REAL ESTATE MARKET REPORT SAN FRANCISCO

APPLEGARTHWARRIN.COM
APRIL 2023
PAUL WARRIN BROKER ASSOCIATE SAN FRANCISCO SPECIALIST
While mortgage rates have dropped for the past 5 weeks in a row, high rates have continued to put downward pressure on sales prices San Francisco’s median SFH price of $1,697,000 in March is down 15% from a year ago, but up 18% from February. The median condo sales price of $1,080,000 is down 10% yearover-year, and down 4% from February.
Cash buyers are taking advantage of the dip in prices and as a result, the percentage of homes being purchased without a loan has increased significantly. Others are buying now with the plan to refi when rates drop again A recent survey showed that nearly 40% of buyers believe that this is a good time to buy,
U.S. homes sales jumped 15%, but inventory levels have dropped, especially in San Francisco New listings are down 30% for SFHs and 42% for condos. Pending sales are down 36%.
Sales in the luxury market are slightly slower than last year. In 2022 there were three $10M+ sales in Q1, and sixteen in total for the year. Thus far in 2023, there has been one $10M+ sale, and two pending sales. The one sale was a big one, 3450 Washington, which sold for, appropriately, $34,500,000.
Fast Fact: Applegarth+Warrin was the #1 team at Golden Gate Sotheby’s in San Francisco and Marin last year, with $120M in sales.

TRENDING IN SF
RANKING SAN FRANCISCO’S BIGGEST NEW PROJECTS

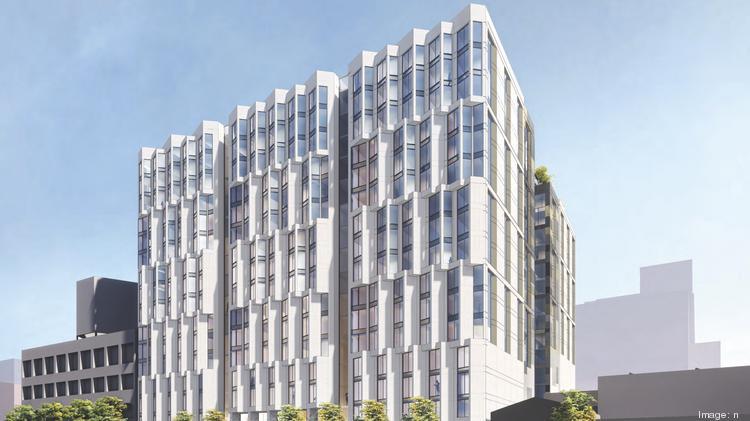
The estimated cost of the 10 biggest projects that got underway in San Francisco in 2022 totaled more than half a billion dollars. These projects are expected to deliver just 1,361 new residential units. Strada Investment Group’s 16-story project at 555 Bryant Street topped the list with its $200m estimated cost and with the 500 new units it promises for SoMa
GOOGLE RELEASES BARD, NEW AI CHATBOT
Google LLC began to release its much-anticipated artificial intelligence chatbot. Bard is Google's answer to ChatGBT, the AI chatbot developed by San Franciscobased OpenAI LLC, and to a similar service Microsoft Corp. is incorporating into its Bing search engine that's also built on OpenAI's technology. Google offered early access to Bard to a number of tech journalists.

ONE OF SF’S BIGGEST DEVELOPMENTS JUST GOT A BIG PUSH FORWARD
San Francisco supervisors have moved to bridge a roughly $200 million infrastructure funding gap for the Potrero Power Station project, keeping it on track to begin vertical construction this fall. This includes a redevelopment of a 29-acre stretch of waterfront land south of Pier 70 into up to 2,600 new homes, a new hotel and about 1.6M square feet of commercial space.

BEHIND THE SCENES
HOME TRANSFORMATION
FROM DRAB TO FAB
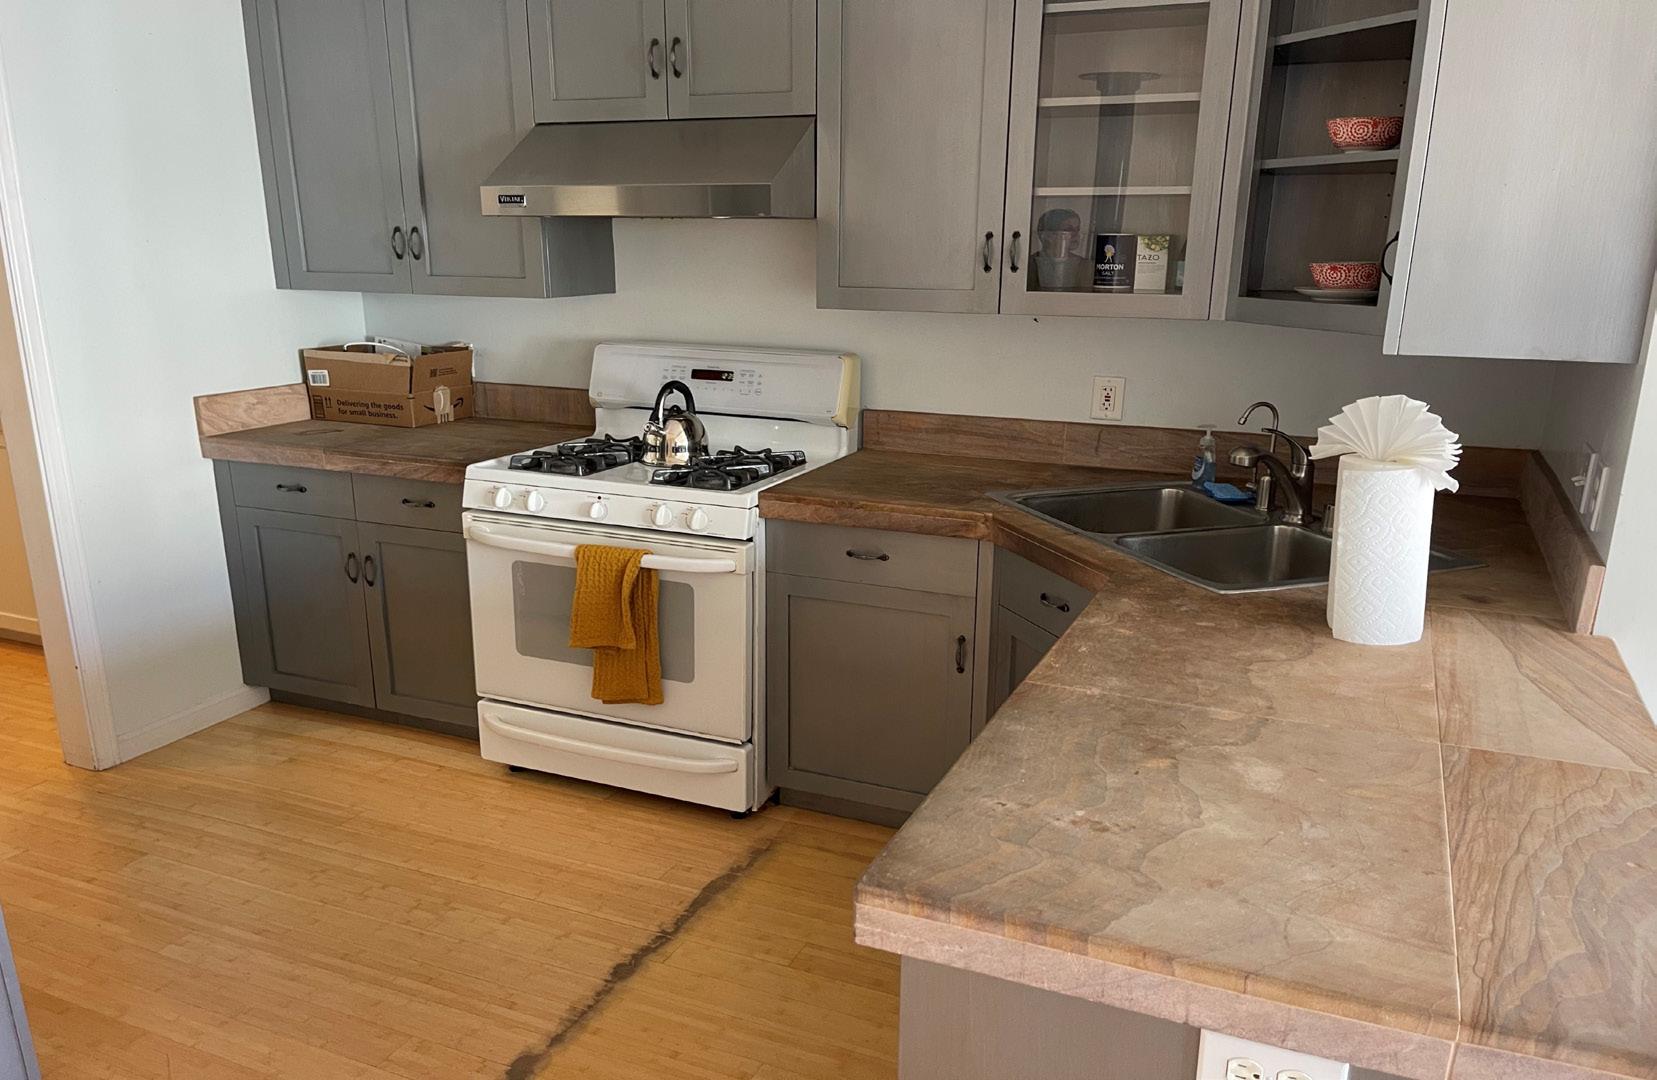
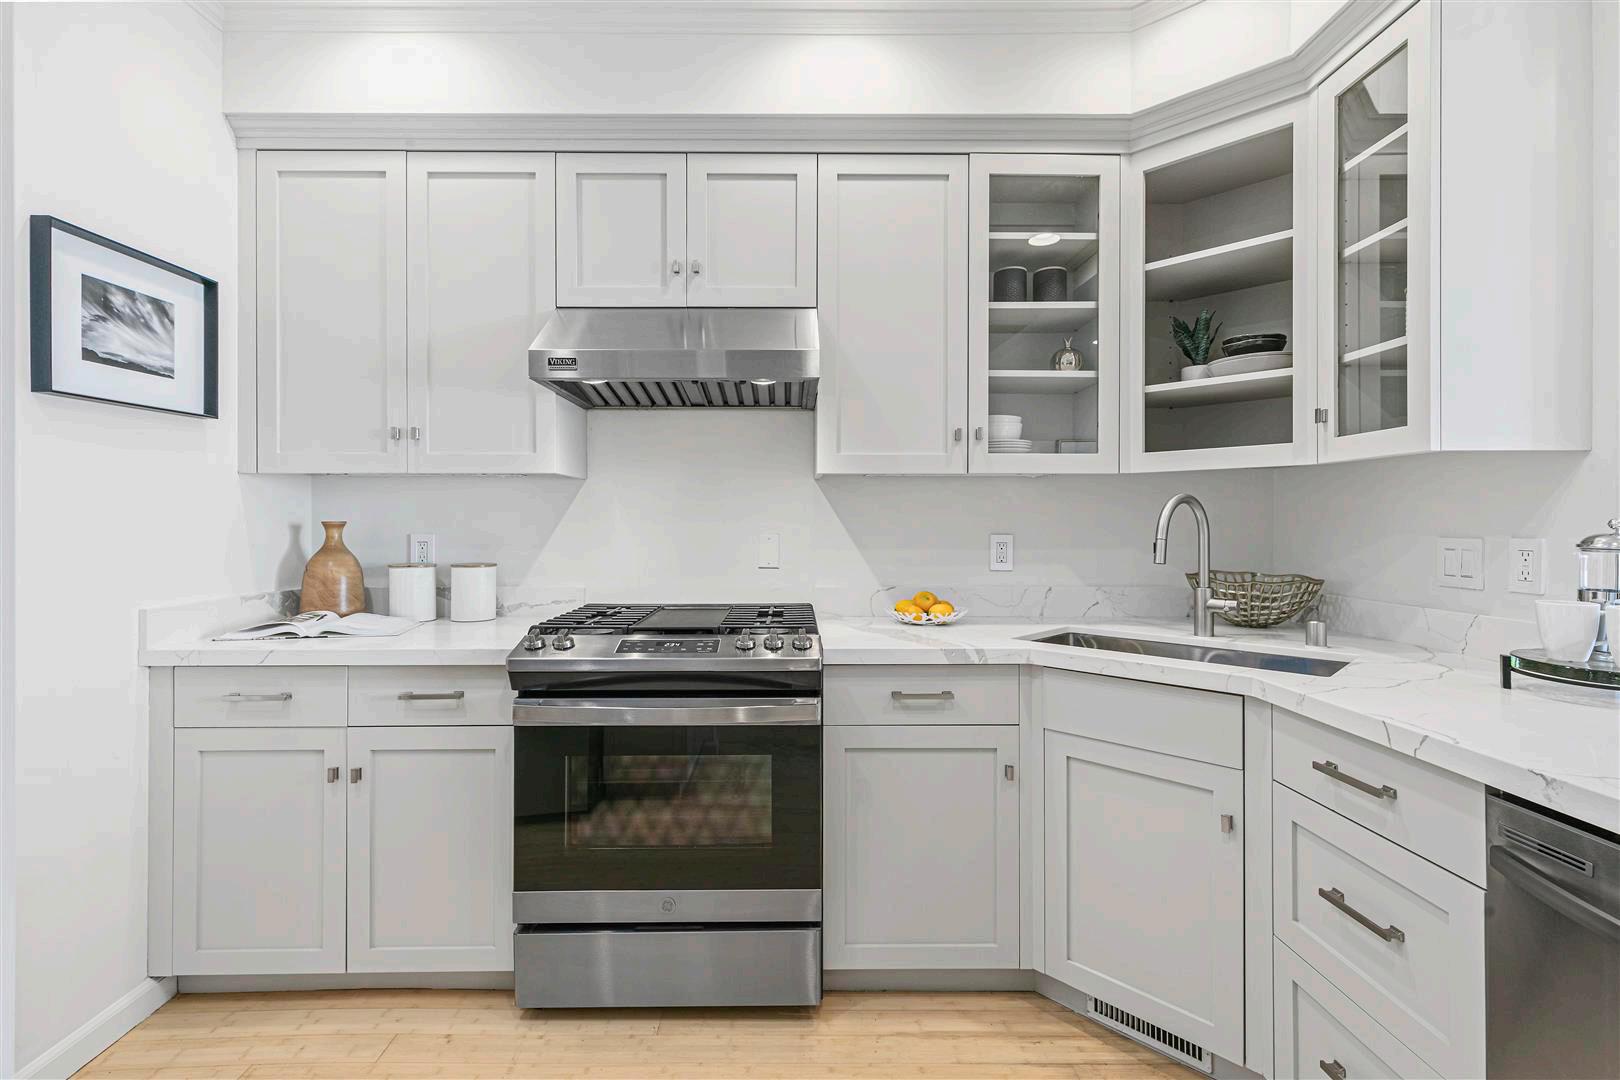
A fresh and modern kitchen completely elevated this Bernal Heights home. The original kitchen with its antiquated stone countertops and white appliances, was instantly turned around with the incorporation of Calacutta quartz countertops, new hardware and lighting, modern faucetry , and paint. Now bright and airy, and stunning all the way around. More before/after photos can be viewed here :
BEFORE
https://vimeo.com/641953
712?playsinline=0


APPLEGARTH + WARRIN 6


7
A+W SAN FRANCISCO FEATURED PROPERTIES
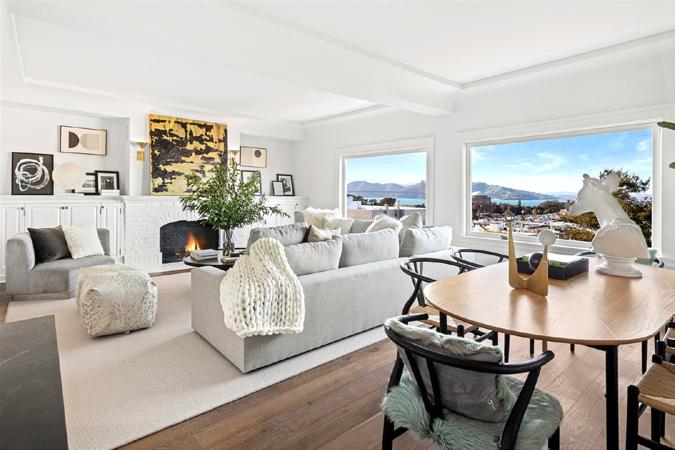
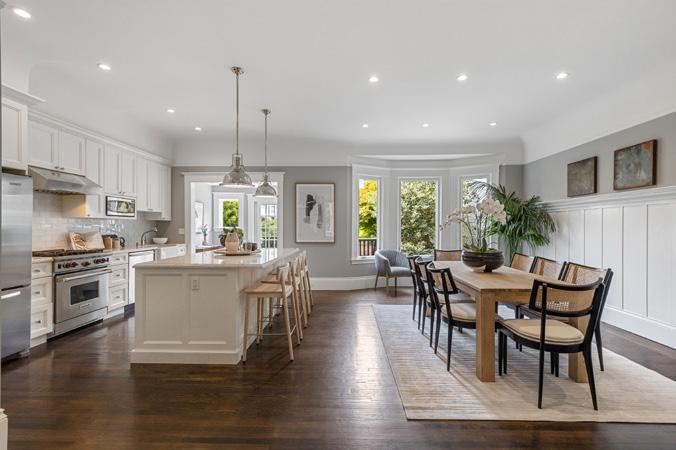
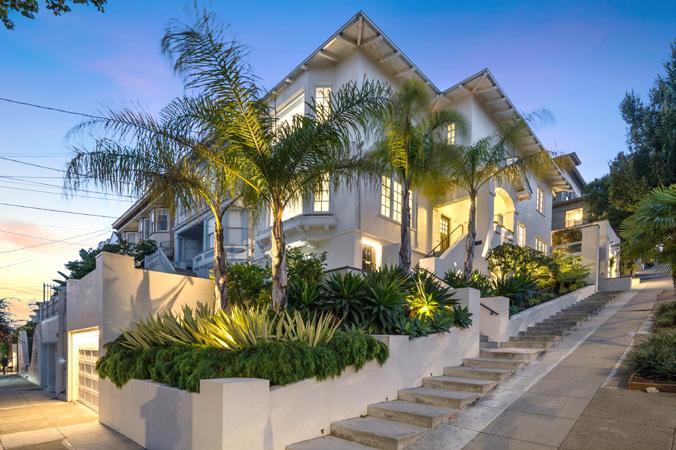
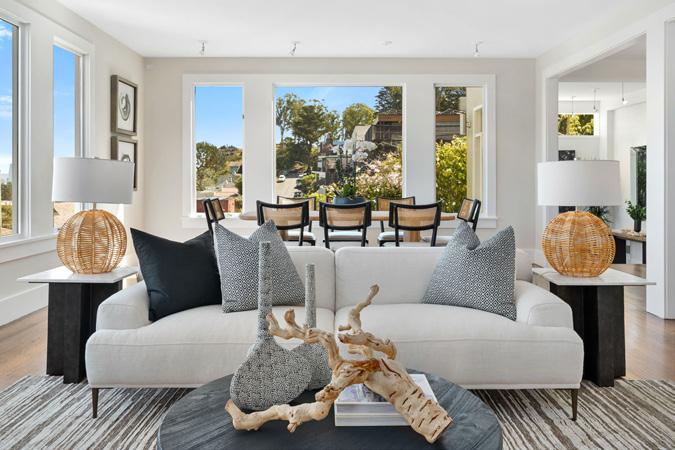
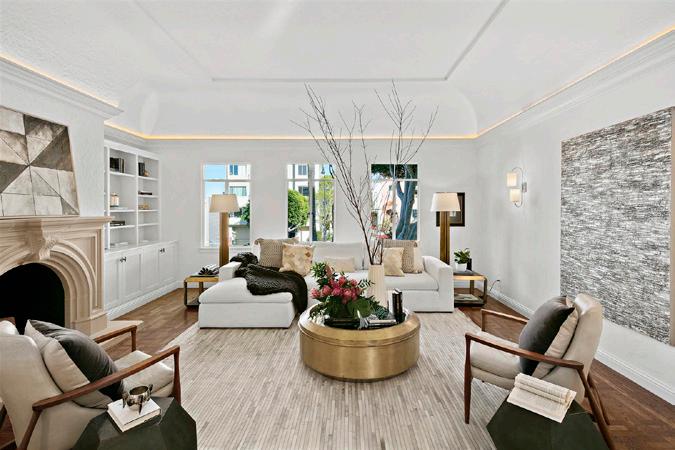
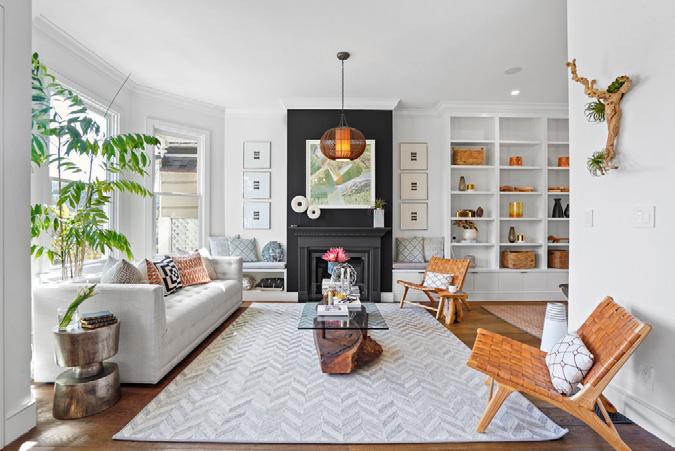

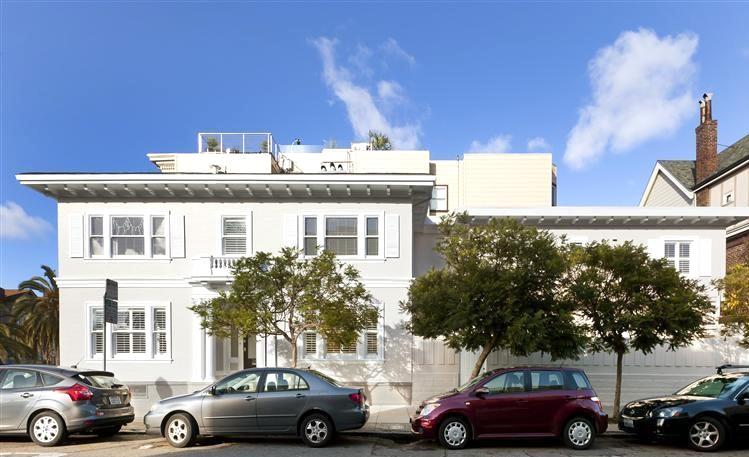


SOLD NOE VALLEY Represented Buyer $5,800,000 SOLD NOE VALLEY Represented Buyer $5,650,000 FAST
SOLD LAKE DISTRICT Represented Buyer $4,205,000 SOLD NOE VALLEY Represented Buyer $4,712,500 FOR SALE COW HOLLOW Graceful Cow Hollow Home $9,495,000 FOR SALE COW HOLLOW Iconic Cow Hollow Home $6,150,000 SOLD NOE VALLEY Sold Over Asking $6,250,000 SOLD COLE VALLEY Represented Buyer $5,505,000 SOLD PACIFIC HEIGHTS Pinnacle of Pacific Heights $4,750,000
FACT : The Applegarth + Warrin Team sold over $120 Million in 2022.
A+W MARIN FEATURED PROPERTIES

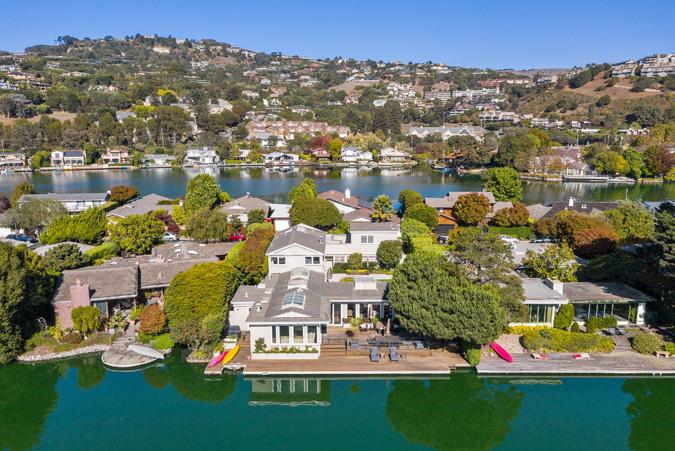
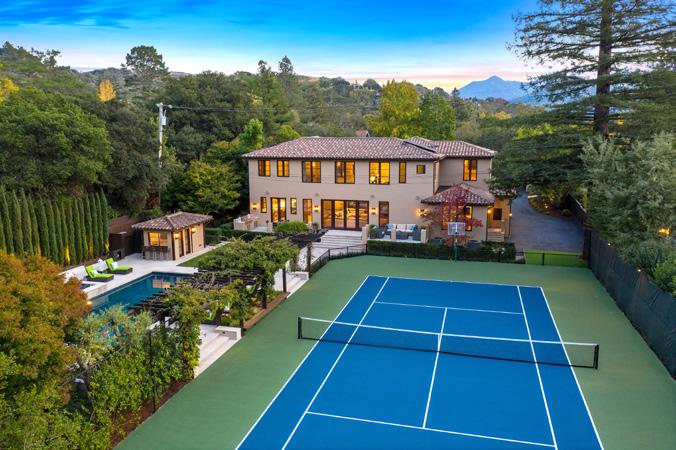
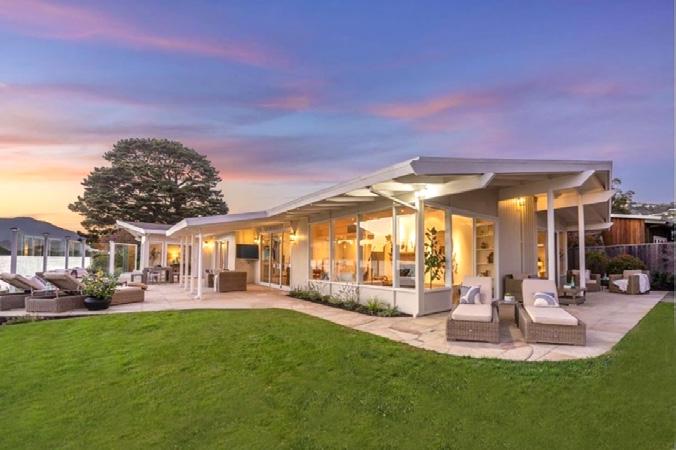
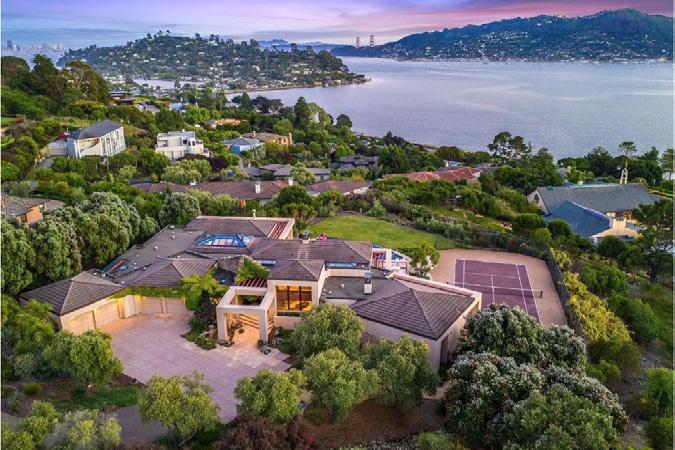
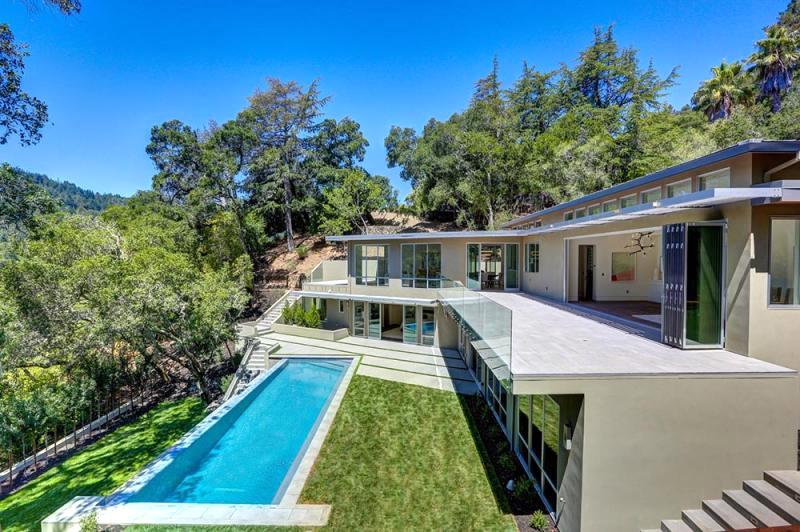


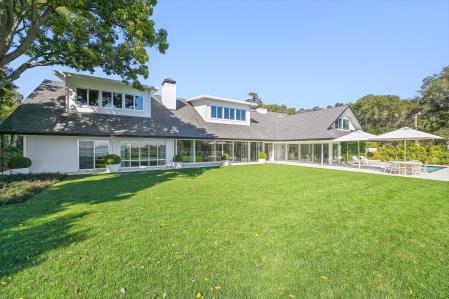

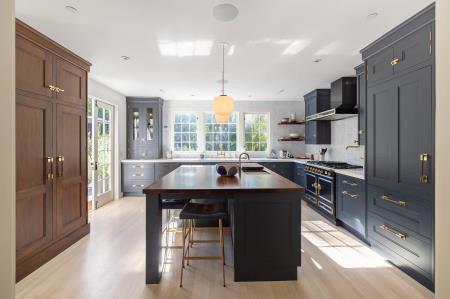

SOLD BELVEDERE Represented Buyer $6,800,000 SOLD BELVEDERE Represented Buyer $11,750,000 SOLD SAN ANSELMO Resort Like Estate $6,750,000 SOLD TIBURON Sweeping Views Home $8,000,000 SOLD OFF MARKET MILL VALLEY Represented Buyer $6,800,000 SOLD TIBURON Represented Buyer $12,175,000 SOLD KENTFIELD Represented Buyer $8,000,000 FOR SALE TIBURON Tiburon View Home $4,695,000 SOLD MILL VALLEY Designer Mill Valley Home $7,050,000
SAN FRANCISCO SINGLE FAMILY

SALES BY DISTRICT · SINGLE FAMILY HOMES · Q1 2023
DISTRICT 1
Central Richmond, Inner Richmond, Outer Richmond, Jordan Park/ Laurel Heights, Presidio, Lake Street, Sea Cliff, Lone Mountain
DISTRICT 2
Golden Gate Heights, Outer Parkside, Outer Sunset, Parkside, Central Sunset, Inner Sunset, Inner Parkside
DISTRICT 3
Lake Shore, Merced Heights, Pine Lake Park, Stonestown, Lakeside, Merced Manor, Ingleside, Ingleside Heights, Oceanview
DISTRICT 4
Balboa Terrace, Diamond Heights, Forest Hill, Forest Knolls, Ingleside Terrace, Midtown Terrace, Saint Francis Wood, Miraloma Park, Forest Hill Extension, Sherwood Forest, Mount Davidson Manor, Westwood Highlands, Westwood Park, Sunnyside, West Portal, Monterey Heights
DISTRICT 5
Glen Park, Haight Ashbury, Noe Valley, Twin Peaks, Cole Valley/Parnassus Heights, Buena Vista/Ashbury Heights, Castro, Corona Heights, Clarendon Heights, Duboce Triangle, Eureka Valley/Dolores Heights, Mission Dolores
DISTRICT 6
Anza Vista, Hayes Valley, Lower Pacific Heights, Western Addition, Alamo Square, North Panhandle
DISTRICT 7
Marina, Pacific Heights, Presidio Heights, Cow Hollow
DISTRICT 8
Downtown, Financial District/Barbary Coast, Nob Hill, North Beach, Russian Hill, Van Ness/Civic Center, Telegraph Hill, North Waterfront, Tenderloin
DISTRICT 9
Bernal Heights, Inner Mission, Mission Bay, Potrero Hill, South of Market, Yerba Buena, South Beach, Central Waterfront/ Dogpatch
DISTRICT 10 Bayview, Crocker Amazon, Excelsior, Outer Mission, Visitacion Valley, Portola, Silver Terrace, Mission Terrace, Hunter’s Point, Bayview Heights, Candlestick, Little Hollywood
City Average Median Sale/List Price High Sale Price/SF # of Sales DOM District 1 $2,550,785 $2,250,000 104.0% $4,999,000 $910 28 36 District 2 $1,682,913 $1,528,000 107.5% $3,100,000 $906 59 31 District 3 $1,400,118 $1,212,500 104.6% $2,850,000 $866 28 27 District 4 $1,929,104 $1,700,000 104.9% $4,250,000 $884 50 34 District 5 $2,743,169 $2,475,000 105.2% $9,938,000 $1,010 46 35 District 6 $2,925,000 $2,925,000 93.5% $4,500,000 $959 2 10 District 7 $8,115,100 $5,075,000 93.4% $34,500,000 $1,521 10 52 District 8 $6,025,000 $6,025,000 92.7% $6,500,000 $1,646 2 95 District 9 $1,745,581 $1,500,000 102.9% $3,895,000 $826 43 32 District 10 $1,093,149 $1,060,000 103.0% $1,875,000 $767 73 37 San Francisco $2,013,106 $1,550,000 104.2% $34,500,000 $897 341 34
SAN FRANCISCO COUNTY SINGLE FAMILY MARKET TRENDS
Graphs show trends in market activity for the county comparing this year (dark lines) with last year (light lines) for the same period. Data is gathered from Multiple Listing Service (MLS) sources, reviewed for accuracy, and charted for easy comparison. Data shown is for single family homes only.

MARKET REPORT | Q1 2023
THIS YEAR LAST YEAR
Data Source: MLS. Data is for single family homes only.
SAN FRANCISCO CONDOS
SALES BY DISTRICT · CONDOS · Q1 2023

DISTRICT 1
Central Richmond, Inner Richmond, Outer Richmond, Jordan Park/ Laurel Heights, Presidio, Lake Street, Sea Cliff, Lone Mountain
DISTRICT 2
Golden Gate Heights, Outer Parkside, Outer Sunset, Parkside, Central Sunset, Inner Sunset, Inner Parkside
DISTRICT 3
Lake Shore, Merced Heights, Pine Lake Park, Stonestown, Lakeside, Merced Manor, Ingleside, Ingleside Heights, Oceanview
DISTRICT 4
Balboa Terrace, Diamond Heights, Forest Hill, Forest Knolls, Ingleside Terrace, Midtown Terrace, Saint Francis Wood, Miraloma Park, Forest Hill Extension, Sherwood Forest, Mount Davidson Manor, Westwood Highlands, Westwood Park, Sunnyside, West Portal, Monterey Heights
DISTRICT 5
Glen Park, Haight Ashbury, Noe Valley, Twin Peaks, Cole Valley/Parnassus Heights, Buena Vista/Ashbury Heights, Castro, Corona Heights, Clarendon Heights, Duboce Triangle, Eureka Valley/Dolores Heights, Mission Dolores
DISTRICT 6
Anza Vista, Hayes Valley, Lower Pacific Heights, Western Addition, Alamo Square, North Panhandle
DISTRICT 7
Marina, Pacific Heights, Presidio Heights, Cow Hollow
DISTRICT 8
Downtown, Financial District/Barbary Coast, Nob Hill, North Beach, Russian Hill, Van Ness/Civic Center, Telegraph Hill, North Waterfront, Tenderloin
DISTRICT 9
Bernal Heights, Inner Mission, Mission Bay, Potrero Hill, South of Market, Yerba Buena, South Beach, Central Waterfront/ Dogpatch
DISTRICT 10
Bayview, Crocker
Amazon, Excelsior, Outer Mission, Visitacion Valley, Portola, Silver Terrace, Mission Terrace, Hunter’s Point, Bayview Heights, Candlestick, Little Hollywood
City Average Median Sale/List Price High Sale Price/SF # of Sales DOM District 1 $1,218,721 $1,175,000 100.4% $2,290,000 $800 31 36 District 2 $942,489 $925,000 101.5% $1,420,000 $883 15 51 District 3 $807,080 $685,000 97.7% $1,500,000 $671 10 40 District 4 $1,046,667 $995,000 100.1% $1,600,000 $763 6 15 District 5 $1,328,841 $1,287,500 99.0% $3,260,000 $941 80 45 District 6 $1,384,492 $1,375,000 99.8% $2,800,000 $835 53 41 District 7 $2,099,711 $1,550,000 98.3% $8,400,000 $1,129 45 39 District 8 $1,018,154 $975,000 93.9% $2,695,000 $826 81 86 District 9 $1,165,767 $992,500 95.0% $7,750,000 $952 142 76 District 10 $785,091 $860,000 100.5% $1,028,000 $585 11 58 San Francisco $1,259,676 $1,080,000 97.1% $8,400,000 $903 474 60
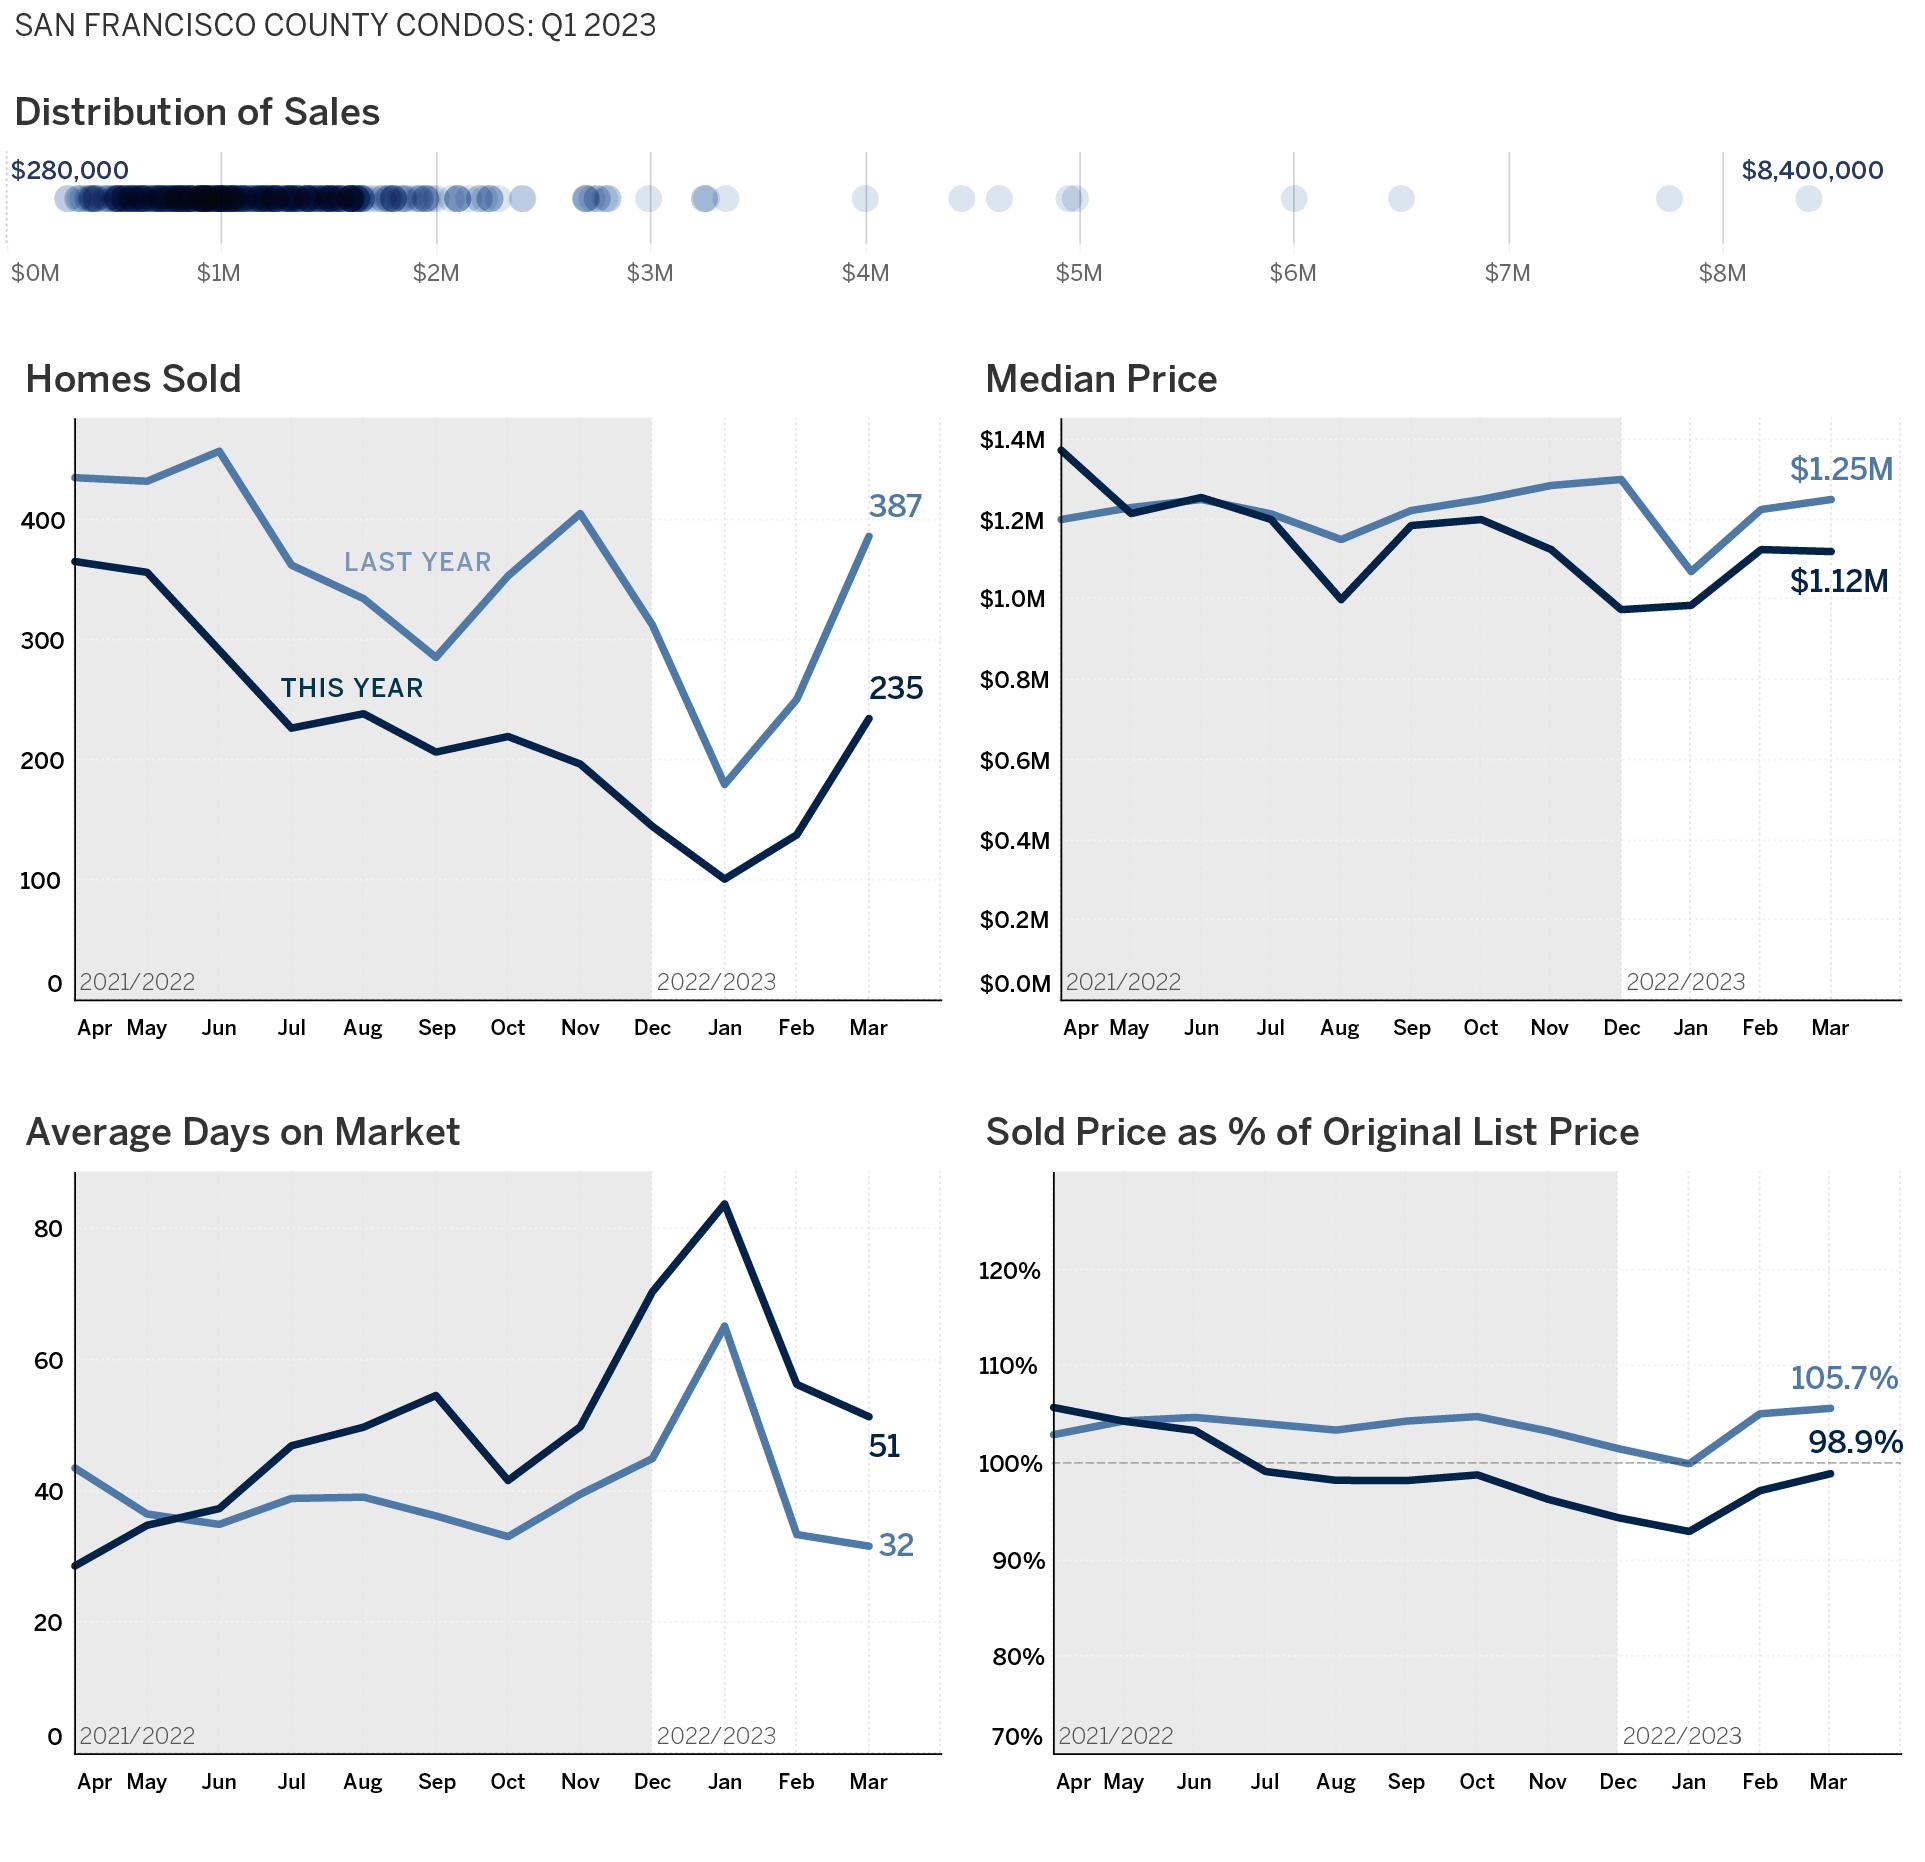
SAN FRANCISCO COUNTY CONDO MARKET TRENDS
Graphs show trends in market activity for the county comparing this year (dark lines) with last year (light lines) for the same period. Data is gathered from Multiple Listing Service (MLS) sources, reviewed for accuracy, and charted for easy comparison. Data shown is for single family homes only.
MARKET REPORT | Q1 2023
THIS YEAR LAST YEAR
Data Source: MLS. Data is for condos, townhouses, stock cooperative, and tenant in common properties only.
DISTRICT 1 SALES RICHMOND/LAKE/SEA CLIFF
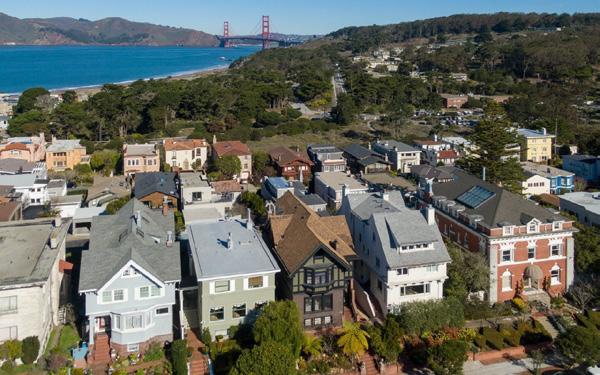
2212 Lake $4,999,000 Sold March13 $953 PER SQFT $2,295,000 MEDIAN SALES SINGLE FAMILY $956 PER SQFT $1,475,000 MEDIAN SALES CONDO 9.3% 13.4% FEB 23 vs FEB 22 14.3% 21.9% Address Subdistrict Sale Price Date DOM BR BA Sq Feet % Over List 2212 Lake Lake Street $4,999,000 13-Mar 11 3 5 4395 4.6% 1544 Lake Lake Street $3,900,000 23-Feb 71 4 3 3205 -2.4% 521 Lake Lake Street $3,400,000 9-Mar 26 3 3 2250 -2.7% 731 23rd Central Richmond $3,200,000 20-Mar 6 4 5 2711 6.8% 422 45th Outer Richmond $2,200,000 22-Mar 133 5 6 4056 0.0% 44 7th Lake Street $2,000,000 13-Feb 17 3 2 2075 -4.8% 2940 Clement Central Richmond $2,000,000 16-Mar 0 3 2 1604 -2.4% 10 Loyola Lone Mountain $1,979,111 6-Mar 8 2 2 1460 11.2% 127 7th Lake Street $1,850,000 21-Feb 9 3 2 1743 3.1% 852 29th Central Richmond $1,772,000 6-Feb 18 4 3 1772 -1.0% 1508 Lake Lake Street $1,565,000 16-Feb 10 2 2 1440 31.0% 4 Rossi Lone Mountain $1,555,000 16-Mar 15 3 2 1736 4.0% 128 Wood #3 Lone Mountain $1,462,000 10-Mar 43 3 2 1730 -2.4% 742 17th Central Richmond $1,400,000 4-Mar 0 2 2 1245 27.9% 3136 Fulton #2 Inner Richmond $1,395,000 24-Feb 154 4 3 1832 0.0% 124 Beaumont Lone Mountain $1,350,000 13-Feb 0 2 2 1138 1.9% 501 Arguello #302 Inner Richmond $1,200,000 23-Feb 74 2 2 1263 -3.8% 1 Stanyan #21 Lone Mountain $1,175,000 8-Mar 139 2 2 1230 -9.5% 723 38th Outer Richmond $1,165,000 1-Mar 12 3 1 1227 16.7% 437 19th #1 Central Richmond $1,050,000 2-Mar 35 3 2 1984 -8.7% 401 26th #1 Central Richmond $925,000 1-Mar 13 2 1 1068 3.0% 262A 3rd Inner Richmond $850,000 14-Mar 19 2 1 797 3.0% 2480 Fulton #4 Lone Mountain $800,000 17-Mar 20 1 1 738 4.0%
DISTRICT 2 SALES SUNSET AND PARKSIDE
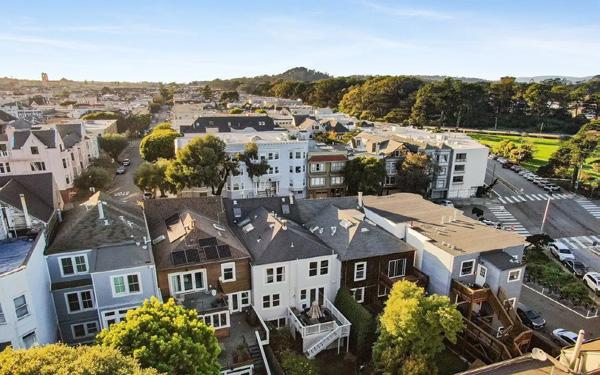
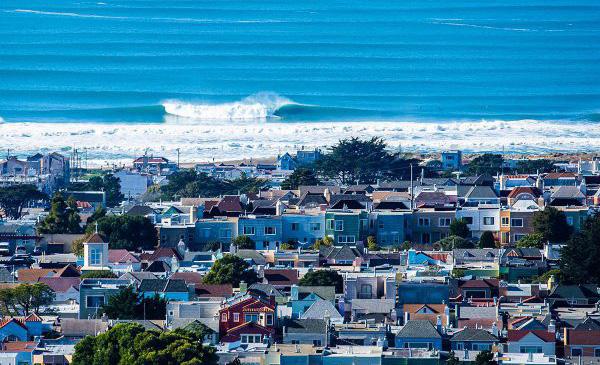
$975 PER SQFT $1,500,000 MEDIAN SALES SINGLE FAMILY $924 PER SQFT $1,350,000 MEDIAN SALES CONDO 1212 Arguello $2,800,000 Sold Feb 17 11.8% 12.8% 8.9% 1.9% Address Subdistrict Sale Price Date DOM BR BA Sq Feet % Over List 1212 Arguello Inner Sunset $2,800,000 17-Feb 6 3 3 2100 3.9% 2323 Funston Golden Gate Heights $2,410,000 16-Mar 49 3 3 2685 -3.4% 2275 45th Outer Parkside $2,410,000 13-Mar 2 3 3 2415 20.8% 1266 39th Outer Sunset $2,350,000 16-Feb 11 4 2 2332 0.0% 2054 36th Parkside $2,320,000 23-Feb 14 4 4 2259 -3.3% 1443 29th Central Sunset $2,169,000 3-Mar 39 4 5 2228 -5.2% 1923 32nd Parkside $2,150,000 24-Feb 20 6 4 3375 -2.1% 1476 36th Central Sunset $2,150,000 16-Mar 10 3 2 2116 34.8% 2114 28th Parkside $2,000,000 10-Mar 22 5 4 2463 0.6% 1426 33rd Central Sunset $1,980,000 17-Mar 28 4 4 2195 16.8% 1594 44th Outer Sunset $1,800,000 21-Feb 71 4 3 1930 -4.7% 1569 16th Golden Gate Heights $1,800,000 1-Feb 21 2 2 1575 0.3% 1531 Funston Inner Sunset $1,726,000 21-Feb 12 2 1 1685 15.5% 1915 30th Parkside $1,650,000 8-Mar 7 2 2 1175 18.9% 2179 27th Parkside $1,600,000 1-Mar 13 2 1 1400 14.7% 2425 Taraval Parkside $1,600,000 17-Mar 43 4 2 1975 15.3% 1298 48th Outer Sunset $1,600,000 9-Mar 13 4 2 2442 23.6% 3425 Quintara Outer Parkside $1,560,000 15-Mar 12 3 1 1214 42.5% 1543 46th Outer Sunset $1,528,000 10-Feb 31 2 1 1075 9.3% 1547 40th Outer Sunset $1,525,000 7-Mar 122 3 2 1936 -1.6% 2241 17th Inner Parkside $1,500,000 13-Feb 13 3 1 1550 25.5% 3644 Ulloa Outer Parkside $1,480,000 6-Mar 16 3 2 1664 5.7% 2115 27th Parkside $1,475,000 10-Mar 0 2 2 1528 23.4% FEB 23 vs FEB 22
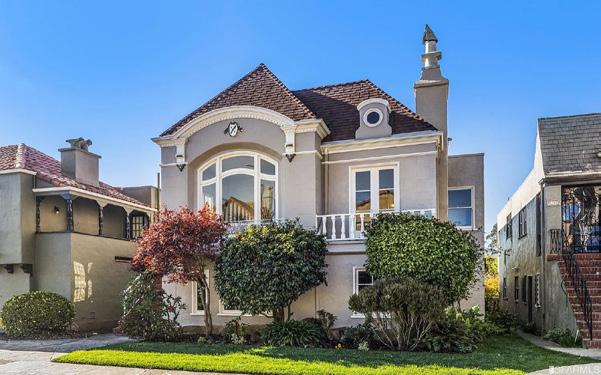
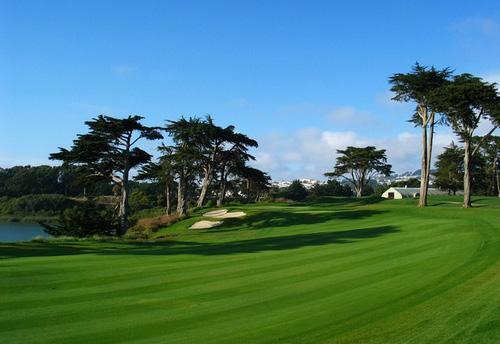
DISTRICT 3 SALES OCEANVIEW TO LAKESHORE
$858 PER SQFT $1,105,000 MEDIAN SALES SINGLE FAMILY $770,000 MEDIAN SALES CONDO 19.4% $685 PER SQFT 25 Goleta $2,350,000 Sold Mar 14 11.0% 10.8% Address Subdistrict Sale Price Date DOM BR BA Sq Feet % Over List 25 Goleta Pine Lake Park $2,350,000 14-Mar 35 3 3 2625 -5.8% 3040 22nd Merced Manor $2,002,500 3-Mar 7 3 2 2625 18.1% 251 Summit Stonestown $1,920,000 6-Mar 19 4 4 2385 -3.9% 1501 Eucalyptus Lake Shore $1,850,000 6-Feb 23 4 3 1965 9.1% 168 Sylvan Lake Shore $1,775,000 17-Mar 27 3 3 1492 -1.1% 3045 21st Merced Manor $1,730,000 19-Jan 64 4 3 2075 -8.4% 225 Lee Ingleside $1,648,000 9-Mar 34 4 3 2378 -2.4% 546 Head Ingleside Heights $1,555,000 24-Feb 7 3 2 1694 11.9% 103 Summit Stonestown $1,500,000 20-Mar 133 3 3 2133 -6.1% 186 Byxbee Ingleside Heights $1,300,000 10-Feb 85 3 2 1899 -7.1% 557 Bright Merced Heights $1,252,000 6-Feb 9 3 2 950 25.5% 486 Ralston Merced Heights $1,215,000 13-Mar 6 2 1 1100 21.6% 531 Orizaba Merced Heights $1,205,000 23-Feb 14 3 3 1828 0.8% 730 Garfield Merced Heights $1,150,000 27-Feb 10 2 1 1135 28.5% 231 Thrift Oceanview $1,050,000 27-Jan 31 4 2 1180 6.3% 166 Bright Ingleside Heights $1,000,000 20-Feb 28 2 2 1250 -4.8% 174 Farallones Oceanview $950,000 20-Jan 106 4 3 1669 -4.8% 332 Jules Ingleside $950,000 22-Feb 12 3 2 810 18.9% 245 Shields Merced Heights $840,000 18-Jan 0 2 1 781 1.8% 139 Lake Merced Lake Shore $835,000 22-Feb 18 3 2 1474 -1.6% 386 Faxon #9 Ingleside $768,800 27-Feb 39 2 2 1268 0.0% 542 Holloway Ingleside $660,000 1-Feb 35 1 1 696 -5.6% 8300 Oceanview #316 Ingleside Heights $585,000 17-Mar 18 1 1 669 3.5% FEB 23 vs FEB 22 21.4%
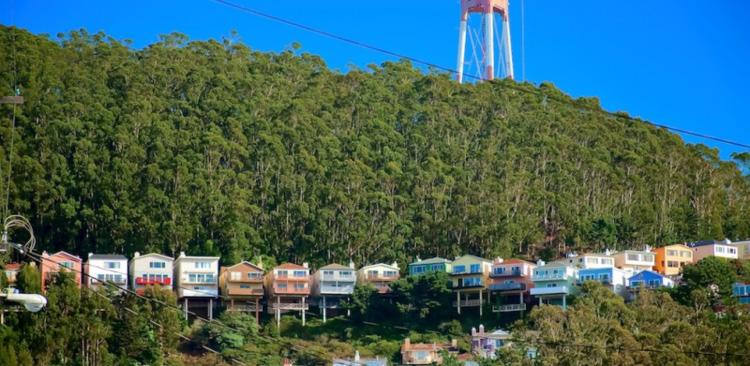
DISTRICT 4 SALES FOREST KNOLLS TO WESTWOOD PK


$913 PER SQFT $1,562.500 MEDIAN SALES SINGLE FAMILY $637 PER SQFT $800,000 MEDIAN SALES 11.1% CONDO 140 Vasquez $3,640,000 Sold Mar 9 24.2% 19.1% 41.6% Address Subdistrict Sale Price Date DOM BR BA Sq Feet % Over List 140 Vasquez Forest Hill Extension $3,640,000 9-Mar 13 4 5 3750 13.8% 50 Santa Paula St. Francis Wood $3,500,000 10-Feb 43 4 4 3521 -6.7% 170 Vasquez Forest Hill Extension $3,017,000 10-Mar 6 4 4 2360 16.3% 201 Edgehill Forest Hill Extension $2,750,000 9-Feb 15 3 3 3515 14.8% 460 Myra Miraloma Park $2,475,000 7-Mar 13 4 3 2031 12.8% 1340 Plymouth Westwood Park $2,275,000 20-Feb 69 5 5 2349 0.0% 125 Cerritos Ingleside Terrace $2,250,000 7-Mar 18 3 3 2907 60.8% 250 Claremont West Portal $2,200,000 3-Feb 99 3 2 2130 -2.2% 23 Magellan Forest Hill $2,025,000 20-Mar 16 4 2 2158 6.9% 85 Manor Mount Davidson Manor $1,968,000 10-Mar 245 4 4 2473 -1.5% 215 Juanita Miraloma Park $1,900,000 7-Mar 21 3 2 2123 -2.6% 663 Joost Sunnyside $1,740,000 14-Feb 0 4 3 1725 -5.9% 57 Greenview Midtown Terrace $1,700,000 9-Feb 9 3 2 1640 30.9% 55 Topaz Diamond Heights $1,600,000 2-Mar 5 3 3 1945 0.3% 265 Glenview Midtown Terrace $1,500,000 6-Mar 28 3 2 1250 0.3% 159 Skyview Midtown Terrace $1,500,000 27-Feb 14 2 1 1152 2.1% 449 Melrose Sunnyside $1,490,000 3-Feb 117 3 2 1414 -1.1% 595 Teresita Miraloma Park $1,460,000 21-Mar 11 3 2 1029 22.2% 374 Joost Sunnyside $1,400,000 27-Feb 10 2 2 1179 8.5% 111 Monterey Sunnyside $1,350,000 10-Feb 9 2 2 1170 4.2% 117 Topaz Diamond Heights $1,320,000 10-Mar 10 3 3 2047 10.5% 131 Hearst Sunnyside $1,300,000 14-Feb 17 3 2 1915 -3.7% 57 Longview Midtown Terrace $1,275,000 2-Mar 0 3 2 1579 -7.9% FEB 23 vs FEB 22
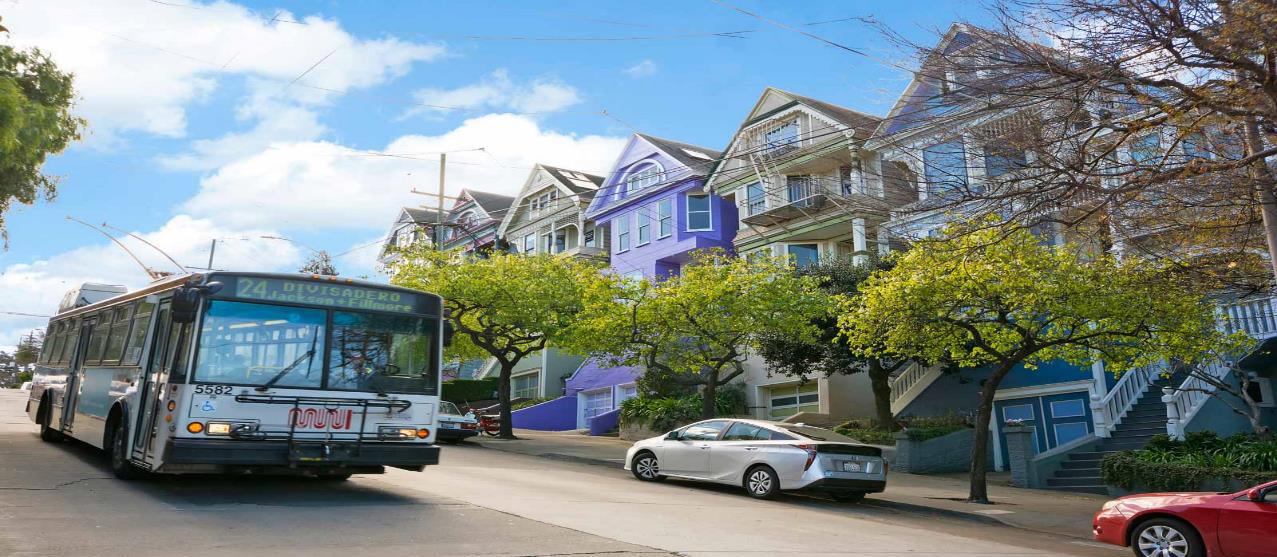
DISTRICT 5 SALES HAIGHT ASHBURY TO GLEN PARK

$1,187 PER SQFT $2,170,000 MEDIAN SALES SINGLE FAMILY $1,030 PER SQFT $1,399,000 MEDIAN SALES CONDO 33 Mountain Spring $5,725,000 Sold Mar 10 15.2% 11.5% 14.7% 6.7% Address Subdistrict Sale Price Date DOM BR BA Sq Feet % Over List 33 Mountain Spring Clarendon Heights $5,725,000 10-Mar 0 5 6 6115 -4.5% 3723 22nd Noe Valley $4,100,000 1-Mar 5 3 4 2780 5.8% 47 Levant Corona Heights $3,750,000 17-Mar 5 5 4 3068 7.3% 3883 17th Eureka Valley/Dolores Hts $3,361,000 22-Mar 15 4 4 2395 5.2% 293 Downey Buena Vista/Ashbury $3,250,000 13-Mar 100 4 4 3000 -7.0% 45 Chilton Glen Park $3,172,314 8-Mar 13 4 3 2742 22.2% 20 Graystone Clarendon Heights $3,030,000 6-Mar 0 3 3 2178 1.0% 2772 Diamond Glen Park $2,600,000 3-Mar 6 4 3 2380 30.3% 919 Elizabeth Noe Valley $2,250,000 9-Mar 7 3 3 1468 12.8% 903 Guerrero Eureka Valley/Dolores Hts $2,225,000 22-Mar 54 3 2 1955 6.0% 4521 25th #1 Noe Valley $2,100,000 10-Mar 10 3 3 1859 5.3% 4185 Cesar Chavez Noe Valley $2,015,000 21-Mar 8 2 2 1395 12.9% 4210 22nd Noe Valley $1,925,000 14-Mar 7 4 2 1575 28.8% 1026 Church #2 Noe Valley $1,870,000 13-Mar 13 3 2 1556 1.1% 1439 Page Haight Ashbury $1,842,500 20-Mar 25 3 2 1924 -0.4% 445 Roosevelt Corona Heights $1,799,000 2-Mar 130 2 2 1505 0.0% 130 Belvedere Cole Valley/Parnassus Hts $1,780,000 3-Mar 12 3 2 1635 11.6% 3500 19th #204 Mission Dolores $1,660,000 3-Mar 20 2 3 1485 4.1% 467A Duboce Duboce Triangle $1,625,000 16-Mar 7 2 2 1195 1.9% 1612 Dolores Noe Valley $1,600,000 17-Mar 55 3 2 1265 0.3% 110 Divisadero Buena Vista/Ashbury Hts $1,515,000 13-Mar 1 2 2 1303 12.3% 64 Mars Corona Heights $1,500,000 1-Mar 97 3 2 2185 -10.4% 650 28th Noe Valley $1,500,000 9-Mar 94 2 1 1027 -11.7% FEB 23 vs FEB 22
DISTRICT 6 SALES LOWER PAC HTS TO HAYES VALLEY

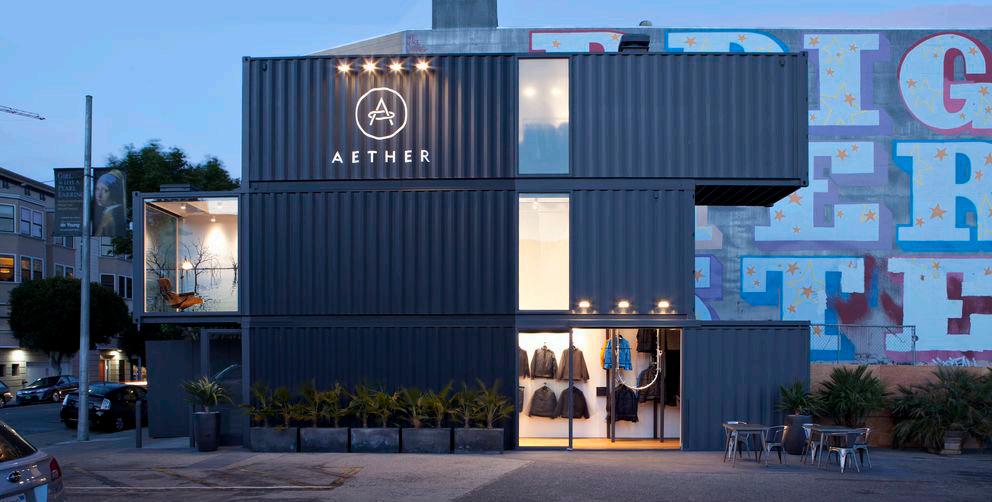
$924 PER SQFT $2,709,500 MEDIAN SALES SINGLE FAMILY $995 PER SQFT $1,200,000 MEDIAN SALES CONDO 22.2% 2139 Grove $2,700,000 Sold Mar 3 15.1% 4.8% FEB 23 vs FEB 22 11.7% Address Subdistrict Sale Price Date DOM BR BA Sq Feet % Over List 2139 Grove North Panhandle $2,700,000 3-Mar 7 3 3 2906 0.7% 1646 Fell North Panhandle $1,800,000 24-Feb 11 2 2 1845 2.9% 526 Baker North Panhandle $1,800,000 20-Mar 34 3 2 1982 6.2% 1949 Pine #1949 Lower Pacific Heights $1,750,000 14-Mar 50 3 2 2163 -2.5% 419 Linden Hayes Valley $1,700,000 14-Mar 14 3 3 1307 17.6% 64 Waller Hayes Valley $1,675,000 17-Feb 13 2 2 1690 0.0% 1147 Fell Alamo Square $1,630,000 3-Mar 5 2 1 1370 16.8% 1900B Steiner Lower Pacific Heights $1,600,000 7-Mar 16 2 2 1496 0.3% 60 Webster Hayes Valley $1,515,000 20-Mar 195 3 2 1814 -0.7% 1922 Laguna Lower Pacific Heights $1,425,000 10-Mar 17 3 2 1456 -0.8% 1727 Grove North Panhandle $1,405,000 21-Feb 11 2 2 1135 0.4% 1951 Hayes North Panhandle $1,350,115 10-Mar 11 2 1 1267 4.3% 2972 Bush Lower Pacific Heights $1,350,000 24-Feb 20 6 4 3890 -12.9% 2185 Bush #307 Lower Pacific Heights $1,250,000 21-Feb 97 3 2 1290 0.0% 2060 Sutter #309 Lower Pacific Heights $1,250,000 13-Mar 14 2 2 1060 25.1% 75 Webster Hayes Valley $1,210,000 17-Mar 27 2 1 1035 5.2% 82 Garden Lower Pacific Heights $1,170,000 9-Mar 11 2 2 1179 1.7% 949 Fell #5 Alamo Square $1,140,000 13-Mar 32 3 3 1183 -3.0% 66 Cleary #1208 Western Addition $1,050,000 14-Mar 40 3 2 1106 -4.5% 66 Cleary #1202 Western Addition $995,000 28-Feb 15 3 2 1202 0.0% 863 Haight #3 Hayes Valley $950,000 2-Mar 7 1 1 842 2.7% 865B Hayes Alamo Square $820,000 23-Feb 27 2 1 1201 -3.4% 452 Fell Hayes Valley $640,000 28-Feb 13 1 2 800 -1.5%
DISTRICT 7 SALES MARINA TO PACIFIC HEIGHTS


$1,832 PER SQFT $9,000,000 MEDIAN SALES SINGLE FAMILY $1,325 PER SQFT $1,325,000 MEDIAN SALES CONDO 2.6% 3450 Washington $34,500,000 Sold Mar 7 25.4% Address Subdistrict Sale Price Date DOM BR BA Sq Feet % Over List 3450 Washington Presidio Heights $34,500,000 7-Mar 122 6 10 9865 -12.7% 2863 Green Cow Hollow $9,995,000 24-Feb 38 4 6 4455 -9.1% 214 Spruce Presidio Heights $7,200,000 16-Mar 6 4 4 3638 9.9% 2170 Jackson #1 Pacific Heights $4,625,000 22-Mar 43 3 4 3300 7.7% 2218 Divisadero Pacific Heights $2,908,000 22-Mar 0 4 3 2570 -1.4% 2668 Greenwich Cow Hollow $2,800,000 13-Mar 22 3 2 2455 -1.8% 2302 Divisadero Pacific Heights $2,785,000 22-Feb 36 4 3 2272 -5.6% 2229 Beach Marina $2,725,000 7-Mar 202 3 2 2250 -2.5% 3027 Webster Cow Hollow $2,400,000 7-Mar 128 3 4 2002 -2.0% 54 Casa Marina $2,100,000 28-Feb 10 2 2 1647 5.3% 2919 Pacific #10 Pacific Heights $1,625,000 17-Mar 32 2 2 1151 3.2% 1998 Broadway #804 Pacific Heights $1,500,000 2-Mar 19 2 2 980 -1.6% 1900 Broadway #2 Pacific Heights $1,420,000 15-Feb 43 2 2 1518 -5.0% 2299 Sacramento #6 Pacific Heights $1,325,000 8-Mar 7 2 1 1175 6.0% 2230 Francisco #102 Marina $1,315,000 21-Mar 17 2 1 1068 1.2% 1229 Francisco Marina $1,300,000 21-Feb 20 3 1 1290 -3.7% 1835 Franklin #402 Pacific Heights $1,250,000 21-Mar 8 2 2 1545 -3.8% 1998 Pacific #303 Pacific Heights $1,235,000 13-Mar 7 2 2 1075 -1.1% 1648A Union Cow Hollow $1,025,000 13-Mar 46 1 1 806 -6.4% 1835 Franklin #902 Pacific Heights $915,000 3-Mar 14 2 2 1500 3.0% 1840 Washington #303 Pacific Heights $866,000 3-Mar 14 1 1 837 0.0% 2522 Octavia #3 Pacific Heights $678,000 28-Feb 15 1 1 673 4.5% 2701 Van Ness #505 Cow Hollow $625,000 8-Mar 37 0 1 612 -3.8% FEB 23 vs FEB 22 97.8% 1.3%
DISTRICT 8 Sales NORTH BEACH TO DOWNTOWN
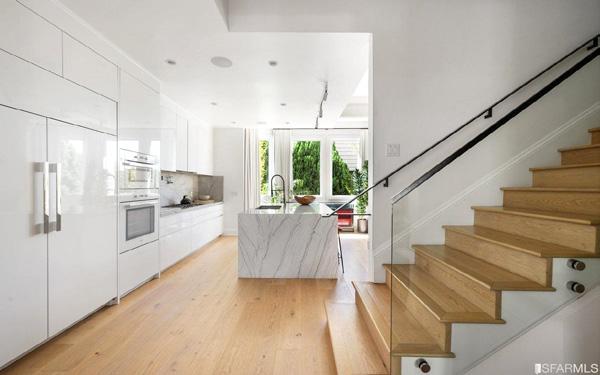

49 Glover $5,550,000 Sold Mar 10 $1,061 PER SQFT $2,794,500 MEDIAN SALES SINGLE FAMILY $940 PER SQFT $1,020,000 MEDIAN SALES CONDO 31.7% 23.2% 18.7% FEB 23 vs FEB 22 7.4% Address Subdistrict Sale Price Date DOM BR BA Sq Feet % Over List 45 Glover Russian Hill $5,550,000 10-Mar 189 4 5 3225 -6.7% 288 Pacific #2A Financial District $2,150,000 21-Mar 21 2 3 1261 13.3% 1448 Union Russian Hill $1,950,000 1-Mar 10 2 2 1461 8.6% 875 California #102 Nob Hill $1,830,000 28-Feb 230 1 2 1324 -3.4% 101 Lombard #505W North Waterfront $1,500,000 10-Mar 41 2 2 1512 -1.6% 1177 California #1510 Nob Hill $1,495,000 10-Mar 119 3 3 1660 0.0% 18 Vandewater North Beach $1,475,000 6-Mar 137 3 3 1860 1.9% 1483 Sutter #1707 Van Ness/Civic Center $1,400,000 22-Feb 10 2 2 1403 0.8% 140 Van Ness #801 Van Ness/Civic Center $1,300,000 2-Mar 34 3 2 1800 -3.7% 1450 Franklin #405 Van Ness/Civic Center $1,250,000 27-Feb 25 2 2 1325 0.0% 1776 Sacramento #606 Nob Hill $1,200,000 13-Mar 12 3 2 1231 4.4% 66 Bernard #2 Nob Hill $1,000,000 28-Feb 18 2 2 924 0.5% 1483 Sutter #605 Van Ness/Civic Center $975,000 10-Mar 51 2 2 1316 -2.0% 1545 Broadway #304 Nob Hill $915,000 22-Feb 90 2 2 1160 -6.2% 611 Mason #506 Downtown $850,000 17-Mar 13 2 2 978 6.4% 1545 Pine #611 Van Ness/Civic Center $830,000 21-Mar 183 1 1 857 -4.0% 1148 Montgomery Telegraph Hill $785,000 9-Mar 100 2 2 984 -7.5% 1483 Sutter #520 Van Ness/Civic Center $755,000 20-Mar 20 1 1 775 0.0% 1001 Pine #509 Downtown $575,000 2-Mar 43 1 1 616 -4.0% 1650 Jackson #205 Nob Hill $515,000 7-Mar 195 0 1 617 -5.5% 1159 Hyde #5 Nob Hill $470,000 24-Feb 130 2 1 800 0.0% 1050 North Point #305 Russian Hill $440,000 15-Mar 165 0 1 386 -10.0% 631 Ofarrell #812 Downtown $340,000 24-Feb 131 0 1 520 -10.3%
DISTRICT 9 SALES SOUTH BEACH TO BERNAL HEIGHTS
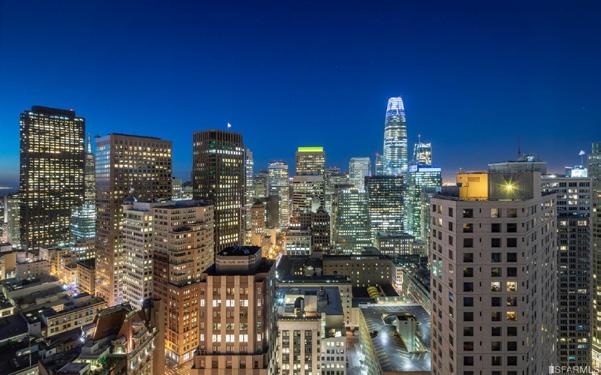

$984 PER SQFT $1,500,000 MEDIAN SALES SINGLE FAMILY $957 PER SQFT $1,090,000 MEDIAN SALES CONDO 765 Market #29A $4,450,000 Sold Mar 6 14.5% 7.7% 21.5% Address Subdistrict Sale Price Date DOM BR BA Sq Feet % Over List 765 Market #29A South of Market $4,450,000 6-Mar 30 4 5 3321 -10.9% 1321 De Haro Potrero Hill $3,895,000 17-Mar 117 4 5 3722 -2.5% 188 Minna #30D Yerba Buena $3,250,000 22-Mar 0 2 3 1792 0.0% 188 Minna #30C Yerba Buena $3,250,000 22-Mar 0 2 3 1670 0.0% 211 Anderson Bernal Heights $2,650,000 13-Mar 4 4 3 1918 15.5% 506 Banks Bernal Heights $2,400,000 9-Mar 9 3 2 1701 6.7% 3339 Folsom Bernal Heights $2,350,000 17-Mar 0 3 3 3229 4.7% 834 Rhode Island Potrero Hill $1,900,000 17-Mar 28 2 3 1325 0.0% 219 Brannan #2F South Beach $1,775,000 9-Mar 38 2 2 1322 1.5% 480 Mission Bay #514 Mission Bay $1,650,000 16-Mar 168 2 2 1383 -2.9% 338 Potrero #PH3 Inner Mission $1,625,000 16-Mar 45 2 2 1215 -4.4% 216 Precita Bernal Heights $1,604,900 9-Mar 0 3 2 1230 10.7% 145 Cortland Bernal Heights $1,570,000 17-Mar 11 3 2 1274 21.0% 480 Mission Bay #513 Mission Bay $1,500,000 16-Mar 32 2 2 1209 -3.2% 216 Precita #A Bernal Heights $1,425,000 9-Mar 7 2 2 1075 10.0% 772 South Van Ness #1 Inner Mission $1,410,000 10-Mar 0 3 3 1639 1.1% 1074 Treat Inner Mission $1,360,000 22-Mar 29 3 2 1448 5.0% 1254 South Van Ness Inner Mission $1,325,000 10-Mar 20 3 2 1438 10.9% 229 Brannan #5E South Beach $1,225,000 6-Mar 0 2 2 1063 -1.9% 219 Bocana Bernal Heights $1,205,000 20-Mar 10 2 1 875 26.8% 93 Mirabel Bernal Heights $1,185,000 13-Mar 12 2 2 1025 13.0% 1 South Park #206 South Beach $1,184,000 13-Mar 34 2 2 972 -5.3% 555 4th #900 South Beach $1,175,000 10-Mar 21 2 2 1111 0.0% FEB 23 vs FEB 22 3.1%
SOTHEBY’S
Sotheby’s Auction House has over 200 years of history selling our clients’ treasures. Our association with the brand ensures stellar representation, brings cachet to your property and allows us access to affluent buyers around the world.
SOTHEBY’S INTERNATIONAL REALTY
With our distinguished global referral network we can find qualified buyers or quality agents for your next purchase from around the globe. Our listings achieve maximum sale price.
950 OFFICES
22,000 SALES ASSOCIATES
70 COUNTRIES
118M ANNUAL PAGE VIEWS SIR.COM
58M YOUTUBE VIDEO VIEWS
2.5M AVERAGE MONTHLY VISITS SIR.COM
POWER
T R U S T E D T O S E L L Y O U R M O S T V A L U E D A S S E T
OF THE BRAND
BAY AREA AND BEYOND FEATURED LISTING
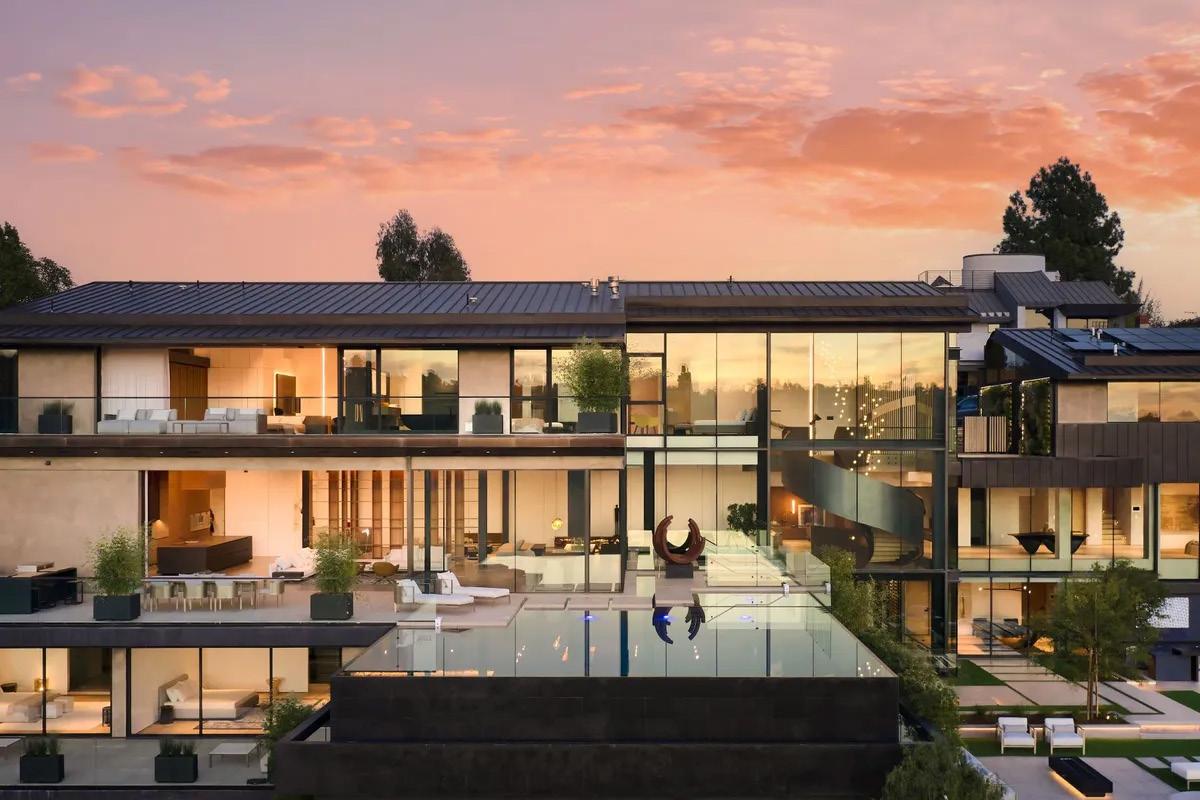
LOS ANGELES, CALIFORNIA

$68,000,000
Enveloped in the lush landscape and bound by the masterful vision of icons in quality and thoughtful execution, award-winning architectural firm Tag Front and world-renowned interior designer Cesar Giraldo, 1859 Bel Air Road offers 20,000 square feet of venerable beauty and an artful abundance of sophistication. The sleek curvature of the exterior of the house is a work of art in itself, with clean lines, geometric shapes, and a contemporary design that exudes sophistication and elegance. An eco-green living wall and a manicured pathway above a striking water feature encompass the 350-foot width of frontage and lead to a moment of arrival, peering above the clouds and extending to the views of the ocean, Catalina Island, and the canyons from Bel Air. This Bel Air modern masterpiece is a true gem, offering the ultimate in luxury living. Listed by Beverly Hills Sotheby’s International Realty.
For more information on this listing and others from our Southern California partners, call us at 415.289.8999.
BAY AREA AND BEYOND FEATURED LISTING

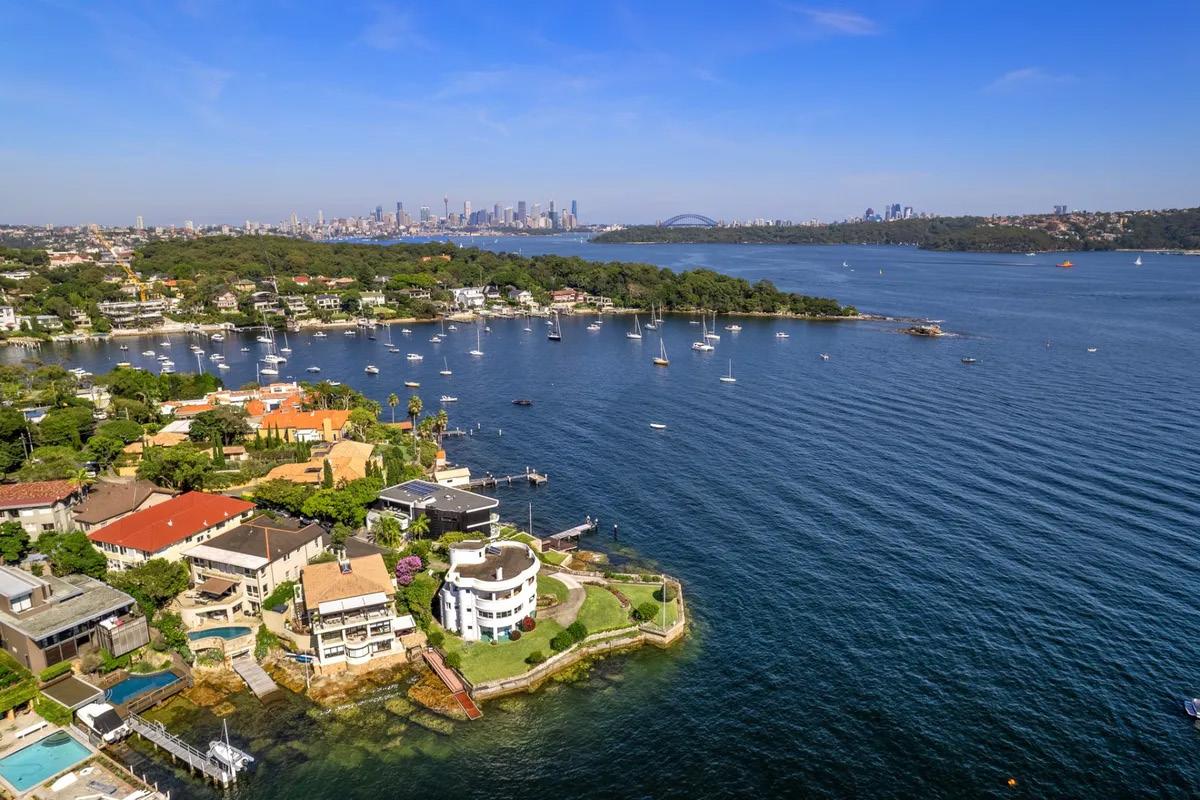
SYDNEY, AUSTRALIA PRICE UPON REQUEST
Offered for the first time in 83 years this incredible residence is a truly iconic and unique and absolute waterfront residence. Occupying a prized 1271 m2 parcel of north facing land on the footsteps of Sydney Harbour. Nestled in an exclusive waterfront cul -de sac between idyllic Parsley and Vaucluse Bay, this waterfront residence boasts breathtaking harbour views and direct access into the glistening waters of Sydney harbour. Undeniably handsome with its timeless P&O architecture, virtually all rooms embrace spectacularly intimate harbour views over the boat-studded waters of Parsley Bay and the gentle sounds of lapping water from every level. Listed by Sydney Sotheby’s International Realty.
For more information on this listing and others from our Global partners, call us at 415.289.8999.
BAY AREA AND BEYOND FEATURED LISTING

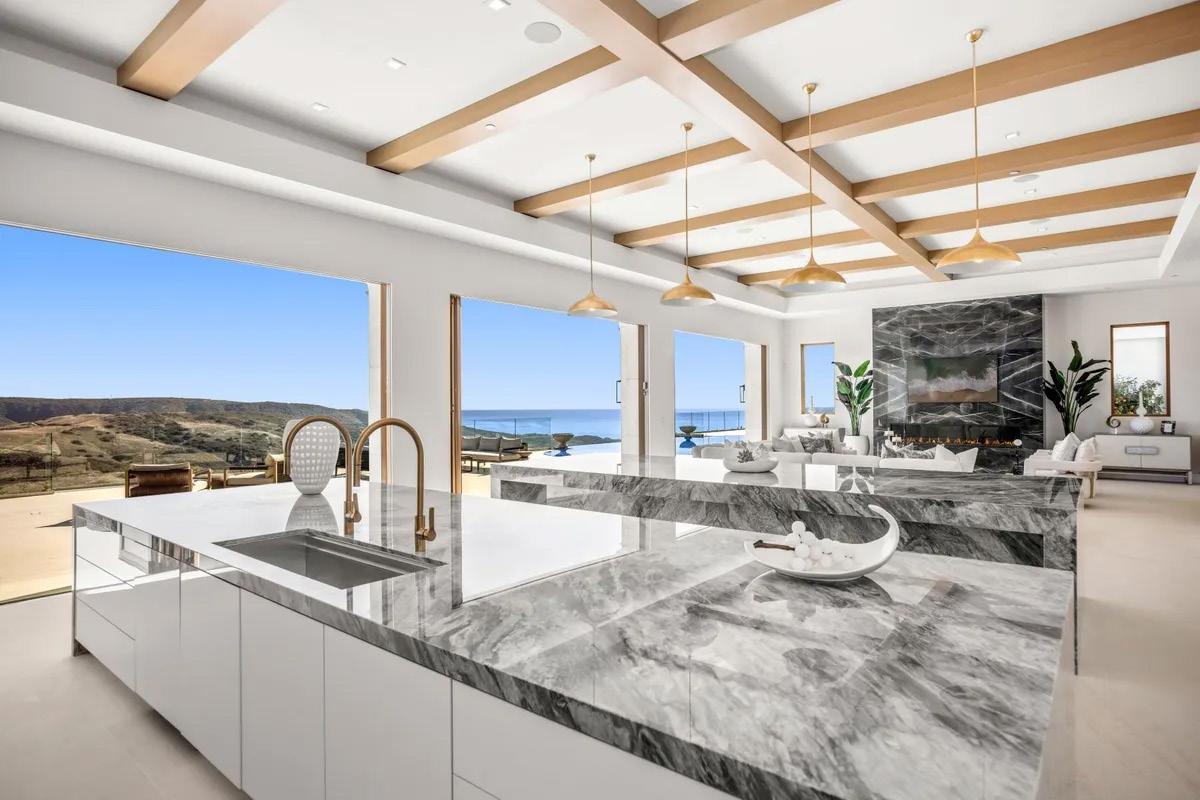
NEWPORT BEACH, CA
$35,000,000
Crystal Cove's newest custom home is a masterfully-designed hilltop estate prominently positioned on a private front-row lot behind the community's prestigious second gates. Stunning architecture is accentuated by the extra-wide corner lot, offering nearly 150 linear feet at the front and nearly 200 linear feet at the back. Possessing a unique 35-feet building height allowance, the home's palatial entrance blends seamlessly with the dual fireplace interior courtyard and beyond to the rear grounds and endless ocean and hillside vistas. No expense was spared in creating this showpiece that offers over 22,000 square feet of interior and exterior living space, numerous covered loggias and terraces, open-air courtyards, and a 3,000 square feet subterranean garage for 15 vehicles. Listed by Pacific Sotheby's International Realty.
For more information on this listing and others from our Southern California partners, call us at 415.289.8999.
BAY AREA AND BEYOND FEATURED LISTING

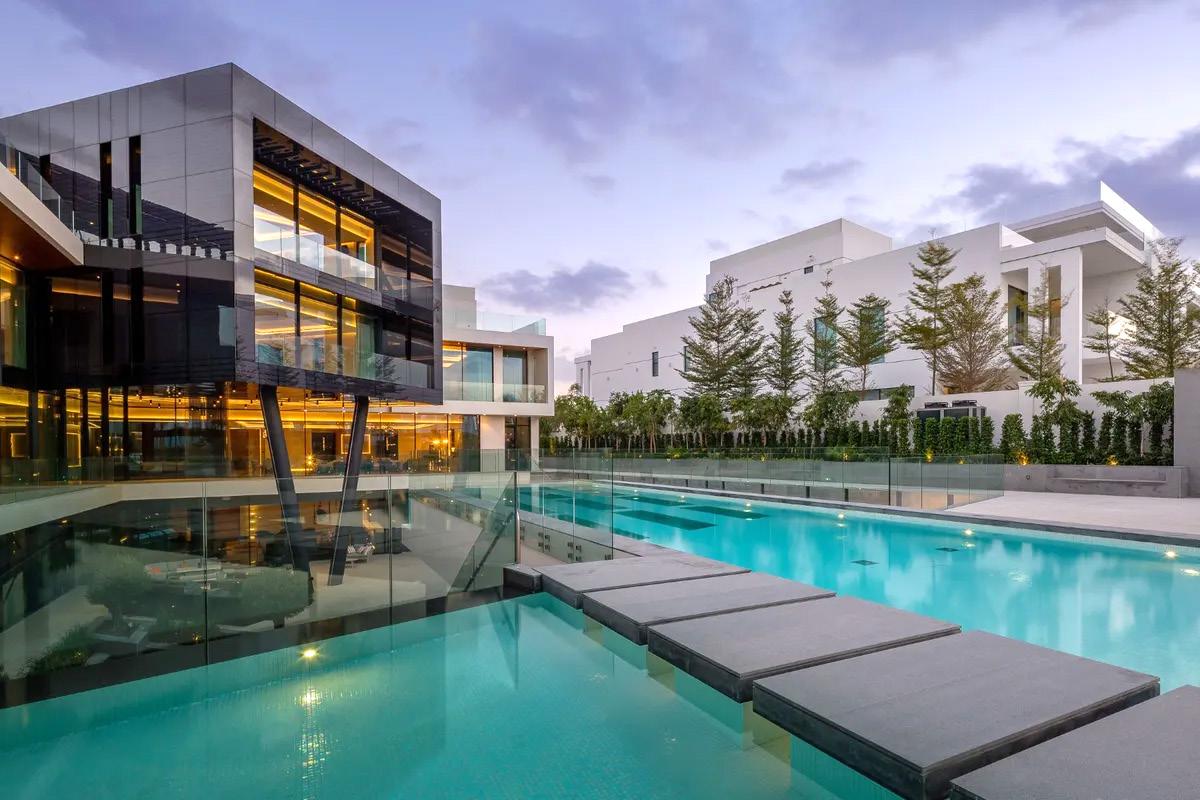
EMIRATES HILLS, DUBAI
$95,095,368
This brand-new mansion-sized villa has been designed to expand the possibilities of elite architecture and pioneer a new frontier in luxury living in the world’s capital of VIP residential real estate. Designed by the experts at XBD Interiors, the villa spans four floors and includes some of the most impressive international brands, superb fittings and luxurious materials. The completely bespoke exterior is dominated by an external mashrabiya facades that casts delicate light shadows, stunning floor to sky glass windows and an 11.5-meter length suspended glass bridge that connects the ground floor balcony to the pavilion and swimming pool. The villa is also entirely solar powered and comes with ten bedrooms and thirteen bathrooms, making it large enough for big families or those who love to host guests. his extraordinary villa needs to be seen to be believed. Listed by Luxhabitat Sotheby’s International Realty
For more information on this listing and others from our Global partners, call us at 415.289.8999.
BAY AREA AND BEYOND FEATURED LISTING

GREENWICH, CT
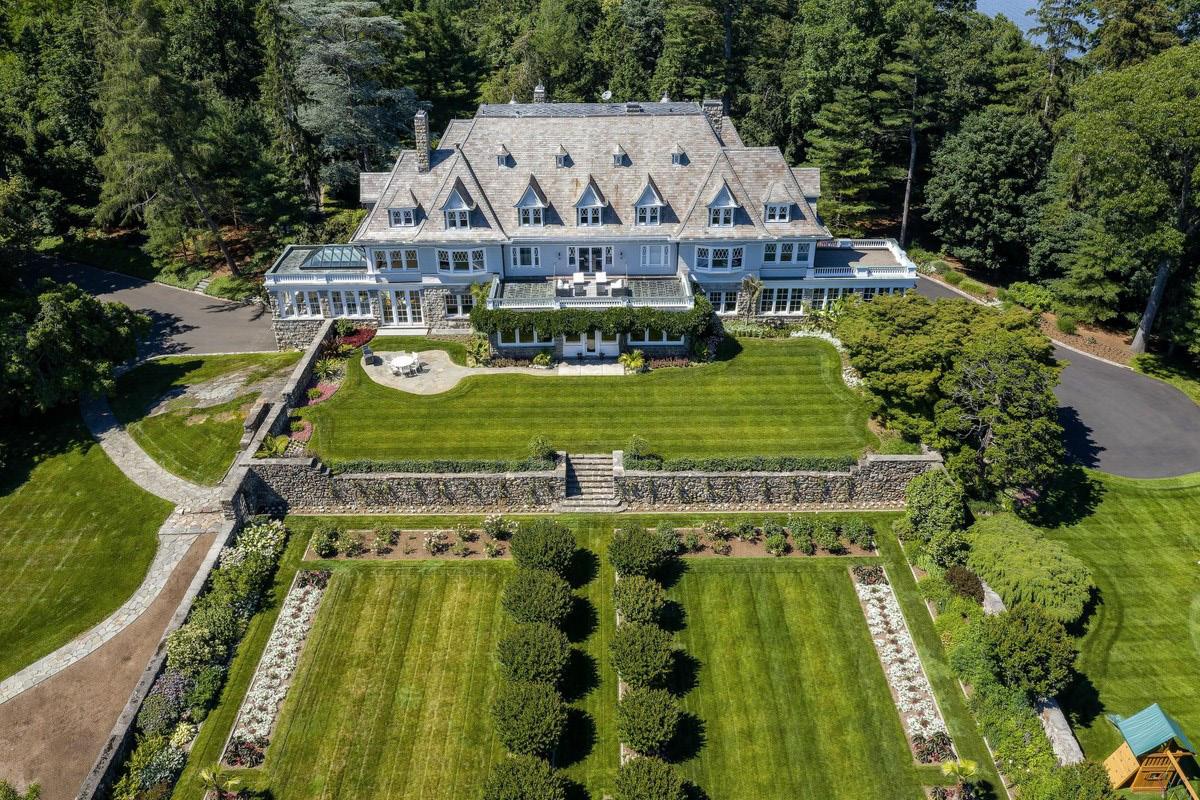
$150,000,000
Copper Beech Farm is the largest waterfront parcel in Greenwich. Situated on a private peninsula, the estate spans over 50 acres with almost a mile of frontage. From its vantage point of 40 feet above mean high water, this estate enjoys dazzling views of Long Island Sound. The property encompasses a stately main house with spectacular walled gardens, a swimming pool, a grass tennis court, apple orchard and two private beaches. Acres of rolling lawn surround the auxiliary buildings including a carriage house, a gatehouse, a pool house and two greenhouses. The crown jewel of the Greenwich coastline, Copper Beech Farm is the pinnacle of the Greenwich real estate hierarchy. This is a tremendously rare opportunity to own one of the largest, if not the largest, residential waterfront properties close to New York City. Listed by Greenwich Sotheby’s International Realty.
For more information on this listing and others from our East Coast partners, call us at 415.289.8999.
BAY AREA AND BEYOND FEATURED

LISTING
MIES, SWITZERLAND PRICE UPON REQUEST
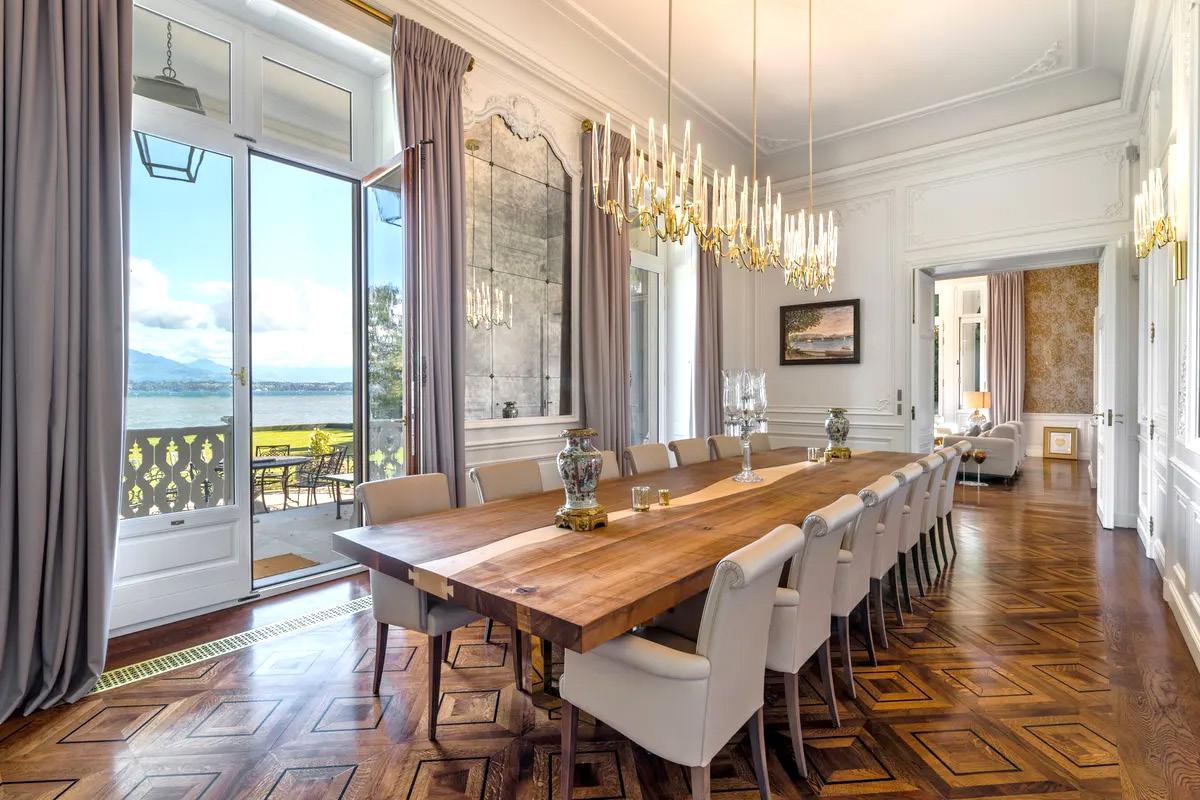
Located on the front line of the lake on a magnificent plot of more than three hectares, this luxurious master property offers you a unique and idyllic location at the entrance to Geneva. Built in the 19th century, this sumptuous property was renovated between 2016 and 2017 using noble and refined materials. It offers a total living area of around 1,000 m² with top-of-the-range services that will meet the highest requirements. Its facilities include an outdoor swimming pool, a tennis court and an elevator serving several levels of the building. This property is ideally located on the edge of the lake. Located at the gates of Geneva, the positioning of the property benefits from all useful amenities such as a train station, grocery store, bakery and pharmacy. At the first visit the charm operates, it will be impossible for you to remain indifferent. The key word is: “Coup de coeur”. Listed by Cardis Immobilier Sotheby's International Realty.
For more information on this listing and others from our Global partners, call us at 415.289.8999.
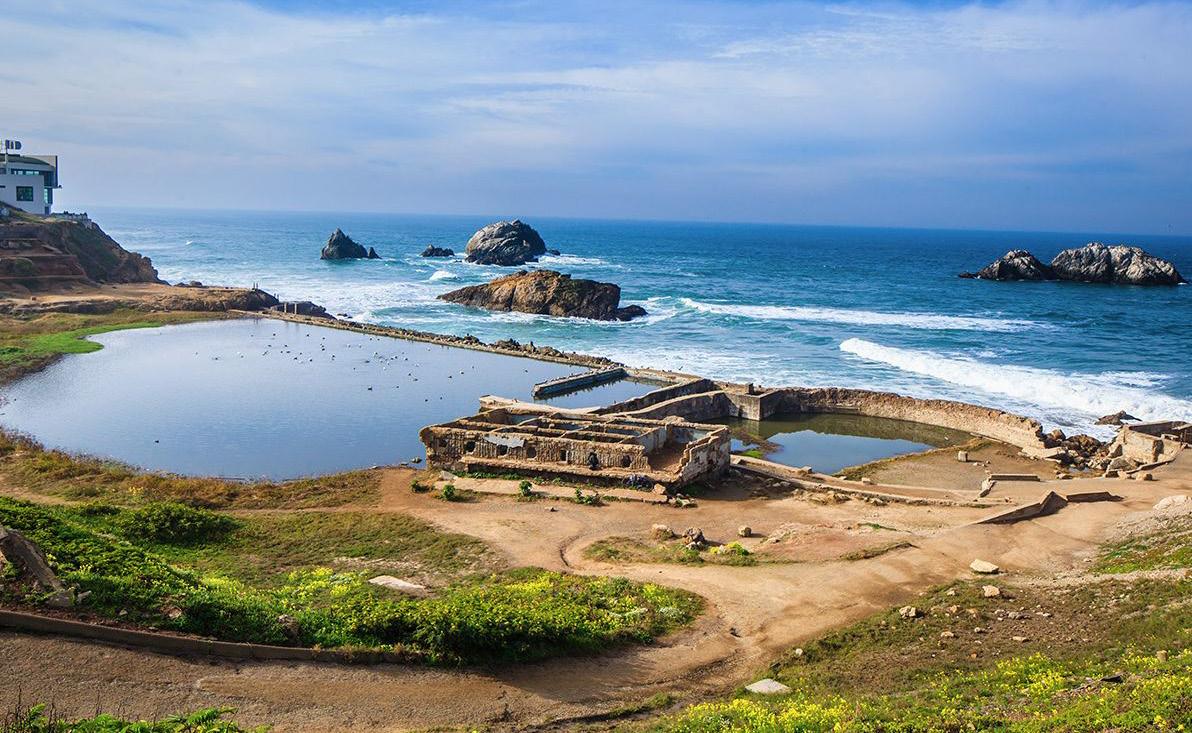
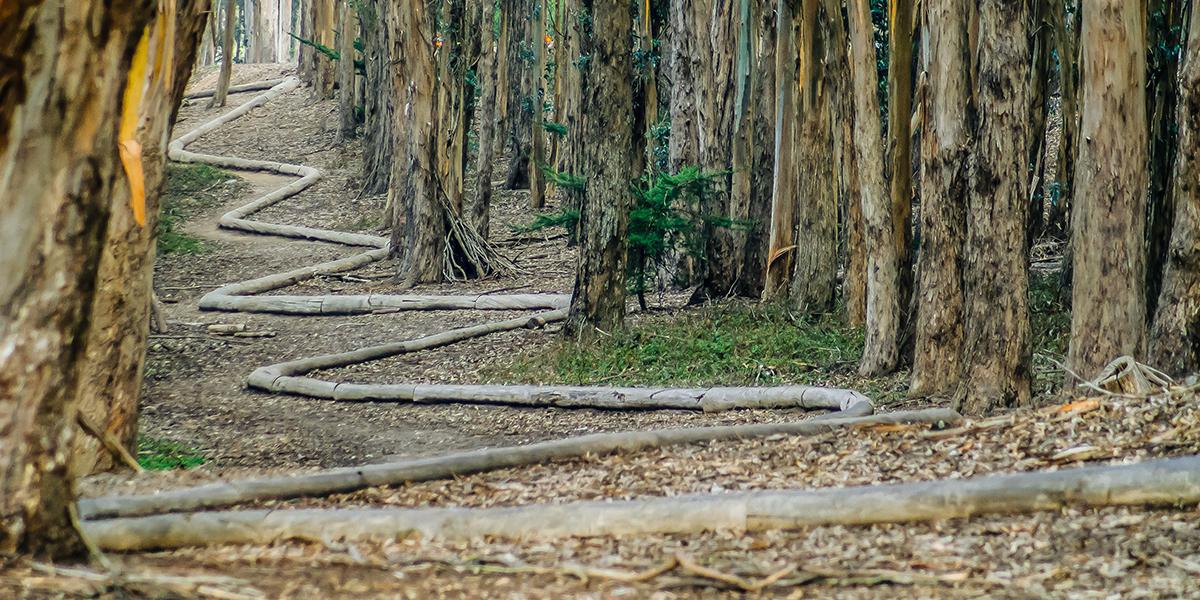
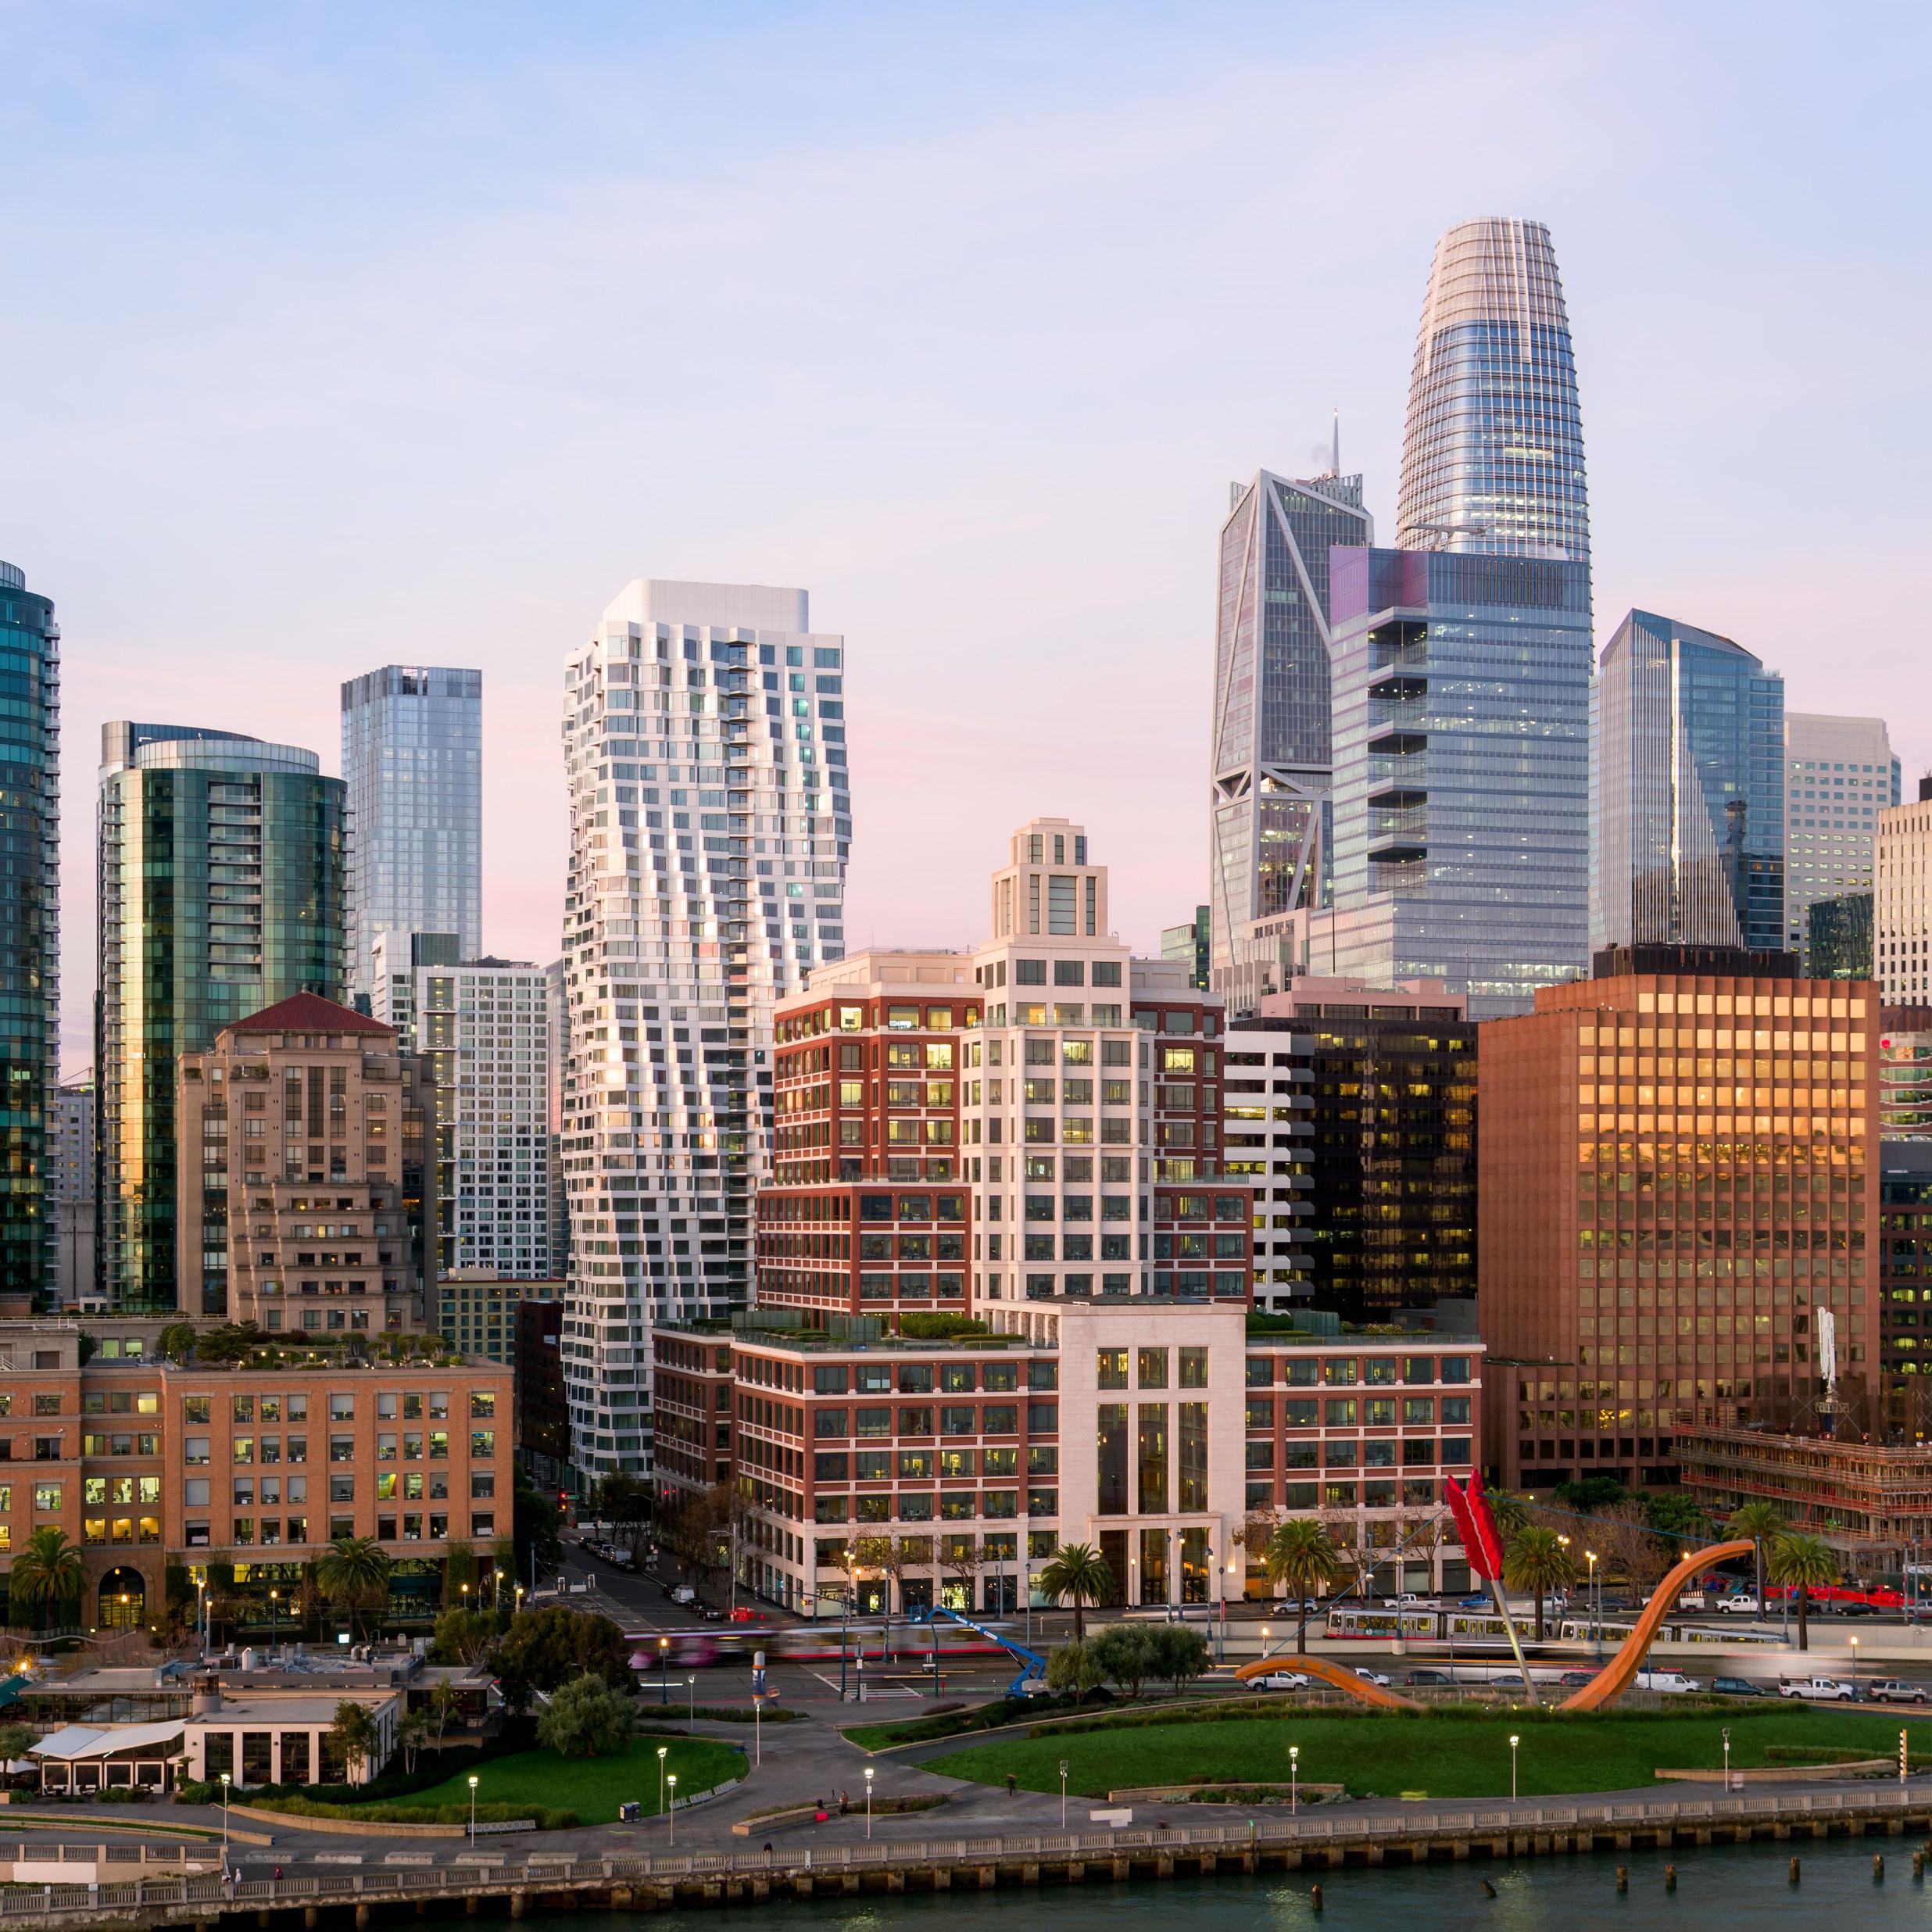
TEST YOUR SAN FRANCISCO IQ


Where am I?
Last issue’s answer: Magowan's Infinite Mirror Maze

GOLDEN GATE SOTHEBY’S INTERNATIONAL REALTY
LOCAL KNOWLEDGE CONNECTED AROUND THE BAY AND THE WORLD
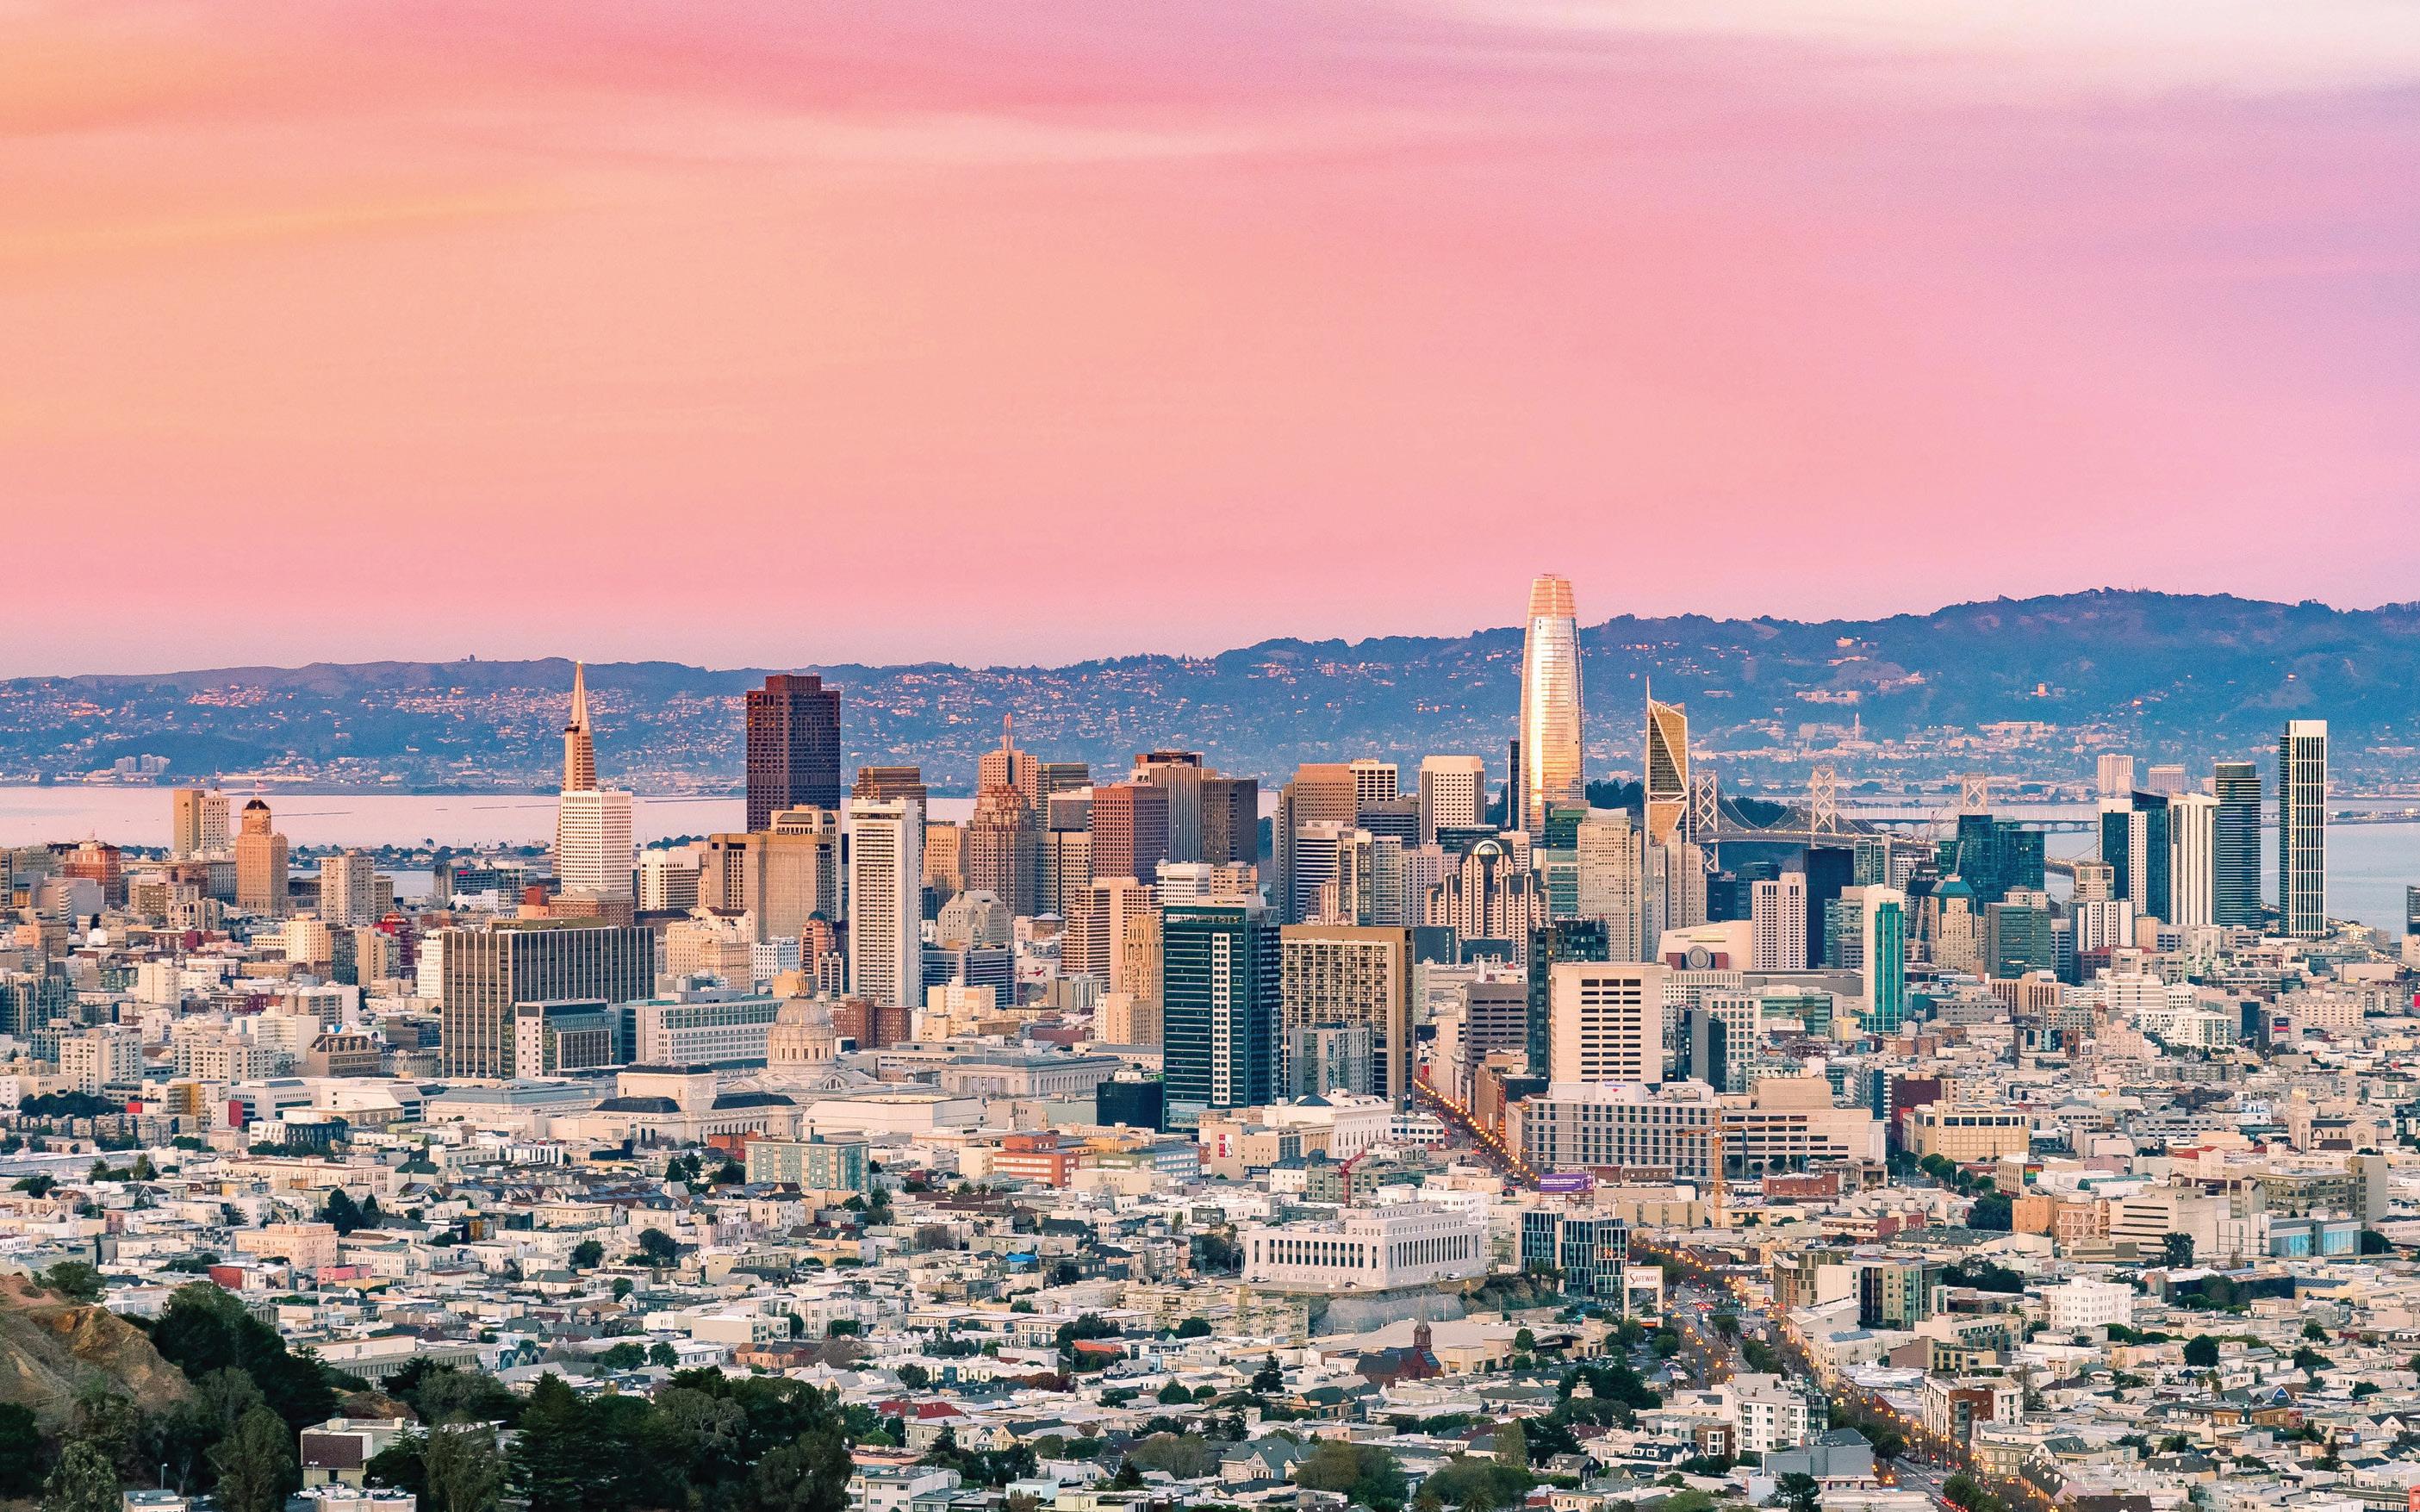
Our brokerage is the number one Sotheby’s International Affiliate in Northern California. We can help you find your buyer. We have more than 500 agents in 22 offices representing active qualified buyers and sellers throughout the San Francisco Bay Area. We service the counties of:
•Alameda
•Contra Costa
•Marin
•Napa
•San Francisco
•San Mateo
•Santa Clara
•Solano
•Sonoma
•Santa Cruz
1#
MEET PAUL
Paul and his team are consistently ranked in the top 1% of agents nationwide, having sold over $2 billion worth of properties. Beyond Paul’s reputation as a consummate professional, his clients appreciate his tenacious attention to detail and extensive market knowledge.
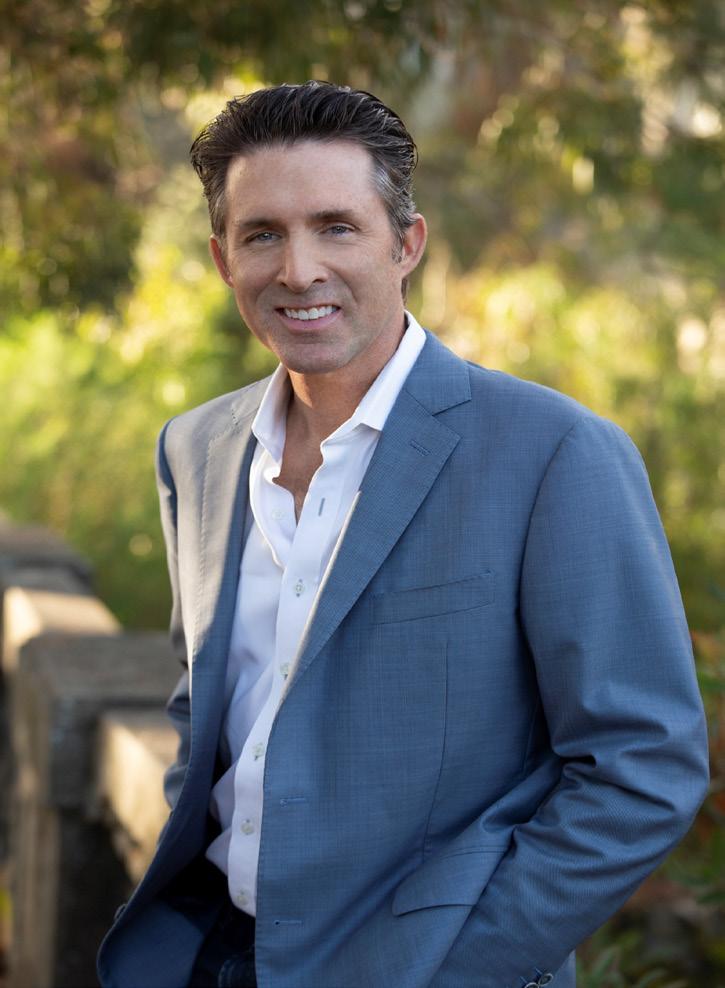

Applegarth+Warrin is one of the top-producing team at Golden Gate Sotheby’s, averaging over $100 million in sales per year. Paul and his team handle a diverse range of properties, from luxury homes to condominiums, TICs, and small apartment buildings, with prices ranging from $500,000 to $25,000,000.
PAUL WARRIN
415.407.8019
Paul@AW-SF.com

Top 1% Nationwide
Lic . #01364693
A fourth generation San Franciscan, Paul has an unrivaled knowledge of the local real estate market. In over two decades in local real estate, he has helped hundreds of clients find their dream home or attain the best possible sales price for their property. In addition, he has also renovated many properties and invested in multi-family apartment buildings.
Above all, Paul knows that his continued success depends upon exceeding expectations and forging long-term relationships. With that in mind, he has one goal for every real estate transaction: a completely satisfied client.
In his free time Paul enjoys spending time with his wife Kara and their three children. The family is full of avid tennis players, thrillseeking skiers, and intrepid travelers.
MEET SF’S FAVORITE TEAM
KARA WARRIN
Highly innovative and successful, Kara excels at envisioning the details of a property’s potential Her vision and in-depth market knowledge makes Kara uniquely qualified to guide clients through the process of buying and selling.
415.407.7979
kara@applegarthwarrin.com
Lic. 01882747
PAUL WARRIN
Ranked top 1% nationwide Paul is a 4th generation San Franciscan, with unrivaled local market knowledge. Paul and his team have helped hundreds of clients find their dream home and attain the maximum possible sales price

415.407.8019
paul@applegarthwarrin.com
Lic. 01364693
MAX APPLEGARTH
Max is a fourth generation native of San Francisco He has been awarded the coveted International President’s Premier Top Producer designation, in recognition of his achievements and placing him in the top one percent of his colleagues.

415.298.7600
maxl@applegarthwarrin.com
Lic. 01423191
CLAIRE BAYLES
Raised in Tiburon, Claire has an innate understanding of Marin County life She offers an array of design and development experience and is ideally suited to navigate you through the process of buying or selling your home. Claire’s goal is to achieve results above her client’s expectations
415.218.0535
claire@applegarthwarrin.com
Lic. 02061042
SKYE ADDICKS
Born and raised in Marin County, to a family that goes back seven generations in San Francisco. Syke has an extensive background in design and unique ability to identify hidden opportunities She is fully committed to providing a personalized service that exceeds expectations.
415.717.6036
skye@applegarthwarrin.com Lic. 02137351
HOLLY KHOUW
Originally from the East Coast, Holly holds a degree in Marketing and worked in advertising in Los Angeles She enjoys all the Marin lifestyle has to offer and the fastpaced real estate environment Holly knows the benefits of each neighborhood be it in San Francisco or Marin.




415.444.6403
holly@applegarthwarrin.com Lic. 01478076
415.289.2999 team@applegarthwarrin.com O V E R $ 2 B I L L I O N I N S A L E S APPLEGARTHWARRIN.COM


