REAL ESTATE MARKET REPORT SAN FRANCISCO

APPLEGARTHWARRIN.COM 2023
Power of the Brand
Housing Market Update
Luxury Market Summary
San Francisco Sales Summary
Single Family Sales Over $3.5M
Condo Sales Over $2.5M
Biggest Overbids 2022
Price Increase by Neighborhood
SFAR 2022 Annual Report
A+W Featured Properties
Significant Sales Meet the Team 4 8 14 17 26 38 48 49 64 78 82 84 91
U.S. Biggest Home Sales 2022 Sotheby’s
The A+W team is pleased to present you with our annual report on the San Francisco real estate market. Last year was a tale of two markets. The first half was a continuation of the hyperactive pandemic market, with sales prices hitting an all-time high in April 2022. Meanwhile, rising interest rates and economic concerns cooled the market in the second half of the year.
While prices fell during the second half of the year, we can expect them to nudge back up from their November and December lows, buoyed by lower interest rates, improved buyer confidence, and the post-pandemic re-opening of China.
For the year:
• The median single family home price fell 1.1%, to $1,800,000
• The median condo/TIC/co-op price fell 1.6%, to $1,200,000
• The overall number of homes sold fell 27%, to 5,569
• The average sale price was 8% over asking, same as in 2021
• The number of luxury homes sold in the Bay Area at the highest end of the market (over $10M) fell 15% to 118 homes
• The biggest sales in SF were:
- 2790 Broadway, $34.5M
- 3450 21st St (Mark Zuckerberg’s house), $31M
- 3355 Pacific, $29.5M
- 999 Green #3201/2 (George Shultz’s 2 penthouses), $29M
- 3636 Clay, $19M
- 2006 Washington #2, $19M
With $122,000,000 in sales last year, Applegarth+Warrin was the top team at Golden Gate Sotheby’s in San Francisco and Marin, and one of the top teams in the country. We’d like to take a minute to thank all of our friends, clients, and colleagues who have entrusted us to help with their real estate needs. We wish you a very happy and healthy 2023. TOP AGENTS
If you have questions about the market or your home, call us anytime at 415-299-8999, or email team@applegarthwarrin.com

2 B I L L I O N S O L D
APPLEGARTH + WARRIN $
%
1 NATIONWIDE
POWER OF THE BR AND Trusted to Sell Your Most Valued Asset
S O T H E B Y ’ S
Sotheby’s Auction House has over 200 years of history selling our clients’ treasures. Our association with the brand ensures stellar representation, brings cachet to your property and allows us access to affluentbuyersaroundtheworld.

SOTHEBY’S I NTERN A T I O NAL R EA L TY
With our distinguished global referral network we can find qualified buyers or quality agents for your next purchase from around the globe. Our listings achievemaximumsaleprice.
1,000 Offices
178M Million Annual Page Visits SIR.com
25,000 Sales Associates
77 Countries
170M Million YouTube Video Views
3.8M Million Average Monthly Visits SIR.com
4


5

APPLEGARTH + WARRIN 6


7
SAN FRANCISCO BAY AREA HOUSING MARKET

AN UP AND DOWN YEAR
The past year was marked by strong for-sale housing market conditions followed by a modest softening in the second half of the year. Driven primarily by the surge in mortgage rates, some buyers returned to the sidelines — interested in entering the ownership market yet wary of affordability and household finances. However, at the higher end of the pricing spectrum, buyer activity performed relatively better in the last year, particularly within prime neighborhoods.
UNDERLYING ECONOMIC STRENGTH
The regional economy remained strong even as headwinds such as elevated inflation, weakened consumer confidence and layoff announcements threatened to slow the expansion. The labor market is surprisingly strong, with the unemployment rate at 2.6%. In 2022, roughly 165,000 jobs were created throughout the region. The tight labor market continued to buoy household finances with strong wage
growth across a range of industries. Government programs and subsidies for pandemic and inflation-related issues also helped consumers to continue to purchase discretionary goods and services.
SF Bay Area Job Creation (in thousands)
Napa Santa Cruz San Francisco San Mateo Alameda BayArea Santa Clara Marin Contra Costa Sonoma Solano -17.6% -4.5% -1.3% 0.0% 0.4% 0.7% 0.8% 1.9% 2.5% 5.4% 5.8% 300
Median Price Increased above $2 million (2018 vs. 2019)
Sources: MLS, RCG
SF Bay Area Unemployment Rate
0% 2% 4% 6% 8% 10% 12% 14% 16% 2001 2002 2003 2004 2005 2006 2007 2008 2009 2010 2011 2012 2013 2014 2015 2016 2017 2018 2019 202 0 20 21 20 22 Peak: 13.7% MAY 2020 2.6% NOV 2022 8
Source: US Bureau of Labor Statistics. Data through November 2022, seasonally adjusted.
SF Bay Area Job Creation
PACE OF SALES CALMS FROM RECORD-SETTING 2021
In 2022, more than 46,000 single family homes sold across the SF Bay Area, a decrease of roughly 26% from the previous year. It is no surprise that sales activity slowed from the record-setting pace of 2021 and returned to near 2020 levels. The low number of available homes available during the year likely would have decreased achievable sales totals in 2022 even if mortgage rates did not increase. The number of closed sales fell in all counties in the SF Bay Area, led by Sonoma County. The smallest decreases of roughly 20% were in San Francisco and Solano counties.
PRICE TIERS BEHAVE DIFFERENTLY
The higher mortgage rates and decreased affordability hampered activity at the lower price tiers. Additionally, recent price increases have shifted many homes out of the lowest price tier. The number of homes sold for less than $750,000 declined by 31%, while sales in the $750,000 to $1 million range fell by approximately 25%. Though still lower than one year ago, sales of homes priced between $2.5 million and $5 million decreased by roughly 16%, much less than the decrease in the lower price ranges.
As more employers focus on the majority of days spent at the workplace rather than working from home, households made a choice to locate closer to workplaces in many cases, helping to bolster demand and pricing. The international buyer segment has yet to fully recover, with the strong dollar a deterrent for some potential buyers. While the importance of this segment varies by neighborhood, the lack of a recovery of international purchase activity helped produce the lower sales volume.
(in thousands) Sources: BLS, RCG; as of November 2022 -500 -400 -300 -200 -100 0 100 200 300 19911992199319941995199619971998199920002001200220032004200520062007200820092010201120122013201420152016201720182019202020212022 179.9 241.8 -410.3 65.7 78.8 78.2 100 121.9139.5 118 144 74.6 22 -180.8 -80.6 51.7 55.1 47 25.7 -63.5 -107.4 -222.1 163.5 98.3 81.5 142.9 116.3 97.2 23.1 19.4 -38.7 -36.2 Source: US Bureau of Labor Statistics. Data through November 2022, seasonally adjusted. 0% 2001 2002 2003 2004 2005 2006 2007 2008 2009 2010 2011 2012 2013 2014 2015 2016 2017 2018 2019 202 0 20 21 20 22 Jan Feb Mar Apr May Jun Jul Aug Sep Oct Nov Dec Jan 0K 1K 2K 3K 4K 5K 6K 4,298 2,666 2021/2022 Homes Sold SF Bay Area Single Family Homes Median Price SF Bay Area Single Family Homes Average Days on Market SF Bay Area Single Family Homes Sold Price as % of Original List Price SF Bay Area Single Family Homes Jan Feb Mar Apr May Jun Jul Aug Sep Oct Nov Dec Jan $0.0M $0.5M $1.0M $1.5M $1.06M $1.18M 2021/2022 41 2022 2021 2022 2021 Source: MLS Source: MLS 9
PRICES EASE IN SOME AREAS, INCREASE IN OTHERS
The SF Bay Area median price decreased toward the end of 2022, reaching slightly less than $1.1 million at year-end. This was off from the intrayear peak of $1.48 million in April. Though pricing was lower in most areas, bucking the trend were Solano and Sonoma counties where the median prices were flat when compared with the previous year end.
Additionally, highly desirable cities produced year-end pricing gains versus December 2021. In Alameda County, for example, where prices declined by roughly 12% county-wide, the median price increased by 4% in Alameda and more than 8% in Piedmont. Similarly, in San Mateo County where pricing was off by 15%, the median price increased in Atherton by more than 17%. In Marin County, the median price in Belvedere also increased in 2022. Throughout the SF Bay Area, prime neighborhoods, particularly those with access to desirable school districts, often outperformed other cities. In fact, when segmenting by median price, seven out of the top ten highest median-priced cities boasted price gains last year.
Further highlighting that pricing held up better in certain neighborhoods in 2022, by year-end the median price of a home sold in the $750,000
to $1.25 million and $2.5 million to $3.5 million ranges increased by roughly 1%. The median price in the less than $750,000 range fell by nearly 2% from the previous year. For homes that sold above the $3.5 million mark, the median price decreased by 2% to 3%.
MODEST INCREASES IN INVENTORY
For-sale inventory remained low even as absorption slowed, averaging 5,000 homes for sale in 2022. The range of number of listings per month was varied, with record-low inventory to begin the year and a peak of nearly 7,500 homes for sale during the summer months. The mortgage rate for most existing homeowners is lower than current rates, which deters a segment of potential sellers. Despite this, inventory increased modestly in much of the SF Bay Area. However, inventory decreased in Sonoma County and was flat in Napa County compared with the previous year.
SOME HOMES TAKING SLIGHTLY LONGER TO SELL
By the end of the year, homes in the SF Bay Area stayed on the market for longer than at the beginning of 2022, though still less than the prepandemic period. For homes that sold in the last year, the average time on market was 24 days. However, during the spring, homes spent less than 20 days on the market, on average, which increased to more than 40 days by December. Counties with larger increases in time spent on
Average Days on Market
Dec Jan 4,298 2,666 Median Price SF Bay Area Single Family Homes Sold Price as % of Original List Price SF Bay Area Single Family Homes Jan Feb Mar Apr May Jun Jul Aug Sep Oct Nov Dec Jan $0.0M $0.5M $1.0M $1.5M $1.06M $1.18M 2021/2022 Dec Jan 26 41 Jan Feb Mar Apr May Jun Jul Aug Sep Oct Nov Dec Jan 70% 80% 90% 100% 110% 120% 107.5% 96.2% 2021/2022 2022 2021 2022 2021 Source: MLS Source: MLS Jan Feb Mar Apr May Jun Jul Aug Sep Oct Nov Dec Jan 0K 1K 2K 3K 4K 5K 6K 4,298 2,666 2021/2022 Homes Sold SF Bay Area Single Family Homes Median SF Bay
SF Bay Area Single Family Homes Sold SF Bay Jan Feb $0.0M $0.5M $1.0M $1.5M 2021/2022 Jan Feb Mar Apr May Jun Jul Aug Sep Oct Nov Dec Jan 0 10 20 30 40 26 41 2021/2022 Jan Feb 70% 80% 90% 100% 110% 120% 2021/2022 2022 2022 2021 2022 2021 2022 2021 2021 Source: MLS Source: Source: MLS Source: 10
Frenetic Pace of Spring Market Moderates
Average Days on Market by County in 2022
Median Price
the market for closed sales included Contra Costa and Santa Clara counties, while the amount of time in Napa County was virtually unchanged.
Even with the increase in time on the market throughout the SF Bay Area, well-priced homes sold relatively quickly. Homes in less desirable neighborhoods, as well as those where seller expectations may be different than that of buyers, sat on the market for longer periods. These unsold listings, in part, drove the average of all homes still available on the market to more than 90 days. Additionally, vacation homes in some markets remained on the market for an extended period, leading the average time on market for active listings to increase to more than 100 days in
Sold Price as % of Original List Price
Marin, Napa, Santa Cruz and Sonoma counties.
BUYER COMPETITION EASES
Though buyer demand persists, competition slowed into the end of the year as some potential buyers returned to the sidelines. Early in the year, multiple bids and closes greater than the asking price were often the norm. In the first half of the year, nearly 80% of transactions closed at greater than the list price. In the second half of the year, the share dropped to roughly 40%.
LOOKING AHEAD
The last year highlighted the depth of demand for housing in the SF Bay Area as home values, number of sales and scarce inventory hit record levels early in the year. This past year also displayed the impact of higher mortgage rates, declining affordability and diminished consumer confidence on the housing market.
Despite the headwinds, the underlying demand for housing in the SF Bay Area should maintain a moderate pace of sales in 2023 though home prices may fall. Near-term economic issues such as a reduction in tech employment may reduce buyer competition but the attractiveness of ownership combined with the amenities and access to leading employers will maintain and attract new residents to the SF Bay Area.
2007200820092010201120122013201420152016201720182019202020212022 179.9 241.8 -410.3 65.7 78.8 78.2 100 121.9139.5 118 144 74.6 22 -180.8 -80.6 JanFebMarAprMayJunJulAugSepOctNovDec 0 10 20 30 40 50 60 70 56 Sonoma 56 Solano 37 Santa Cruz 30 Santa Clara 37 San Mateo 36 San Francisco 67 Napa 43 Marin 41 Contra Costa 32 Alameda Dec Jan 4,298 2,666
Source: MLS, Sold Single Family Homes
SF Bay Area Single Family Homes
SF Bay Area Single Family Homes Jan Feb Mar Apr May Jun Jul Aug Sep Oct Nov Dec Jan $0.0M $0.5M $1.0M $1.5M $1.06M $1.18M 2021/2022 Dec Jan 26 41 Jan Feb Mar Apr May Jun Jul Aug Sep Oct Nov Dec Jan 70% 80% 90% 100% 110% 120% 107.5% 96.2% 2021/2022 2022 2021 2022 2021 Source: MLS Source: MLS 11
SAN FRANCISCO BAY AREA MEDIAN SALES PRICES: 1991-2022
Graph shows the 12-month rolling average of the median sales price for existing single family detached homes in the nine SF Bay Area counties. The rolling average smooths out seasonal variations, shown in gold, to give a clear picture of long term trends. Source: California Association of Realtors
1991199219931994199519961997199819992000200120022003200420052006200720082009
$400,000 $600,000 $800,000 $1,000,000 $1,200,000 $1,400,000 $1,600,000
Dotcom bubble peaks
12-MONTH ROLLING AVERAGE
12

19911992199319941995199619971998199920002001200220032004200520062007200820092010201120122013201420152016201720192020202120 2022 18 MarketPeak $789,250 May 2007 $1,540,000 High April 2022 Subprime bubble bursts MarketTrough $321,110 Feb 2009 MONTHLY MEDIAN 13
LUXURY MARKET SALES SUMMARY

14
SAN FRANCISCO BAY AREA LUXURY MARKET

Golden Gate Sotheby’s International Realty serves the SF Bay Area luxury home market with exclusive access to the largest international “Luxury MLS” — the Sotheby’s International Realty listing syndication platform, which includes sothebysrealty.com and partners that include Mansion Global, The Wall Street Journal, Barron’s, Financial Times, James Edition and Juwai, just to name a few. The platform allows buyers from around the world to locate luxury homes in the SF Bay Area and beyond.
2022 Luxury Sales by County and Sale Price
2022 LUXURY SALES
Sales at the highest-end of the market dropped slightly in 2022 from the luxury boom that was 2021, but remained more than 60% above 2020 levels.
2022 Luxury Sales by Price Band

The highest priced sale recorded in the MLS in 2022 was for a 15,288-square-foot home on a 45-acre vineyard property in St. Helena in Napa Valley wine country. Of the top ten highest sales for the year, seven were in San Mateo County, and one in each in Napa, Santa Clara, and Marin counties.
For an in-depth review of the luxury housing market worldwide, see luxuryoutlook.com
Sales Trends by Price Band
County $5M $10M $15M $20M $25M $30M $35M Sale Price
COUNTY 050100150200250300350400450500550600650 Number of Sales Santa Clara San Mateo San Francisco Marin Contra Costa Alameda Napa Sonoma Santa Cruz 260 113 16 16 10 1 1 2 2 Santa Clara San Mateo San Francisco Marin Contra Costa Alameda Napa Sonoma Santa Cruz 4 20 119 133 129 494 60 45 57 7215 871 2216 10 2813
2017 2018 2019 2020 2021 2022 0 500 1000 1500 2000 477 589 564 762 1,535 $4-6m: 1,229 172 218 187 233 497 $6-10m: 390 45 66 52 74 138 $10m+: 118
Luxury Price Bands $10m+ $6-10m $4-6m
Q3 REPORT 2022 Significant Sales OUR BROKERAGE’S SIGNIFICANT SALES 15


16
SAN FRANCISCO SALES SUMMARY

17
SAN FRANCISCO SINGLE FAMILY

2022 ANNUAL SALES BY DISTRICT · SINGLE FAMILY HOMES
DISTRICT 1
Central Richmond, Inner Richmond, Outer Richmond, Jordan Park/Laurel Heights, Presidio, Lake Street, Sea Cliff, Lone Mountain
DISTRICT 2
Golden Gate Heights, Outer Parkside, Outer Sunset, Parkside, Central Sunset, Inner Sunset, Inner Parkside
DISTRICT 3
Lake Shore, Merced Heights, Pine Lake Park, Stonestown, Lakeside, Merced Manor, Ingleside, Ingleside Heights, Oceanview
DISTRICT 4
Balboa Terrace, Diamond Heights, Forest Hill, Forest Knolls, Ingleside Terrace, Midtown Terrace, Saint Francis Wood, Miraloma Park, Forest Hill Extension, Sherwood Forest, Mount Davidson Manor, Westwood Highlands, Westwood Park, Sunnyside, West Portal, Monterey Heights
DISTRICT 5
Glen Park, Haight Ashbury, Noe Valley, Twin Peaks, Cole Valley/ Parnassus Heights, Buena Vista/Ashbury Heights, Castro, Corona Heights, Clarendon Heights, Duboce Triangle, Eureka Valley/Dolores Heights, Mission Dolores
DISTRICT 6
Anza Vista, Hayes Valley, Lower Pacific Heights, Western Addition, Alamo Square, North Panhandle
DISTRICT 7
Marina, Pacific Heights, Presidio Heights, Cow Hollow
DISTRICT 8
Downtown, Financial District/ Barbary Coast, Nob Hill, North Beach, Russian Hill, Van Ness/ Civic Center, Telegraph Hill, North Waterfront, Tenderloin
DISTRICT 9
Bernal Heights, Inner Mission, Mission Bay, Potrero Hill, South of Market, Yerba Buena, South Beach, Central Waterfront/ Dogpatch
DISTRICT 10
Bayview, Crocker Amazon, Excelsior, Outer Mission, Visitacion Valley, Portola, Silver Terrace, Mission Terrace, Hunter’s Point, Bayview Heights, Candlestick, Little Hollywood
City Average Sale Price Median Sale Price High Sale Avg Price/SF # of Sales DOM 2022 ±% 2022 ±% 2022 2022 ±% 2022 ±% 2022 ±% District 1 $2,747,436 -0.2% $2,400,000 -3.7% $8,950,000 $1,072 2.1% 207 -8.4% 20 10.6% District 2 $1,794,350 -1.9% $1,700,000 0.0% $3,915,000 $1,042 1.6% 462 -12.3% 19 33.1% District 3 $1,528,150 0.4% $1,400,000 -0.7% $3,400,000 $902 -1.1% 159 -15.0% 24 -6.4% District 4 $2,250,070 1.9% $2,000,000 1.4% $7,100,000 $1,026 2.8% 323 -25.2% 20 20.2% District 5 $2,971,146 -4.7% $2,650,000 -4.5% $8,250,000 $1,159 6.9% 349 -23.6% 21 -7.3% District 6 $3,145,402 -4.9% $2,875,000 5.3% $6,000,000 $1,029 -2.8% 42 -23.6% 30 28.9% District 7 $5,799,165 -6.8% $4,950,000 -5.2% $17,000,000 $1,403 -4.2% 93 -40.8% 36 24.7% District 8 $3,613,857 -6.2% $2,602,500 -14.7% $12,000,000 $1,244 2.2% 30 -3.2% 50 -1.3% District 9 $2,021,653 6.8% $1,825,000 4.3% $5,625,000 $999 5.5% 243 -28.3% 24 -10.1% District 10 $1,238,468 2.9% $1,200,000 0.0% $2,195,000 $806 3.2% 451 -14.9% 25 3.2% San Francisco Co. $2,218,755 -4.1% $1,800,000 -1.1% $17,000,000 $1,017 1.9% 2359 -19.8% 23 6.1%
18
Graphs show trends in market activity for the county comparing this year (dark lines) with last year (light lines) for the same period. Data is gathered from Multiple Listing Service (MLS) sources, reviewed for accuracy, and charted for easy comparison. Data shown is for single family homes only.
Data sourced from local MLS and deemed to be reliable, brokerage cannot verify data or guarantee accuracy. Data that appeared to be incorrect was not included in the calculations.
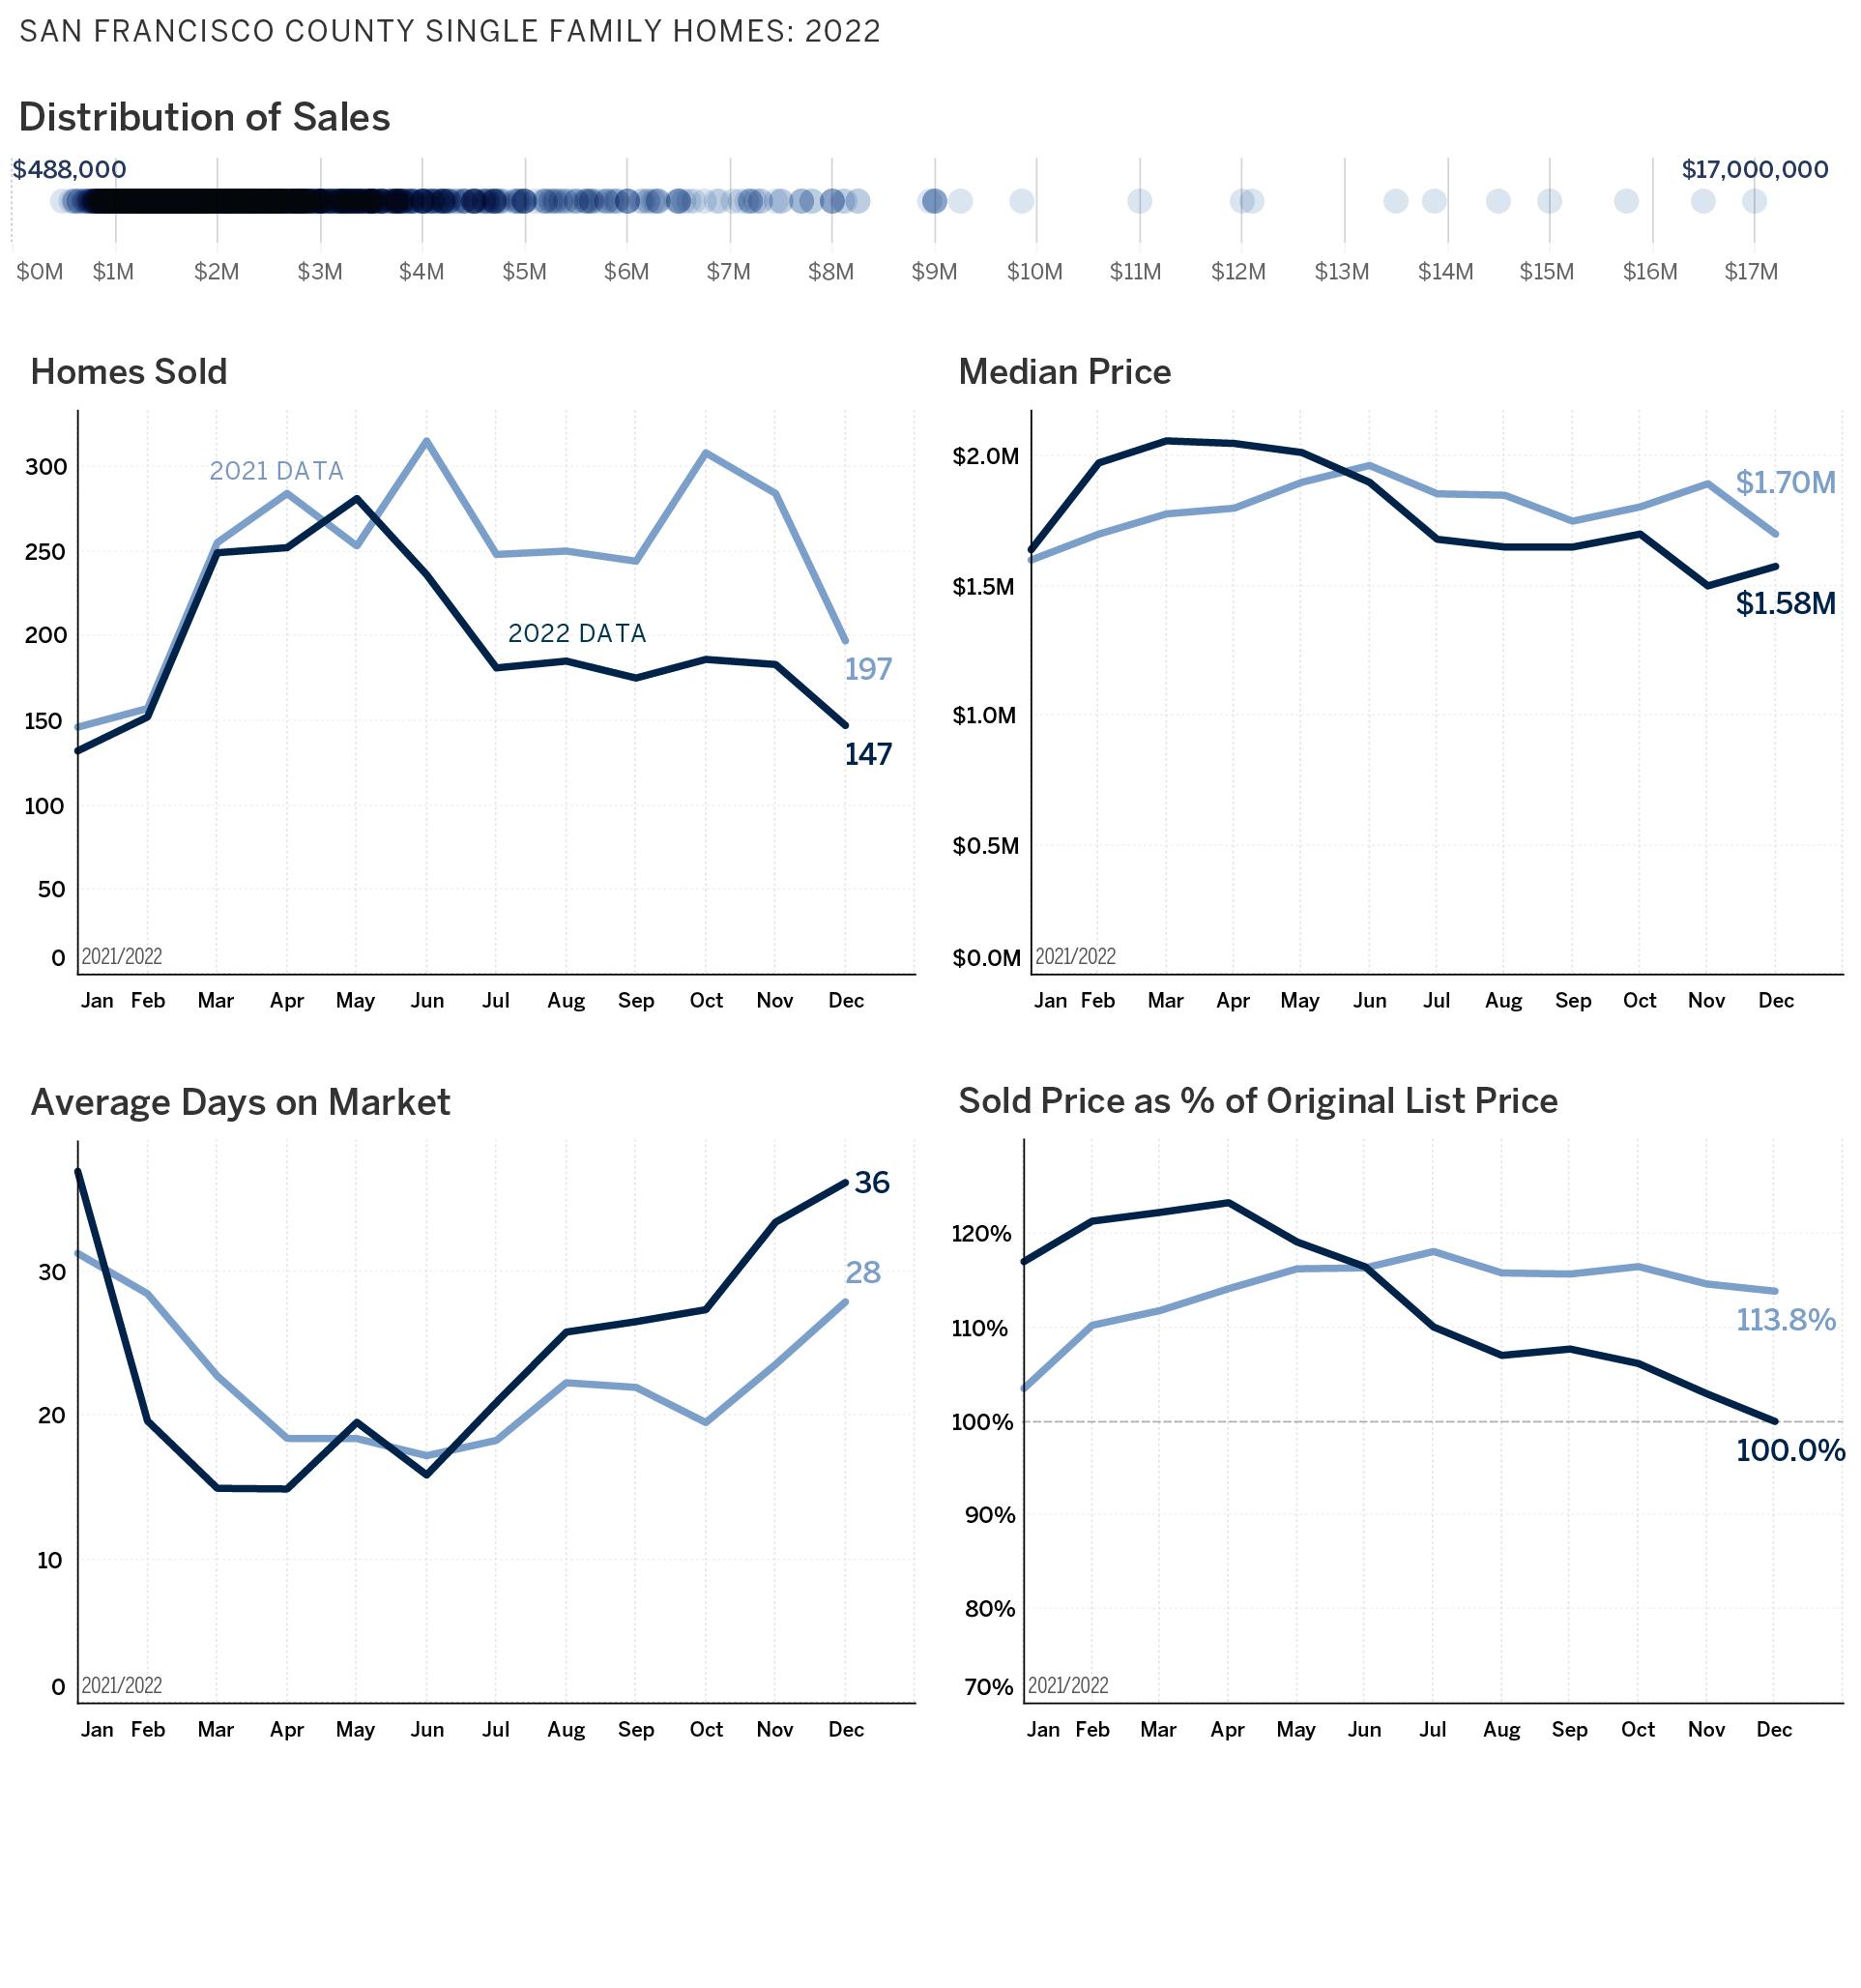
SAN FRANCISCO COUNTY · MONTHLY MARKET TRENDS · SINGLE FAMILY HOMES
19
SAN FRANCISCO CONDOS
2022 ANNUAL SALES BY DISTRICT · CONDO/CO-OP/TIC/LOFT
DISTRICT 1
Central Richmond, Inner Richmond, Outer Richmond, Jordan Park/Laurel Heights, Presidio, Lake Street, Sea Cliff, Lone Mountain
DISTRICT 2
Golden Gate Heights, Outer Parkside, Outer Sunset, Parkside, Central Sunset, Inner Sunset, Inner Parkside
DISTRICT 3
Lake Shore, Merced Heights, Pine Lake Park, Stonestown, Lakeside, Merced Manor, Ingleside, Ingleside Heights, Oceanview
DISTRICT 4
Balboa Terrace, Diamond Heights, Forest Hill, Forest Knolls, Ingleside Terrace, Midtown Terrace, Saint Francis Wood, Miraloma Park, Forest Hill Extension, Sherwood Forest, Mount Davidson Manor, Westwood Highlands, Westwood Park, Sunnyside, West Portal, Monterey Heights
DISTRICT 5
Glen Park, Haight Ashbury, Noe Valley, Twin Peaks, Cole Valley/ Parnassus Heights, Buena Vista/Ashbury Heights, Castro, Corona Heights, Clarendon Heights, Duboce Triangle, Eureka Valley/Dolores Heights, Mission Dolores
DISTRICT 6
Anza Vista, Hayes Valley, Lower Pacific Heights, Western Addition, Alamo Square, North Panhandle

DISTRICT 7
Marina, Pacific Heights, Presidio Heights, Cow Hollow
DISTRICT 8
Downtown, Financial District/ Barbary Coast, Nob Hill, North Beach, Russian Hill, Van Ness/ Civic Center, Telegraph Hill, North Waterfront, Tenderloin
DISTRICT 9
Bernal Heights, Inner Mission, Mission Bay, Potrero Hill, South of Market, Yerba Buena, South Beach, Central Waterfront/ Dogpatch
DISTRICT 10 Bayview, Crocker Amazon, Excelsior, Outer Mission, Visitacion Valley, Portola, Silver Terrace, Mission Terrace, Hunter’s Point, Bayview Heights, Candlestick, Little Hollywood
City Average Sale Price Median Sale Price High Sale Avg Price/SF # of Sales DOM 2022 ±% 2022 ±% 2022 2022 ±% 2022 ±% 2022 ±% District 1 $1,395,889 -3.7% $1,355,000 -3.2% $3,325,000 $1,017 6.8% 161 -24.8% 29 23.6% District 2 $1,248,017 4.2% $1,300,000 16.9% $2,208,000 $970 12.7% 35 -48.5% 34 -5.4% District 3 $886,021 -8.1% $770,000 -9.6% $1,500,000 $764 5.0% 37 -35.1% 36 -22.7% District 4 $881,539 -3.1% $804,000 2.4% $1,760,000 $887 2.2% 56 -8.2% 41 -15.3% District 5 $1,515,053 2.4% $1,475,000 1.7% $4,500,000 $1,019 10.2% 537 -20.8% 26 -7.5% District 6 $1,284,167 -2.8% $1,225,000 -4.2% $3,100,000 $986 1.1% 344 -28.6% 38 4.9% District 7 $1,960,564 -2.4% $1,600,000 -0.2% $19,000,000 $1,134 3.2% 310 -34.5% 34 -5.0% District 8 $1,383,600 3.3% $1,065,000 -0.9% $17,000,000 $1,019 3.5% 510 -32.3% 47 -9.9% District 9 $1,240,169 -3.5% $1,100,000 -0.7% $8,600,000 $1,003 -1.7% 984 -32.2% 52 4.9% District 10 $766,153 -0.9% $776,750 -0.4% $1,200,000 $662 -0.1% 94 -9.6% 70 46.8% San Francisco Co. $1,372,771 -1.4% $1,200,000 -1.6% $19,000,000 $1,005 2.3% 3068 -29.3% 42 -0.3%
20
Graphs show trends in market activity for the county comparing this year (dark lines) with last year (light lines) for the same period. Data is gathered from Multiple Listing Service (MLS) sources, reviewed for accuracy, and charted for easy comparison. Data shown is for single family homes only.
Data sourced from local MLS and deemed to be reliable, brokerage cannot verify data or guarantee accuracy. Data that appeared to be incorrect was not included in the calculations.

SAN FRANCISCO COUNTY · MONTHLY MARKET TRENDS · CONDO/CO-OP/TIC/LOFT
21
NOE VALLEY I SOLD APRIL 2022
LISTED BY APPLEGARTH+WARRIN

1 1 4 8 D O L O R E S I $ 6 , 2 5 0 , 0 0 0
22

23


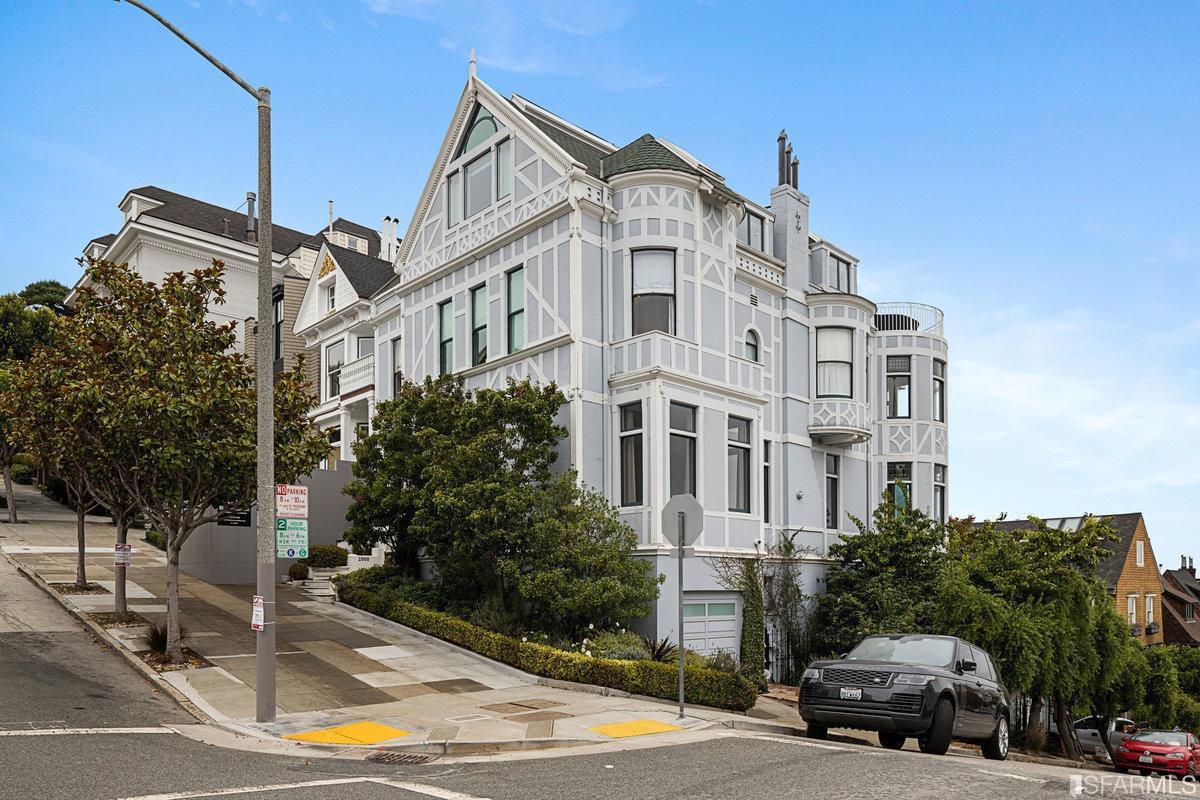
2790 BROADWAY Pacific Heights SoldOffMarket $ 31,00 0,000
$ 34,500,000 3450 21 st ST Dolores Heights SoldOffMarket
2855 PACIFIC Pacific Heights SoldOffMarket
$ 17,600,000
3355 PACIFIC Presidio Heights ListedbySFFineHomesInc.
$
29,50 0,000
3636 CLAY Presidio Heights ListedbyCompass 19,155,000
$
2950 PACIFIC Pacific Heights ListedbyCompass 7,00 0,000
$1
HIGHEST PRICED HOME SALES 2022
24
SINGLE FAMILY HOMES
HIGHEST PRICED HOME SALES 2022


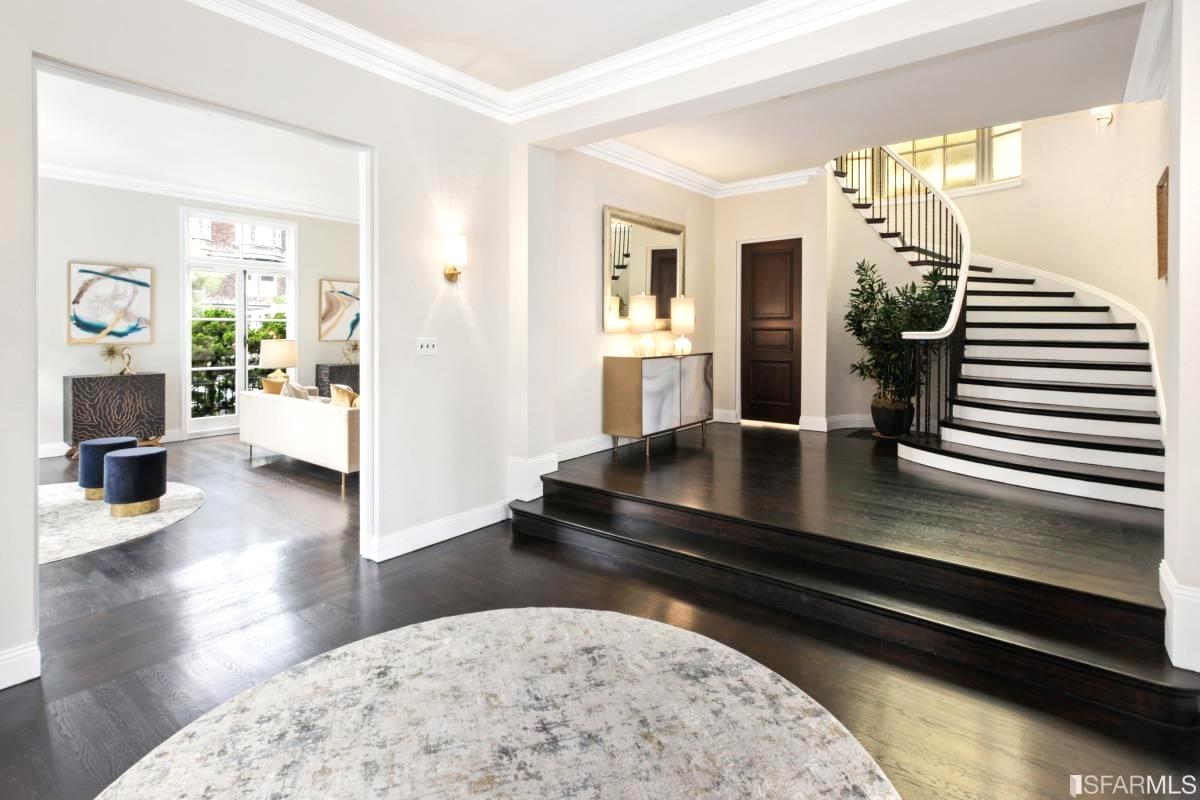


$ 1 6 ,500 ,000 3747
$ 1 5,75 0 ,000
$ 1 5,00 0 ,000
2518 JACKSON Pacific Heights ListedbyCompass
JACKSON Presidio Heights ListedbyCompass
50 ARGUELLO Presidio Heights ListedbyCompass
$15,500,000 2505
PACIFIC Pacific Heights ListedbySotheby’sInt.Realty
2556 FILBERT Cow Hollow ListedbySotheby’sInt.Realty
$ 14,500,000
2500 BROADWAY Pacific Heights ListedbyCompass
$ 13,875 ,000
SINGLE FAMILY HOMES 25
2022 SINGLE FAMILY HOME SALES OVER $3.5M
Address Sales Price Date DOM List Price BR/BA Sq Ft $/Sq Ft District 1 - Central Richmond 553 15th Ave $4,600,000 20-May 7 $3,995,000 3/4 4001 $1,150 218 15th Ave $4,000,000 1-Jun ** Off-market 3/2 2751 $1,454 734 27th Ave $3,850,000 26-Aug 48 $3,950,000 4/6 4375 $880 747 14th Ave $3,674,700 9-Dec 10 $3,499,000 4/4 3239 $1,135 663 22nd Ave $3,528,000 12-Apr 8 $3,349,000 4/6 3300 $1,069 District 1 - Inner Richmond 570 7th Ave $4,000,570 5-May 4 $3,498,000 5/4 2742 $1,459 682 12th Ave $3,750,000 26-Apr 1 $3,100,000 3/4 2392 $1,568 439 3rd Ave $3,500,000 15-Sep 0 $3,000,000 4/4 3035 $1,153 District 1 - Jordan Park/Laurel Heights 126 Commonwealth Ave $11,611,500 31-Jan 11 Off-market 5/5 7245 $1,603 71 Jordan Ave $8,950,000 11-Feb ** Off-market 5/5 5415 $1,653 11 Commonwealth Ave $7,300,000 31-May 0 $6,495,000 5/6 N/A N/A 118 Commonwealth Ave $7,200,000 27-Apr 19 $7,500,000 5/3 4560 $1,579 43 Jordan Ave $4,520,000 23-Nov 15 $4,500,000 4/6 3800 $1,189 120 Commonwealth Ave $4,500,000 1-Jul 13 $4,495,000 4/5 2813 $1,600 152 Collins St $3,800,000 20-May 8 $3,650,000 3/5 3327 $1,142 2 Heather Ave $3,520,000 30-Aug 9 $3,995,000 5/3 3280 $1,073 160 Collins St $3,500,000 25-May 8 $2,995,000 3/3 N/A N/A District 1 - Lake Street 139 24th Ave $8,250,000 28-Feb 152 $9,500,000 5/5 6210 $1,329 40 22nd Ave $8,000,000 30-Mar 28 $6,995,000 7/5 6962 $1,149 54 6th Ave $7,250,000 23-May ** Off-market 5/5 3915 $1,852 1751 Lake St $6,000,000 17-Feb 150 $7,385,000 6/6 6027 $996 63 7th Ave $6,000,000 18-Apr ** Off-market 5/5 4768 $1,258 64 6th Ave $5,600,000 6-Apr ** Off-market 5/4 N/A N/A 154 15th Ave $4,999,999 24-Oct 11 $5,250,000 5/6 4385 $1,140 126 6th Ave $4,995,000 13-Apr 1 $4,600,000 5/5 3245 $1,539 2141 Lake St $4,995,000 30-Mar 14 $4,500,000 4/5 2885 $1,731 126 6th Ave $4,995,000 13-Apr ** Off-market 5/4 3245 $1,539 1536 Lake St $4,730,000 15-Apr 3 $4,125,000 4/4 3408 $1,388 10 5th Ave $4,700,000 4-Nov 17 $4,999,000 6/6 6035 $779 102 3rd Ave $4,520,000 22-Feb 12 $4,250,000 4/5 2656 $1,702 425 Lake St $4,500,000 7-Dec 22 $4,600,000 4/4 3620 $1,243 111 6th Ave $4,410,000 5-Jan 9 $3,995,000 4/3 2565 $1,719 822 Lake St $4,260,000 1-Apr 8 $3,995,000 4/4 3325 $1,281 118 9th Ave $4,205,000 30-Aug 49 $4,895,000 4/4 2791 $1,507 26
2022 SINGLE FAMILY HOME SALES OVER $3.5M
Address Sales Price Date DOM List Price BR/BA Sq Ft $/Sq Ft 4736 California St $4,200,000 18-Nov 21 $3,995,000 6/4 3900 $1,077 76 6th Ave $4,150,000 29-Aug 8 $4,200,000 4/3 2364 $1,755 1926 Lake St $4,075,000 31-Jan 5 $3,495,000 5/4 3015 $1,352 109 7th Ave $4,000,000 19-Apr 11 $3,595,000 4/4 3220 $1,242 125 21st Ave $3,998,000 22-Dec 88 $4,995,000 5/7 3884 $1,029 2412 Lake St $3,500,000 14-Jun 17 $3,495,000 4/4 2535 $1,381 169 25th Ave $3,500,000 9-May 3 $2,350,000 3/3 2035 $1,720 District 1 - Lone Mountain 80 Rossi Ave $4,900,000 17-Feb 7 $3,995,000 5/4 3590 $1,365 District 1 - Outer Richmond 563-565 34th Ave $4,388,888 18-Feb 12 $3,995,000 8/9 5489 $800 3633 Clement St $3,553,000 18-May 10 $2,395,000 5/4 3528 $1,007 District 1 - Seacliff 625 El Camino Del Mar St $6,200,000 31-Oct 238 $8,795,000 7/7 6134 $1,011 222 El Camino Del Mar $5,900,000 29-Apr 13 $5,195,000 4/4 3510 $1,681 6 Scenic Way $4,950,000 14-Apr 18 $4,880,000 4/3 4160 $1,190 263 29th Ave $4,200,000 14-Nov 42 $4,500,000 4/4 3465 $1,212 291 31st Ave $3,602,000 4-Nov ** Off-market 3/3 2661 $1,354 District 2 - Inner Sunset 1371 6th Ave $3,915,000 26-May 6 $2,595,000 5/4 2620 $1,494 326 Judah St $3,792,500 12-Dec ** Off-market 4/2 4835 $784 1265 4th Ave $3,750,000 16-May 8 $3,195,000 4/3 2880 $1,302 District 4 - Balboa Terrace 1625 Monterey Blvd $7,100,000 15-Aug 132 $7,100,000 5/3 3843 $1,848 1615 Monterey Blvd $6,275,000 28-Sep 25 $6,500,000 5/5 3920 $1,601 240 Santa Ana Ave $3,525,000 4-May 13 $2,690,000 5/5 3066 $1,150 District 4 - Diamond Heights 9 Jade Pl $4,325,000 16-Feb 7 $3,495,000 5/4 3603 $1,200 328 Gold Mine Dr $3,740,000 7-Feb 13 $2,995,000 4/4 3030 $1,234 217 Gold Mine Dr $3,550,000 15-Feb 4 $2,549,000 4/3 3123 $1,137 District 4 - Forest Hill 127 Castenada Ave $5,300,000 24-Feb 3 $5,260,000 5/7 5736 $924 196 Castenada Ave $5,200,000 12-May 7 $3,695,000 4/4 3829 $1,358 358 Pacheco St $4,925,000 29-Jul 12 $5,200,000 4/5 4022 $1,225 20 Santa Rita Ave $4,500,000 4-Apr ** Off-market 4/4 4400 $1,023 201 Pacheco St $3,900,000 12-Oct 90 $4,200,000 3/3 3075 $1,268 15 Castenada Ave $3,885,000 27-Dec 177 $4,490,000 6/9 5705 $681 27
2022 SINGLE FAMILY HOME SALES OVER $3.5M
Address Sales Price Date DOM List Price BR/BA Sq Ft $/Sq Ft 360 Castenada Ave $3,815,000 28-Nov 6 $3,295,000 4/5 3668 $1,040 266 Pacheco St $3,810,000 3-Feb 13 $3,295,000 6/4 3176 $1,200 230 Magellan Ave $3,700,000 18-Mar 7 $2,595,000 4/3 436 Pacheco St $3,600,000 30-Mar 0 $3,500,000 4/4 3281 $1,097 125 Montalvo Ave $3,500,000 22-Nov 57 $3,895,000 5/5 4883 $717 District 4 - Ingleside Terrace 24 Cerritos Ave $3,500,000 6-Jun 6 $2,895,000 6/4 2995 $1,169 District 4 - Miraloma Park 300 Molimo Dr $3,800,000 6-Jun 4 $2,795,000 4/6 3338 $1,138 District 4 - Monterey Heights 168 Yerba Buena Ave $6,300,000 28-Jul 7 $5,995,000 5/7 6587 $956 1355 Monterey Blvd $3,750,000 26-Dec 24 $3,498,000 4/5 3301 $1,136 154 Maywood Dr $3,600,000 6-Apr 28 $3,295,000 5/3 3830 $940 District 4 - Mount Davidson Manor 637 Darien Way $3,800,000 3-May 10 $3,398,000 5/4 3691 $1,030 1355 Monterey Blvd $3,750,000 28-Dec 24 $3,498,000 4/5 3338 $1,123 District 4 - St. Francis Wood 1625 Monterey Blvd $7,100,000 15-Aug 0 $7,100,000 5/3 3843 $1,848 168 Yerba Buena Ave $6,300,000 28-Jul 7 $5,995,000 5/7 6587 $956 1615 Monterey Blvd $6,275,000 28-Sep 25 $6,500,000 5/5 3920 $1,601 175 San Fernando Way $5,700,000 12-Dec 36 $5,995,000 5/5 4200 $1,357 1600 Monterey Blvd $4,988,000 4-Nov 22 $4,850,000 4/4 3810 $1,309 165 San Anselmo Ave $4,700,000 14-Jan ** Off-Market 5/3 4460 $1,054 34 Yerba Buena Ave $4,200,000 3-Mar 8 $2,795,000 3/4 2791 $1,505 2 Santa Ana Ave $4,025,000 13-Jun 8 $2,795,000 3/3 2524 $1,595 140 San Leandro Way $3,700,000 21-Nov 34 $4,200,000 5/5 3600 $1,028 139 San Pablo Ave $3,600,000 1-Mar 12 $3,290,000 3/3 2672 $1,347 80 Yerba Buena Ave $3,525,080 24-Mar 6 $2,795,000 4/2 2728 $1,292 40 San Andreas Way $3,525,000 6-Sep 18 $3,695,000 4/4 3423 $1,030 121 San Benito Way $3,510,000 9-Sep 11 $2,950,000 4/3 2475 $1,418 District 4 - West Portal 350 Claremont Blvd $3,700,000 7-Jun 11 $2,895,000 4/5 2646 $1,398 District 4 - Westwood Highlands 990 Monterey Blvd $4,150,000 10-May 14 $3,995,000 4/4 4655 $892 485 Colon Ave $3,600,000 31-Jan 11 $2,495,000 4/4 2902 $1,241 District 5 - Buena Vista/Ashbury Heights 201 E Buena Vista Ave $8,000,000 10-Feb 9 $6,995,000 7/6 5715 $1,400 591 Buena Vista Ave $8,000,000 10-Feb 0 $6,995,000 4/5 3985 $2,008 28
2022 SINGLE FAMILY HOME SALES OVER $3.5M
Address Sales Price Date DOM List Price BR/BA Sq Ft $/Sq Ft 109 Alpine Ter $7,250,000 3-Jan ** Off-market 4/5 3400 $2,132 24 Buena Vista Ter $6,750,000 15-Mar 0 $6,750,000 4/4 3773 $1,789 771 Buena Vista Ave $4,250,000 20-Dec 99 $4,495,000 4/4 3385 $1,256 4 Ashbury Ter $4,220,000 6-Oct 22 $4,375,000 3/3 3610 $1,169 389 Upper Terrace $4,100,000 13-Jul 12 $4,200,000 4/5 2770 $1,480 235 Divisadero St $3,885,000 22-Apr 11 $3,095,000 4/3 2660 $1,461 20 Loma Vista Ter $3,785,000 29-Jul 15 $3,688,000 4/3 2657 $1,425 491 Buena Vista Ave $3,730,000 4-Aug 12 $3,595,000 3/3 2640 $1,413 156 Delmar St $3,500,000 7-Mar 2 $3,550,000 3/3 2820 $1,241 District 5 - Clarendon Heights 48 Clarendon Ave $4,500,000 17-Feb 133 $4,998,000 4/5 3882 $1,159 53 Clarendon Ave $4,425,000 15-Apr 12 $4,495,000 4/4 3500 $1,264 149 Graystone Ter $4,150,000 9-Jun 29 $3,698,000 4/4 4400 $943 29 Villa Ter $4,005,000 2-Aug 21 $4,250,000 4/4 3815 $1,050 175 St Germain Ave $3,750,000 10-Nov 14 $3,750,000 3/3 3258 $1,151 20 Villa Ter $3,500,000 6-Jun 7 $3,400,000 4/4 2982 $1,174 District 5 - Cole Valley/Parnassus Heights 32 Alma St $5,600,000 29-Apr 7 $4,595,000 4/4 3352 $1,671 125 Belgrave Ave $5,505,000 9-May 14 $4,950,000 4/3 2888 $1,906 50 Alma St $4,400,000 23-Nov 49 $4,995,000 4/4 3690 $1,192 508 Belvedere St $4,320,000 14-Mar 12 $4,195,000 5/3 2650 $1,630 126 Grattan St $4,050,000 10-May 12 $2,999,000 4/2 2172 $1,865 183 Edgewood Ave $3,850,000 31-Aug 15 $3,200,000 4/3 2550 $1,510 163 Carl St $3,800,000 6-Sep 11 $3,495,000 4/3 3140 $1,210 25 Parnassus Ave $3,600,000 23-Mar 4 $2,795,000 3/3 2157 $1,669 District 5 - Corona Heights 30 Ord St $3,500,000 20-Apr 25 $2,995,000 3/3 2456 $1,425 District 5 - Eureka Valley/Dolores Heights 3450 21st St $31,000,000 1-Jul ** Off-market 4/4 5542 $5,594 359 Cumberland St $8,100,000 1-Mar ** Off-market 5/4 3968 $2,041 428 Collingwood St $7,700,000 27-May 5 $7,450,000 5/5 4300 $1,791 4540 19th St $7,450,000 22-Mar 4 $7,300,000 5/5 4468 $1,667 3500 21st St $6,800,000 9-Aug 7 $1,749,000 3/3 2636 $2,580 3756 22nd St $6,000,000 24-Feb 18 $6,000,000 5/6 3498 $1,715 3925 20th St $6,480,000 5-Oct 0 $5,995,000 5/6 3840 $1,688 43-45 Liberty St $6,000,000 20-Apr 0 $4,999,000 4/3 3304 $1,816 3494 21st St $5,650,000 7-Jun 4 $5,500,000 5/4 3168 $1,783 418 Liberty St $5,400,000 3-May 12 $4,995,000 5/4 2980 $1,812 29
2022 SINGLE FAMILY HOME SALES OVER $3.5M
Address Sales Price Date DOM List Price BR/BA Sq Ft $/Sq Ft 365 Douglass St $5,100,000 18-Oct 26 $5,300,000 4/4 N/A N/A 4127 20th St $4,750,000 17-May 11 $4,200,000 4/3 N/A N/A 3944 21st St $4,700,000 5-Jul 7 $4,495,000 4/5 3270 $1,437 28 Hill St $4,638,000 6-May 0 $4,695,000 5/5 3582 $1,295 366 Hill St $4,400,000 8-Apr 28 $4,299,000 4/3 3332 $1,321 4444 20th St $3,900,000 23-Jun 19 $3,895,500 4/2 2952 $1,321 196 Liberty St $3,850,000 1-Jun ** Off-market 2/2 2150 $1,791 3859 21st St $3,800,000 28-Nov ** Off-market 4/4 2790 $1,362 737 Castro St $3,780,000 1-Apr 2 $2,998,000 3/3 2796 $1,352 4349 20th St $3,740,000 30-Aug 0 $3,799,000 4/4 2885 $1,296 3962 20th St $3,700,000 24-Mar 45 $3,225,000 4/4 3200 $1,156 733 Sanchez St $3,625,000 5-Oct 6 $3,495,000 3/3 2066 $1,755 45 Hartford St $3,600,000 9-May 19 $3,595,000 5/4 3235 $1,113 561 Sanchez St $3,500,000 7-Nov 22 $3,500,000 3/3 N/A N/A District 5 - Glen Park 483 30th St $5,350,000 27-Apr 7 $4,395,000 4/4 3155 $1,696 46 Digby St $4,700,000 31-Oct 23 $4,995,000 6/5 4269 $1,101 2629 Diamond St $4,200,000 13-Jun 5 $3,695,000 4/3 3290 $1,277 259 Randall St $4,185,000 13-May ** Off-market 4/3 2515 $1,664 278 Randall St $4,000,000 11-Oct 14 $4,485,000 4/5 3380 $1,183 473 Chenery St $3,800,000 1-Aug 12 $3,599,000 5/4 3180 $1,195 221 Chenery St $3,510,000 14-Mar 25 $2,995,000 3/3 N/A N/A District 5 - Haight Ashbury 210 Frederick St $4,500,000 7-Jan 2 $4,750,000 5/6 3600 $1,250 727 Ashbury St $4,350,000 14-Oct 7 $3,999,999 5/6 3991 $1,090 235 Divisadero St $3,885,000 22-Apr 11 $3,095,000 4/3 2660 $1,461 151 Broderick St $3,725,000 10-Nov 10 $3,200,000 4/5 3100 $1,202 1461 Page St $3,500,000 6-Jun 15 $3,500,000 7/3 6545 $535 114 Lyon St $3,500,000 14-Apr 45 $3,748,000 5/5 3992 $877 District 5 - Mission Dolores 41 Cumberland St $6,337,500 29-Apr 8 $5,000,000 5/4 3863 $1,641 District 5 - Noe Valley 533 Elizabeth St $9,500,000 14-Mar 11 $1,129,000 4/4 4812 $1,974 1225 Dolores St $8,250,000 15-Apr ** Off-market 4/7 4500 $1,833 939 Sanchez St $8,000,000 3-Jun ** Off-market 5/7 4715 $1,697 625 Duncan St $7,800,000 20-May 171 $7,995,000 5/6 5933 $1,315 363 Jersey St $6,866,278 14-Feb 0 $6,900,000 4/6 3820 $1,797 4184 25th St $6,500,000 14-Apr 11 $5,898,000 5/6 4587 $1,417 30
2022 SINGLE FAMILY HOME SALES OVER $3.5M
Address Sales Price Date DOM List Price BR/BA Sq Ft $/Sq Ft 1148 Dolores St $6,250,000 1-Apr 9 $4,995,000 5/5 3610 $1,731 2430 Castro St $6,150,000 28-Jun 19 $5,898,000 5/6 4390 $1,401 587 29th St $6,005,000 1-Mar 6 $4,995,000 4/4 3505 $1,713 4251 23rd St $6,000,000 7-Apr ** Off-market 5/4 3326 $1,804 3756 22nd St $6,000,000 24-Feb ** Off-market 5/6 3498 $1,715 3838 25th St $5,800,000 21-Apr 7 $3,750,000 4/5 2975 $1,950 523 Alvarado St $5,750,000 15-Aug 5 $5,989,000 4/4 N/A N/A 111 Hoffman Ave $5,500,000 5-May 3 $4,995,000 4/5 3043 $1,807 818 Douglass St $5,500,000 1-Aug ** Off-market 4/4 3434 $1,602 799 Duncan St $5,400,000 14-Jul 41 $5,995,000 5/4 4250 $1,271 483 30th St $5,350,000 27-Apr 7 $4,395,000 4/4 3155 $1,696 4348 23rd St $5,200,000 8-Aug 20 $4,800,000 4/4 3408 $1,526 584 Duncan St $4,900,000 31-May 9 $4,700,000 4/3 3688 $1,329 400 Fair Oaks St $4,712,500 24-Oct 0 $4,789,000 4/3 N/A N/A 55 Fountain St $4,700,000 31-May 3 $3,995,000 4/3 N/A N/A 661 27th St $4,425,000 24-Jan 0 $4,295,000 3/4 2825 $1,566 3969-3971 23rd St $4,400,000 2-Feb ** Off-market 4/4 3060 $1,438 208 Fair Oaks St $4,266,500 26-Jan 175 $4,600,000 8/0 4463 $956 422 Valley St $4,200,000 9-Nov 8 $3,950,000 4/4 3327 $1,262 1082 Noe St $4,100,000 27-May 9 $3,750,000 4/2 3759 $1,091 170 Valley St $4,100,000 26-Aug 6 $3,995,000 4/4 2480 $1,653 286 Fair Oaks St $4,050,000 23-Sep 6 $3,995,000 4/4 3025 $1,339 4163 26th St $4,000,000 8-Mar 5 $3,295,000 4/4 2572 $1,555 254 Valley St $4,000,000 8-Aug 12 $3,395,000 4/3 2870 $1,394 235 Duncan St $4,000,000 17-Mar ** Off-market 4/4 2244 $1,783 511 29th St $3,950,000 2-May 14 $3,495,000 4/3 3265 $1,210 144 Clipper St $3,910,000 2-Jun 6 $3,100,000 4/3 2555 $1,530 1567 Sanchez St $3,751,000 30-Mar 6 $2,895,000 3/3 2214 $1,694 477 Day St $3,750,000 4-Apr 13 $3,250,000 3/3 2202 $1,703 564 Valley St $3,750,000 16-Aug 42 $3,695,000 4/4 3064 $1,224 847 Elizabeth St $3,750,000 25-Oct ** Off-market 4/4 2920 $1,284 3945 23rd St $3,650,000 9-Sep 0 $3,495,000 3/3 2000 $1,825 212 Chattanooga St $3,600,000 5-May 7 $3,195,000 3/4 2132 $1,689 1655 Dolores St $3,555,000 21-Mar 4 $3,295,000 5/4 3430 $1,036 360 Fair Oaks St $3,500,000 8-Aug 6 $2,995,000 3/2 2367 $1,479 District 6 - Alamo Square 722 Steiner St $6,000,000 1-Apr 14 $5,750,000 6/6 4831 $1,242 809 Scott St $5,300,000 11-Mar 10 $5,300,000 4/4 4274 $1,240 31
2022 SINGLE FAMILY HOME SALES OVER $3.5M
Address Sales Price Date DOM List Price BR/BA Sq Ft $/Sq Ft 850 Steiner St $4,600,000 9-May 178 $5,125,000 4/6 4125 $1,115 District 6 - Anza Vista 1880 Turk Blvd $4,499,000 12-Aug 121 $4,650,000 8/9 7500 $600 District 6 - Hayes Valley 399 Webster St $5,000,000 9-Sep ** Off-market 5/4 9000 $556 738 Hayes St $4,800,000 10-Jun 4 $3,995,000 5/5 4460 $1,076 District 6 - Lower Pacific Heights 2150 Bush St $5,250,000 12-Sep 4 $5,185,000 4/5 3055 $1,718 2868 Bush St $5,250,000 24-May 34 $5,999,000 5/5 4261 $1,232 2105 Pine St $4,750,000 10-May 35 $4,550,000 5/4 3495 $1,359 2909 Bush St #2029a $4,700,000 24-May 20 $4,850,000 4/4 4409 $1,066 1988 Bush St $4,600,000 11-Mar 11 $4,295,000 4/4 3215 $1,431 1815 Laguna St $4,550,000 28-Jan 4 $4,500,000 4/4 3412 $1,334 1923 Pierce St $3,600,000 23-Mar 8 $2,995,000 4/4 2190 $1,644 District 6 - North Panhandle 2170 Hayes St $4,520,000 31-Jan 20 $3,898,000 6/3 3010 $1,502 848 Lyon St $4,100,000 3-Jan 0 $4,100,000 3/4 3210 $1,277 District 6 - Western Addition 7 Seymour St $4,250,000 6-Apr 10 $3,650,000 5/6 3281 $1,295 District 7 - Cow Hollow 2556 Filbert St $14,500,000 22-Jul 27 $15,000,000 3/4 N/A N/A 2615 Union St $12,095,000 3-Oct ** Off-market 6/6 6982 $1,732 2775 Green St $9,000,000 6-Dec ** Off-market 5/4 4892 $1,840 2660 Filbert St $8,400,000 2-Dec 81 $9,500,000 6/5 4924 $1,706 2651 Baker St $7,800,000 1-Jul 0 $6,900,000 4/5 3655 $2,134 2724 Lyon St $7,500,000 18-Mar 7 $6,900,000 4/4 N/A N/A 2611 Filbert St $6,550,000 19-Oct 8 $5,595,000 4/4 3550 $1,845 2580 Greenwich St $5,575,000 2-May 177 $5,995,000 5/4 3487 $1,599 2865 Green St $4,995,000 20-Sep 46 $4,995,000 3/3 2890 $1,728 2729 Filbert St $4,987,500 13-Jul 19 $5,450,000 4/5 3210 $1,554 2130 Filbert St $4,775,000 14-Feb 4 $3,995,000 4/5 2564 $1,862 2727 Gough St $4,500,000 2-May ** Off-market 4/3 3074 $1,464 2930 Laguna St $3,876,000 22-Apr 13 $3,295,000 4/2 2680 $1,446 77 Pixley St $3,500,000 23-Aug 0 $3,450,000 3/3 2200 $1,591 District 7 - Marina 2266 Bay St $7,700,000 8-Jun 8 $7,500,000 5/6 4869 $1,581 112 Mallorca Way $7,200,000 11-Feb ** Off-market 5/5 4810 $1,497 336 Avila St $6,500,000 10-Jun ** Off-market 5/5 N/A N/A 32
2022 SINGLE FAMILY HOME SALES OVER $3.5M
Address Sales Price Date DOM List Price BR/BA Sq Ft $/Sq Ft 3733 Broderick St $6,200,000 22-Feb 10 $5,600,000 4/4 4255 $1,457 827 Marina Blvd $5,450,000 18-Apr 19 $5,595,000 4/5 3615 $1,508 301 Marina Blvd $5,175,000 25-Apr 14 $4,750,000 4/5 3664 $1,412 3666 Baker St $4,666,000 1-Nov 15 $3,500,000 4/5 3889 $1,200 3750 Divisadero St $4,637,500 22-Feb 5 $4,195,000 3/4 3490 $1,329 3627 Broderick St $4,631,250 6-Oct 21 $4,750,000 4/4 3688 $1,256 138 Avila St $4,600,000 16-Mar 2 $3,995,000 3/3 2549 $1,805 3239 Webster St $4,200,000 26-Jan 162 $4,595,000 3/4 2720 $1,544 318 Avila St $4,000,000 20-Apr 13 $3,750,000 4/3 2379 $1,681 3235 Webster St $3,855,000 8-Mar 15 $3,595,000 3/2 2460 $1,567 3253 Baker St $3,600,000 18-Jan 13 $3,500,000 4/3 2405 $1,497 1747 Chestnut St $3,520,000 23-Dec 15 $2,999,000 5/4 3607 $976 3642 Webster St $3,500,000 9-Mar 6 $2,499,000 3/4 2245 $1,559 27 Avila St $3,500,000 22-Feb ** Off-market 3/3 2555 $1,370 District 7 - Pacific Heights 2790 Broadway St $34,500,000 11-Jul ** Off-market /8 12150 $2,840 2855 Pacific Ave $17,600,000 23-May 26 $17,850,000 6/9 8960 $1,964 2950 Pacific Ave $17,000,000 13-Oct 24 $20,000,000 8/13 20000 $850 2518 Jackson St $16,500,000 28-Mar 28 $17,500,000 7/6 9175 $1,798 2505 Pacific Ave $15,000,000 18-May 75 $15,500,000 6/6 6514 $2,303 2500 Broadway St $13,875,000 11-Mar 169 $17,000,000 6/7 7045 $1,969 2828 Vallejo St $13,500,000 18-Nov 595 $16,750,000 8/9 10345 $1,305 2908 Pacific Ave $11,000,000 20-May 17 $11,495,000 5/6 5915 $1,860 2760 Vallejo St $10,500,000 19-May ** Off-market 4/4 5180 $2,027 2775 Green St $9,000,000 6-Dec ** Off-market 5/4 4892 $1,840 2725 Broadway St $9,000,000 7-Mar 38 $9,500,000 4/5 5213 $1,726 2628 Broderick St $9,000,000 2-Jun 6 $8,995,000 4/4 4819 $1,868 2980 Vallejo St $9,000,000 2-Dec 81 $9,950,000 4/5 5140 $1,751 2773 Clay St $7,500,000 10-Jun 11 $7,200,000 4/4 3525 $2,128 2110 Scott St $7,300,000 8-Aug 14 $7,500,000 5/6 6875 $1,062 2127 Broderick St $7,200,000 29-Jun ** Off-market 4/5 4667 $1,543 2830 Buchanan St $7,030,000 12-Jul 21 $6,400,000 5/5 4058 $1,732 2302 Steiner St $6,900,000 10-Jun 47 $7,850,000 5/6 5250 $1,314 1641 Green St $6,650,000 18-Mar 38 $6,925,000 3/4 2705 $2,458 3026 Clay St $6,500,000 3-Oct 40 $6,995,000 5/4 N/A N/A 2206 Steiner St $6,300,000 4-Mar 0 $5,950,000 3/4 2775 $2,270 2040 Gough St $6,128,000 18-Oct 25 $5,995,000 8/4 6623 $925 2199 Divisadero St $5,900,000 4-Mar ** Off-market 5/4 3690 $1,599 33
2022 SINGLE FAMILY HOME SALES OVER $3.5M
Address Sales Price Date DOM List Price BR/BA Sq Ft $/Sq Ft 3176 Washington St $5,875,000 16-Mar 4 $5,750,000 4/6 3335 $1,762 2543 Vallejo St $5,850,000 10-Jun 7 $5,495,000 4/4 3155 $1,854 2104 Divisadero St $5,650,000 21-Jan 8 $4,350,000 4/4 2967 $1,904 2940 Jackson St $5,650,000 8-Apr 4 $5,295,000 4/4 N/A N/A 2422 Clay St $5,600,000 18-May 32 $4,900,000 3/4 3051 $1,835 2104 Divisadero St $5,350,000 21-Jan 8 $4,350,000 4/4 2967 $1,803 2053 Vallejo St $5,200,000 7-Mar 9 $5,450,000 5/5 4769 $1,090 2865 Green St $4,995,000 20-Sep 46 $4,995,000 3/3 2890 $1,728 2675 Pacific Ave $4,700,000 17-Nov 9 $4,500,000 4/4 2700 $1,741 2725 Broadway St $4,590,000 12-Jul 38 $9,500,000 4/5 5213 $880 1931 Lyon St $4,100,000 25-Apr 8 $2,995,000 2/3 2200 $1,864 2405 Green St $4,026,000 6-Jul 12 $3,799,000 4/4 2839 $1,418 2638-2640 Webster St $4,000,000 8-Mar 0 $3,795,000 3/3 2860 $1,399 2203 Scott St $3,750,000 18-Apr 10 $3,495,000 4/3 2500 $1,500 2112 Baker St $3,750,000 18-Aug 6 $3,295,000 3/4 2247 $1,669 2665 Laguna St $3,700,000 4-Apr 118 $3,995,000 8/9 4200 $881 1809 Lyon St $3,600,000 15-Sep 80 $4,250,000 3/4 3150 $1,143 District 7 - Presidio Heights 3355 Pacific Ave $29,500,000 7-Nov ** Off-market 6/8 9081 $3,249 3636 Clay St $19,155,000 14-Oct 23 $19,800,000 7/8 7710 $2,484 3747 Jackson St $15,750,000 20-Apr 18 $15,500,000 6/8 6985 $2,255 50 Arguello Blvd $15,500,000 31-Mar ** Off-market 7/8 4060 $3,818 3800 Washington St $12,650,000 14-Mar ** Off-market 9/9 17895 $707 250 Locust St $11,300,000 15-Dec ** Off-market /5 6958 $1,624 3580 Washington St $9,900,000 20-May ** Off-market 6/4 3848 $2,573 3445 Washington St $9,750,000 31-Aug ** Off-market 5/5 5887 $1,656 3388 Clay St $9,400,000 9-May ** Off-market 5/5 5351 $1,757 315 Laurel St $9,250,000 26-May 8 $9,250,000 6/6 5519 $1,667 101 Walnut St $9,200,000 12-Apr ** Off-market 6/6 4417 $1,839 3525 Washington St $8,125,000 22-Jun ** Off-market 4/6 4778 $1,701 3511 Jackson St $7,165,000 31-Mar 30 $7,350,000 4/5 N/A N/A 3621 Clay St $6,650,000 21-Jun ** Off-market 7/4 5642 $1,179 3235 Pacific Ave $6,300,000 20-May 12 $5,999,999 2/4 2866 $2,198 139 Cherry St $4,995,000 20-Apr 10 $4,995,000 3/3 2470 $2,022 3810 Washington St $4,950,000 16-Sep 32 $5,377,000 4/3 N/A N/A 3881 Washington St $4,228,000 30-Nov 61 $4,828,000 5/5 4105 N/A 333 Laurel St $3,818,000 6-Sep 12 $3,100,000 4/4 2751 N/A 34
2022 SINGLE FAMILY HOME SALES OVER $3.5M
Address Sales Price Date DOM List Price BR/BA Sq Ft $/Sq Ft District 8 - Nob Hill 1230 Sacramento St $7,700,000 14-Jan ** Off-market 4/3 4822 $1,597 1155 Washington St $5,279,000 21-Apr 6 $5,079,000 4/3 2863 $1,844 District 8 - Russian Hill 2705 Larkin St $12,000,000 1-Jun 7 $11,500,000 4/7 5930 $2,024 2707 Larkin St $9,850,000 18-Apr 42 $10,500,000 4/8 5371 $1,834 1066 Francisco St $6,600,000 17-Jun 7 $6,995,000 5/4 3961 $1,666 2531 Larkin St $5,800,000 1-Mar 13 $5,888,000 4/5 3750 $1,547 2424 Jones St $5,800,000 12-Sep 62 $7,000,000 5/4 4988 $1,163 1629 Taylor St $4,693,000 31-May 69 $5,295,000 5/4 N/A N/A 2500 Leavenworth St $4,100,000 5-May 22 $3,995,000 4/4 2920 $1,404 2912 Van Ness Ave $3,690,001 15-Apr 8 $3,650,000 4/4 3655 $1,010 14 White St $3,637,500 10-Jan 19 $3,750,000 3/3 2420 $1,503 District 8 - Telegraph Hill 467 Filbert St $3,775,000 14-Oct 28 $3,950,000 3/3 2905 $1,299 26 Hodges Aly $3,600,000 14-Apr ** Off-market 3/3 2000 $1,800 District 9 - Bernal Heights 15 Prospect Ave $5,350,000 14-Apr ** Off-market 4/6 4708 $1,136 936 Esmeralda Ave $4,180,000 17-Mar 11 $3,395,000 4/4 2617 $1,597 1719 Alabama St $4,000,000 25-Apr 9 $3,295,000 5/5 2546 $1,571 160 Bonview St $3,600,000 2-Jun 6 $3,050,000 4/4 N/A N/A District 9 - Inner Mission 1990 Folsom St $5,522,000 9-Nov ** Off-market N/A N/A N/A 824 Florida St $4,159,000 21-Jan 7 $3,800,000 4/3 2875 $1,447 25 Capp St $4,000,000 8-Dec 33 $4,550,000 3/3 N/A N/A 3336 23rd St $3,900,000 21-Apr 11 $3,295,000 3/4 2668 $1,462 963 Alabama St $3,750,000 16-Dec 4 $3,795,000 5/5 3205 $1,170 1040 Treat Ave $3,560,000 22-Apr 15 $3,350,000 3/4 2593 $1,373 917 Florida St $3,510,000 9-Mar 4 $3,195,000 4/5 2490 $1,410 District 9 - Potrero Hill 794 Rhode Island St $5,625,000 16-Feb 7 $4,795,000 5/6 3757 $1,497 901 Wisconsin St $4,925,000 25-Mar 7 $3,795,000 4/5 3330 $1,479 882 Carolina St $4,500,000 27-Jul 40 $4,590,000 4/6 3327 $1,353 712 De Haro St $4,260,000 29-Nov 3 $3,850,000 4/4 2900 $1,469 535 Missouri St $3,765,000 17-Oct 86 $3,500,000 4/4 2757 $1,366 706-708 Wisconsin St $3,710,000 12-May 21 $3,495,000 4/6 3746 $990 35
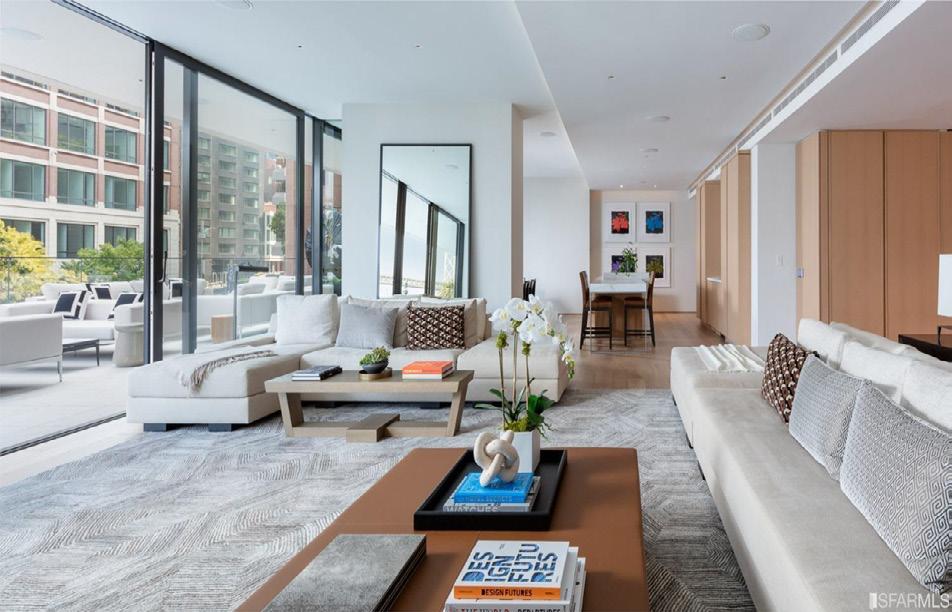
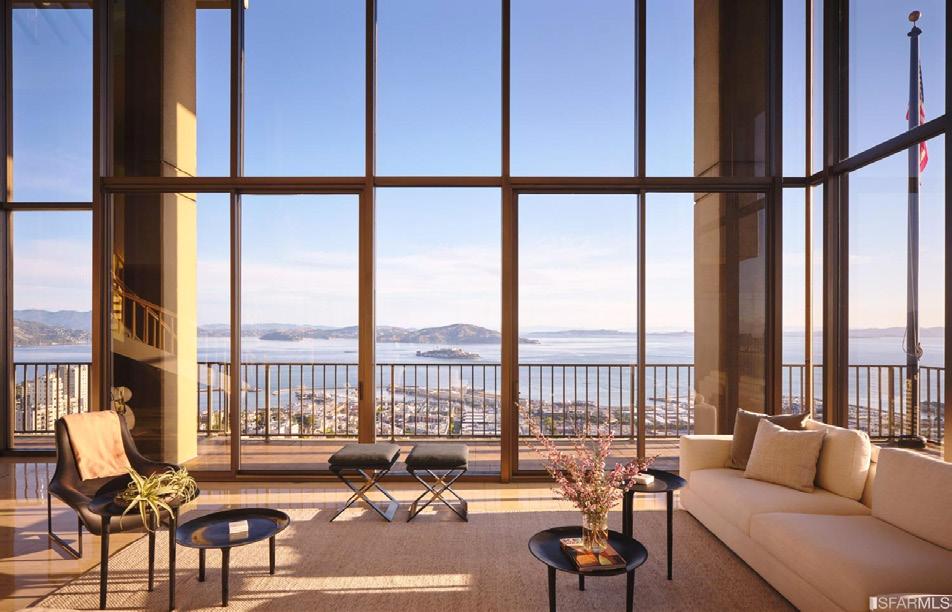
HIGHEST PRICED HOME SALES 2022 CONDOS




999
Russian Hill ListedbyCompass $1 7,000 ,000 2006 WASHINGTON
Pacific Heights ListedbySotheby’sInt.Realty $1 9,000 ,000 999 GREEN
Russian Hill ListedbyCompass $ 12,000 ,000 1 STEUART
South Beach SoldOffMarket $ 10,500 ,000
Hill ListedbySotheby’sInt.Realty $9, 5 00,000 1090 CHESTNUT
Russian Hill ListedbySotheby’sInt.Realty $9, 809,524
GREEN #3201
#2
#3202
#2001
1750 TAYLOR #1201 Russian
#3
36
HIGHEST PRICED HOME SALES 2022


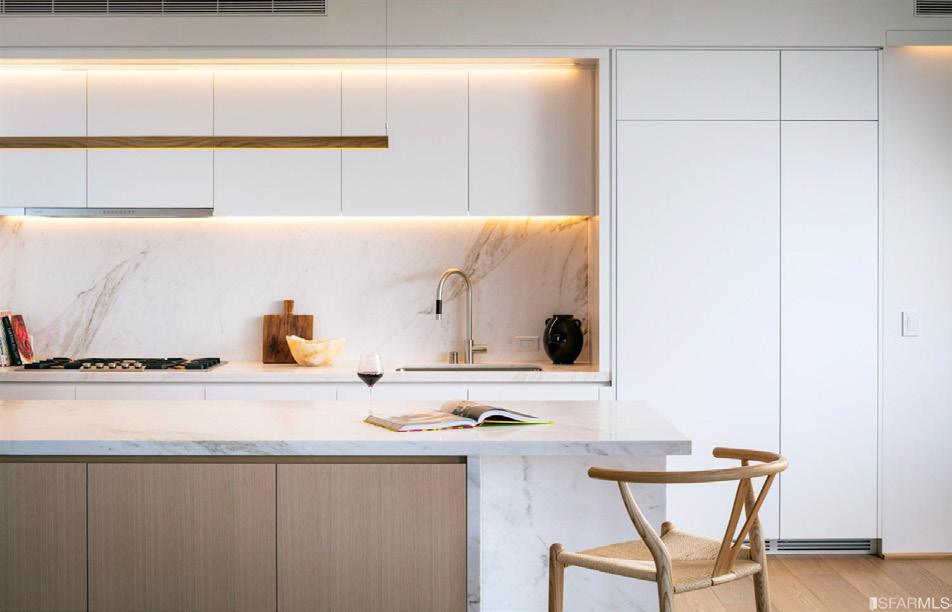
1
2 01 South Beach SoldOffMarket $8, 600 ,000 1001 CALIFORNIA #3 Nob Hill ListedbyColdwellBanker $ 7,300 ,000 1020 VALLEJO
Russian Hill ListedbySotheby’sInt.Realty $ 7,125 ,000 1960
Telegraph Hill ListedbySotheby’sInt.Realty $6,100,000
ListedbySotheby’sInt.Realty $ 6,005 ,000 875
Nob Hill ListedbyPolarisPacific $ 6,00 0,000
STEUART LN #1
#7
GRANT #15
2127 BROADWAY
#5
Pacific Heights
CALIFORNIA #PH2
CONDOS 37
2022 CONDO SALES OVER $2.5M
Address Sales Price Date DOM List Price BR/BA Sq Ft $/Sq Ft District 1 - Inner Richmond 440 4th Ave $2,500,000 6-Sep ** Off-market 5/4 2761 $905 District 1 - Jordan Park/Laurel Heights 35 Blake St $3,325,000 21-Nov ** Off-market 4/4 3285 $1,012 72 Iris Ave $2,653,000 25-Mar 8 $2,195,000 3/2 1740 $1,525 51 Parker Ave $2,620,000 29-Apr 14 $2,150,000 3/2 1925 $1,361 District 1 - Lake Street 124 9th Ave $3,193,125 23-Mar 6 $3,250,000 3/3 2872 $1,112 64 7th Ave $2,550,000 14-Jul 3 $2,495,000 3/3 2375 $1,074 2515 Lake St $2,500,000 8-Aug 16 $2,625,000 3/3 2545 $982 653 Lake St $2,500,000 14-Nov 8 $2,375,000 3/2 1965 $1,272 District 5 - Buena Vista/Ashbury Heights 457 Buena Vista Ave $4,180,000 23-Feb 4 $3,849,000 3/3 2580 $1,620 171 Alpine Ter $3,050,000 15-Apr 7 $1,949,000 3/2 2261 $1,349 869 Clayton St $3,000,000 26-Apr 0 $3,100,000 3/3 2526 $1,188 District 5 - Cole Valley/Parnassus Heights 246 Carl St $3,995,000 1-Apr 0 $3,995,000 3/5 4216 $948 494 Frederick St $3,750,000 25-Feb 0 $3,795,000 4/4 2655 $1,412 248 Carl St $3,495,000 31-Mar ** Off-market 3/4 2864 $1,220 492 Frederick St $2,865,000 25-Feb 11 $2,799,000 3/3 2010 $1,425 490 Frederick St $2,600,000 25-Feb 11 $2,299,000 3/3 1685 $1,543 District 5 - Corona Heights 171 Beaver St $4,100,000 2-May 6 $3,400,000 3/3 2639 $1,554 183 States St $2,608,000 5-Apr 11 $2,095,000 2/3 2093 $1,246 District 5 - Duboce Triangle 2238 Market St #503 $2,995,000 23-Sep ** Off-market 3/3 1574 $1,903 District 5 - Eureka Valley/Dolores Heights 101 Liberty St $3,650,000 16-Feb 10 $2,895,000 3/3 2485 $1,469 608 Sanchez St $3,600,000 6-May 8 $2,395,000 3/3 2376 $1,515 160 Hancock St #3 $3,000,000 3-Jun 6 $2,850,000 3/3 2425 $1,237 943 Church St #A $2,950,000 17-Oct 10 $2,895,000 3/3 2821 $1,046 990 Guerrero St $2,867,000 11-Mar 16 $2,495,000 4/3 2110 $1,359 165 Collingwood St $2,625,000 24-Feb 6 $2,295,000 3/3 1853 $1,417 4658 18th St #PH $2,600,000 31-May 12 $2,395,000 3/4 2211 $1,176 District 5 - Haight Ashbury 117 Lyon St $4,500,000 16-May 7 $2,700,000 5/4 2352 $1,913 118 Lyon St $3,400,000 18-May 3 $2,845,000 3/3 2470 $1,377 38 Baker St $3,250,000 10-Jun 5 $2,495,000 3/2 2419 $1,344 District 5 - Mission Dolores 200 Dolores St #8 $2,975,000 1-Mar 15 $2,950,000 3/4 2248 $1,323 3572 19th St $2,925,000 17-May 4 $2,595,000 3/3 1904 $1,536 38
2022 CONDO SALES
OVER $2.5M
Address Sales Price Date DOM List Price BR/BA Sq Ft $/Sq Ft 370 Dolores St $2,800,000 7-Jan 66 $2,999,000 5/3 2755 $1,016 3500 19th St #302 $2,550,000 6-May 12 $2,500,000 2/3 1456 $1,751 23 Rosemont Pl $2,500,000 4-Apr 7 $2,275,000 2/2 N/A N/A 174 Dolores St $2,500,000 6-Oct 21 $2,695,000 3/2 N/A N/A District 5 - Noe Valley 4163 26th St $4,000,000 8-Mar 5 $3,295,000 4/4 2572 $1,555 110 Chattanooga St #A $3,595,000 1-Jul 22 $3,595,000 4/3 2880 $1,248 4163-A 26th St $2,795,000 16-Mar 12 $2,795,000 3/4 1994 $1,402 168 Duncan St $2,750,000 3-May 18 $2,495,000 4/3 2452 $1,122 1061 Dolores St $2,750,000 13-Jun 16 $2,695,000 3/3 2360 $1,165 1140 Dolores St $2,650,000 17-Mar 5 $2,195,000 2/2 1935 $1,370 468 Valley St $2,600,000 2-Mar 26 $2,595,000 3/3 2378 $1,093 399 Duncan St $2,600,000 21-Mar 7 $2,395,000 3/3 2040 $1,275 1159 Church St $2,600,000 16-May 15 $1,995,000 3/3 1862 $1,396 110 Chattanooga St #B $2,599,000 31-Aug 11 $2,599,000 3/3 2153 $1,207 470 Valley St $2,500,000 7-Mar 28 $2,395,000 3/3 1847 $1,354 300 Valley St #6 $2,500,000 21-Apr 5 $1,995,000 3/3 2090 $1,196 District 5 - Twin Peaks 1523 Franklin St #401 $3,040,000 7-Mar 34 $3,100,000 3/3 2180 $1,394 717 Corbett Ave $2,565,000 9-Jun 7 $1,995,000 3/3 2156 $1,190 District 6 - Hayes Valley 77 Carmelita St #A $2,725,000 18-Feb 15 $1,895,000 2/2 1960 $1,390 780 Haight St $2,600,000 1-Mar 9 $1,995,000 3/2 2020 $1,287 District 6 - Lower Pacific Heights 2273 California St $4,000,000 21-Jan 60 $3,950,000 3816 $1,048 2426 Pine St $3,100,000 18-Feb 2 $2,850,000 4/3 3125 $992 1523 Franklin St #501 $3,050,000 19-Apr 60 $3,200,000 3/3 2120 $1,439 1523 Franklin St #401 $3,040,000 7-Mar 34 $3,100,000 3/3 2180 $1,394 1523 Franklin St #201 $2,920,000 18-Feb 24 $2,950,000 4/4 3080 $948 1967 Pine St $2,850,000 27-May 19 $2,795,000 3/3 2360 $1,208 1523 Franklin St #301 $2,780,000 18-Feb 37 $2,895,000 3/3 1810 $1,536 2154 Sutter St $2,600,000 4-Apr ** Off-market 3/2 1872 $1,389 2365 Bush St $2,595,000 18-Feb 20 $2,495,000 3/2 2230 $1,164 District 6 - North Panhandle 928 Broderick St $2,500,000 9-May 5 $1,998,000 2480 $1,008 District 6 - Western Addition 1480 Golden Gate Ave $2,800,000 26-Apr 1 $2,199,000 2513 $1,114 District 7 - Cow Hollow 2756 Greenwich St $3,610,000 20-Sep 31 $3,300,000 4/3 2405 $1,501 2771 Union St $3,375,000 9-May 10 $3,195,000 3/3 2800 $1,205 1662 Union St $3,300,000 18-Jul 20 $3,495,000 3/3 2219 $1,487 4/3 4/4 3/3 39
2022 CONDO SALES
OVER $2.5M
Address Sales Price Date DOM List Price BR/BA Sq Ft $/Sq Ft 2756 Baker St $2,950,000 22-Apr 4 $2,895,000 2/3 1936 $1,524 2847 Baker St $2,900,000 23-Sep 51 $3,200,000 3/2 2101 $1,380 2717 Union St $2,815,000 4-Oct 4 $2,798,000 2/2 1551 $1,815 1515 Union St #2D $2,799,000 29-Apr 37 $2,849,000 2/3 1502 $1,864 1515 Union St #6C $2,625,000 8-Dec 137 $3,255,000 2/2 1618 $1,622 2134 Green St #2 $2,600,000 2-May 21 $2,495,000 3/3 2160 $1,204 1515 Union St #4I $2,595,000 13-Jan 128 $2,745,000 2/2 1545 $1,680 2737 Union St $2,595,000 23-Dec 24 $2,595,000 2/2 N/A N/A 2823 Laguna St $2,535,000 14-Feb 12 $2,495,000 3/2 1896 $1,337 District 7 - Marina 3532 Webster St $4,300,000 16-May 11 $4,100,000 5/3 2876 $1,495 1433 Jefferson St $3,630,000 22-Nov 69 $4,695,000 4/3 3278 $1,107 33 Capra Way $3,400,000 23-May 9 $3,199,000 4/4 2137 $1,591 2227 Beach St $3,400,000 28-Oct 96 $3,795,000 4/3 2614 $1,301 1456 Chestnut St #3 $3,250,000 2-May 8 $2,900,000 3/2 N/A N/A 2267 Francisco St $3,150,000 18-Apr 10 $2,850,000 3/3 2129 $1,480 2442 Francisco St $3,150,000 29-Mar 6 $2,475,000 2/2 1913 $1,647 37 Capra Way $3,100,000 17-May 9 $2,299,000 3/2 1360 $2,279 2324 Francisco St $3,000,000 18-Nov 41 $3,250,000 4/3 2745 $1,093 35 Capra Way $2,800,000 16-Jun 2 $2,499,000 3/3 1538 $1,821 2257 Beach St $2,975,000 7-Apr ** Off-market 3/3 2047 $1,453 2444 Francisco St $2,775,000 22-Apr 3 $2,475,000 2/3 1685 $1,647 2328 Francisco St $2,725,000 11-May ** Off-market 2/2 1743 $1,563 147 Cervantes Blvd $2,715,000 21-Jun ** Off-market 3/2 1709 $1,589 2920 Franklin St $2,625,000 10-Jun 15 $2,495,000 2/3 1670 $1,572 121 Retiro Way $2,620,000 11-Feb 0 $2,495,000 3/3 1970 $1,330 1531 Beach St $2,560,000 25-Mar 8 $2,295,000 2/2 2217 $1,155 3534 Broderick St $2,500,000 14-Jul 3 $2,149,000 2/2 1508 $1,658 District 7 - Pacific Heights 2006 Washington St #2 $19,000,000 22-Nov 296 $19,000,000 4/9 N/A N/A 2127 Broadway St #5 $6,005,000 14-Nov 38 $6,100,000 3/3 2745 $2,188 2330 Vallejo St $5,300,000 11-Mar 5 $4,950,000 4/3 2765 $1,917 1925 Gough St #32 $4,999,000 13-Oct 221 $5,900,000 4/4 4234 $1,181 2210 Vallejo St $4,995,000 28-Oct 2 $4,995,000 4/4 3075 $1,624 1925 Gough St #41 $4,750,000 22-Dec 87 $4,750,000 3/4 4000 $1,188 2121 Webster St #108 $4,700,000 26-Sep 121 $5,225,000 3/4 2888 $1,627 1958 Vallejo St #4 $4,700,000 26-Oct 32 $4,695,000 4/4 3358 $1,400 1896 Pacific Ave #604 $4,600,000 31-Jan ** Off-market 3/3 2631 $1,748 2121 Webster St #301 $4,500,000 16-Jun ** Off-market 3/3 2112 $2,131 2121 Webster St #TH8 $4,500,000 15-Mar 0 $4,500,000 3/4 2478 $1,816 2464 Broadway St $4,500,000 24-May ** Off-market 3/4 2806 $1,604 40
2022 CONDO SALES
OVER $2.5M
Address Sales Price Date DOM List Price BR/BA Sq Ft $/Sq Ft 2121 Webster St #TH2 $4,400,000 1-Feb 81 $4,295,000 3/4 2404 $1,830 2040 Broadway St #402 $4,400,000 16-Nov 32 $4,400,000 4/5 2366 $1,860 2259 Clay St $4,082,500 5-Jan 70 $4,200,000 3/3 3022 $1,351 3953 Washington St $4,050,000 10-Nov 40 $4,495,000 4/3 3371 $1,201 2273 California St $4,000,000 21-Jan ** Off-market 4/4 3816 $1,048 1960 Vallejo St #7 $3,950,000 11-May 26 $3,995,000 3/3 2376 $1,662 2999 Pacific Ave #2 $3,843,000 31-Mar 1 $2,995,000 3/3 2551 $1,506 250 Laurel St #202 $3,700,000 18-Jan ** Off-market 3/2 1950 $1,897 2121 Webster St #503 $3,600,000 9-Feb 0 $3,498,000 2/2 1325 $2,717 3320 Washington St $3,600,000 20-May 7 $2,995,000 3/3 2335 $1,542 3545 Washington St $3,550,000 13-May 7 $3,200,000 4/3 N/A N/A 1855 Broadway St $3,500,000 25-Feb 8 $2,950,000 3/3 2262 $1,547 2106 Scott St #C $3,500,000 8-Mar 6 $2,750,000 2/2 2045 $1,711 3938 Washington St $3,500,000 8-Aug 7 $3,199,000 3/3 2045 $1,711 2115 Baker St $3,400,000 22-Mar 26 $3,399,000 3/2 2522 $1,348 1960 Broadway #5 $3,350,000 14-Jan 296 $3,995,000 3/3 2794 $1,199 2614 Buchanan St #1 $3,300,000 21-Jun 14 $3,195,000 4/3 2910 $1,134 22 Presidio Ave $3,290,000 1-Jul 30 $3,350,000 3/3 2312 $1,423 2121 Webster St #105 $3,250,000 14-Apr ** Off-market 2/2 1534 $2,119 2100 Pacific Ave #8A $3,200,000 9-Dec 77 $3,495,000 4/4 2707 $1,182 2200 Sacramento St #1203 $3,200,000 9-Jun ** Off-market 2/2 1130 $2,832 1650 Broadway #502 $3,180,000 31-Aug ** Off-market 3/3 1494 $2,129 3537 Washington St $3,150,000 4-May 10 $3,200,000 4/2 N/A N/A 3324 Washington St $3,050,000 15-Jun 26 $3,250,000 3/3 2375 $1,284 3320 California St #3 $2,995,000 8-Mar 8 $2,995,000 4/3 2583 $1,160 1928 Jackson St $2,900,000 15-Apr 5 $2,650,000 2/2 1607 $1,805 408 Laurel St #2 $2,880,000 6-May 25 $2,895,000 3/4 1875 $1,536 2459 Jackson St $2,850,000 4-Mar 18 $2,829,000 3/3 2321 $1,228 3153 Sacramento St $2,850,000 7-Apr 8 $2,795,000 3/3 1937 $1,471 2785 Jackson St #2 $2,800,000 31-May 20 $2,699,000 3/3 N/A N/A 2100 Green St #502 $2,700,000 8-Jul 107 $2,800,000 2/3 1850 $1,459 3046 California St $2,700,000 29-Apr 0 $2,700,000 4/3 N/A N/A 2100 Pacific Ave #7A $2,650,000 1-Jul 55 $2,995,000 4/4 2707 $979 2635 Buchanan St $2,650,000 4-Nov 90 $3,295,000 3/3 2633 $1,006 122 Arguello Blvd $2,650,000 11-Jul 15 $2,295,000 3/2 1690 $1,568 2137 Jackson St #1 $2,600,000 4-Nov 8 $2,500,000 3/3 2435 $1,068 2871 Clay St $2,600,000 3-Jan 22 $2,750,000 3/2 1910 $1,361 2134 Green St #2 $2,600,000 2-May 21 $2,495,000 3/3 2160 $1,204 2139 Jackson St $2,600,000 4-Nov ** Off-market 3/3 2435 $1,068 2332 Vallejo St $2,505,000 11-Oct 11 $2,395,000 2/2 1640 $1,527 2121 Webster St #208 $2,500,000 16-Mar 10 $2,450,000 1/2 1123 $2,226 41
2022 CONDO SALES
OVER $2.5M
Address Sales Price Date DOM List Price BR/BA Sq Ft $/Sq Ft 2169 Green St #1 $2,500,000 10-May 16 $2,650,000 2/2 1550 $1,613 District 7 - Presidio Heights 3953 Washington St $4,050,000 10-Nov 40 $4,495,000 4/3 3371 $1,201 250 Laurel St #202 $3,700,000 18-Jan ** Off-market 3/2 2583 $1,432 3320 Washington St $3,600,000 20-May 7 $2,995,000 3/3 2335 $1,542 3545 Washington St $3,550,000 13-May 7 $3,200,000 4/2 2761 $1,286 3938 Washington St $3,500,000 8-Aug 7 $3,199,000 3/3 2045 $1,711 3537 Washington St #2A $3,150,000 4-May 10 $3,200,000 4/2 2761 $1,141 3324 Washington St $3,050,000 15-Jun 26 $3,250,000 3/3 2375 $1,284 3320 California St #3 $2,995,000 8-Mar 8 $2,995,000 4/3 2583 $1,160 408 Laurel St #2 $2,880,000 6-May 25 $2,895,000 3/4 1875 $1,536 122 Arguello Blvd $2,650,000 11-Jul 15 $2,295,000 3/2 1690 $1,568 District 8 - Downtown 875 California St #Ph2 $6,000,000 23-Mar ** Off-market 3/2 1825 $3,288 1001 California St #3A $3,650,000 14-Nov 38 $7,900,000 2/3 3474 $1,051 875 California St #101 $3,000,000 1-Feb ** Off-market 2/3 2075 $1,446 District 8 - Financial District 733 Front St #701 $3,400,000 17-Dec ** Off-market n/a 1578 $2,155 845 Montgomery St #PH2 $3,000,000 17-Aug 123 $2,995,000 3/2 1800 $1,667 733 Front St #601 $2,900,000 5-Jan ** Off-market n/a 1509 $1,922 640 Davis St #3 $2,650,000 18-Apr 20 $2,650,000 3/3 2251 $1,177 611 Washington St #2204 $2,625,000 11-Feb ** Off-market n/a 1857 $1,414 District 8 - Nob Hill 1001 California St #3 $7,300,000 14-Nov 38 $7,900,000 2/3 3474 $2,101 875 California St #PH2 $6,000,000 24-Mar 98 $6,995,000 3/3 1825 $3,288 1452 Broadway #PH $5,850,000 3-Nov 75 $5,995,000 3/4 3242 $1,804 10 Miller Pl #2200 $4,500,000 4-Apr ** Off-market 3/3 2400 $1,875 1220 Jones St #501 $4,299,000 18-Oct 128 $4,500,000 3/3 2715 $1,583 1170 Sacramento St #17A $3,850,000 13-Sep 197 $4,295,000 2/3 2027 $1,899 1333 Jones St #905 $3,125,000 23-Mar 15 $3,195,000 2/2 1850 $1,689 1340 Clay St #801 $2,950,000 15-Jun 21 $2,795,000 2/2 2070 $1,425 1623 Hyde St $2,900,000 16-May 6 $2,495,000 3/3 1741 $1,666 840 Powell St #202 $2,800,000 31-Oct 171 $3,295,000 5/4 3077 $910 1200 California St #19B $2,725,000 22-Mar 142 $2,850,000 2/2 1800 $1,514 1333 Jones St #1510 $2,600,000 28-Apr 23 $2,698,000 2/2 N/A N/A District 8 - Russian Hill 999 Green St #3201 $17,000,000 18-Jul 35 $17,000,000 3/5 5380 $3,160 999 Green St #3202 $12,000,000 18-Jul 35 $12,000,000 3/5 4935 $2,432 1090 Chestnut St #3 $9,809,524 26-Jul 47 $10,900,000 3/4 3455 $2,839 1750 Taylor St #1201 $9,500,000 31-Oct 37 $9,500,000 3/4 N/A N/A 1020 Vallejo St #7 $7,125,000 23-Sep 8 $5,995,000 2/3 2410 $2,956 40
2022 CONDO SALES OVER
$2.5M
Address Sales Price Date DOM List Price BR/BA Sq Ft $/Sq Ft 2310 Hyde St #1 $4,990,000 31-Mar 26 $4,950,000 3/4 3746 $1,332 2164 Hyde St #715 $4,575,000 15-Jul 69 $4,895,000 3/3 3055 $1,498 1039 Vallejo St $4,200,000 12-May 3 $4,200,000 3/3 2611 $1,609 1338 Filbert St #B $3,950,000 8-Feb 12 $3,895,000 3/4 2620 $1,508 1100 Union St #800 $3,800,000 11-Mar 49 $4,195,000 3/4 2614 $1,454 1028 Lombard St $3,500,000 13-Jul 8 $3,500,000 4/4 2725 $1,284 2423 Larkin St $3,350,000 10-Aug 43 $3,495,000 2/2 1693 $1,979 1268 Lombard St #4 $3,300,000 20-May 8 $3,195,000 2/2 1425 $2,316 2450 Larkin St $3,225,000 21-Oct 12 $2,995,000 3/3 3040 $1,061 1750 Taylor St #1802 $3,200,000 28-Apr 117 $3,500,000 2/2 N/A N/A 1137 Green St $3,125,000 10-May 2 $2,795,000 3/3 1868 $1,673 1034 Chestnut St $3,120,001 8-Feb 144 $3,500,000 3/2 N/A N/A 1080 Chestnut St #7C $3,000,000 12-Sep 0 $2,995,000 2/2 1622 $1,850 1079 Lombard St #301 $2,900,000 12-Sep 18 $2,500,000 3/5 3135 $925 1001 Greenwich St $2,750,000 7-Sep 24 $2,895,000 3/3 2084 $1,320 1926 Taylor St $2,600,000 25-May 10 $2,195,000 2/2 1449 $1,794 1750 Taylor St #1203 $2,600,000 18-Oct ** Off-market 1/2 N/A N/A 1062 Filbert St $2,500,000 21-Oct 23 $2,495,000 2/2 N/A N/A District 8 - Telegraph Hill 1960 Grant Ave #15 $6,100,000 14-Jun 15 $5,995,000 4/3 4206 $1,450 186 Francisco St #3 $3,150,000 16-Mar 9 $3,100,000 3/3 2239 $1,407 1360 Montgomery St #11 $3,000,000 31-Jan 14 $3,250,000 2/2 1550 $1,935 165 Francisco St #14 $2,800,000 9-Sep 72 $3,195,000 3/4 2800 $1,000 186 Francisco St #2 $2,700,000 22-Jun 41 $2,950,000 3/3 2533 $1,066 470 Greenwich St $2,525,000 30-Sep 29 $2,698,000 2/2 1905 $1,325 District 9 - Inner Mission 945 Treat Ave $2,925,000 11-Mar 42 $3,195,000 4/4 2762 $1,059 District 9 - Mission Bay 255 Berry St #708 $3,100,000 27-Oct ** Off-market 2/2 2435 $1,273 480 Mission Bay Blvd #1105 $2,950,000 13-May 7 $2,950,000 3/2 1921 $1,536 1000 3rd St #1301 $2,900,000 15-Jul 73 $3,650,000 3/2 1976 $1,468 255 Berry St #710 $2,695,000 2-Mar 48 $2,695,000 3/3 2293 $1,175 1000 3rd St #1202 $2,640,000 29-Apr 148 $3,000,000 3/3 1827 $1,445 District 9 - Potrero Hill 896 De Haro St $3,850,000 15-Nov 24 $3,850,000 4/3 2907 $1,324 485 Connecticut St $3,275,000 19-Oct ** Off-market 1/1 609 $5,378 495 Connecticut St $3,275,000 19-Oct ** Off-market 1/1 648 $5,054 1538 20th St $3,275,000 19-Oct ** Off-market 1/1 1256 $2,607 1540 20th St $3,275,000 19-Oct ** Off-market 1/1 1214 $2,698 251 Missouri St $2,994,933 28-May ** Off-market 4/3 2323 $1,289 2005 19th St $2,850,000 12-Apr 24 $2,895,000 4/3 2369 $1,203 43
2022 CONDO SALES OVER $2.5M
Address Sales Price Date DOM List Price BR/BA Sq Ft $/Sq Ft 2103 18th St $2,800,000 6-Apr 23 $2,995,000 3/3 2570 $1,089 1912 18th St $2,625,000 8-Dec 0 $2,625,000 3/3 2136 $1,229
1 Steuart Ln #2001 $10,500,000 22-Aug ** Off-market 3/3 2340 $4,487 1 Steuart Ln #1201 $8,600,000 4-Apr ** Off-market 3/3 2556 $3,365 160 Folsom St #39C $6,750,000 7-Feb ** Off-market 3/2 2410 $2,801 1 Steuart Ln #510 $5,595,000 27-Jan ** Off-market 2/3 2278 $2,456 160 Folsom St #33E $4,995,000 26-Apr ** Off-market 3/2 2109 $2,368 488 Folsom #4602 $4,950,000 24-Jan ** Off-market 3/3 2064 $2,398 160 Folsom St #37A $4,650,000 12-Jul ** Off-market 3/2 2122 $2,191 160 Folsom St #35f $4,500,000 8-Apr ** Off-market 3/3 1947 $2,311 160 Folsom St #34f $4,445,000 15-Apr ** Off-market 3/3 1963 $2,264 54 South Park St $4,406,000 23-Dec 107 $4,950,000 3/5 3104 $1,419 181 Fremont St #62A $4,200,000 26-Aug 8 $5,067,000 3/4 1914 $2,194 488 Folsom #4202 $4,075,000 15-Feb ** Off-market 3/3 1888 $2,158 301 Main St #15C $4,000,000 30-Sep 36 $3,999,999 2/3 2174 $1,840 301 Main St #15D $4,000,000 30-Sep 152 $4,125,000 2/3 2174 $1,840 75 Howard St #1202 $3,990,000 25-Aug ** Off-market 2/3 1679 $2,376 1 Steuart Ln #1202 $3,990,000 14-Sep ** Off-market 2/3 N/A N/A 650 2nd St #502 $3,950,000 28-Oct 18 $3,950,000 4/4 4190 $943 425 1st St #6004 $3,800,000 1-Feb 52 $3,998,000 2/2 1568 $2,423 488 Folsom St #5005 $3,755,000 4-Mar ** Off-market 2/3 1811 $2,073 488 Folsom St #3501 $3,750,000 9-Jun 79 $3,825,000 3/3 2053 $1,827 488 Folsom #3502 $3,600,000 5-Oct ** Off-market 3/3 1898 $1,897 188 Minna St #31A $3,595,000 31-Oct 67 $3,595,000 3/3 2027 $1,774 301 Mission St #Ph4 $3,550,000 19-Oct ** Off-market 2/2 1339 $2,651 301 Mission St #Ph5 $3,550,000 19-Oct 11 $3,595,000 4/3 3139 $1,131 338 Spear St #35C $3,510,000 23-Sep 52 $3,790,000 3/3 1732 $2,027 301 Mission St #48D $3,500,000 28-Oct 213 $12,900 2/3 1971 $1,776 401 Harrison St #42D $3,250,000 14-Sep 440 $3,750,000 3/3 1949 $1,668 3 Clarence Pl $3,250,000 6-Apr 58 $3,798,000 4/3 2590 $1,255 338 Spear St #35B $3,180,000 18-Apr 0 $2,950,000 3/3 1614 $1,970 75 Howard St #1005 $3,125,000 14-Feb ** Off-market 2/3 1678 $1,862 401 Harrison #PH49A $3,125,000 28-Feb 161 $3,450,000 2/2 1648 $1,896 488 Folsom #4205 $3,085,000 5-Apr 48 $3,135,000 2/3 1652 $1,867 301 Main St #29C $2,999,000 2-Mar 5 $2,999,000 3/3 1748 $1,716 425 1st St #5902 $2,995,000 11-Feb ** Off-market 2/2 1526 $1,963 188 Minna St #32C $2,995,000 18-Feb 200 $2,995,000 2/3 1670 $1,793 480 Mission Bay Blvd N #1105 $2,950,000 13-May 7 $2,950,000 3/2 1921 $1,536 425 1st St #5202 $2,900,000 25-Jul 129 $3,599,000 3/3 1971 $1,471 188 Minna St #28F $2,850,000 12-May 94 $2,995,000 2/3 1527 $1,866 44
District 9 - South Beach
2022 CONDO SALES OVER
$2.5M
Address Sales Price Date DOM List Price BR/BA Sq Ft $/Sq Ft 72 Townsend St #902 $2,825,000 19-Jul 105 $3,600,000 2/2 N/A N/A 188 Minna St #33c $2,800,000 29-Mar 35 $2,895,000 2/3 1670 $1,677 75 Folsom St #1603 $2,775,000 8-Jun 50 $2,875,000 2/2 1507 $1,841 188 Minna St #25B $2,750,000 26-Apr 294 $2,850,000 2/3 1777 $1,548 401 Harrison #PH46A $2,750,000 8-Jul 512 $2,975,000 2/2 1648 $1,669 401 Harrison St #39D $2,750,000 20-Jan 241 $2,825,000 2/2 1297 $2,120 301 Mission St #54a $2,725,000 15-Sep 41 $2,950,000 2/3 2706 $1,007 425 1st St #3003 $2,700,000 21-Apr 22 $2,495,000 2/3 1928 $1,400 338 Main St #30C $2,700,000 11-Mar 0 $2,698,000 2/2 1491 $1,811 338 Main St #32E $2,680,000 18-Nov 56 $3,150,000 3/3 1791 $1,496 401 Harrison St #39E $2,645,000 11-Aug 107 $2,645,000 2/2 1297 $2,039 488 Folsom St #4004 $2,625,000 17-Mar 267 $2,625,000 2/3 1549 $1,695 338 Spear St #38F $2,500,000 22-Apr 31 $2,500,000 2/2 N/A N/A 200 Brannan St #424 $2,500,000 2-Sep 33 $2,695,000 2/2 1939 $1,289 District 9 - South of Market 736 Mission St #29A $7,960,000 1-Jun ** Off-market 3/3 3205 $2,484 736 Mission St #601 $5,444,444 25-Jan ** Off-market 2/3 2780 $1,958 765 Market St #31CD $4,500,000 24-Jun ** Off-market 1/1 956 $4,707 15 Brush Pl $4,000,000 31-Mar 301 $4,750,000 6/3 5200 $769 1 Bernice St $3,180,000 30-Jun 48 $3,395,000 2/3 3350 $949 10 Mint Plz #6 $2,500,000 4-Jan 72 $3,500,000 4/4 3321 $753 District 9 - Yerba Buena 181 Fremont #62A $4,200,000 26-Aug 8 $5,067,000 3/4 1914 $2,194 181 Fremont St #60A $4,000,000 19-Jul 198 $3,995,000 3/3 1972 $2,028 188 Minna St #31A $3,595,000 31-Oct 67 $3,595,000 3/3 2027 $1,774 301 Mission St #PH5 $3,550,000 19-Oct 11 $3,595,000 4/3 3139 $1,131 188 Minna St #32C $2,995,000 18-Feb 200 $2,995,000 2/3 1670 $1,793 188 Minna St #28F $2,850,000 12-May 94 $2,995,000 2/3 1527 $1,866 188 Minna St #33C $2,800,000 29-Mar 35 $2,895,000 2/3 1670 $1,677 188 Minna St #25B $2,750,000 26-Apr 294 $2,995,000 2/3 1777 $1,548 301 Mission St #54A $2,725,000 15-Sep 41 $2,950,000 2/3 2706 $1,007 45
NOB HILL I SOLD APRIL 2022
LISTED BY APPLEGARTH+WARRIN
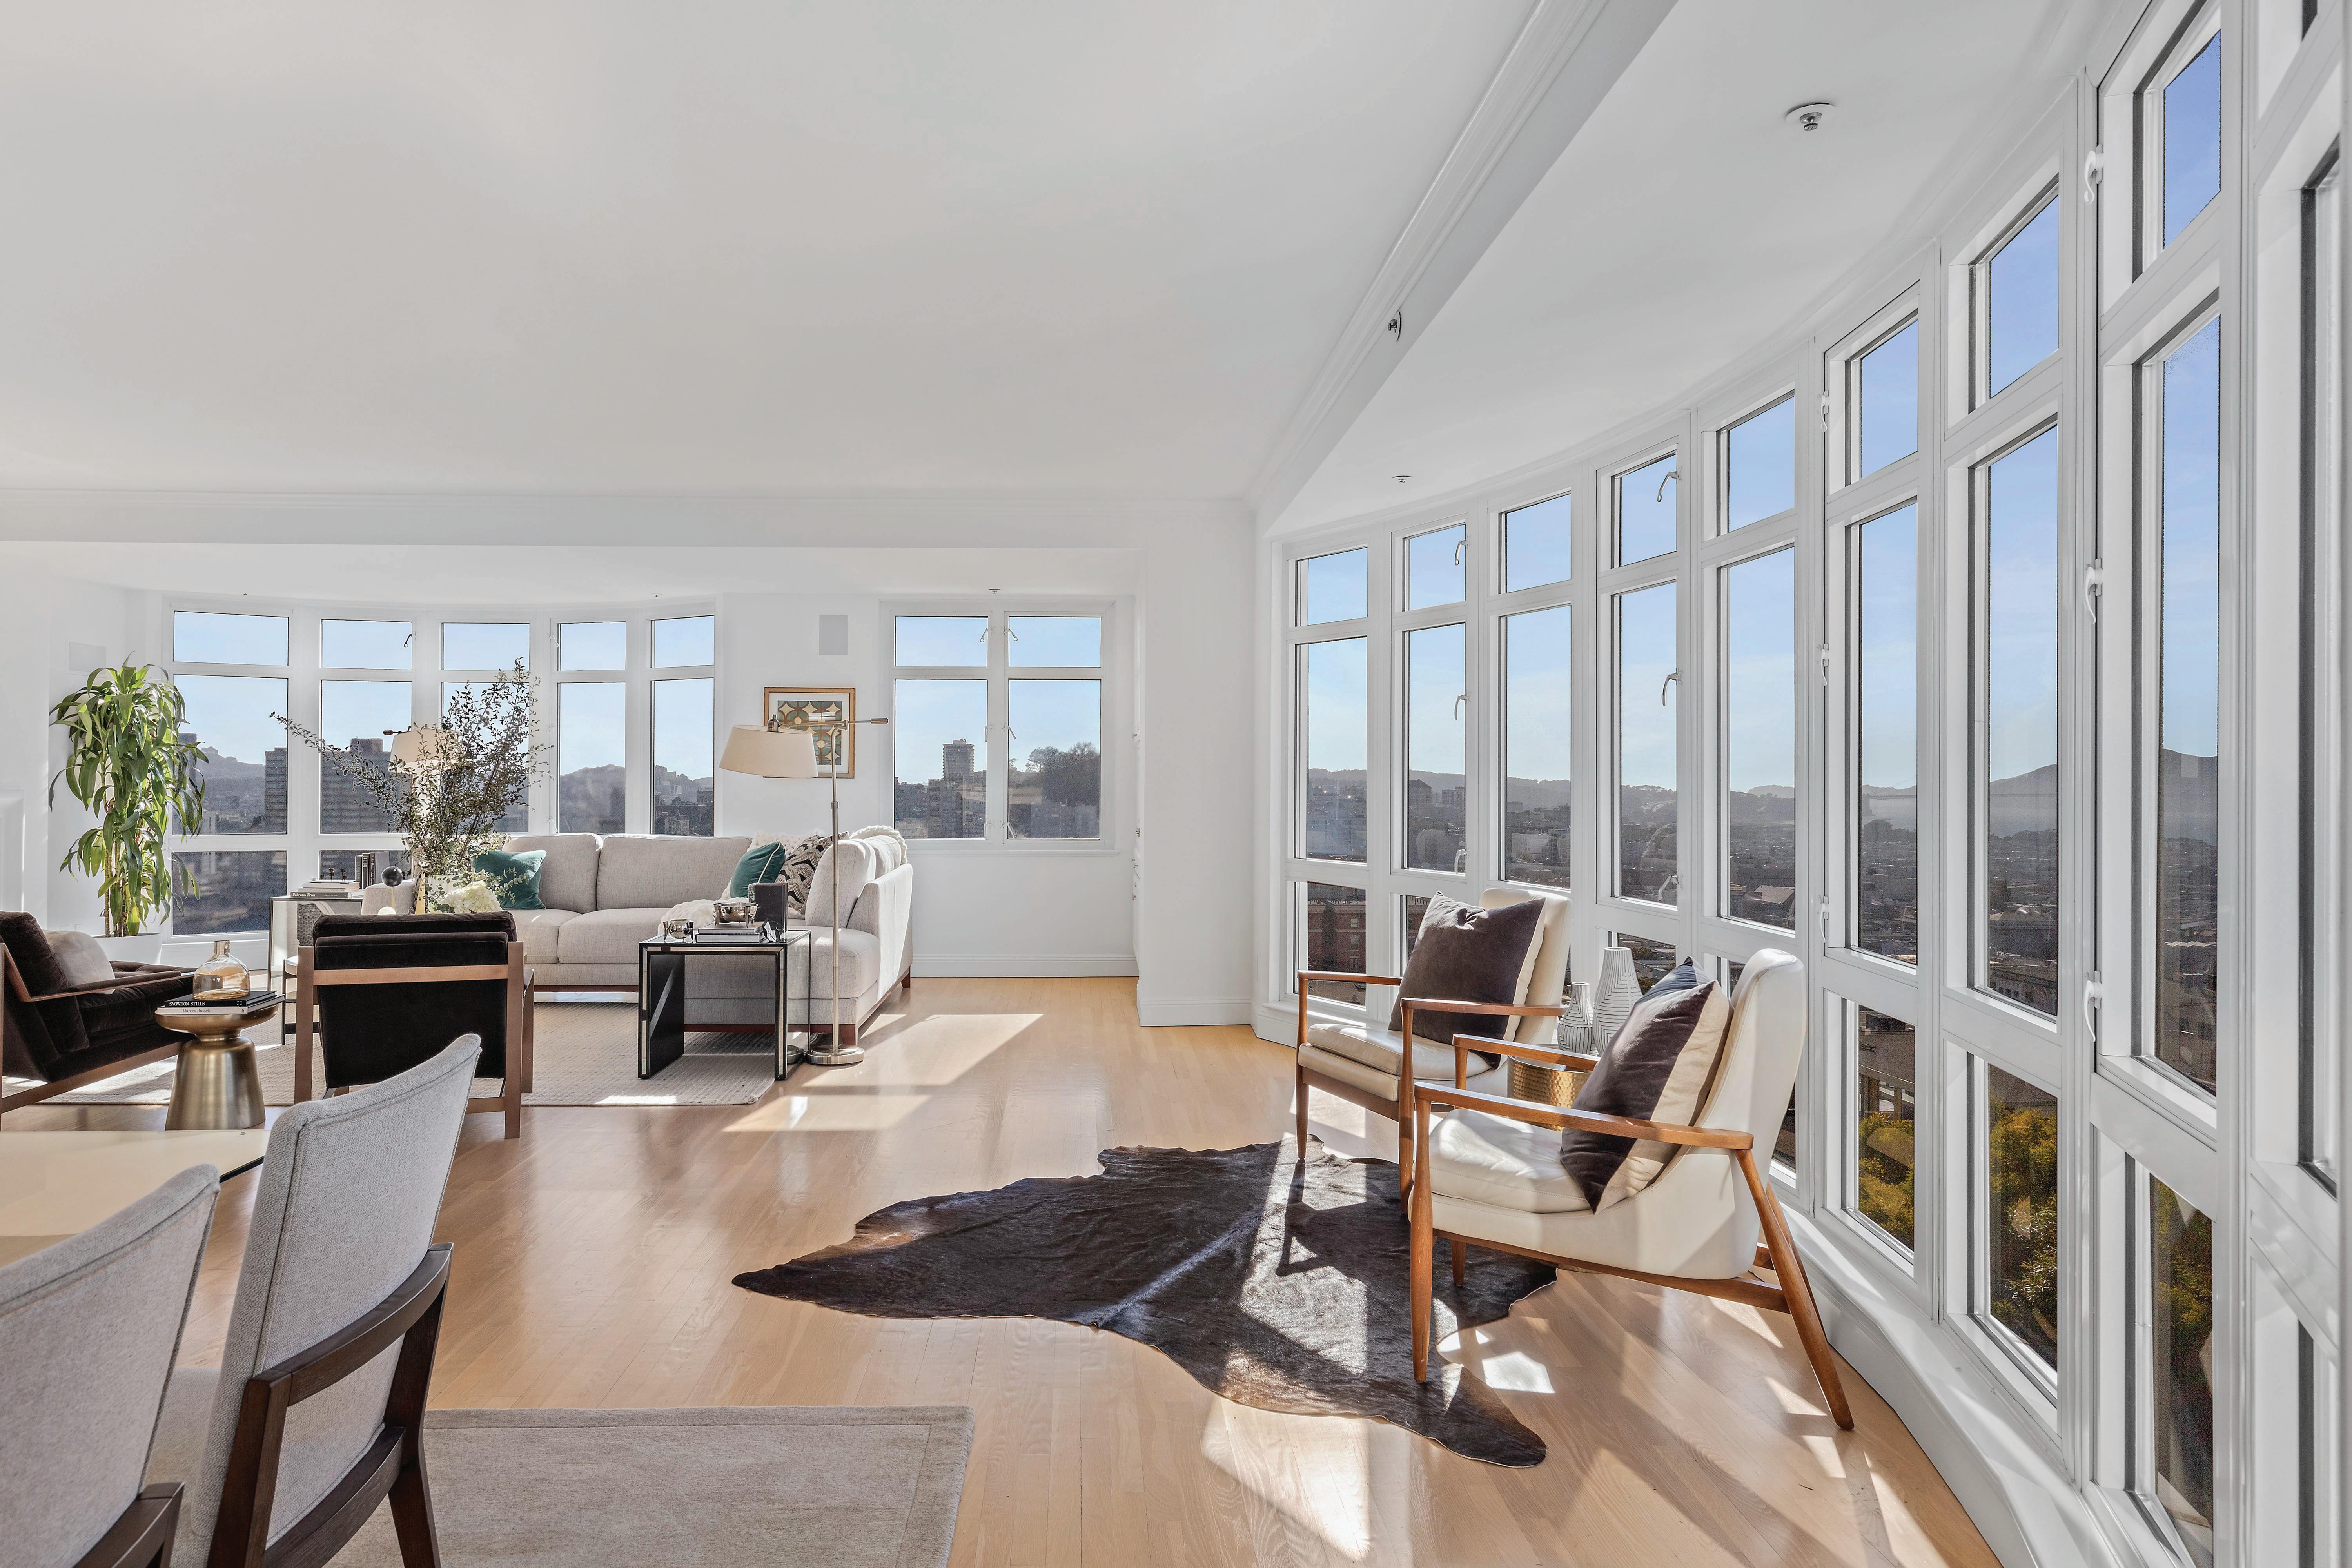
1 3 4 0 C L AY # 8 0 1 I $ 2 , 9 5 0 , 0 0 0
46

47


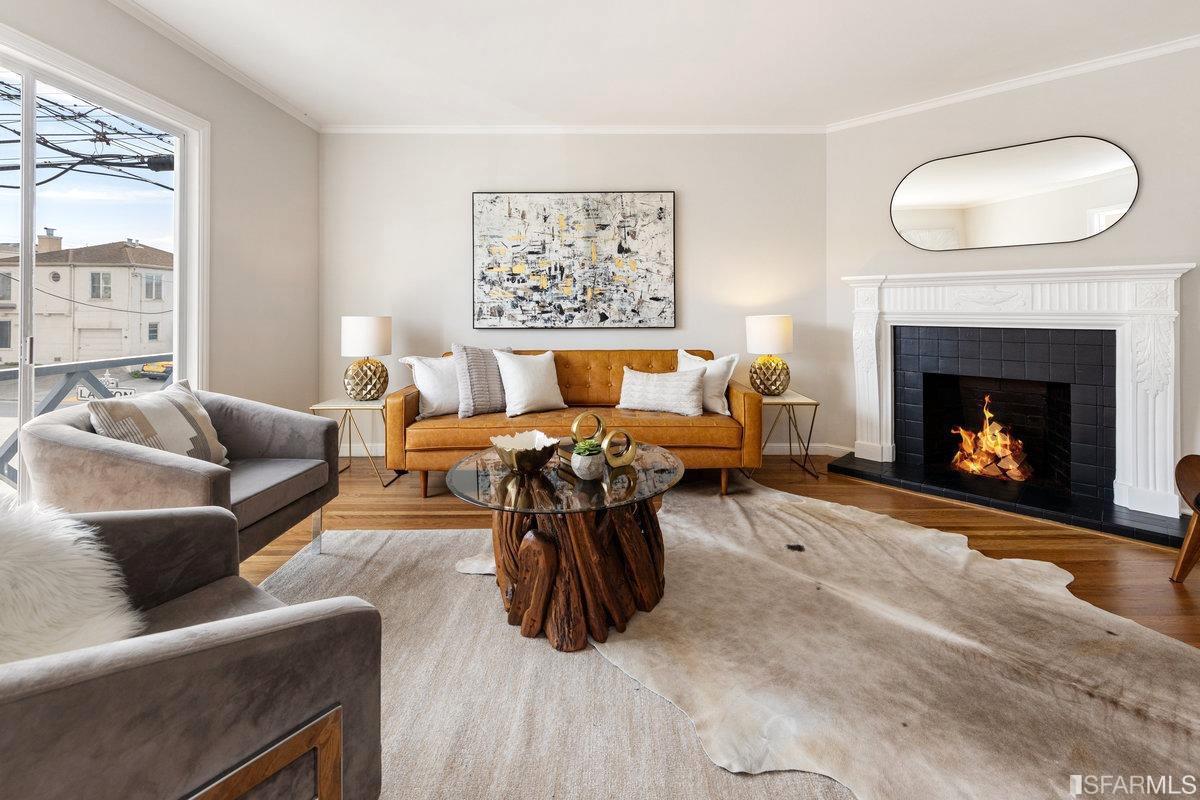
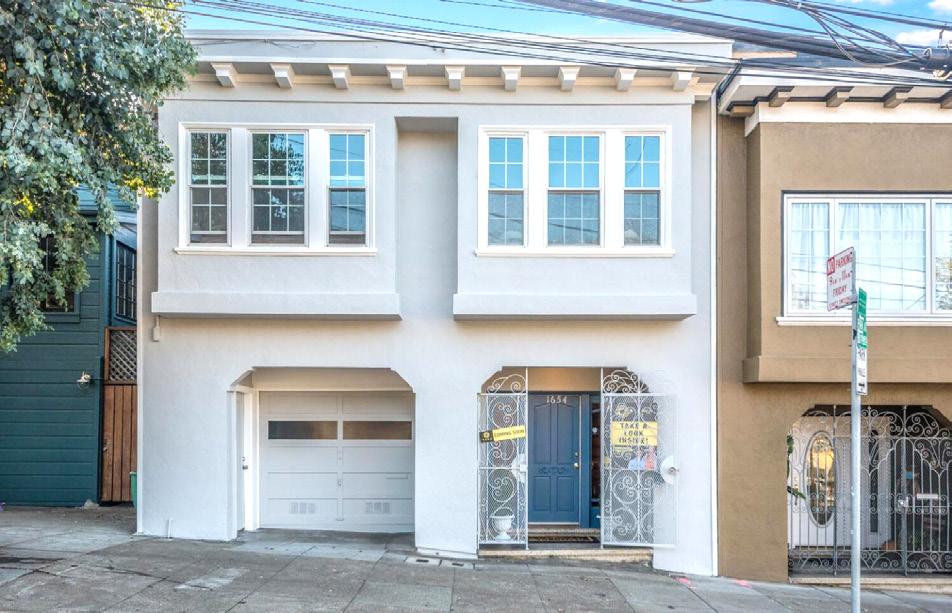

98 % OVER ASKING 320 Day, Noe Valley ListedbyCompass $1 ,970,0 00 8 4% OVER ASKING 367 Elsie, Bernal Heights ListedbyCompass $ 2,305,367 6 8 % OVER ASKING 1654 Alabama, Bernal Heights ListedbyVaraRealty $ 2,188,0 00 76 % OVER ASKING 1923 30th Ave, Parkside ListedbyEXPRealty $ 2,100 ,000 70% OVER ASKING 1595 45th Ave, Outer Sunset ListedbyCompass $1 ,700 ,000 6 7 % OVER ASKING 287 24th Ave, Lake Street ListedbyCompass $ 2,942 ,000 BIGGEST OVERBIDS 2022 PROPERTIES SOLD OVER ASKING 48
PRICE INCREASE BY NEIGHBORHOOD

AVERAGE PRICE PER SQUARE FOOT Biggest Increase Over Past 10 Years % Smallest Increase Over Past 10 Years % St. Francis Wood 99 Downtown 8 Forest Knolls 99 South of Market 16 Ingleside Heights 97 North Beach 24 Oceanview 95 Anza Vista 24 Outer Sunset 94 Russian Hill 25 Central Sunset 93 North Waterfront 26 Mount Davidson Manor 91 Financial District 27 Biggest Increase Over Past 5 Years % Smallest Increase Over Past 5 Years % St. Francis Wood 35 Downtown -12 Oceanview 31 South of Market -6 Forest Knolls 29 North Beach -5 Clarendon Heights 29 Financial District -5 Pine Lake Park 28 Van Ness/Civic Center -4 Outer Sunset 27 Yerba Buena -4 Lake Street 25 North Waterfront -3 Biggest Increase Over Past 3 Years % Smallest Increase Over Past 3 Years % St. Francis Wood 31 North Beach -13 Golden Gate Heights 26 Downtown -11 Jordan Park/Laurel Hts 20 Van Ness/Civic Center -11 Stonestown 20 Mission Bay -7 Lone Mountain 20 Yerba Buena -6 Merced Manor 19 Financial District -5 Marina 18 Merced Heights -4 Biggest Increase Over Past 1 Year % Smallest Increase Over Past 1 Year % Duboce Triangle 15 Merced Heights -26 Ingleside Terrace 15 Oceanview -21 St. Francis Wood 14 Ingleside -20 Lone Mountain 12 Merced Manor -18 Westwood Highlands 12 Inner Sunset -17 Lake Street 11 Pine Lake Park -11 Balboa Terrace 10 Forest Hill Extension -10 49
DISTRICT 1 AVERAGE PRICE PER SQUARE FOOT
-0.7% 0.7% 4.5% -0.5% -2.4% 0.2% -1.5% -7.8% 9.9% 9.5% 13.9% 11.7% -6.7% -1.6% -0.4% 3.3% $500 $700 $900 $1,100 Central Richmond Inner Richmond Outer Richmond Jordan
2018 2019 2020 2021 2022 16.1% -7.9% 6.6% -15.7% 2.6% 3.9% 5.0% 6.7% 2.2% -2.2% 12.0% 10.6% $500 $700 $900 $1,100 $1,300 $1,500 Sea Cliff Lone Mountain Lake Street 2018 2019 2020 2021 2022 50
Park/Laurel Heights
DISTRICT 2 AVERAGE PRICE PER SQUARE FOOT
-2.9% 3.0% -0.1% 3.6% 0.9% -0.2% -7.1% 0.6% 15.6% 13.9% 8.8% 9.3% 9.4% -4.5% 6.1% 1.8% $500 $700 $900 $1,100 Golden Gate Heights Outer Parkside Inner Parkside Parkside 2018 2019 2020 2021 2022 5.5% -1.1% -6.3% -5.5% 1.3% 9.3% 3.4% 10.8% 8.8% 2.7% 5.2% 1.8% $500 $700 $900 $1,100 Inner Sunset Outer Sunset Central Sunset 2018 2019 2020 2021 2022
51
DISTRICT 3 AVERAGE PRICE PER SQUARE FOOT
-3.4% -0.2% 0.8% -1.2% -3.2% 11.6% 7.2% 9.3% 6.6% 2.6% -0.6% 6.2% $500 $700 $900 Lake Shore Oceanview Lakeside 2018 2019 2020 2021 2022 4.0% -4.7% -4.2% -5.6% 2.1% 3.8% 4.0% 9.3% 0.0% 0.7% -1.5% 19.6% $500 $700 $900 Ingleside Ingleside Heights Stonestown 2018 2019 2020 2021 2022
52
DISTRICT 3 AVERAGE PRICE PER SQUARE FOOT
3.0% -5.0% 3.6% -2.8% 12.8% -5.4% 5.0% 3.0% 8.6% -1.0% -7.2% 9.6% $500 $700 $900 $1,100
Pine Lake Park Merced Heights
2018 2019 2020 2021 2022
Merced Manor
53
DISTRICT 4 AVERAGE PRICE PER SQUARE FOOT
3.7% 5.8% 10.5% 3.9% 9.4% -4.6% 6.1% 0.5% 2.1% 8.7% -2.6% 11.8% 0.0% 4.4% 9.9% -3.7% $500 $700 $900 $1,100 Forest Hill Forest Knolls Balboa Terrace Diamond Heights 2018 2019 2020 2021 2022 -6.8% -3.6% -3.4% 0.3% 15.1% 2.6% 7.4% -3.4% -0.3% 10.0% 14.8% 9.7% 14.6% -3.1% 14.5% 3.9% $500 $700 $900 $1,100 $1,300 Ingleside Terrace Midtown Terrace St.
Park 2018 2019 2020 2021 2022
Francis Wood Miraloma
54
DISTRICT 4 AVERAGE PRICE PER SQUARE FOOT
4.2% 1.4% 12.2% -2.1% -2.5% 7.5% -5.6% 0.9% 23.3% 16.2% 17.9% 10.3% -10.2% -2.3% -0.7% 2.1% $500 $700 $900 $1,100
2018 2019 2020 2021 2022 -13.9% -8.2% -1.2% -6.7% 16.1% -7.6% 12.3% 10.5% 5.1% 9.4% -2.1% 2.6% 12.0% 6.1% 2.0% 2.0% $500 $700 $900 $1,100 Westwood Highlands Westwood Park Sunnyside West Portal 2018 2019 2020 2021 2022
Forest Hill Extension Sherwood Forest Monterey Heights Mount Davidson Manor
55
DISTRICT 5 AVERAGE PRICE PER SQUARE FOOT
-3.9% -7.4% 5.6% -0.3% -0.4% -1.1% -4.3% -1.3% 0.7% 5.3% 1.7% 5.3% 3.4% 5.4% 0.7% 4.2% $500 $700 $900 $1,100 $1,300 Glen Park Haight Ashbury Noe Valley Twin Peaks 2018 2019 2020 2021 2022 14.0% 0.9% 0.3% -3.2% -8.6% 1.0% -1.7% -3.2% 7.7% 1.2% 4.9% 22.4% 1.4% 1.6% 4.7% -6.8% $500 $700 $900 $1,100 $1,300 Cole Valley/Parnassus Heights Buena Vista/Ashbury Heights Corona Heights Clarendon Heights 2018 2019 2020 2021 2022
56
DISTRICT 5 AVERAGE PRICE PER SQUARE FOOT
8.9% -1.9% 1.2% -13.0% -5.5% -11.1% -10.4% 3.3% 6.6% 15.0% 2.9% -1.6% $500 $700 $900 $1,100 $1,300 Duboce Triangle Eureka Valley/Dolores Heights Mission
2018 2019 2020 2021 2022
Dolores
57
DISTRICT 6 AVERAGE PRICE PER SQUARE FOOT
15.7% 4.5% -0.5% -10.4% -7.2% 4.1% 7.5% 1.6% 4.1% -0.4% -1.7% -1.8% $500 $700 $900 $1,100 $1,300
2018 2019 2020 2021 2022 8.3% 0.0% 5.2% -6.5% 1.1% -6.4% 5.5% 2.3% -2.6% 1.5% -3.1% 5.2% $500 $700 $900 $1,100 Alamo Square North Panhandle Western Addition 2018 2019 2020 2021 2022
Anza Vista Hayes Valley Lower Pacific Heights
58
DISTRICT 7 AVERAGE PRICE PER SQUARE FOOT
5.0% -2.8% 1.2% 0.4% -5.1% -3.8% -5.9% 2.2% 15.0% 14.2% 7.4% 3.0% -1.8% 3.1% -1.2% 4.8% $500 $700 $900 $1,100 $1,300 $1,500
2018 2019 2020 2021 2022
Cow Hollow Marina Pacific Heights Presidio Heights
59
DISTRICT 8 AVERAGE PRICE PER SQUARE FOOT
3.7% 2.9% -6.8% 13.4% -9.5% 3.8% -0.9% -10.8% -1.5% -5.1% 3.4% -3.1% -10.1% 0.5% 1.5% -10.2% $500 $700 $900 $1,100 $1,300 Downtown Financial District Nob Hill North Beach 2018 2019 2020 2021 2022 -8.3% 4.5% 4.5% -4.8% 10.2% -4.1% 2.8% 6.6% -4.9% 1.0% 1.1% -10.9% 1.1% 2.5% -0.2% -0.4% $500 $700 $900 $1,100 $1,300 North Waterfront Russian Hill Telegraph Hill Van Ness/Civic Center 2018 2019 2020 2021 2022
60
DISTRICT 9 AVERAGE PRICE PER SQUARE FOOT
4.1% 1.5% 9.5% 11.6% -2.0% -5.7% -12.4% -3.9% 2.8% 0.7% -3.4% -3.2% 1.8% -2.3% -4.2% -0.3% $500 $700 $900 $1,100 $1,300 Bernal Heights Inner Mission Mission Bay Potrero Hill 2018 2019 2020 2021 2022 1.5% 0.6% 2.1% -3.5% -15.9% -1.5% -4.6% -4.3% -1.6% -5.8% 7.5% 2.9% 2.4% 0.3% -3.0% -0.5% $500 $700 $900 $1,100 $1,300 South of Market Yerba Buena South Beach Central Waterfront/Dogpatch 2018 2019 2020 2021 2022
61
PACIFIC HEIGHTS I SOLD DECEMBER 2022
LISTED BY APPLEGARTH+WARRIN

1 9 2 5 G O U G H # 4 1 I $ 4 , 7 5 0 , 0 0 0
62

63
Annual Report on the San Francisco County Housing Market


64
Residentialrealestateactivity in San Francisco County(Districts1-10), composedofsingle-familyproperties,townhomesand condominiums.
Annual Report on the San Francisco County Housing Market

2022 began where 2021 left off: Mortgage rates were near historic lows, buyer competition was fierce, and homes were selling at abreakneckpace, often with multiple bids and all-cash offers, due to pent-up demand and a shortageof housingsupply, causing sales prices to soar to new heights. But all that changed a few months later as mortgage rates began to rise, adding hundreds of dollars to monthly mortgage paymentsand causing housing affordability to plummet toits lowest level in decades. As borrowing costs continuedto increase, homesales and home prices began to slow, and after two years of record-breaking activity, the red-hothousing market was finally cooling.
Sales: Pending sales decreased 26.7 percent, finishing 2022 at 5,569. Sold listings were down 26.5 percent to end the year at 5,617.
Listings: Comparing2022 to the prior year, the number of homes available for sale wasdown by 28.6 percent There were 653 active listings at the endof the year New listings decreased by 11.0 percent to finish the yearat 8,223.
Prices: Home prices were up compared to last year. The overallmediansales price increased 0.8 percent to $1,450,000 forthe year. SingleFamily homeprices were down 0.9 percentcompared to last year,and Condo/ TIC/Coop homeprices were down0.8 percent.
List Price Received: Sellers received, on average, 108.2 percentoftheir listprice atsale, which remained unchanged fromlast year
Homesales continued to decline throughout muchof the year, as affordability challengestook their toll on market participants, forcing many prospective buyers and sellers to the sidelines. To help offset risingcosts,some buyers moved from bigger, more expensive cities to smaller, more affordable areas, while others turned to the rental market, where competition and rental pricessurged. As mortgage rates continued to climb and market conditions shifted, manyhomeowners were reluctant toselltheir homes, and with buyerdemand down, homebuilders eased production, further constrainingan already limited supply of housing.
Lookingahead to 2023, much depends on inflation, mortgage interest rates, and the broader state of the economy, although economists predict manyof 2022’s housingtrends will continue into the new year: home sales will soften, price growth will moderate, inventory will remain tight, and there will be greater variability between markets nationally, with some regions possibly seeing price declines while other, more affordable areas of the country remain in high demand and experience price growth.
Table of Contents 3 Quick Facts 5 PropertyType Review 6 Bedroom Range Review 7 SquareFoot Range Review 8 Price Range Review 9 Area Overviews 10 Area Historical Prices
65
Residentialrealestateactivity in San Francisco County(Districts1-10), composedofsingle-familyproperties,townhomesand condominiums.
Quick Facts
New Listings
Pending Sales
Sold Listings
Active Listings

Top 5 Areas: Change in Pending Sales from 2021 SF District 10 - 15.0% SF District2 - 15.4% SF District1 - 20.7% SF District5 - 21.6% SF District3 - 21.7% Bottom 5 Areas: Change in Pending Sales from 2021 SF District4 - 23.8% SF District6 - 30.8% SF District8 - 31.2% SF District9 - 33.5% SF District7 - 37.9% Top 5 Areas: Change in Sold Listingsfrom 2021 SF District 10 - 15.1% SF District2 - 16.5% SF District1 - 18.4% SF District3 - 19.2% SF District5 - 22.7% Bottom 5 Areas: Change in Sold Listingsfrom 2021 SF District4 - 25.4% SF District6 - 28.7% SF District8 - 30.6% SF District9 - 33.4% SF District7 - 37.3% Top 5 Areas: Change in Active Listingsfrom 2021 SF District2 0.0% SF District 10 - 4.9% SF District3 - 5.6% SF District5 - 13.0% SF District1 - 17.1% Bottom 5 Areas: Change in Active Listingsfrom 2021 SF District4 - 18.5% SF District9 - 31.4% SF District8 - 37.6% SF District7 - 38.7% SF District6 - 54.9% Top 5 Areas: Change in New Listingsfrom 2021 SF District 10 - 2.3% SF District5 - 7.1% SF District1 - 7.3% SF District4 - 8.2% SF District2 - 8.5% Bottom 5 Areas: Change in New Listingsfrom 2021 SF District9 - 10.4% SF District3 - 10.9% SF District8 - 16.6% SF District6 - 19.6% SF District7 - 20.2% 2022 Annual Report on the San Francisco CountyHousing Market
807 770 1,578 914 653 2018 2019 2020 2021 2022 5,690 5,447 5,357 7,646 5,617 2018 2019 2020 2021 2022 5,646 5,470 5,470 7,598 5,569 2018 2019 2020 2021 2022 7,227 7,000 8,761 9,244 8,223 2018 2019 2020 2021 2022
- 3.1% + 25.2% + 5.5%
At theendofthe year. - 11.0% - 3.1% 0.0% + 38.9% - 26.7% - 4.3% - 1.7% + 42.7% - 26.5% - 4.6% + 104.9% - 42.1% - 28.6% 66
2022 Annual Report on the San Francisco CountyHousing Market

Quick Facts
MedianSales Price Average Sales Price
Days on Market Until Sale Percent of List PriceReceived
Bottom 5 Areas: Change in Pct. of ListPrice Received from 2021 SF District6 - 0.2% SF District 10 - 0.6% SF District2 - 2.4% SF District3 - 2.9% SF District4 - 3.3% Top 5 Areas: Change in Pct. of ListPrice Received from 2021 SF District1 + 1.0% SF District5 + 0.9% SF District7 + 0.1% SF District9 + 0.1% SF District8 - 0.1% Top 5 Areas: Change inMedian Sales Price from 2021 SF District 10 + 1.8% SF District5 + 0.7% SF District7 + 0.2% SF District2 - 0.3% SF District9 - 0.5% Top 5 Areas: Change in Avg. Sales Price from 2021 SF District8 + 2.8% SF District 10 + 2.8% SF District1 + 0.7% SF District4 + 0.1% SF District3 + 0.1% Bottom 5 Areas: Change in MedianSales Price from 2021 SF District6 - 1.2% SF District8 - 2.7% SF District1 - 2.8% SF District4 - 3.0% SF District3 - 4.4% Bottom 5 Areas: Change in Avg. Sales Price from 2021 SF District2 - 0.2% SF District9 - 1.1% SF District5 - 1.8% SF District6 - 3.0% SF District7 - 6.5%
$1,330,000 $1,353,000 $1,385,000 $1,438,000 $1,450,000 2018 2019 2020 2021 2022 34 38 37 36 $1,566,076 $1,616,204 $1,636,496 $1,762,183 $1,732,161 2018 2019 2020 2021 2022
+ 1.7% + 2.4% + 3.8%
110.4% + 0.8% + 3.2% + 1.3% + 7.7% - 1.7% 30 + 13.3% + 11.8% - 2.6% - 2.7% 201820192020 2021 2022 Top 5 Areas: Change in Days on Market from 2021 SF District2 + 15.8% SF District 10 + 12.9% SF District1 + 8.7% SF District4 + 8.7% SF District6 + 2.6% Bottom 5 Areas: C on Market from 2021 SF District3 0.0% SF District7 0.0% SF District9 - 4.0% SF District8 - 9.1% SF District5 - 10.3% 108.6% 108.2% 108.2% 104.1% - 1.6% - 4.1% + 3.9% 0.0% 2018 2019 2020 2021 2022 67
Property Type Review

Days on Market Until Sale
MedianSales Price
Percent of List Price Received


Top Areas: Condo/TIC/Coop Market Share in 2022 2022 Annual Report on the San Francisco CountyHousing Market
- 0.9% One-Year Change in Price Single-Family - 0.8% One-Year Change in Price Condo/TIC/Coop 114.4% Pct.of List Price Received Single-Family 103.5% Pct.of List Price Received Condo/TIC/Coop 24 AverageDayson Market Single-Family 44 AverageDayson Market Condo/TIC/Coop 115.7% 112.5% 106.2% 105.3% 107.5% 101.2% 114.7% 114.4% 103.8% 103.5% Single-Family Condo/TIC/Coop $1525K $1551K $1609K $1800K $1784K $1175K $1200K $1190K $1210K $1200K Single-Family Condo/TIC/Coop 2018201920202021 2022 20 25 30 35 40 45 50 55 1-2018 1-2019 1-2020 1-2021 1-2022 Single-Family Condo/TIC/Coop
This chartuses a rolling 12-month average foreachdata point.
2018201920202021 2022 93.7% 89.1% 79.7% 76.7% 60.4% 44.2% 17.5% 14.3% 13.9% 7.1% SF District8 SF District6 SF District9 SF District7 SF District5 SF District1 SF District3 SF District4 SF District 10 SF District2 68
2022 Annual Report on the San Francisco CountyHousing Market

BedroomCount Review
Top Areas: 4 Bedrooms or More Market Share in 2022 Percent of Original List Price Received This chartuses a rolling 12-month average foreachdata point.
106.9% Percentof Original List Price Received in 2022 for All Properties 99.9% Percentof Original List Price Received in 2022 for 2Bedroomsor Less 106.7% Percentof Original List Price Received in 2022 for 3 Bedrooms 110.8% Percentof Original List Price Received in 2022 for 4Bedroomsor More - 29.0% Reduction in Closed Sales 2Bedroomsor Less - 25.7% Reduction in Closed Sales 4Bedroomsor More 1,485 2,642 1,054 2,192 1,967 1,629 2 Bedroomsor Less 3 Bedrooms 4 Bedroomsor More 20212022 116% 114% 112% 110% 108% 106% 104% 102% 100% 98% 96% 1-2018 1-2019 1-2020 1-2021 1-2022 2 Bedroomsor Less 3 Bedrooms 4 Bedroomsor More Closed Sales - 29.0% - 25.5% - 25.7% 43.1% 37.8% 32.3% 29.0% 24.0% 19.9% 12.7% SF District2 SF District4 SF District 10 35.7% SF District5 35.4% SF District3 34.5% SF District1 SF District6 SF District7 SF District9 SF District8 69
2022 Annual Report on the San Francisco CountyHousing Market
Square Foot Range Review

Top Areas: 1,500 or Less Market Share in 2022 - 20.4% Reduction in Closed Sales 1,501- 2,000 - 33.1% Reduction in Closed Sales 2,501or More 105.4% Percentof Original List Price Received in 2022 for 1,500or Less 110.3% Percentof Original List Price Received in 2022 for 1,501- 2,000 110.5% Percentof Original List Price Received in 2022 for 2,001- 2,500 105.5% Percentof Original List Price Received in 2022 for 2,501or More Percent of Original List Price Received This chartuses a rolling 12-month average foreachdata point.
1,357 714 813 2,962 1,080 553 544 1,500or Less 1,501 - 2,000 2,001 - 2,500 2,501or More 20212022 Closed Sales 4,004 116% 114% 112% 110% 108% 106% 104% 102% 100% 98% 96% 94% 1-2018 1-2019 1-2020 1-2021 1-2022 1,500or Less 1,501 - 2,000 2,001 - 2,500 2,501or More - 26.0% - 20.4% - 22.5% - 33.1% 67.6% 61.8% 56.0% 54.9% 46.6% 38.5% 37.0% 35.4% 35.4% 32.3% SF District9 SF District8 SF District6 SF District 10 SF District3 SF District5 SF District2 SF District7 SF District4 SF District1 70
Price Range Review

Closed Sales by Price Range

$1,098,000 or More Price Range with the MostClosed Sales + 6.0% Price Range with Strongest One-Year Change in Sales: $564,999or Less $564,999 or Less Price Range with the Fewest Closed Sales - 31.3% Price Range with Weakest One-Year Change in Sales: $565,000 to $758,999 2022 Annual Report on the San Francisco CountyHousing Market
$1,098,000 or More $564,999 or Less Price Range with Shortest Average Market Time Price Range with Longest Average Market Time Days on Market Until Sale by Price Range 9.3% - 21.8% ofHomesfor Sale at Year End Priced $564,999or Less One-Year Change in Homes for Sale Priced $564,999or Less Share of Homes for Sale $564,999 or Less 101 58 42 29 $564,999or Less $565,000 to $758,999 $759,000 to $1,097,999 $1,098,000 or More 111 1,086 3,824 518 1,466 201213 334 356 5,461 1,015 4,033 $564,999 or Less $565,000 to $758,999 $759,000 to $1,097,999 $1,098,000 or More 20202021 2022
0% 1% 2% 3% 5% 4% 6% 8% 7% 9% 10% 1-2018 1-2019 1-2020 1-2021 1-2022 71
2022 Annual Report on the San Francisco CountyHousing Market
Area Overviews

SF District 1 378 - 18.4% 55.3% 44.2% 0.9 25 111.4% SF District 2 518 - 16.5% 92.3% 7.1% 0.7 22 119.3% SF District 3 206 - 19.2% 79.6% 17.5% 1.0 28 110.1% SF District 4 384 - 25.4% 84.9% 14.3% 0.7 25 110.8% SF District 5 903 - 22.7% 38.6% 60.4% 0.9 26 109.3% SF District 6 403 - 28.7% 10.7% 89.1% 1.0 39 104.6% SF District 7 417 - 37.3% 23.0% 76.7% 1.1 38 101.6% SF District 8 557 - 30.6% 5.2% 93.7% 2.3 50 99.0% SF District 9 1,274 - 33.4% 19.4% 79.7% 2.2 48 101.5% SF District 10 577 - 15.1% 81.5% 13.9% 1.6 35 110.4% Total Closed Sales Change from 2021 Percent Single-Family Percent Condo/TIC/Coop Months Supply of Inventory Days on Market Pct. of Orig. Price Received
72
2022 Annual Report on the San Francisco CountyHousing Market Area Historical Median Prices

Change Change 2018 2019 2020 2021 2022 From 2021 From 2018 SF District 1 SF District 2 $1,650,000$1,627,500$1,700,000$1,800,888$1,750,000 $1,415,000$1,452,500$1,490,000$1,660,000$1,655,000 - 2.8% + 6.1% - 0.3% + 17.0% SF District 3 SF District 4 $1,180,000$1,175,000$1,200,000$1,360,000$1,300,000 $1,625,000$1,600,000$1,681,224$1,856,200$1,800,006 - 4.4% + 10.2% - 3.0% + 10.8% SF District 5 SF District 6 $1,665,000$1,730,000$1,665,000$1,750,000$1,762,500 $1,262,500$1,285,000$1,279,000$1,315,316$1,300,000 + 0.7% + 5.9% - 1.2% + 3.0% SF District 7 SF District 8 $1,825,000$2,000,000$1,920,000$2,095,000$2,100,000 $1,110,000$1,072,500$1,077,500$1,130,000$1,100,000 + 0.2% + 15.1% - 2.7% - 0.9% SF District 9 SF District 10 $1,217,500$1,250,000$1,206,000$1,206,500$1,200,000 $975,000$1,040,000$1,070,000$1,120,000$1,140,000 - 0.5% - 1.4% + 1.8% + 16.9%
73
COLE VALLEY I SOLD MAY 2022
BUYER REPRESENTED
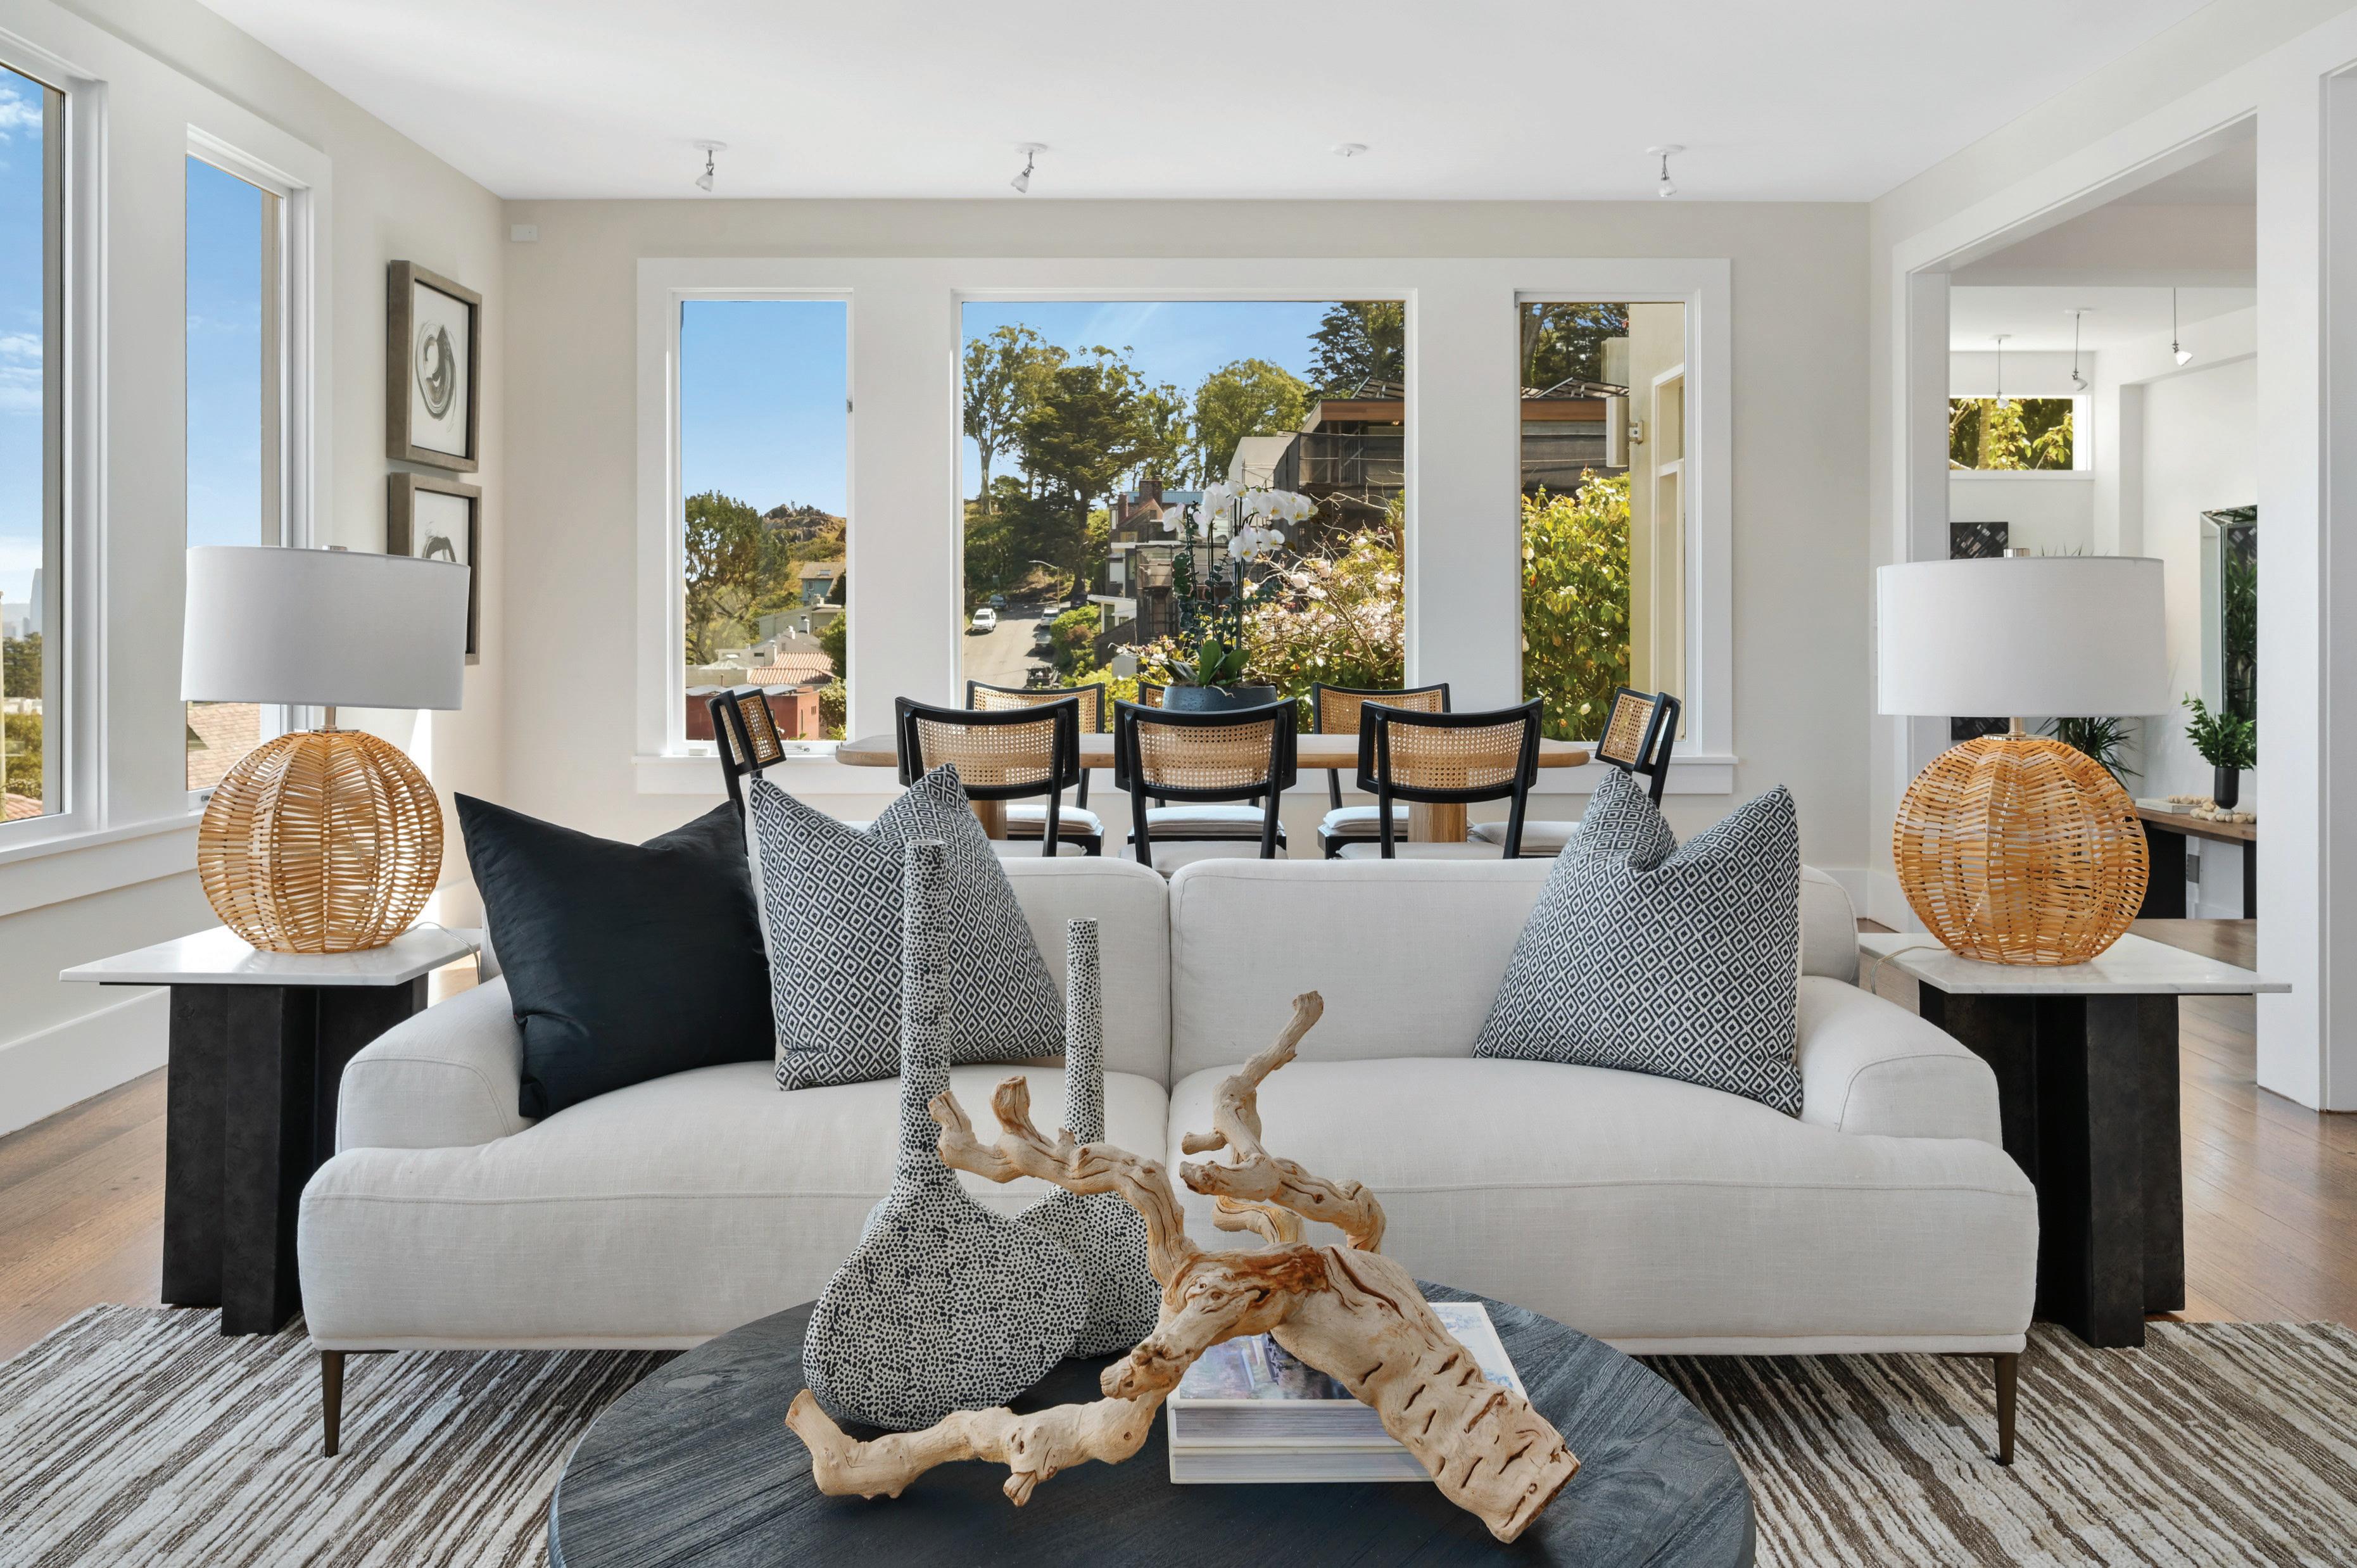
1 2 5 B E L G R A V E I $ 5 , 5 0 5 , 0 0 0
74

75
GOLDEN GATE SOTHEBY’S INTERNATIONAL REALTY
LOCAL KNOWLEDGE CONNECTED AROUND THE BAY AND THE WORLD
Our brokerage is the numberone Sotheby’s International Affiliate in Northern California. We can help you find your buyer. We have more than 500agents in 22offices representing active qualified buyers and sellers throughout the San Francisco Bay Area. We service the counties of:

•Alameda
•Contra Costa
•Marin
•Napa
•San Francisco
•San Mateo
•Santa Clara
•Solano
•Sonoma
•Santa Cruz
1# 76
WORLD’S LARGEST REFERRAL NETWORK



WE CAN FIND QUALIFIED BUYERS AROUND THE GLOBE BY ACTIVATING OUR WORLDWIDE AGENT NETWORK



25,000 SALES ASSOCIATES

1,000+ OFFICES

77 COUNTRIES
ALL WORKING FOR YOU
SOTHEBY'S INTERNATIONAL REALTY WORLDWIDE REACH


The Sotheby’s International Realty brand is a collection of the finest real estate companies in the world. Today our network boasts more than 25,000 affiliated independent sales associates, located in over 1,000 offices, in 77 countries and territories worldwide, placing over 15,000 referrals every year

Global Marketing | Worldwide Network
77
A+W SAN FRANCISCO FEATURED PROPERTIES


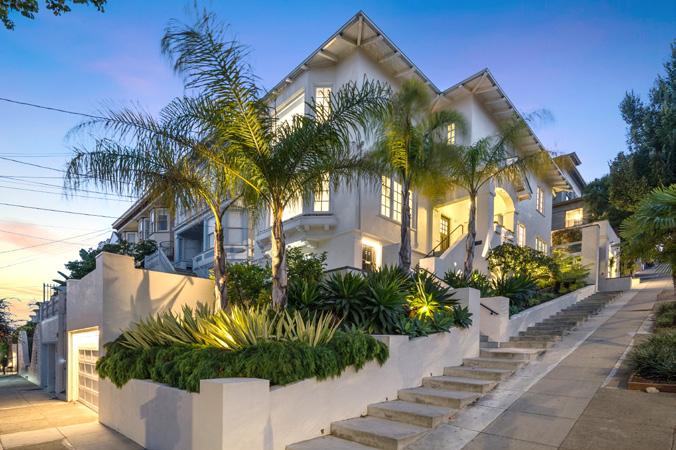
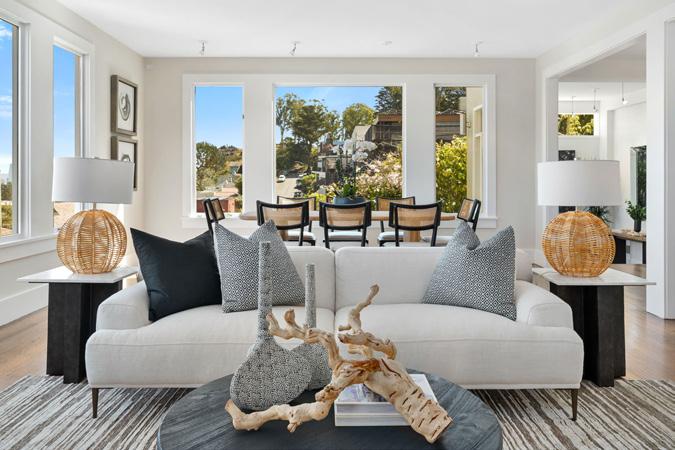


FAST FACT : The Applegarth + Warrin Team sold over $120 Million in 2022.

SOLD NOE VALLEY Represented Buyer $5,650,000 SOLD COLE VALLEY Represented Buyer $5,505,000
SOLD MARINA Sold Off Market $2,975,000 SOLD LAKE DISTRICT Represented Buyer $4,205,000 FOR SALE COW HOLLOW Iconic Cow Hollow Home $6,150,000 SOLD NOE VALLEY Sold Over Asking $6,250,000 SOLD NOE VALLEY Represented Buyer $5,800,000 SOLD PACIFIC HEIGHTS Pinnacle of Pacific Heights $4,750,000 SOLD NOE VALLEY Represented Buyer $4,712,500
78


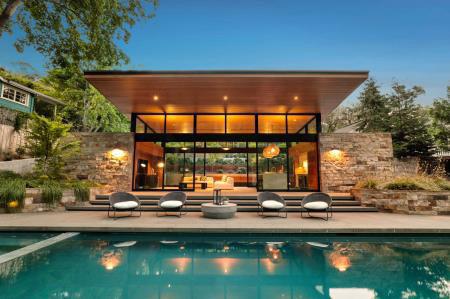
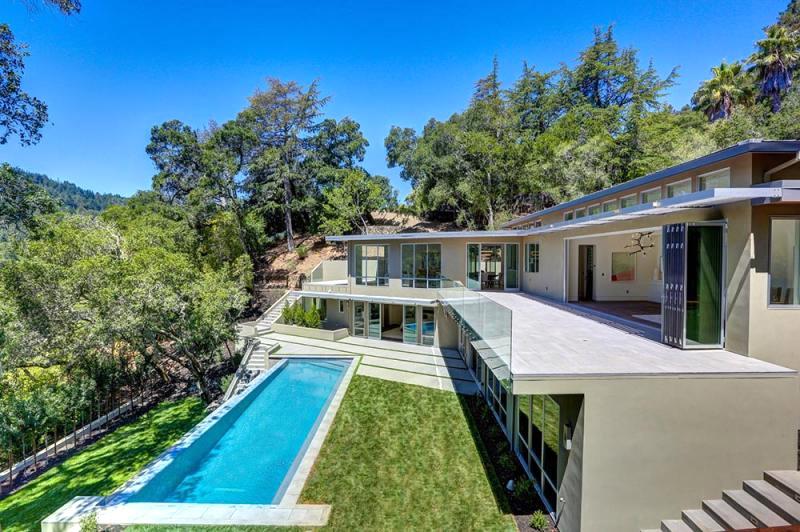
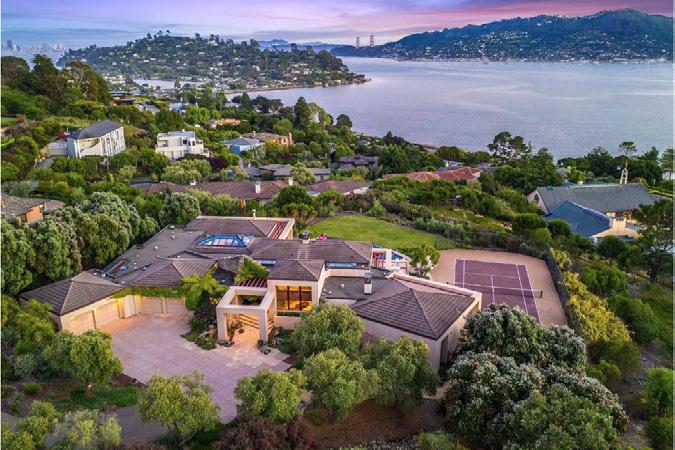
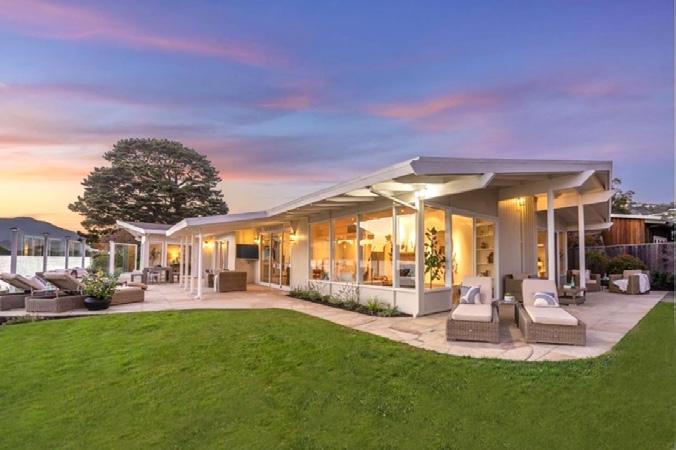
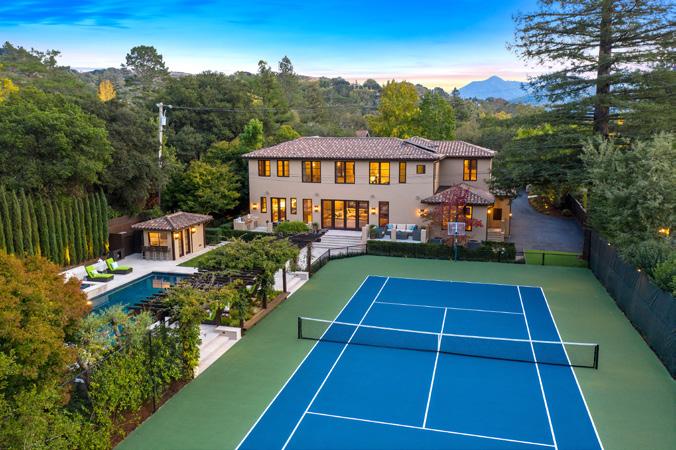
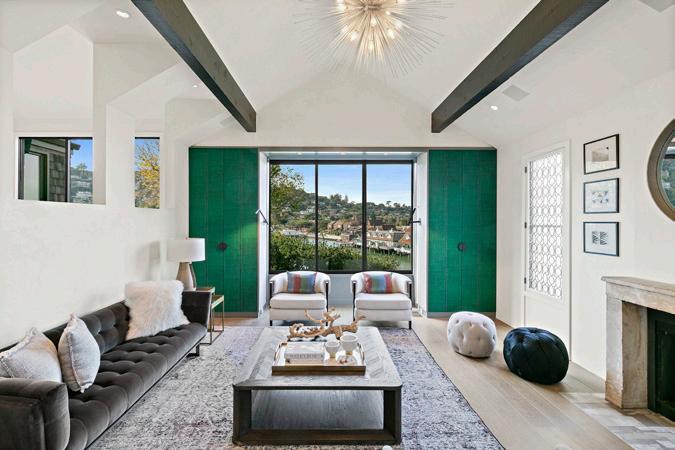

SOLD SAN ANSELMO Resort Like Estate $6,750,000 SOLD TIBURON Sweeping Views Home $8,000,000 SOLD BELVEDERE Corinthian Island Stunner $5,050,000 SOLD KENTFIELD Represented Buyer $8,000,000 SOLD BELVEDERE Represented Buyer $6,800,000 SOLD BELVEDERE Represented Buyer $11,750,000 SOLD MILL VALLEY DesignerMill Valley Home $7,050,000 SOLD TIBURON Represented Buyer $12,175,000 SOLD OFF MARKET MILL VALLEY Represented Buyer $6,800,000
79
A+W MARIN FEATURED PROPERTIES

1 2 5 0 L E A V E N W O R T H I $ 2 , 4 5 0 , 0 0 0
BUYER
80
NOB HILL I SOLD FEB 2022
REPRESENTED

81


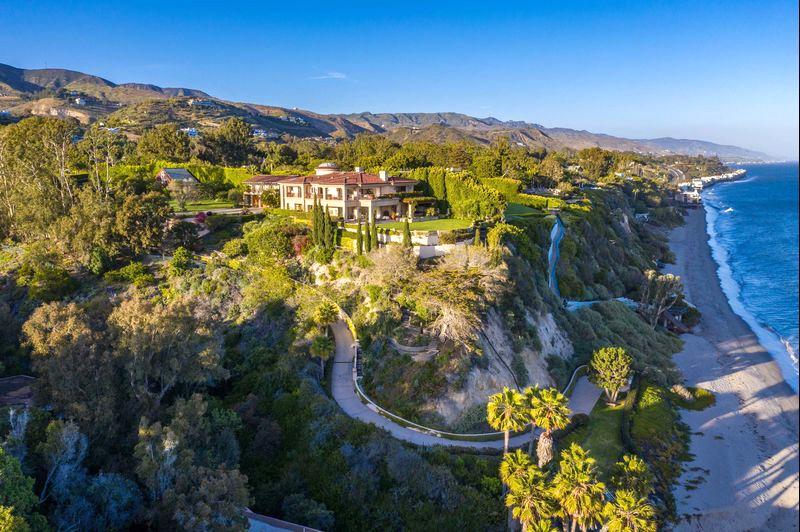
$1 73,000
HOLMBY
$ 145,000 ,000 944
$ 141,000 ,000
$1 01,00 0,000
220 CENTRAL PARK S PH. Midtown, Manhattan SoldOffMarket $ 100,00 0,000
$1
90,000
,000 2000 S OCEAN BLVD Manalapan, FL SoldOffMarket
,000
HILLS MANSION Los Angeles, CA
AIROLE WAY Los Angeles, CA ListedbyCompass
4 EAST 66 th St. Upper East Side, Manhattan ListedbyDouglasEllimanRealty
27628
PACIFIC HWY Malibu, CA ListedbyColdwellBanker
82
BIGGEST HOME SALES IN THE U.S. 2022
SIGNIFICANT SALES


2022 HIGHLIGHTS
83


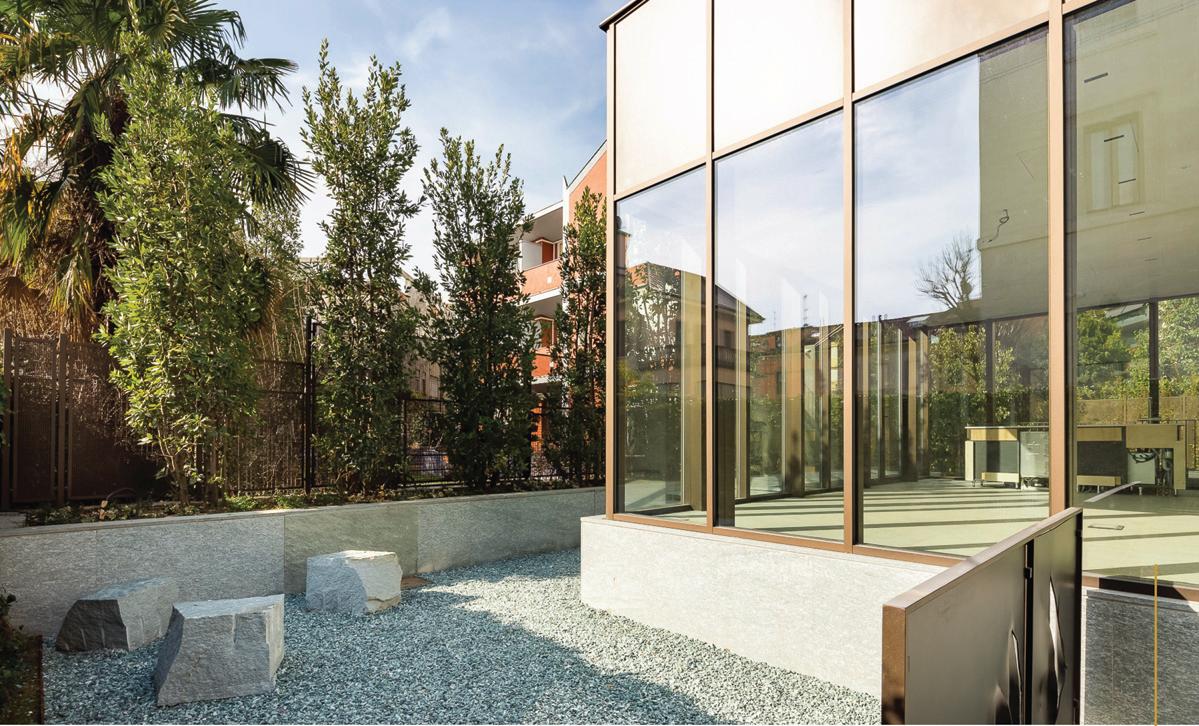

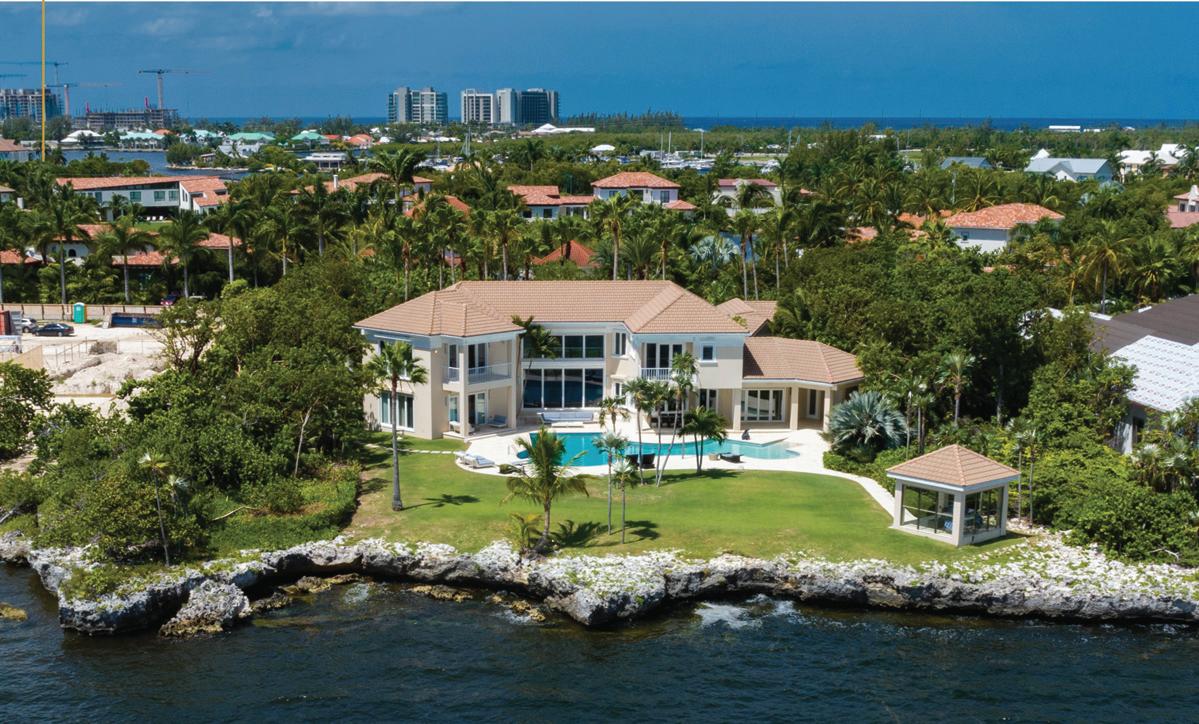

84






85



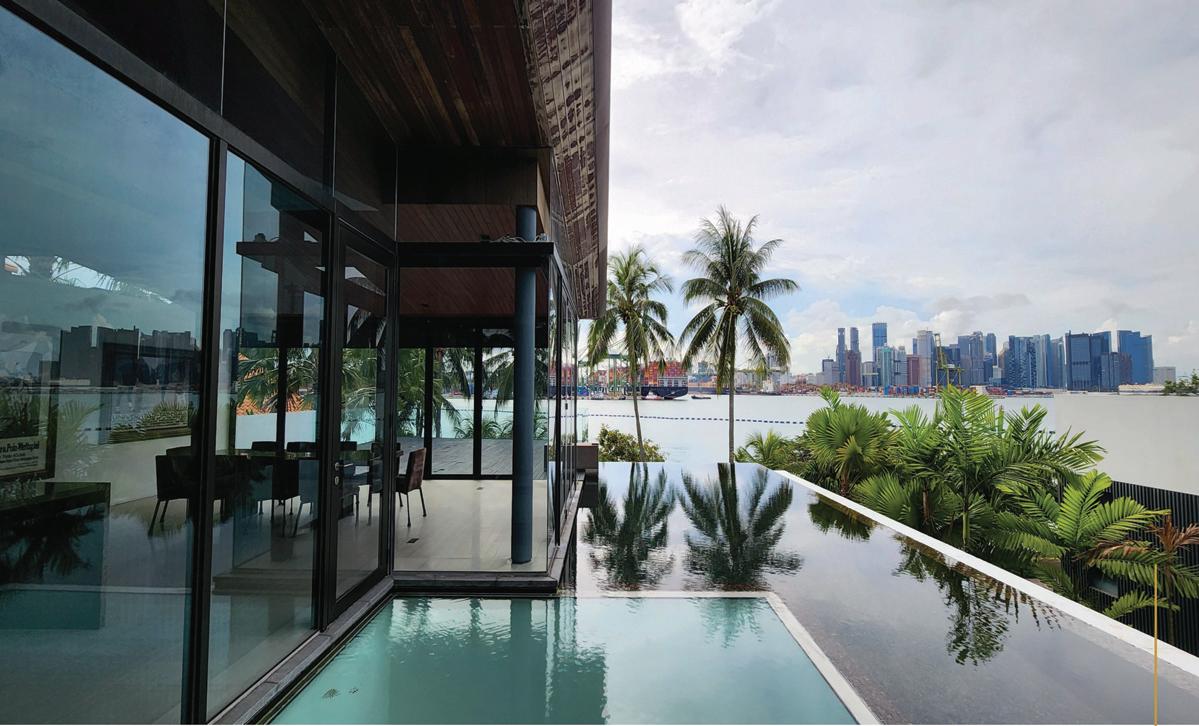

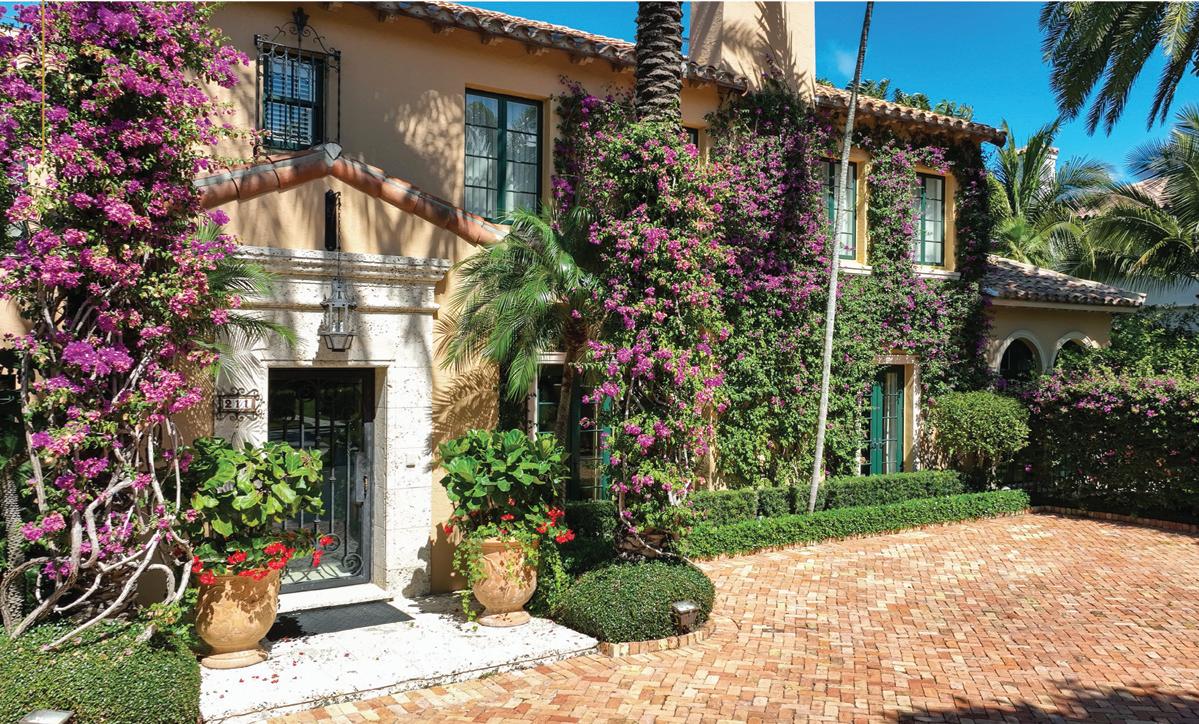

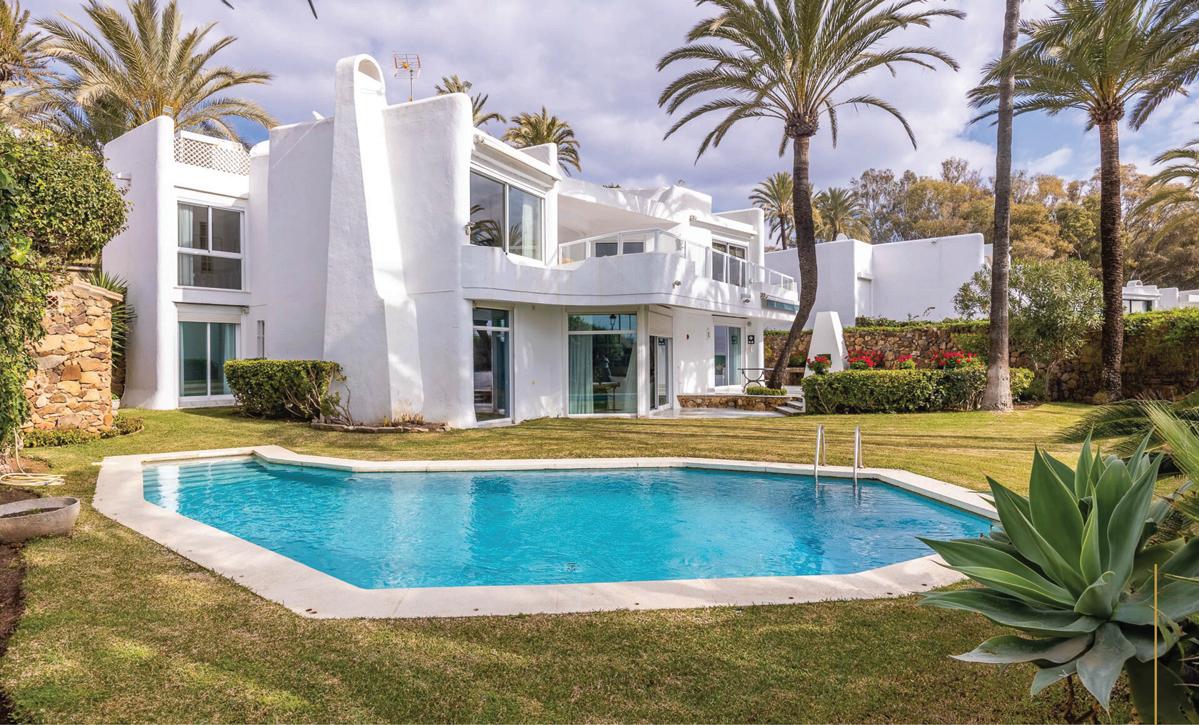
86


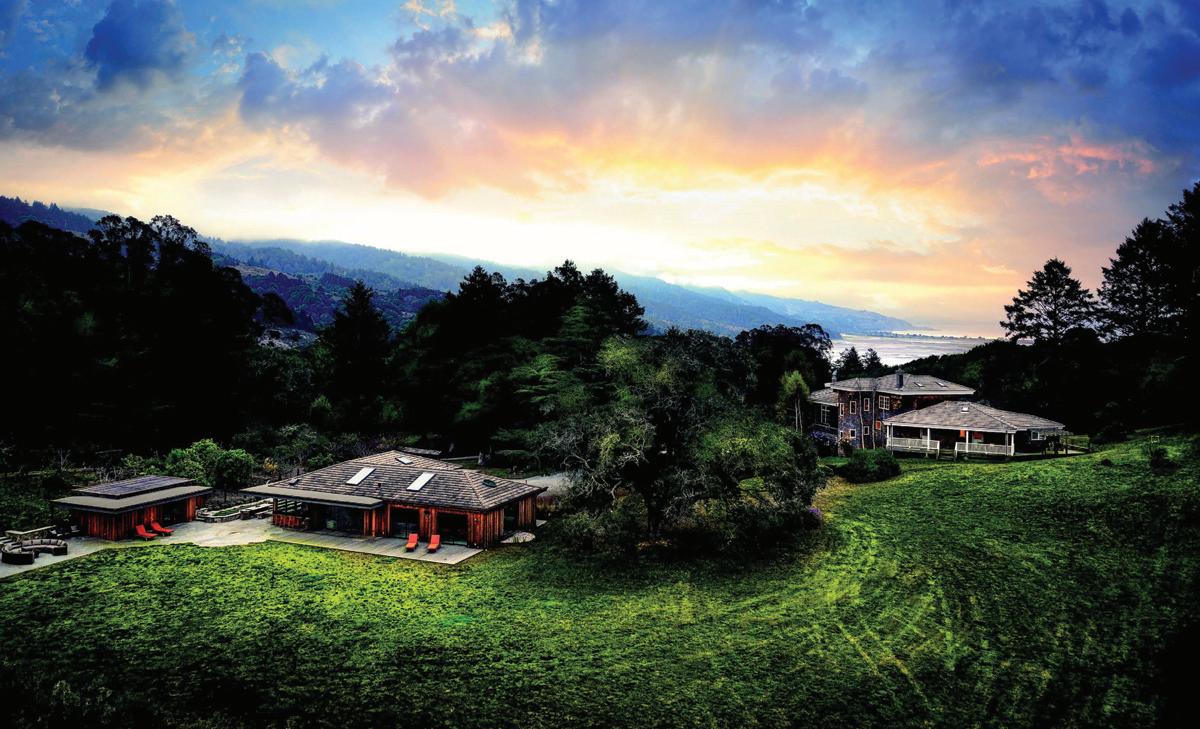


87




88
27401 Edgerton, Los Altos


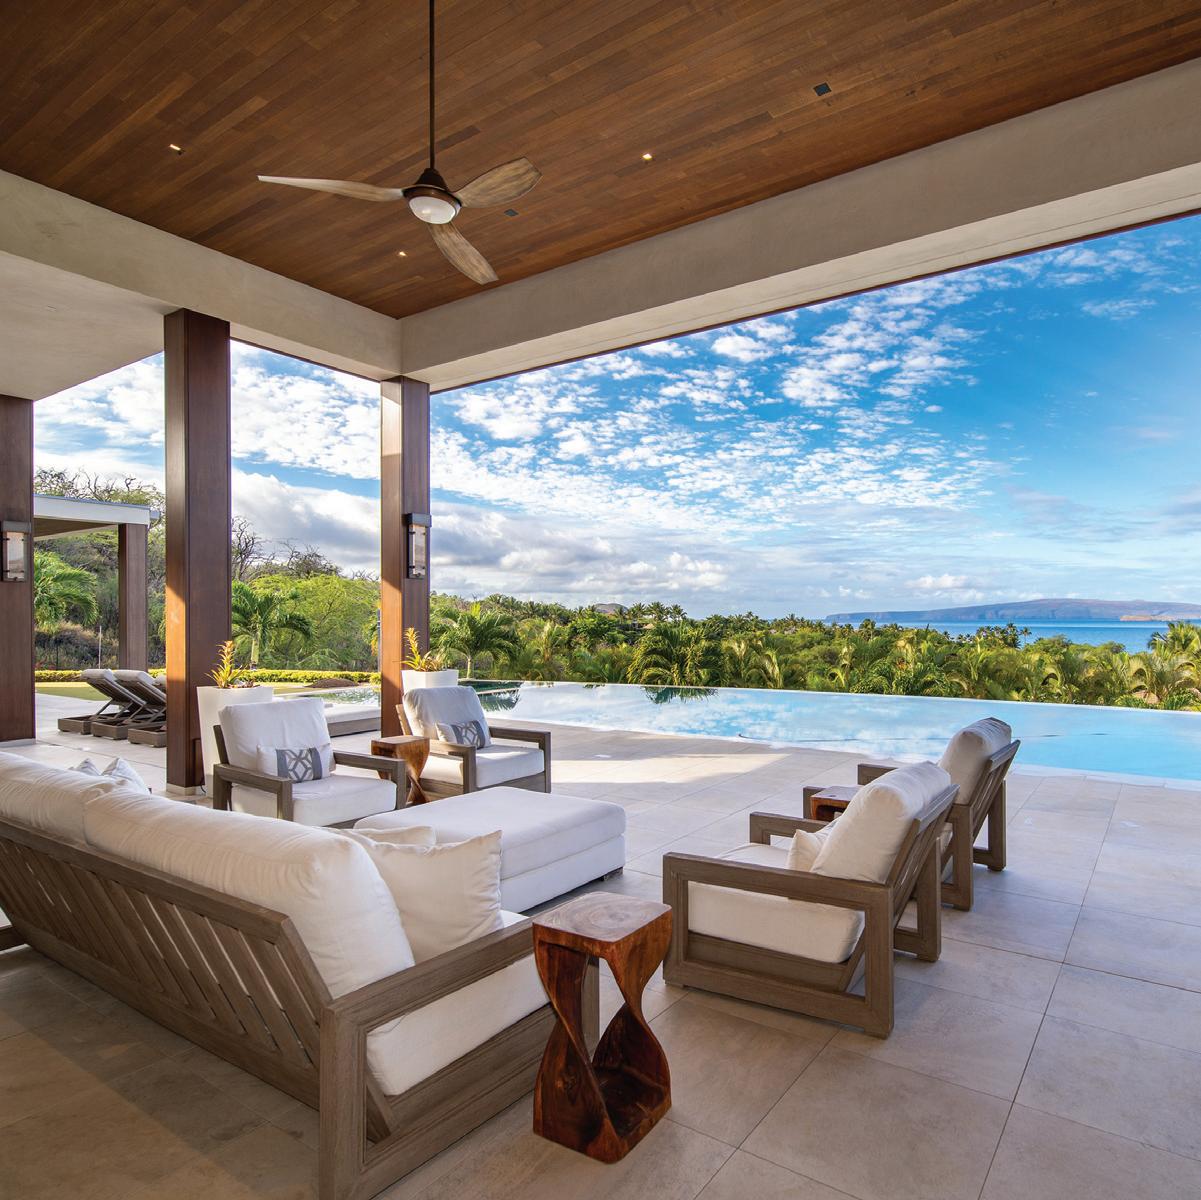


89
APPLEGARTH + WARRIN

90
MEET SF’S FAVORIT E TEAM
PAUL WARRIN
Paul is consistently ranked top 1% nationwide. He is a 4th generation San Franciscan, with unrivaled local market knowledge.
415.407.8019
paul@applegarthwarrin.com
Lic. 01364693
KARA WARRIN
With an impeccable eye and background in design, Kara is uniquely qualified to guide clients through the process of home transformation, buying and selling.
415.407.7979
kara@applegarthwarrin.com
Lic. 01882747
MAX APPLEGARTH
Max is a 4th generation San Francisco native, ranked in the top 1% of Realtors, and holds the International President’s Premier Top Producer designation.


415.298.7600
max@applegarthwarrin.com
Lic. 01423191
SKYE ADDICKS
Skye is a 7th generation San Francisco native. Coming from an extensive design background, she has a unique ability to identify hidden opportunities.
415.717.6036
skye@applegarthwarrin.com Lic. 02137351
CLAIRE BAYLES
Raised in Tiburon, Claire has an innate understanding of Marin County life. She offers an array of design and development expertise.
415.218.0535
claire@applegarthwarrin.com Lic. 02061042
HOLLY KHOUW
Holly is originally from the East Coast and has extensive experience in Marketing along with well-rounded knowledge for all that Marin and San Francisco offer.


415.444.6403
holly@applegarthwarrin.com
Lic. 01478076
91
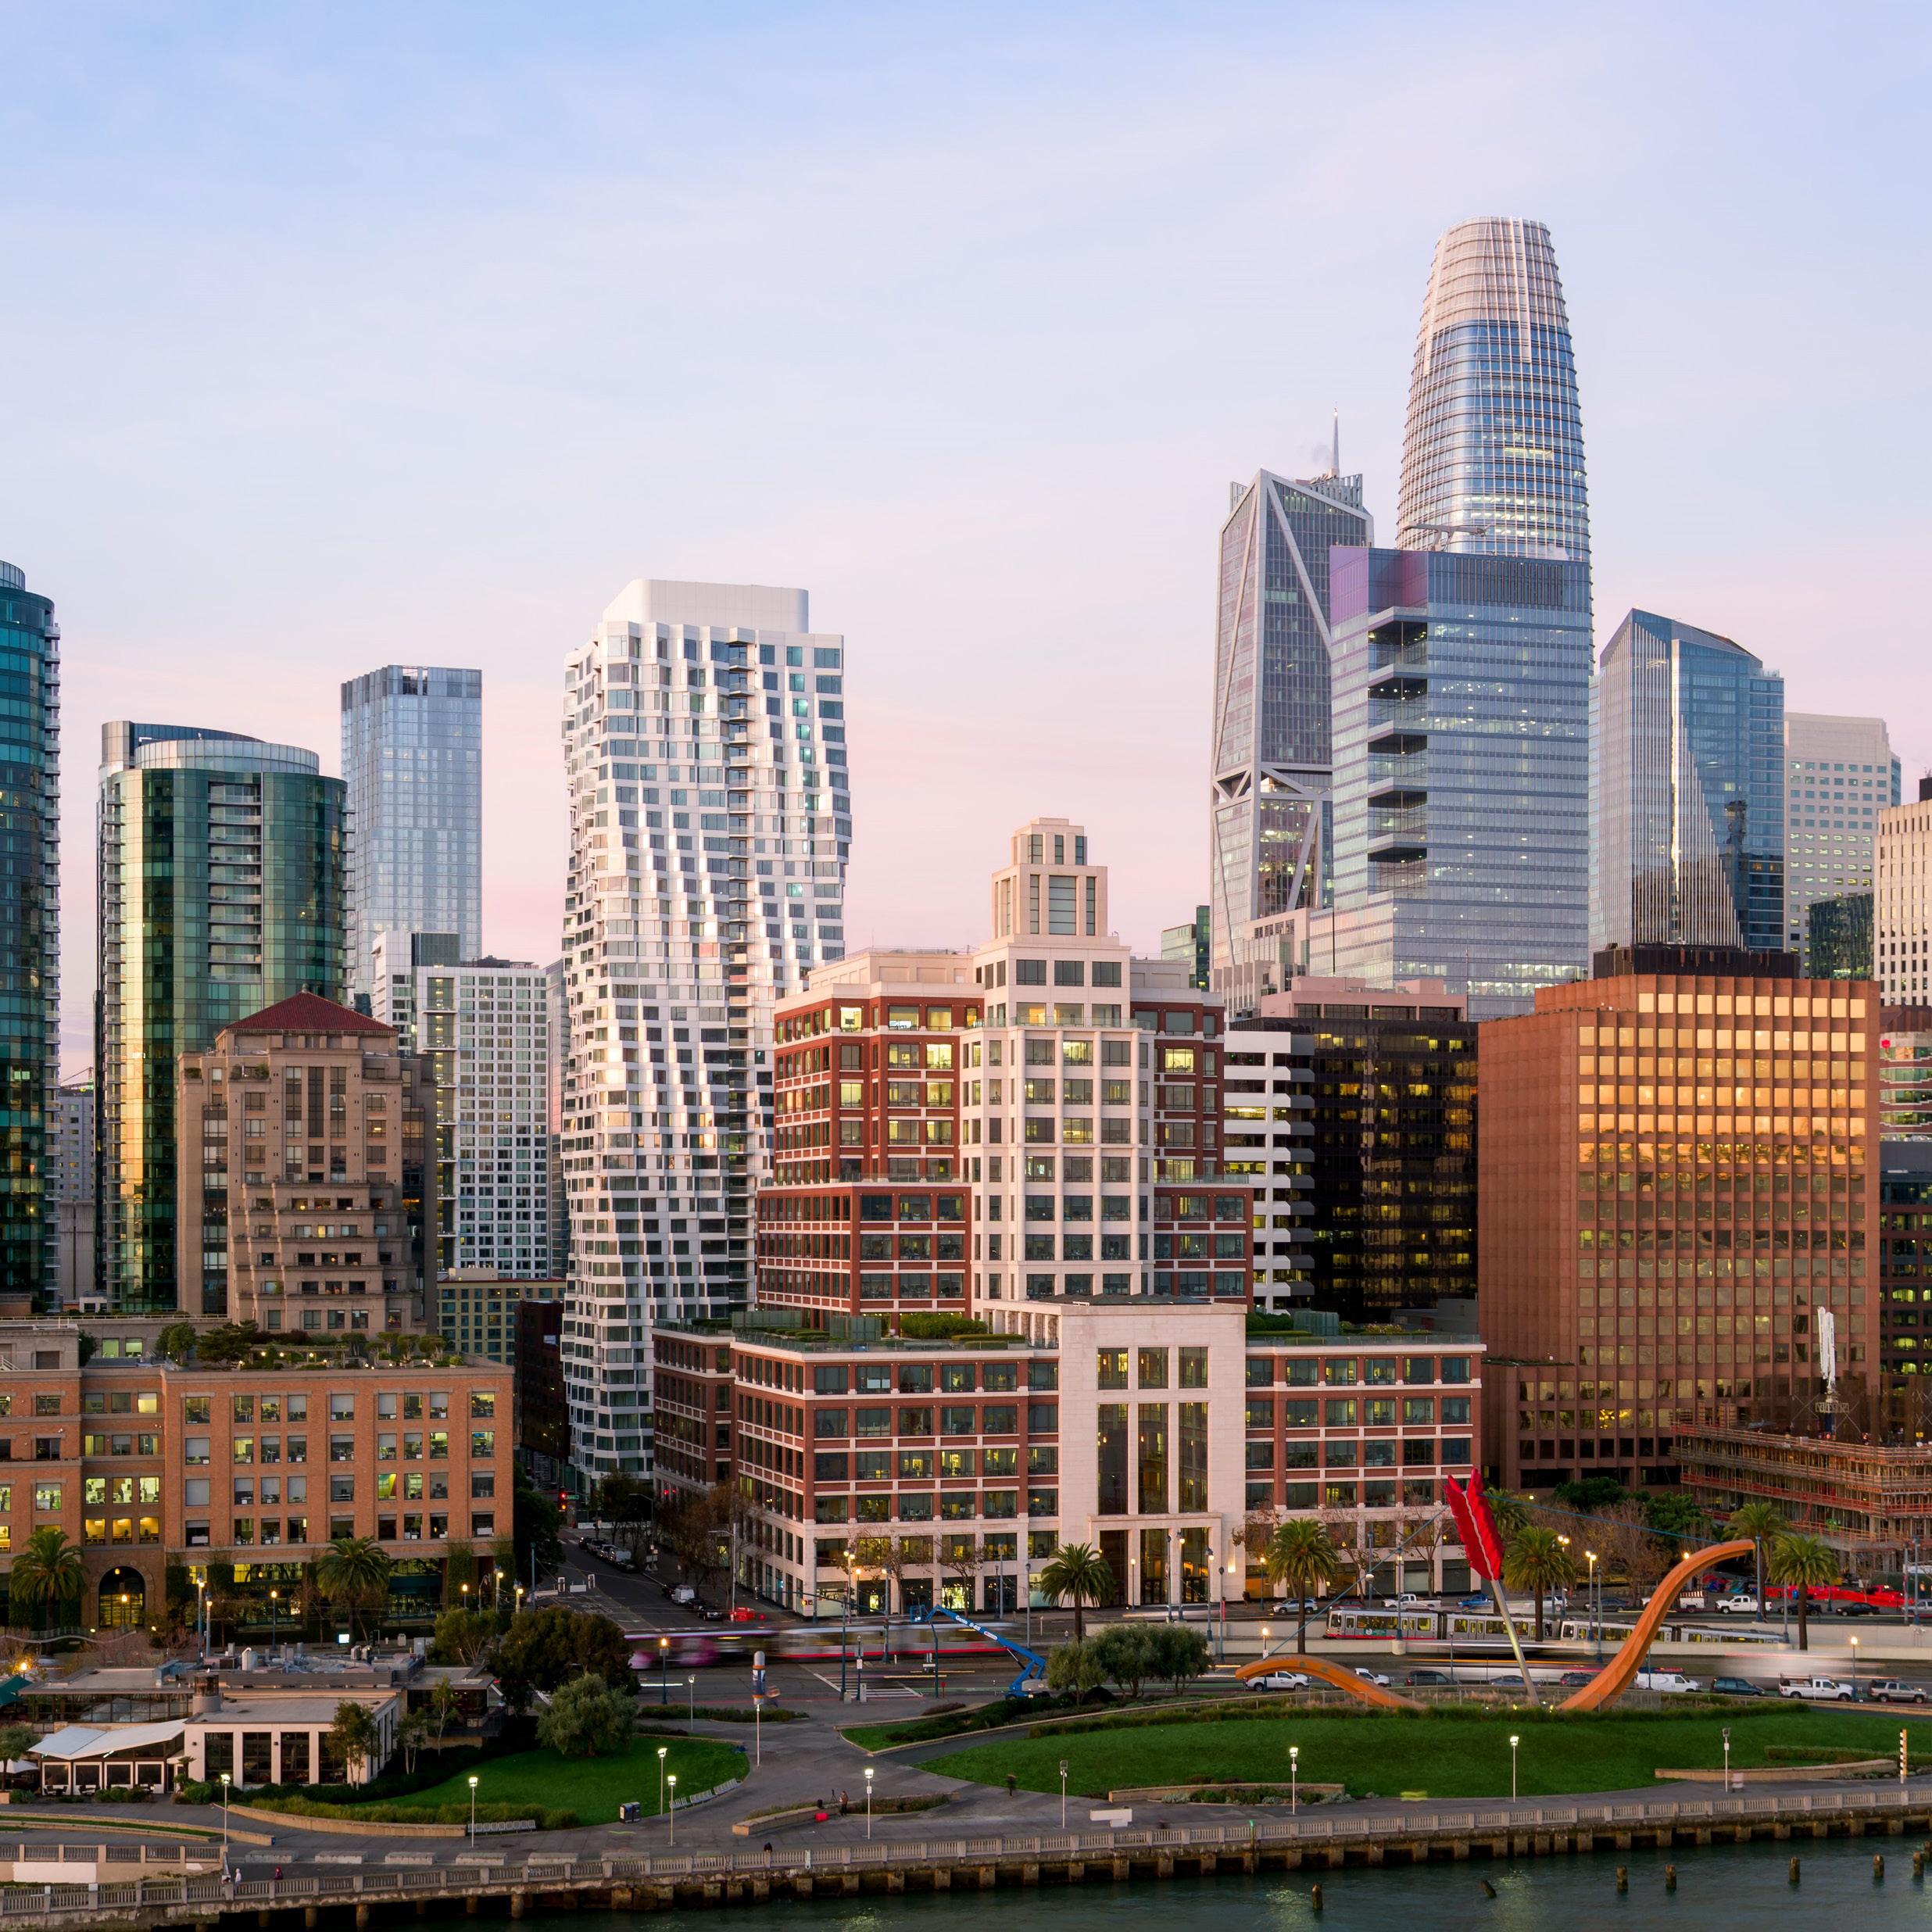
415.299.8999 team@applegarthwarrin.com O V E R $ 2 B I L L I O N I N S A L E S APPLEGARTHWARRIN.COM


