
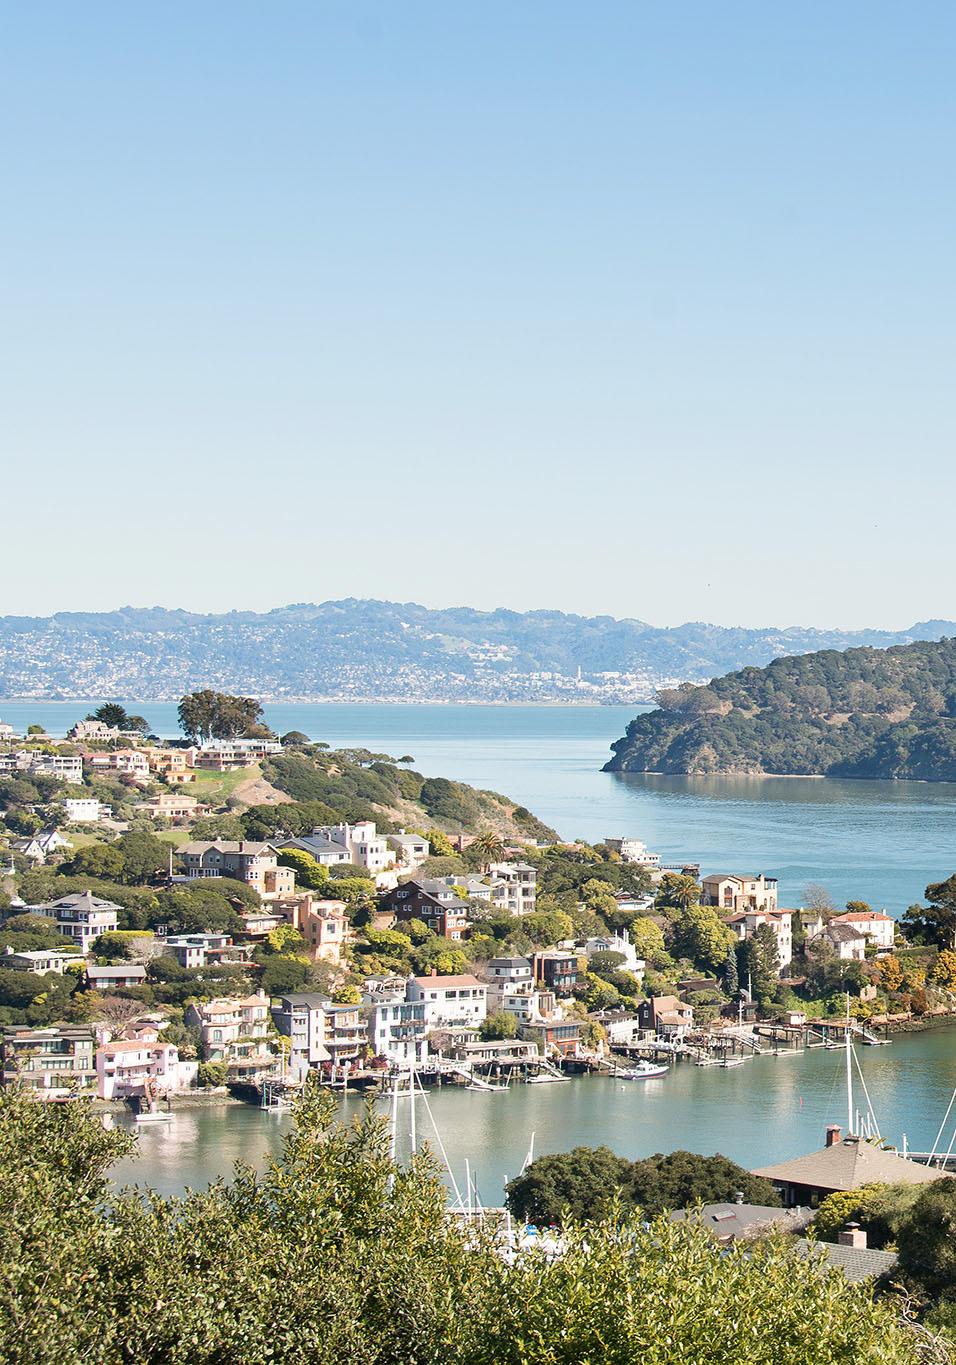
APPLEGARTHWARRIN.COM 2023
REAL ESTATE MARKET REPORT MARIN
Our Brand Heritage
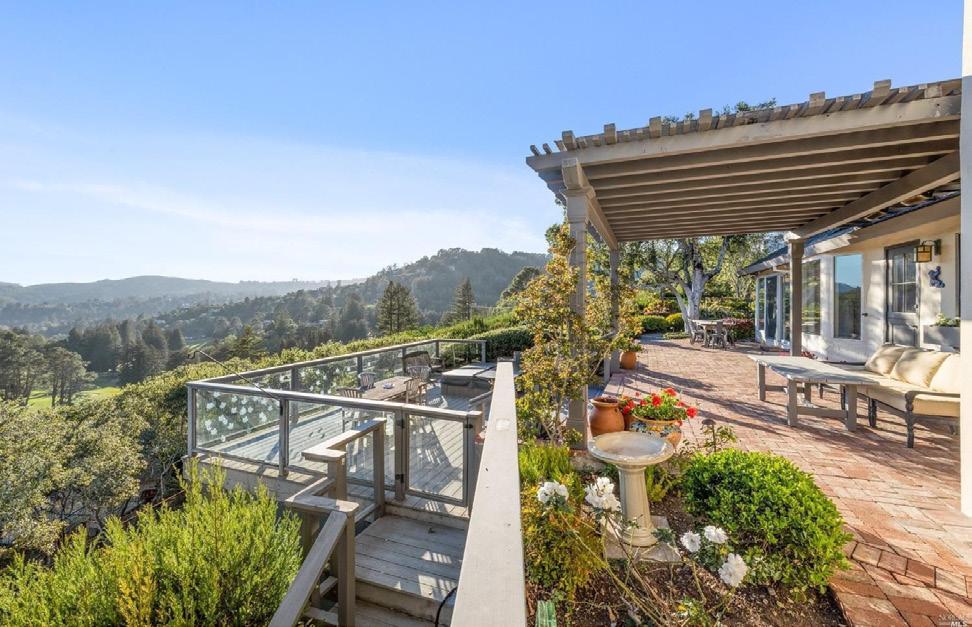
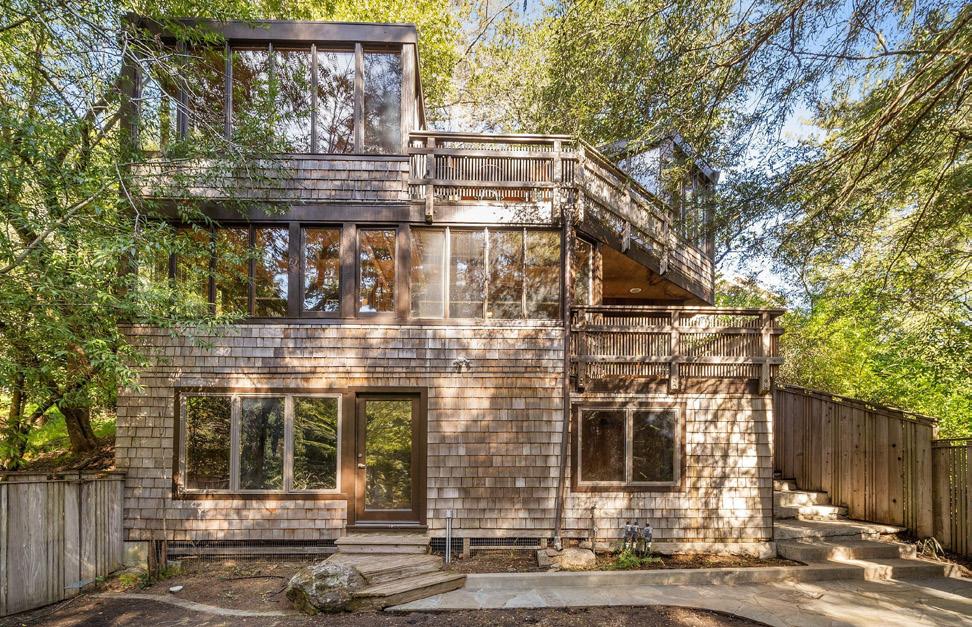
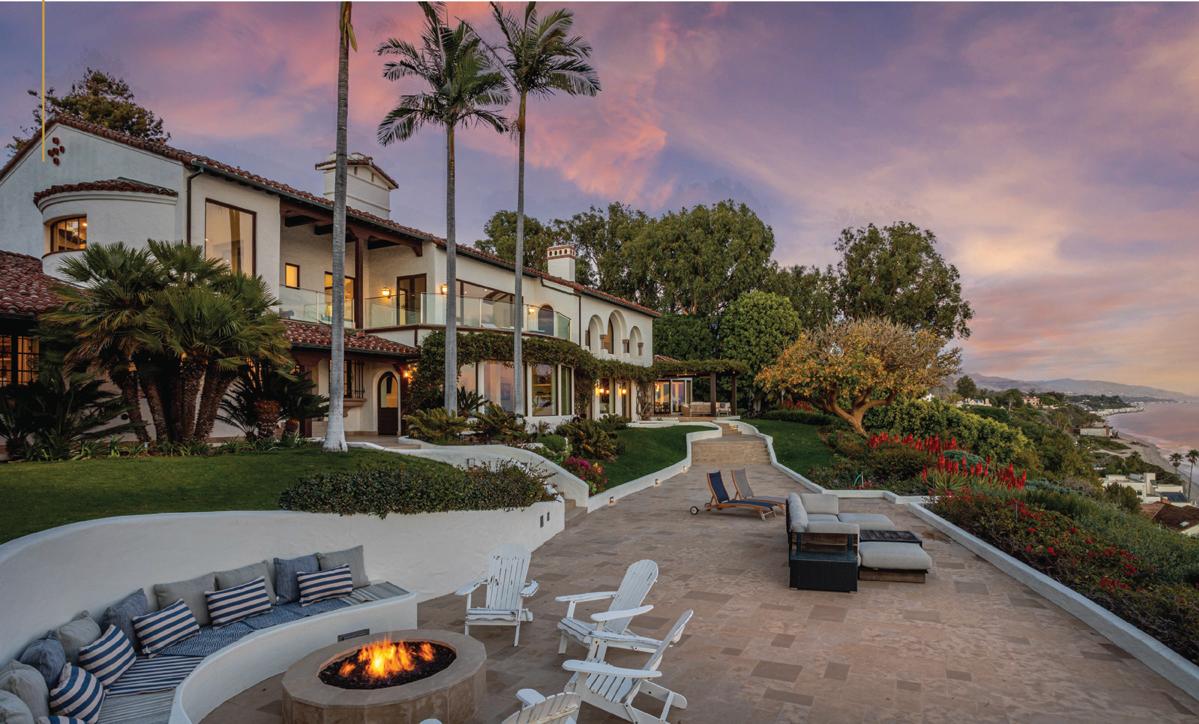
A+W Featured Properties
Bay Area Sales Summary
Luxury Market Sales Summary
Highest Priced Home Sales
SFH Sales Over $2.5M
Biggest Overbids 2022
Stats by Town
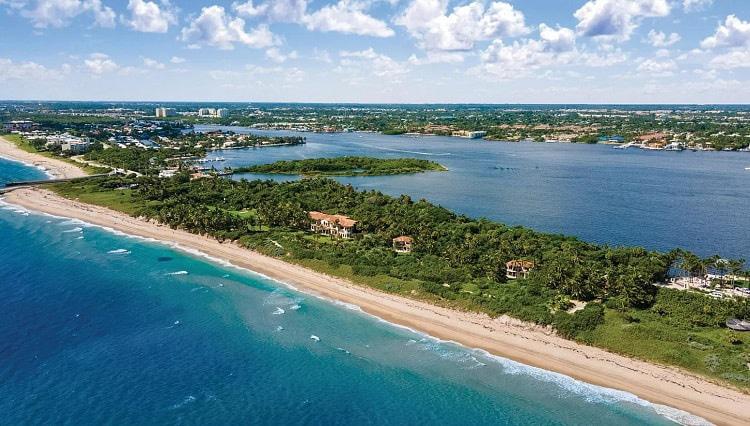
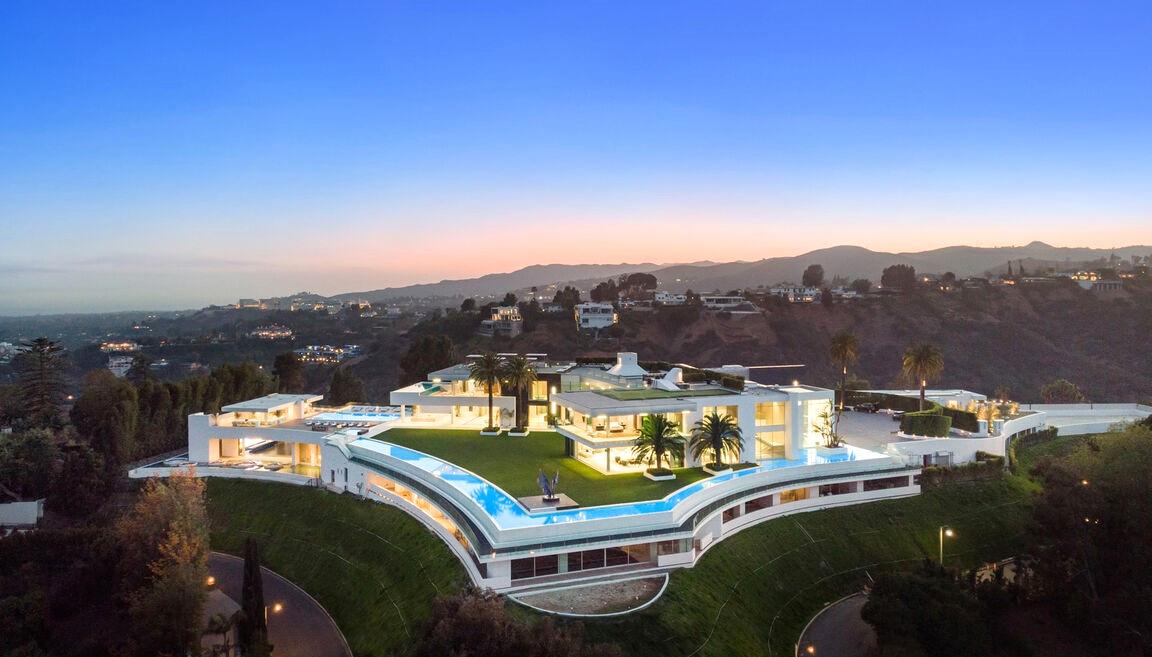
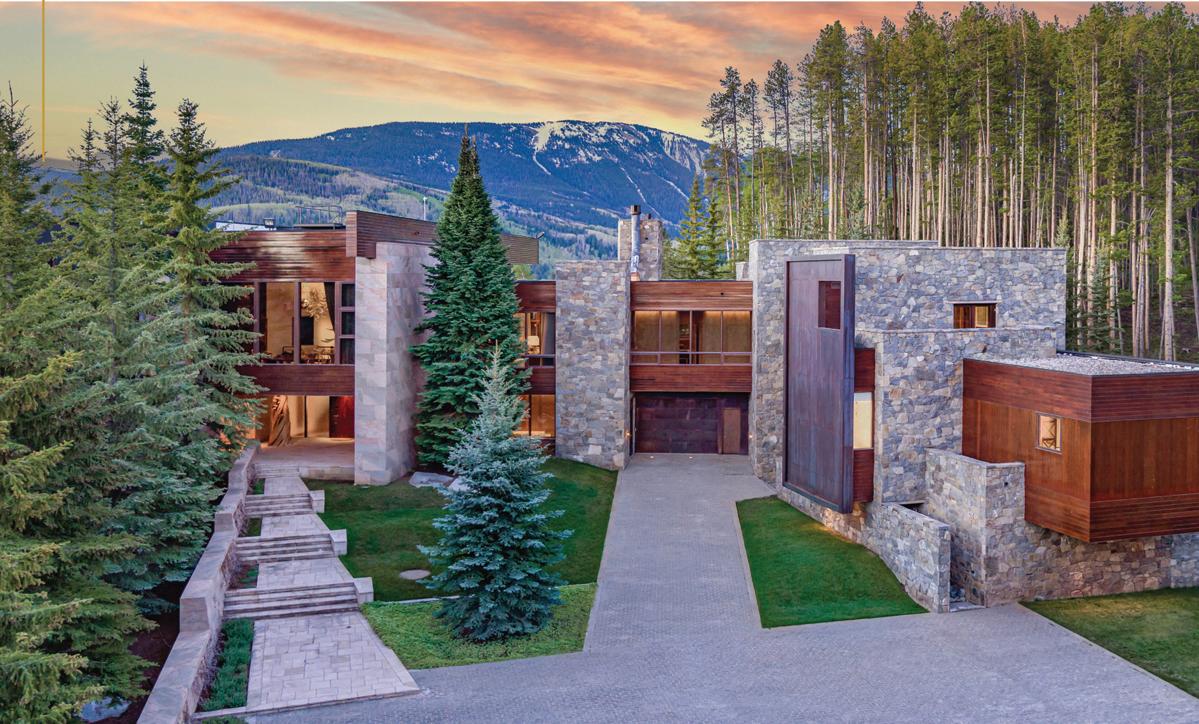
U.S. Biggest Home Sales 2022
Sotheby’s Significant Sales
4 5 8 12 22 28 30 46 50 62 64 73
Power of the Brand
Meet the Team
The A+W team is pleased to present you with our annual report on the Marin real estate market.
Low inventory and high buyer demand continued to dictate the market in Marin. For the year:
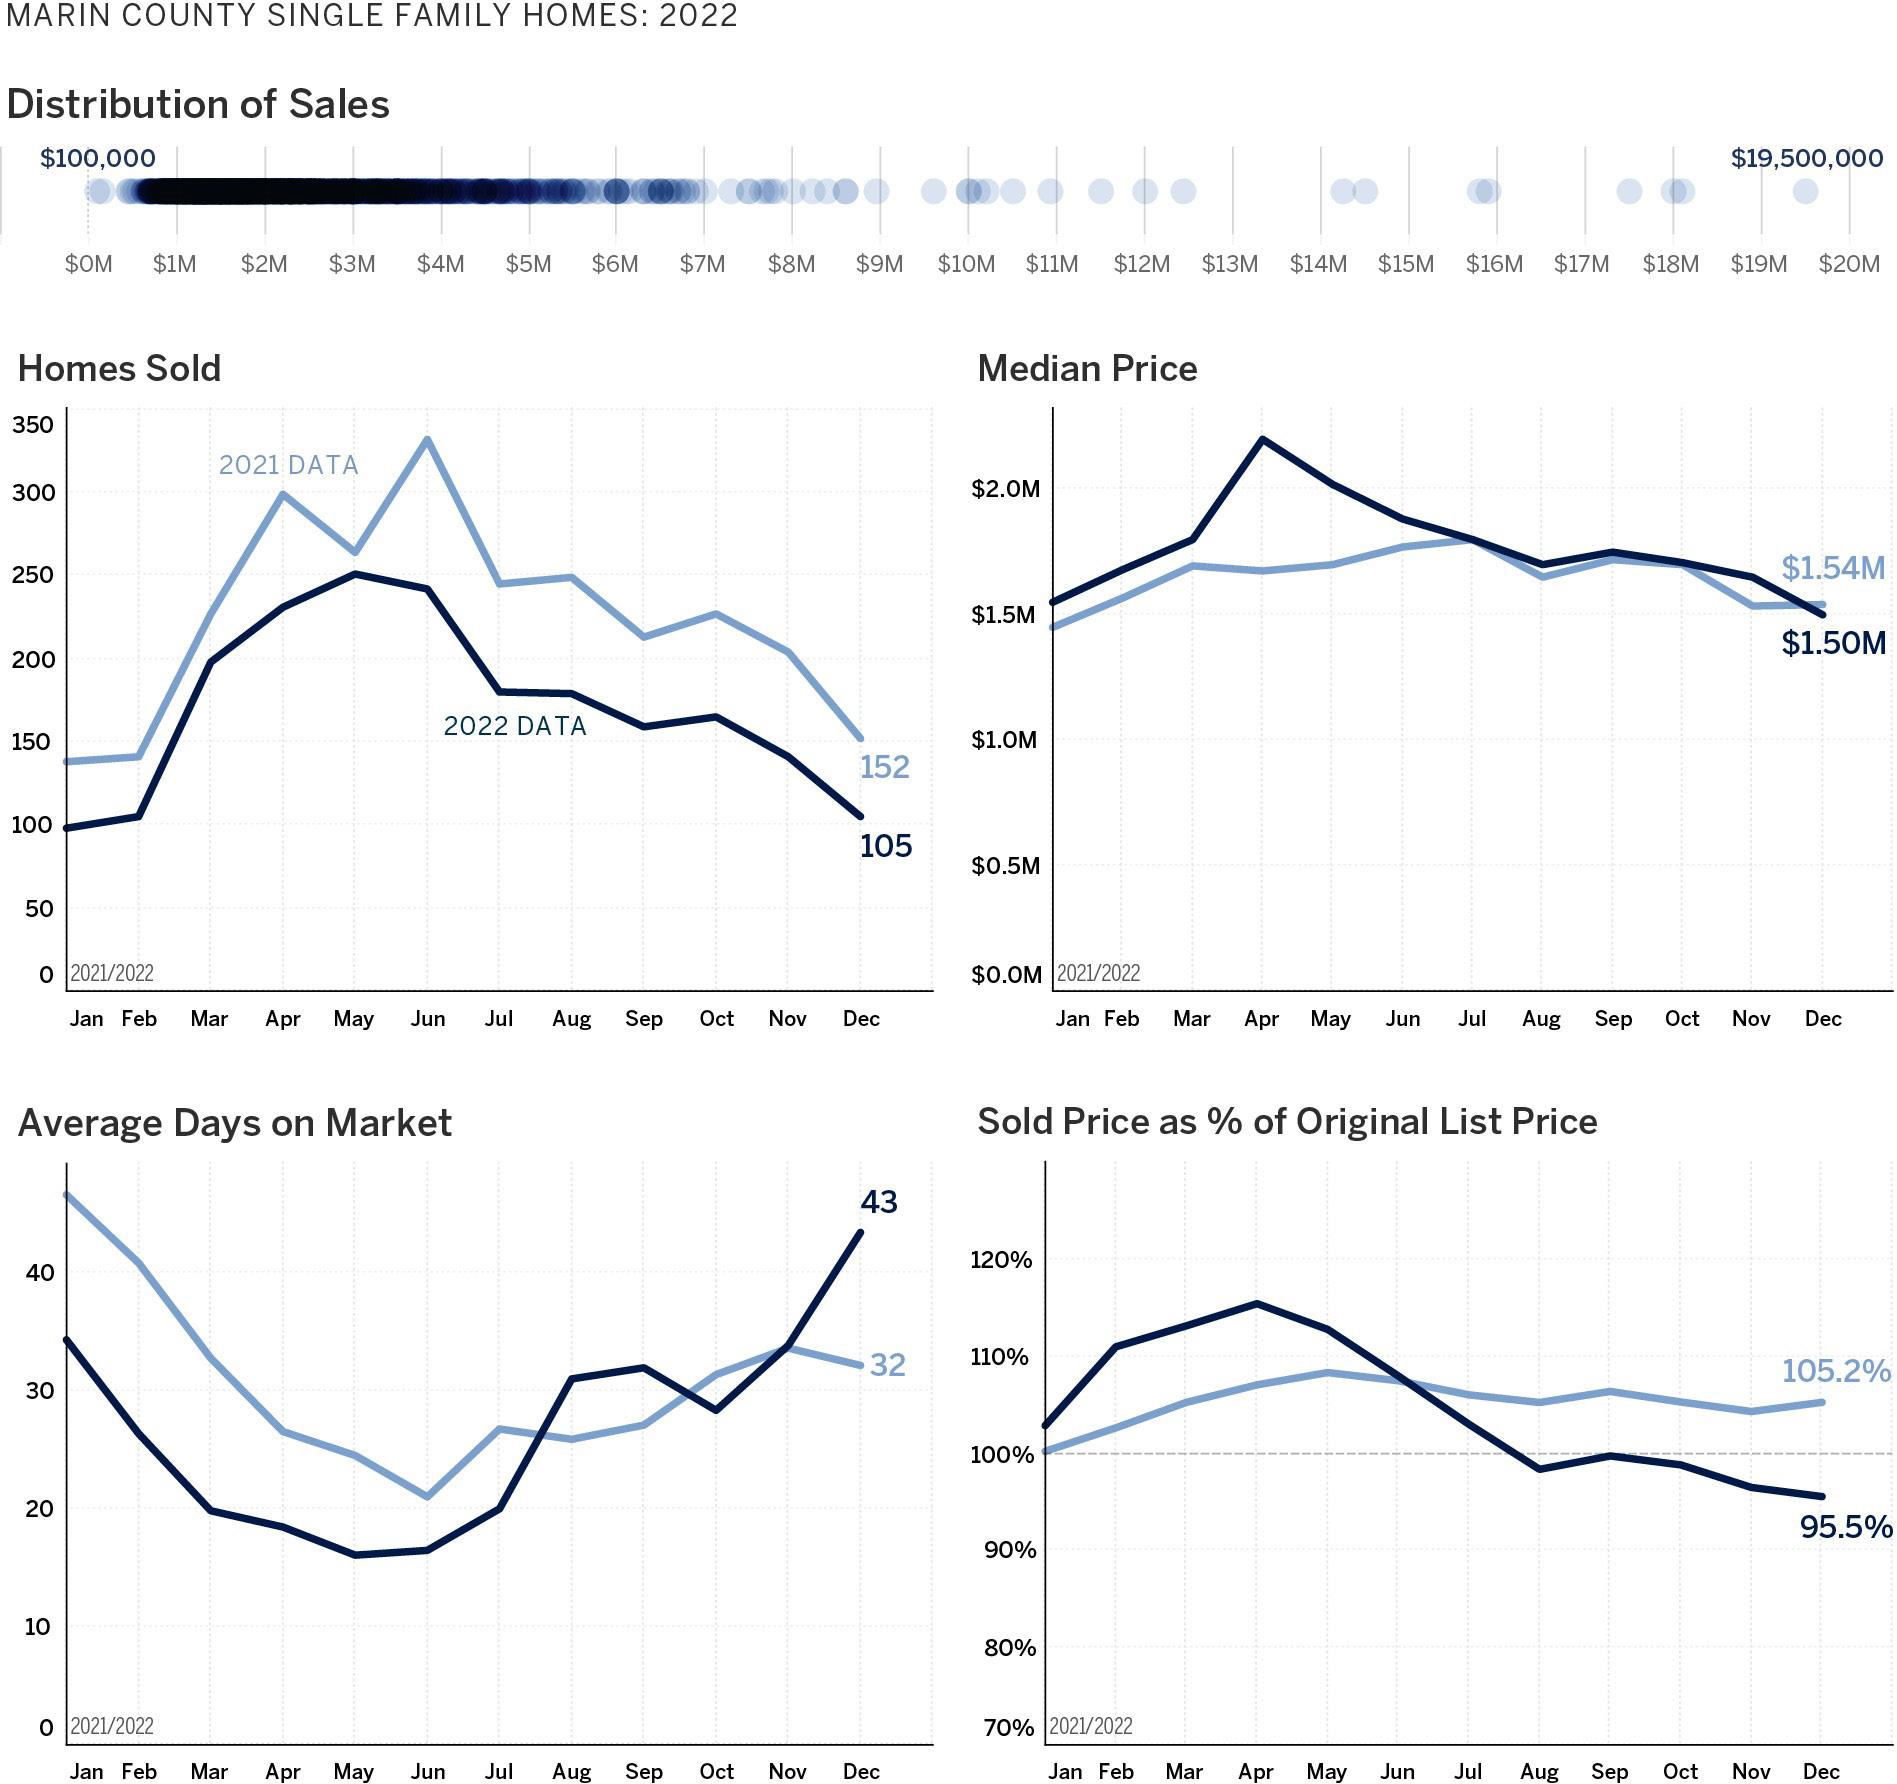
• The median single family home price rose 7.5%, to $1,800,000
• The overall number of SFH sales fell 24%, to 2,064
• The average price per square foot rose 11% to $984/square foot
• The number of luxury homes ($10M+) sold throughout the Bay Area fell 15% to 118 homes

• 2022’s biggest sales were:
- 130 Bella Vista, Belvedere, $19.5M
- 12 Upper Ames, Ross, $18M
- 1860 Mountain View, Tiburon, $17.5M
- 480 Throckmorton, Mill Valley, $15.9M
- 41 Upper, Ross, $14M
With $122,000,000 in sales last year, Applegarth+Warrin was the top team at Golden Gate Sotheby’s in San Francisco and Marin, and one of the top teams in the country. We’d like to take a minute to thank all of our friends, clients, and colleagues who have entrusted us to help with their real estate needs. We wish you a very happy and healthy 2023.
If you have questions about the market or your home, call us anytime at 415-299-8999, or email team@applegarthwarrin.com.

APPLEGARTH + WARRIN $ 2 B I L L I O N S O L D
TOP AGENTS % 1 NATIONWIDE
POWEROFTHE B R AND
Trus ted to Sell Your M os t Valued A sset
SOTHEBY’S
Sotheby’sAuction House has over 200 years of history selling our clients’ treasures Our association with thebrand ensures stellar representation, brings cachet to your property and allows us access to affluent buyers around the world.

SOTHEBY’SINTERNAT I O N ALREA L T Y
With our distinguished global referral network we can find qualified buyers or quality agents for your next purchase from around the globe Our listings achieve maximum sale price
1,000 Off ices
25,000 SalesAssociates
178M Million Annual Page Visits SIR . com
170M Million YouTube Video Views
77 Countries
3.8M Million Average Monthly Visits SIR .com
4


5

6
APPLEGARTH + WARRIN


7

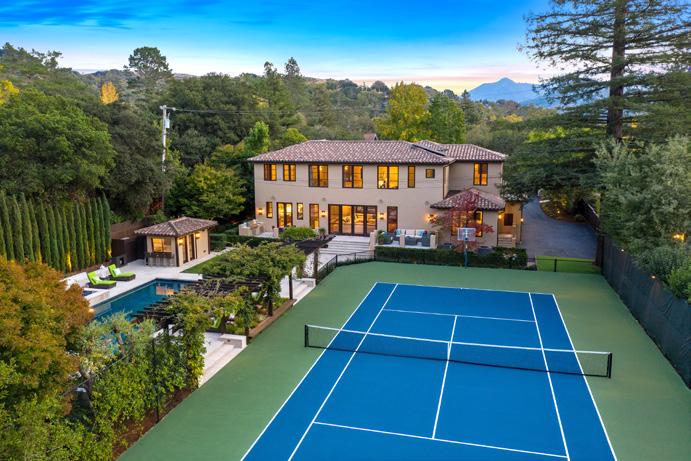
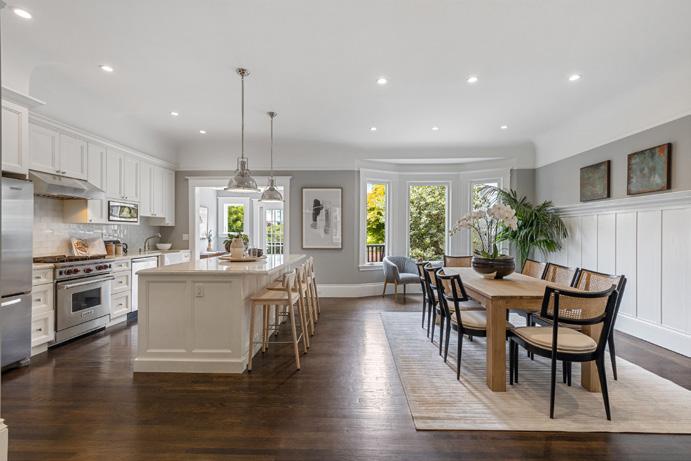
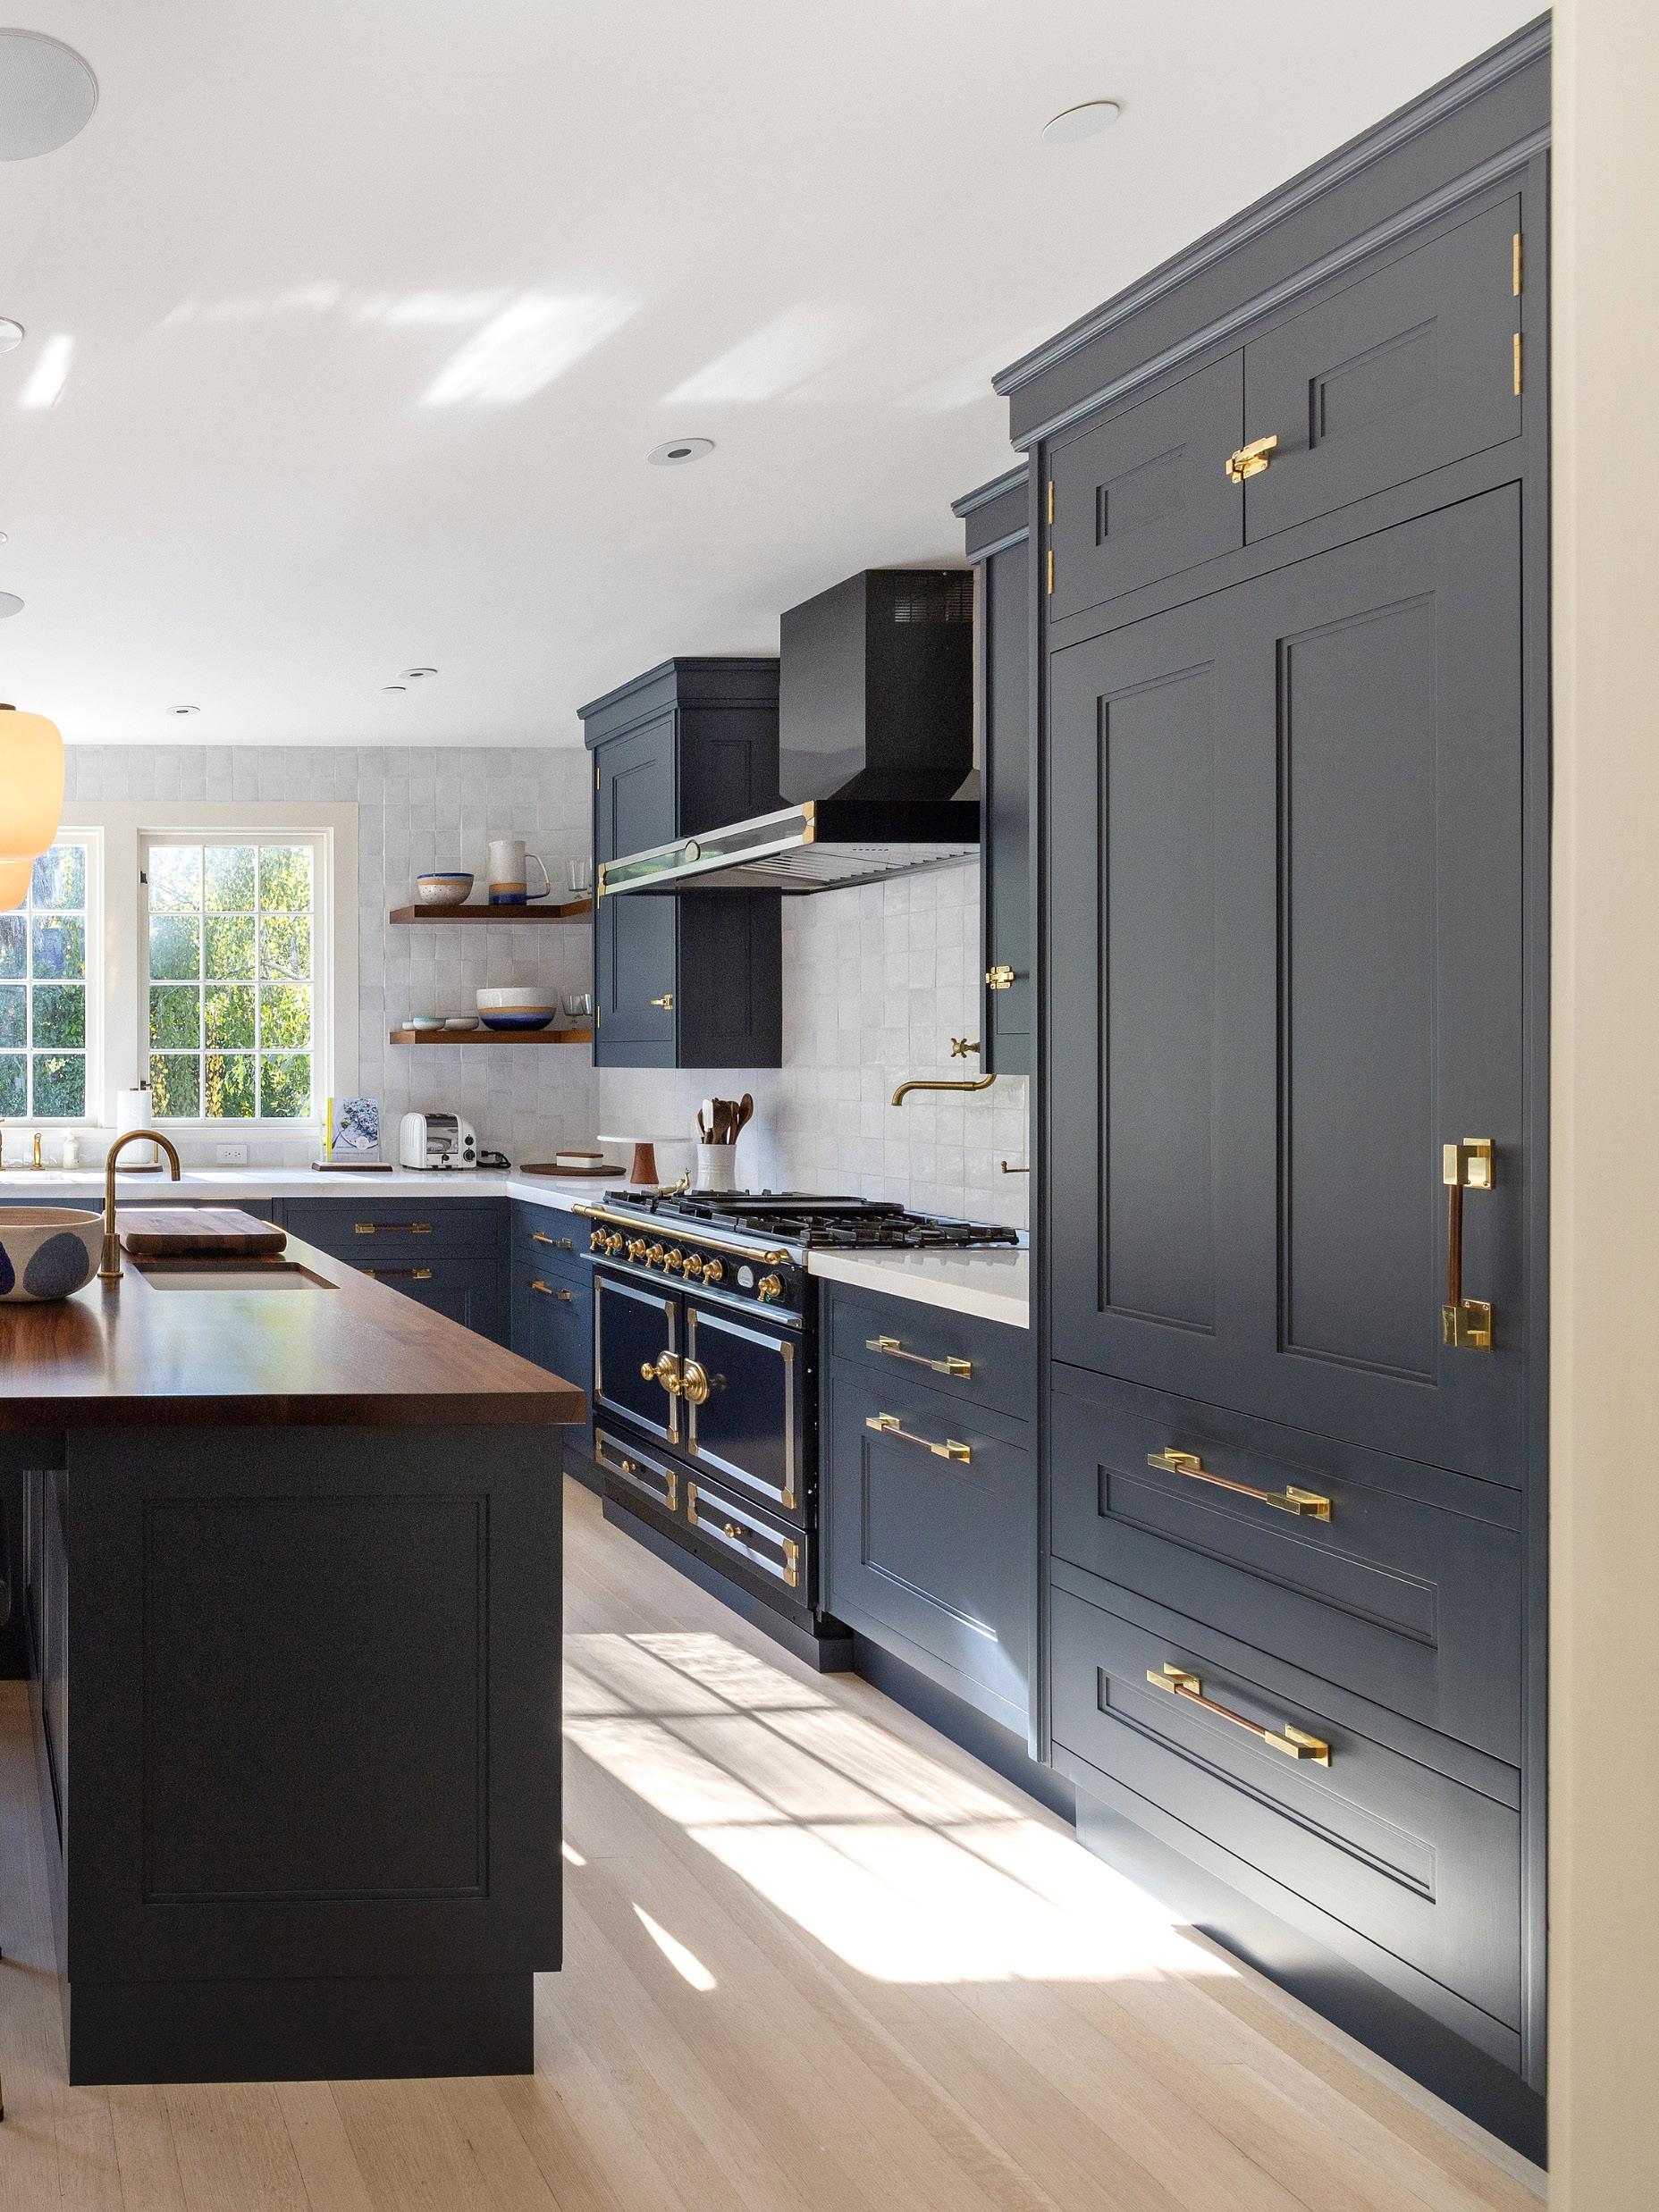
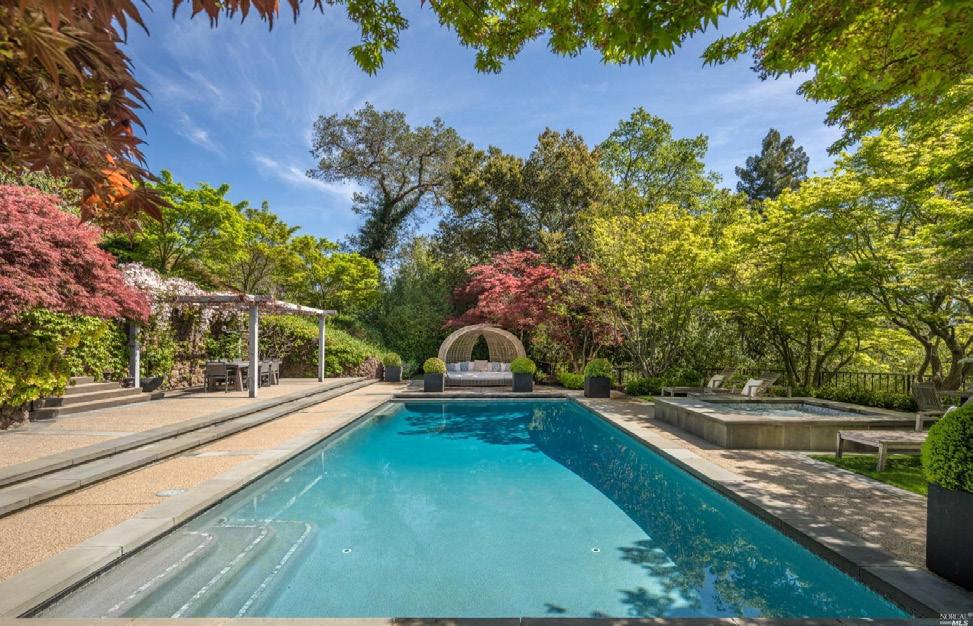
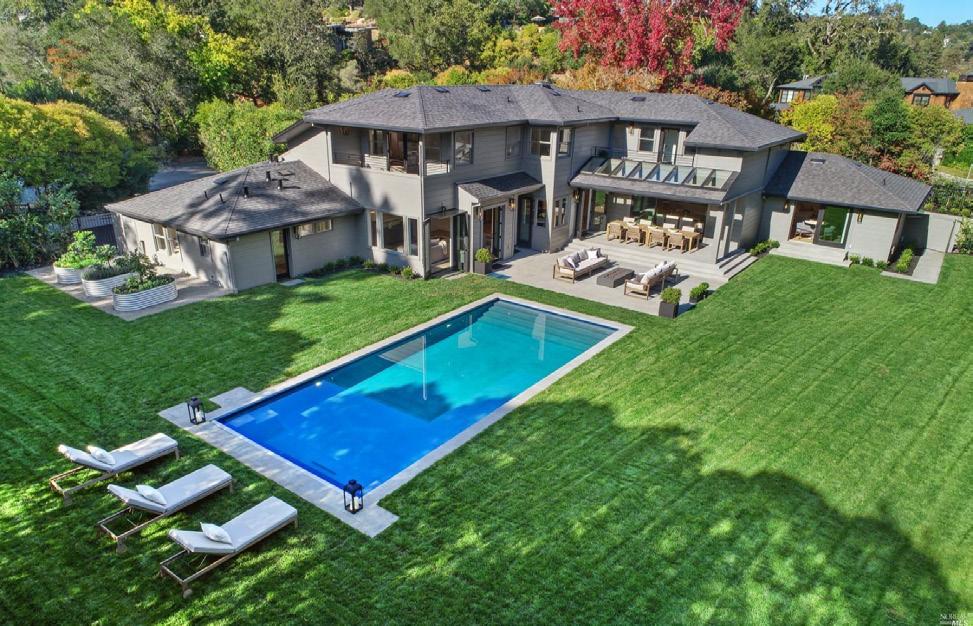
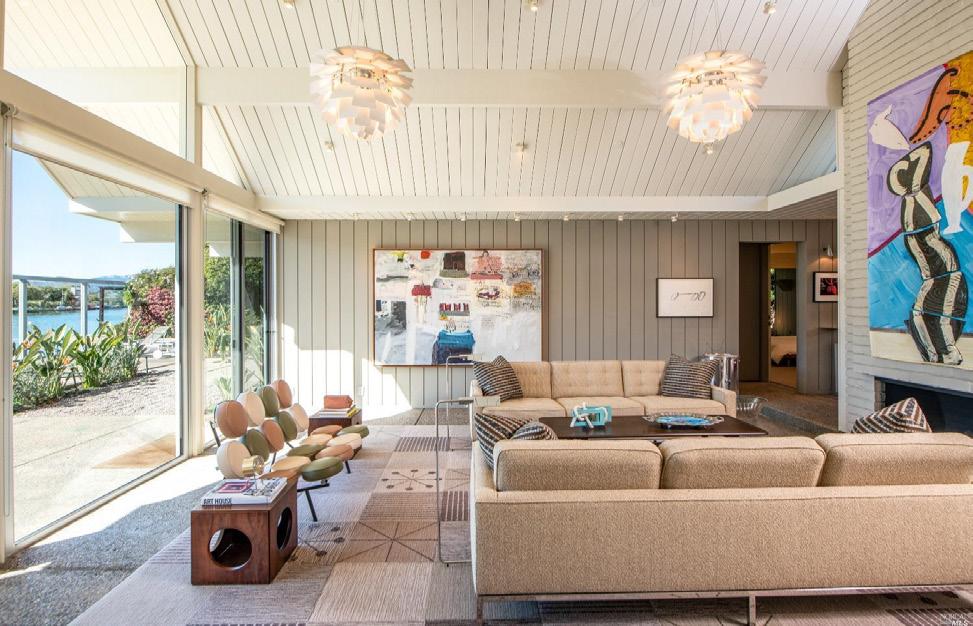
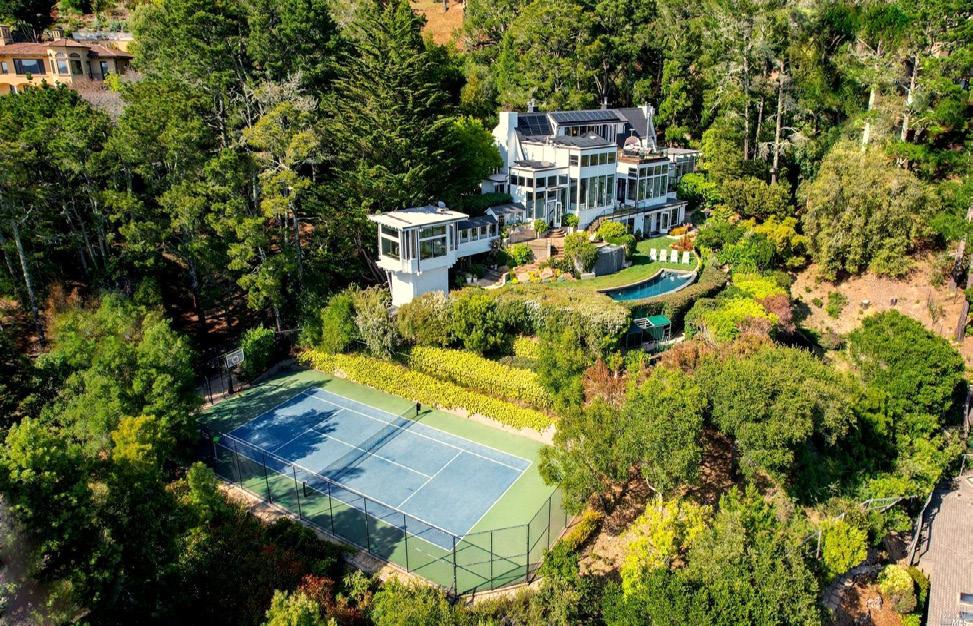
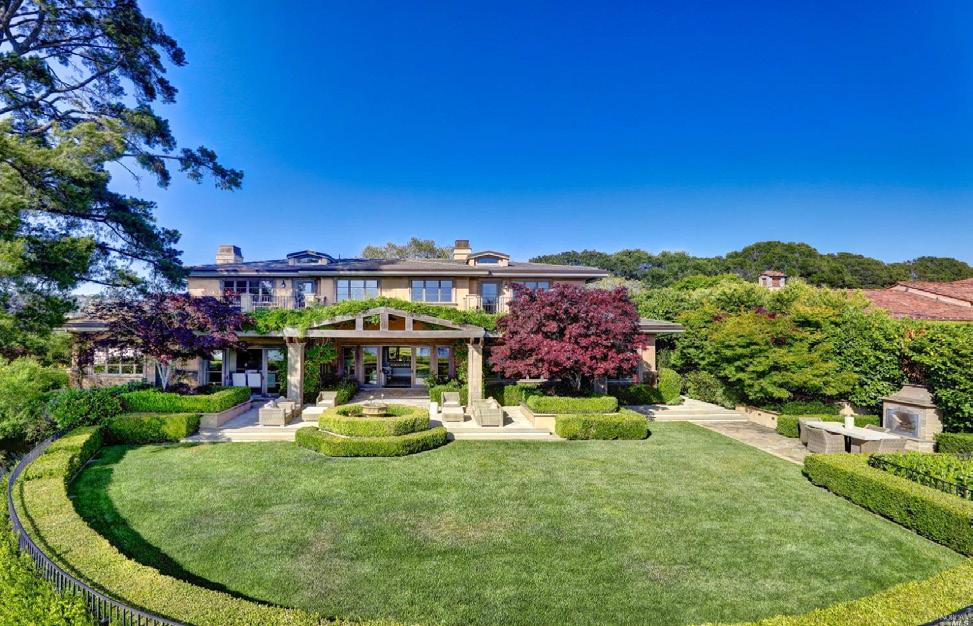
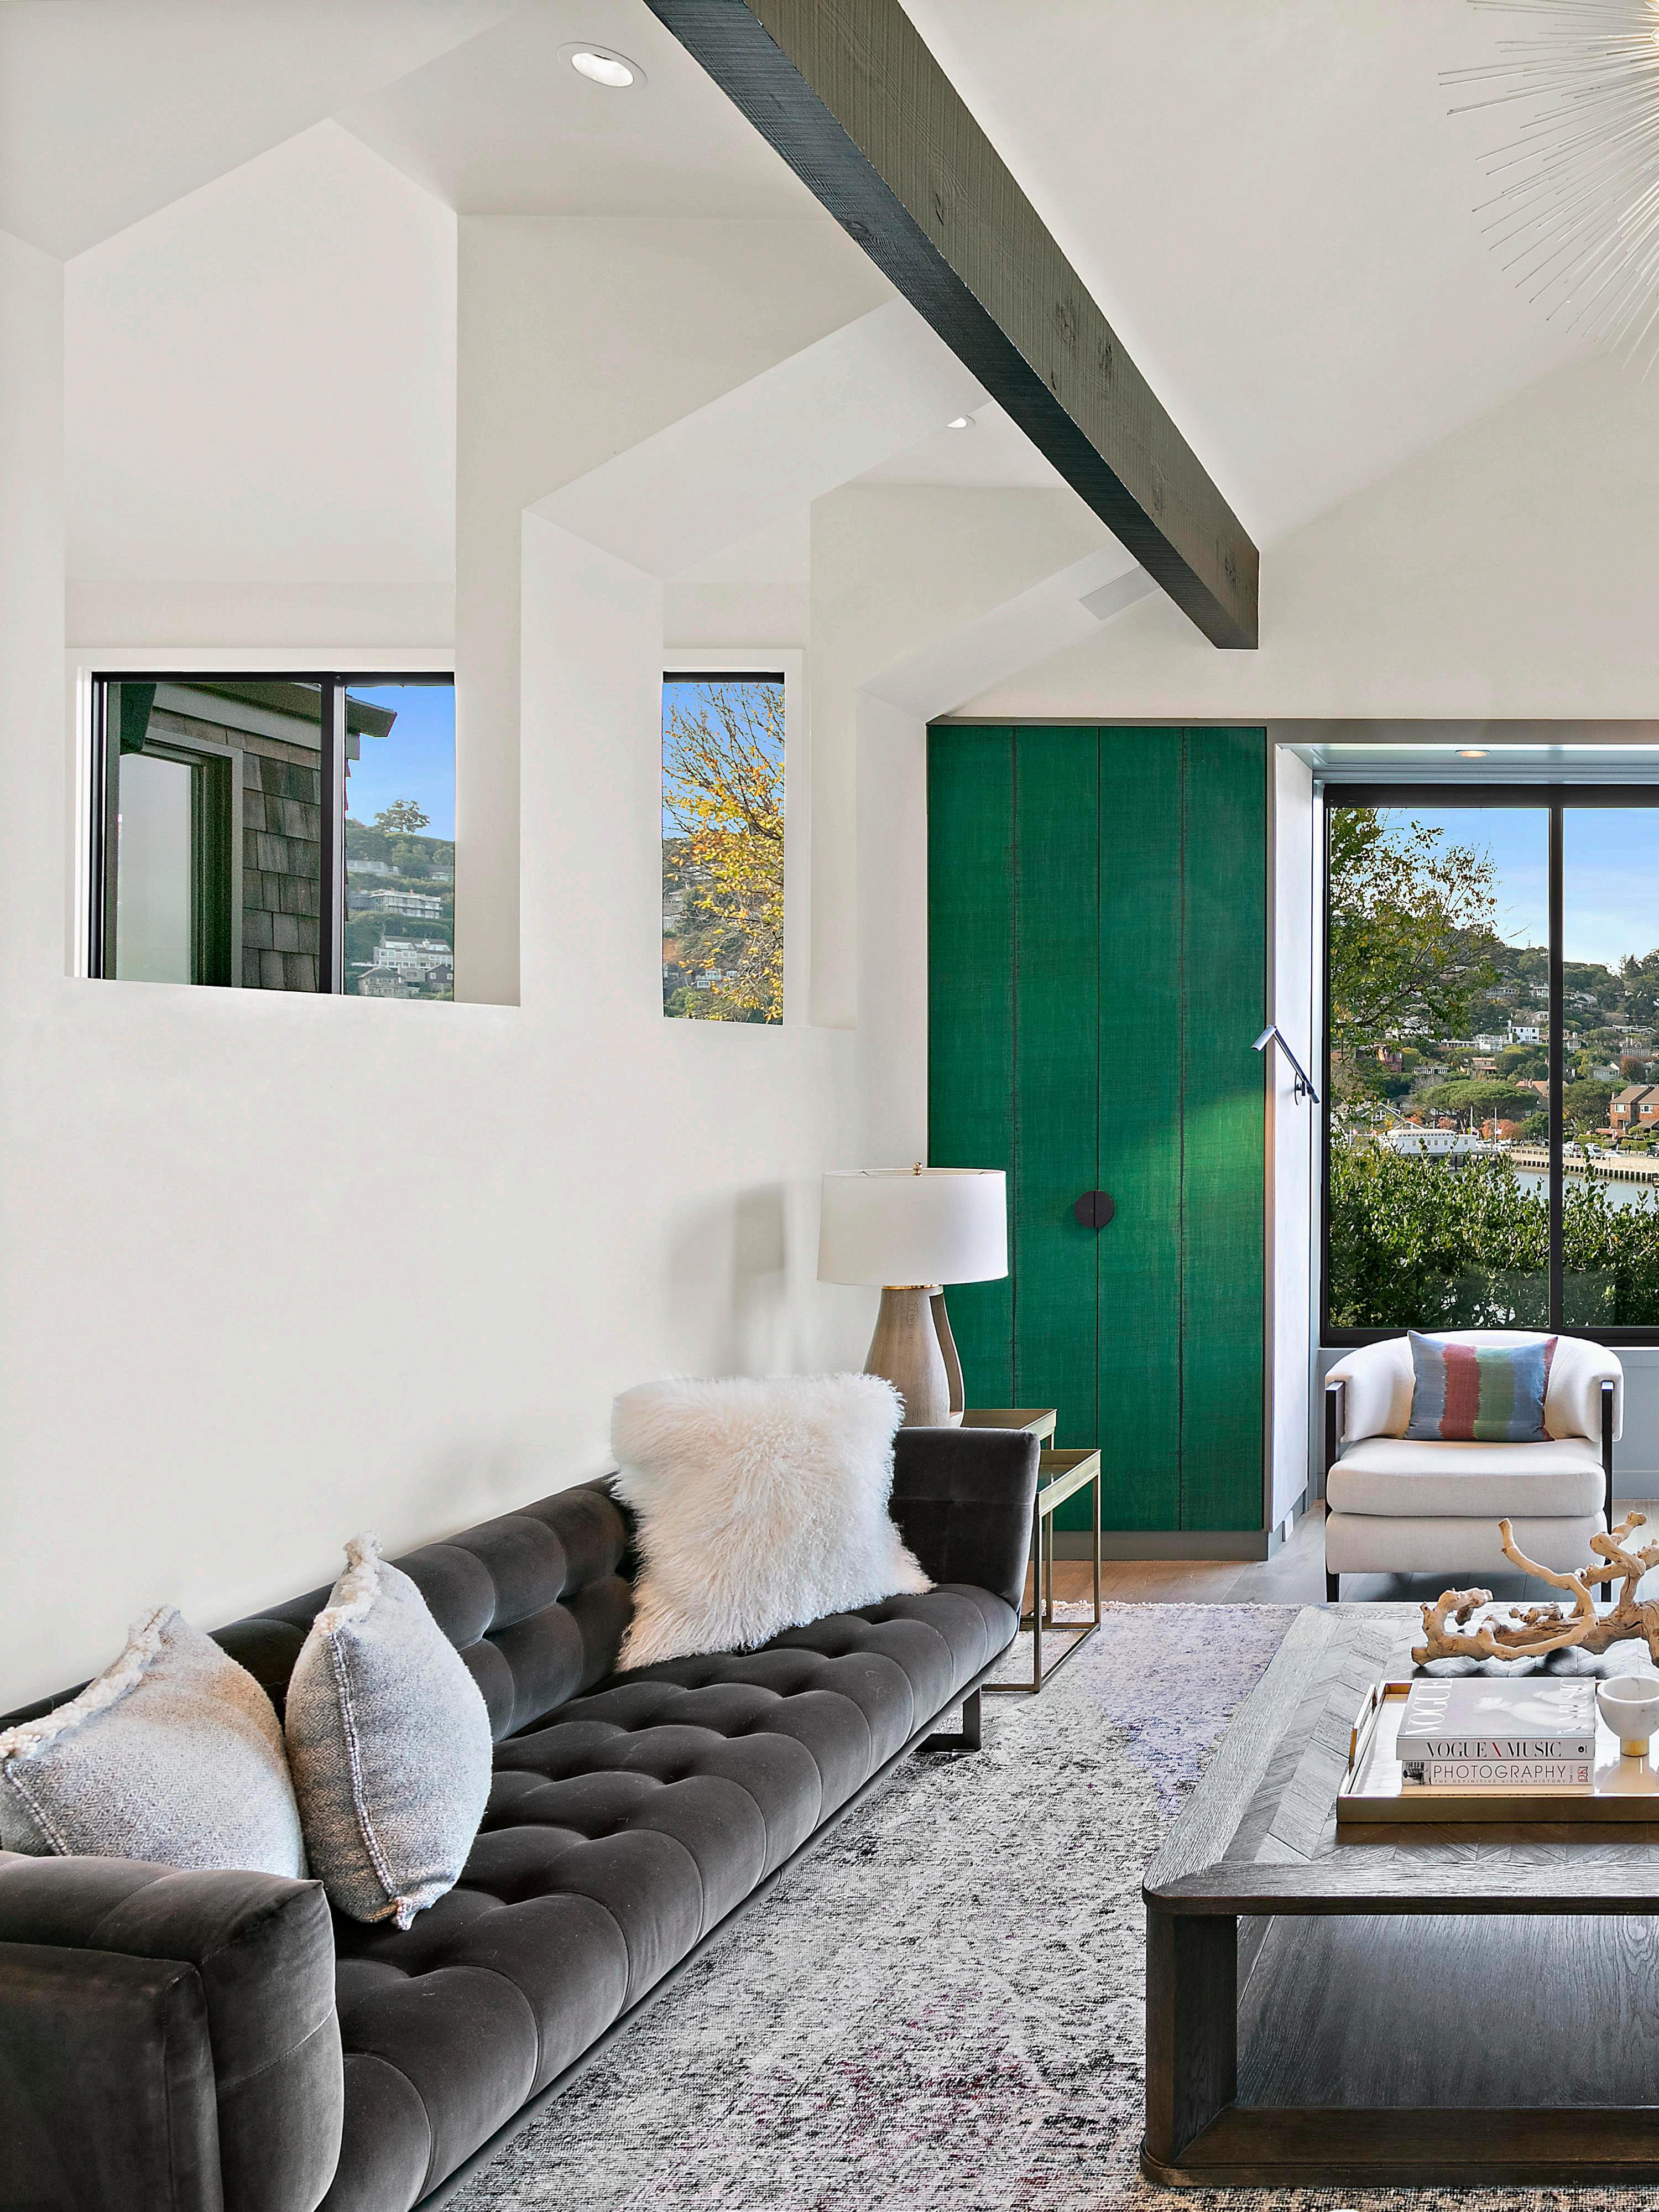
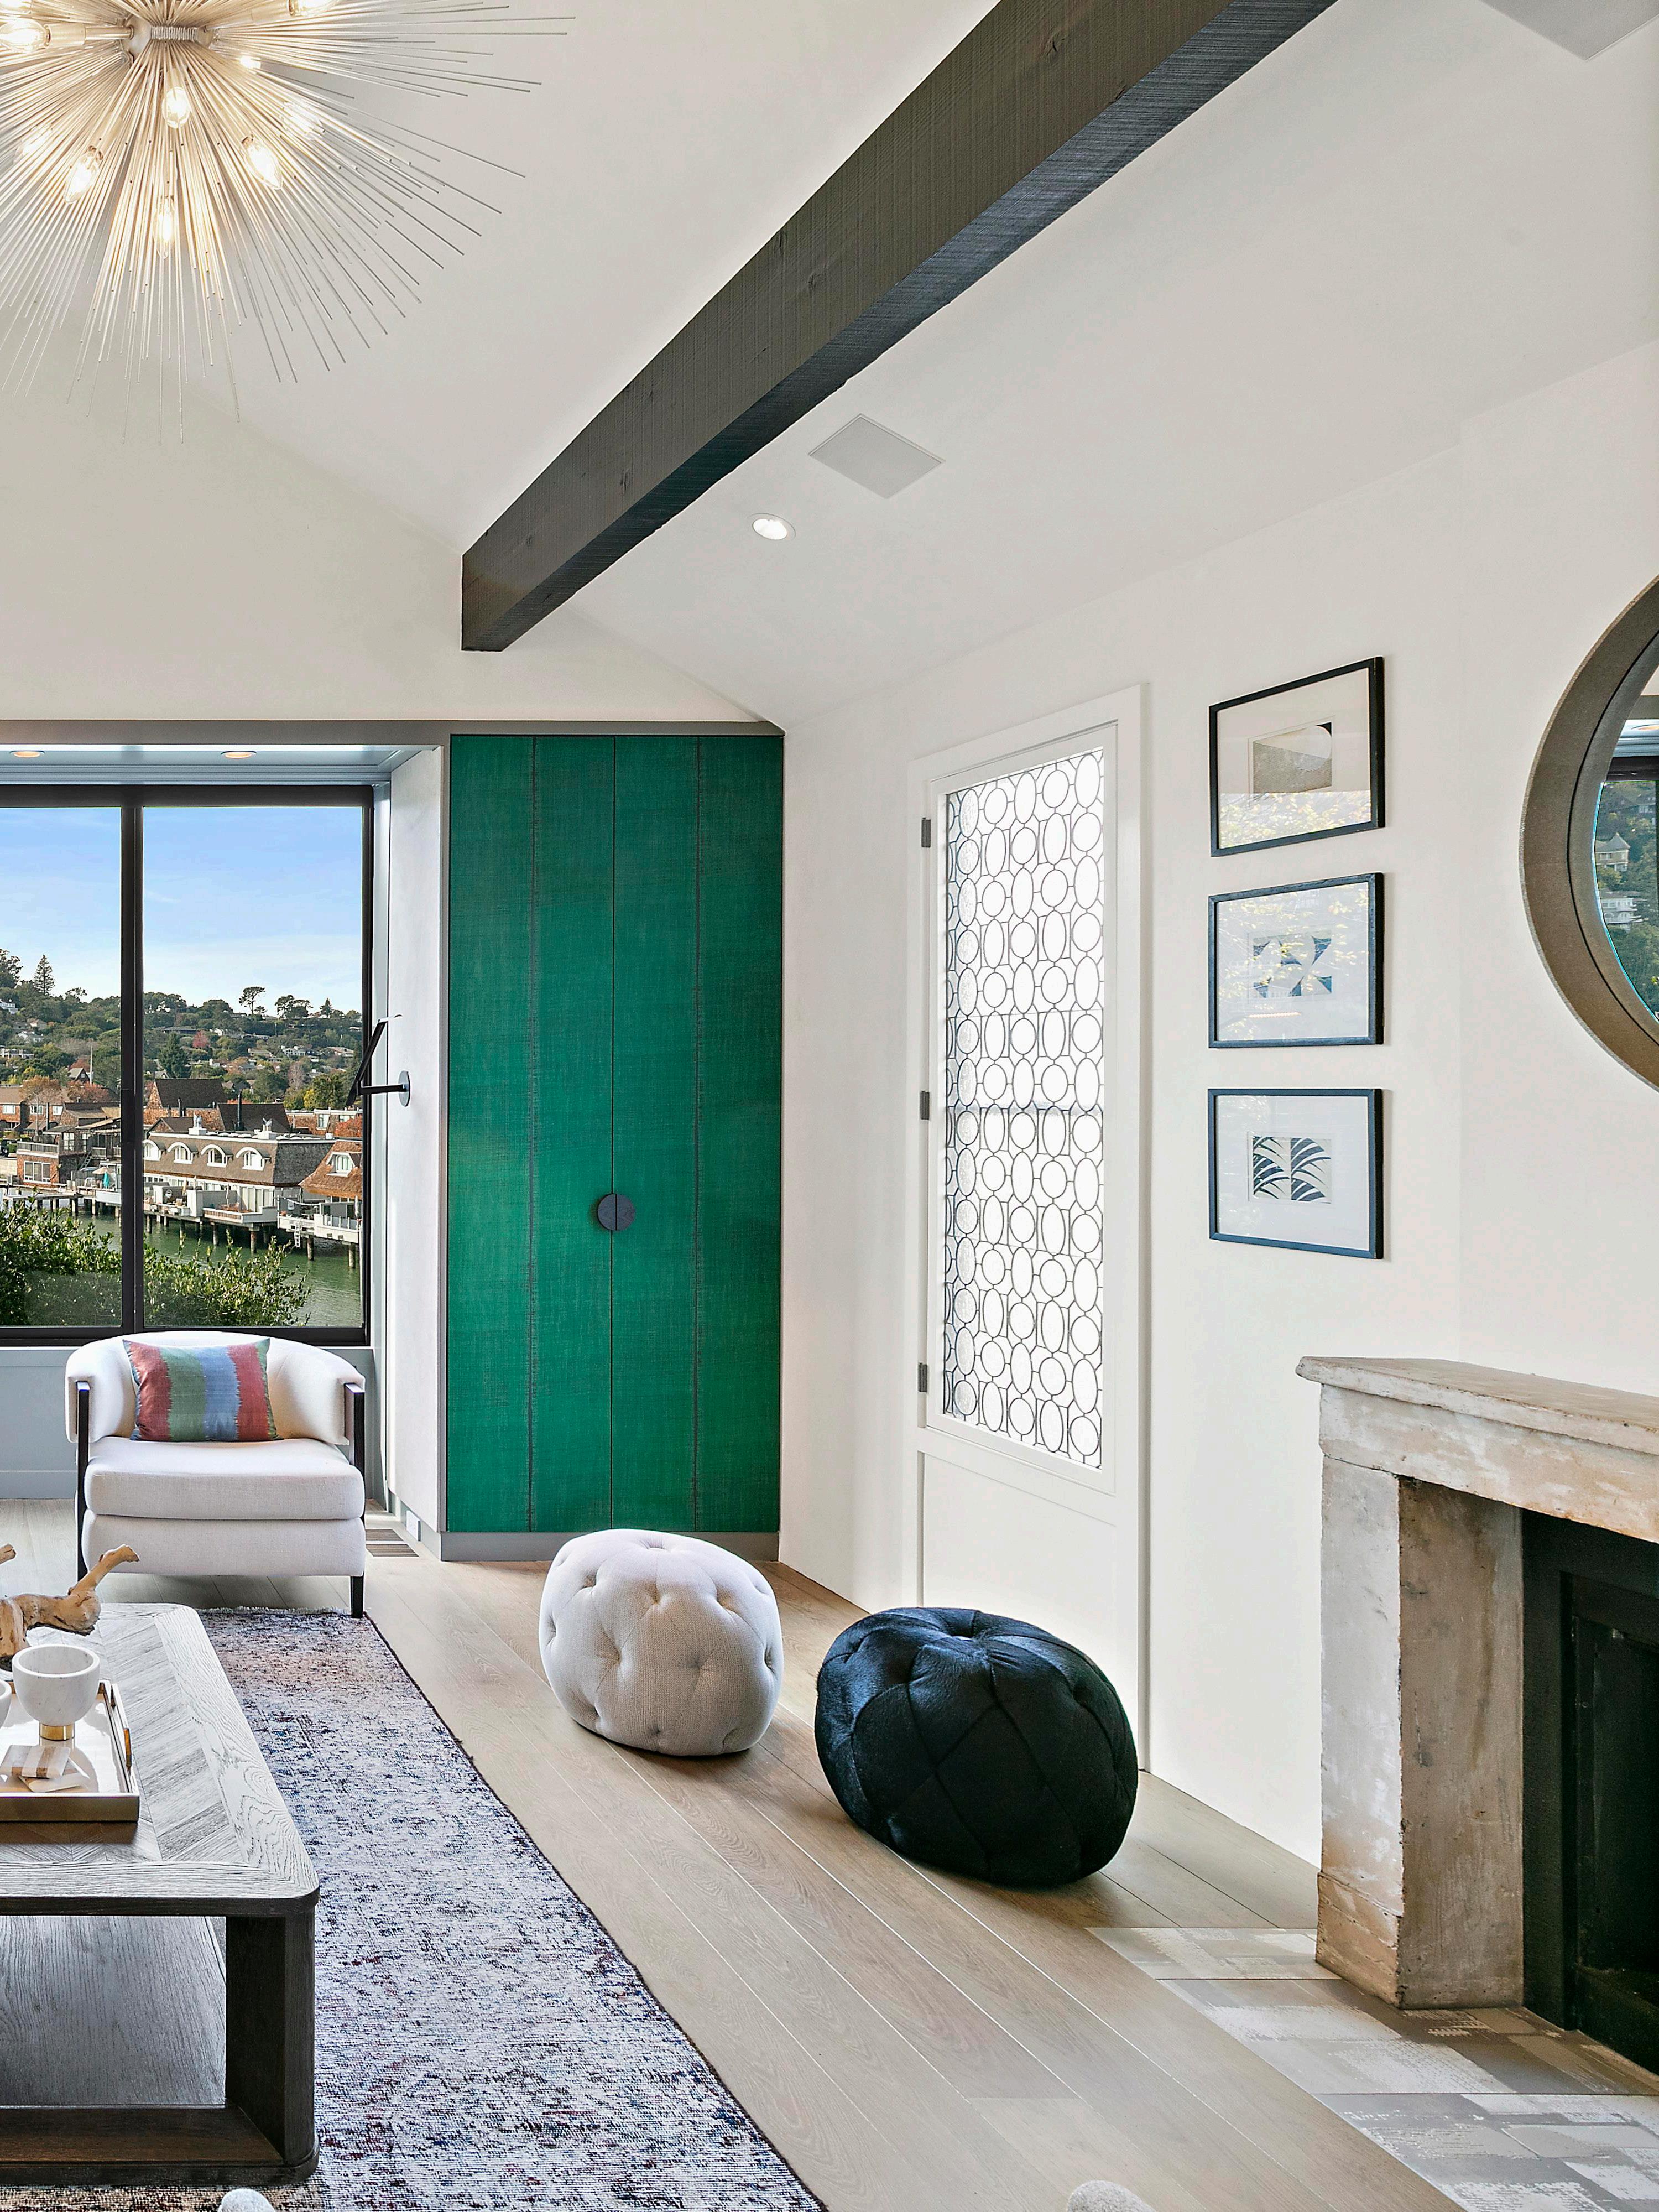
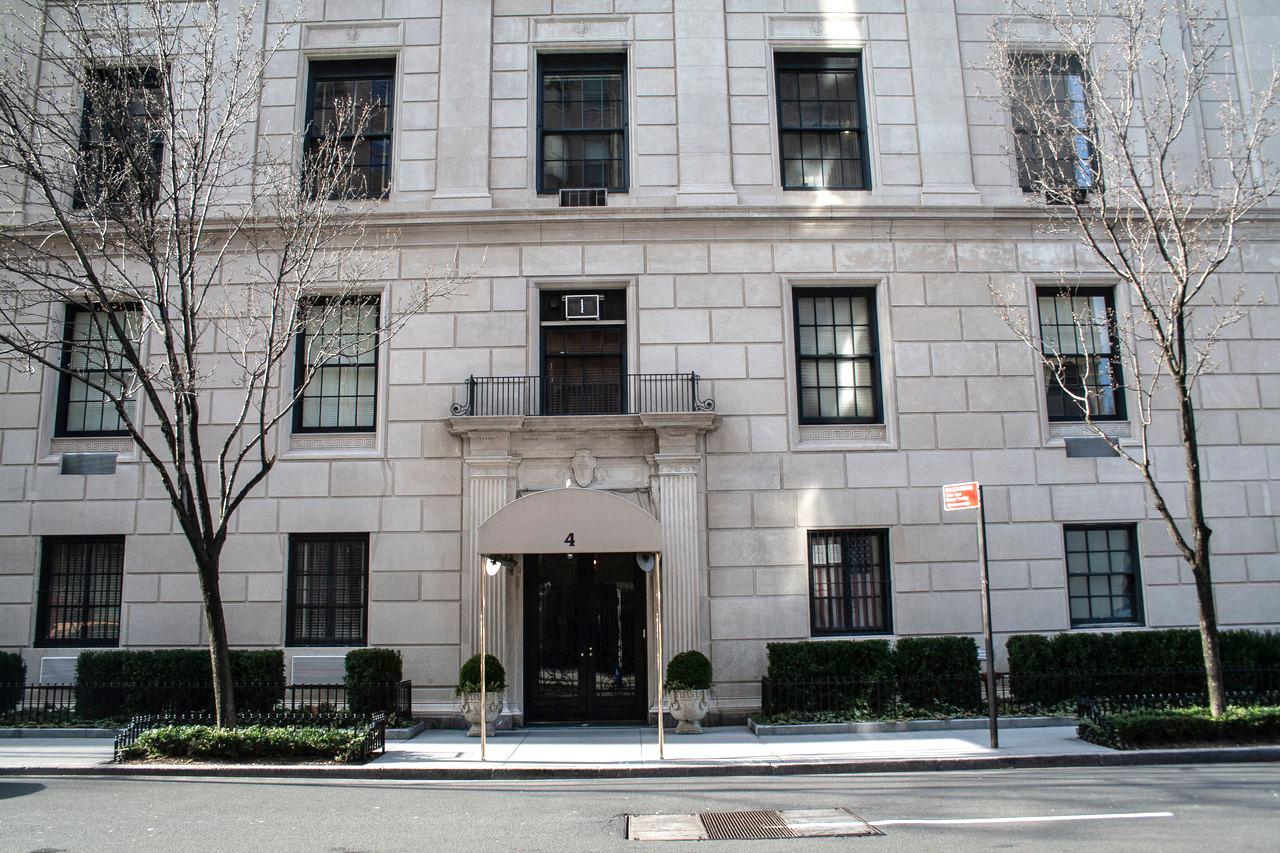
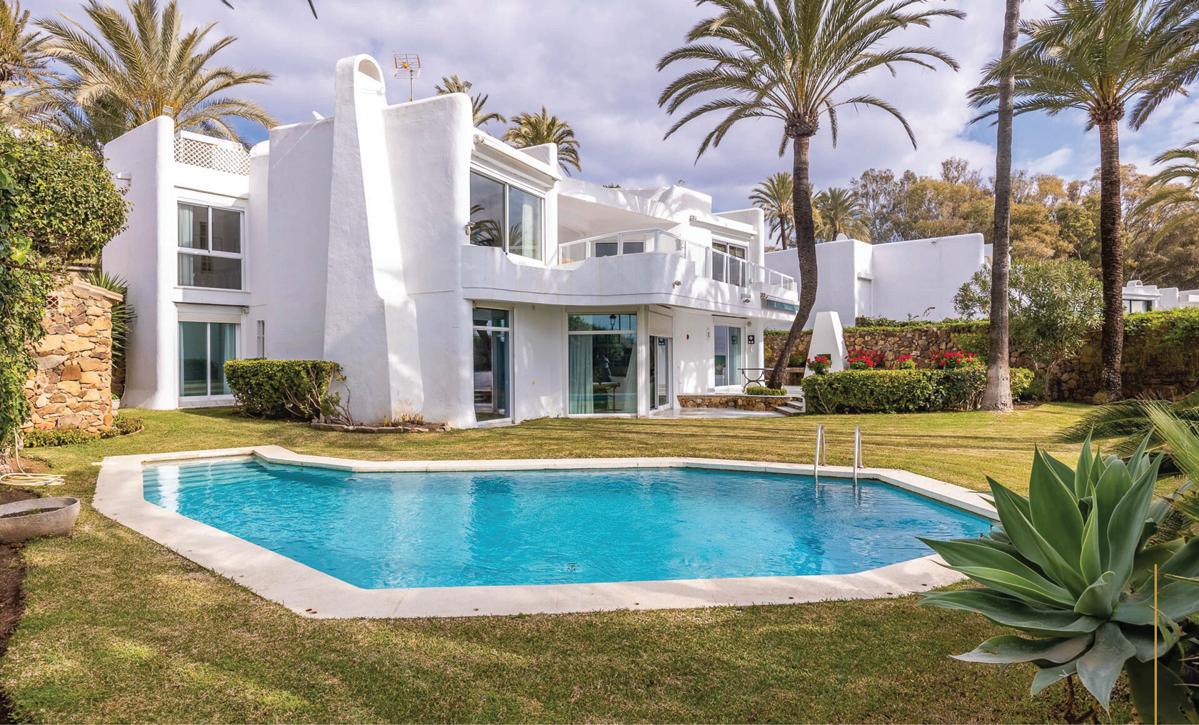
SOLD SAN ANSELMO Resort Like Estate $6,750,000 SOLD TIBURON Sweeping Views Home $8,000,000 SOLD TIBURON Represented Buyer $5,050,000 SOLD KENTFIELD Represented Buyer $8,000,000 SOLD BELVEDERE Represented Buyer $6,800,000 SOLD BELVEDERE Represented Buyer $11,750,000 SOLD MILL VALLEY Designer Mill Valley Home $7,050,000 SOLD TIBURON Represented Buyer $12,175,000 SOLD OFF MARKET MILL VALLEY Represented Buyer $6,800,000
8
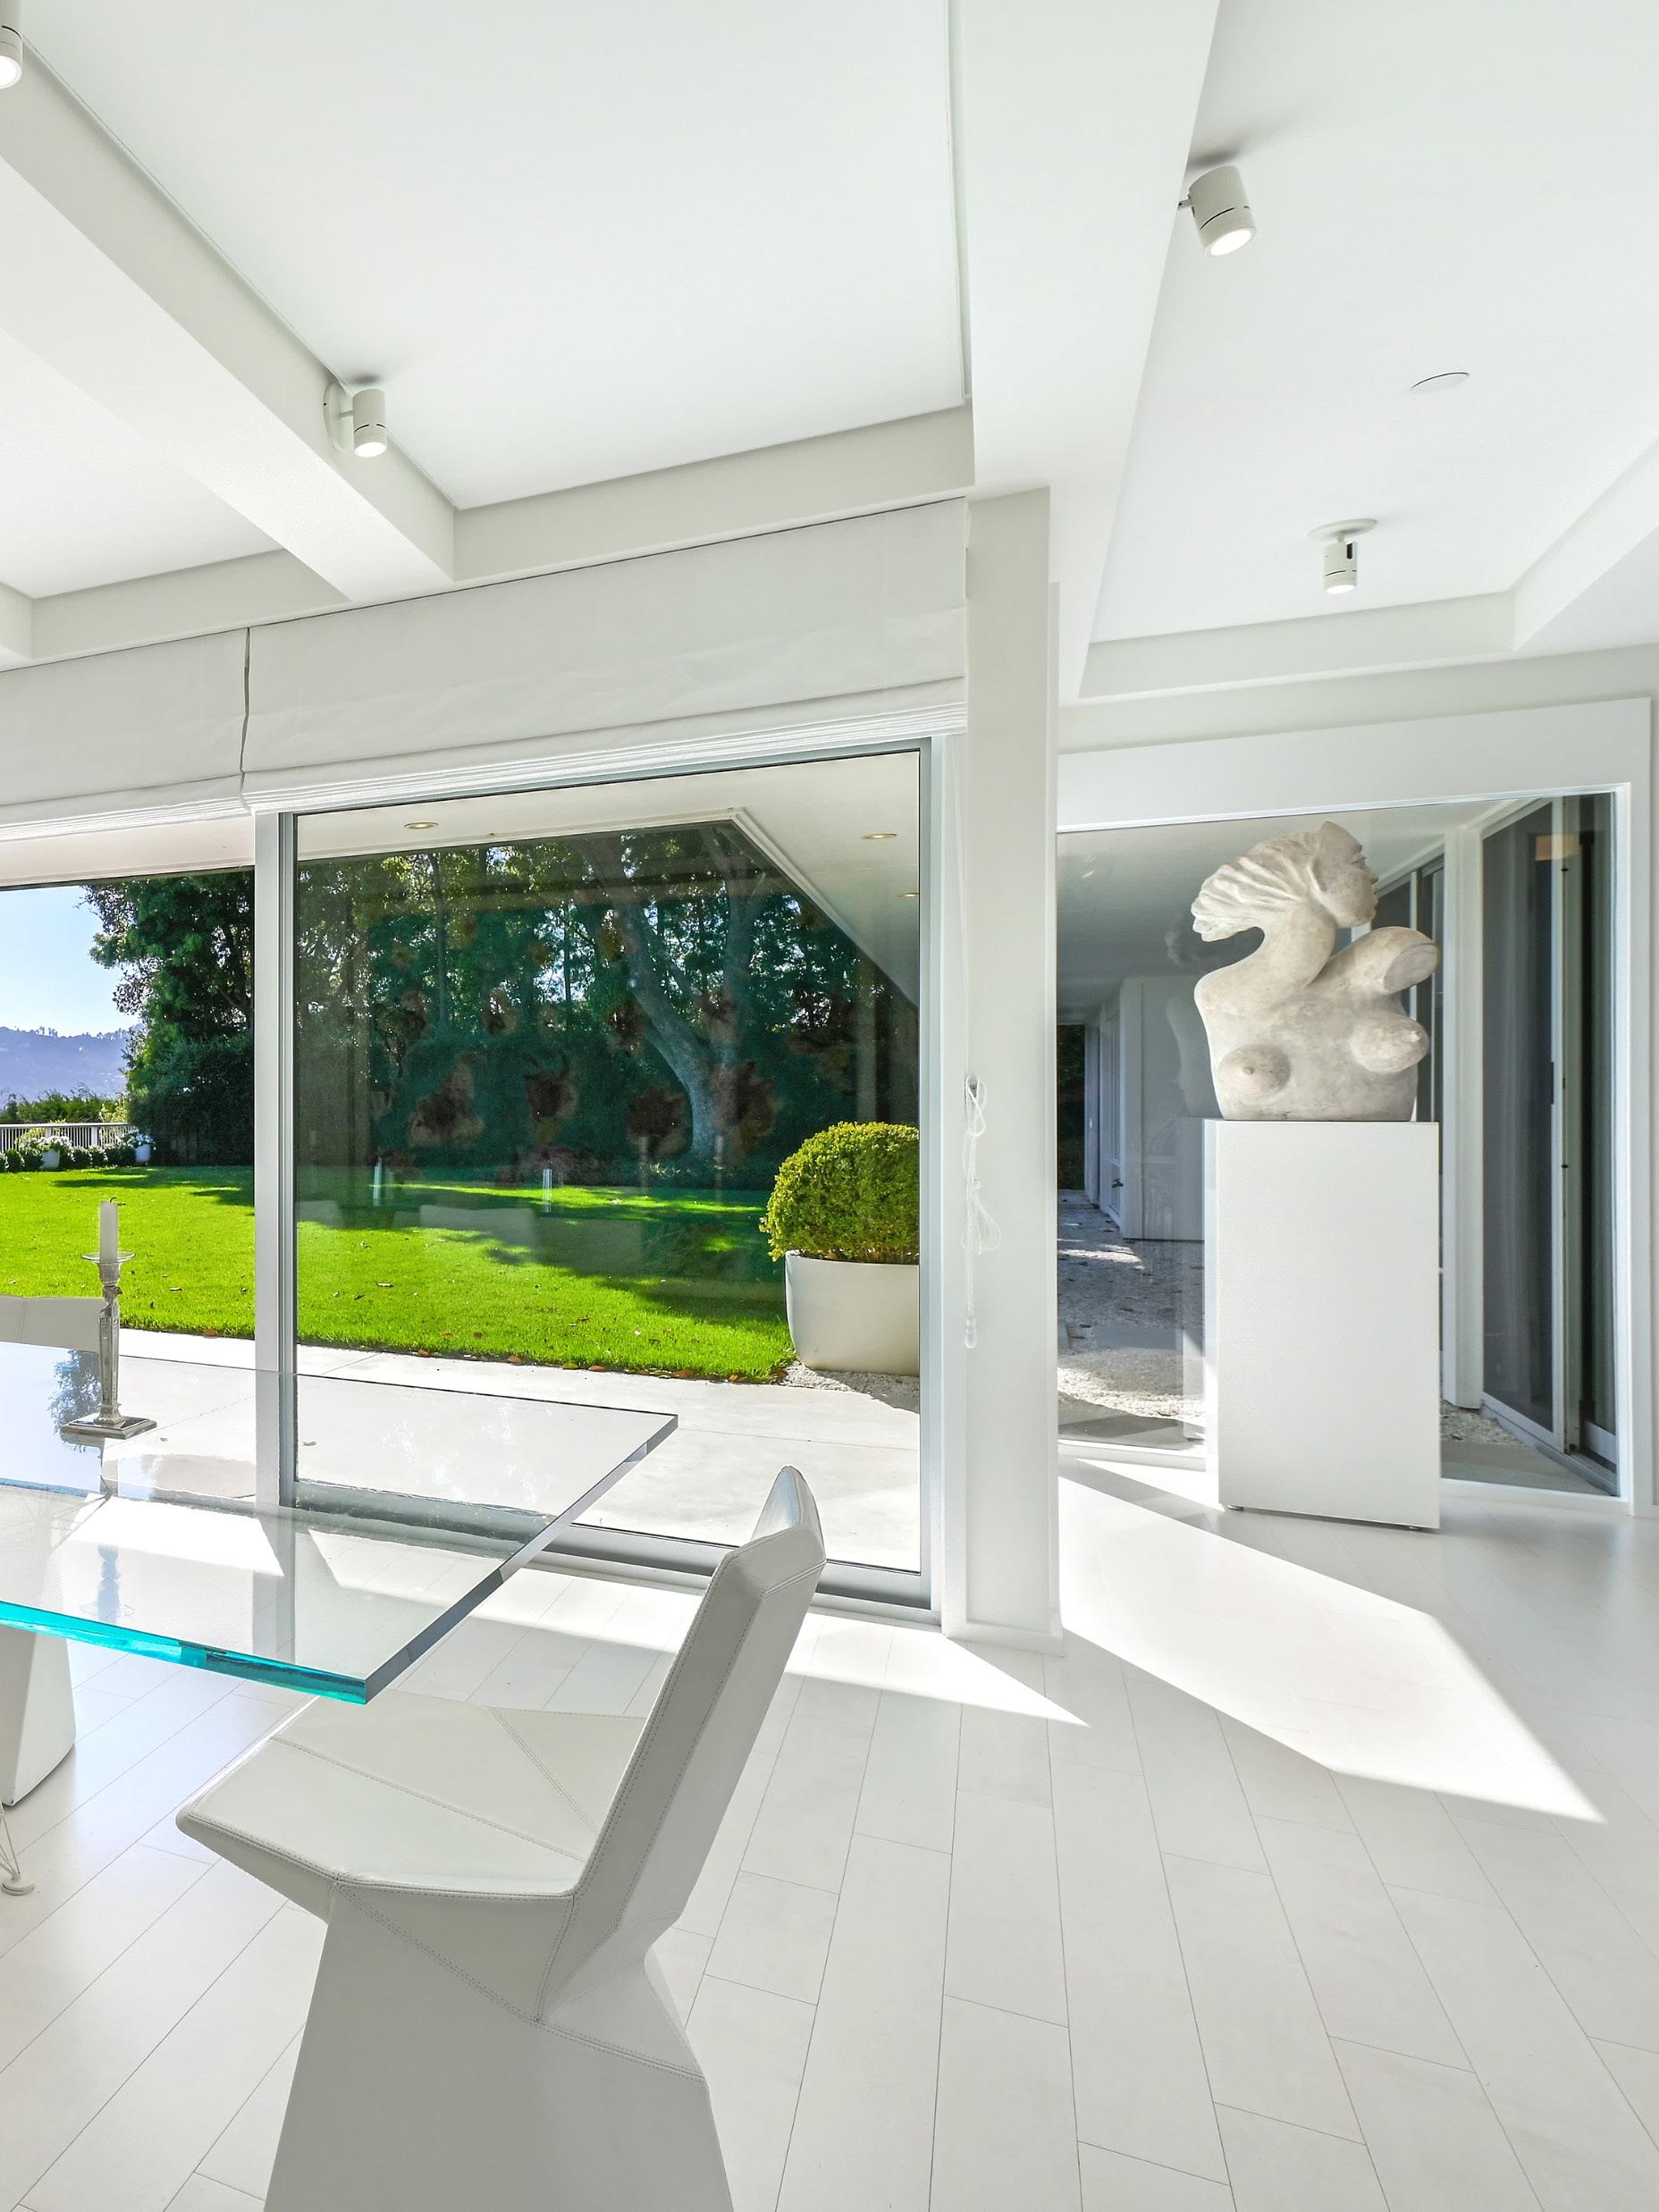
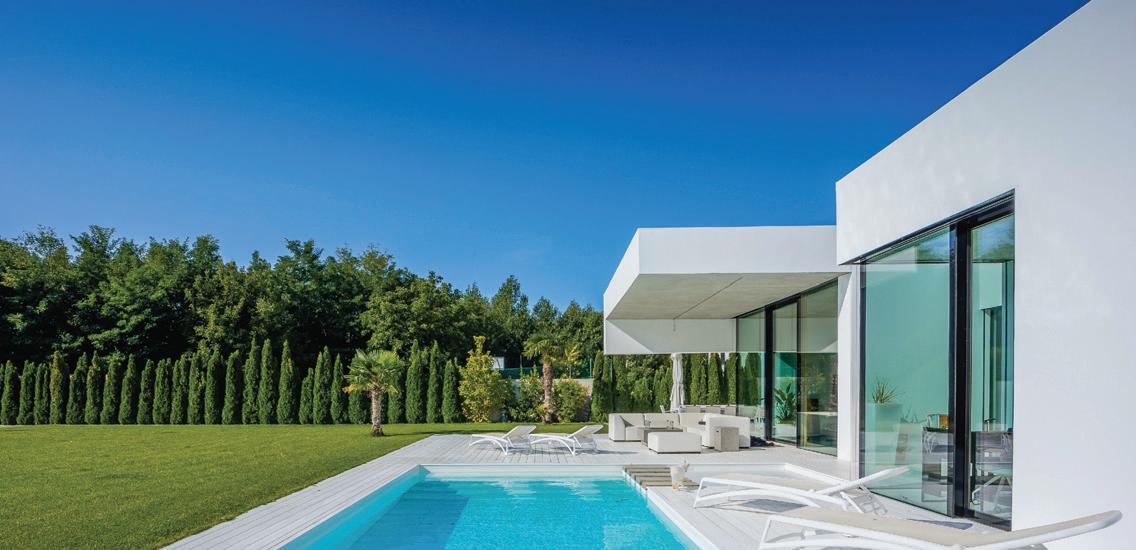
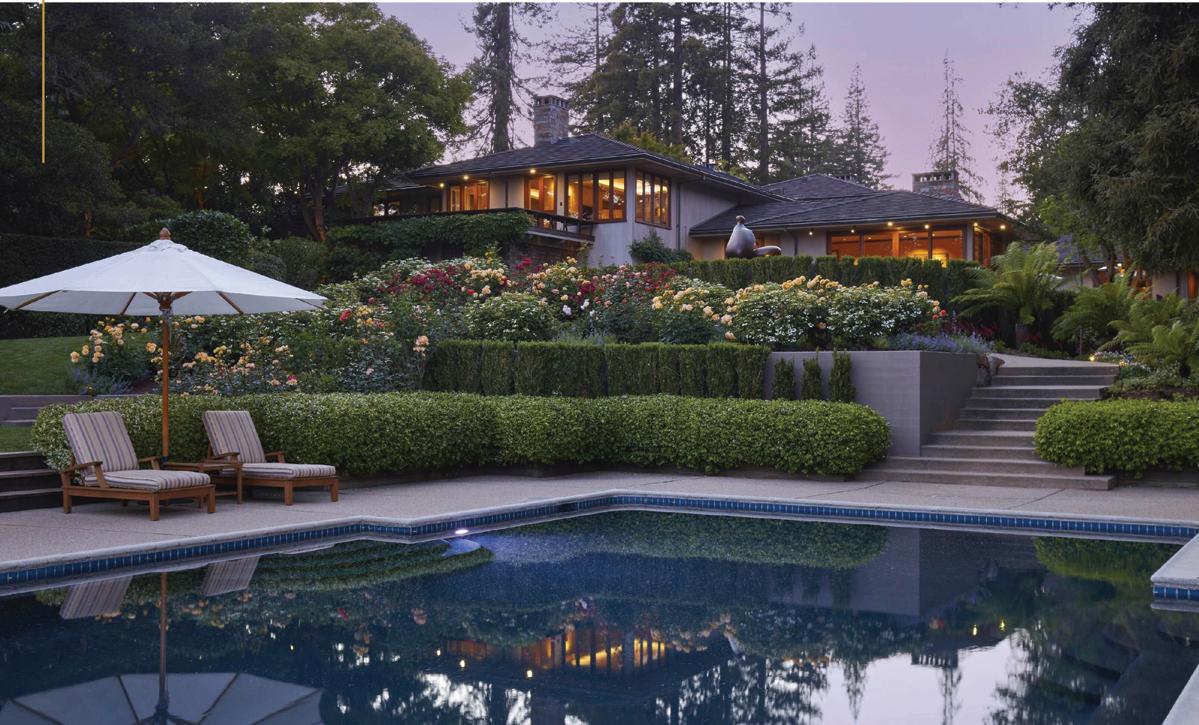
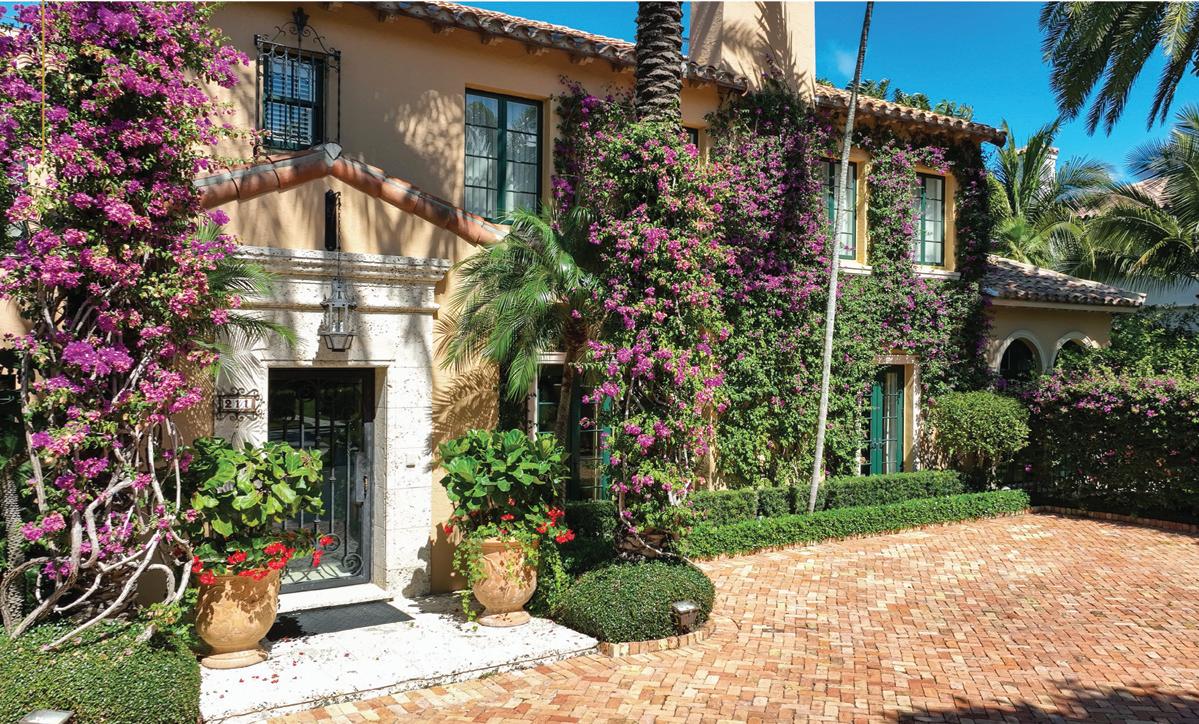
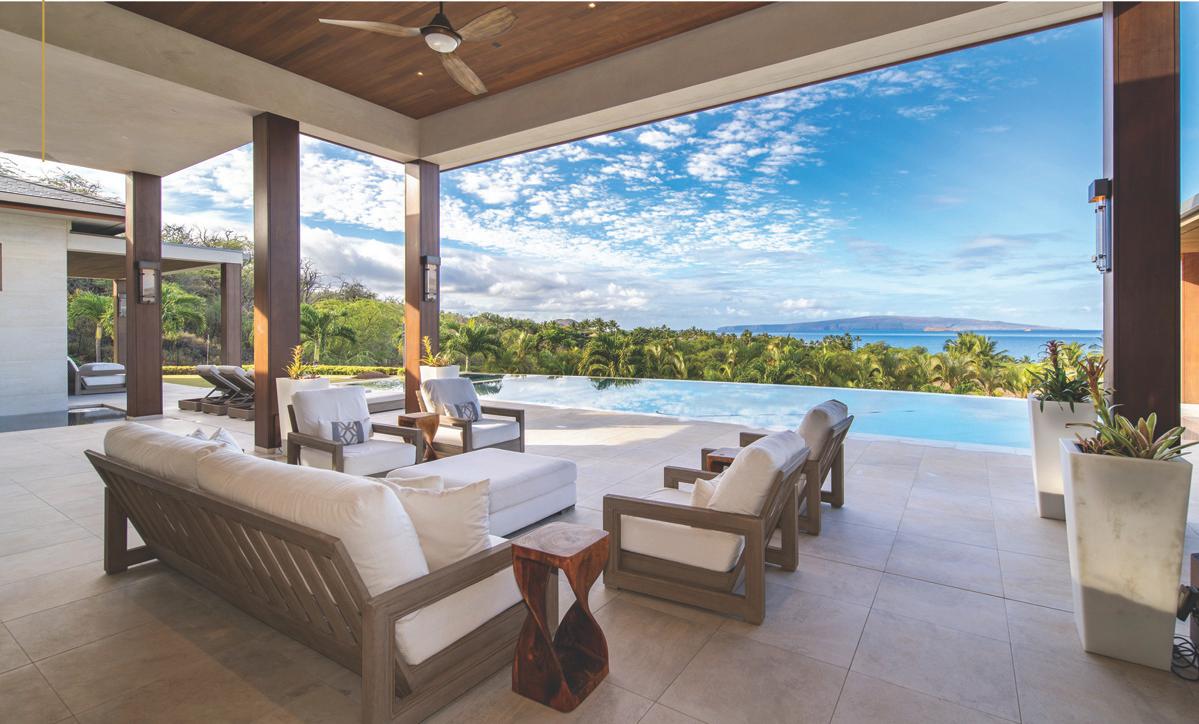
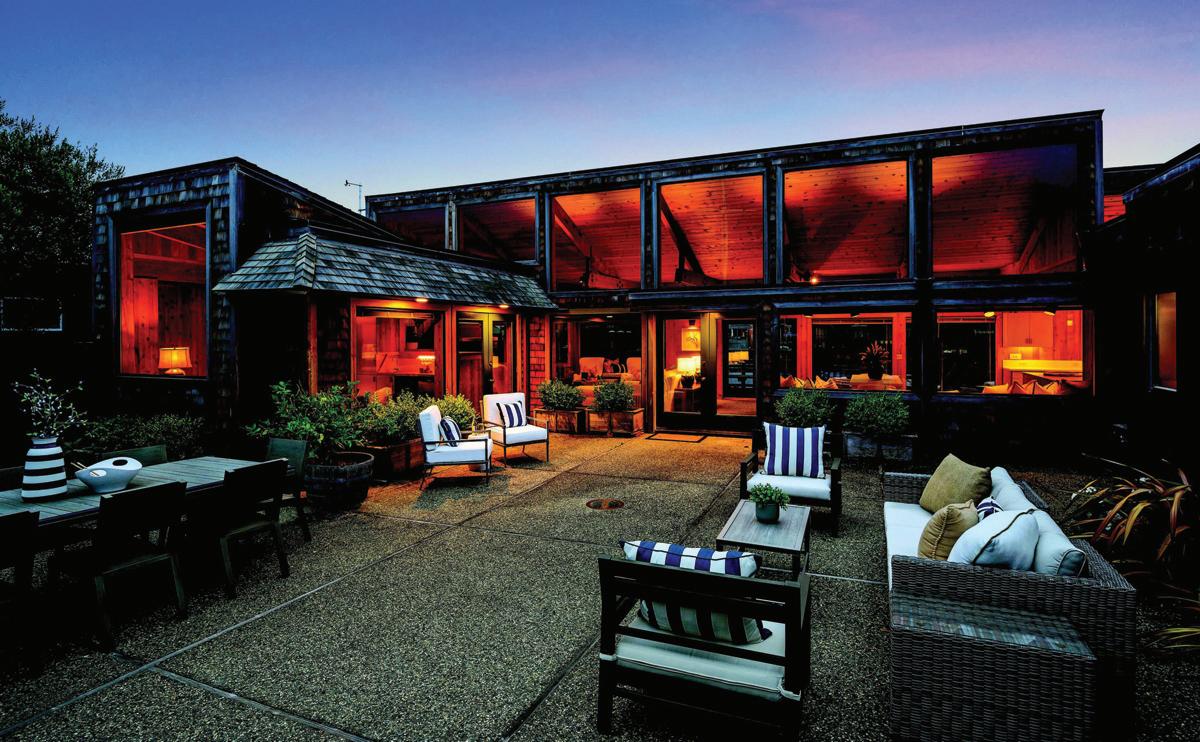
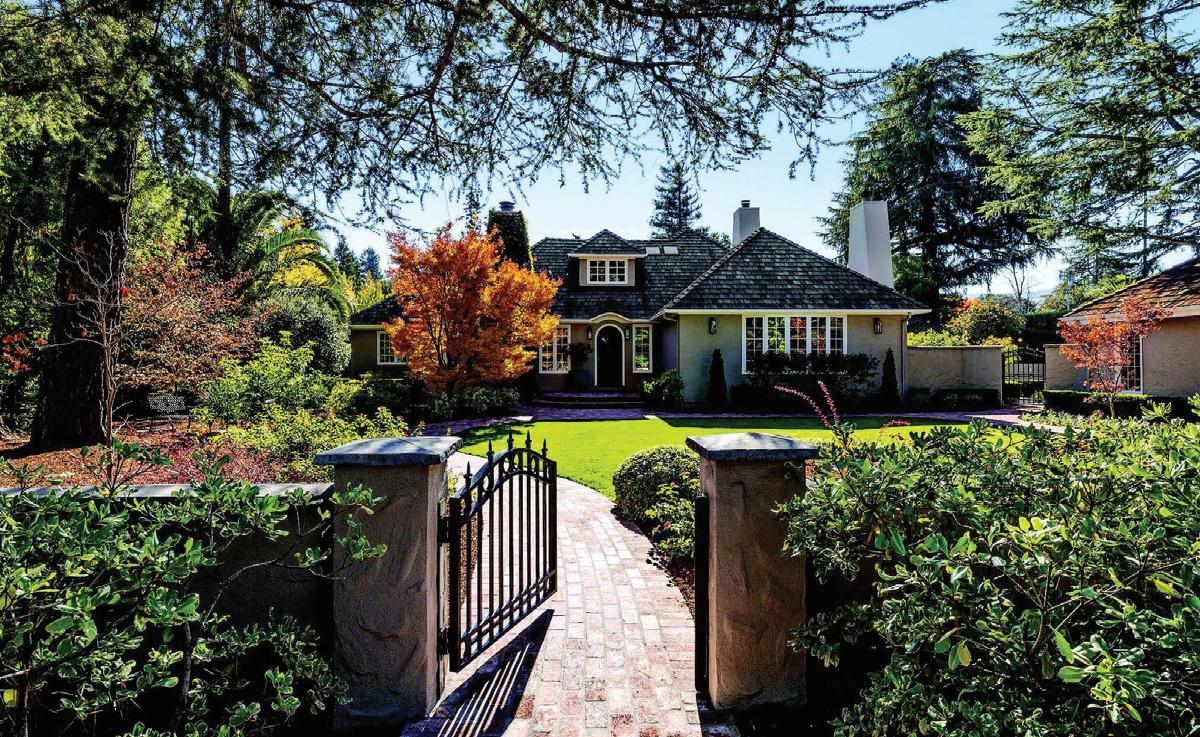
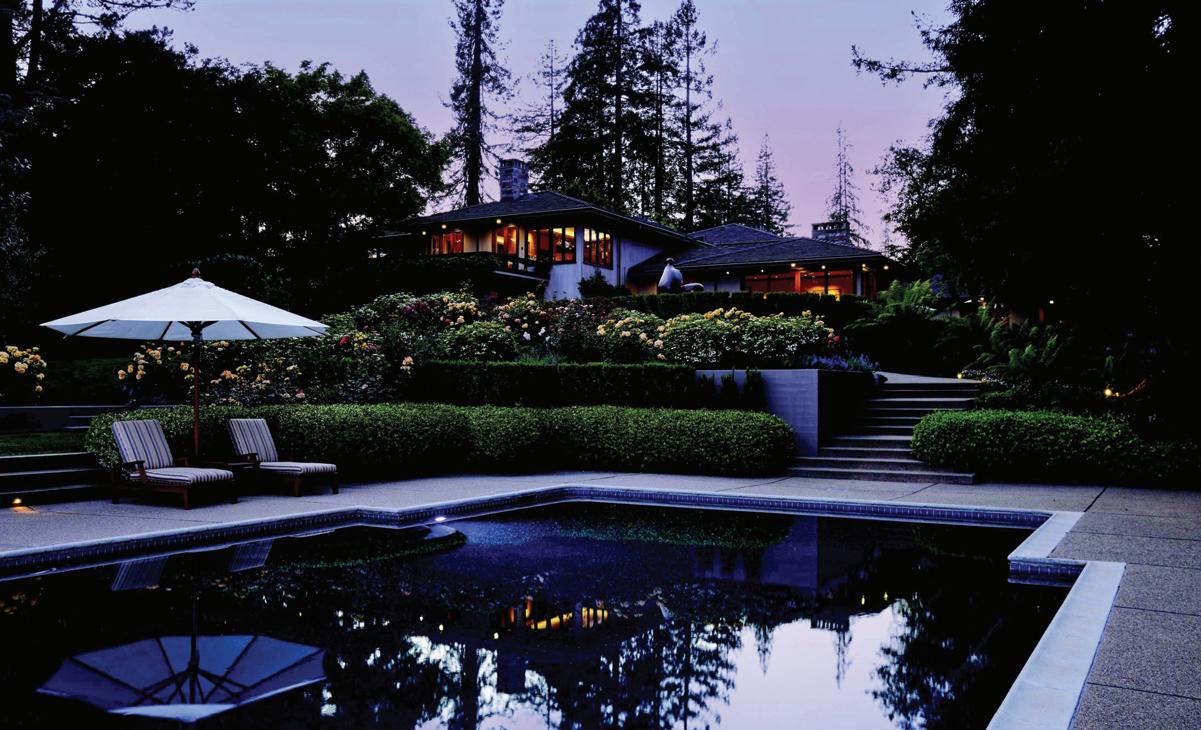
A+W MARIN FEATURED PROPERTIES
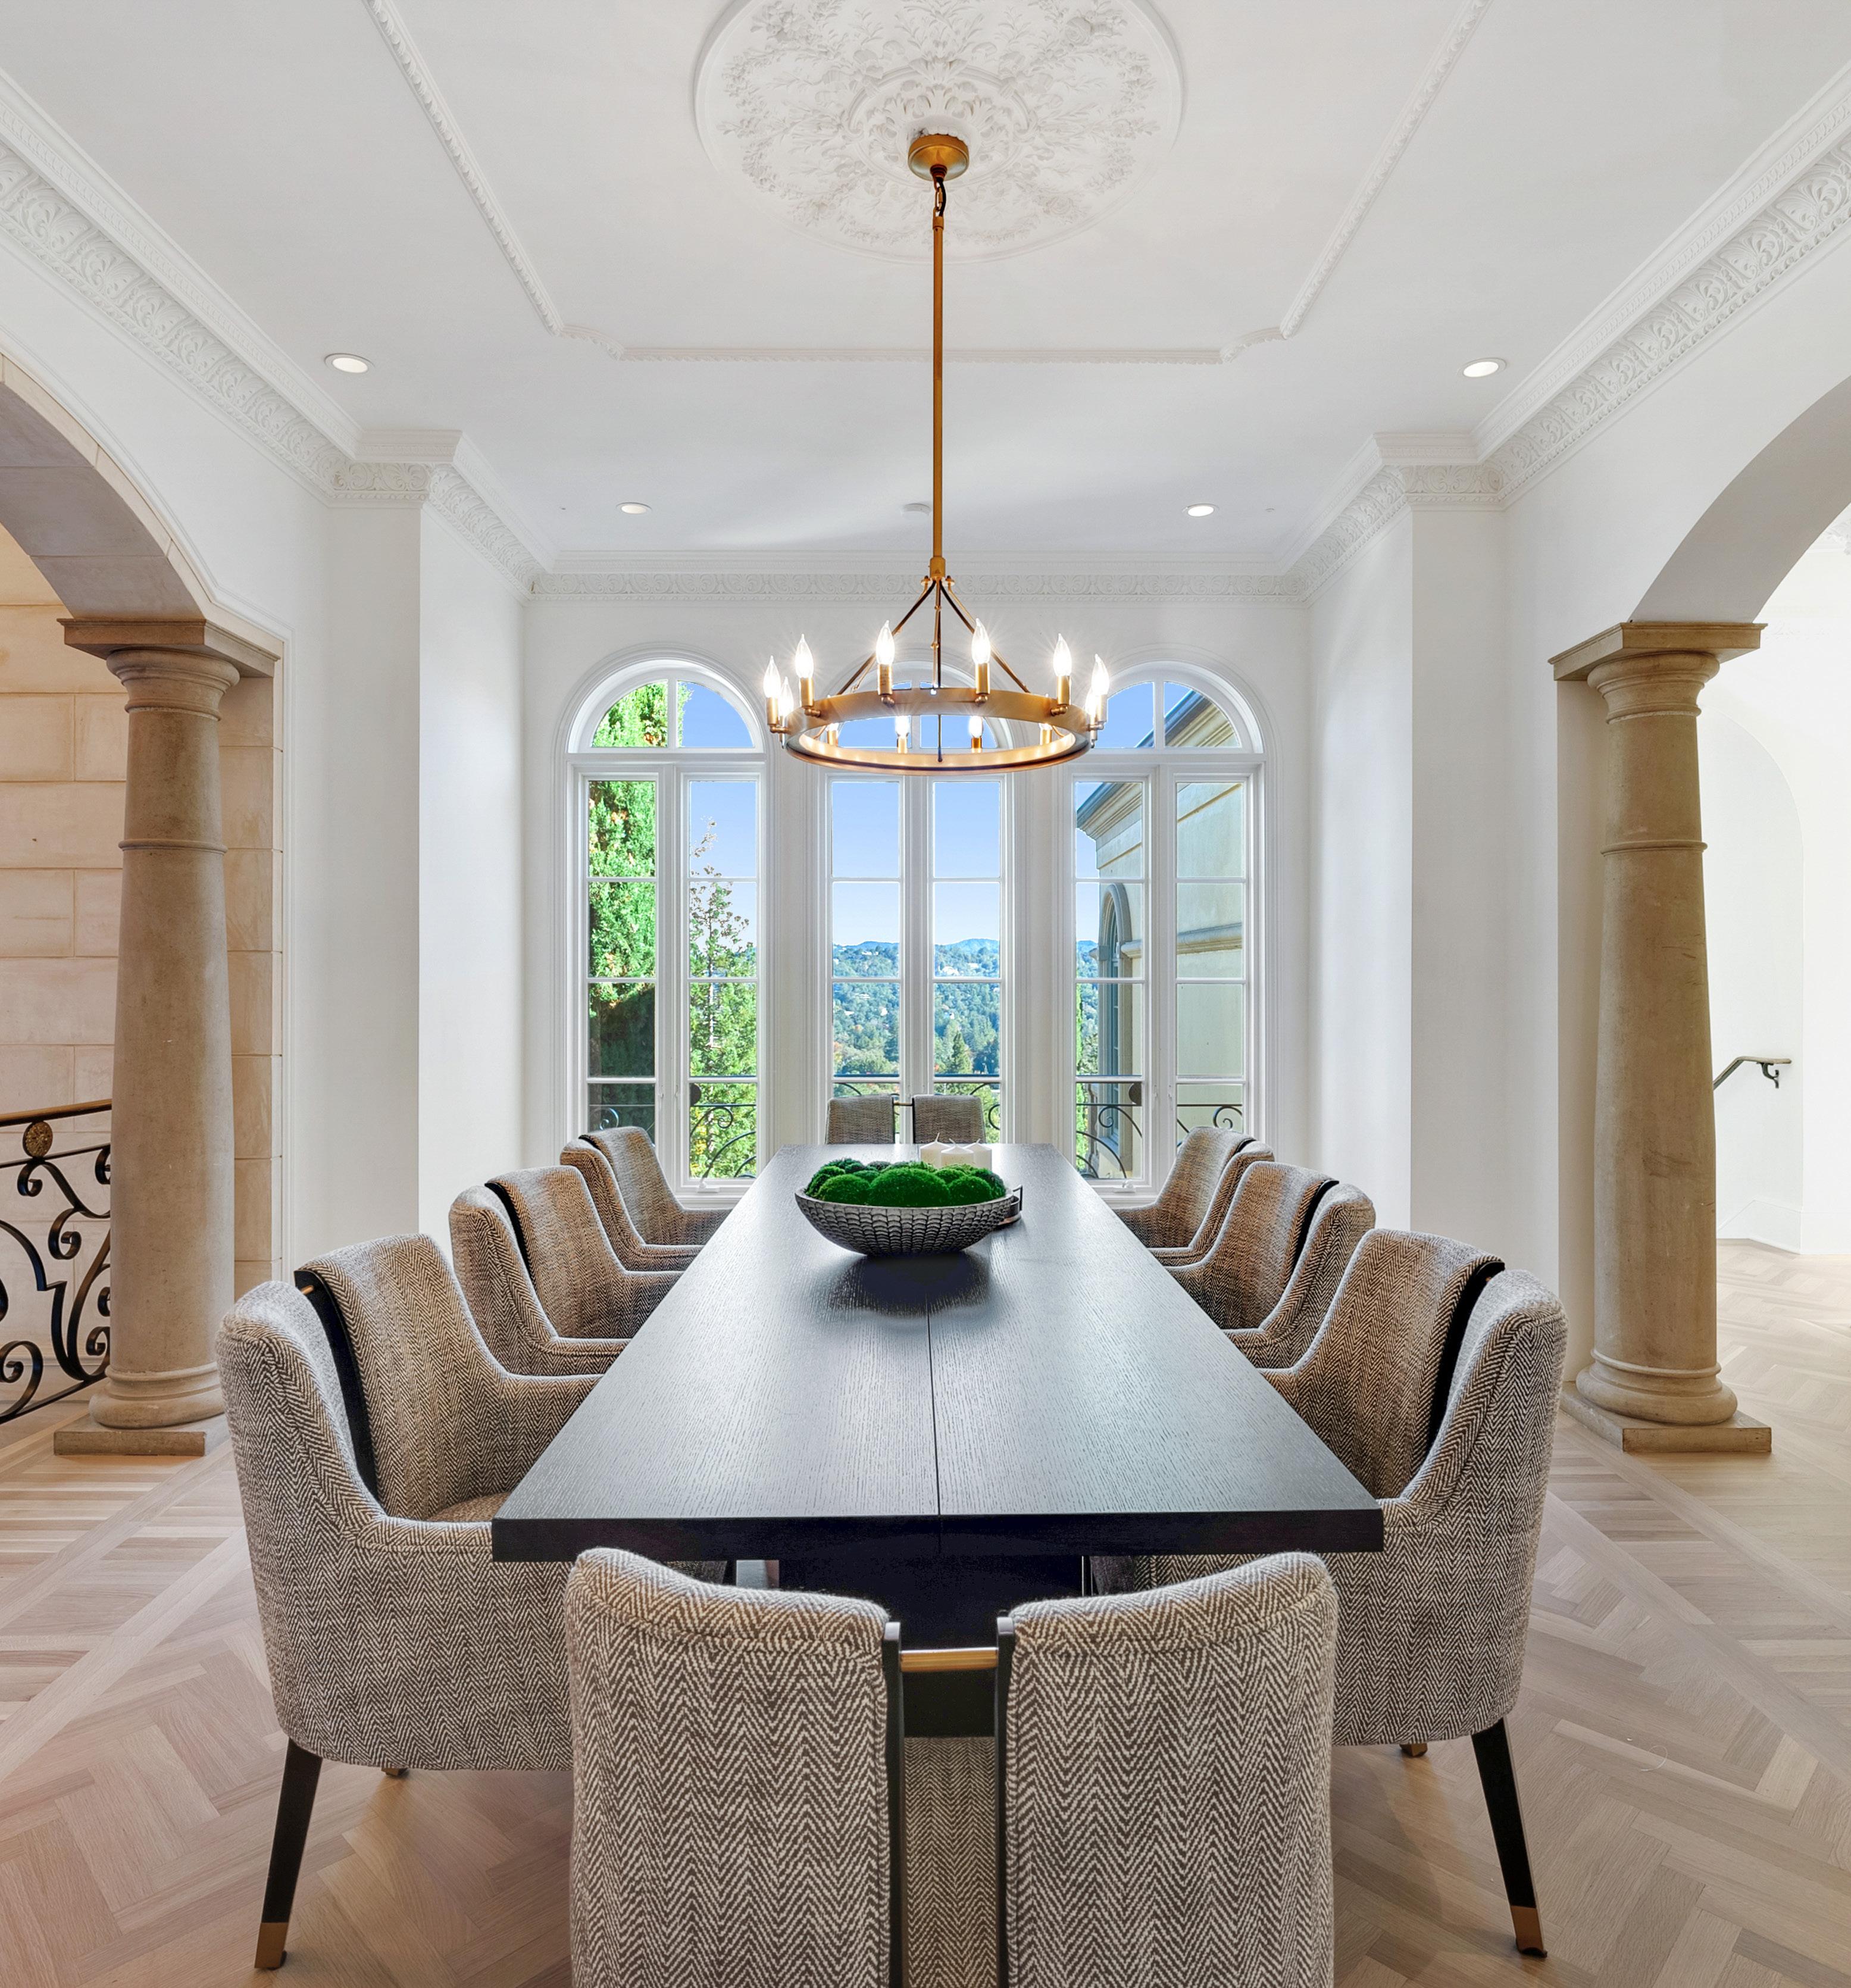
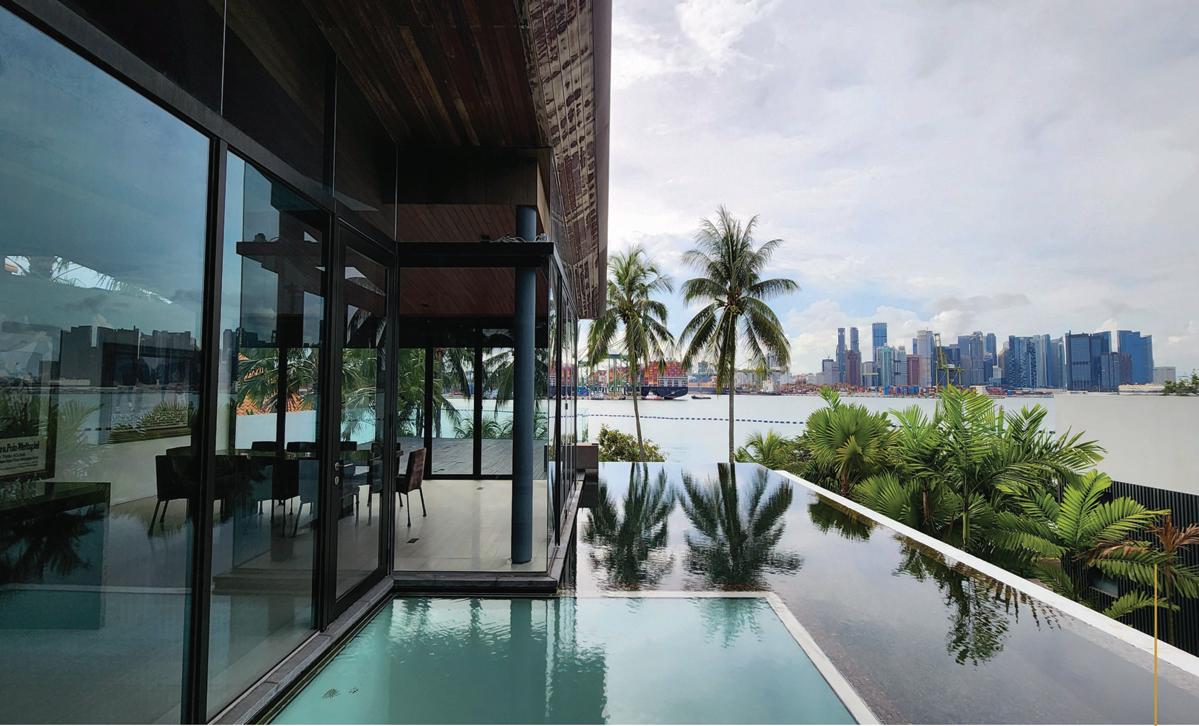
A+W SAN FRANCISCO FEATURED PROPERTIES
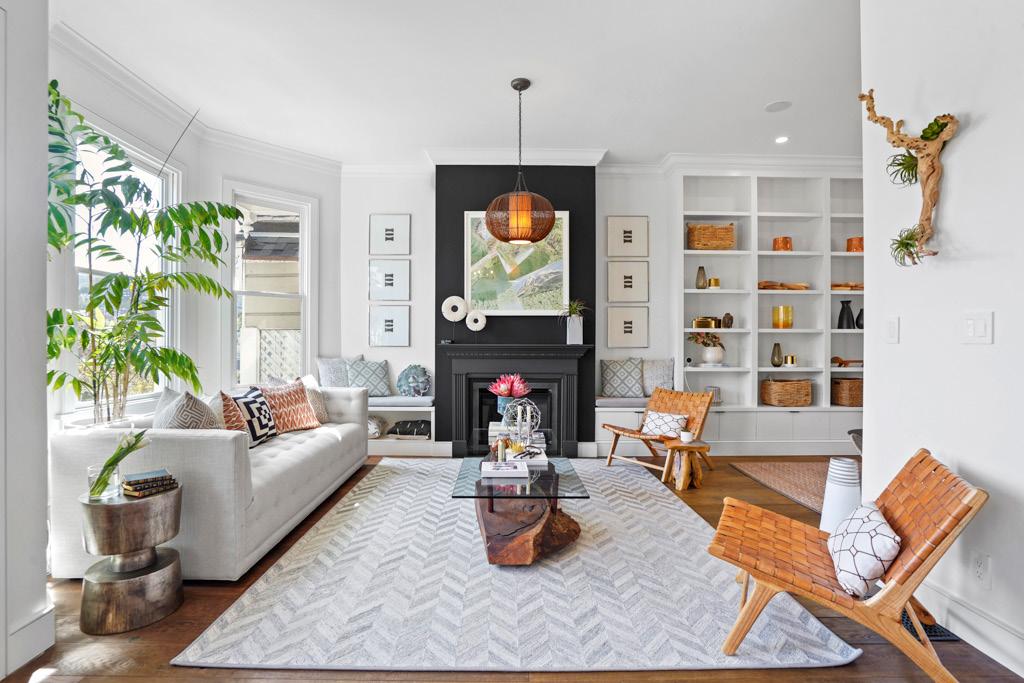
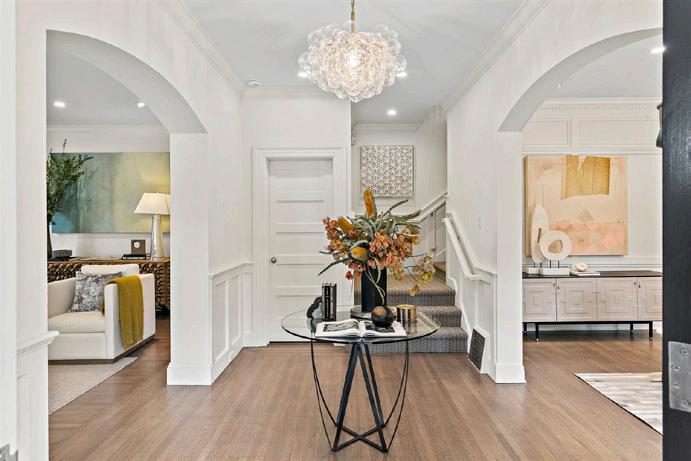
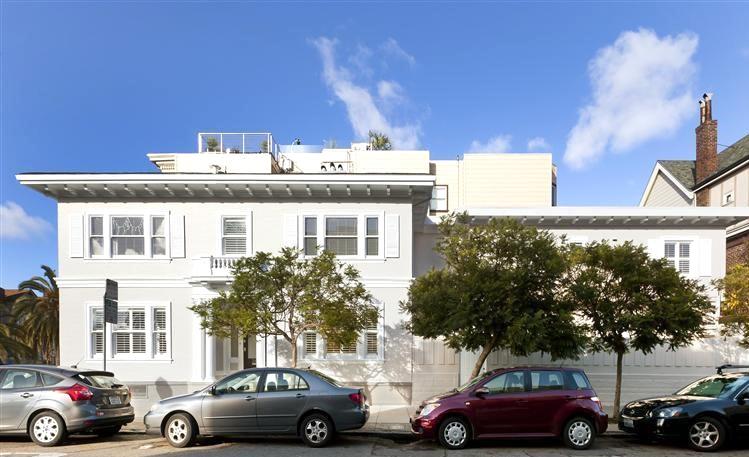
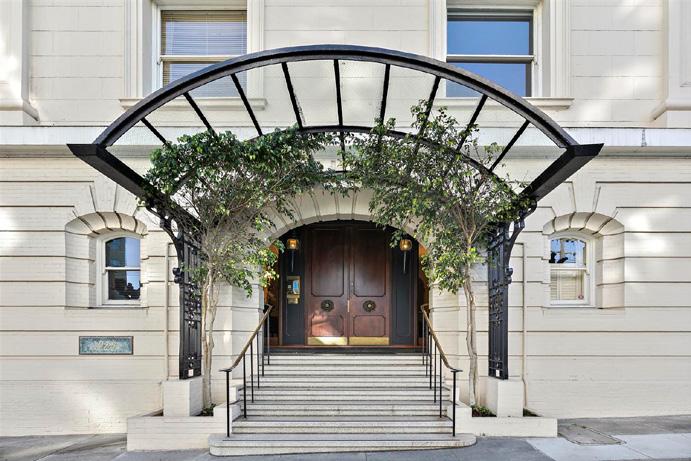
FAST FACT : The Applegarth + Warrin Team sold over $120 Million in 2022.
SOLD NOE VALLEY Represented Buyer $5,800,000 SOLD NOE VALLEY Represented Buyer $5,650,000
SOLD LAKE DISTRICT Represented Buyer $4,205,000 SOLD NOE VALLEY Represented Buyer $4,712,500 FOR SALE COW HOLLOW Graceful Cow Hollow Home $9,495,000 SOLD NOE VALLEY Sold Over Asking $6,250,000 SOLD COW HOLLOW Iconic Cow Hollow Home $5,875,000 SOLD COLE VALLEY Represented Buyer $5,505,000 SOLD PACIFIC HEIGHTS Pinnacle of Pacific Heights $4,750,000
9
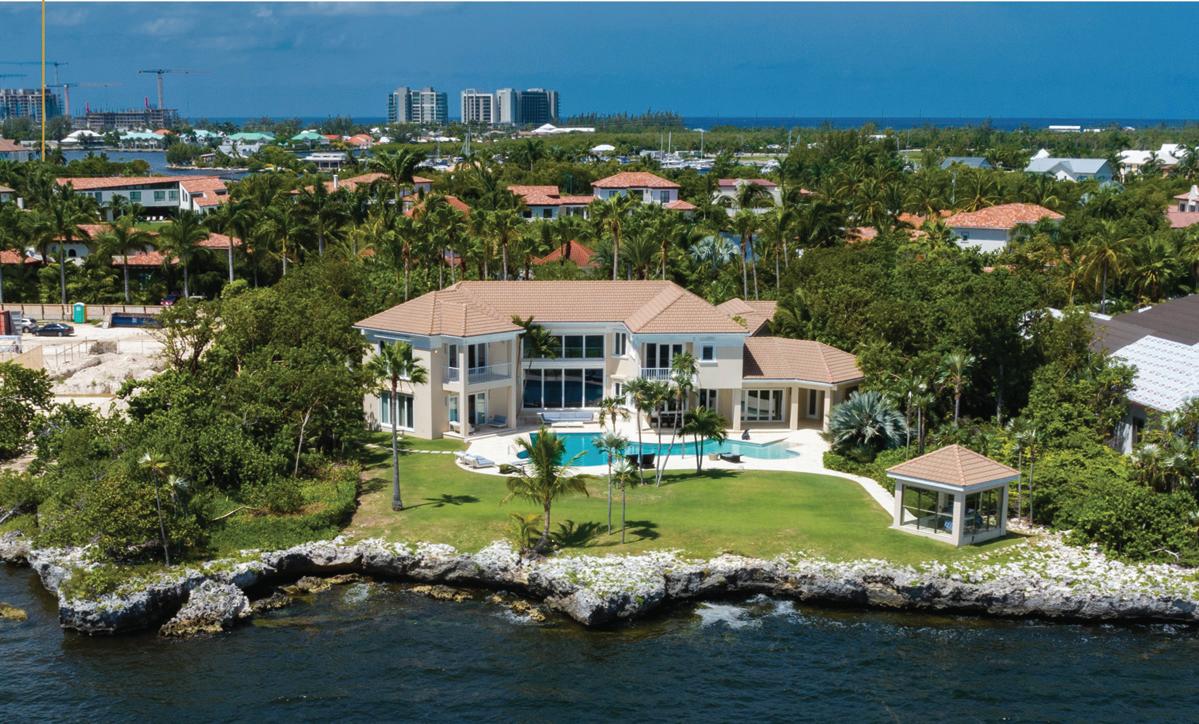
BELVEDERE
REPRESENTED BUYER
27 WINDWARD I $6,800,000
10
11
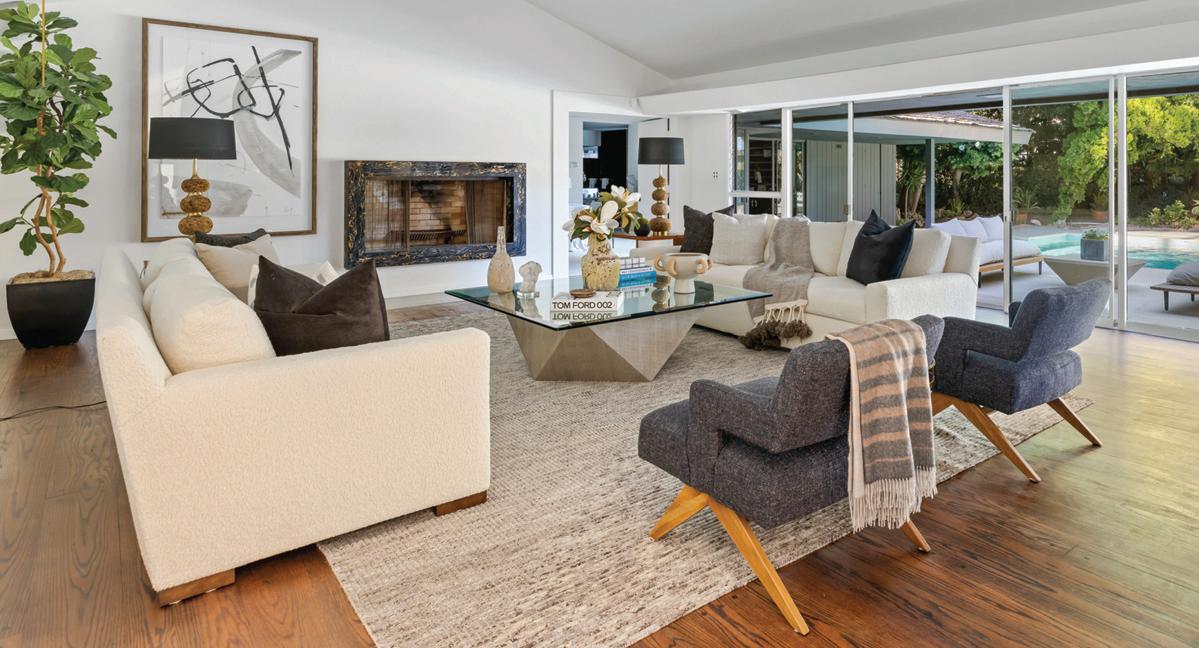
SAN FRANCISCO BAY AREA HOUSING MARKET

AN UP AND DOWN YEAR
The past year was marked by strong for-sale housing market conditions followed by a modest softening in the second half of the year. Driven primarily by the surge in mortgage rates, some buyers returned to the sidelines — interested in entering the ownership market yet wary of affordability and household finances. However, at the higher end of the pricing spectrum, buyer activity performed relatively better in the last year, particularly within prime neighborhoods.
UNDERLYING ECONOMIC STRENGTH
The regional economy remained strong even as headwinds such as elevated inflation, weakened consumer confidence and layoff announcements threatened to slow the expansion. The labor market is surprisingly strong, with the unemployment rate at 2.6%. In 2022, roughly 165,000 jobs were created throughout the region. The tight labor market continued to buoy household finances with strong wage
growth across a range of industries. Government programs and subsidies for pandemic and inflation-related issues also helped consumers to continue to purchase discretionary goods and services.
SF Bay Area Job Creation (in thousands)
Napa Santa Cruz San Francisco San Mateo Alameda BayArea Santa Clara Marin Contra Costa Sonoma Solano -17.6% -4.5% -1.3% 0.0% 0.4% 0.7% 0.8% 1.9% 2.5% 5.4% 5.8% 200 300 163.5
Median Price Increased above $2 million (2018 vs. 2019)
Sources: MLS, RCG
SF Bay Area Unemployment Rate
0% 2% 4% 6% 8% 10% 12% 14% 16% 2001 2002 2003 2004 2005 2006 2007 2008 2009 2010 2011 2012 2013 2014 2015 2016 2017 2018 2019 202 0 20 21 20 22 Peak: 13.7% MAY 2020 2.6% NOV 2022 12
Source: US Bureau of Labor Statistics. Data through November 2022, seasonally adjusted.
SF Bay Area Job Creation (in thousands)
PACE OF SALES CALMS FROM RECORD-SETTING 2021
In 2022, more than 46,000 single family homes sold across the SF Bay Area, a decrease of roughly 26% from the previous year. It is no surprise that sales activity slowed from the record-setting pace of 2021 and returned to near 2020 levels. The low number of available homes available during the year likely would have decreased achievable sales totals in 2022 even if mortgage rates did not increase. The number of closed sales fell in all counties in the SF Bay Area, led by Sonoma County. The smallest decreases of roughly 20% were in San Francisco and Solano counties.
PRICE TIERS BEHAVE DIFFERENTLY
The higher mortgage rates and decreased affordability hampered activity at the lower price tiers. Additionally, recent price increases have shifted many homes out of the lowest price tier. The number of homes sold for less than $750,000 declined by 31%, while sales in the $750,000 to $1 million range fell by approximately 25%. Though still lower than one year ago, sales of homes priced between $2.5 million and $5 million decreased by roughly 16%, much less than the decrease in the lower price ranges.
As more employers focus on the majority of days spent at the workplace rather than working from home, households made a choice to locate closer to workplaces in many cases, helping to bolster demand and pricing. The international buyer segment has yet to fully recover, with the strong dollar a deterrent for some potential buyers. While the importance of this segment varies by neighborhood, the lack of a recovery of international purchase activity helped produce the lower sales volume.
Sources: BLS, RCG; as of November 2022 -500 -400 -300 -200 -100 0 100 200 300 19911992199319941995199619971998199920002001200220032004200520062007200820092010201120122013201420152016201720182019202020212022 179.9 241.8 -410.3 65.7 78.8 78.2 100 121.9139.5 118 144 74.6 22 -180.8 -80.6 51.7 55.1 47 25.7 -63.5 -107.4 -222.1 163.5 98.3 81.5 142.9 116.3 97.2 23.1 19.4 -38.7 -36.2 Source: US Bureau of Labor Statistics. Data through November 2022, seasonally adjusted. 0% 2001 2002 2003 2004 2005 2006 2007 2008 2009 2010 2011 2012 2013 2014 2015 2016 2017 2018 2019 202 0 20 21 20 22 Jan Feb Mar Apr May Jun Jul Aug Sep Oct Nov Dec Jan 0K 1K 2K 3K 4K 5K 6K 4,298 2,666 2021/2022 Homes Sold SF Bay Area Single Family Homes Median Price SF Bay Area Single Family Homes Average Days on Market SF Bay Area Single Family Homes Sold Price as % of Original List Price SF Bay Area Single Family Homes Jan Feb Mar Apr May Jun Jul Aug Sep Oct Nov Dec Jan $0.0M $0.5M $1.0M $1.5M $1.06M $1.18M 2021/2022 40 41 2022 2021 2022 2021 Source: MLS Source: MLS 13
PRICES EASE IN SOME AREAS, INCREASE IN OTHERS
The SF Bay Area median price decreased toward the end of 2022, reaching slightly less than $1.1 million at year-end. This was off from the intrayear peak of $1.48 million in April. Though pricing was lower in most areas, bucking the trend were Solano and Sonoma counties where the median prices were flat when compared with the previous year end.
Additionally, highly desirable cities produced year-end pricing gains versus December 2021. In Alameda County, for example, where prices declined by roughly 12% county-wide, the median price increased by 4% in Alameda and more than 8% in Piedmont. Similarly, in San Mateo County where pricing was off by 15%, the median price increased in Atherton by more than 17%. In Marin County, the median price in Belvedere also increased in 2022. Throughout the SF Bay Area, prime neighborhoods, particularly those with access to desirable school districts, often outperformed other cities. In fact, when segmenting by median price, seven out of the top ten highest median-priced cities boasted price gains last year.
Further highlighting that pricing held up better in certain neighborhoods in 2022, by year-end the median price of a home sold in the $750,000
to $1.25 million and $2.5 million to $3.5 million ranges increased by roughly 1%. The median price in the less than $750,000 range fell by nearly 2% from the previous year. For homes that sold above the $3.5 million mark, the median price decreased by 2% to 3%.
MODEST INCREASES IN INVENTORY
For-sale inventory remained low even as absorption slowed, averaging 5,000 homes for sale in 2022. The range of number of listings per month was varied, with record-low inventory to begin the year and a peak of nearly 7,500 homes for sale during the summer months. The mortgage rate for most existing homeowners is lower than current rates, which deters a segment of potential sellers. Despite this, inventory increased modestly in much of the SF Bay Area. However, inventory decreased in Sonoma County and was flat in Napa County compared with the previous year.
SOME HOMES TAKING SLIGHTLY LONGER TO SELL
By the end of the year, homes in the SF Bay Area stayed on the market for longer than at the beginning of 2022, though still less than the prepandemic period. For homes that sold in the last year, the average time on market was 24 days. However, during the spring, homes spent less than 20 days on the market, on average, which increased to more than 40 days by December. Counties with larger increases in time spent on
Average Days on Market
Dec Jan 4,298 2,666 Median Price SF Bay Area Single Family Homes Sold Price as % of Original List Price SF Bay Area Single Family Homes Jan Feb Mar Apr May Jun Jul Aug Sep Oct Nov Dec Jan $0.0M $0.5M $1.0M $1.5M $1.06M $1.18M 2021/2022 Dec Jan 26 41 Jan Feb Mar Apr May Jun Jul Aug Sep Oct Nov Dec Jan 70% 80% 90% 100% 110% 120% 107.5% 96.2% 2021/2022 2022 2021 2022 2021 Source: MLS Source: MLS Jan Feb Mar Apr May Jun Jul Aug Sep Oct Nov Dec Jan 0K 1K 2K 3K 4K 5K 6K 4,298 2,666 2021/2022 Homes Sold SF Bay Area Single Family Homes Median SF Bay
SF Bay Area Single Family Homes Sold Price SF Bay Jan Feb $0.0M $0.5M $1.0M $1.5M 2021/2022 Jan Feb Mar Apr May Jun Jul Aug Sep Oct Nov Dec Jan 0 10 20 30 40 26 41 2021/2022 Jan Feb Mar 70% 80% 90% 100% 110% 120% 2021/2022 2022 2022 2021 2022 2021 2022 2021 2021 Source: MLS Source: MLS Source: MLS Source: MLS 14
Frenetic Pace of Spring Market Moderates
Average Days on Market by County in 2022
Median Price
the market for closed sales included Contra Costa and Santa Clara counties, while the amount of time in Napa County was virtually unchanged.
Even with the increase in time on the market throughout the SF Bay Area, well-priced homes sold relatively quickly. Homes in less desirable neighborhoods, as well as those where seller expectations may be different than that of buyers, sat on the market for longer periods. These unsold listings, in part, drove the average of all homes still available on the market to more than 90 days. Additionally, vacation homes in some markets remained on the market for an extended period, leading the average time on market for active listings to increase to more than 100 days in
Sold Price as % of Original List Price
BUYER COMPETITION EASES
Though buyer demand persists, competition slowed into the end of the year as some potential buyers returned to the sidelines. Early in the year, multiple bids and closes greater than the asking price were often the norm. In the first half of the year, nearly 80% of transactions closed at greater than the list price. In the second half of the year, the share dropped to roughly 40%.
LOOKING AHEAD
The last year highlighted the depth of demand for housing in the SF Bay Area as home values, number of sales and scarce inventory hit record levels early in the year. This past year also displayed the impact of higher mortgage rates, declining affordability and diminished consumer confidence on the housing market.
Despite the headwinds, the underlying demand for housing in the SF Bay Area should maintain a moderate pace of sales in 2023 though home prices may fall. Near-term economic issues such as a reduction in tech employment may reduce buyer competition but the attractiveness of ownership combined with the amenities and access to leading employers will maintain and attract new residents to the SF Bay Area.
Marin, Napa, Santa Cruz and Sonoma counties.
2007200820092010201120122013201420152016201720182019202020212022 179.9 241.8 -410.3 65.7 78.8 78.2 100 121.9139.5 118 144 74.6 22 -180.8 -80.6 51.7 JanFebMarAprMayJunJulAugSepOctNovDec 0 10 20 30 40 50 60 70 56 Sonoma 56 Solano 37 Santa Cruz 30 Santa Clara 37 San Mateo 36 San Francisco 67 Napa 43 Marin 41 Contra Costa 32 Alameda 2022 Nov Dec Jan 4,298 2,666
Source: MLS, Sold Single Family Homes
SF Bay Area Single Family Homes
SF Bay Area Single Family Homes Jan Feb Mar Apr May Jun Jul Aug Sep Oct Nov Dec Jan $0.0M $0.5M $1.0M $1.5M $1.06M $1.18M 2021/2022 Nov Dec Jan 26 41 Jan Feb Mar Apr May Jun Jul Aug Sep Oct Nov Dec Jan 70% 80% 90% 100% 110% 120% 107.5% 96.2% 2021/2022 2022 2021 2022 2021 Source: MLS Source: MLS 15


16
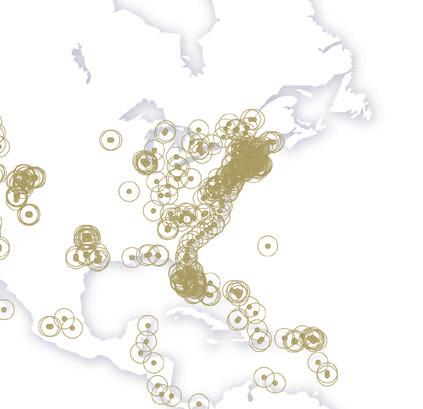
WORLD’S LARGEST REFERRAL NETWORK


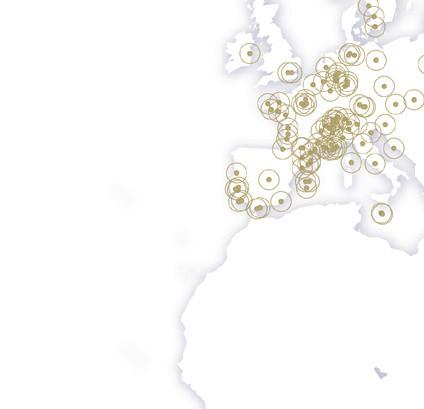
WE CAN FIND QUALIFIED BUYERS AROUND THE GLOBE BY ACTIVATING OUR WORLDWIDE AGENT NETWORK
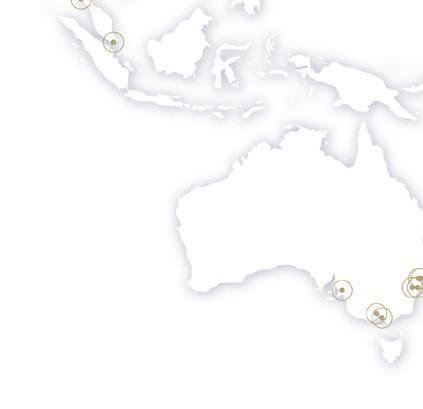


25,000 SALES ASSOCIATES

1,000+ OFFICES

77 COUNTRIES
ALL WORKING FOR YOU
SOTHEBY'S INTERNATIONAL REALTY WORLDWIDE
REACH
The Sotheby’s International Realty brand is a collection of the finest real estate companies in the world. Today our network boasts more than 25,000 affiliated independent sales associates, located in over 1,000 offices, in 77 countries and territories worldwide, placing over 15,000 referrals every year

Global Marketing | Worldwide Network
17
LINCOLN I $7,050,000
MILL VALLEY
LISTED BY APPLEGARTH + WARRIN
14
18
19
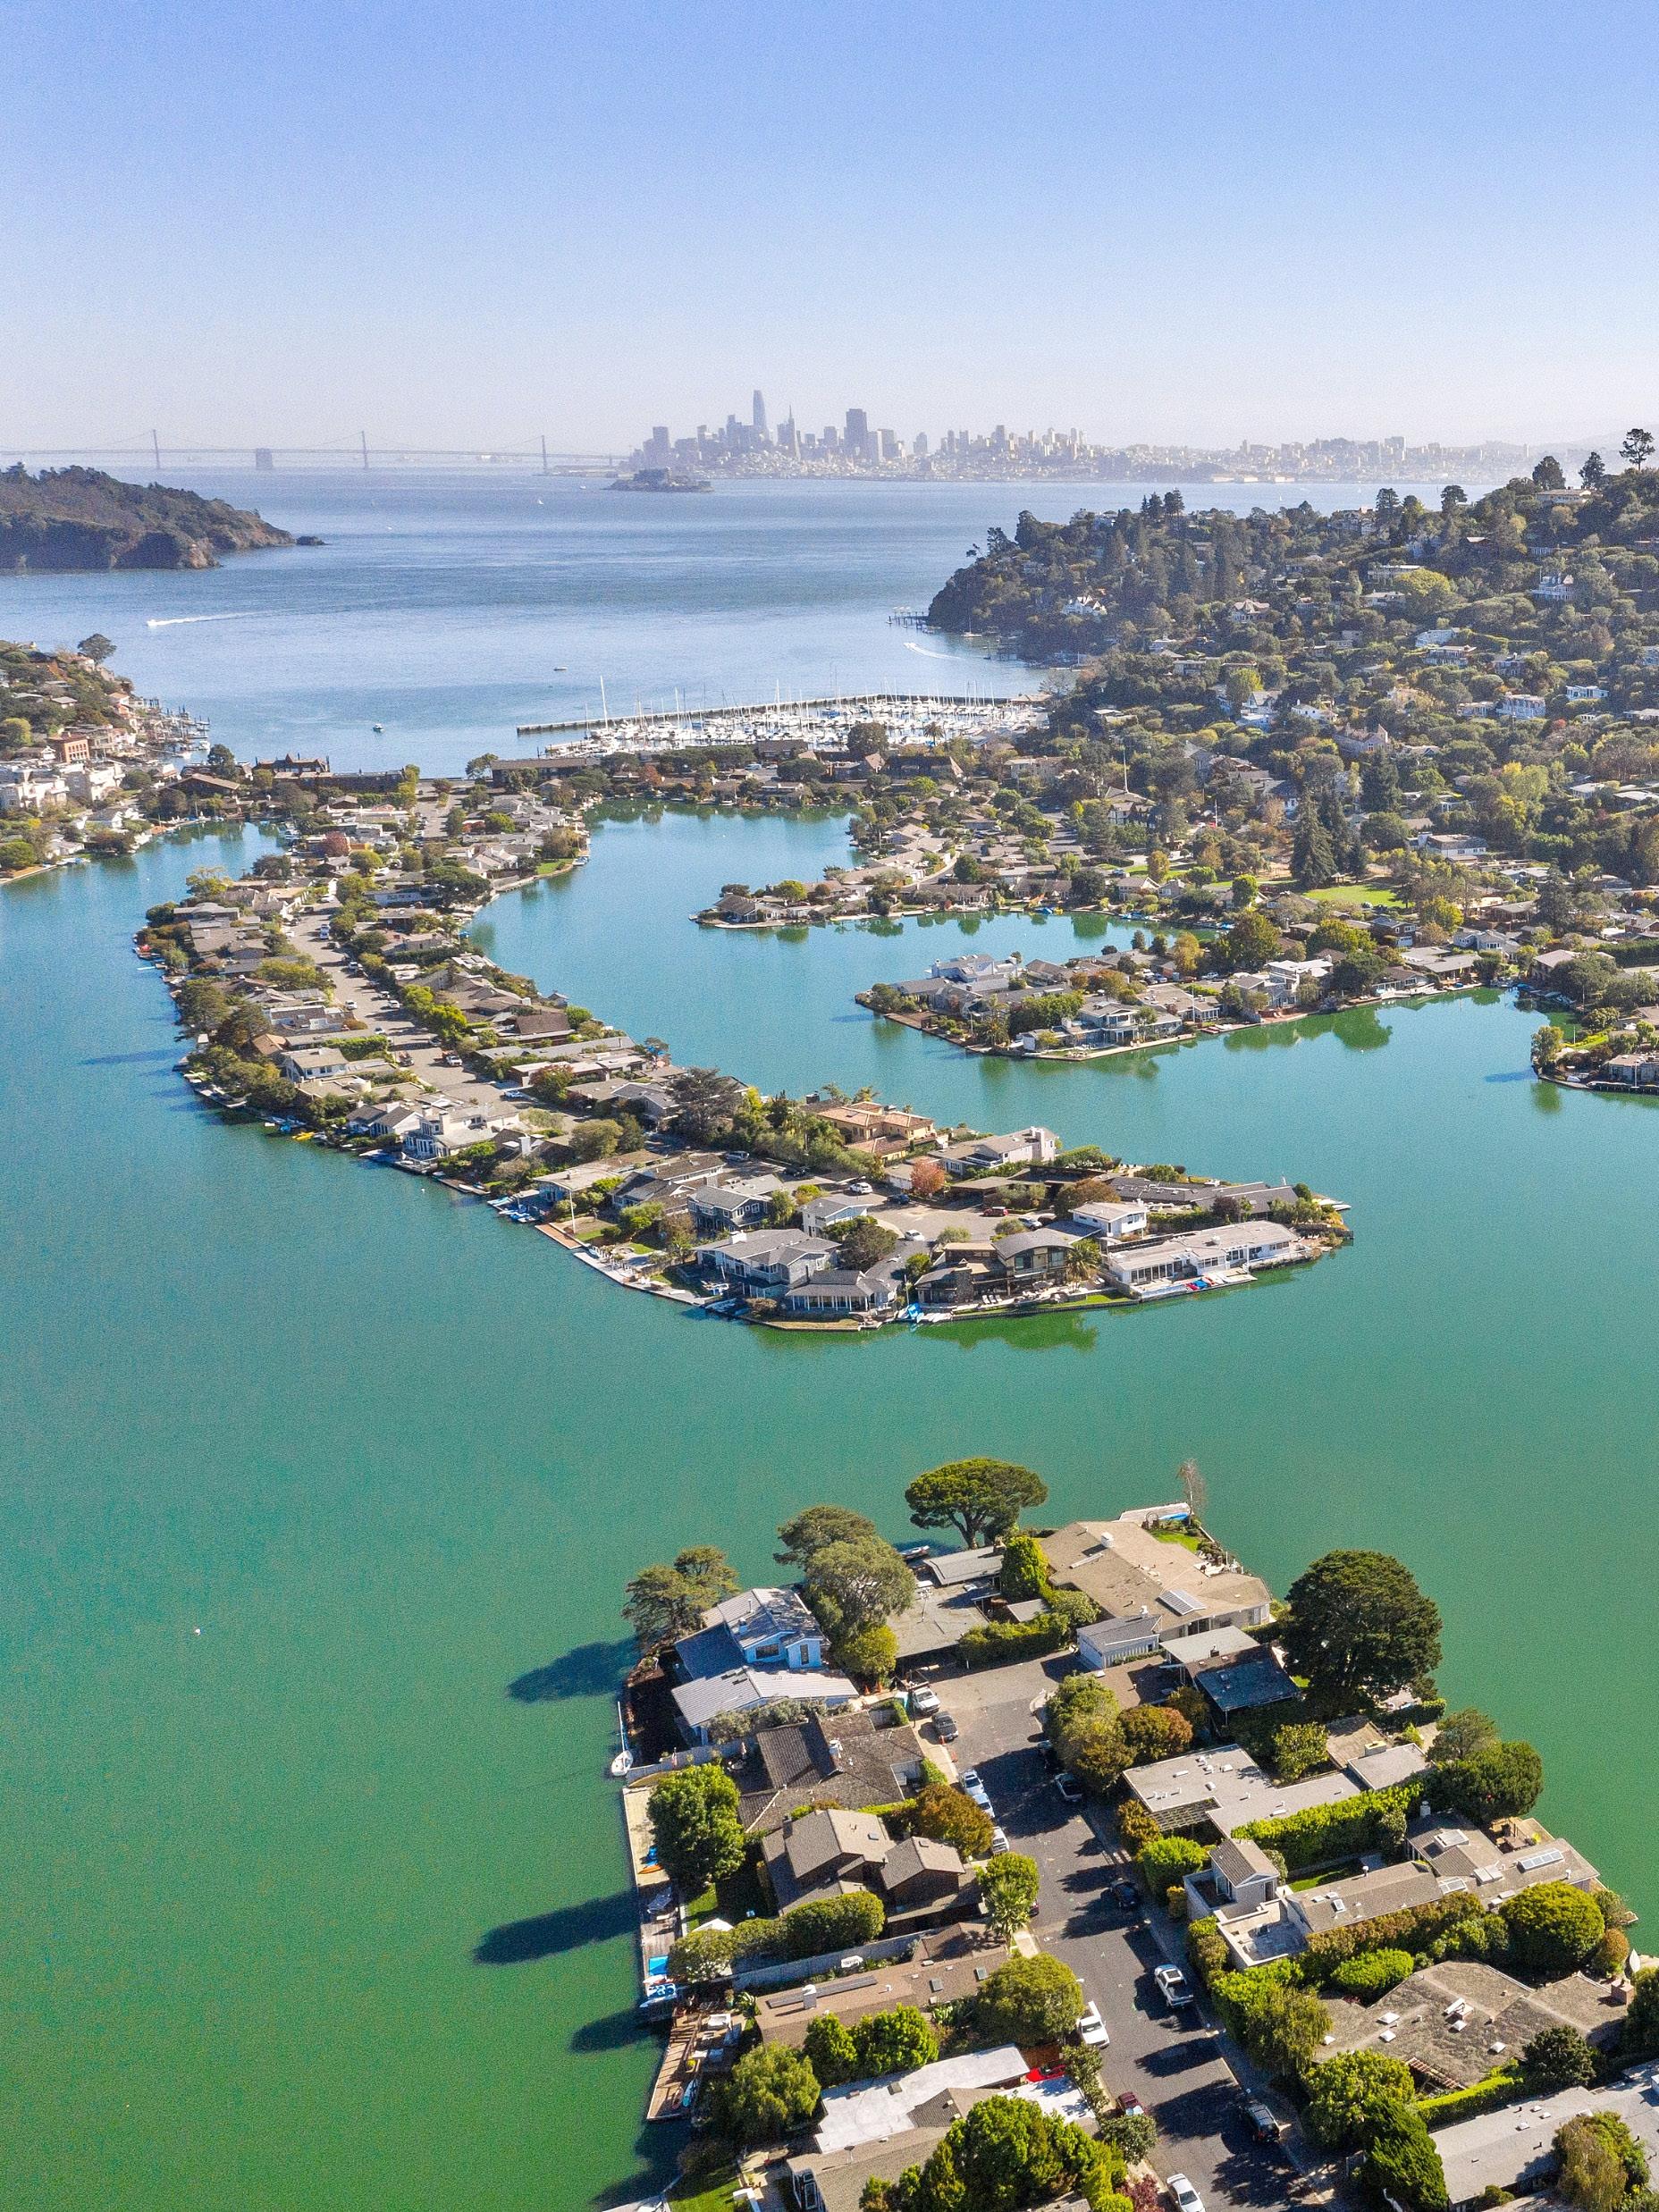
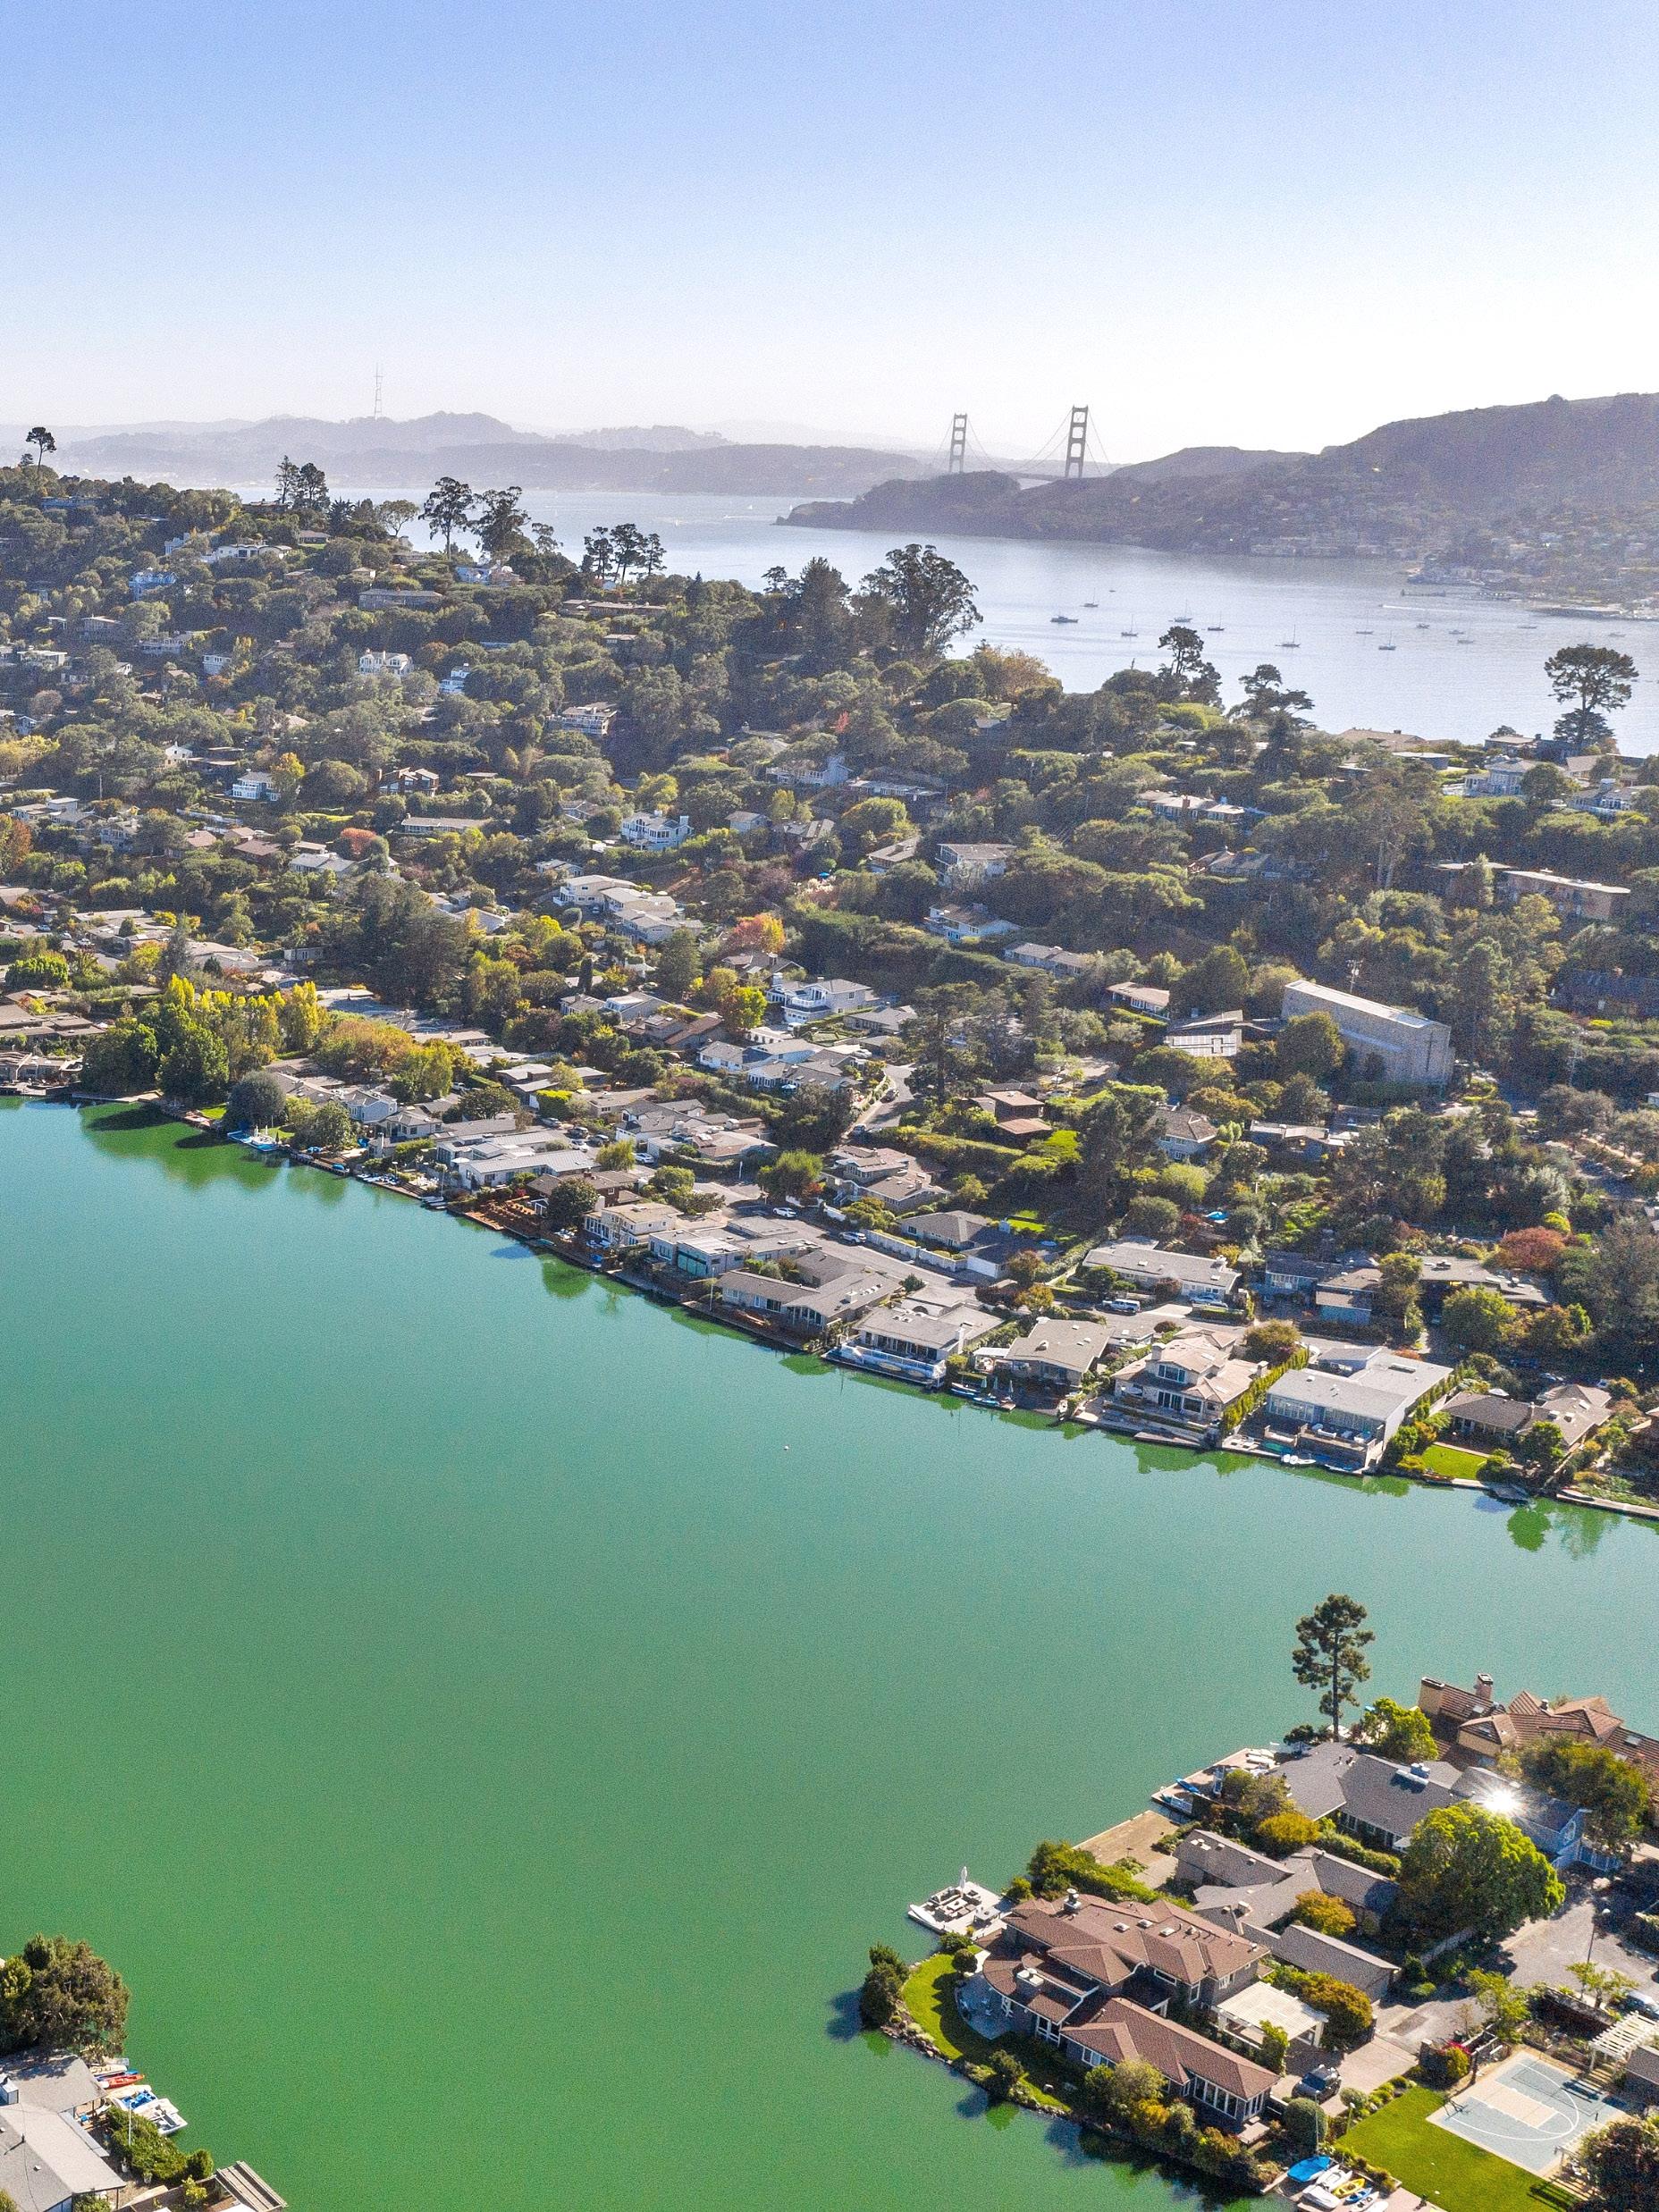
SOUTHERN MARIN

MEDIAN SALES PRICES : 2008 - 2022
Graph shows themonthly median sales price for existing single familyhomes in southern Marin County, along with a 12-month rolling average. The rolling average smooths out seasonal variations to give a clear picture of long term trends. Includes Belvedere, CorteMadera, Greenbrae, Kentfeld, Larkspur, Mill Valley, Ross, San Anselmo, Sausalito, Tiburon.
2011 2012 2013 2014 2015
$1,500,000 $2,000,000 $2,500,000
12 MONTH ROLLING AVERAGE 20092010 MONTHLY MEDIAN 20

2016 2017 2018 2020 2021 2022 2019
21
High $2,800,000 April 2022
LUXURY MARKET SALES SUMMARY
22
SAN FRANCISCO BAY AREA LUXURY MARKET
Golden Gate Sotheby’s International Realty serves the SF Bay Area luxury home market with exclusive access to the largest international “Luxury MLS” — the Sotheby’s International Realty listing syndication platform, which includes sothebysrealty.com and partners that include Mansion Global, The Wall Street Journal, Barron’s, Financial Times, James Edition and Juwai, just to name a few. The platform allows buyers from around the world to locate luxury homes in the SF Bay Area and beyond.
2022 Luxury Sales by County and Sale Price
2022 LUXURY SALES
Sales at the highest-end of the market dropped slightly in 2022 from the luxury boom that was 2021, but remained more than 60% above 2020 levels.
2022 Luxury Sales by Price Band

The highest priced sale recorded in the MLS in 2022 was for a 15,288-square-foot home on a 45-acre vineyard property in St. Helena in Napa Valley wine country. Of the top ten highest sales for the year, seven were in San Mateo County, and one in each in Napa, Santa Clara, and Marin counties.
For an in-depth review of the luxury housing market worldwide, see luxuryoutlook.com
Sales Trends by Price Band
County $5M $10M $15M $20M $25M $30M $35M Sale Price
COUNTY 050100150200250300350400450500550600650 Number of Sales Santa Clara San Mateo San Francisco Marin Contra Costa Alameda Napa Sonoma Santa Cruz 260 113 16 16 10 1 1 2 2 Santa Clara San Mateo San Francisco Marin Contra Costa Alameda Napa Sonoma Santa Cruz 4 20 119 133 129 494 60 45 57 7215 871 2216 10 2813
2017 2018 2019 2020 2021 2022 0 500 1000 1500 2000 477 589 564 762 1,535 $4-6m: 1,229 172 218 187 233 497 $6-10m: 390 45 66 52 74 138 $10m+: 118
Luxury Price Bands $10m+ $6-10m $4-6m
Q3 REPORT 2022 Significant Sales OUR BROKERAGE’S SIGNIFICANT SALES 23
2022
ANN UA LSALE S BY CIT Y· SINGLE FA M ILY HOM ES
Average Sale Price Median Sale Price High Sale Avg Price/SF # of Sales DOM City 2022 ±% 2022 ±% 2022 2022 ±% 2022 ±% 2022 ±% Belvedere $5,771,827 -4.0% $4,317,500 -6.5% $19,500,000 $1,925 7.7% 22 -52.2% 49 -43.4% Bolinas $2,029,000 -25.6% $2,000,000 -4.8% $2,775,000 $1,601 23.3% 5 -61.5% 20 -63.1% Corte Madera $2,135,702 5.9% $2,000,000 5.8% $4,350,000 $1,128 9.2% 93 -7.0% 20 14.6% Dillon Beach $1,408,000 -15.1% $1,415,000 -16.8% $2,300,000 $944 15.7% 5 -44.4% 22 -13.5% Fairfax $1,463,892 1.8% $1,400,000 9.8% $3,730,000 $848 6.7% 94 -17.5% 25 -5.5% Fallon $100,000 -97.7% $100,000 -97.7% $100,000 $47 -98.8% 1 0.0% 16 700.0% Forest Knolls $1,042,125 13.4% $880,000 -0.3% $3,540,000 $560 -6.4% 12 0.0% 43 15.9% Greenbrae $2,418,392 18.7% $2,300,000 15.6% $4,750,000 $996 6.7% 37 -37.3% 21 3.4% Inverness $1,609,118 -26.5% $1,500,000 -0.7% $3,000,000 $1,050 14.9% 17 0.0% 17 -64.8% Kentfield $3,950,685 14.1% $3,337,500 19.2% $11,500,000 $1,211 6.4% 54 -31.6% 29 10.2% Lagunitas $1,559,000 17.5% $1,265,000 -1.0% $4,000,001 $899 74.8% 11 37.5% 54 32.0% Larkspur $2,884,037 16.6% $2,700,000 17.4% $5,675,000 $1,258 13.2% 54 -34.9% 24 21.0% Marshall $3,600,000 134.1% $3,600,000 134.1% $3,600,000 $3,000 135.8% 1 -50.0% 8 -80.7% Mill Valley $2,661,763 4.8% $2,220,000 5.7% $15,900,000 $1,167 12.2% 324 -19.6% 22 -16.7% Muir Beach $3,701,667 -28.2% $4,700,000 -8.8% $4,805,000 $1,953 47.8% 3 50.0% 4 -91.3% Nicasio $3,456,063 150.4% $3,437,125 186.4% $4,650,000 $1,005 88.3% 4 33.3% 36 -57.5% Novato $1,448,191 8.8% $1,300,000 8.2% $8,000,000 $679 12.2% 459 -26.6% 25 -6.6% Olema † † † † † † † 0 † † † Pt. Reyes Station $2,741,429 -18.4% $2,495,000 4.1% $4,850,000 $1,403 -26.5% 7 16.7% 42 100.0% Ross $6,557,632 4.9% $5,200,000 22.4% $18,000,000 $1,607 7.6% 19 -54.8% 24 -38.8% San Anselmo $2,139,407 7.7% $1,828,000 7.4% $5,500,000 $975 9.4% 152 -38.7% 22 -7.9% San Geronimo $1,556,000 -16.1% $1,480,000 -5.0% $2,350,000 $791 12.8% 5 -50.0% 58 68.7% San Rafael $1,730,992 3.4% $1,580,000 5.3% $5,800,000 $861 12.5% 437 -19.8% 25 -12.6% Sausalito $2,991,553 16.9% $2,575,000 18.1% $7,500,000 $1,257 20.2% 82 7.9% 22 -54.5% Stinson Beach $4,442,333 -0.1% $3,730,000 6.3% $14,250,000 $2,540 27.0% 12 0.0% 27 -5.1% Tiburon $4,218,076 12.9% $3,700,000 13.8% $17,500,000 $1,337 12.4% 113 -28.5% 25 -35.9% Tomales $1,856,250 104.8% $1,337,500 40.8% $3,650,000 $733 30.4% 4 33.3% 128 14.5% Woodacre $1,218,852 -11.2% $1,220,000 -4.3% $2,315,000 $640 -6.7% 27 80.0% 25 -53.0% Marin Co. $2,239,779 4.0% $1,800,000 7.5% $19,500,000 $984 10.5% 2054 -23.7% 25 -15.7% CONDOS Average Sale Price Median Sale Price High Sale Avg Price/SF # of Sales DOM Marin Co. $910,006 10.6% $825,000 12.2% $3,799,000 $689 9.5% 597 -24.2% 36 -7.7% †No sales recordedfor 2022.
24
MARIN COUNTY
MAR IN COU NTY· MON T HLY MARK ET TR EN DS · SINGLE FA M ILY HOM ES
Graphs show trends in market activity for the county comparing this year (dark lines) with last year (light lines)for the same period Data is gathered fromMultiple Listing Service (MLS) sources, reviewed for accuracy, and charted for easy comparison Data shown is for singlefamily homes only
Data sourcedfrom local MLS and deemed to be reliable,brokerage cannot verify data or guarantee accuracy. Data that appeared to be incorrect was notincluded in the calculations.
25
FERNHILL I $6,250,000
LISTED BY APPLEGARTH+WARRIN
18
ROSS
26

27
HIGHEST PRICED HOME SALES 2022


130 BELLA
Belvedere ListedbyCompass $1 9,500 ,000 12 UPPER
Ross ListedbySotheby’sInt.Realty $ 18,000 ,000 1860 MOUNTAIN
Tiburon ListedbySotheby’sInt.Realty $1 7,500 ,000 480
ListedbyMadroneHomes $1 5,900 ,000
$ 14,500,000
Listedby GoldenGateSotheby’sInt.Realty $ 14,250 ,000
VISTA
AMES
VIEW
THROCKMORTON Mill Valley
41 UPPER ROAD Ross ListedbytheAgency
2500 BROADWAY Pacific Heights
SINGLE FAMILY HOMES 28
HIGHEST PRICED HOME SALES 2022
8 CREST ROAD Belvedere ListedbyCompass $ 12,435,000 106 MOUNT TIBURON Tiburon ListedbyColdwellBanker $12,00 0,000 8 W
Belvedere ListedbyCompass $ 10,925,000 90 LAGOON Belvedere ListedbyColdwellBanker $ 11,50 0,000 111 GOODHILL Kentfield ListedbytheAgency $ 11,500,000 443
Belvedere Listedby GoldenGateSotheby’sInt.Realty $1 0,50 0,000
SINGLE FAMILY HOMES 29
SHORE ROAD
- 441 BELVEDERE AVE
2022 SINGLE FAMILY HOME SALES OVER $2.5M
Address Sales Price Date DOM List Price BR/BA Sq Ft $/Sq Ft Belvedere (24 homes) 130 Bella Vista $19,500,000 31-May 24 $18,000,000 4/7 5620 $3,470 8 Crest $12,435,000 20-Dec 215 $17,775,000 7/5 5980 $2,079 90 Lagoon $11,500,000 11-Mar 14 $10,500,000 3/4 2622 $4,386 8 Shore $10,925,000 12-Oct 29 $11,950,000 5/5 5728 $1,907 443 Belvedere $10,500,000 25-Feb 72 $15,000,000 4/5 3756 $2,796 95 Shore $8,927,000 1-Apr 63 $8,927,000 4/6 3810 $2,343 19 Belvedere $6,700,000 27-May 13 $4,995,000 2/3 2726 $2,458 7 Bellevue $5,050,000 31-Jan 45 $5,250,000 3/3 2515 $2,008 402 Golden Gate $5,000,000 14-Feb 171 $5,950,000 5/6 4761 $1,050 220 San Rafael $4,700,000 27-Jan 15 $4,700,000 4/2 1944 $2,418 37 Alcatraz $4,677,000 15-Sep 71 $4,977,000 5/6 3971 $1,178 126 Madrona $4,650,000 9-Dec 75 $5,850,000 4/4 3493 $1,331 230 Madrona $4,425,000 10-Jun 13 $4,400,000 3/3 3225 $1,372 60 Peninsula $4,210,000 1-Jun 0 $4,210,000 4/3 2389 $1,762 5 Golden Gate $4,150,000 11-Mar 70 $4,480,000 4/3 2810 $1,477 40 Peninsula $3,830,000 31-May 18 $3,827,000 3/2 1977 $1,937 67 Bellevue $3,700,000 7-Apr 9 $3,850,000 3/3 2274 $1,627 60 San Rafael $3,650,000 3-Feb 118 $3,977,000 4/2 1685 $2,166 30 Bella Vista $3,600,000 17-Feb 6 $3,299,000 4/3 2344 $1,536 2 Hilarita $3,495,000 4-Aug 48 $3,995,000 3/3 1744 $2,004 103 Acacia $3,009,000 20-Sep 15 $2,900,000 3/3 2236 $1,346 51 Acacia $2,810,000 19-Aug 23 $2,950,000 3/2 2243 $1,253 551 San Rafael $2,650,000 20-Sep 52 $2,850,000 2/3 1805 $1,468 148 Bayview $2,614,200 8-Jul 49 $3,100,000 3/3 2614 $1,000 Bolinas (2 homes) 155 Horseshoe Hill $5,300,000 15-Apr 96 $5,495,000 2/2 2377 $2,230 398 Tulip $2,775,000 12-Aug 0 $2,775,000 3/1 1468 $1,890 Corte Madera (25 homes) 8 Westward $4,995,000 10-Jun 0 $4,995,000 5/6 3980 $1,255 503 Corte Madera $4,350,000 9-Sep 76 $4,700,000 5/5 5303 $820 472 Redwood $3,895,000 5-May 33 $3,895,000 5/5 4115 $947 479 Montecito $3,727,000 13-Jun 4 $2,995,000 4/3 2520 $1,479 15 Lupine $3,675,000 25-Mar 4 $3,349,000 4/3 3170 $1,159 109 Walnut $3,450,000 21-Jan 0 $3,450,000 5/4 3215 $1,073 154 Crescent $3,380,000 17-Jun 7 $2,995,000 5/4 2802 $1,206 637 Redwood $3,175,000 8-Jun 42 $3,750,000 4/5 3566 $890 1 Alta $3,002,000 29-Jul 5 $2,200,000 4/2 2215 $1,355 10 Palm $2,995,000 17-Aug 24 $2,995,000 3/2 2149 $1,394 300 Summit $2,850,000 1-Jul 45 $2,850,000 4/4 2547 $1,119 8 Fairview $2,850,000 22-Jun 15 $2,950,000 4/3 2750 $1,036 89 Spindrift $2,800,000 8-Apr 7 $1,879,000 3/2 1628 $1,720 5 Merry $2,750,000 26-Jul 3 $2,350,000 4/2 2491 $1,104 13 Paloma $2,750,000 13-Jan 5 $2,195,000 5/3 2544 $1,081 1 Balclutha $2,725,000 16-Jun 7 $2,450,000 3/3 2505 $1,088 30
2022 SINGLE FAMILY HOME SALES OVER $2.5M
Address Sales Price Date DOM List Price BR/BA Sq Ft $/Sq Ft 154 Granada $2,700,000 16-Sep 12 $2,495,000 4/3 2721 $992 26 Madera del Presidio $2,665,000 14-Apr 9 $2,250,000 4/3 2460 $1,083 53 Lakeside $2,660,000 9-Nov 120 $2,899,000 3/4 1566 $1,699 610 Chapman $2,600,620 14-Jun 7 $2,195,000 4/3 2344 $1,109 33 Enterprise $2,600,000 1-Jul 4 $2,395,000 4/4 2182 $1,192 485 Montecito $2,555,555 8-Apr 7 $1,749,000 4/2 1788 $1,429 10 Presidio $2,555,000 15-Jun 9 $2,250,000 4/3 2547 $1,003 75 Redwood $2,525,000 20-May 5 $1,895,000 4/2 1932 $1,307 6 Spindrift $2,515,000 11-May 10 $1,895,000 3/2 1800 $1,397 Fairfax (5 homes) 1 Fawn $3,730,000 19-Jan 94 $3,780,000 5/4 5310 $702 16 Shadow Creek $3,000,000 12-Dec 27 $3,600,000 5/4 4790 $626 15 Deer Park $2,825,000 12-Apr 13 $2,599,000 4/4 3122 $905 103 Woodland $2,650,000 18-Apr 35 $2,695,000 4/4 3466 $765 406 Cascade $2,595,000 30-Mar 33 $2,595,000 6/0 4236 $613 Forest Knolls (1 home) 60 Arroyo $3,540,000 3-Aug 48 $3,795,000 4/4 4869 $727 Greenbrae (13 homes) 23 La Cuesta $4,750,000 16-Aug 4 $4,195,000 4/4 3346 $1,420 27 Corte Toluca $3,850,000 24-May 8 $2,995,000 5/3 3271 $1,177 75 Via Hermosa $3,750,000 22-Jun 8 $2,895,000 4/4 2765 $1,356 110 Tioga $3,500,000 16-Mar 0 $3,387,000 5/4 3045 $1,149 85 Corte Patencio $3,300,000 29-Aug 11 $2,995,000 5/5 3205 $1,030 65 Corte Toluca $3,200,000 14-Jul 17 $2,995,000 4/4 2645 $1,210 57 Via Navarro $3,150,000 19-Sep 3 $2,695,000 4/4 2459 $1,281 152 Corte Anita $3,050,000 31-May 9 $2,995,000 4/4 3345 $912 100 Bretano $2,912,000 7-Mar 6 $2,395,000 3/3 2240 $1,300 85 Corte Toluca $2,900,000 20-Apr 9 $2,395,000 4/4 2650 $1,094 5 Corte Toluca $2,750,000 27-Apr 3 $2,299,500 4/2 2169 $1,268 100 Via La Paz $2,700,000 16-Jun 8 $2,495,000 3/3 2196 $1,230 40 Corte Dorado $2,500,000 17-Nov 24 $2,500,000 4/3 2804 $892 Inverness (2 homes) 305 Vision $3,000,000 8-Apr 16 $3,000,000 2/3 2660 $1,128 16 Cameron $2,800,000 10-Mar 0 $2,475,000 3/2 2389 $1,172 Kentfield (40 homes) 111 Goodhill $11,500,000 31-Oct 2 $11,500,000 6/8 5240 $2,195 8 Woodland $10,200,000 22-Sep 38 $9,750,000 6/5 5530 $1,844 224 Woodland $10,100,000 8-Jul 7 $8,750,000 6/6 5609 $1,801 304 Evergreen $10,000,000 11-May 2 $7,995,000 5/5 4835 $2,068 203 Poplar $7,500,000 24-Aug 58 $8,745,000 6/7 7335 $1,022 111 Goodhill $6,600,000 15-Jul 0 $6,600,000 5/6 4806 $1,373 218 Poplar $6,600,000 26-May 13 $5,995,000 4/4 N/A N/A 220 Evergreen $6,320,000 17-Mar 0 $6,350,000 6/6 5028 $1,257 415 Woodland $6,000,000 17-May 28 $6,395,000 5/4 4400 $1,364 59 Manor $5,995,000 3-Jun 30 $6,450,000 5/5 4165 $1,439 31
2022 SINGLE FAMILY HOME SALES OVER $2.5M
Address Sales Price Date DOM List Price BR/BA Sq Ft $/Sq Ft 304 Evergreen $5,800,000 1-Mar 0 $5,800,000 4/5 4553 $1,274 14 Fay $5,614,000 31-Jan 7 $5,395,000 5/5 3164 $1,774 310 Goodhill $4,850,000 11-Jul 6 $3,795,000 4/4 2650 $1,830 70 Rock $4,725,000 22-Apr 0 $4,995,000 4/3 6350 $744 4 Rosebank $4,675,000 25-May 0 $4,995,000 4/3 3400 $1,375 123 Crown $4,450,000 18-Jul 7 $3,995,000 4/4 3430 $1,297 511 Goodhill $4,450,000 17-Jun 9 $4,200,000 4/5 4112 $1,082 10 Fay $4,300,000 5-Apr 2 $3,295,000 4/3 2121 $2,027 33 Rosebank $4,277,000 2-May 10 $4,000,000 5/4 3457 $1,237 120 Ridgewood $4,205,000 4-Apr 7 $2,995,000 4/3 2130 $1,974 17 Poplar $4,150,000 14-Nov 14 $4,295,000 4/6 4595 $903 1 Woodland $4,100,000 16-Dec 134 $5,295,000 4/4 3965 $1,034 10 Turnagain $4,075,000 30-Sep 9 $3,795,000 5/4 2717 $1,500 240 Evergreen $4,005,000 7-Jun 39 $3,795,000 4/4 3783 $1,059 225 Ridgewood $4,000,000 14-Jun 1 $3,495,000 4/4 3856 $1,037 14 Acacia $3,550,000 21-Mar 0 $3,550,000 3/3 2341 $1,516 245 Upper Toyon $3,500,000 4-Nov 7 $2,995,000 4/3 3480 $1,006 307 Kent $3,500,000 14-Oct 11 $3,495,000 4/4 3500 $1,000 6 Broadway $3,350,000 11-Jul 8 $2,895,000 4/3 2610 $1,284 6 Broadway $3,350,000 9-Dec 0 $3,350,000 4/3 2610 $1,284 4 Stetson $3,325,000 3-May 11 $2,750,000 5/3 2750 $1,209 160 Rancheria $3,310,000 30-Sep 60 $3,500,000 5/6 4780 $692 137 Hillside $3,200,000 5-Dec 47 $3,495,000 4/4 3495 $916 165 Upland $3,050,000 20-May 9 $2,850,000 4/4 2774 $1,099 109 Wolfe Grade $3,030,000 13-Dec 8 $2,995,000 3/4 3421 $886 90 Upper Toyon $3,000,000 23-Jun 60 $2,995,000 4/4 3309 $907 152 Hillside $2,975,000 9-Dec 19 $3,295,000 6/5 3655 $814 90 Upper Toyon $2,950,000 9-Mar 95 $3,390,000 4/4 3309 $892 50 Quisisana $2,625,000 6-Sep 10 $2,795,000 4/3 2214 $1,186 15 Oak $2,600,000 16-May 10 $2,100,000 4/3 2441 $1,065 Lagunitas (1 home) 1 Mountain King $4,000,001 23-Sep 198 $4,888,000 3/3 2170 $1,843 Larkspur (30 homes) 11 Orange $5,675,000 19-Aug 5 $5,495,000 4/4 2544 $2,231 80 Marina Vista $5,600,000 18-Nov 58 $5,995,000 5/4 4045 $1,384 49 Hillcrest $5,350,000 11-May 15 $4,250,000 4/4 4016 $1,332 10 Wiltshire $4,675,000 13-Apr 84 $4,695,000 5/5 3486 $1,341 60 Hazel $4,600,000 23-Jun 20 $4,977,000 5/4 3620 $1,271 10 La Rosa $4,450,000 10-May 4 $4,395,000 4/4 2755 $1,615 91 Corte Del Bayo $4,100,000 1-Aug 31 $3,995,000 4/3 2599 $1,578 12 Sycamore $4,050,000 10-May 1 $2,995,000 4/3 2700 $1,500 33 Drakes Cove $4,039,000 18-Apr 39 $3,980,000 4/4 4317 $936 12 Sycamore $3,750,000 5-Jul 8 $3,995,000 4/3 2700 $1,389 29 Drakes Cove $3,750,000 29-Mar 74 $3,950,000 4/5 3979 $943 15 Orange $3,725,000 10-Nov 5 $3,625,000 4/4 2300 $1,619 32
2022 SINGLE FAMILY HOME SALES OVER $2.5M
Address Sales Price Date DOM List Price BR/BA Sq Ft $/Sq Ft 170 Riviera $3,700,000 20-May 7 $2,995,000 5/4 2883 $1,283 59 Meadowood $3,650,000 17-Oct 11 $3,877,000 4/3 2565 $1,423 10 Orchid $3,600,000 31-Aug 28 $3,895,000 3/4 2340 $1,538 34 Diane $3,500,000 5-Apr 3 $2,895,000 4/3 1862 $1,880 5 Monte Vista $3,500,000 4-Nov 23 $3,500,000 4/1 2436 $1,437 323 Madrone $3,400,000 17-Jun 21 $3,323,000 5/4 3571 $952 222 Monte Vista $3,300,000 20-Apr 47 $3,000,000 4/2 1984 $1,663 30 Acacia $3,300,000 3-Oct 12 $2,895,000 3/3 2262 $1,459 432 Riviera $3,275,000 15-Nov 7 $2,495,000 3/2 2290 $1,430 352 Riviera $3,205,000 27-May 7 $2,500,000 3/2 2163 $1,482 96 Corte Del Coronado $3,100,000 27-Sep 8 $2,495,000 4/2 1984 $1,563 26 Drakes Cove $2,950,000 13-Dec 91 $3,300,000 4/4 3382 $872 9 Owlswood $2,900,000 30-Sep 3 $2,750,000 3/2 2369 $1,224 7 Murray $2,801,000 30-Mar 28 $2,800,000 3/3 2500 $1,120 14 Drakes Cove $2,750,000 15-Mar 3 $2,395,000 3/4 3100 $887 51 Olive $2,650,000 19-Dec 0 $2,500,000 3/3 1765 $1,501 7 Eden $2,650,000 3-Oct 15 $2,495,000 4/3 2310 $1,147 144 Magnolia $2,523,000 4-Oct 6 $1,995,000 3/3 1690 $1,493 Marshall (1 home) 18135 State Route 1 $3,600,000 21-Oct 8 $3,700,000 1/2 1200 $3,000 Mill Valley (132 homes) 480 Throckmorton $15,900,000 4-Aug 37 $17,500,000 5/5 5755 $2,763 9 Walsh $10,500,000 11-Apr 117 $12,500,000 6/5 5566 $1,886 108 Ethel $10,000,000 17-Jun 0 $8,995,000 4/6 5665 $1,765 2 Salt Creek $7,700,000 10-May 8 $7,295,000 5/6 5000 $1,540 515 Throckmorton $7,000,000 13-May 47 $7,995,000 5/9 4509 $1,552 41 Shell $6,800,000 5-Apr 22 $6,950,000 6/5 3775 $1,801 321 Summit $6,800,000 15-Apr 0 $6,800,000 5/5 4595 $1,480 11 Ethel $6,600,000 28-Jun 11 $6,995,000 6/10 6260 $1,054 50 Harbor Cove $6,577,000 18-Aug 15 $5,977,000 4/3 3899 $1,687 8 Sandy $6,440,000 6-May 9 $6,500,000 4/5 5755 $1,119 342 Laverne $6,400,000 21-Jun 9 $5,995,000 5/7 5595 $1,144 11 King $6,300,000 15-Jul 6 $5,295,000 4/4 3360 $1,875 325 Buena Vista $6,150,000 5-May 9 $5,495,000 4/6 4020 1529.9 172 Blithedale $6,000,000 6-May 56 $5,498,000 5/4 3785 $1,585 285 Hillside $5,995,000 27-May 1 $5,995,000 3/4 2757 $2,174 45 Fern $5,925,000 27-Jan 4 $4,395,000 4/3 2791 $2,123 152 Blithedale $5,661,500 10-Oct 8 $5,661,500 5/5 N/A N/A 16 Hill $5,526,000 10-May 0 $3,795,000 5/4 2807 $1,969 160 Corte Madera $5,500,000 22-Jun 0 $5,500,000 0/0 7000 $786 141 Walnut $5,300,000 11-Oct 8 $4,995,000 4/3 2284 2320.5 53 Knoll $5,300,000 26-May 7 $3,995,000 5/5 3595 1474.3 44 Locust $5,250,000 13-Jun 3 $4,150,000 4/4 2425 $2,165 4 Blithedale $5,150,000 6-Apr 8 $4,650,000 4/4 2865 $1,798 335 LOVELL $5,000,000 6-May 14 $3,995,000 4/4 2698 $1,853 33
2022 SINGLE FAMILY HOME SALES OVER $2.5M
Address Sales Price Date DOM List Price BR/BA Sq Ft $/Sq Ft 149 Chapel $5,000,000 10-Nov 101 $6,495,000 6/7 5767 $867 209 Cascade $4,975,000 11-Mar 3 $4,395,000 5/4 3800 $1,309 750 Lovell $4,945,000 1-Mar 21 $4,995,000 4/4 3446 $1,435 23 Janes $4,925,000 17-Oct 10 $4,995,000 5/3 3271 $1,506 100 Laverne $4,900,000 7-Apr 10 $4,500,000 4/5 3582 $1,368 325 Strawberry $4,900,000 29-Nov 23 $5,329,000 5/5 4890 $1,002 56 Walnut $4,800,000 27-Jun 6 $3,695,000 4/3 2208 $2,174 8 Nina $4,750,000 22-Jun 38 $4,995,000 4/4 4500 $1,056 16 Carmelita $4,650,000 18-Nov 45 $5,300,000 5/4 3140 $1,481 38 Sycamore $4,576,000 28-Mar 11 $2,995,000 5/2 2260 $2,025 11 Bay Tree $4,550,000 10-May 9 $3,960,000 5/4 3155 $1,442 11 Heather $4,500,000 23-Sep 105 $4,895,000 5/3 3060 $1,471 515 Lovell $4,500,000 12-Jul 2 $4,500,000 4/3 4287 $1,050 7 Ethel $4,400,000 28-Jun 11 $4,500,000 4/4 3785 $1,162 44 Valley $4,350,000 28-Oct 50 $3,900,000 4/3 2652 $1,640 30 Sarah $4,225,000 5-Apr 8 $2,495,000 4/2 1930 $2,189 657 Lovell $4,100,000 29-Apr 1 $4,100,000 3/2 2216 $1,850 230 Edgewood $4,100,000 12-May 10 $3,750,000 5/5 4071 $1,007 438 Wellesley $4,052,000 17-Nov 44 $3,850,000 5/6 4280 $947 135 Elinor $4,050,000 14-Jun 0 $3,500,000 5/4 2522 $1,606 40 Hilarita $4,000,000 11-Mar 0 $4,000,000 4/3 1955 $2,046 444 Strawberry $4,000,000 5-Jan 12 $2,754,000 2/3 2507 $1,596 100 Summit $3,995,000 10-Jun 9 $3,995,000 5/4 3414 $1,170 6 Lula $3,995,000 6-Dec 29 $4,995,000 5/4 4110 $972 14 Eton $3,925,000 7-Jul 8 $3,895,000 4/5 3770 $1,041 177 Blithedale $3,900,000 17-Jun 11 $2,990,000 4/3 2286 $1,706 916 Valley View $3,900,000 23-Mar 15 $2,999,000 5/5 4216 $925 70 Bolsa $3,800,000 16-Jun 3 $3,800,000 4/3 2371 $1,603 38 Topside $3,800,000 25-Apr 7 $3,495,000 5/4 3750 $1,013 58 Sycamore $3,750,000 21-Jun 7 $3,350,000 3/2 1825 $2,055 271 Buena Vista $3,705,000 11-Feb 7 $3,795,000 3/3 2835 $1,307 22 Underhill $3,700,000 22-Sep 13 $3,795,000 5/3 3060 $1,209 17 Eton $3,610,090 4-May 18 $3,495,000 4/4 2950 $1,224 7 Cottage $3,600,000 29-Jun 5 $3,300,000 3/3 1472 $2,445 419 Laverne $3,600,000 11-Mar 169 $3,995,000 4/4 3198 $1,126 20 Blithedale $3,550,000 20-Apr 12 $3,500,000 4/4 3211 $1,106 153 Blithedale $3,515,300 4-Apr 8 $3,175,000 3/3 2094 $1,679 16 Vasco $3,500,000 11-Apr 6 $2,995,000 4/3 2178 $1,607 232 Oakdale $3,500,000 11-Apr 9 $2,795,000 3/2 2515 1391.7 124 Lovell $3,500,000 28-Apr 36 $3,295,000 4/3 2645 $1,323 79 Lovell $3,495,000 4-Nov 33 $3,695,000 5/3 2516 $1,389 70 Harbor Cove $3,450,000 12-Aug 12 $3,200,000 3/3 2818 $1,224 870 Chamberlain $3,450,000 4-Mar 6 $2,798,000 4/3 2840 $1,215 14 Eagle Rock $3,425,000 5-Jul 14 $3,495,000 6/4 3111 $1,101 9 Matilda $3,400,000 10-Jun 0 $3,500,000 4/3 2499 $1,361 34
2022 SINGLE FAMILY HOME SALES OVER $2.5M
Address Sales Price Date DOM List Price BR/BA Sq Ft $/Sq Ft 422 Vista Linda $3,375,000 14-Jul 22 $2,995,000 4/3 2200 $1,534 445 Wellesley $3,350,000 10-Jan 25 $2,900,000 4/3 3600 $931 57 Sycamore $3,300,000 17-Jun 5 $2,595,000 3/2 2099 $1,572 261 Loring $3,300,000 26-May 22 $3,249,000 5/4 2461 $1,341 835 Smith $3,275,000 24-Feb 10 $2,999,999 6/4 4467 733.15 412 Laverne $3,250,000 2-May 10 $2,695,000 3/3 2082 $1,561 409 Throckmorton $3,250,000 2-May 61 $3,400,000 4/4 2167 $1,500 24 Midhill $3,200,000 28-Oct 52 $3,495,000 4/3 3231 $990 81 Vista Del Sol $3,200,000 24-Oct 58 $3,595,000 5/6 4422 $724 159 Linden $3,150,000 3-Oct 7 $2,650,000 4/2 1839 $1,713 104 Montford $3,125,000 28-Sep 10 $2,795,000 4/4 2646 $1,181 6 Mirabel $3,100,000 3-May 63 $3,100,000 3/3 1932 $1,605 411 Wellesley $3,100,000 5-May 13 $2,795,000 4/3 3052 $1,016 363 Ferndale $3,050,000 19-May 0 $2,795,000 4/3 2656 $1,148 330 Sheffield $3,050,000 14-Mar 4 $2,950,000 4/3 2966 $1,028 1104 Western $3,050,000 27-Apr 18 $2,400,000 4/4 3500 $871 332 Ridgewood $3,015,000 17-Mar 8 $2,695,000 4/2 1935 $1,558 67 Meadow $3,005,000 22-Mar 2 $2,695,000 4/3 1970 $1,525 237 Princeton $3,000,000 3-Mar 0 $3,000,000 4/4 2506 $1,197 310 Vista Linda $3,000,000 31-Aug 8 $2,495,000 3/3 2553 $1,175 20 Cushing $3,000,000 15-Apr 8 $2,977,000 5/4 2985 $1,005 735 Bay $3,000,000 21-Oct 69 $3,699,000 4/4 4021 $746 1 Manor $2,977,000 19-Apr 10 $2,395,000 3/2 1816 $1,639 27 Azalea $2,950,000 31-Oct 15 $2,788,000 4/3 3050 $967 17 Vista Real $2,935,000 1-Apr 32 $2,995,000 4/3 2678 $1,096 289 Tamalpais $2,900,000 17-May 1 $2,200,000 4/2 2118 $1,369 250 Ethel $2,900,000 31-May 12 $2,995,000 4/3 2585 $1,122 211 Meda $2,900,000 14-Mar 17 $2,995,000 4/3 3115 $931 246 Reed $2,890,000 8-Sep 29 $3,096,000 5/4 3170 $912 313 Eldridge $2,875,000 13-Sep 7 $2,495,000 4/2 1923 $1,495 315 Hillside $2,850,000 24-Feb 8 $2,500,000 3/2 1260 $2,262 227 Reed $2,830,000 19-Aug 11 $2,800,000 3/3 3415 $829 180 Locust $2,800,000 29-Apr 26 $2,900,000 6/3 3700 $757 124 E Blithedale $2,800,000 14-Feb 189 $3,050,000 4/3 3780 $741 61 Knoll $2,800,000 31-May 19 $2,695,000 7/5 5072 $552 809 Everest $2,758,000 22-Apr 7 $2,295,000 4/3 1964 $1,404 183 Molino $2,750,000 30-Nov 0 $2,195,000 5/2 3132 $878 103 Bolsa $2,725,000 6-Jun 9 $2,480,000 4/3 2203 $1,237 390 Ferndale $2,715,000 10-Feb 9 $2,195,000 3/3 1856 $1,462 390 Ferndale $2,715,000 19-Apr 4 $2,695,000 3/3 1856 $1,463 8 Rowan $2,710,000 16-May 10 $1,995,000 4/3 1886 $1,437 105 Quarry $2,700,000 12-Oct 27 $2,895,000 4/4 3515 $768 1007 Greenhill $2,695,000 27-Oct 7 $2,695,000 4/4 3044 $885 185 Greenwood $2,650,000 23-Dec 55 $2,795,000 3/3 2235 $1,186 449 Wellesley $2,650,000 20-Dec 9 $2,625,000 4/4 2518 $1,052 35
2022 SINGLE FAMILY HOME SALES OVER $2.5M
Address Sales Price Date DOM List Price BR/BA Sq Ft $/Sq Ft 73 Lomita $2,642,500 20-Jun 34 $2,785,000 6/5 3430 $770 306 Evergreen $2,625,000 1-Aug 8 $2,495,000 3/2 1943 $1,351 476 Live Oak $2,600,000 7-Apr 8 $2,199,000 3/5 3020 $861 49 Keats $2,600,000 31-Oct 9 $2,700,000 5/4 3082 $844 284 Morning Sun $2,550,000 6-Apr 6 $1,895,000 2/3 1740 $1,466 3 Altamont $2,550,000 1-Jun 8 $1,795,000 3/3 1926 $1,324 528 Alta $2,550,000 25-Feb 8 $1,895,000 4/3 2185 $1,167 388 Lowell $2,550,000 14-Nov 14 $2,495,000 4/3 2683 $950 659 Sequoia Valley $2,550,000 28-Mar 10 $2,150,000 4/3 3035 $840 368 Dolan $2,550,000 15-Jul 68 $2,700,000 4/4 3240 $787 36 Pimlott $2,550,000 26-Aug 8 $1,995,000 3/2 N/A N/A 307 Lowell $2,510,000 10-Feb 11 $2,100,000 4/3 2500 $1,004 726 Marin $2,500,000 22-Apr 9 $2,495,000 3/2 1842 $1,357 18 Somerset $2,500,000 11-Oct 51 $2,495,000 3/2 2004 $1,248 364 Dolan $2,500,000 26-May 6 $1,895,000 3/3 2203 $1,135 619 Springfield $2,500,000 9-Sep 8 $2,395,000 4/3 2299 $1,087 40 De Silva Island $2,500,000 4-Jan 41 $2,150,000 3/3 2422 $1,032 311 Morning Sun $2,500,000 6-Jun 6 $1,895,000 4/3 2585 $967 Muir Beach (2 homes) 60 Starbuck $4,805,000 10-Oct 3 $4,500,000 3/3 2114 $2,273 35 Seacape $4,700,000 9-May 9 $2,900,000 3/3 2564 $1,833 Nicasio (2 homes) 5757 Lucas Valley $4,650,000 27-Jun 31 $4,650,000 4/3 2435 $1,910 4000 Old Rancheria $4,431,750 5-Apr 45 $4,950,000 4/4 5735 $773 Novato (29 homes) 201 San Antonio $8,000,000 27-Jul 22 $8,000,000 5/7 6000 $1,333 482 Fairway $3,395,000 27-Sep 29 $3,395,000 5/4 3205 $1,059 50 Oak Shade $3,200,000 10-May 3 $2,995,000 4/4 3290 $973 256 San Ramon $3,200,000 7-Jul 0 $3,200,000 4/3 3899 $821 25 Old Ranch $3,000,000 27-Sep 32 $2,850,000 4/4 3386 $886 2560 Vineyard $2,950,000 26-Jan 0 $2,800,000 6/4 4434 $665 87 Eagle $2,945,000 11-Jul 6 $2,795,000 4/3 3390 $869 200 Atherton $2,900,000 4-Aug 11 $2,699,995 5/4 5158 $562 63 Oak Valley $2,850,000 15-Nov 44 $2,995,000 6/4 5750 $496 13 Brooke $2,825,000 15-Jun 22 $2,995,000 5/5 5826 $485 2500 Vineyard $2,803,000 6-Jun 21 $2,695,000 5/3 3000 $934 92 Stonetree $2,800,000 16-May 11 $2,100,000 4/4 4672 $599 38 Dolphin $2,775,000 2-Sep 0 $2,800,000 4/3 2428 $1,143 1034 Valle View $2,675,000 8-Aug 15 $2,595,000 3/4 3340 $801 25 Woodside $2,675,000 19-May 71 $2,850,000 4/5 5463 $490 2 Winged Foot $2,666,500 30-Jun 58 $2,950,000 5/4 3535 $754 60 Carnoustie $2,650,000 4-Apr 16 $2,600,000 5/4 3893 $681 10 Indian Trail $2,600,000 15-Mar 28 $2,650,000 4/4 2765 $940 55 Wildwood $2,600,000 2-May 7 $1,995,000 3/5 4176 $623 40 Miwok $2,555,000 16-Sep 3 $2,195,000 4/5 4518 $566 36
2022 SINGLE FAMILY HOME SALES OVER $2.5M
Address Sales Price Date DOM List Price BR/BA Sq Ft $/Sq Ft 157 Laurelwood $2,550,000 19-May 7 $1,995,000 3/4 3270 $780 38 Thunderbird $2,550,000 28-Jul 71 $2,795,000 4/4 3333 $765 200 Caribe $2,535,000 27-Apr 4 $2,199,000 4/3 2267 $1,118 87 Carnoustie $2,530,100 19-Oct 81 $2,977,000 4/4 3200 $791 37 Oak Valley $2,505,000 8-Aug 3 $2,500,000 5/3 3196 $784 2349 Novato $2,500,000 18-Nov 27 $2,650,000 2/2 1400 $1,786 285 Country Club $2,500,000 10-Jun 3 $2,185,000 3/4 2801 $893 100 Deer $2,500,000 4-Jan 0 $2,500,000 5/3 2988 $837 50 Old Ranch $2,500,000 17-Nov 57 $2,995,000 3/4 3409 $733 Point Reyes Station (3 homes) 30 Knob Hill $4,850,000 11-Apr 15 $4,850,000 3/4 3177 $1,527 15 Paige Walk $4,700,000 9-May 21 $4,280,000 3/3 2517 $1,867 12191 State Route 1 $3,250,000 23-May 31 $3,500,000 3/2 2046 $1,588 Ross (21 homes) 12 Upper Ames $18,000,000 20-Apr 6 $17,995,000 6/8 7210 $2,497 41 Upper $14,500,000 13-Jun 19 $14,995,000 6/9 7505 $1,932 27 Upper $8,950,000 19-May 27 $9,000,000 7/8 10294 $869 160 Lagunitas $8,600,000 14-Jan 33 $8,600,000 4/5 4038 $2,130 196 Lagunitas $8,600,000 13-Apr 15 $9,500,000 5/6 4940 $1,741 71 Shady $7,500,000 23-Feb 0 $7,500,000 4/3 N/A N/A 1 Pomeroy $6,300,000 29-Nov 91 $6,995,000 5/5 4890 $1,288 15 Makin Grade $6,050,000 28-Jan 76 $6,500,000 5/7 5305 $1,140 2 Pomeroy $5,800,000 11-Feb 0 $5,750,000 3/5 5722 $1,014 61 Bolinas $5,500,000 9-May 22 $5,895,000 6/4 3628 $1,516 65 Wellington $5,200,000 15-Apr 7 $4,575,000 4/4 2817 $1,846 10 Shady $5,000,000 17-Nov 11 $4,900,000 4/3 2800 $1,786 2 Garden $4,500,000 4-Apr 0 $4,500,000 3/3 2652 $1,697 94 Shady $4,425,000 25-May 14 $4,250,000 4/4 2532 $1,748 18 Canyon $3,795,000 17-Aug 18 $3,795,000 3/3 2580 $1,471 17 Upper $3,600,000 9-May 52 $3,695,000 4/3 2725 $1,321 43 Winship $3,405,000 5-Apr 7 $2,950,000 3/2 1845 $1,846 28 Walnut $3,175,000 8-Jun 6 $2,425,000 3/2 2004 $1,584 121 Lagunitas $2,500,000 6-Sep 11 $2,500,000 3/2 2192 $1,141 74 Wellington $2,500,000 17-Jun 8 $2,295,000 3/3 2197 $1,138 San Anselmo (47 homes) 710 Butterfield $5,500,000 11-Apr 8 $3,995,000 5/4 4115 $1,337 130 Crescent $5,350,000 23-Sep 9 $5,250,000 4/4 3575 $1,497 419 Redwood $5,300,000 8-Jun 9 $4,000,000 4/5 3340 $1,587 1435 Butterfield $4,935,000 12-May 0 $4,950,000 4/4 4340 $1,137 95 Irving $4,750,000 12-Apr 0 $3,350,000 3/4 2629 $1,807 125 Tarry $4,700,000 5-Apr 11 $4,000,000 5/4 4295 $1,094 1090 Butterfield $4,400,000 2-May 11 $3,250,000 4/4 3383 $1,301 1423 Butterfield $4,025,000 3-May 7 $2,995,000 4/3 2530 $1,591 124 Woodland $3,905,000 15-Apr 7 $3,250,000 4/4 2636 $1,481 117 Crescent $3,800,000 26-May 17 $3,995,000 5/4 3166 $1,200 37
2022 SINGLE FAMILY HOME SALES OVER $2.5M
Address Sales Price Date DOM List Price BR/BA Sq Ft $/Sq Ft 10 Tarry $3,800,000 26-May 12 $3,495,000 4/5 3954 $961 2 Estates $3,725,000 17-May 10 $3,495,000 5/4 3947 $944 155 Hidden Valley $3,637,500 7-Sep 91 $3,950,000 6/5 3800 $957 65 San Rafael $3,630,000 3-May 7 $2,495,000 4/3 2364 $1,536 444 Laurel $3,550,000 18-Nov 20 $3,999,500 5/4 3636 $976 785 Fawn $3,525,000 15-Apr 5 $3,125,000 4/3 3724 $947 28 Greensburgh $3,515,000 5-Apr 27 $3,410,000 6/4 3924 $896 644 Butterfield $3,500,000 6-Apr 0 $2,900,000 3/4 2679 $1,306 24 Knoll $3,420,000 10-Jun 8 $3,295,000 4/4 3100 $1,103 38 Tomahawk $3,400,000 29-Jul 32 $3,595,000 6/4 3823 $889 50 Tarry $3,275,000 13-Jun 5 $2,795,000 4/2 2579 $1,270 61 Sais $3,273,011 5-Jan 4 $3,000,000 5/4 3075 $1,064 17 Idalia $3,255,000 1-Jun 7 $2,895,000 3/2 2442 $1,333 60 Estates $3,250,000 18-Jan 5 $3,200,000 5/4 3109 $1,045 9 Prospect $3,200,000 12-Apr 0 $3,200,000 4/4 2986 $1,072 120 Crescent $3,200,000 12-Apr 5 $3,295,000 3/3 3070 $1,042 51 Oak $3,145,000 18-May 12 $3,195,000 4/4 3660 $859 58 Indian Rock $2,999,000 12-May 41 $3,200,000 4/5 4563 $657 57 Summit $2,930,000 18-Apr 29 $2,995,000 5/5 5316 $551 10 Deer Hollow $2,925,000 27-May 6 $2,800,000 4/4 2880 $1,016 70 Crane $2,900,000 20-Jul 10 $2,550,000 4/3 2465 $1,176 139 Barber $2,900,000 28-Oct 33 $2,795,000 4/3 2566 $1,130 205 Tunstead $2,830,000 1-Apr 6 $2,295,000 3/3 2190 $1,292 10 Knoll $2,810,000 11-Apr 9 $2,695,000 4/3 2311 $1,216 151 Meadowcroft $2,800,000 4-Jan 0 $2,700,000 3/4 2542 $1,101 134 Scenic $2,770,000 18-Mar 7 $1,995,000 3/3 2435 $1,138 400 San Francisco $2,750,000 18-Apr 6 $2,495,000 5/3 2746 $1,001 155 Oak Knoll $2,750,000 4-Feb 153 $4,999,000 2/3 2848 $966 21 Echo $2,700,000 13-May 18 $2,750,000 5/3 2592 $1,042 156 Hilldale $2,670,000 13-May 3 $2,459,000 5/4 3190 $837 30 Caletta $2,650,000 19-Jul 20 $2,595,000 5/4 3200 $828 153 Jordan $2,600,000 25-Apr 0 $2,195,000 4/3 2155 $1,206 33 Alderney $2,600,000 8-Sep 1 $2,500,000 4/3 3145 $827 47 Martling $2,600,000 30-Mar 9 $2,395,000 5/4 3266 $796 3 Agatha $2,575,000 21-Jul 7 $1,950,000 3/3 2263 $1,138 19 Tappan $2,550,000 24-Oct 5 $2,495,000 3/3 2296 $1,111 290 Fawn $2,510,000 1-Mar 4 $1,995,000 4/3 2185 $1,149 San Rafael (49 homes) 387 Margarita $5,800,000 11-Apr 2 $4,995,000 5/4 5210 $1,113 140 Main $5,250,000 31-May 6 $3,995,000 6/5 4735 $1,109 90 Culloden Park $5,113,500 30-Jun 27 $5,477,000 6/5 5918 $864 333 Forbes $5,000,001 29-Aug 51 $4,495,000 5/5 4625 $1,081 230 Forbes $4,800,000 24-Jun 17 $4,995,000 6/6 7016 $684 20 Westgate $4,275,000 2-Aug 119 $4,777,000 4/4 5175 $826 49 Inverness $4,125,000 9-Mar 0 $3,400,000 5/5 4122 $1,001 38
2022 SINGLE FAMILY HOME SALES OVER $2.5M
Address Sales Price Date DOM List Price BR/BA Sq Ft $/Sq Ft 15 Manzanita $4,000,517 25-Apr 2 $3,295,000 5/3 3100 $1,290 1440 Grand $3,950,000 9-Jun 7 $3,495,000 4/3 3445 $1,147 110 Lochinvar $3,850,000 21-Apr 7 $2,850,000 5/4 4000 $963 5 Golden Lily $3,675,000 14-Apr 9 $2,895,000 4/3 3902 $942 110 Bay $3,650,000 1-Dec 58 $3,995,000 4/3 4045 $902 9 Silk Oak $3,525,000 2-May 6 $3,195,000 4/3 3720 $948 811 Point San Pedro $3,500,000 5-Dec 166 $3,499,000 5/5 4226 $828 15 Allensby $3,450,000 14-Sep 9 $3,350,000 5/4 3797 $909 6 Live Oak $3,450,000 28-Mar 6 $3,295,000 4/5 3867 $892 15 Milano $3,315,000 2-Feb 437 $3,495,000 5/5 4007 $827 32 Marina $3,310,000 2-May 9 $2,595,000 4/4 3007 $1,101 8 Chapel Cove Court $3,237,633 11-Jan 78 $3,595,000 4/5 4280 $756 295 Summit $3,200,000 15-Jul 4 $3,195,000 3/3 3104 $1,031 98 Convent $3,100,000 24-Feb 8 $2,795,000 4/3 2767 $1,120 7 Sea View $3,100,000 18-May 58 $3,275,000 4/4 3900 $795 12 Bridgegate $3,050,000 30-Mar 3 $2,777,000 5/4 3754 $812 58 Lochinvar $3,000,000 2-Sep 64 $3,200,000 4/3 2650 $1,132 135 Marina $3,000,000 27-Jul 78 $3,195,000 4/4 3313 $906 72 Las Casas $2,915,000 6-Apr 61 $2,795,000 4/4 3470 $840 10 Mission $2,900,000 2-Aug 11 $2,495,000 4/3 3321 $873 41 Chula Vista $2,899,000 5-May 22 $2,899,000 5/5 4235 $685 75 Lochinvar $2,836,775 17-Feb 53 $2,900,000 3/4 2325 $1,220 54 Junipero Serra $2,820,000 14-Jun 10 $1,995,000 5/3 2729 $1,033 60 Las Casas $2,800,000 2-Mar 12 $2,250,000 4/4 3173 $882 190 Oak $2,752,000 2-Aug 17 $2,700,000 4/3 3209 $858 56 Surfwood $2,735,000 29-Mar 112 $2,400,000 5/5 3222 $849 104 Clark $2,650,000 21-Jun 4 $2,295,000 4/4 2488 $1,065 15 Debes Ranch $2,650,000 8-Jul 7 $2,598,000 4/3 2852 $929 28 Oak Mountain $2,626,000 16-May 6 $2,500,000 4/2 1882 $1,395 312 Mount Shasta $2,600,000 27-Jun 0 $1,995,000 4/2 1960 $1,327 72 Montevideo $2,600,000 16-Sep 10 $2,498,000 5/4 2842 $915 24 Dominican $2,575,000 18-Oct 1 $2,395,000 3/3 2385 $1,080 163 Dominican $2,550,000 16-Sep 6 $2,495,000 4/3 2380 $1,071 358 Mountain View $2,550,000 17-Aug 0 $2,395,000 4/3 2540 $1,004 765 Beechnut $2,550,000 15-Mar 21 $2,550,000 6/4 3085 $827 1002 Del Ganado $2,545,000 17-Jun 0 $2,450,000 4/2 2159 $1,179 201 H $2,525,000 13-Jun 13 $2,295,000 3/3 2648 $954 162 Maywood $2,525,000 18-May 9 $2,250,000 3/3 2862 $882 271 Riviera $2,505,000 26-Apr 8 $2,150,000 3/3 2197 $1,140 11 Madeline $2,500,000 21-Oct 8 $2,750,000 4/4 3276 $763 36 Junipero Serra $2,500,000 15-Jun 7 $2,195,000 6/2 3340 $749 67 Summit $2,500,000 10-Jan 27 $2,495,000 5/3 3958 $632 Sausalito (50 homes) 87 San Carlos $7,500,000 22-Jun 2 $7,000,000 4/4 3355 $2,235 19 Prospect $6,750,000 4-May 18 $4,500,000 4/4 4755 $1,420 39
2022 SINGLE FAMILY HOME SALES OVER $2.5M
Address Sales Price Date DOM List Price BR/BA Sq Ft $/Sq Ft 22 Atwood $5,625,000 13-Sep 0 $4,995,000 3/4 2490 $2,259 51 Santa Rosa $5,315,000 1-Jun 15 $4,998,000 4/4 3669 $1,449 34 Wolfback $5,250,000 13-Jul 0 $5,000,000 4/5 4217 $1,245 60 Platt $5,100,000 28-Sep 26 $4,600,000 4/5 4210 $1,211 95 Cloud View $5,027,000 13-Sep 0 $4,995,000 5/4 3480 $1,445 234 Currey $5,020,000 24-Feb 14 $4,995,000 3/3 4780 $1,050 96 Harrison $4,980,000 22-Aug 52 $4,980,000 4/5 4032 $1,235 71 Glen $4,900,000 3-Oct 8 $4,900,000 2/3 2555 $1,918 68 Prospect $4,500,000 8-Sep 17 $4,500,000 3/3 3004 $1,498 121 Toyon $4,285,000 17-Mar 21 $4,285,000 3/4 2612 $1,641 86 Prospect $4,200,000 20-Jun 0 $4,200,000 3/5 2720 $1,544 1 Channing $4,150,000 25-Mar 12 $3,195,000 3/3 2745 $1,512 19 Edwards $4,050,000 28-May 10 $3,695,000 3/4 3092 $1,310 202 Valley $4,000,000 27-Jun 51 $3,995,000 2/3 3500 $1,143 26 Woodward $3,949,000 20-Jan 125 $4,495,000 4/5 3279 $1,204 61 San Carlos $3,850,000 11-Aug 27 $3,595,000 4/3 3516 $1,095 114 Prospect $3,825,000 13-Jul 15 $3,895,000 3/3 2758 $1,387 60 Currey $3,800,000 28-Nov 19 $3,795,000 3/4 3010 $1,262 40 Toyon $3,700,000 2-Dec 18 $3,795,000 4/3 2785 $1,329 9 Laurel $3,550,000 15-Apr 3 $3,495,000 4/5 3281 $1,082 26 Crecienta $3,500,000 7-Apr 11 $2,695,000 3/3 2453 $1,427 63 Bulkley $3,500,000 31-Oct 19 $4,250,000 3/4 4137 $846 10 Currey $3,400,000 25-Aug 0 $3,300,000 4/4 2342 $1,452 519 Bonita $3,400,000 2-May 11 $3,395,000 3/3 2545 $1,336 32 Sunshine $3,400,000 17-Mar 0 $3,500,000 3/3 2766 $1,229 49 Lower Crescent $3,380,000 21-Apr 6 $2,350,000 3/3 1690 $2,000 6 Toyon $3,330,000 16-May 7 $2,750,000 3/3 2575 $1,293 115 Prospect $3,325,000 29-Apr 15 $2,895,000 3/4 2945 $1,129 187 Harrison $3,250,000 31-Oct 8 $3,295,000 3/3 2540 $1,280 70 San Carlos $3,245,000 8-Aug 11 $2,695,000 3/3 2272 $1,428 231 Cazneau $3,050,000 28-Jun 8 $2,000,000 4/4 2380 $1,282 199 Bulkley $3,010,000 19-Jul 10 $2,995,000 2/3 2199 $1,369 303 Bridgeway $2,985,000 1-Dec 20 $2,995,000 2/2 1320 $2,261 158 Spencer $2,950,218 27-May 29 $2,585,000 4/4 2505 $1,178 12 Crescent $2,950,000 14-Jan 12 $2,695,000 3/3 2453 $1,203 325 Sausalito $2,895,000 25-Apr 29 $2,595,000 3/4 2330 $1,242 200 San Carlos $2,860,000 11-Apr 10 $2,199,000 3/2 1953 $1,464 71 Woodward $2,850,000 8-Jul 3 $2,450,000 3/3 2360 $1,208 494 Sausalito $2,850,000 7-Dec 9 $3,200,000 3/3 3040 $938 210 West $2,800,000 17-Mar 9 $2,399,000 3/3 2159 $1,297 83 Monte Mar $2,650,000 11-Mar 90 $2,895,000 4/4 2653 $999 303 Bridgeway $2,600,000 12-May 0 $2,600,000 2/1 1320 $1,970 82 Central $2,550,000 13-Apr 13 $2,550,000 3/4 2170 $1,175 11 Vista Clara $2,550,000 22-Jul 25 $3,777,000 3/3 2581 $988 109 Marion $2,550,000 28-Jan 39 $2,988,800 4/4 3010 $847 40
2022 SINGLE FAMILY HOME SALES OVER $2.5M
Address Sales Price Date DOM List Price BR/BA Sq Ft $/Sq Ft 124 Glen $2,549,000 1-Nov 9 $2,549,000 4/3 2565 $994 509 Sausalito $2,530,000 14-Mar 0 $2,285,000 2/2 1790 $1,413 164 Bulkley $2,500,000 16-Sep 11 $1,995,000 5/3 2139 $1,169 Stinson Beach (10 homes) 230 Seadrift $14,250,000 8-Jun 9 $13,695,000 4/3 2063 $6,907 59 Dipsea $6,900,000 1-Nov 11 $6,900,000 4/5 2918 $2,365 65 Dipsea $4,800,000 13-Oct 4 $4,800,000 2/2 1859 $2,582 7220 Panoramic $4,750,000 4-Apr 12 $4,750,000 3/3 2414 $1,968 6 Willow $4,600,000 12-Sep 13 $4,700,000 7/5 4225 $1,089 117 Dipsea $3,900,000 4-Nov 28 $4,500,000 2/2 1540 $2,532 355 Belvedere $3,850,000 1-Jun 45 $4,295,000 2/3 N/A N/A 15 Calle Del Ribera $3,560,000 11-Feb 7 $3,595,000 3/2 1720 $2,070 26 Calle del Resaca $3,500,000 31-Jan 84 $4,500,000 3/1 1235 $2,834 174 Calle Del Arroyo $2,600,000 24-Feb 24 $2,600,000 3/3 1219 $2,133 Tiburon (107 homes) 1860 Mountain View $17,500,000 11-Apr 9 $16,000,000 4/5 4470 $3,915 106 Mount Tiburon $12,000,000 9-Sep 87 $12,000,000 5/7 7644 $1,570 1910 Straits View $9,600,000 20-May 46 $11,450,000 5/6 6380 $1,505 409 Ridge $8,389,000 24-Aug 4 $8,495,000 4/5 4190 $2,002 101 Mount Tiburon $8,225,000 31-Jan 49 $8,977,000 5/8 7600 $1,082 189 Gilmartin $7,750,000 14-Mar 25 $7,888,000 6/7 7560 $1,025 44 Meadow Hill $7,650,000 13-Apr 3 $6,495,000 4/4 4280 $1,787 55 Vista Tiburon $7,300,000 2-May 6 $6,375,000 6/6 5695 $1,282 1 Old Landing $6,850,000 23-May 0 $6,995,000 5/5 4681 $1,463 11 Via Paraiso $6,800,000 28-Apr 21 $6,950,000 4/5 4880 $1,393 114 Jamaica $6,700,000 8-Apr 7 $5,500,000 4/4 4777 $1,403 79 Saint Thomas $6,627,000 29-Jul 18 $6,777,000 4/5 5612 $1,181 8 Francisco Vista $6,507,000 31-May 7 $4,499,000 4/4 3371 $1,930 2332 Mar East $6,500,000 6-May 22 $5,977,000 3/4 2750 $2,364 75 Rolling Hills $6,500,000 17-Feb 8 $6,477,000 3/4 3566 $1,823 80 Via Los Altos $6,500,000 17-Feb 0 $5,977,000 4/4 4475 $1,453 5 Via Capistrano $6,500,000 21-Jul 16 $6,500,000 5/5 5137 $1,265 4881 Paradise $6,500,000 20-Jul 22 $6,750,000 6/5 5755 $1,129 4 Malvino $6,400,000 6-May 6 $5,495,000 5/5 3260 $1,963 140 Lyford $6,100,000 11-Apr 16 $5,995,000 4/5 5023 $1,214 36 Linda Vista $6,000,000 29-Apr 0 $4,995,000 3/4 3432 $1,748 98 Mount Tiburon $6,000,000 2-May 18 $5,795,000 4/5 4329 $1,386 2 Heathcliff $6,000,000 1-Apr 197 $6,590,000 6/7 4976 $1,206 15 Turtle Rock $5,778,000 29-Nov 38 $6,177,000 5/7 6175 $936 2110 Vistazo $5,500,000 9-Nov 13 $5,695,000 4/5 4155 $1,324 24 Turtle Rock $5,500,000 18-Apr 11 $4,395,000 5/5 4342 $1,267 17 Turtle Rock $5,477,000 22-Mar 36 $4,977,000 5/4 4660 $1,175 27 Old Landing $5,400,000 26-Jul 3 $4,995,000 6/4 3710 $1,456 10 Hillcrest $5,400,000 7-Jun 8 $5,000,000 5/5 5456 $990 198 Stewart $5,350,000 31-Oct 0 $5,350,000 5/4 3720 $1,438 41
2022 SINGLE FAMILY HOME SALES OVER $2.5M
Address Sales Price Date DOM List Price BR/BA Sq Ft $/Sq Ft 25 Turtle Rock $5,177,000 29-Jun 35 $5,775,000 6/5 4588 $1,128 7 Mariposa $5,100,000 30-Nov 49 $6,295,000 4/6 5715 $892 27 Venado $4,750,000 9-Sep 29 $4,750,000 4/4 4225 $1,124 141 Jamaica $4,650,000 10-Feb 9 $3,995,000 4/5 3922 $1,186 2472 Mar East $4,550,000 5-Apr 18 $4,877,000 3/4 2981 $1,526 34 Southridge $4,525,000 14-Apr 4 $3,995,000 4/4 3028 $1,494 1 Tower Point $4,500,000 22-Nov 45 $4,500,000 3/4 2887 $1,559 14 Place Moulin $4,500,000 5-Oct 2 $4,295,000 5/5 3598 $1,251 600 Ridge $4,500,000 13-Dec 8 $4,295,000 5/5 3675 $1,224 155 Jamaica $4,500,000 9-Sep 11 $4,995,000 4/4 4000 $1,125 4 Park Place $4,490,000 24-Jan 147 $4,777,000 5/7 6249 $719 88 Paseo Mirasol $4,475,000 7-Dec 168 $5,777,000 5/5 4268 $1,049 14 Corte San Fernando $4,450,000 15-Mar 8 $3,595,000 5/4 3248 $1,370 4079 Paradise $4,450,000 12-Aug 49 $4,995,000 8/8 6410 $694 2 Midden $4,300,000 19-Jan 0 $4,300,000 3/3 3241 $1,327 71 Via Los Altos $4,300,000 14-Jan 22 $3,995,000 4/4 4384 $981 120 Lyford $4,250,000 3-Oct 67 $5,200,000 5/3 2815 $1,510 15 Mark $4,250,000 15-Nov 36 $4,495,000 3/3 3125 $1,360 9 Stevens $4,200,000 19-Apr 78 $4,995,000 5/4 3454 $1,216 238 Round Hill $4,150,000 17-Mar 31 $4,300,000 3/4 2784 $1,491 2441 Spanish Trail $4,150,000 9-Jun 9 $4,198,000 4/4 3827 $1,084 4925 Paradise $4,100,000 14-Feb 7 $3,900,000 4/4 4201 $976 135 Avenida Miraflores $4,085,000 9-May 0 $4,077,000 5/4 3211 $1,272 155 Jamaica $4,000,000 17-Feb 0 $4,000,000 4/4 3808 $1,050 20 Old Landing $3,900,000 4-Apr 72 $3,500,000 3/3 2520 $1,548 116 Howard $3,851,160 17-Jun 10 $2,995,000 5/3 2424 $1,589 40 Geldert $3,850,000 31-May 13 $3,950,000 4/3 2615 $1,472 4690 Paradise $3,800,000 16-Feb 10 $3,777,000 5/5 3260 $1,166 203 Paradise $3,799,000 7-Jun 48 $3,925,000 3/3 2205 $1,723 407 Paradise $3,799,000 6-Sep 9 $3,699,000 3/3 2205 $1,723 88 Round Hill $3,750,000 16-Mar 0 $3,250,000 5/5 3344 $1,121 2027 Paradise $3,700,000 14-Apr 8 $3,695,000 3/3 2095 $1,766 118 Howard $3,700,000 2-Jun 25 $3,700,000 5/3 2379 $1,555 45 Monterey $3,650,000 19-Jul 9 $3,477,000 4/4 3127 $1,167 249 Trinidad $3,600,000 22-Jan 9 $3,290,000 4/3 3403 $1,058 14 Paseo Mirasol $3,550,000 18-Apr 9 $2,895,000 4/3 2415 $1,470 9 Apollo $3,505,000 18-May 8 $3,495,000 5/4 2517 $1,393 2000 Centro East $3,500,000 4-Aug 5 $3,300,000 4/3 3060 $1,144 3333 Paradise $3,377,000 29-Aug 15 $3,377,000 3/3 3430 $985 137 Hacienda $3,350,000 21-Jul 7 $3,350,000 4/3 3179 $1,054 9 Tower Point $3,325,000 6-Apr 158 $3,500,000 3/3 2471 $1,346 113 Blackfield $3,300,000 15-Mar 21 $3,295,000 4/3 2285 $1,444 553 Silverado $3,300,000 1-Mar 0 $3,177,000 3/3 2552 $1,293 229 Martinique $3,300,000 3-Mar 33 $3,300,000 4/4 3175 $1,039 22 Old Landing $3,257,000 19-Jul 4 $2,750,000 2/3 2190 $1,487 42
2022 SINGLE FAMILY HOME SALES OVER $2.5M
Address Sales Price Date DOM List Price BR/BA Sq Ft $/Sq Ft 23 Juno $3,225,000 17-Aug 3 $3,275,000 3/3 2082 $1,549 3 Macannan $3,215,000 22-Feb 17 $2,950,000 4/3 3215 $1,000 13 Mercury $3,150,000 30-Jun 0 $2,695,000 3/2 1841 $1,711 1 McCart $3,150,000 15-Aug 12 $3,095,000 3/3 2304 $1,367 21 Lagoon Vista $3,127,000 11-May 24 $2,995,000 3/3 2331 $1,341 65 Harriet $3,100,000 25-Feb 23 $3,150,000 4/2 2155 $1,439 140 Rancho $3,100,000 27-Jul 19 $3,200,000 4/4 3040 $1,020 60 Pine $3,050,000 12-Apr 6 $2,150,000 2/3 1921 $1,588 78 Paseo Mirasol $3,050,000 6-Oct 3 $2,895,000 4/2 2653 $1,150 37 Lagoon Vista $3,007,000 27-Jun 2 $2,900,000 2/2 1928 $1,560 183 Saint Thomas $3,005,000 13-Jul 11 $2,995,000 3/2 2762 $1,088 7 Greenwood $3,000,000 17-Jun 7 $2,775,000 4/3 2050 $1,463 1 Felipa $3,000,000 28-Jun 12 $2,977,000 4/3 2532 $1,185 2205 Mar East $3,000,000 8-Feb 104 $4,159,000 3/3 2741 $1,094 90 Rancho $3,000,000 10-Aug 50 $3,395,000 6/4 3390 $885 221 Martinique $2,984,290 16-Feb 7 $3,000,000 3/2 2436 $1,225 31 Juno $2,975,000 3-Oct 13 $2,895,000 3/2 2076 $1,433 107 Blackfield $2,900,000 17-Jun 10 $2,700,000 5/3 2293 $1,265 8 Saba $2,900,000 10-Jan 64 $3,177,000 4/3 2596 $1,117 43 Lagoon $2,860,000 9-Sep 0 $2,900,000 2/2 1928 $1,483 35 Antilles $2,850,000 1-Jul 10 $2,695,000 4/4 2360 $1,208 1661 Mar West $2,820,000 9-Aug 25 $2,695,000 4/3 2108 $1,338 2346 Mar East $2,800,000 1-Dec 44 $3,000,000 3/3 2430 $1,152 696 Hilary $2,700,000 1-Jul 0 $2,600,000 4/2 1534 $1,760 20 Baccharis $2,695,000 28-Nov 39 $2,850,000 3/4 3381 $797 40 Juno $2,580,000 14-Mar 12 $1,995,000 4/2 2110 $1,223 2240 Paradise $2,575,000 14-Oct 81 $2,850,000 4/4 2312 $1,114 49 Main $2,550,000 7-Apr 31 $2,500,000 3/2 1122 $2,273 683 Hilary $2,500,000 7-Mar 31 $2,395,000 5/2 1795 $1,393 1474 Vistazo $2,500,000 6-Jul 36 $2,350,000 3/3 2100 $1,190 11 Lagoon $2,500,000 8-Apr 16 $2,500,000 3/3 2696 $927 2 Lagoon Vista $2,500,000 15-Jun 0 $2,377,000 3/3 2696 $927 Tomales (1 home) 25500 State Route 1 $3,650,000 8-Apr 172 $3,995,000 4/3 3752 $973 43
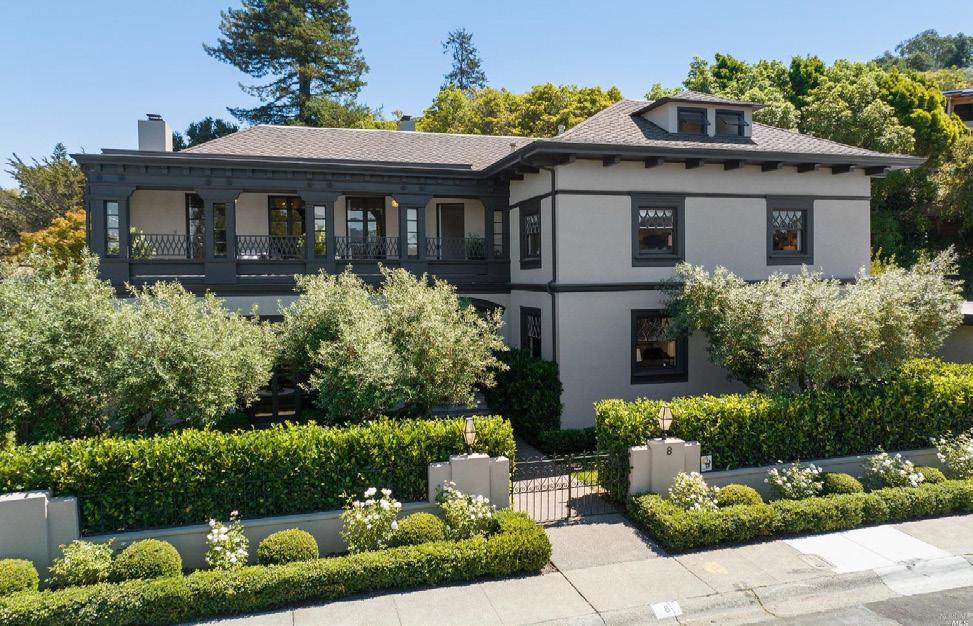
BELLEVUE I $5,050,000
BELVEDERE
LISTED BY APPLEGARTH + WARRIN
7
44
45
69 % OVER ASKING 30 Sarah, Mill Valley ListedbyCompass $ 4,225,0 00 61 % OVER ASKING 29 Millard, Larkspur ListedbySotheby’sInt.Realty $ 1,450,000 53 % OVER ASKING 38 Sycamore, Mill Valley ListedbyGGSotheby’sInt.Realty $ 4,576,0 00 59 % OVER ASKING 155 Stanford , Mill Valley ListedbyAttainRealEstate $ 2,418 ,000 55 % OVER ASKING 45 S Knoll, Mill Valley ListedbyCompass $ 2,315 ,000 53 % OVER ASKING 231 Cazneau, Sausalito ListedbyGGSotheby’sInt.Realty $ 3,050 ,000
OVER ASKING 46
BIGGEST OVERBIDS 2022 PROPERTIES SOLD
GOLDEN GATE SOTHEBY’S
INTERNATIONAL REALTY
LOCAL KNOWLEDGE CONNECTED AROUND THE BAY AND THE WORLD
Our brokerage is the numberone Sotheby’s International Affiliate in Northern California. We can help you find your buyer. We have more than 500agents in 22offices representing active qualified buyers and sellers throughout the San Francisco Bay Area. We service the counties of:

•Alameda
•Contra Costa
•Marin
•Napa
•San Francisco
•San Mateo
•Santa Clara
•Solano
•Sonoma
•Santa Cruz
1# 47
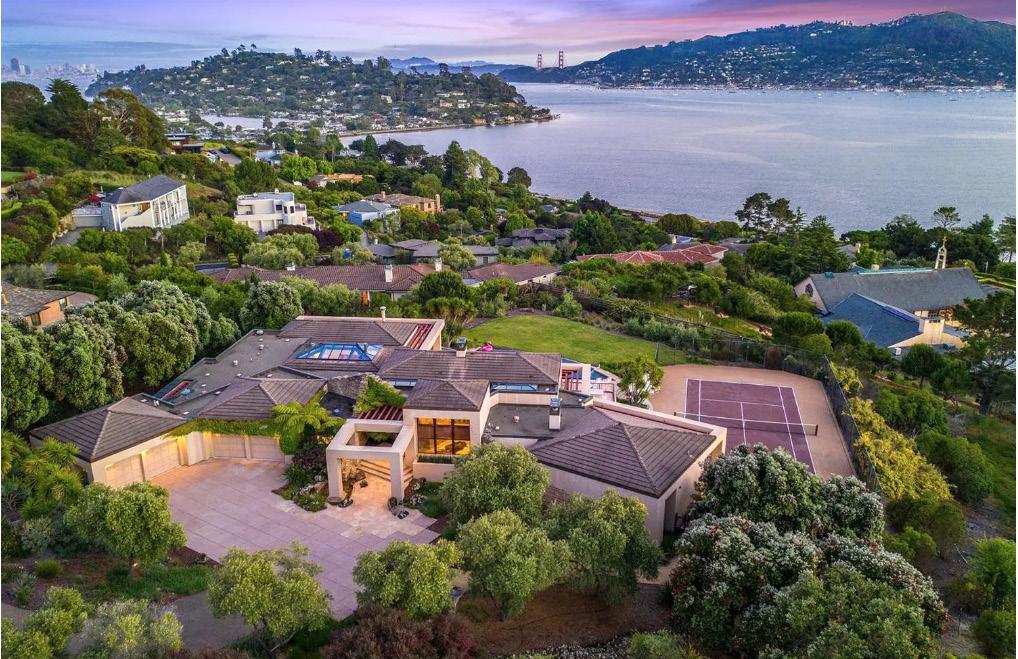
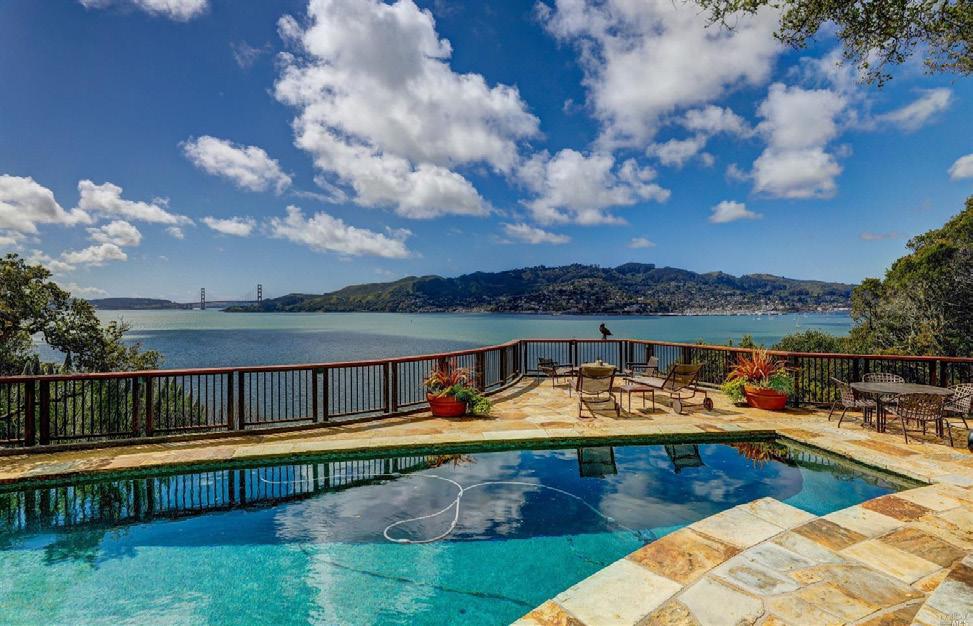
2 SPRING LANE I $8,000,000 TIBURON
LISTED BY APPLEGARTH + WARRIN

48
49
AVERAGE SALES PRICE PER SQUARE FOOT


MEDIAN SALES PRICE VS. HOMES SOLD

BELVEDERE $500 $700 $900 $1,100 $1,300 $1,500 $1,700 $1,900 $2,100 2008 2009 2010 2011 2012 2013 2014 2015 2016 2017 2018 2019 2020 2021 2022*
$1,000,000 $1,500,000 $2,000,000 $2,500,000 $3,000,000 $3,500,000 $4,000,000 $4,500,000 $5,000,000 2008 2009 2010 2011 2012 2013 2014 2015 2016 2017 2018 2019 2020 2021 2022* 0 10 20 30 40 50 Homes Sold Median Sales Price 50
AVERAGE SALES PRICE PER SQUARE FOOT


MEDIAN SALES PRICE VS. HOMES SOLD

CORTE MADERA $450 $550 $650 $750 $850 $950 $1,050 $1,150 2008 2009 2010 2011 2012 2013 2014 2015 2016 2017 2018 2019 2020 2021 2022*
$750,000 $950,000 $1,150,000 $1,350,000 $1,550,000 $1,750,000 $1,950,000 $2,150,000 2008 2009 2010 2011 2012 2013 2014 2015 2016 2017 2018 2019 2020 2021 2022* 0 20 40 60 80 100 120 Homes Sold Median Sales Price
51
AVERAGE SALES PRICE PER SQUARE FOOT


MEDIAN SALES PRICE VS. HOMES SOLD

FAIRFAX $350 $450 $550 $650 $750 $850 $950 2008 2009 2010 2011 2012 2013 2014 2015 2016 2017 2018 2019 2020 2021 2022*
$500,000 $700,000 $900,000 $1,100,000 $1,300,000 $1,500,000 2008 2009 2010 2011 2012 2013 2014 2015 2016 2017 2018 2019 2020 2021 2022* 0 20 40 60 80 100 120 Homes Sold Median Sales Price
52
AVERAGE SALES PRICE PER SQUARE FOOT


MEDIAN SALES PRICE VS. HOMES SOLD

KENTFIELD $450 $550 $650 $750 $850 $950 $1,050 $1,150 $1,250 2008 2009 2010 2011 2012 2013 2014 2015 2016 2017 2018 2019 2020 2021 2022*
$750,000 $1,250,000 $1,750,000 $2,250,000 $2,750,000 $3,250,000 $3,750,000 2008 2009 2010 2011 2012 2013 2014 2015 2016 2017 2018 2019 2020 2021 2022* 0 20 40 60 80 100 Homes Sold Median Sales Price
53
AVERAGE SALES PRICE PER SQUARE FOOT


MEDIAN SALES PRICE VS. HOMES SOLD

LARKSPUR $450 $550 $650 $750 $850 $950 $1,050 $1,150 $1,250 $1,350 2008 2009 2010 2011 2012 2013 2014 2015 2016 2017 2018 2019 2020 2021 2022*
$750,000 $1,250,000 $1,750,000 $2,250,000 $2,750,000 2008 2009 2010 2011 2012 2013 2014 2015 2016 2017 2018 2019 2020 2021 2022* 0 20 40 60 80 100 Homes Sold Median Sales Price
54
AVERAGE SALES PRICE PER SQUARE FOOT


MEDIAN SALES PRICE VS. HOMES SOLD

MILL VALLEY
$450 $550 $650 $750 $850 $950 $1,050 $1,150 $1,250 2008 2009 2010 2011 2012 2013 2014 2015 2016 2017 2018 2019 2020 2021 2022*
$750,000 $950,000 $1,150,000 $1,350,000 $1,550,000 $1,750,000 $1,950,000 $2,150,000 $2,350,000 2008 2009 2010 2011 2012 2013 2014 2015 2016 2017 2018 2019 2020 2021 2022* 0 50 100 150 200 250 300 350 400 450 Homes Sold Median Sales Price 55
AVERAGE SALES PRICE PER SQUARE FOOT

MEDIAN SALES PRICE VS. HOMES SOLD

ROSS
$450 $650 $850 $1,050 $1,250 $1,450 $1,650 $1,850 2008 2009 2010 2011 2012 2013 2014 2015 2016 2017 2018 2019 2020 2021 2022*
$750,000 $1,250,000 $1,750,000 $2,250,000 $2,750,000 $3,250,000 $3,750,000 $4,250,000 $4,750,000 $5,250,000 2008 2009 2010 2011 2012 2013 2014 2015 2016 2017 2018 2019 2020 2021 2022* 0 5 10 15 20 25 30 35 40 45 Homes Sold Median Sales Price 56
AVERAGE SALES PRICE PER SQUARE FOOT


MEDIAN SALES PRICE VS. HOMES SOLD

SAN ANSELMO $400 $500 $600 $700 $800 $900 $1,000 $1,100 2008 2009 2010 2011 2012 2013 2014 2015 2016 2017 2018 2019 2020 2021 2022*
$700,000 $900,000 $1,100,000 $1,300,000 $1,500,000 $1,700,000 $1,900,000 2008 2009 2010 2011 2012 2013 2014 2015 2016 2017 2018 2019 2020 2021 2022* 0 50 100 150 200 250 Homes Sold Median Sales Price
57
AVERAGE SALES PRICE PER SQUARE FOOT


MEDIAN SALES PRICE VS. HOMES SOLD

SAUSALITO
$400 $500 $600 $700 $800 $900 $1,000 $1,100 $1,200 $1,300 2008 2009 2010 2011 2012 2013 2014 2015 2016 2017 2018 2019 2020 2021 2022*
$700,000 $1,200,000 $1,700,000 $2,200,000 $2,700,000 $3,200,000 2008 2009 2010 2011 2012 2013 2014 2015 2016 2017 2018 2019 2020 2021 2022* 0 10 20 30 40 50 60 70 80 90 Homes Sold Median Sales Price 58
AVERAGE SALES PRICE PER SQUARE FOOT
MEDIAN SALES PRICE VS. HOMES SOLD
TIBURON $400 $500 $600 $700 $800 $900 $1,000 $1,100 $1,200 $1,300 2008 2009 2010 2011 2012 2013 2014 2015 2016 2017 2018 2019 2020 2021 2022*
$700,000 $1,200,000 $1,700,000 $2,200,000 $2,700,000 $3,200,000 2008 2009 2010 2011 2012 2013 2014 2015 2016 2017 2018 2019 2020 2021 2022* 0 10 20 30 40 50 60 70 80 90 Homes Sold Median Sales Price
59

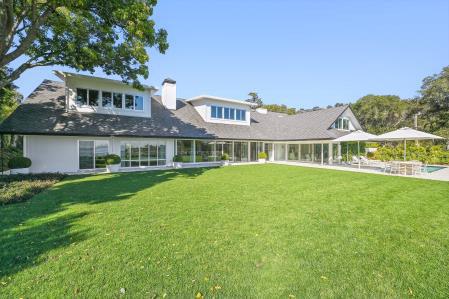
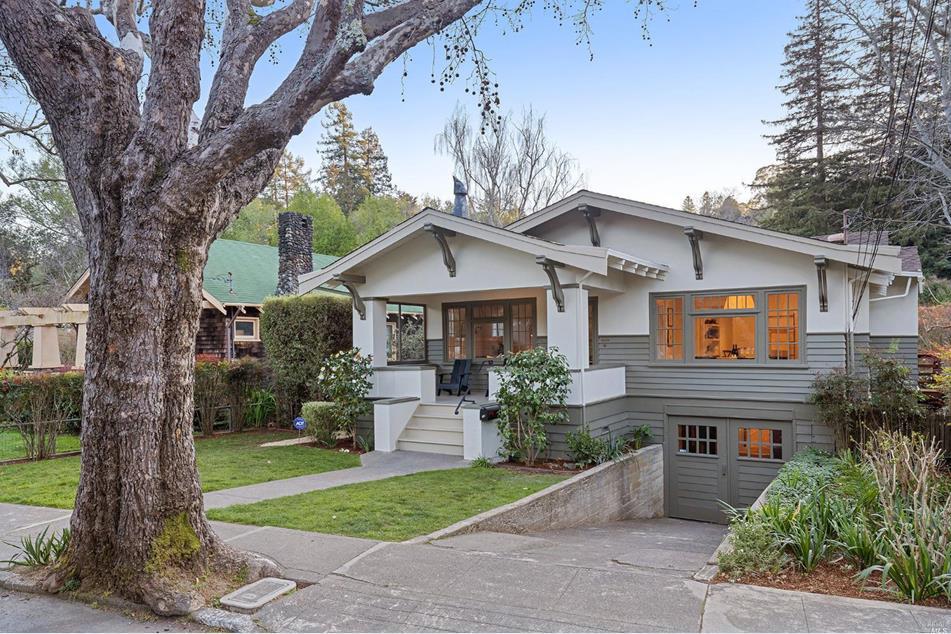
109 FAWN I $6,750,000 SAN ANSELMO LISTED BY APPLEGARTH + WARRIN 60

61

$1 73,000
HOLMBY
MANSION
Angeles,
$ 145,000 ,000 944
$ 141,000 ,000
$1 01,00 0,000
$ 100,00 0,000
220 CENTRAL PARK S
PH.
Midtown, Manhattan SoldOffMarket $1 90,000 ,000 2000 S OCEAN BLVD Manalapan, FL SoldOffMarket
,000
HILLS
Los
CA
AIROLE WAY Los Angeles, CA ListedbyCompass
4 EAST 66 th St. Upper East Side, Manhattan ListedbyDouglasEllimanRealty
27628
PACIFIC HWY Malibu, CA ListedbyColdwellBanker
62
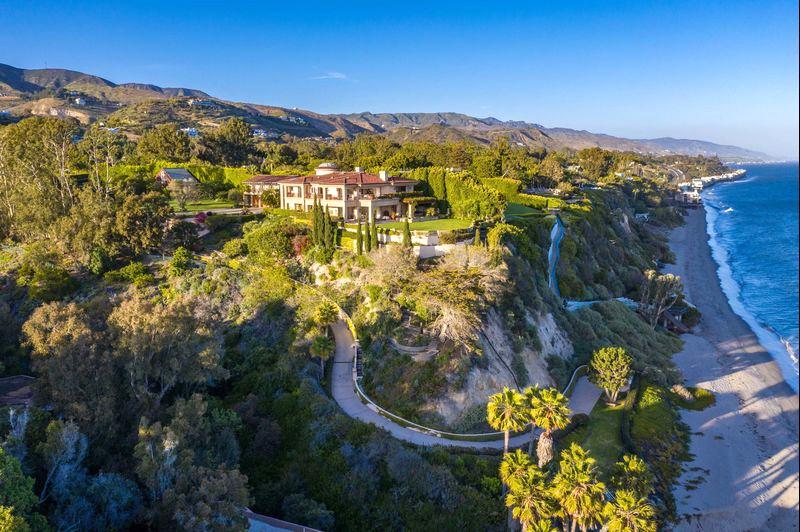
BIGGEST HOME SALES IN THE U.S. 2022
2022 HIGHLIGHTS SIGNIFICANT SALES

63


64


65


66


67


68
27401 Edgerton, Los Altos


69
340 BEACH I $4,950,000
BELVEDERE REPRESENTED BUYER
70
71
APPLEGARTH + WARRIN

72
MEET THE TEAM
PAUL WARRIN
Paul is consistently ranked top 1% nationwide. He is a 4th generation San Franciscan, with unrivaled local market knowledge.
415.407.8019
paul@applegarthwarrin.com
Lic. 01364693
KARA WARRIN
With an impeccable eye and background in design, Kara is uniquely qualified to guide clients through the process of home transformation, buying and selling.
415.407.7979
kara@applegarthwarrin.com
Lic. 01882747
MAX APPLEGARTH
Max is a 4th generation San Francisco native, ranked in the top 1% of Realtors, and holds the International President’s Premier Top Producer designation.


415.298.7600
max@applegarthwarrin.com
Lic. 01423191
SKYE ADDICKS
Skye is a 7th generation San Francisco native. Coming from an extensive design background, she has a unique ability to identify hidden opportunities.
415.717.6036
skye@applegarthwarrin.com
Lic. 02137351
CLAIRE BAYLES
Raised in Tiburon, Claire has an innate understanding of Marin County life. She offers an array of design and development expertise.
415.218.0535
claire@applegarthwarrin.com
Lic. 02061042
HOLLY KHOUW
Holly is originally from the East Coast and has extensive experience in Marketing along with well-rounded knowledge for all that Marin and San Francisco offer.


415.444.6403
holly@applegarthwarrin.com
Lic. 01478076
73

415-289.8999 team@applegarthwarrin.com O V E R $ 2 B I L L I O N I N S A L E S


