Isaac Martinotti Bachelor of Architecture
University of Oregon Selected Works ‘22
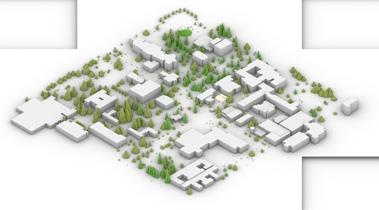
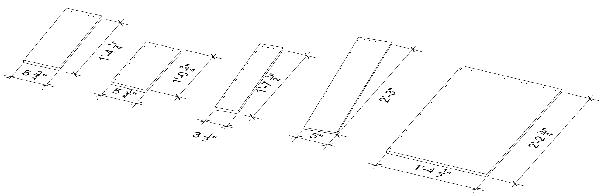
Willamette HEHE BRCA HEHE BRCA HEHE BRCA BRCA HEHE RUUR RUUR RUUR RUUR RUUR RUUR RUUR RUUR ANLE ANLE ANLE POMU MAAQ GAAP GAAP RIRU RIRU PISY ACMA PONI PONI ALGL ALGL ALGL
ALGL ALGL ALGL ALGL N Schedule 10 5 Pathway
Alnus glutinosa Populus nigra Acer macrophylum Pinus Sylvestris
isaac@archiology.org
Isaac Martinotti
Eugene, Oregon, USA
Contact:
Academic: imm@uoregon.edu
Other: isaac@archiology.org
Most things: @mrmartinotti
Isaac is an architectural designer, computational researcher and multidisciplinary artist focusing on the intersection of contemporary technologies, traditional forms of construction, and computer driven production. Being born and raised in the Pacific Northwest, wood-products and sustainable design are a large inspiration, an overwhelming fascination, and an absolute necessity.
Currently working as an academic researcher for the Institute for Health in the Built Environment, and the Energy Studies in Buildings Laboratory at the University of Oregon - Isaac is able to pursue his passion for designing systems and software to benefit non-professional end-users by leveraging the technology, resources, and training afforded to researchers.
This connection is best displayed through the projects and publications that he has been involved with, as well as the artistic collectives and campus initiatives that Isaac dedicates his time to.
Bachelor of Architecture - University of Oregon
College of Design | Summa Cum Laude | 3.95/4.3 Cumulative GPA
Minor in Art History
Minor in Landscape Architecture Minor in Interior Architecture
Associate
of the Arts - Portland Community College
Focus in Maths | Highest Honors | 4.0/4.0 Cumulative GPA
Education: Experiences:
Associate Researcher
Institute for Health in the Built Environment
spring ‘22
spring ‘17
summer ‘22 - present
Assistant in academic research, design, and testing. Generative data visualizations, scripting, writing, and renderings for academic papers and publications. Full-time support for staff of the IHBE relating to software, field study, and physical models.
Designer & Builder
Fuller Initiative for Productive Landscapes
summer ‘22 - present
Production oriented position focusing on supporting artists and university staff in the creation of climate-response art installations. Heavy use of 3D & parametric design, CNC, laser, and traditional woodworking techniques to create gallery-ready works for public consumption.
spring ‘21 - present Associate Researcher
Energy Studies in Buildings & Biology in the Built Environment Laboratories Design & build position including the creation of testing apparatus’ for on-site wind tunnel, acoustic, and lighting setups. Photography, videography & renderings for publication.
Computer
Technology Assistant
spring ‘21 - summer ’22
University of Oregon - College of Design Assistant to a previous professor - tasked with leading labs, guest lecturing, and assisting graduate/undergraduate students in learning architectural softwares. Coordinating roll out of new workflows, writing lab notes, & reviewing submitted work.
Departmental Faculty Assistant
fall ‘21 - winter ’22
University of Oregon - College of Design Assistant to the department head. Provided verbal & written feedback for lesson plans, and tutored software for a design studio. Teaching Rhino 3D, Grasshopper, physical modeling, and assisting in the development of 1:1 scale timber structures. Webmaster for several websites including user account control, security, & design.
Mentor Resident Assistant
University of Oregon - Housing Department
fall ‘18 - spring ’22
Live-in position providing assistance and mediation for incoming first-year students. Focus on building strong communities with transparent standards, facilitating teamwork and conducive learning environments.
Student Leader - UO Maker Club
University of Oregon - Division of Student Life
fall ‘20 - winter ’22
Volunteer leadership position planning meetings and events for the UO Maker Club. Working with professional staff to utilize budgets, engage with the student body, and to assist in creating interesting mechanical / electrical projects for members to complete.
Script Writer & Video Editor - YouTube & Vimeo
ZacCoxTV
|
Archiology
fall ‘13 - summer ’19
| Fallout Forward | Various Personal Projects
Freelance writing, filming, mixing, and editing of 500+ digital videos of various lengths and on various platforms. Worked with individual filmmakers to deliver web-based content within small budgets and on tight schedules. Strong understanding of A/V, social media optimization, and production workflows.
Research & Publications: Contents:
Patterns for Health - A Parametric Tool for Creating Healthy and Habitable Spaces
Isaac Martinotti, Alen Mahic, Kevin Van Den Wymelenberg, Mark Fretz
winter ‘22
Role: Computational and visual lead. Designed a pipeline for gathering open-source data to produce custom CFD simulations and visualizations based on user-provided structural geometry. Worked closely with the VELUX Corporation to provide resources based on the tool for their Build For Life exhibition at the World Capital of Architecture.
SARS-CoV-2 Multimodal Detection and Outbreak Tracking in Buildings
Andreas Olsen Martinez, Leslie G. Dietz, Dale Northcutt, et. al.
fall ‘22
Role: Created spatial and temporal visualizations for pre-print paper and accompanying video publication. Assisted in data analysis, scripting, and documentation.
A Min-Max Protocol for Adaptive Refugee Housing - ICSA Applied Statistics Symposium
Earl J. Mark, Nancy Cheng, Dan Golczewski, et. al.
winter ‘21
Role: Created spatial visualizations and structural documentation for a conference paper, and accompanying presentation graphics. Provided production support, physical models, and publication editing.
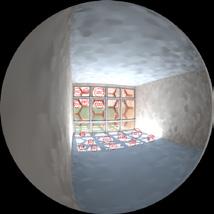
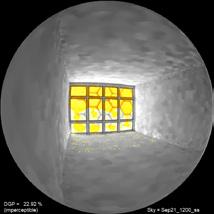
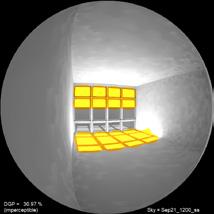
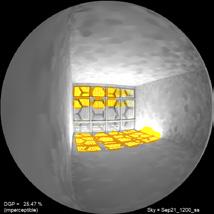
Simple Simulations for Complex Construction: Utilizing Calibrated HDRI Skydomes to Control Digital Models
Isaac Martinotti, Alen Mahic, Kevin Van Den Wymelenberg
fall ‘21
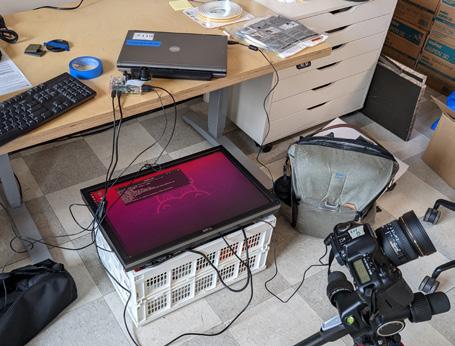
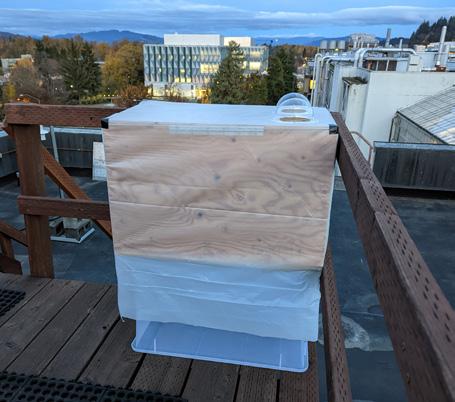
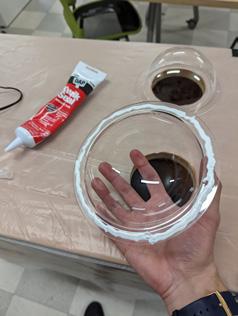
Role: Project lead for creating a pipeline allowing autonomously captured HDRI images to control in-room lighting of a university laboratory. Constructed a rooftop enclosure for a camera rig, a system for automating the capture of calibrated HDRI images, and a Radiance-based simulation setup for controlling smart lights.
Recent Exhibitions:
‘Build for Life’ - VELUX Corporation
World Capital of Architecture - Copenhagen,
winter ‘23
Role: Design lead for an exhibition adapted from a research endeavor with the VELUX Corporation. Created visualizations, ad copy, and video clips for a client exhibit.
Prompt: Rethinking how buildings can help resolve global climate & health challenges through sustainability.
‘Transpecies
Design’ - University Submission
La Biennale di Venezia - Venice, Italy
winter ‘22
Role: Part of a small team working out of the Institute for Health in the Built Environment, tasked with design / build of a gallery-quality wooden model and 2D graphics.
Prompt: Departmental initiative connecting design and the greater biological world.
- Presented by Fuel Ladder Center for Art Research - University of Oregon
‘Ignition’
fall ‘22
Role: Design / build of several art pieces included in the show - working closely with the Fuller Center for Productive Landscapes and other Fuel Ladder members.
Prompt: Investigating climate change through the lens of historic wildfire prevention.
‘Ghost
Forests’
Trustman Art Gallery - Simmons University
summer ‘22
Role: Construction of several wooden shields included in the show - working closely with visiting professor David B. Borden and the Fuller Center for Productive Landscapes.
Prompt: Examining the dying forest ecosystems of North America and our response.
Skills: Rhinoceros 5+ • Grasshopper •Hand Sketching • Revit • AutoCAD • CNC Plotting • Digital Drawing drawing / modeling Blender • Photoshop• After Effects • Illustrator • InDesign• Figma • V-Ray • Premiere Pro • RStudio editing / graphics Carpentry • Laser Cutting • 3D Printing • CNC Routing • Hand Drawing / Finishing • Concrete Casting physical production 01. Patterns for Health 02. SafeAirspaces 03. OuroForest 04. Fine Grained 05. Theseus’ Village 06. AR Recipes 07. Recursive Radiance 08. Moiré Than Meets The Eye 09. Tweeter Weather 10. Fuel Ladder 11. Error 507 What’s next? Professional Professional Academic Academic Academic Personal Academic Academic Academic Personal Personal
Patterns for Health Parametric Energy & Health Tool Research & Development


Collaborator | VELUX Group
Project
Team: Isaac Martinotti - Research Assistant
Alen
Mark
Mahic - Research Associate
Fretz - Interim Director (IHBE)
Dr. Kevin V.D.W. - Director (UO SAE)
Date | July - December 2022
Worked independently - but part of a larger research grant - to create a parametric system for understanding how exterior weather impacts indoor health. Working primarily with open-source information, we combined available software to build a data pipeline, rendering setup, and supporting infrastructure for informative graphics. The graphics are currently being adapted into an in-house web-tool that works similarly to existing ‘pattern guides’ and allow for the dissemination of best-practices based on user defined scenarios.
01
buildhealth.uoregon.edu DesigntheUnseen @UO_IHBE
Patterns for Health

Condensation
Overview & Explanation
The pipeline that I have been working within attempts to leverage many of the industry standard technologies that architecture firms regularly use such as Radiance, OpenStudio, OpenFOAM, and NOAA weather data. This allows us to control the movement of information behind the scenes using various Rhino/Grasshopper scripts and simplify the number of inputs that are needed by the end-user. This also allows us to minimize the expertise that the end-user would need to have, but to continue to provide the accuracy and fidelity of information that a designer who is trained to use the base software could produce.
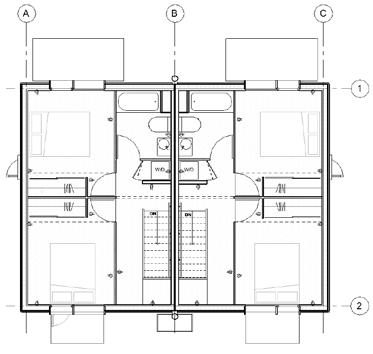
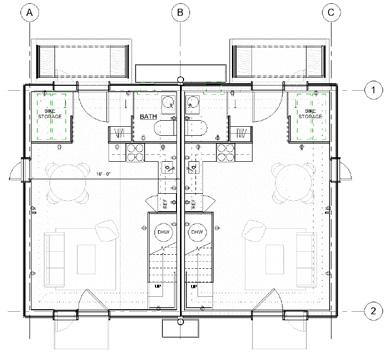
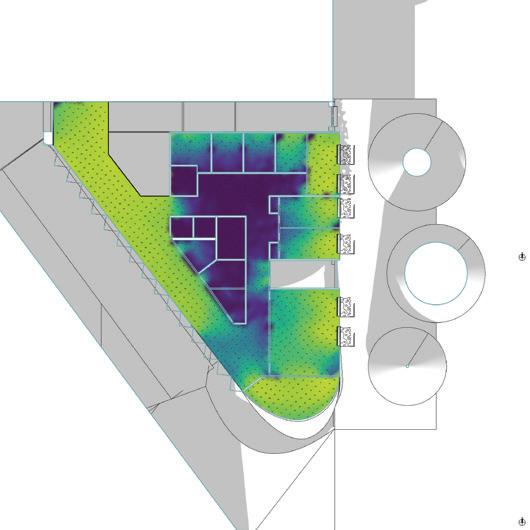
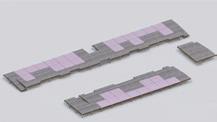
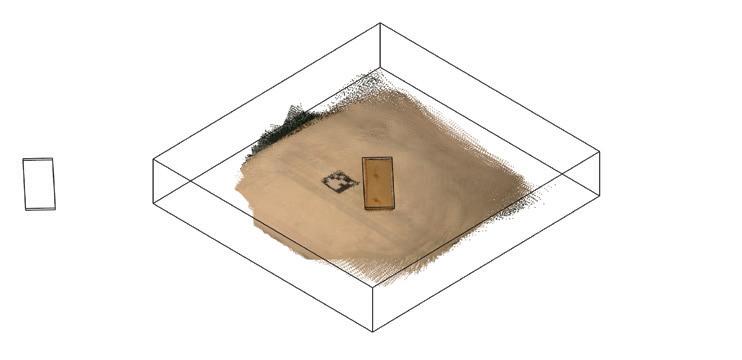
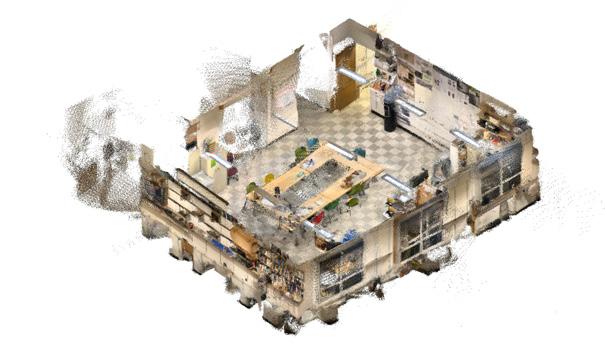
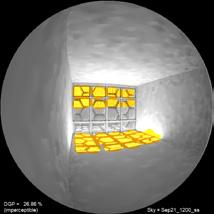
Case Study Home Overview

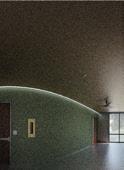
In the following pages we will be utilizing simplified geometry of a duplex structure of approximately 60 square meters to create proof-ofconcept simulations. This structure is designed as a typological case study home and is currently in preparation for construction documents, with the intention of a full-scale construction happening within Oregon in the coming year pursuant to an already funded research proposal.
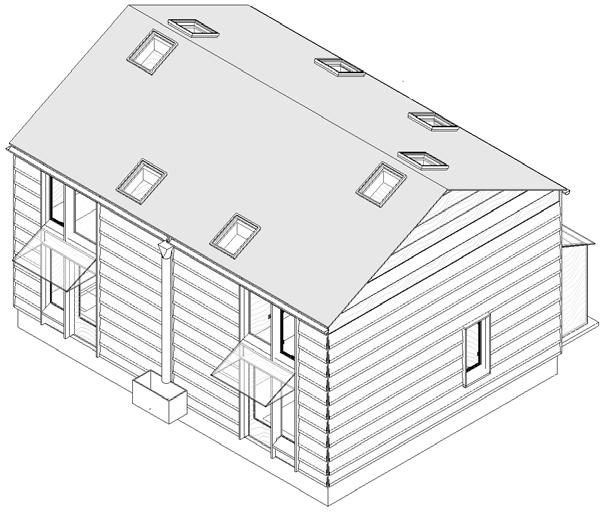
A single unit contains two bedrooms, one and a half bathrooms, kitchen/ dining, a living room, and various storage spaces throughout.
6
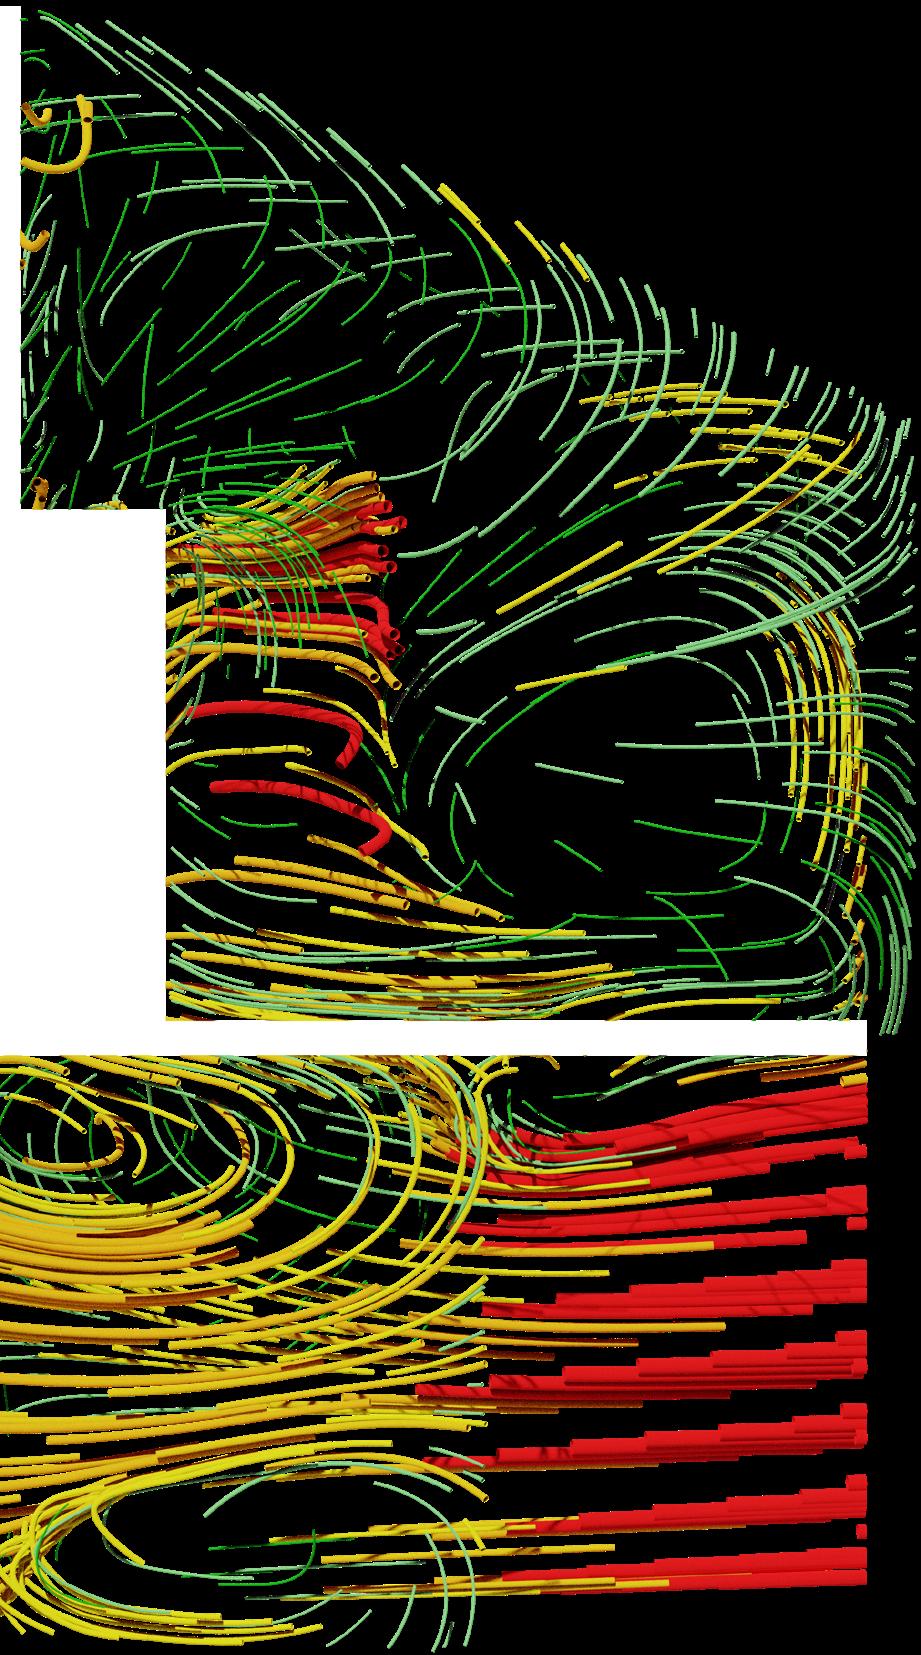
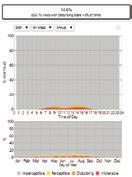
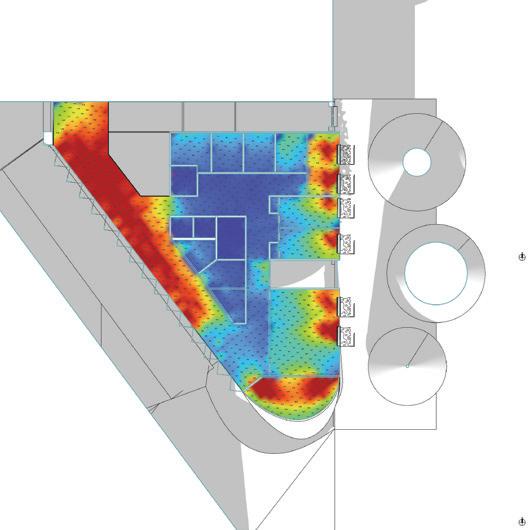
Overview & Structure
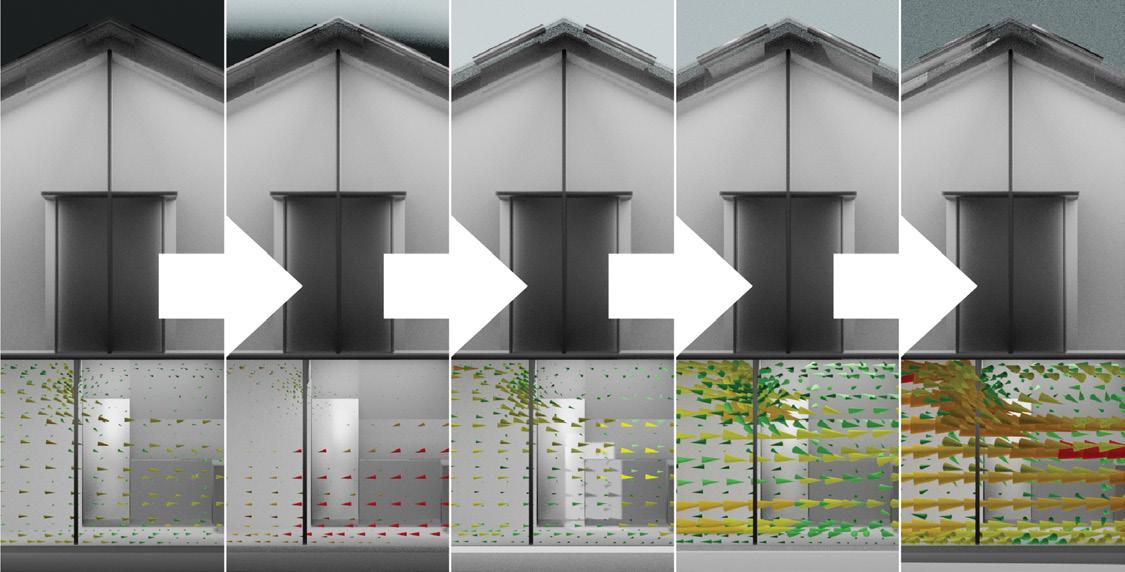
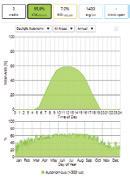
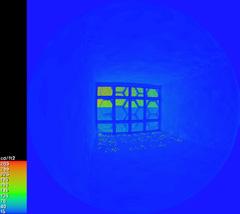
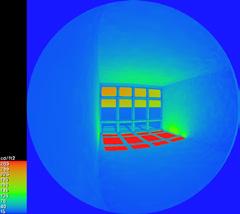
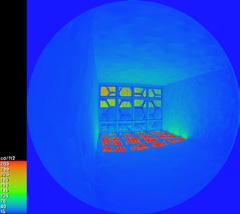
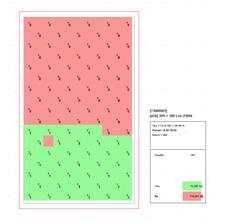
Stills Generation for Situational Comparisons:

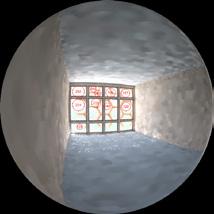
These two examples show the quantifiable difference that a 45° shift in wind direction would make to the upstairs bedroom. Notice the decrease in aerosol risk when the airflow is directed toward the center of the room instead of directly at the closet.
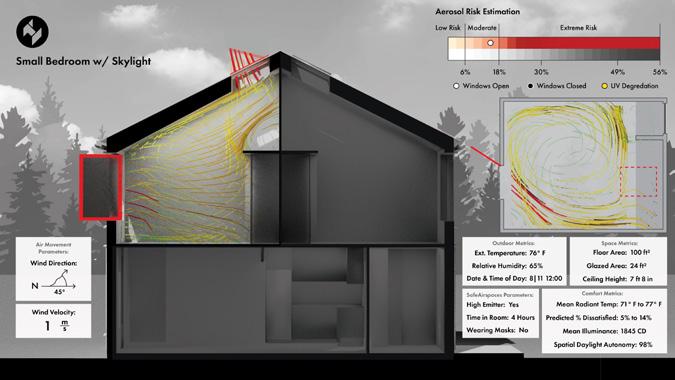
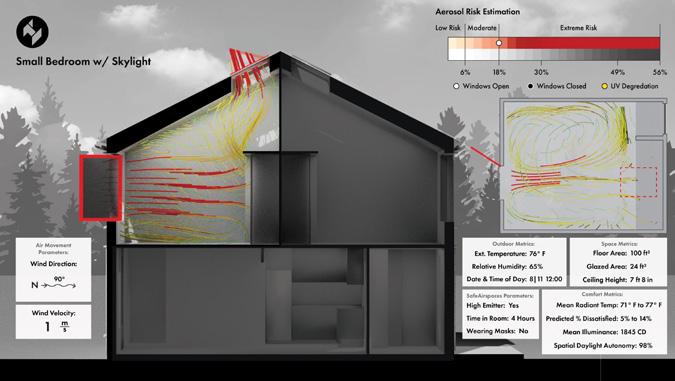
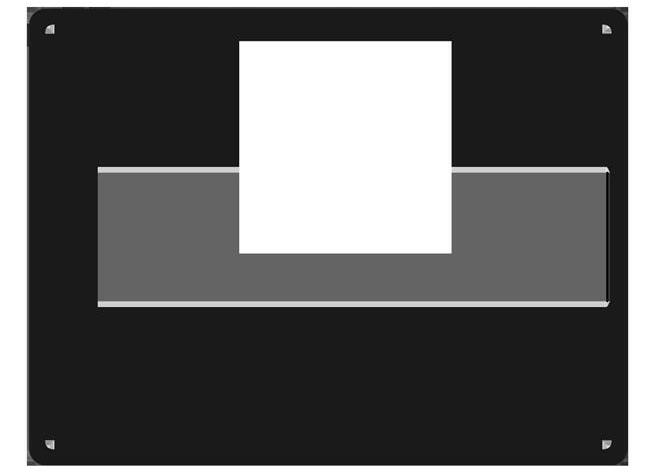
Benefits of stills:
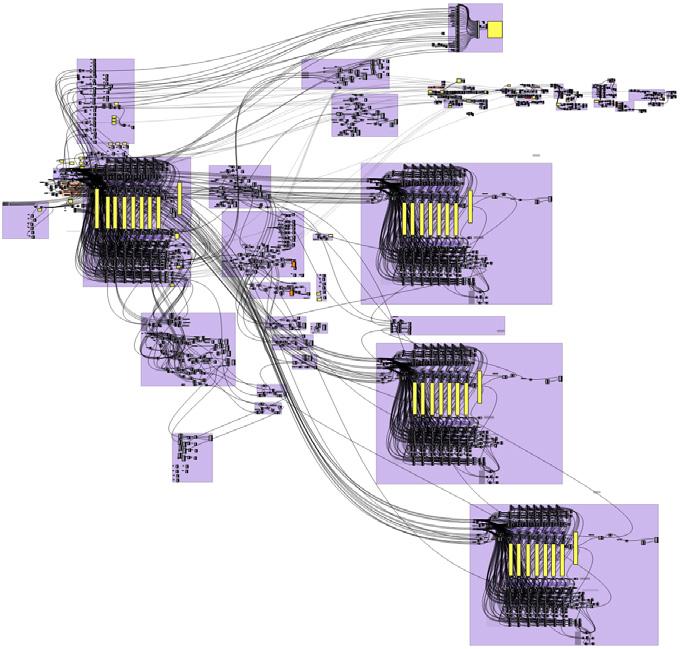
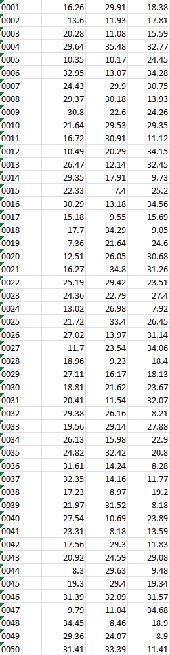
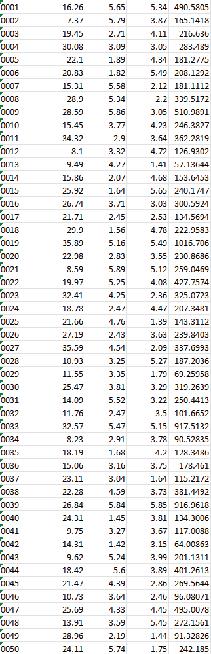
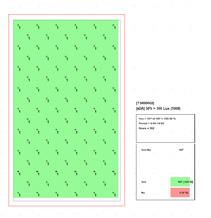
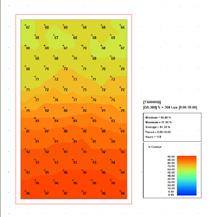
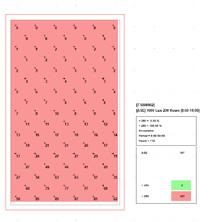
While our end goal has been to prototype an automated and interactive tool that allows users to quickly flip between different simulation cases, we quickly realized a simple system of parametric inputs would be a more realistic way to test the capabilities of our software. Each individual choice that we might allow a user to edit as an input would quickly and exponentially increase the possibilities that would need to be simulated, and the complexity of the overall tool. To best keep track of each individual change, and number of total possibilities, we settled on a matrix method to store rendered images and automatically overlay calculated data using InDesign's data merge.
Despite this relatively small number of input possibilities, the number of outputs still necessitated simulating, rendering, and calculating information for over 150 different possible situations.
7
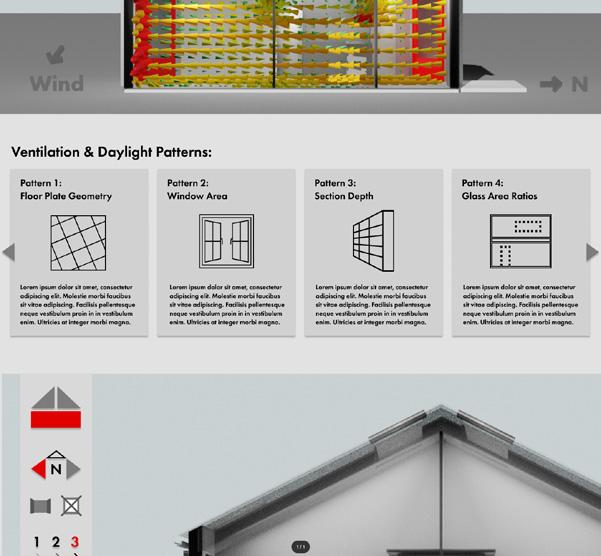
To make
the following
our inputs: 1 Location 1 Date 3 Wind Velocities 3 Wind Angles 3 Aperture Types 5 Room Combinations
a manageable system for our first attempt we designated
as
Image Creation & Explanation
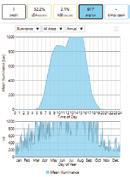
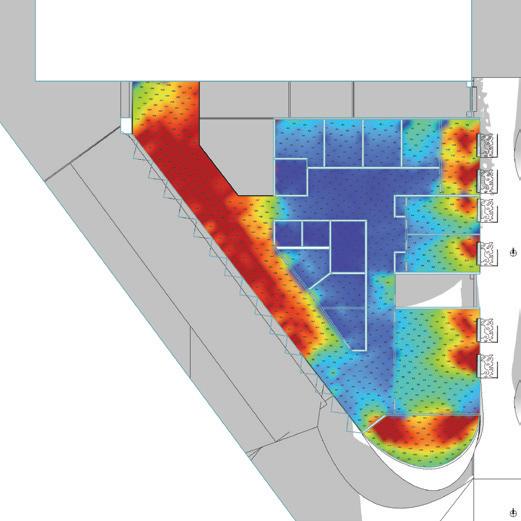
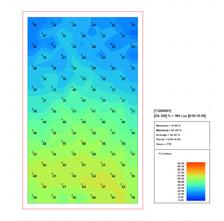
Video Generation for Temporal Comparisons:

Benefits of animation:
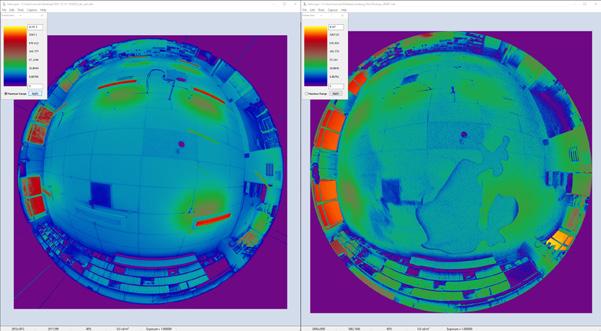
While numbers are always useful, they can often be difficult to fully understand without context. One of the main benefits of animating data is allowing the end user to see how aspects of a simulation change over time, and being able to provide instant feedback on how an individual action can completely alter a situation. To best show the results of these simulations over time, we created a system to run CFD calculation at specific time-steps throughout a specific day and overlay the animation with other useful metrics. Instant mean illuminance, mean indoor radiant temperature, and outdoor metrics allow us to show how changes in the exterior realm can very quickly change the overall indoor climate.
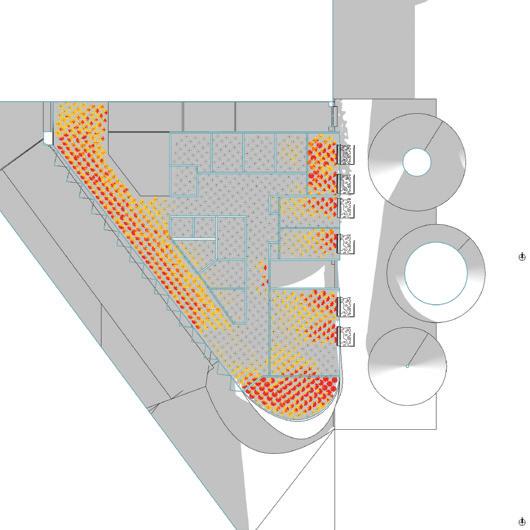
Viral Degradation:
This clip, based off of previous research by Alen Mahic, shows 3 separate scenarios containing a grid of test points.
Each point represents a volume of space containing a realistic density of Covid-19 particulates being bombarded with UVA and UVB radiation.
Although the research was done prior, this project allowed us to display the information in 3D space, a contemporary approach allowing for more informative graphics when compared to the flat planes used previously.
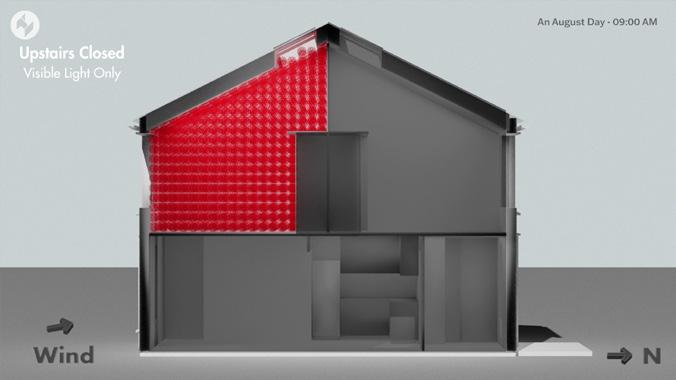
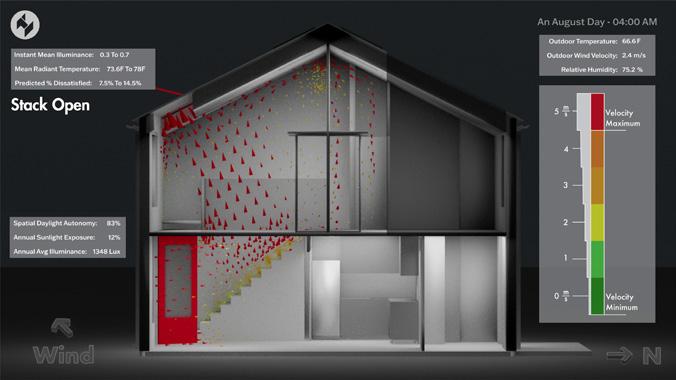
8
This two minute video shows a variety of different simulation setups and the applicable data associated with each case. Most spatial models are shown with an open & closed version for cross reference.
Clip Creation & Explanation
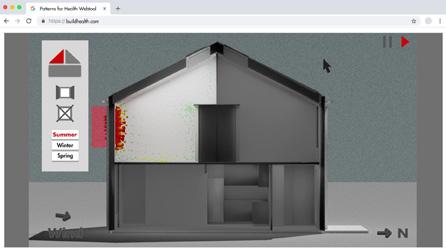
Web-tool Walk-through:
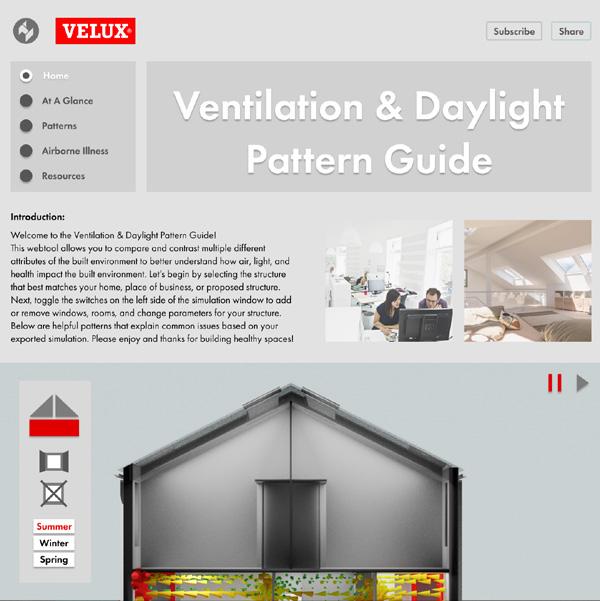
Web-tool:
This clip shows a possible interactive workflow for viewing the results of these simulations and changing their parameters. All content shown would be prerendered.
Conclusion & Next Steps

Packaging and dissemination:
What use is a tool that only a few can use?

Although this one structure simulated in a single climate allows for many important discussions and insights, the power of this pipeline is in its scalability. Creating an intuitive package for the scripts we have created would allow the insights of these various simulations to empower a new demographic of homeowners, designers, and students.

One avenue of output would be the creation of a webtool allowing the viewing of the existing visualizations, and creating a repository that could host more geometries, locations, and situations into the future.
Another possibility would be in creating a separate piece of software that could be available for download. While this would put more computational expectation on the end-user it would also allow for more freedom and opportunity on their end. This option would also require a heavier investment in creating a stable and quality controlled software suite capable of giving useful feedback to the user in the event of a failed run or unexpected result.
The following video clip loosely shows a possible UI/UX solution for viewing prerendered content in a web setting similar to that of the last figure. The content shown is heavily simplified from what is shown in previous clips, but could easily provide the same information and even the possibility of exporting results.
There are many benefits to prerendering content as it would allow a higher level of quality control, instant feedback based on changes and toggles, and reduced simulation hours and infrastructure costs. The main detriments would be the lack specific control allowed to end-users for inputting structures and climates.

9
Proposed Dissemination
SafeAirspaces Aerosol Risk Estimator

UI / UX & Development
Location | World Wide Web Project Team:
Dr. Hooman Parhizkar - Researcher
Dr. Kevin V.D.W. - Director (UO SAE)
Isaac Martinotti - Research Assistant
Date | November - December 2022
Assisted with user-interface development, back-end coding, and various efficiency changes to a Covid-19 web-tool created in Rhino, Grasshopper, and ShapeDiver.

The tool allows users to input specific parameters regarding their own home or office space, and assist in understanding how to mitigate risk of the space using techniques like air-changes per hour (ACH) and HEPA filtration (measured in CFM) of airborne particulates like aerosols. Worked with two lab managers to define a new scope for the project given an updated funding opportunity, as well as planning future phases.
This role primarily consisted of editing and adding new features to existing Grasshopper code - Designed to work with the ShapeDiver suiteand improving the speed and user experience of the website version of the tool.
https://safeairspaces.com/
10 02
Stemming from a paper written by Dr. Hooman Parhizkar in late 2020, this web-tool works as an intuitive calculator that provides the end user with a risk-level based on their inputs.
The main goals of the redesign shown to the left are minimizing the complexity of the overlay to simplify the computation, as well as reducing the expected knowledge level of the end-user. The more complex outputs and options were aggregated in a separate ‘export’ function that allows the user to download the entire calculation sheet with both metric and imperial units.
To facilitate the use of the original ShapeDiver platform, all of the calculations were required to occur within grasshopper’s default components. This reduced the ability to rely on scripting components such as C# or Python, and required more complex functions to be fully defined as step-by-step calculations.
Since joining this team, one of my main responsibilities has been to incorporate the new functionality of V2 and V3 of the ShapeDiver viewer. The majority of the script shown to the left was created by Dr. Parhizkar, and is now updated to the new standards. Much of this included adding back functionality that had to be stripped due to the limitations of V1, as well as assisting in adding new features that were present in the second scope of work for which the ESBL and IHBE received funding.
11
Dashboard & Explanation
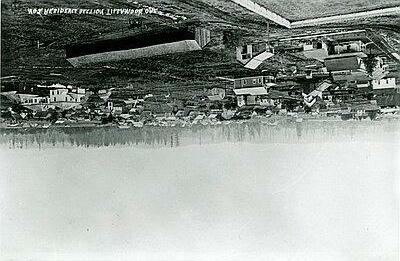
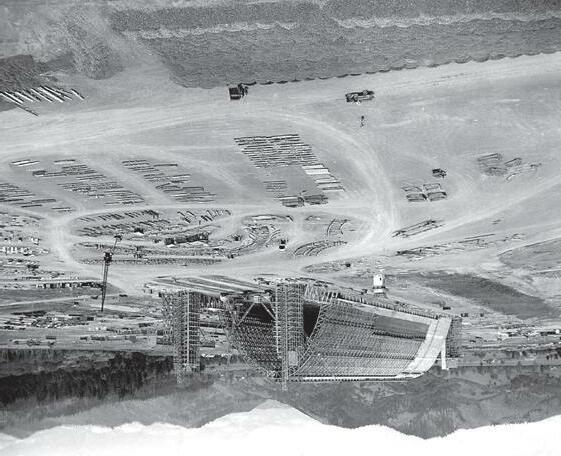
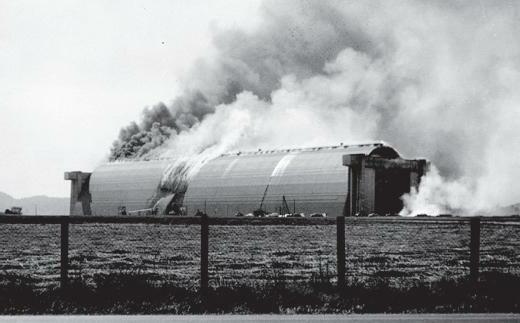
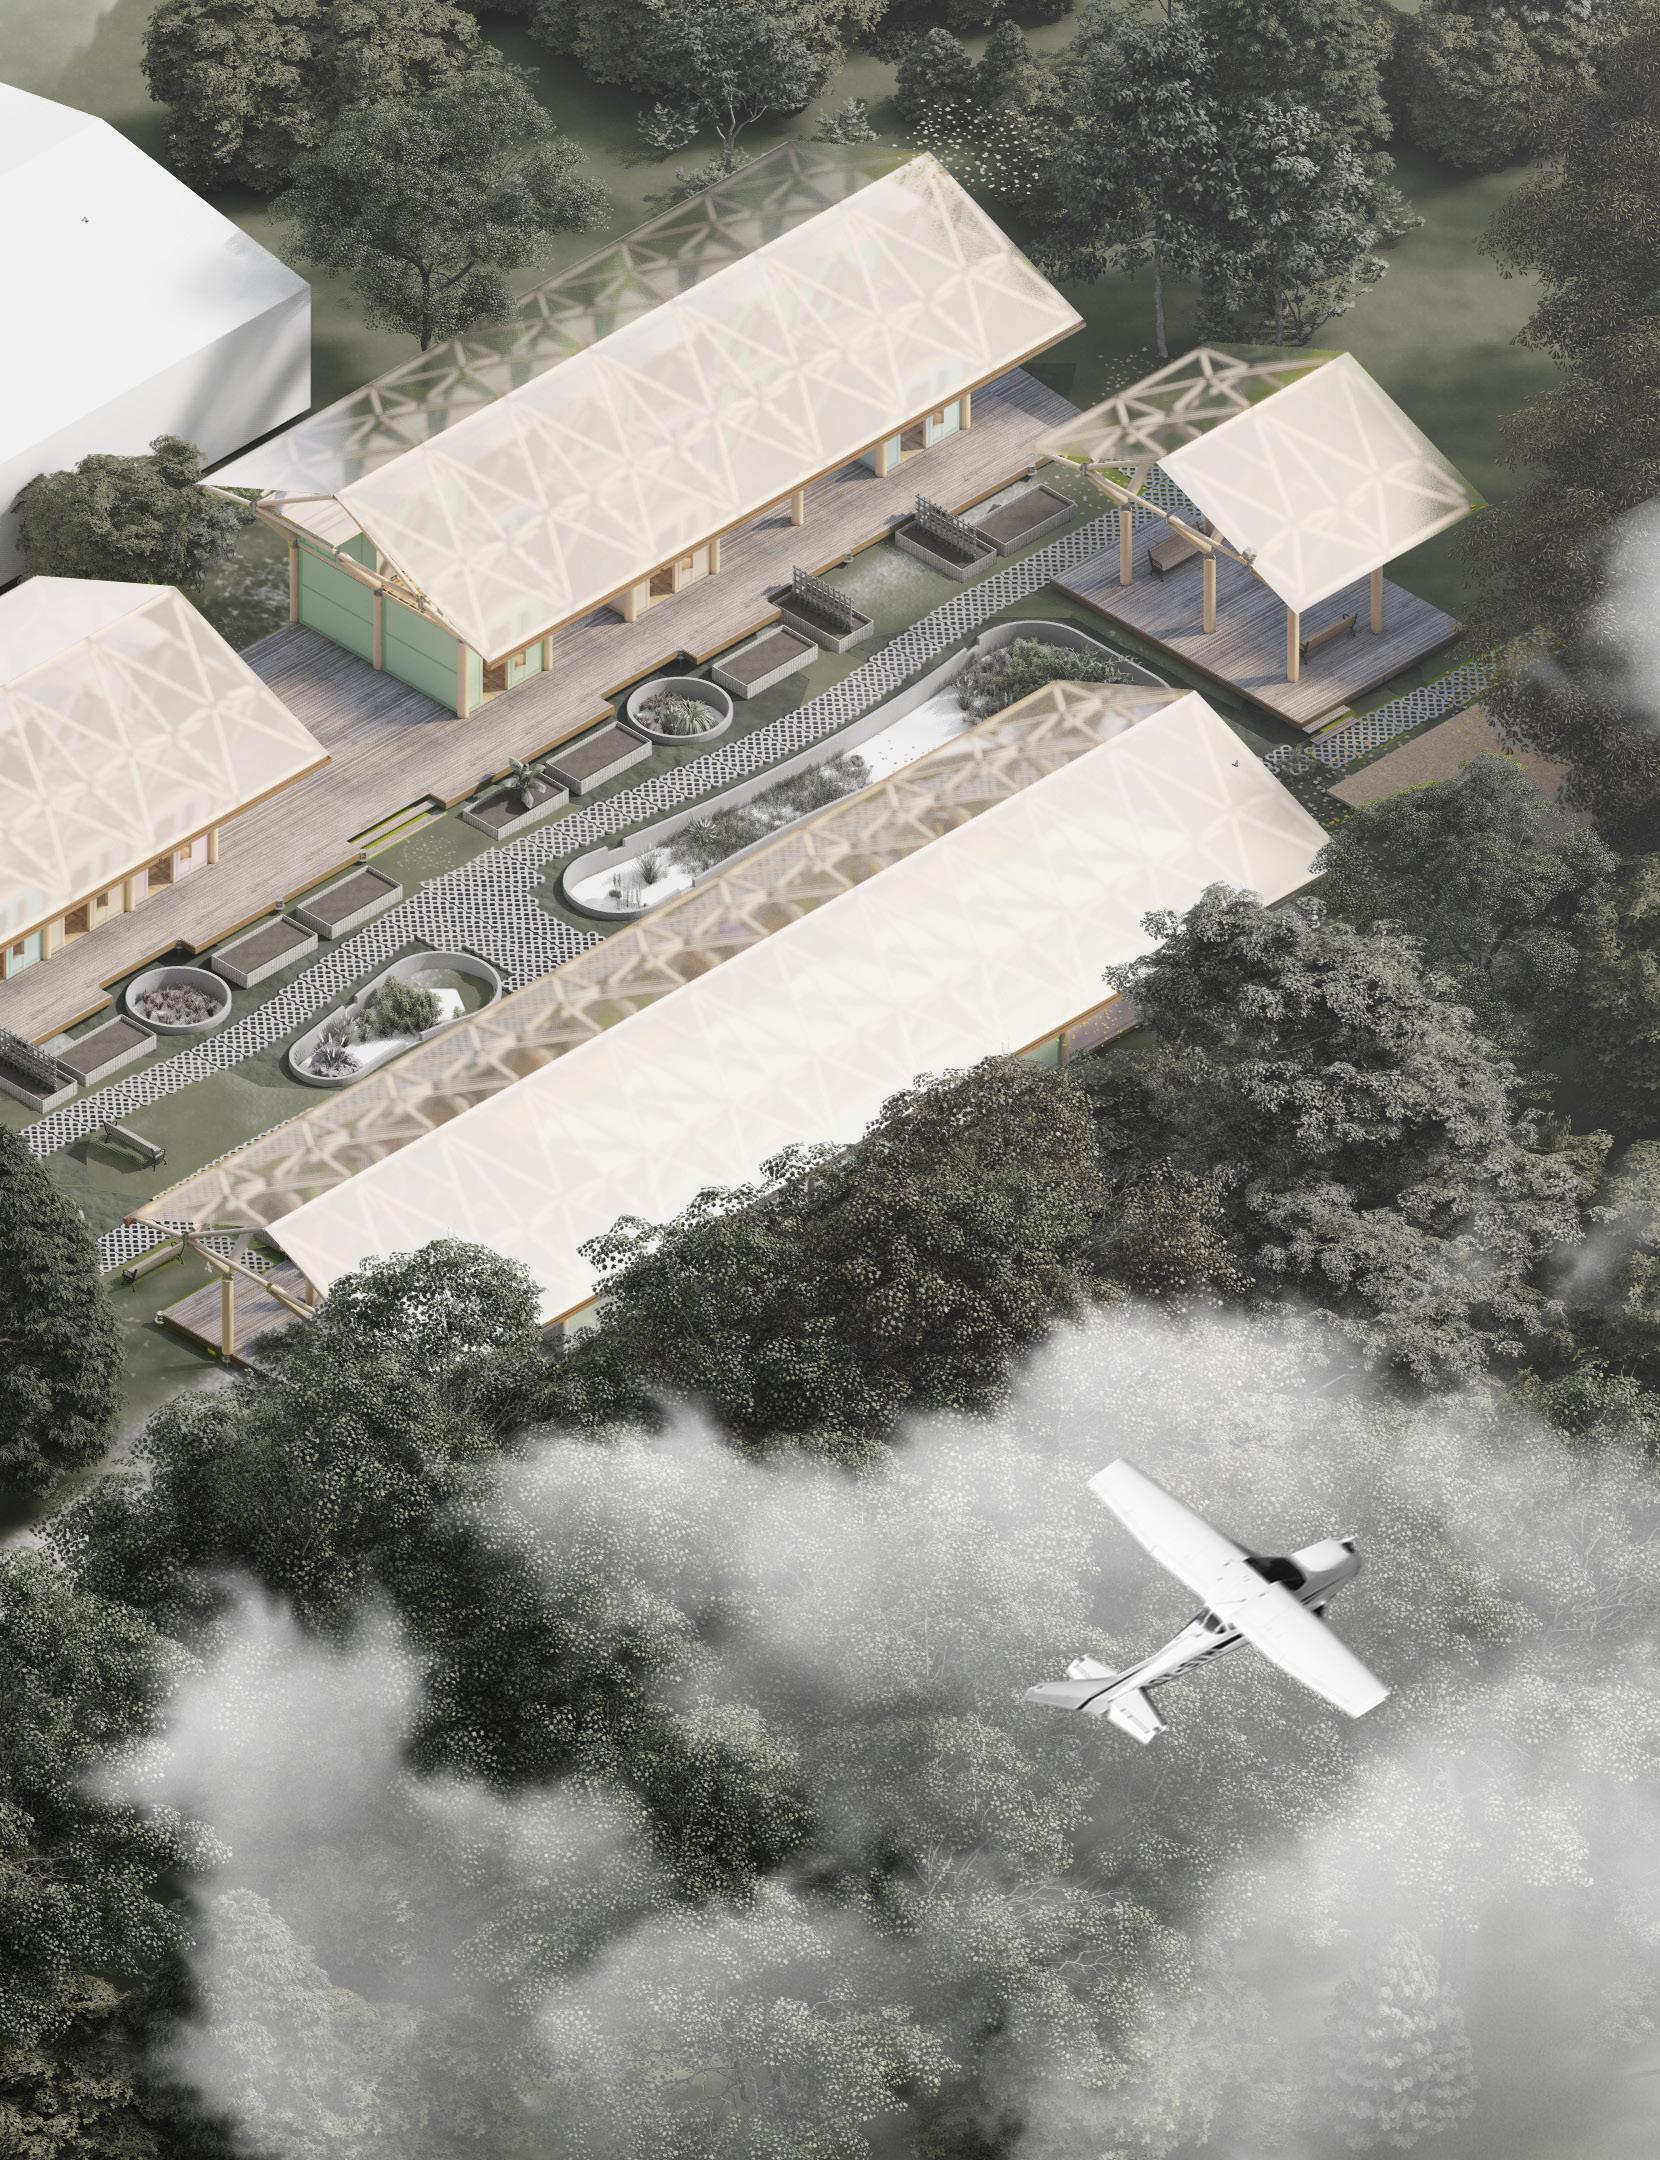
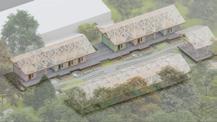
OuroForest Post-War Creative Reuse 20 Weeks
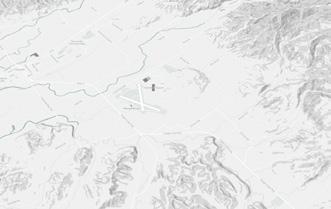
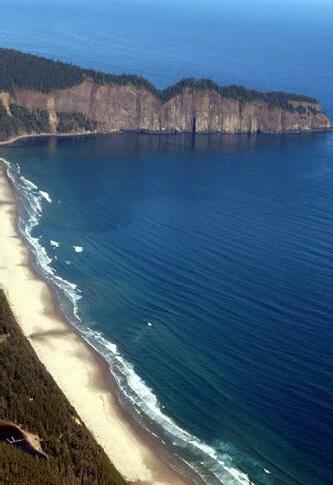
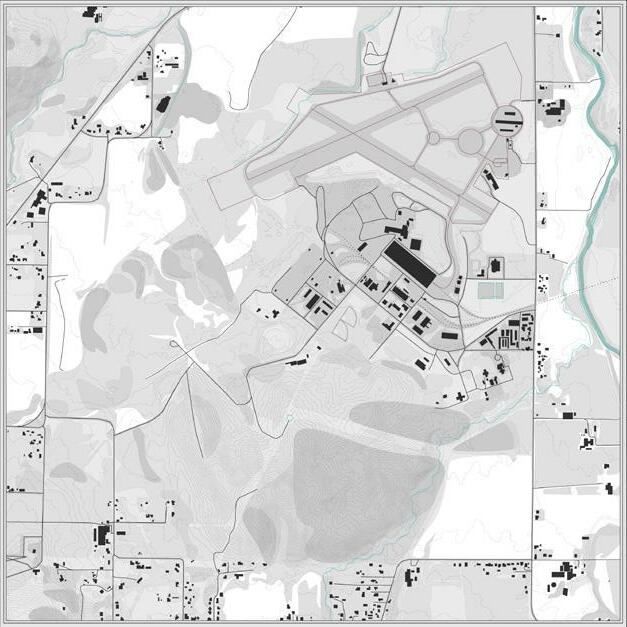
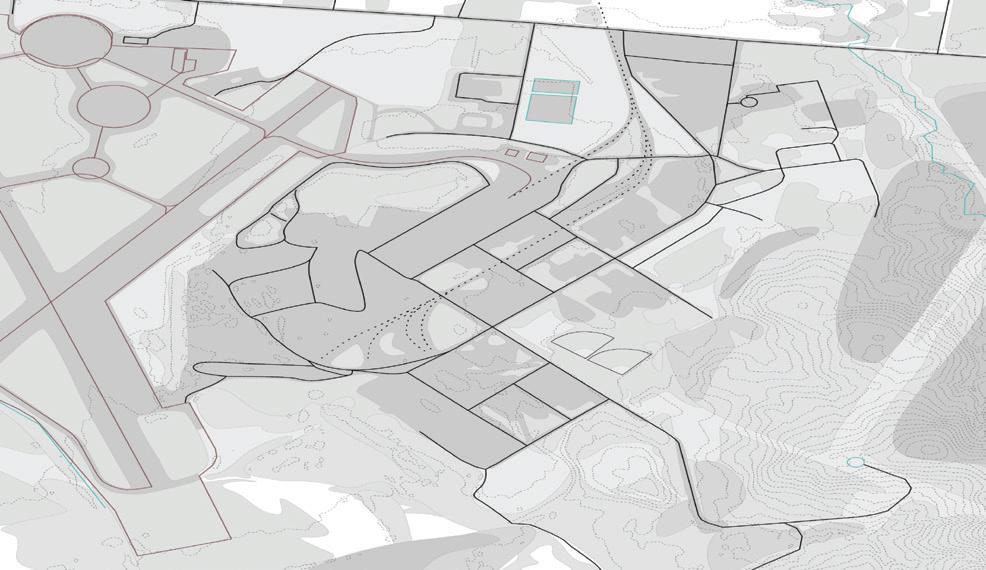
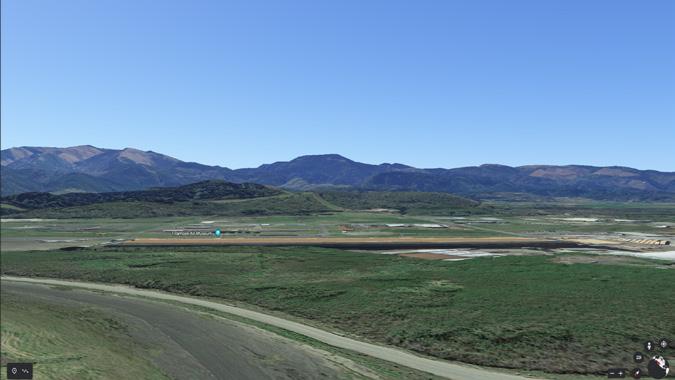
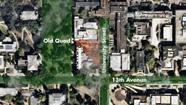
Location | Tillamook, Oregon, USA
Instructor
| Prof. Mark Donofrio

Client | Port of Tillamook Bay
Terminal Studio | Winter/Spring ‘22


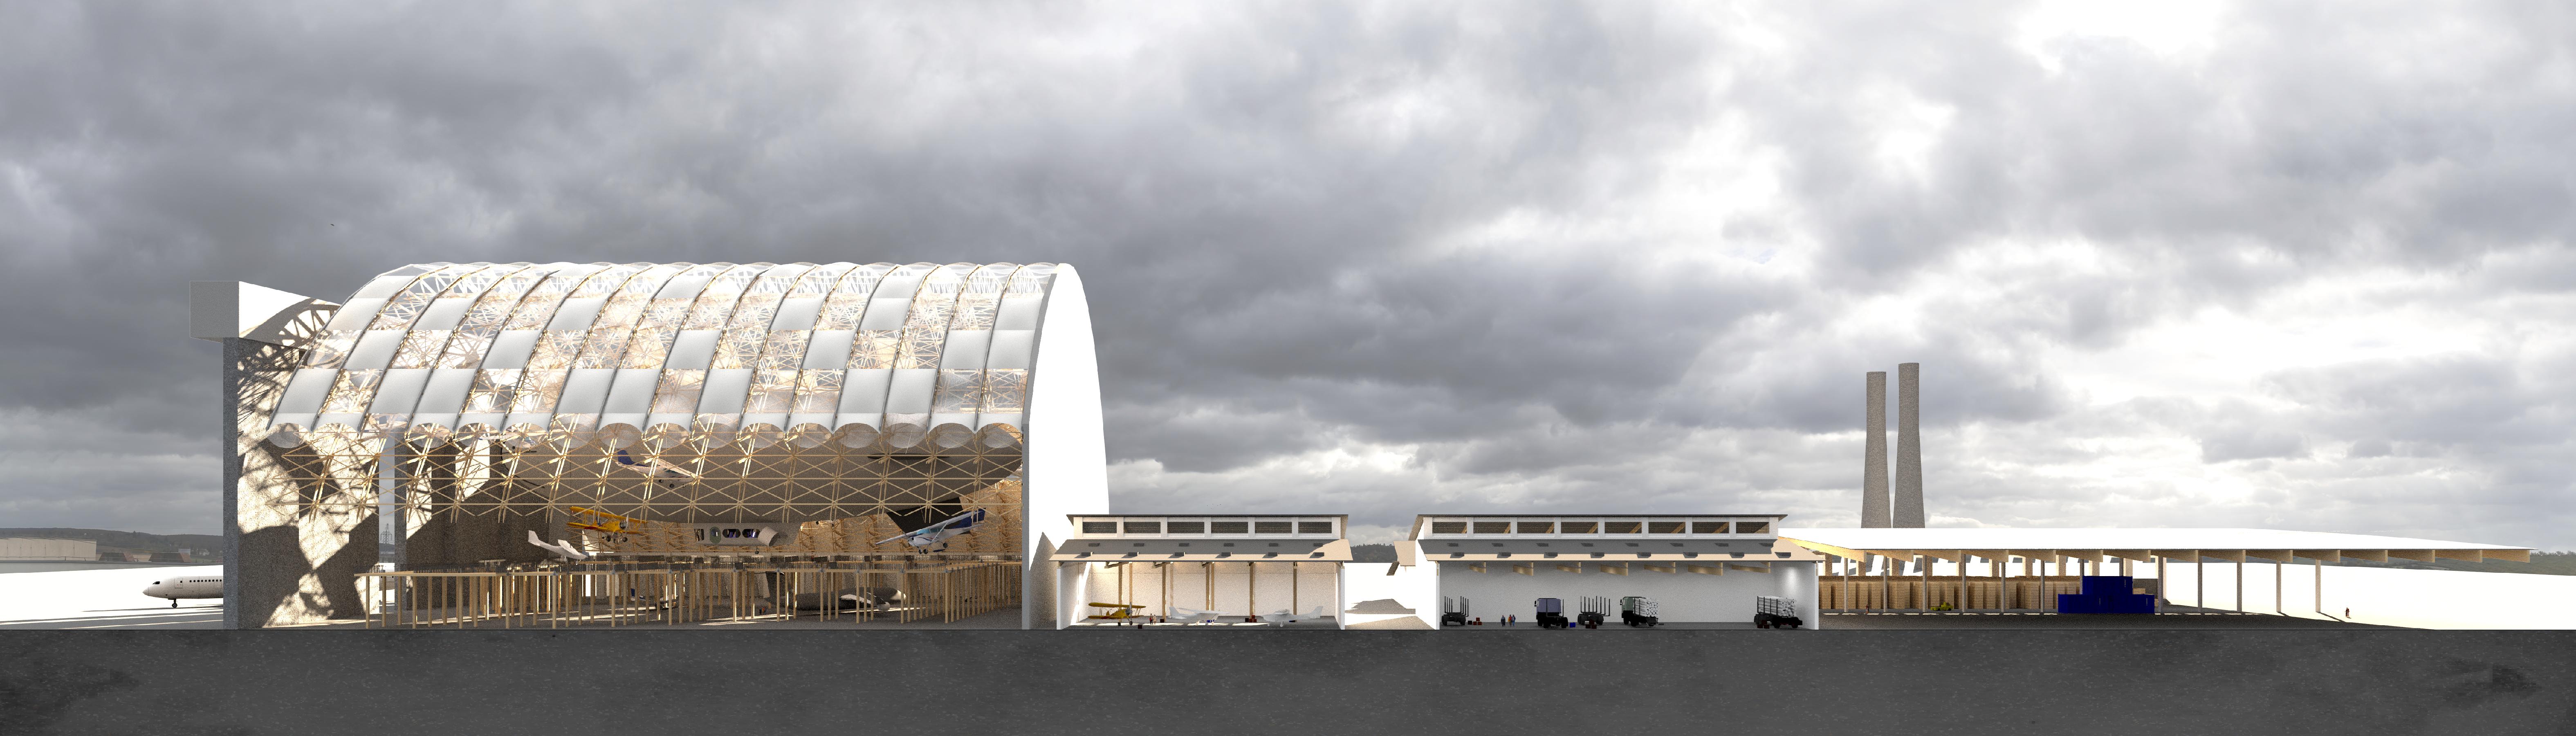
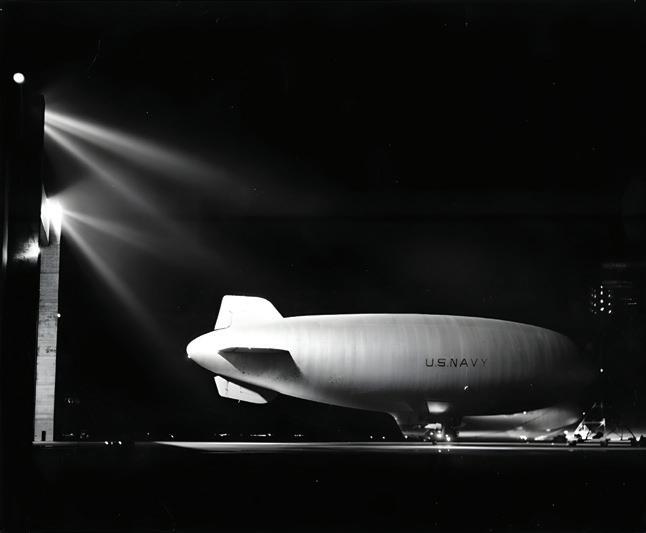
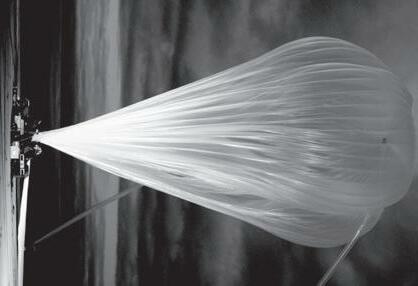
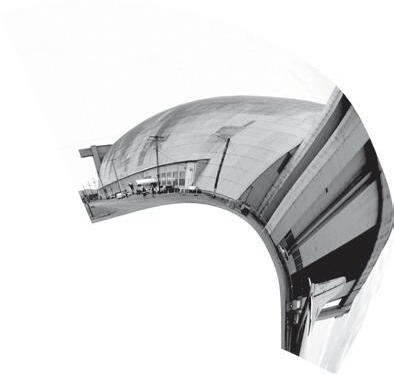
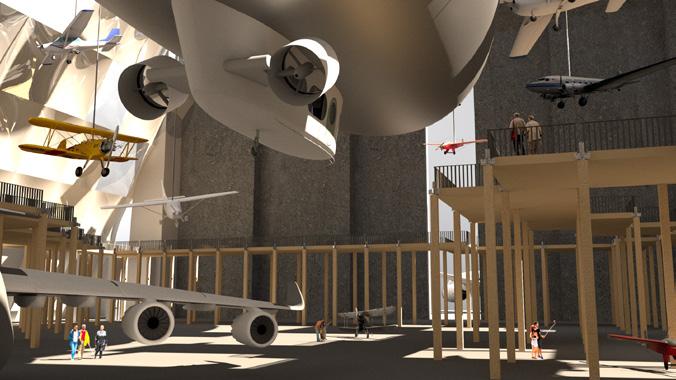
On the heels of decades of underutilization and mismanagement, this historic WWII blimp construction and storage hangar sits empty and rotting. After receiving a call to action from the town that inherited this structure from the US government, an RFP tasked architects and students with re-imagining and redefining the fate of this historic structure. While many attempts have been made to utilize the vertical space afforded to this timber tube, the support system has fallen into horrible disrepair over the last 30 years and is quickly losing stability and trust within the community.
This project attempts to utilize much of the existing structure but ultimately faces the harsh reality that much of the timber structure simply cannot be saved.
03


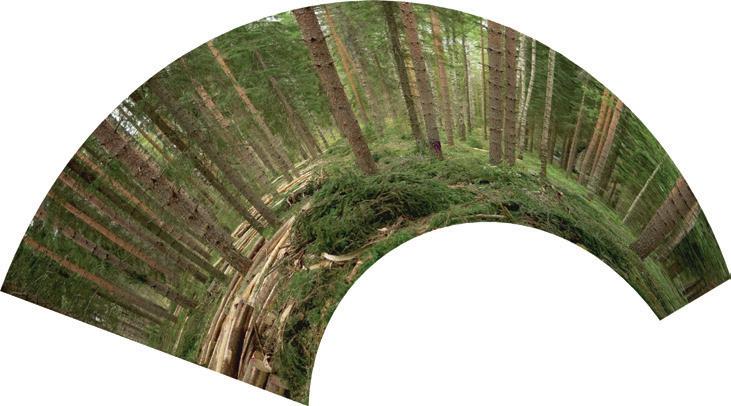
14 9 Population: 7.09e EARTH - 2022 Population: 5.44e EARTH - 1620 8 TIME AND SPACE Western Forests Dense Canopy Thin Canopy 1980-2003, 1,400,000 total fires USA WILDFIRES Deliberate Thinning Protecting what? | To prevent forest fires that can harm industry & development, we have created a system poised to deliver devastating catastrophes. USFS Research Stations 68 Research Stations, 7 Regional Offices, 3 Prospective Locations USA - 2022 Place Setting & Argument Building


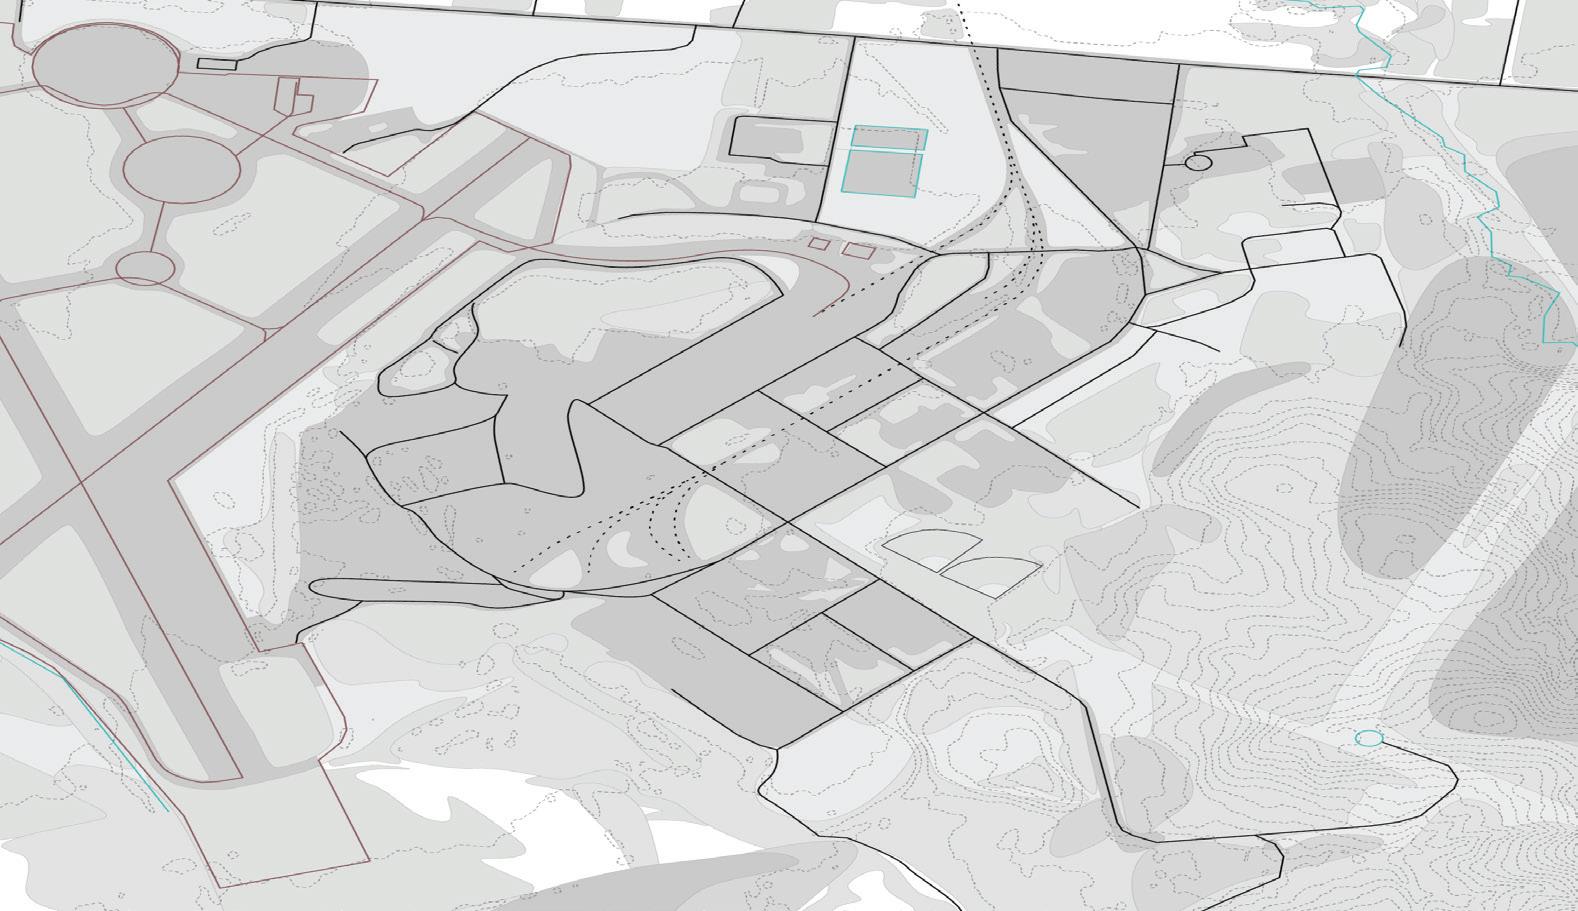

Statistic Visualization & Orientation Clatsop State Forest Santiam State Forest Tillamook State Forest Elliot State Forest Gilchrist State Forest Sun Pass State Forest Olympic Crater Lake Redwood National Parks: Oregon State Forests: Acreage: Visitor Center Tourism: Tillamook SF Tourism Split: Economic Output: Day Use Areas - A park, or an area of a park intended for daytime use exclusively. Designated Campsites - Campsites that are signed, numbered, and improved. Off-Highway Vehicle Trails - Dirt roads or trails for off-road motorized vehicles. Campgrounds - Improved and monitored campsites for family and ADA usage. 364,000 acres 3,245,806 persons 704,512 persons 504,722 persons 53,554 persons $38,800,000 (non-logging) $86,900,000 logging $262,000,000 $71,212,400 $31,071,000 922,650 acres 183,224 acres 138,999 acres Elk Creek | All-Year | 14 campsites Gales Creek | May-Sep | 19 campsites Jones Creek | May-Sep | 42 campsites Keenig Creek | All-Year | 12 campsites Morrison Eddy | All-Year | 6 campsites Nehalem Falls | May-Sep | 21 campsites Reehers Camp | May-Sep | 10 campsites Stagecoach Camp | May-Sep| 14 campsites Scar & Char: 2022 2000 1907: National Forest established by USFS 1507: Estimated Previous 1972: End of Planting 1949: Beginning of Planting Efforts 1973 Officially Tillamook State Forest 1951 Fourth Fire & Beginning of foreclosures 1945 Third Fire 1939 Second Fire 1933 First Fire 1948: Bond Narrowly Passes 355,000 acres 146,000 acres 127,000 acres 19,000 acres 364,000 acres ? State Scale Public/Private Timber Research: City Scale Centralization of Industrial Tech: Site Scale Self-Powered Emergency Hub: Tillamook State Forest Privately Owned Forest Forestry Service Outposts Timber Related Drone Industry • Centralized Mills • Carbon Offset • Localized Power • Disaster Management • Subsidized Energy N N Port of Tillamook Bay Not To Scale
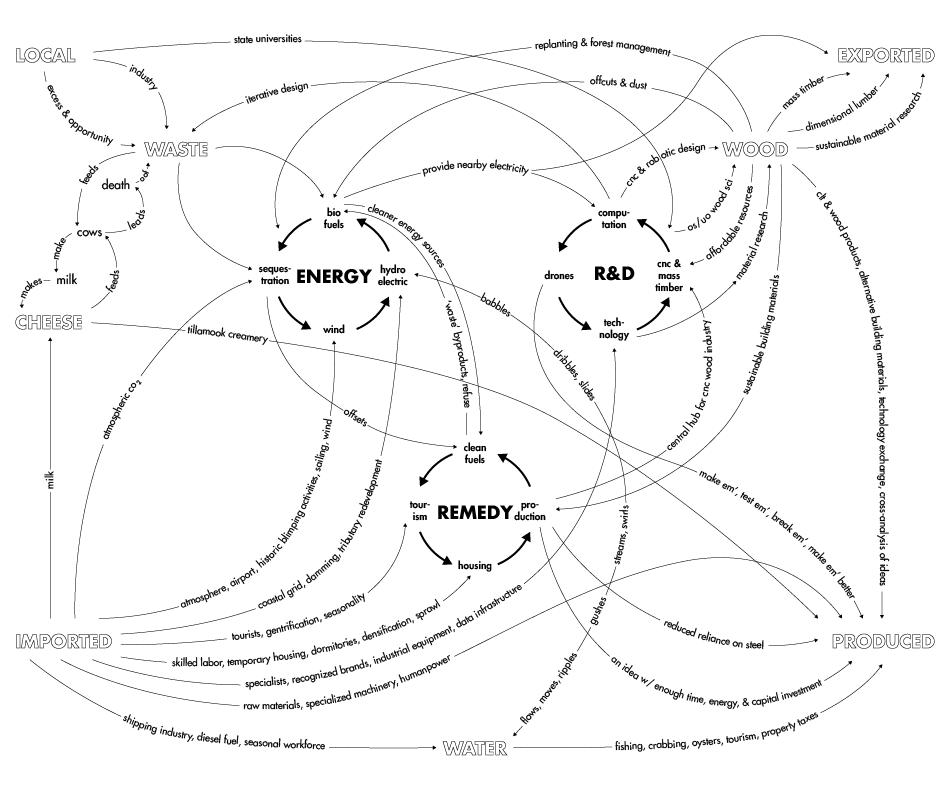


GEOLOGICHISTORY ECOLOGIC FORMING COEXISTENTNURTURING COLONIZATION CITY-BUILDING WARINFRASTRUCTURE UNCERTAINFUTURE PRIVATE INDUSTRYINVESTMEN T AIR MUSEUMFOUNDING POSTWARDISASTERS Flow Visualization & Connections

Bay=2000f³lumber Remove36bays&waste Loweststoreyscurrentlyinuse 36’cubeofmaterial Center for Smart Silviculture Simplified Flexible Storage Consolidated and Re-imagined Land & Air Museum Expanded and Upgraded Digester & Power Generation Reinforce Industrial Circulation Create Centralized Industrial Area Create Centralized Drone Testing & Proving Ground Consolidate and Reinvest in Port of Tillamook Bay Infrastructure Space Organization & Scaling Produced with assistance from Chase Moore
This project primarily focuses on reusing the existing structural, circulatory, and historical facilities afforded to the town of Tillamook, Oregon after purchasing rights to the Port of Tillamook Bay from the U.S. Government. Originally designed and used as an airship manufacturing and storage center during WWII, this space is easily adaptable to the various aerospace needs of private and governmental bodies currently expanding their work in the Pacific Northwest.
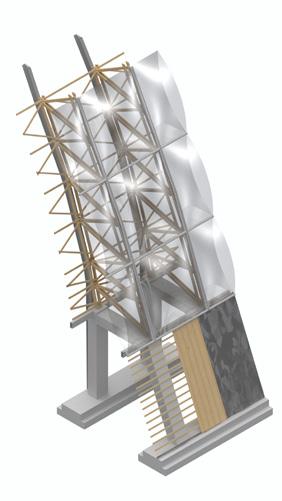


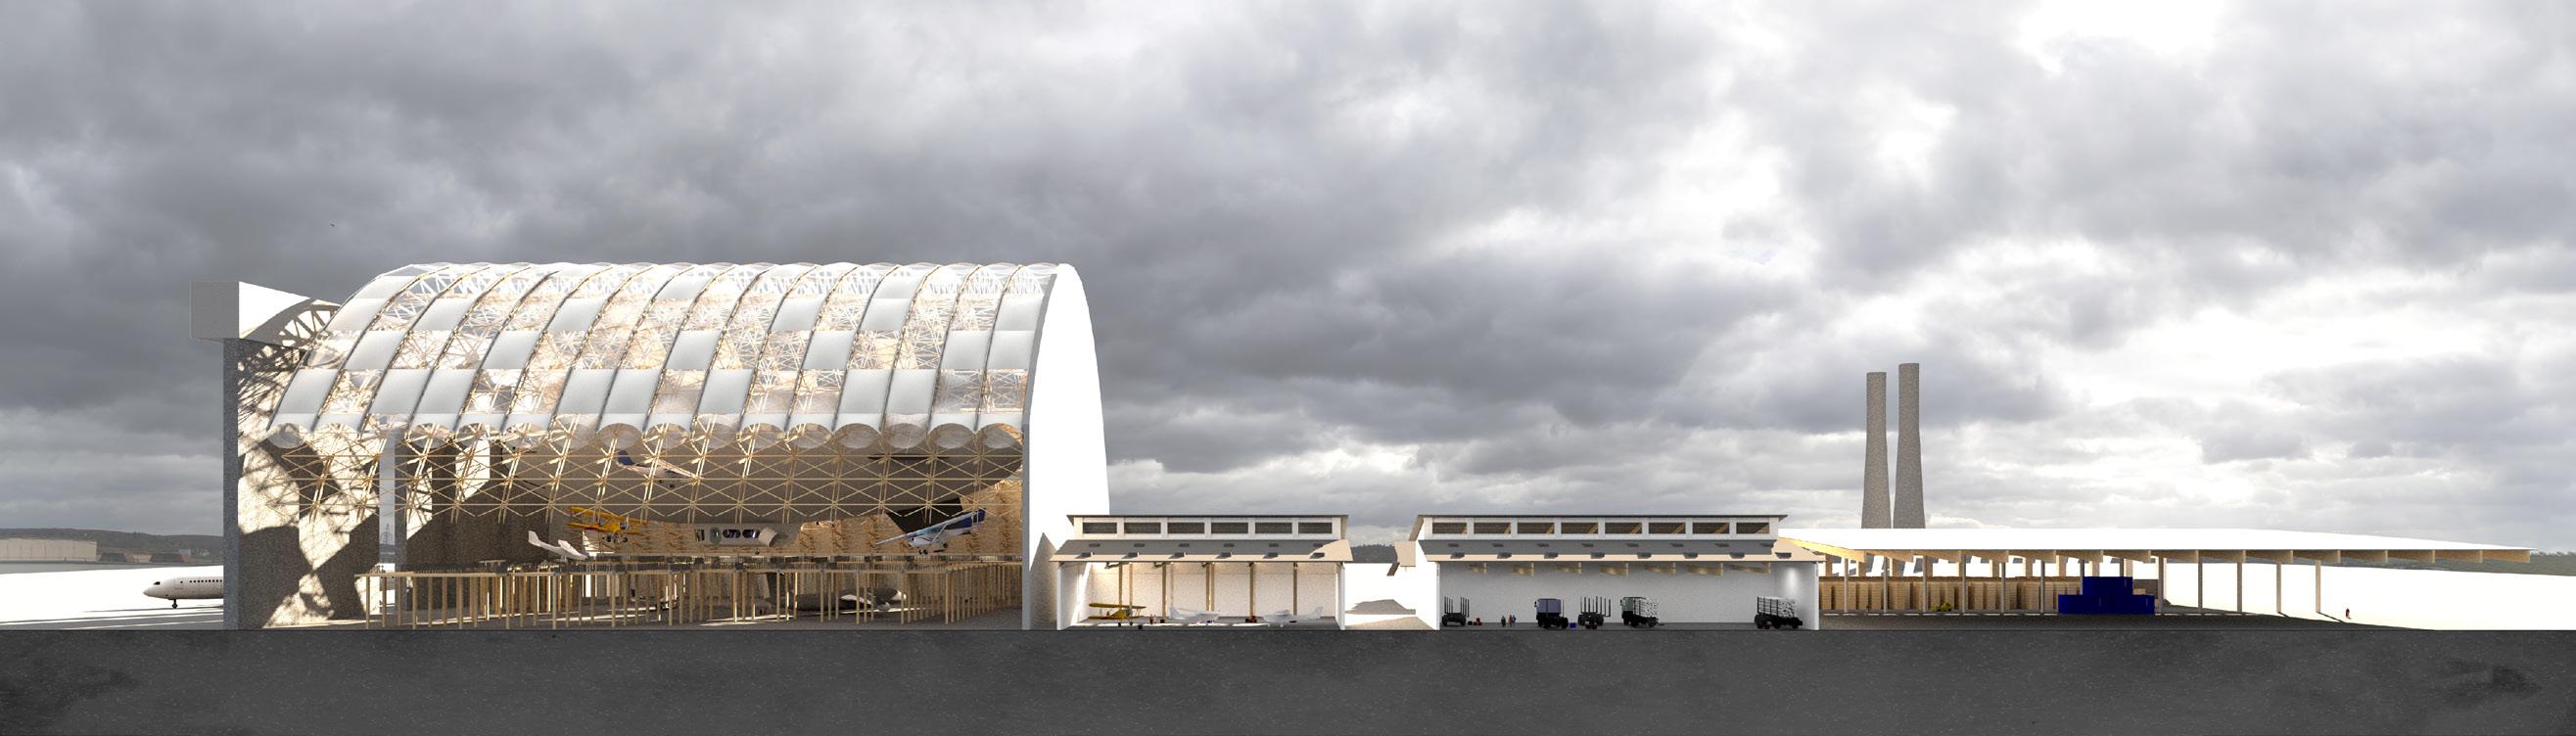
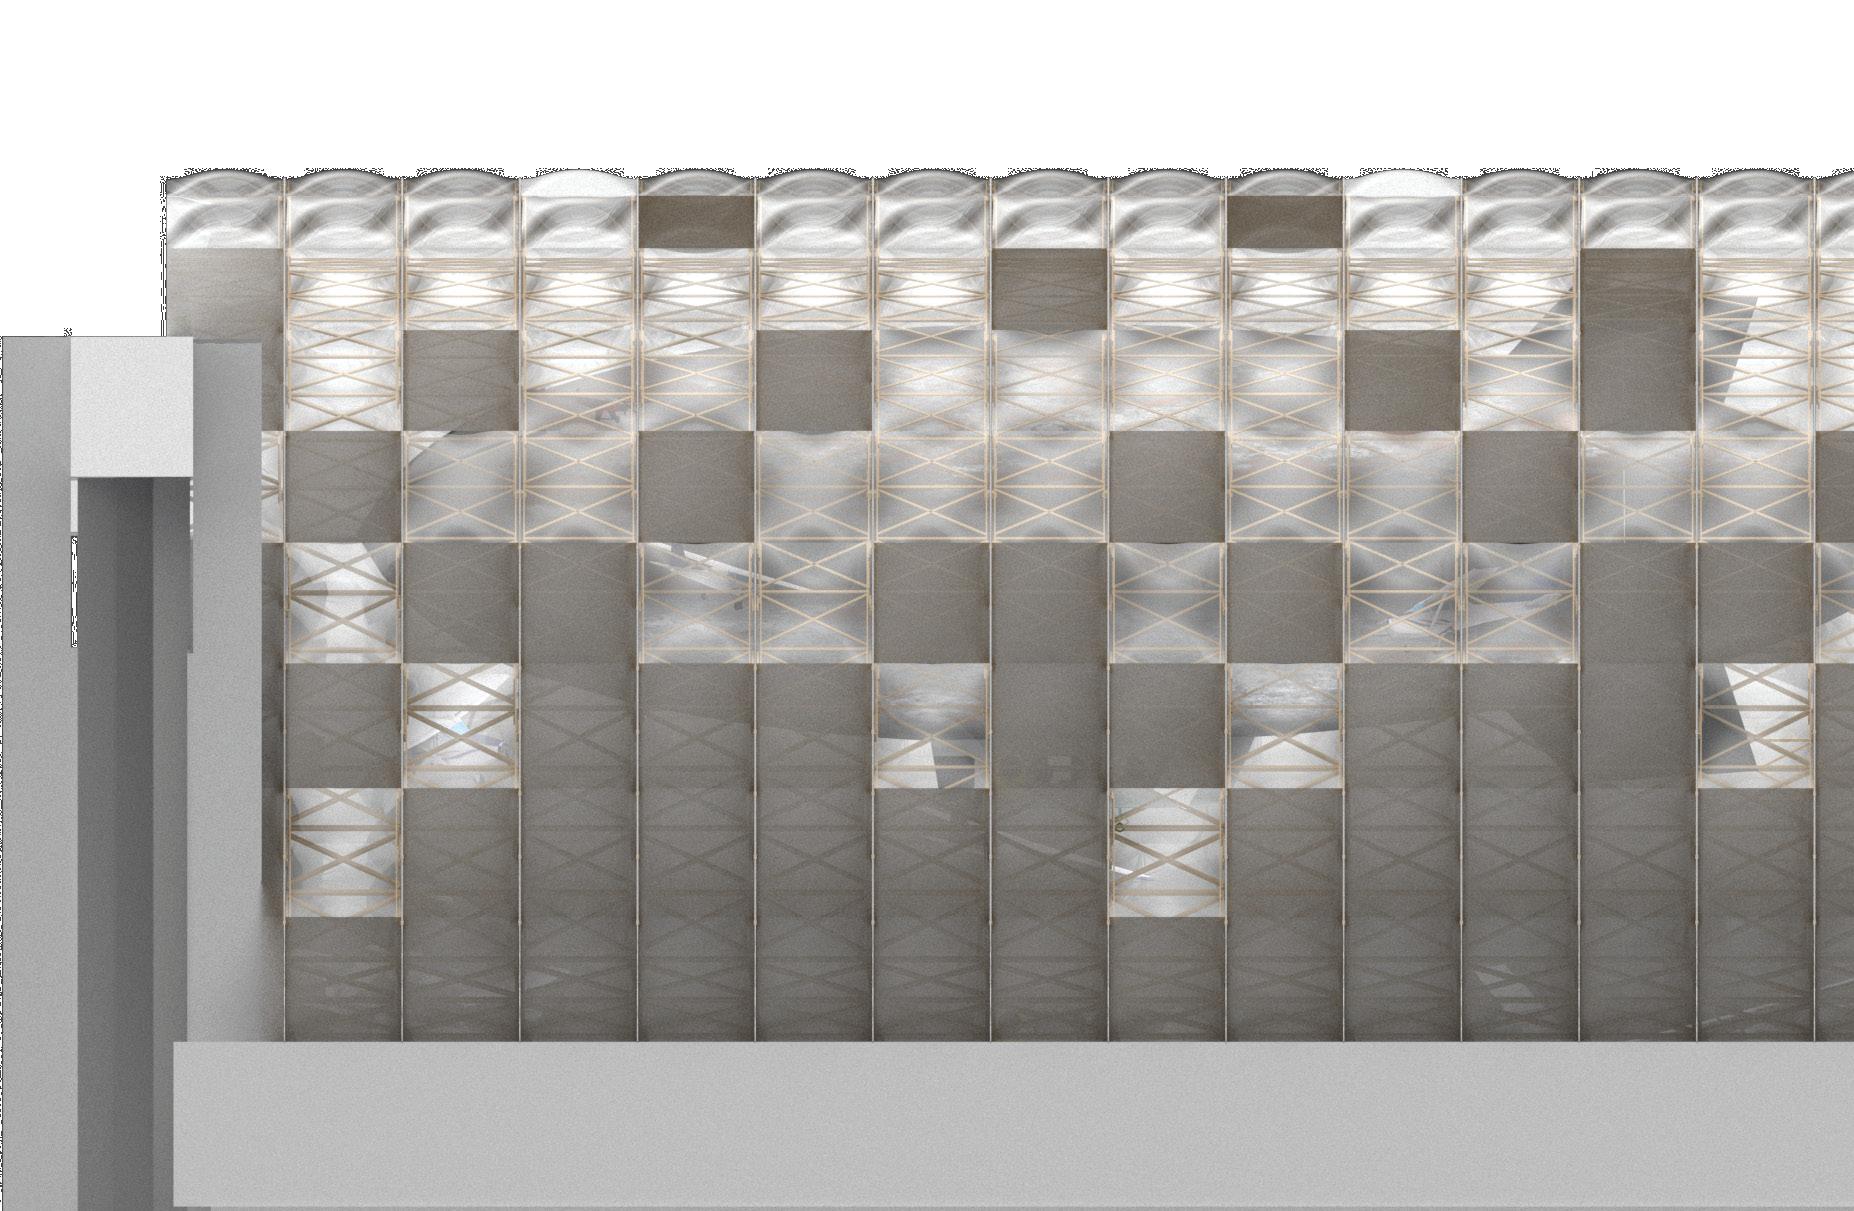
18 N/S Section greenhouses emergy energy investment 33’8” 24’4” Steel Reinforcement ETFE Bladders Extruded Aluminum Channel Existing & Repaired Structure Reinforced Connections Reused Infrastructure Weatherproof Cladding Replaced Underlayment Replaced Support Existing Footprint
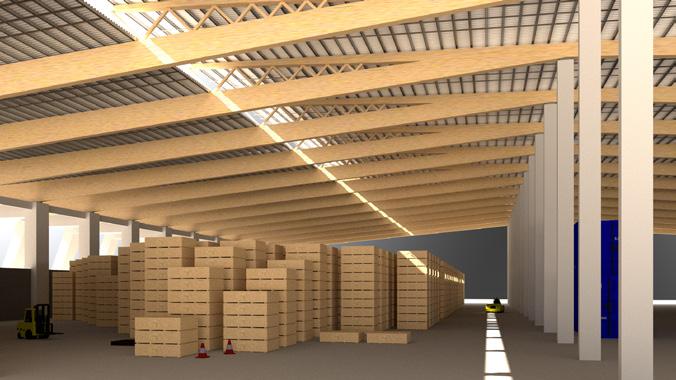
Space Utilization & Forming
Although this site has many things going for it, there are lots of efficiency concerns related to the use of space within the historic structures. One of the main issues is finding use for the tens of thousands of vertical cubic feet within the surviving Hangar ‘B’ on the property... While many companies have attempted to use this space, it has fallen into disrepair as the current tenants have slowly opted into building their own covered storage in nearby plots of land.
Simple Paths
Middle Ground

Vertical Vantage: Complex Walkways
19
Structural Expression & Rationale
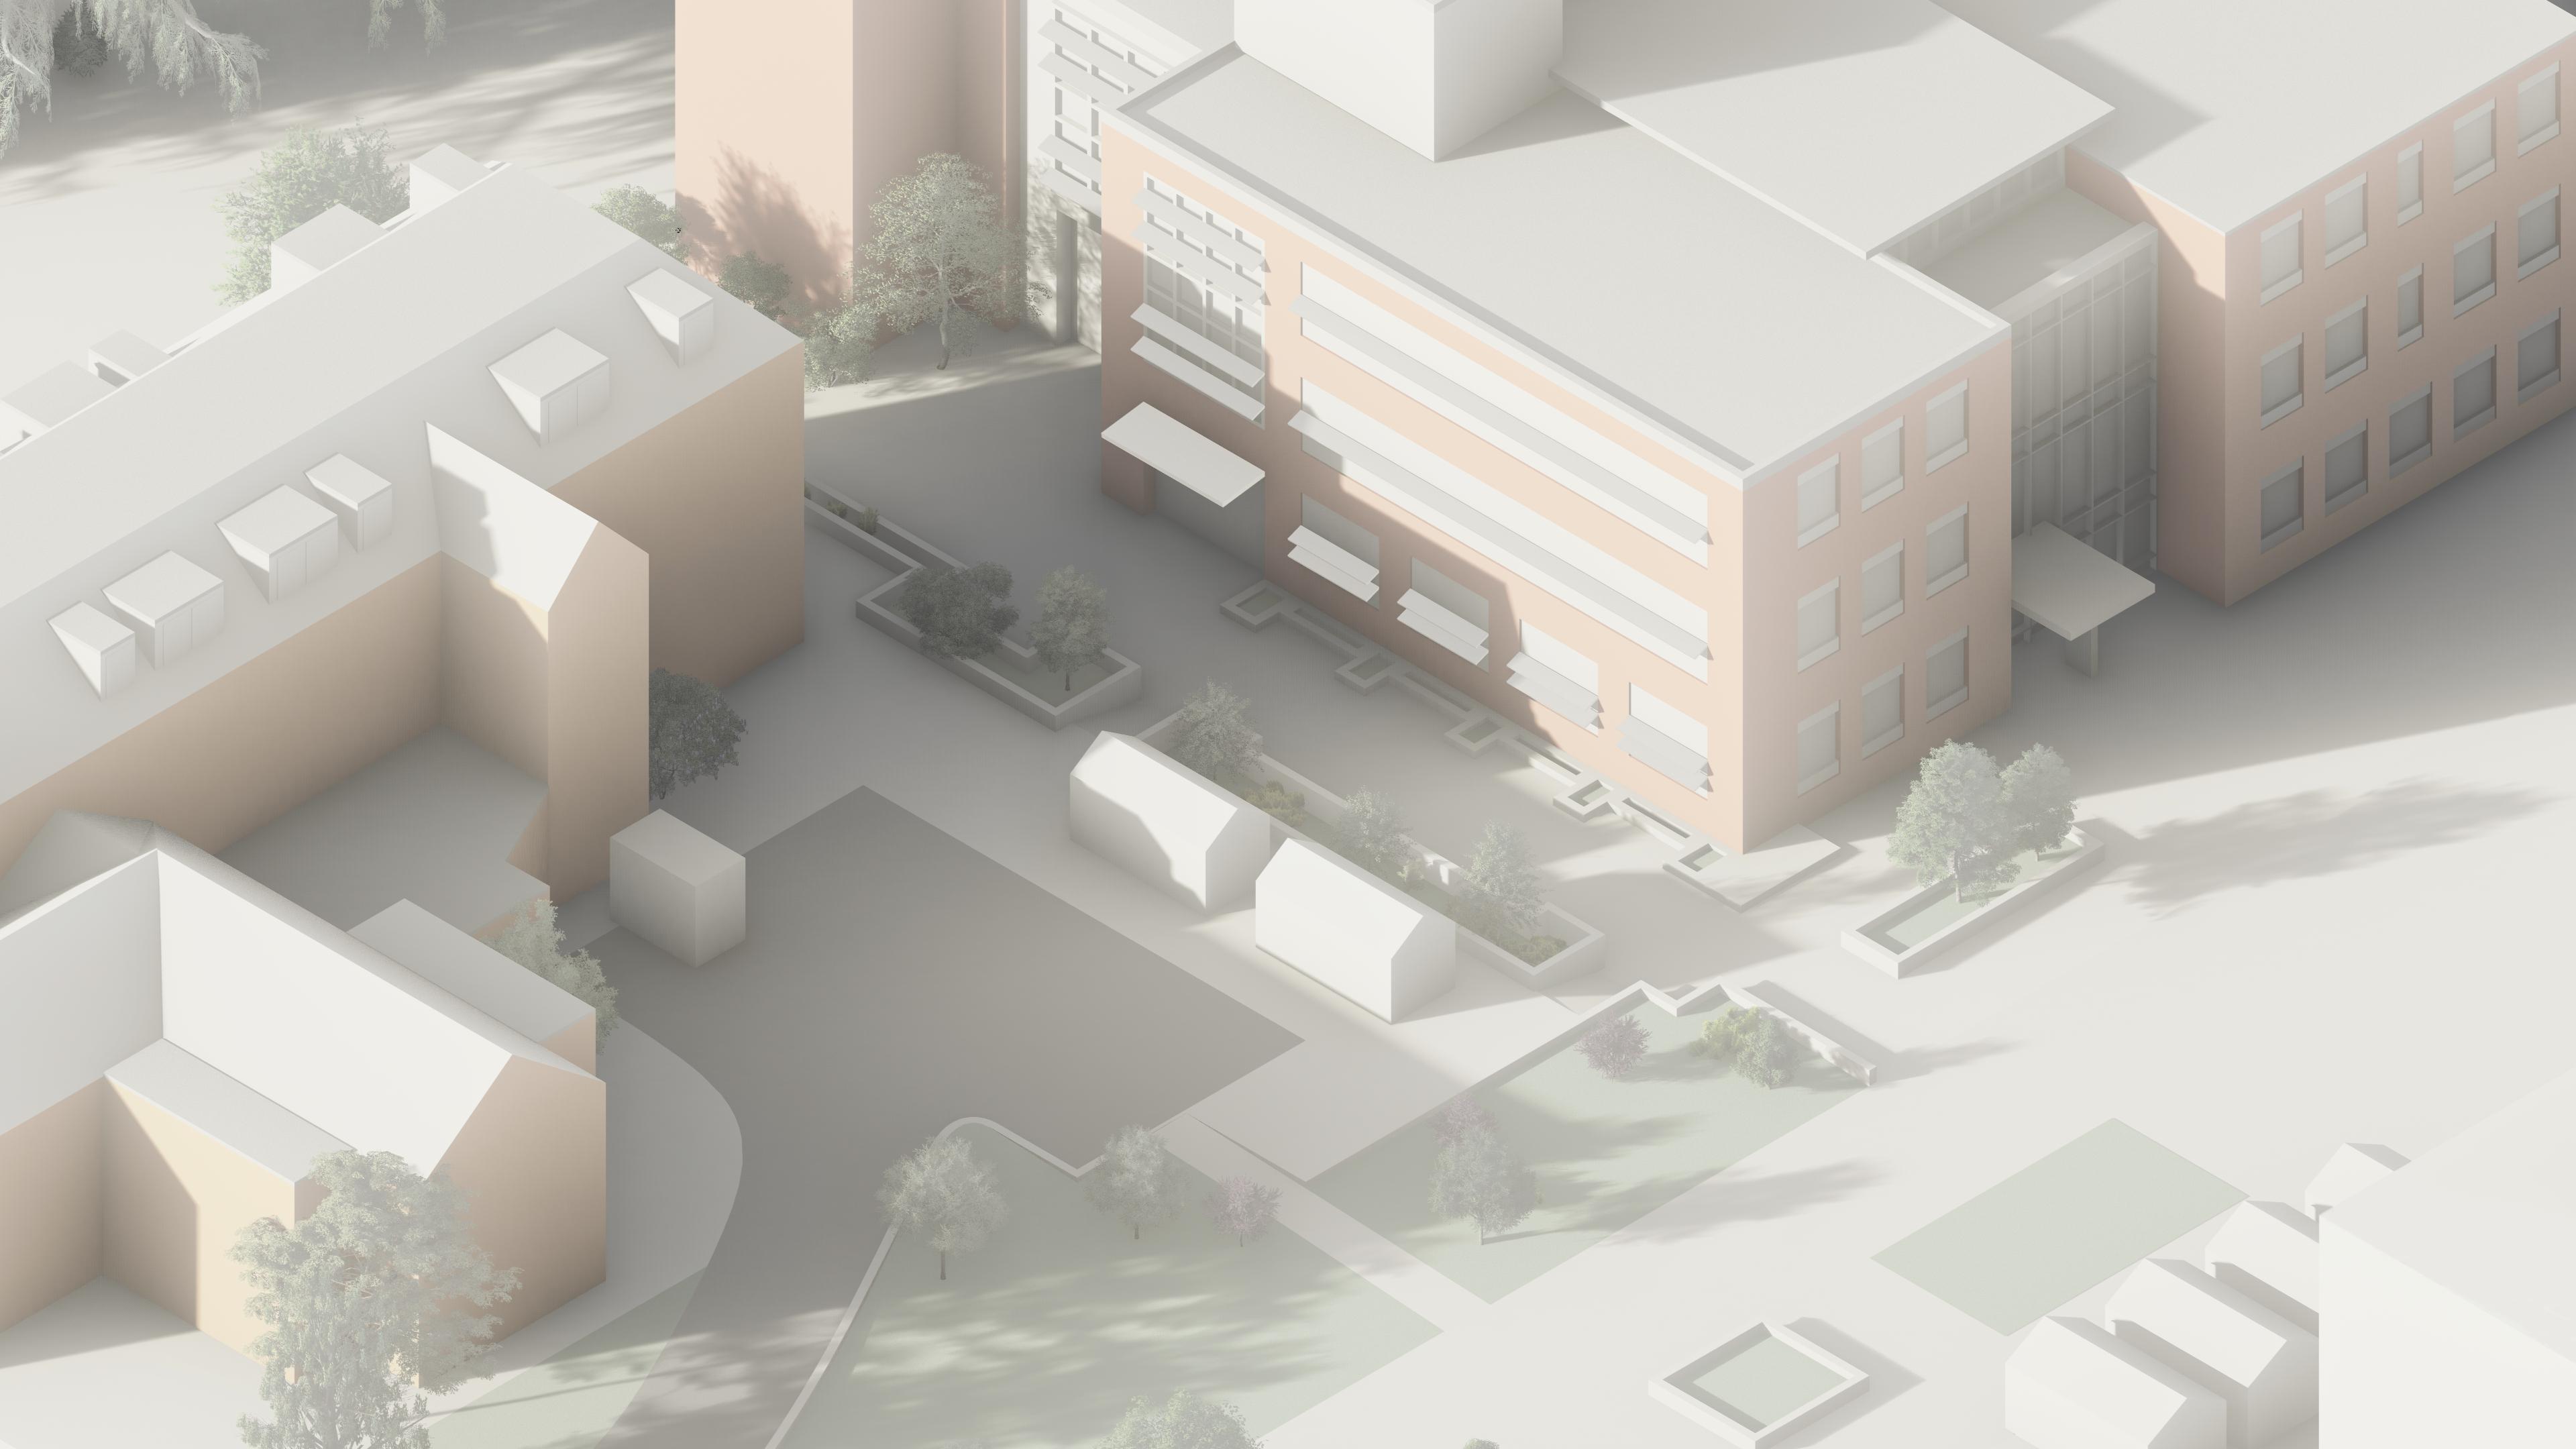
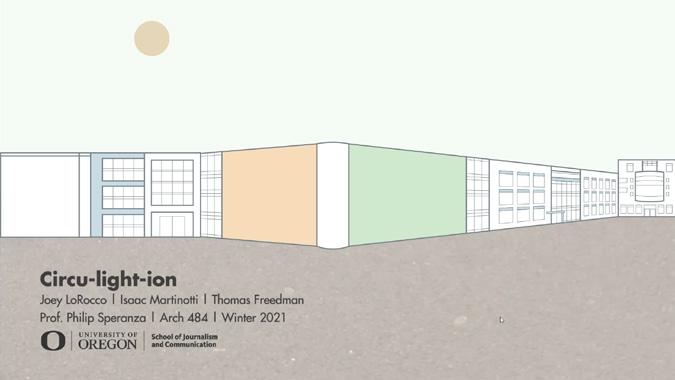
Fine Grained Historic Campus Addition 10 Weeks
Location | Eugene, Oregon, USA
Instructor | Prof. Philip Speranza
Client | Dean Juan-Carlos Molleda, School of Journalism
Fourth Year Studio | Winter 2021
Partner | Joey LoRocco
General design studio focusing on the professional relationship between architect and client. Throughout the term we were able to interview and receive critique from professional staff at the University of Oregon campus planning offices, the Dean of the School of Journalism and Communications, and the campus architects.
The focus of the term was on defining metrics to design within, capturing and visualizing data around human use, and generating video explanations of our ideas.
Personal Contribution:
All Rhino and Grasshopper modeling and analysis. Produced brep models, renderings, animations, and some line drawings.
04
To better understand the existing fauna around the site, an effort was made to parse local arboretum data.
This data was coupled with transparency measurements to pick local species based on how much light they block during specific seasons.
Coziness
Dogwood 20% AprOct 20-35’ 15-20’
Redbud 35% MayNov 20-30’ 25-35’
Coziness Index
Pin Oak 60% AprNov 60-70’ 25-40’
Research lead to identifying ‘coziness’ as one of the more desirable traits for students looking for study and learning spaces. Due to this, an matrix was created using metrics of openness, clarity, and coverage to define existing places of ‘coziness’ on the site. This map was utilized when designing outdoor rooms.
Paper Birch 35% AprOct 50-70’ 35’
Sitka Spruce 45% Evergreen 70’+ 50’+
American Elm 30% AprNov 60-80’ 30-40’
Douglas Fir 25% Evergreen 40-70’ 15’
Ownership
Red Oak 20% MayOct 60-75’ 45’
Spatial Ownership Index
The University of Oregon campus has slowly removed private motor vehicles from many major pedestrian byways. Unfortunately, due to fire codes and campus utilities, many of these roads continue to host other vehicles for special circumstances. This map was created to understand places where intervention is desired to separate the two contrasting traffic patterns.
Common Name Light Penetration Leaf Coverage Average Height Canopy Diameter
EMU Allen Hall Lawrence Schnitzer Art Friendly 100’ 400’ Open Enclosed Clear Covered Canopy Treeless
N 2ft 10ft Pedestrian Vehicle Linear Divergent N EMU Allen Hall Lawrence Schnitzer Art Friendly 100’
400’
Data Collection & Spatialization
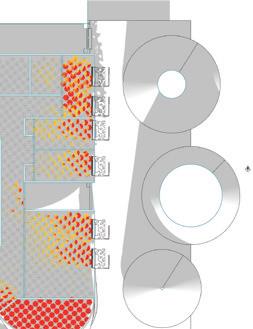
Site Isometric & Categorized Light
Living in a dark climate, light was a major focus of this study. One of the first objectives was to find and categorize existing types of light and shadow found around the site.


Proposed Workflow
Design Inputs


Design Outputs

23 Lawrence
5 4 3 2 1
Hall
Time Rainfall Decibel Attention Clock Historic Weather Microphone / App Precedent Study Data Inputs Computation
As with most generative workflows, the first stop was understanding the data needed to reach the intended outputs.
flex
Data Collection & Spatialization
Architectural
local rainfall existing canopy circulation paths acoustic supression refuge / prospect scholastic requirements solar control rain water capture nearby vegetation sunlight wind public seating entrances pathing
spaces planting zones fenestration animated architecture canopy surrounding structures


24 Lighting Spatial Needs:
Spaces Flex Spaces Vers Spaces parts adapted from: william franklin, betty lou poston, rachel rimmer Circulation Circulation Glow Direct Incidental Scattered Diffuse Circu-light-ion Final Presentation 9:14 4" Batt Insulation Silicone Sealant w/ Backer Rod EFCO Structural Corner Spec. Mutual Materials Norman Brick Cascadia 300 Series Inward Swing Window Mutual Materials Norman Return Brick Scale 3" - 1'0" Jamb Detail Tooled Concave Mortar Joint 3" Rockwool Cavity Insulation 1/2" Type X Gypsum Panel Air/Water/Vapor Barrier Membrane 6" Steel Double-Stud Wall Steel Angle Bracket Air Gap 5/8" DensGlass 4" Batt Insulation Silicone Sealant w/ Backer Rod EFCO Structural Corner Spec. Mutual Materials Norman Brick Cascadia 300 Series Inward Swing Window Mutual Materials Norman Return Brick Scale 3" - 1'0" Jamb Detail Tooled Concave Mortar Joint 3" Rockwool Cavity Insulation 1/2" Type X Gypsum Panel Air/Water/Vapor Barrier Membrane 6" Steel Double-Stud Wall Steel Angle Bracket Air Gap 5/8" DensGlass 4" Batt Insulation NBK Terrart Large Panel 5/8" DensGlass Air/Water/Vapor Barrier Membrane 3" Rockwool Cavity Insulation Custom Terracotta Baguette Fin Scale 3" 1'0" Sill Detail Attachment Clip Cascadia 300 Series Inward Swing Window Continuous Horizontal Carrier Track Wall Bracket 1/2" Type X Gypsum Panel Custom Sheet Metal Drip Edge Light & Structure
Edge
william franklin, rimmer


25 Unnecessary Neutral Desired Basement First Floor Second Floor Third Floor Rooftop Lighting Requirements:
Filtration Circulation Shadow Social Circulation Sit Natural Sunlight Shadow Air/Water/Vapor Barrier Membrane Steel Mass Timber Connection 3" Concrete Interior Topping Courrugated Steel Floor Decking 5-ply CLT Floor Beam 6" Steel Stud Wall Interior Grade Wood Sill Finish Custom Terracotta Baguette Fin Scale 1-1/2" 1'0" Partial Section at Center Bay 3" Rockwool Cavity Insulation 5/8" DensGlass 1/2" Type X Gypsum Panel NBK Terrart Large Panel Cascadia 300 Series Inward Swing Window Continuous Horizontal Carrier Track Wall Bracket Attachment Clip Custom Sheet Metal Drip Edge 10x18 Glulam Column 1/2" Type X Gypsum Panel 6" Steel Double-Stud Wall 4" Batt Insulation 5/8" DensGlass Silicone Sealant w/ Backer Rod Tooled Concave Mortar Joint Joint Reinforcing Scale 1-1/2" - 1'0" Plan Detail at Infill Wall Adjustable Veneer Anchor Mutual Materials Norman Brick Mutual Materials Norman Return Brick NBK Zinc Clip Alum. Extruded Carrier Track 40mm NBK Terrart Large Panel 3" Rockwool Cavity Insulation Cascadia 300 Series Inward Swing Window 10x18 Glulam Column Steel Mass Timber Connection 7-ply CLT Pier Air/Water/Vapor Barrier Membrane Structure & Organization
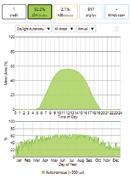
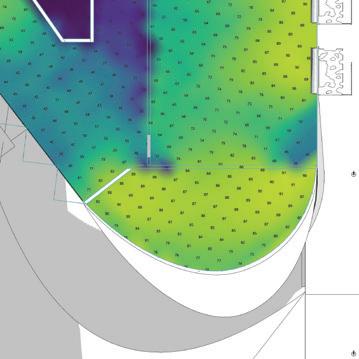
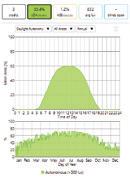
The east zone of the expansion has a mix of high glare and small apertures. This intervention adds larger windows with more dramatic exterior screens to break up light. New frosted window areas in the interior walls allow daylight in deeper. The above diagram shows a decrease in average lux from 1609 to 1433 and an increase in spread with intense direct illumination.
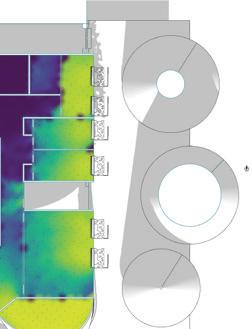

The southern tip of the expansion’s 2nd floor is a conference room that averages approximately 8000 lux and spikes to 10,000. Horizontal fins were added across the panoramic window, and the glazing assembly was replaced with a lower visual transmittance glass (as was originally planned for the space.) This reduces the average lux of the space to 1800 and the overall ASE to only 2.1%.
Spatial daylight autonomy of the entire space increased from the unmodified value of 44.3% to 55.9%, showing a dramatic percentage increase for the east facade area. The sDA could easily be increased by allowing more light into the space but would likely also decrease the atmospheric quality of the individual spaces.


As this space originally had a more-than-acceptable sDA, the main change was to enlarge the doorway to a double-wide entrance. A long window was added to the long wall in an attempt to share more light with the GE workspaces next-door, but the main goal was to decrease transmittance while preserving the panoramic view.
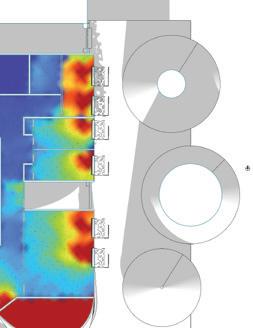
Glare in the eastern offices and lounges can still get intense at times due to this increased glazing. Thankfully, most of the periods where views contain the most dramatic levels of ‘Disturbing Glare’ are during summer months; As this expansion is mainly classroom and student spaces it will be at reduced occupancy, and likely requires adjustable shading for dynamic classroom functions.
Unsurprisingly, glare is still an issue. Although this change helped to remedy light bouncing off interior surfaces to prevent glare from all directions, looking at the window still produces unfortunate results. Thankfully, since this is going to be in the post-covid world people would likely be zooming from their desks so they can keep their cameras off and play solitaire in the background.
26
Intervention 2 - South Zone Intervention 1 - East Zone
Tree Tree Tree
Tree
Tree Tree Tree + +
Tree Tree Light Simulation & Reduction
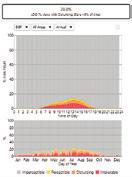
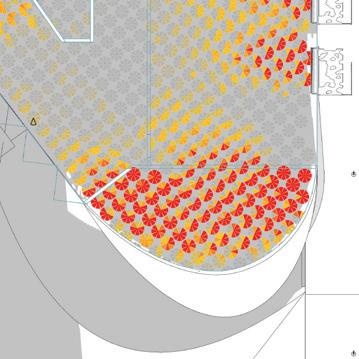
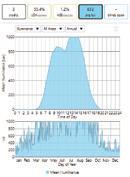
As the west zone is a circulation space on all floors, a higher amount of glare and solar exposure can likely be expected / accepted. Despite this, it seems as through the space still receives a larger amount of late afternoon sun than would be wanted. To the north, an early design error was corrected by adding glazed surfaces to the northern offices.
The average lux for the entire second floor was halved from 1609 to a final value of 832. Although removing light from the interior space wasn’t the main goal of this exercise, it became clear that the unevenness of the light was undesired. The mix of apertures chosen for this combination diffuse the light much better into the space from all sides.
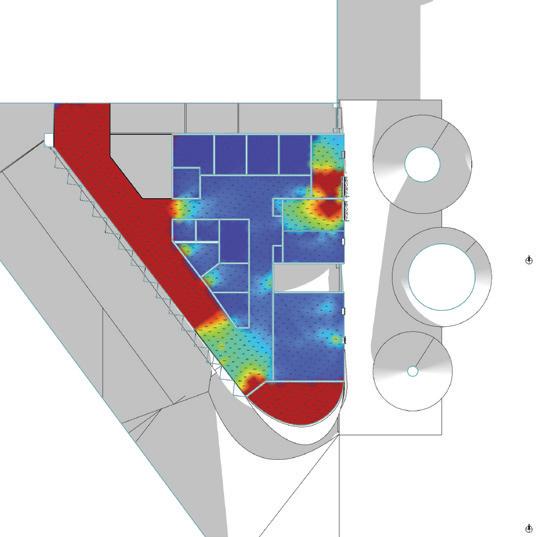
Densifying the screen on the western facade allows less light into the hallway, but doesn’t appreciably change how deep it penetrates into the structure. This has the added benefit of removing the small Annual Sunlight Exposure (>1000lux @ 250h) zone at the northern end of the hallway leaving the final ASE value at 1.2%.
Although the sDA of the original space was at an acceptable 44.3%, getting direct exposure down while still increasing the overall sDA to 55.4% is definitely an improvement. Rooms that were once doomed to purely electric light have been opened up to fit the intent of the structure - showing the organic passage of time inside.
Glare continues to be highest during the summer months and looking directly out the screened window. This seems acceptable for a circulation space, and shares many similarities with the southern conference room. Maybe it will make people will walk faster between classes?
Although glare can be annoying, it can usually be relatively well controlled through user-controlled shades and occasionally even desired. The overall percentage of views with ‘disturbing’ glare >5% dropped from 30.8% to 7.3% so arguably if it’s bothering someone they can move to a different spot or wait it out.
27
+ + + + + = Light Simulation & Maximization
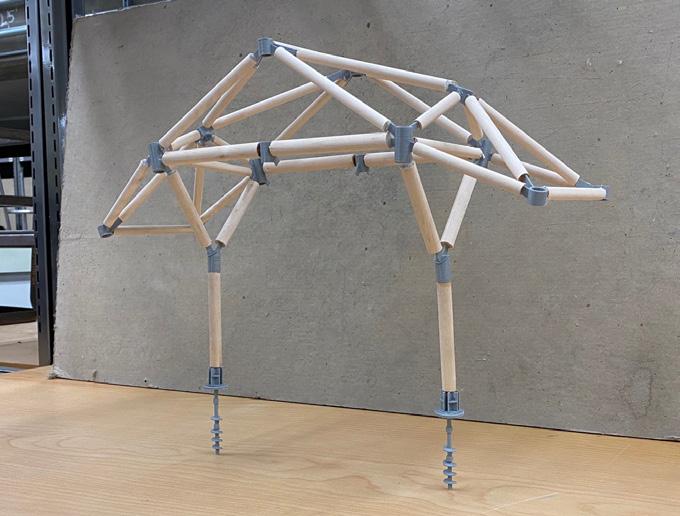
Theseus’ Village
Modular Jump-start Housing 10 Weeks
Location | Eugene, Oregon, USA
Riggio Partner | Paul Turner
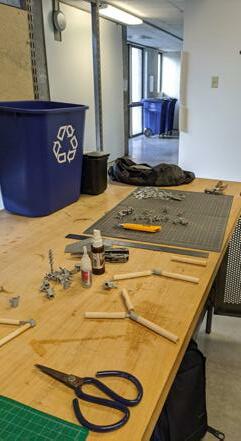
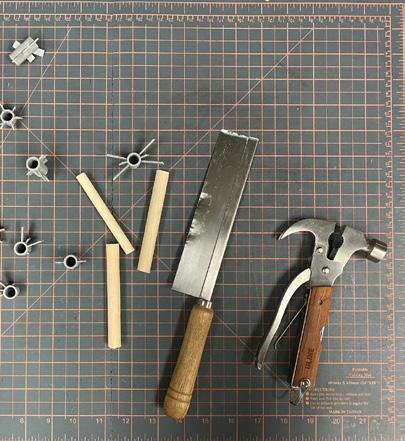
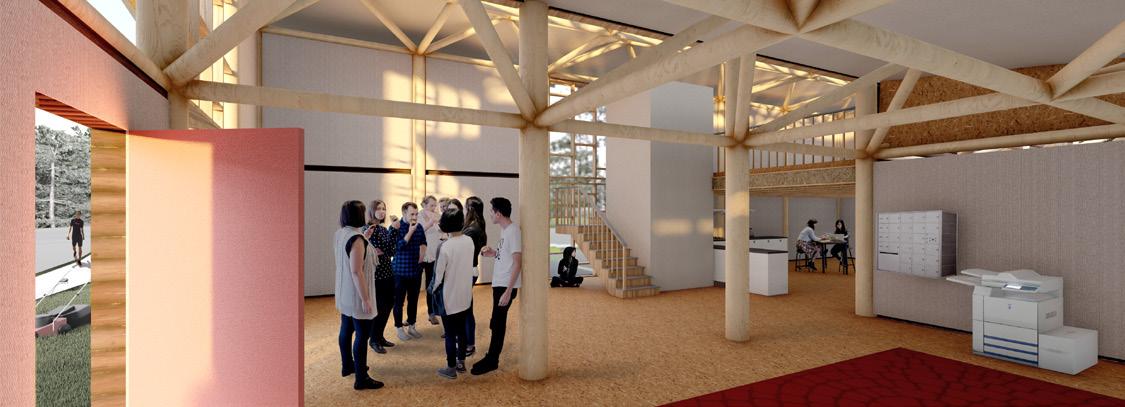
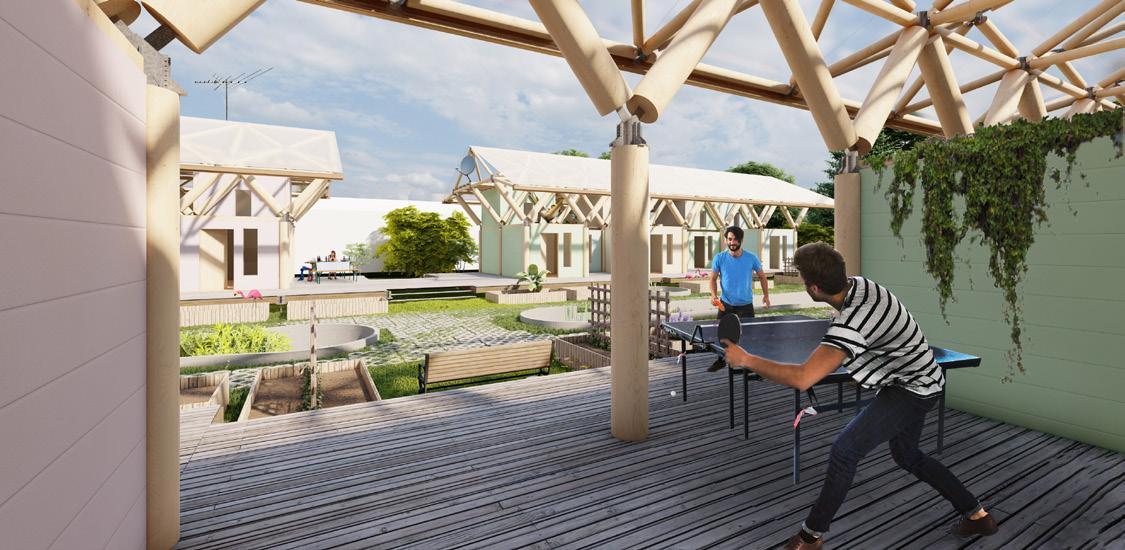
The intention of Theseus’ Village is to develop a modular structural system which utilizes Ponderosa Pine timber poles. Round-wood timber products are in their most structural and natural form, complimenting the hollow steel connections that complete our kit of parts. A driving concept was constructing a primary structure which allows for simple, tenant-built units that foster the idea of participatory architecture. A community of individuals, brought together through uncontrollable circumstances, can come together and build their collective future.

Personal Contribution:
All Rhino and Grasshopper modeling and analysis. Produced brep models, renderings, animations, and some line drawings.
05
Instructor | Prof. Nancy Cheng & Dr. Mariapaola
Fourth Year Studio | Fall 2020
Week 1-2
Initial form finding and experimentation.
Week 2-4
Horseshoe site organization develops and centralized shared space emerges.

Week 5-7
Monolithic development splits into discrete sections and intended deployment switches to a phased system.
Week 7-9
Unifying structural system begins to form, connections and materiality is explored.

30 1 2
x29 x13 x30 x30 x120 x13 xMANY xSEVERAL xA FEW x2+
SHELTER
Parametric Development
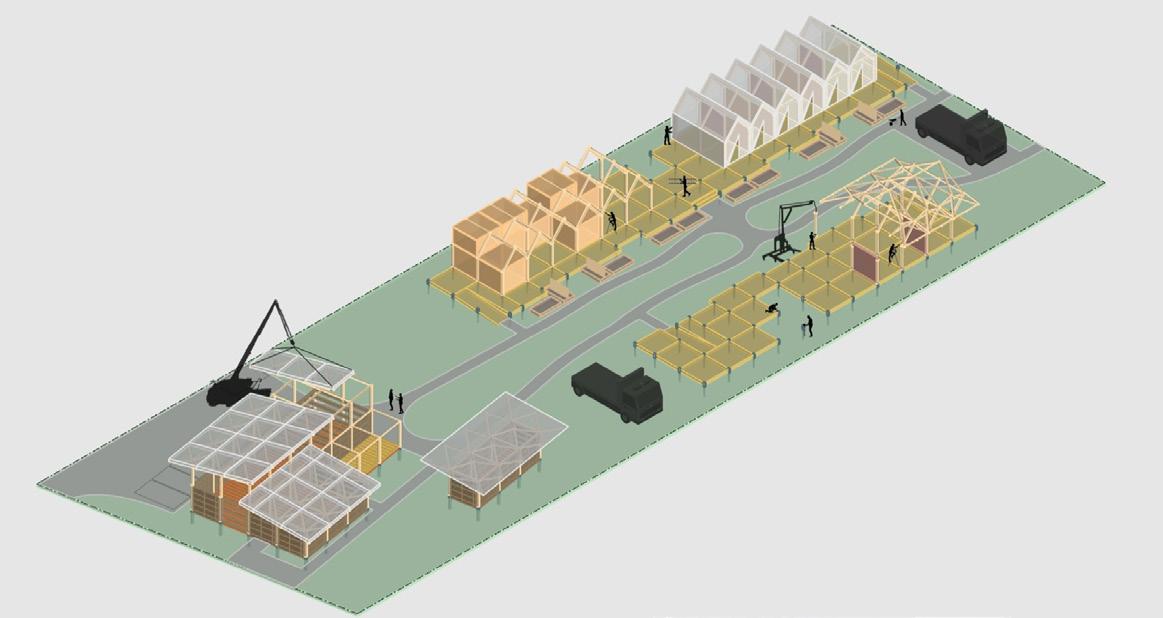
31 3 5 7 9 8 6 4 borate solution x1 x1 x1 x30 x30 1. 3. 8. 7. 6. 2. 4. 5. Layout & Phasing 1 - Screw Pile Deck 2 - Rapid Assembly Units 3 - Permanent Canopy Enclosure 4 - Mid-Canopy Units 5 - Community Center 6 - Shared Facilities 7 - Completed Unit Structures 8 - Extra Facilities Phasing Order:

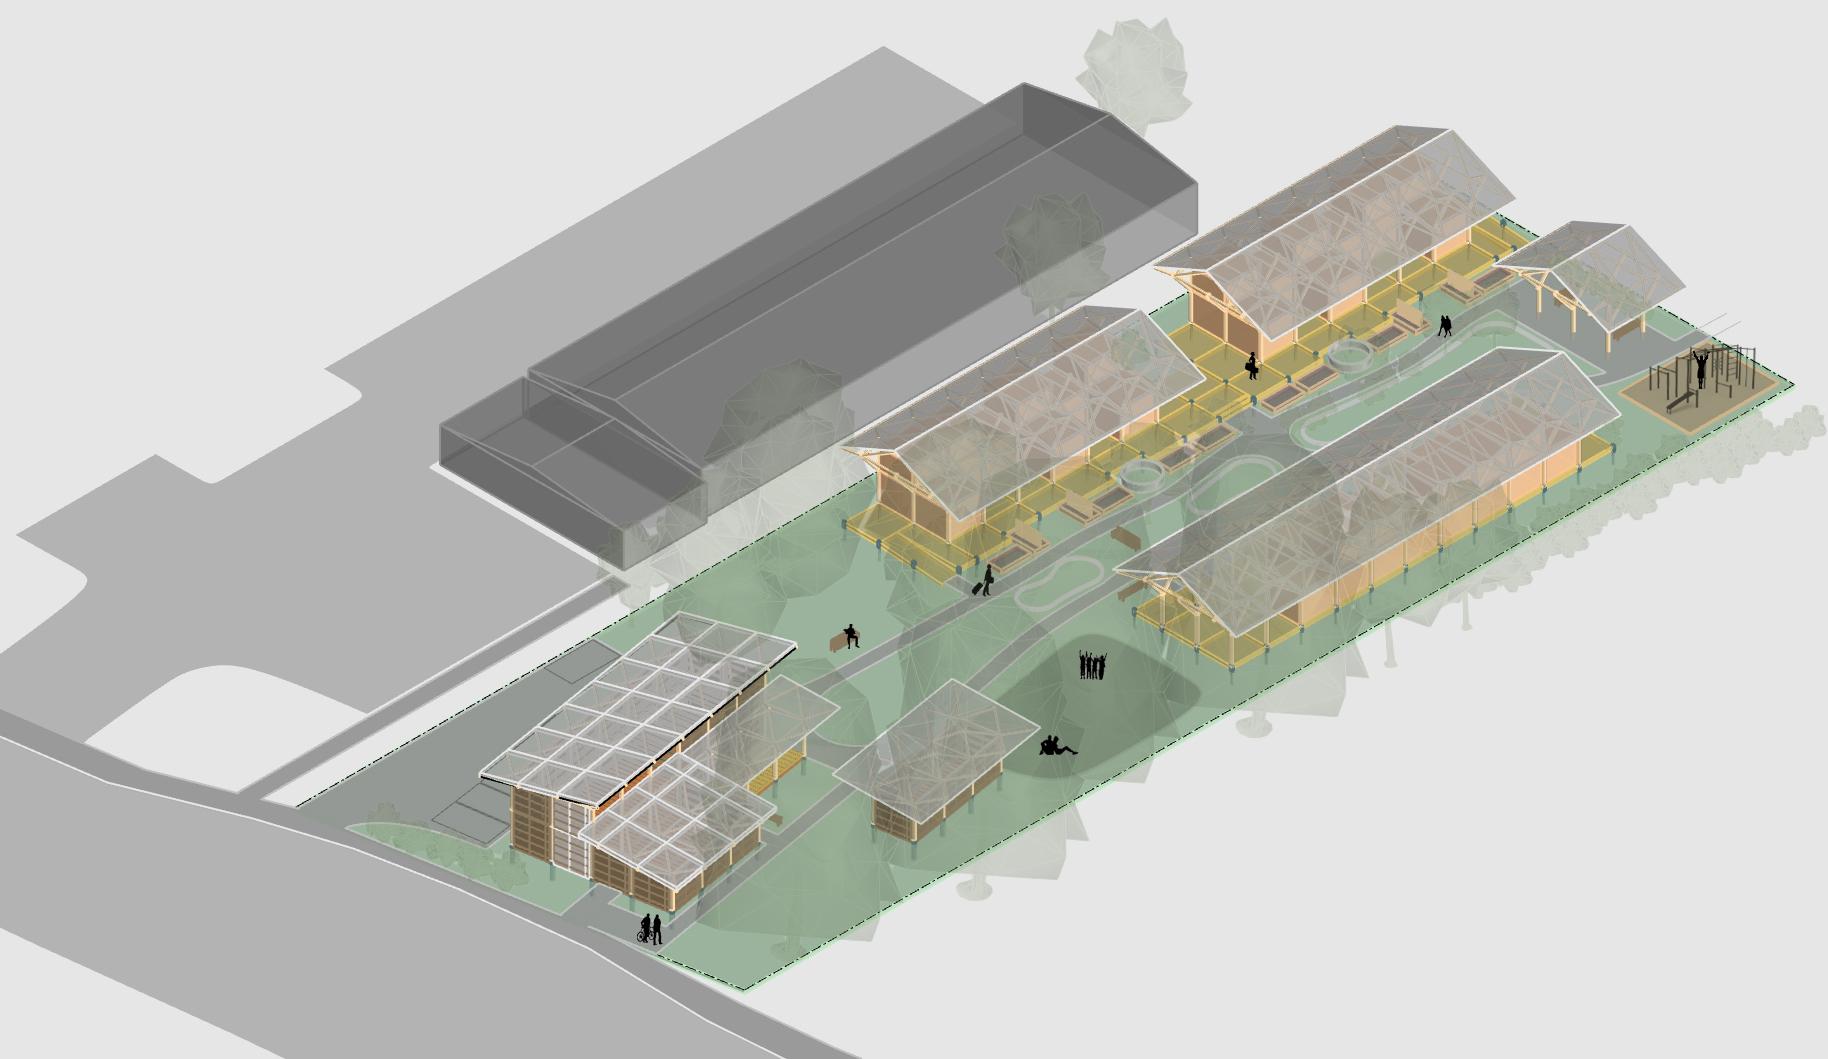
32 Place-making
Finished Unit Construction
Structure Axonometric 0:24
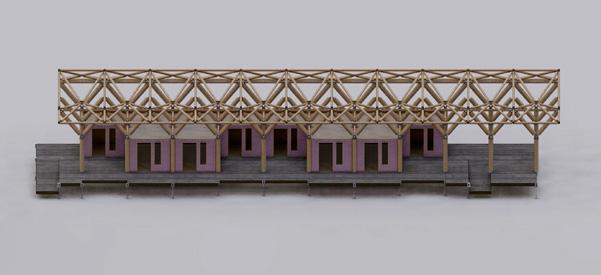
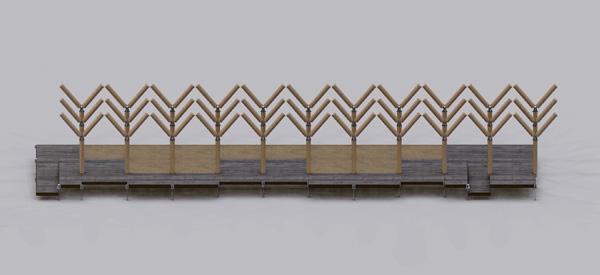
Created in After Effects and Lumion, this animation shows the proposed construction sequence for unit buildings.

This sequence assumes that a finalized unit is the desired outcome and doesn’t include intermediary steps such as the temporary shelters shown in the site phasing axonometric.

The shown building exists on the west edge of the site and borders an existing treeline. Individual units are painted by their prospective owners to provide agency within the site and capable owners are expected to assist in the construction along side the site steward.
Rainy Day
Atmospheric Vantage 0:10 loop
Rainy day is an atmospheric loop that shows the utilization of the unit roofs in inclement weather. A sense of being one with the site while being protected from the rain.
Full Site Sequence
Housing Axonometric 0:24
The hammock man sips tea.
Rain patters on the rooftop.
After Effects and Lumion animation showing the construction sequence for all residential buildings. Starts with the screwpiles and works up to a circulation diagram and site.
Ground-up construction.
Site composition and circulation.
33
Phasing & Animations
AR Recipes Personal Passion Project 3 Weeks
Location | World Wide Web
Project Team: Isaac Martinotti - Research & Coding
ChatGPT - Code Assistance & Review

Date | December ‘22 - January ‘23
Personal project working to combine multiple emerging technologies to facilitate reduced wood-waste and democratize furniture design.
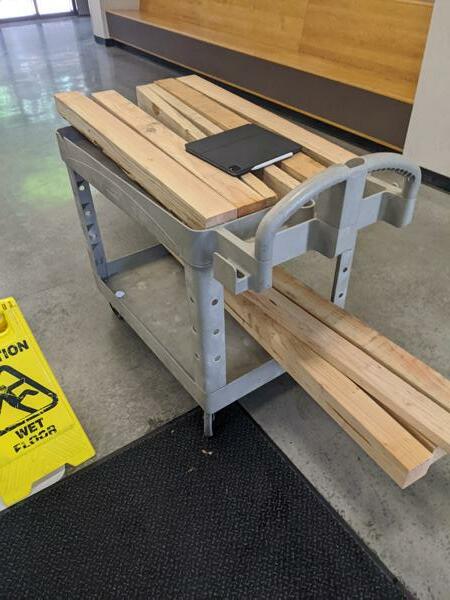
Stemmed from a personal issue when trying to quickly understand, inventory, and utilize scrap lumber from various projects.
Currently partially functioning, but it honestly works better than expected for how little time is has taken.
06
To build an inventory, each individual piece of scrap is depth-mapped using the Sony d-ToF sensor built into contemporary Apple mobile products. This requires that an object of a known length is also placed into the scene in order to accurately scale the point-cloud or mesh.
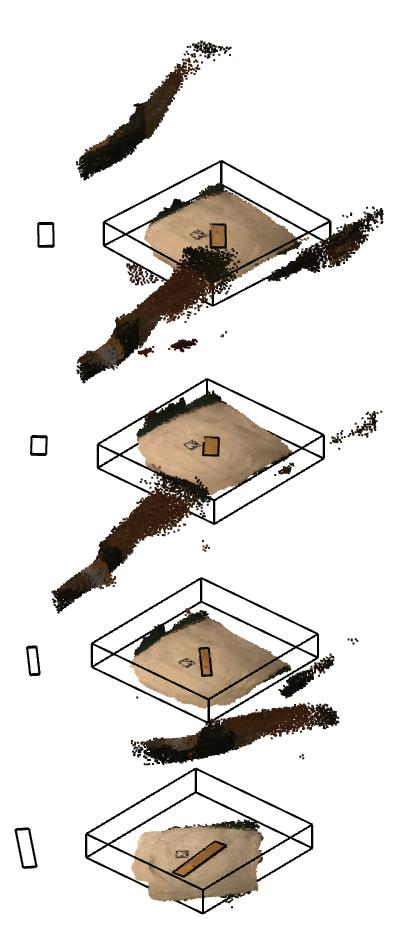
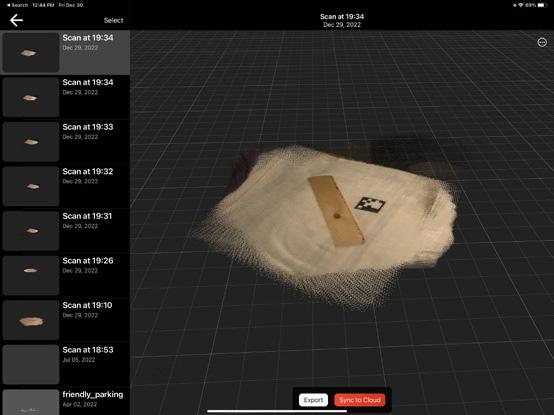
In an effort to minimize any unnecessary computation, each point-cloud is trimmed to only involve the area of the scan that includes the background plane and the subject. Ideally this could be automated in the future.
The point-cloud is added to an array and run through a pytorch model that is trained on the AR marker embedded in the scene. When identified, the point closest to the top left and bottom right recolored to magenta and the scene is overwritten.
Using this color we can scale the point-cloud in rhino to the known diagonal dimension of the marker and get a fairly accurate scale of the scene.
Finally, a plane can be fit through these two points and extended an arbitrary distance to act as the background. This allows us to remove all points within a user-defined tolerance (or key color) and only keep the central points that should define the piece of lumber.
A bounding box is created to encapsulate the points, and acts as a general volume and dimensional reference, finally being saved into an ‘inventory’ matrix.
Ideally, the future of this project would involve creating a repository of furniture where each individual part is categorized based on an outline and an extrusion depth. This could be filtered by the volume of timber pieces within the ‘inventory’ database to find recipes that could be created.
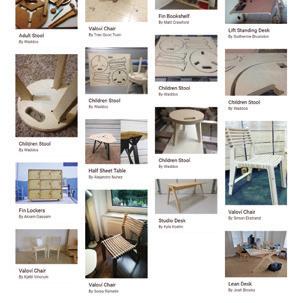
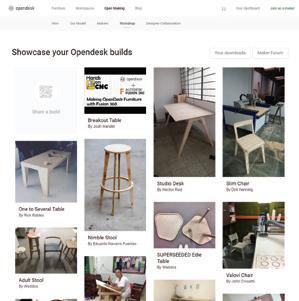
Although open-source projects such as Opendesk.cc and many individual designers have created repositories for designs, there isn’t an existing resource containing this information. In the following slides a process is outlined using a single recipe that was created as a proof-of-concept for this technique.
35
Geometry Capture & Sizing
Now that an inventory of pieces is built, it is simple to recreate brep geometry that can act as a double of the real world piece.
This geometry works best with an evolutionary solver like Galapagos and will allow us to feed a list of curves that match the outlines of each part in our chosen recipe. In this example, a simple piece of furniture based off of the Italian designer Enzo Mari is used.
Unfortunately, in its current form, Galapagos isn’t able to compute multiple fitness values at once. This means that we are only able to optimize for a single value, which in this case was picking the curves from a list that most closely approximated the area of the available material. This ended up being a more computationally intensive route to take, and was quickly abandonded to use OpenNest instead.
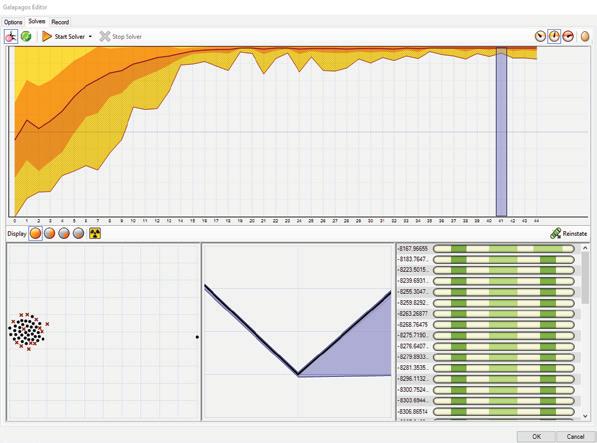
With OpenNest we can feed the largest face of each brep as a sheet, and only use pieces where the z-depth is equal to or larger than the thickness of the intended part. This works great for furniture plans containing simple silhouettes of each piece, and even better for plans where all pieces are the same thickness, like the example piece.
The dimensions shown in this diagram match the original design by Enzo Mari and required more material than was in the inventory. To get around this, all members were scaled down until the largest element fit on the largest sheet.
36
A F G H I B C D E J Section Length Quantity 2x10 ‘’ ‘’ ‘’ ‘’ 173 110 80 70 60 2 1 2 8 4 A B C D E Section Length Quantity 2x10 ‘’ ‘’ 1.8x10 2x80 26 24 14 67 180 4 4 2 4 1 F G H I J Inventory Creation & Recipe Matching
Going forward it will be beneficial to provide instruction for the user in the event that a piece of inventory is thicker than the parts within it.
Similarly, there are many other scenarios that would need to be accounted for. Mainly, recipes that involve multiple pieces of variying thicknesses being fit on a single inventory item, or non-planar items being added to the inventory in general.
2 D E E D x2 9 10 3 x2 F 4 A B 7 x2 I C 21cm 5 x2 G H 2cm 8 J 9.5cm 6
1
8cm
Hypothetical Assembly Instructions
Photo: Bildupphovsrätt
07Recursive Radiance Validated Lighting Simulation Independent Study
10 Weeks
Location | Eugene, Oregon, USA
Advisor | Dr. Kevin VD Wymelenberg
Technology Advisor | Alen Mahic Advanced Technical | Fall 2021
Sprouting from a final project for Dr. Van Den Wymelenberg’s Daylighting class, this independent learning project occurred during the following academic year.
The goal of this study is to utilize multiple-exposure HDR photography of the sky-box to generate quantitatively accurate daylight simulations inside 3D models of structures.
The original intention of this project was to recreate an existing structure in Radiance, lighting it solely with a rooftop hemispherical image. This idea morphed into creating a system to control smart lighting and shading devices.

Simulation:
Photograph:
This process - originally explored and tested for Kevin Van Den Wymelenberg’s advanced technology class - allows for a direct comparison of interior and exterior hdri photos.


The original process shown partially to the left is completely manual and requires simultaneous spherical/hemispherical images of both an interior and exterior scene. The photos are bracketed at common shutter intervals of 1/8000 to 30/1 and combined in the freeware Photosphere along with a recorded illuminance value.


The resulting exterior HDR photograph can then be imported to Blender and utilized to light a 1:1 scene containing a properly textured BIM model of the intended building.

Many steps are required to accurately light the model to match the captured interior photograph, but the intention of this original study was purely proof-of-concept.
Although the end result is relatively realistic from an aesthetic point of view, the purpose of the following independent study is to quantify and validate a similar method that can more easily be automated.
Despite being out of the scope of this 10 week study, the culmination of this idea would be creating a standalone and automatic version of the following study; this would allow exterior photographs to easily control interior smart devices for the purposes of daylight control and human comfort.


40
Prepared & Meshed Model
Default Materials
Adjustment to HDRI Intensity Adjustment to Bounces and Passes Specularity, Reflectivity and Colors
First Attempt:
Materials & Light Bar Emissivity
Proof of Concept Testing


41 ograph and 17:Radianc Figure Figure enderedgridWW-Figure-Vie-Figure quipmen Electronics.Simple Simulations for Complex Construction: Models for Daylight Metering-
Automated Capture & Simulation
Click for Full Article
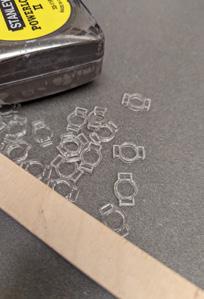
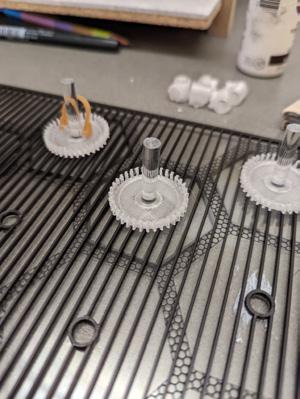
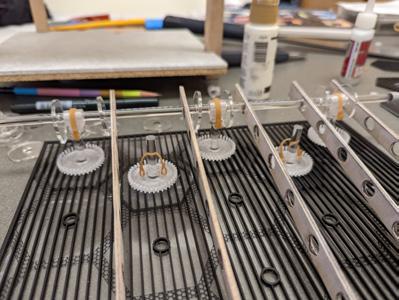
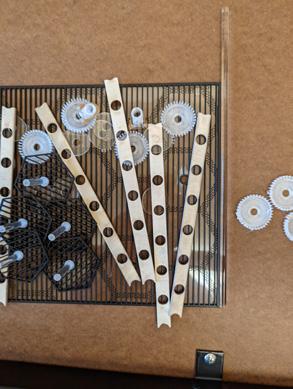
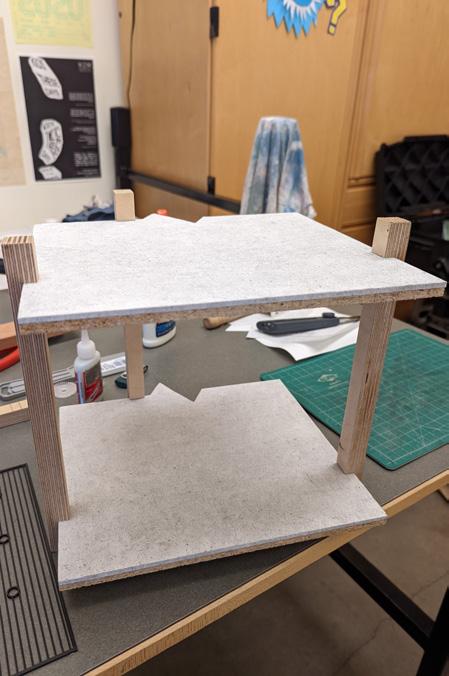
Moiré Than Meets The Eye Kinetic Facade Study

10 Weeks
Location | Eugene, Oregon, USA
Advisor | Dr. Ihab Elzeyadi
Advanced Tech Elective | Fall 2021
Inspired by that annoying phenomenon that prevents people from photographing screens, this facade study investigates how interference patterns and simple motions can create powerful shading systems. The iterative approach shown in the following images and diagrams is the culmination of a crash course in dynamism.
Personal Contribution:
All work shown was completed individually. Critiques and presentations are completed in pairs, but all physical and digital models, drawings, and diagrams are completed on a per-student basis.
08


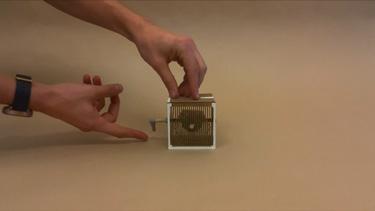
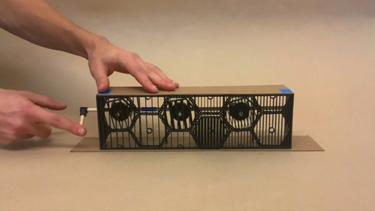
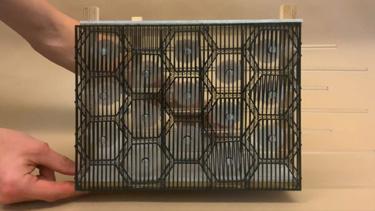
44 Base Scenario Grid (60°) Initial Concept Model Week 3 Front tilt-moire pattern. Initial Motion Model Week 4 Proof of concept hexagon. Motion Model Week 7 Initial state. Final Model Week 10 In-line vertical configuration. Grid (180°) Grid (60°) Grid (0°) Base Scenario Parts Progression Model-making & Simulation

45
Printed, Cut, and Etched Parts
Final Construction & Gearing
Final Model Mechanical Assembly Final Model Bay
Tweeter Weather Environmental Computation Final 1 Week
Location | Portland, Oregon, USA
Instructor | Jun Hak Lee
Upper Div. Elective | Winter 2021
This project attempted to see whether an algorithm could consistently predict the weather based on tweets about clothing, temperature, and sunlight.
Final assignment for an environmental computer science class. Requirements were as follows:
Must be a scraped dataset.
Must solve a realistic problem.
Must be created within a 1 week period.
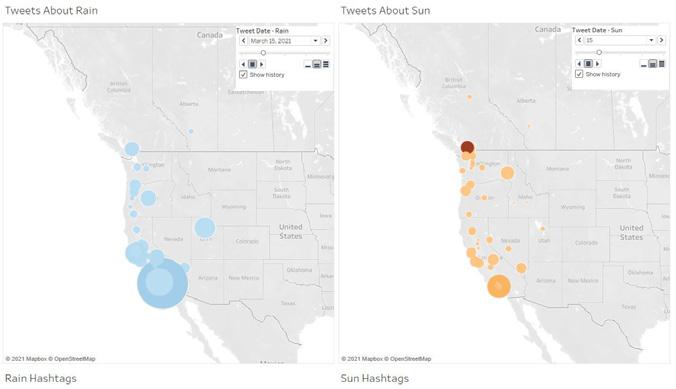
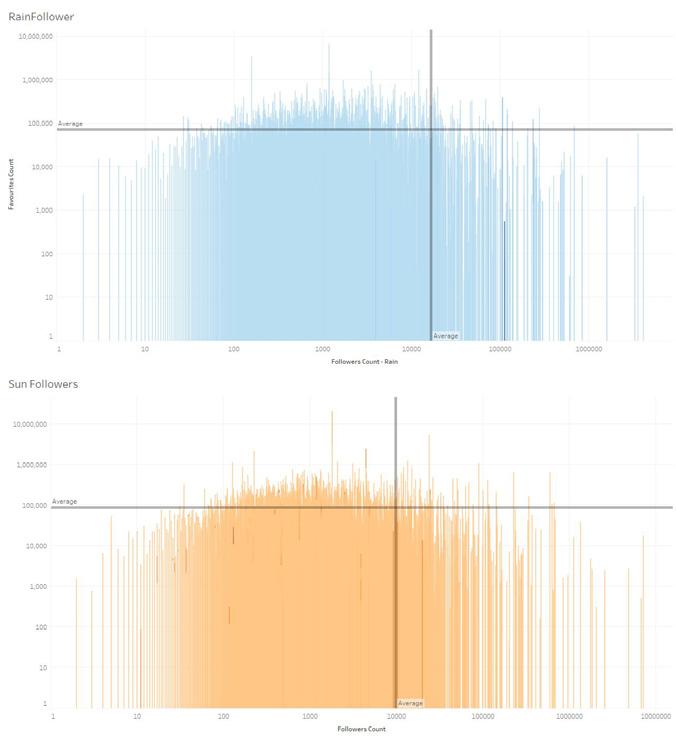
All graphics were created with the R programming and visualization language.
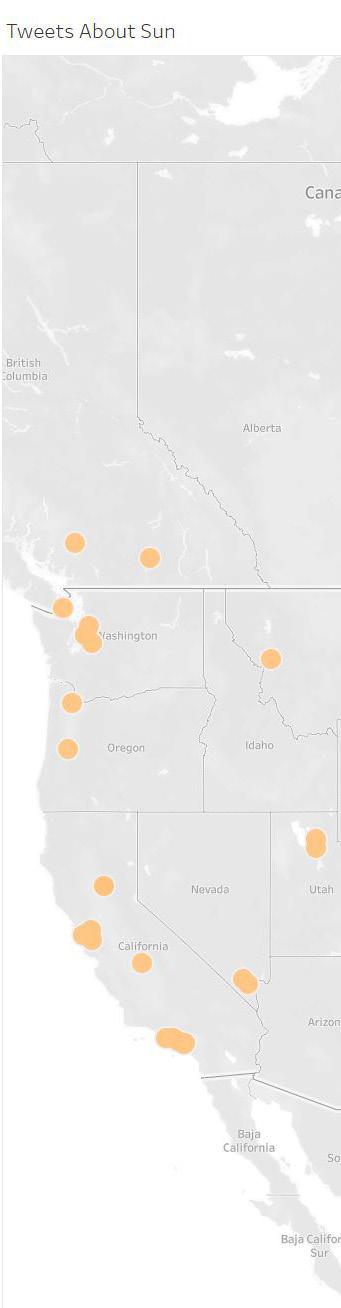
Accounts with sun accounts have on average 20,000 more followers than rain accounts
Word-cloud of most common rain/sun related words included in tweets.

09
Tweets per city, scaled proportionally regarding most common keywords and content.
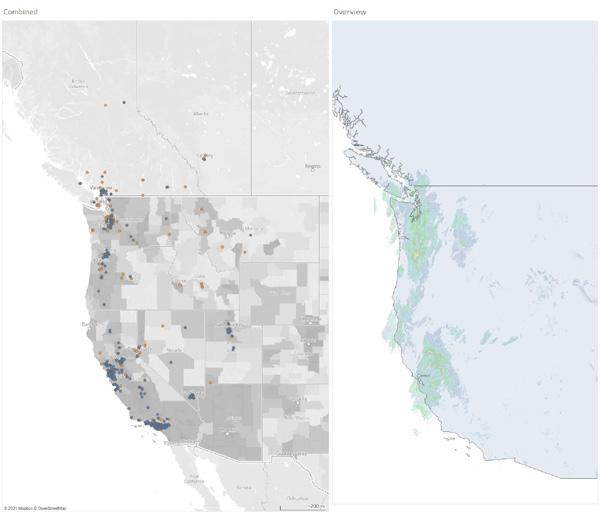
Cities with lower annual rainfall had higher accuracy of predicting rain. Cities with higher annual cloud cover have higher accuracy of predicting sun.
Individual datasets gathered from Twitter
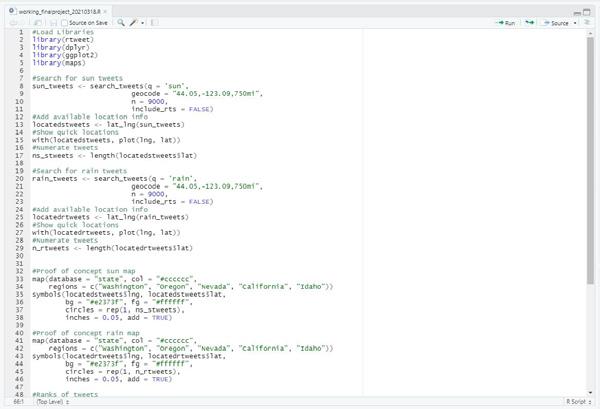
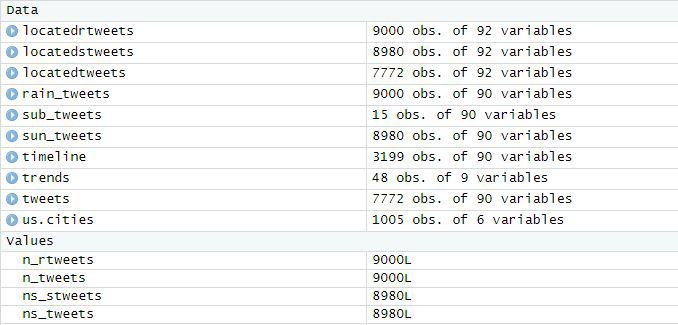
Generative methods for creating graphics
Cities ranked on proliferation of weather related tweets
Takeaway: People tweet about abnormal things.

47
Dataset Creation & Visualization
Fuel Ladder Gallery Exhibition 3 Months
Location | Eugene, Oregon, USA
Host
(CFAR)
Date | November - December 2022
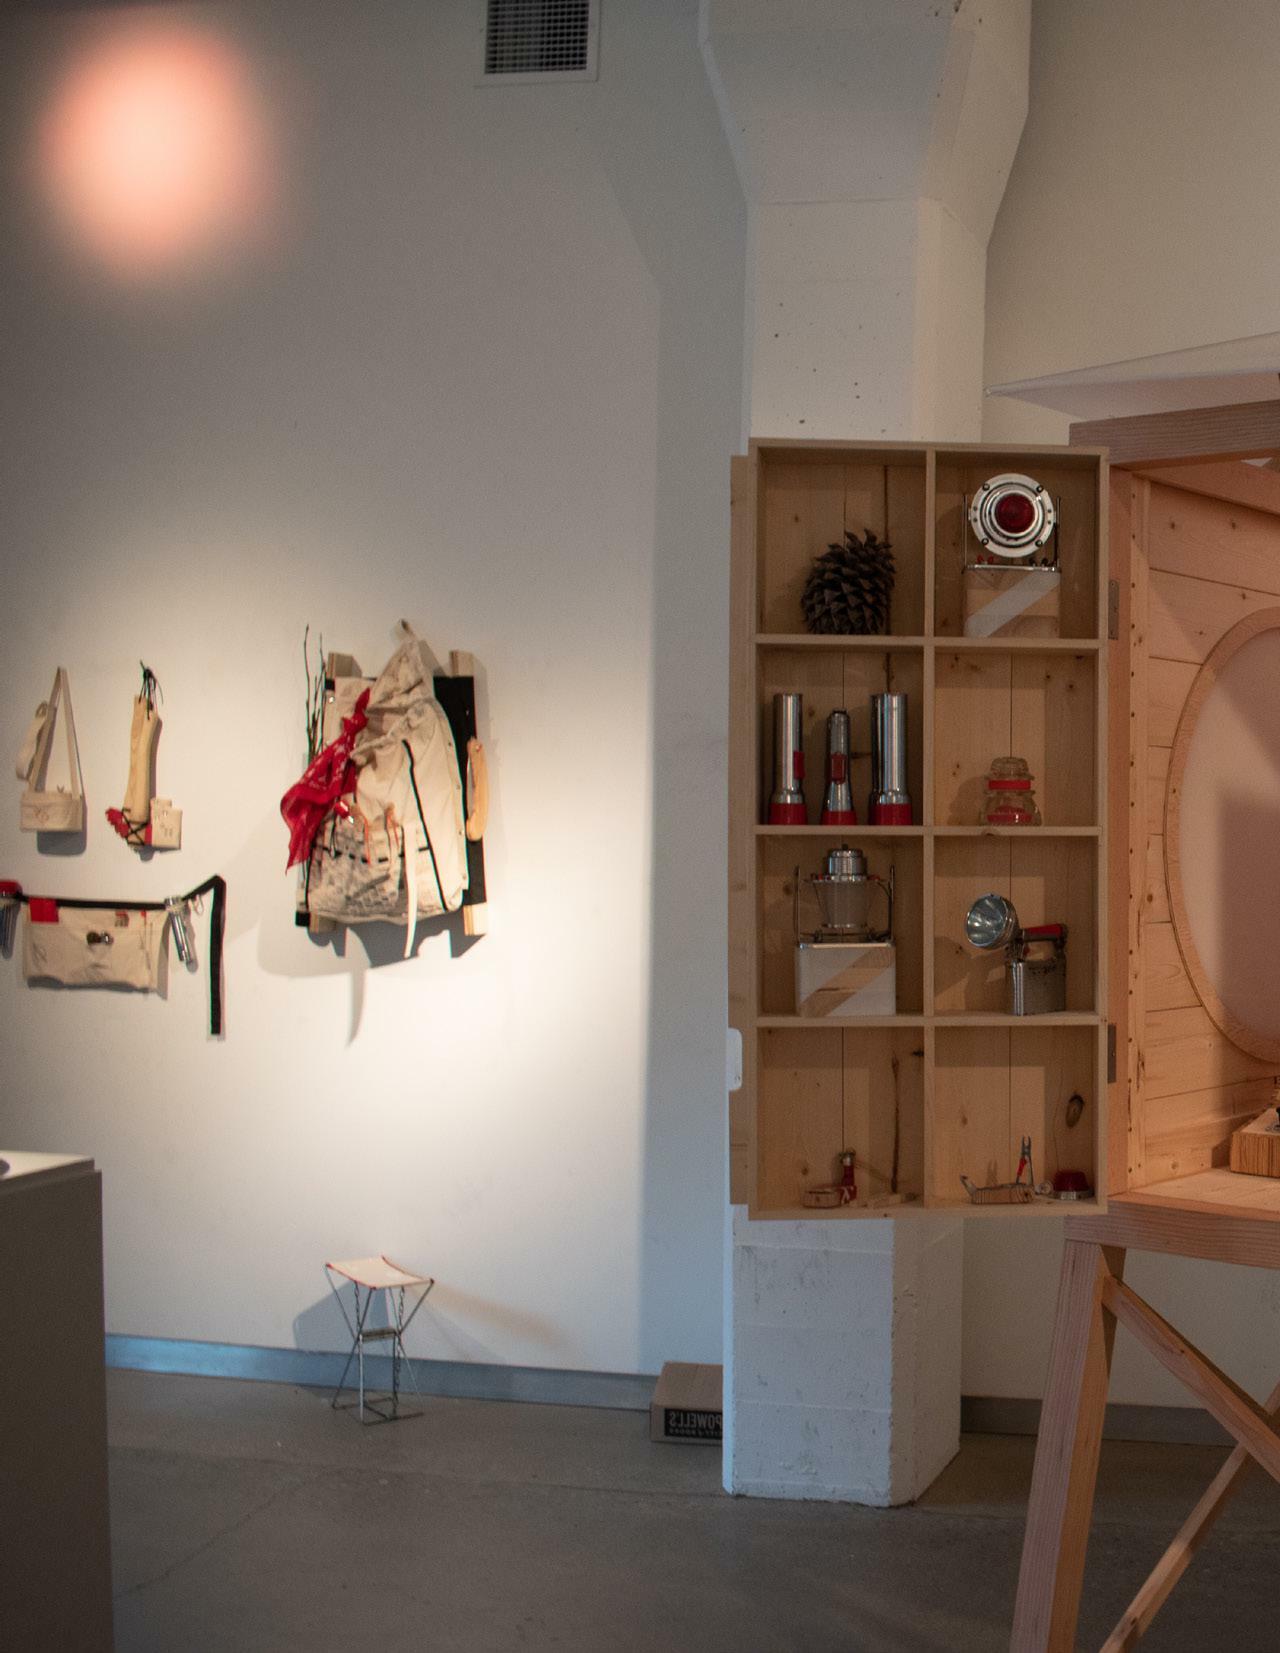
Joined with a group of students, alum, professors, and friends to take part in a speculative wildfire and technology art-show called ‘Ignition.’ This is the second gallery show that was created with this group, now called the Candy Collective - an inside joke harking back to the quality and detail embedded in each designed piece. This show is included as all pieces are both designed and built in-house, and each group member had a large voice during the entire process.
Personal Contribution: Production Woodworking, 3D Renderings, Graphic Design, LaserCutting & Etching, CNC Routing, Painting, Electronics, Mold-making, Installation.
10
| Center for Art Research
Co-Exhibitors | David B. Borden, Will Bonner, Ian Vierck, Nancy Silvers, Madison Sanders, Sabine Winkler
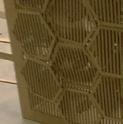
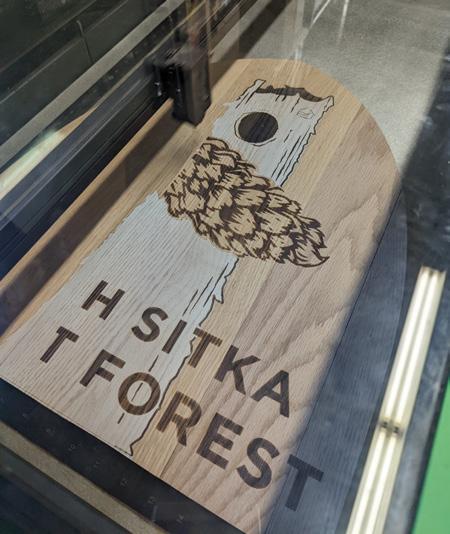
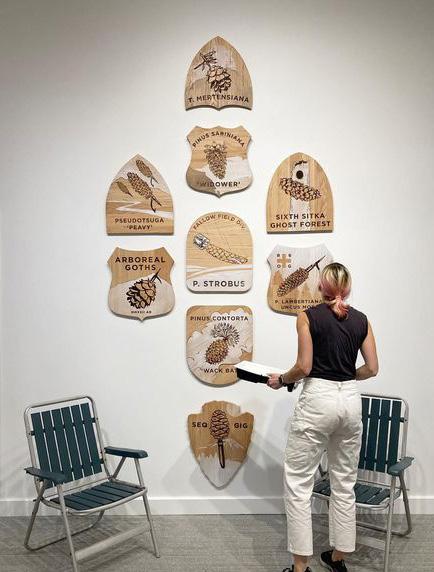
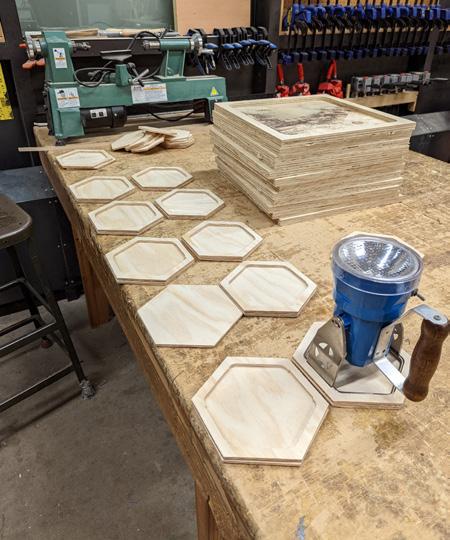
The creation of this show required utilizing many techniques to quickly and intentionally create several pieces of art. Many of the pieces shown in the following images were fully created in Rhinoceros 3D to facilitate CNC fabrication, laser etching & cutting, and to create templates for later use. One of the largest issues when utilizing organic materials such as the Gorman Pine - the primary material in this exhibit - is attempting the combine the precision afforded to computational design with the uncertainty and caution required for non-homogeneous materials like quick-growth woods. We learned lots of new techniques as well as where to best incorporate margins for error during these exercises. Lots of research and development time was also used during the experimentation on the various laser cutters at the University of Oregon in order to create the Arboreal Goth Shields to the right of and below this paragraph. Effort was made to produce the multitude of burn patterns and etch depths used in the final production.

50
Parametric Design & Fabrication
Photo: David B. Borden
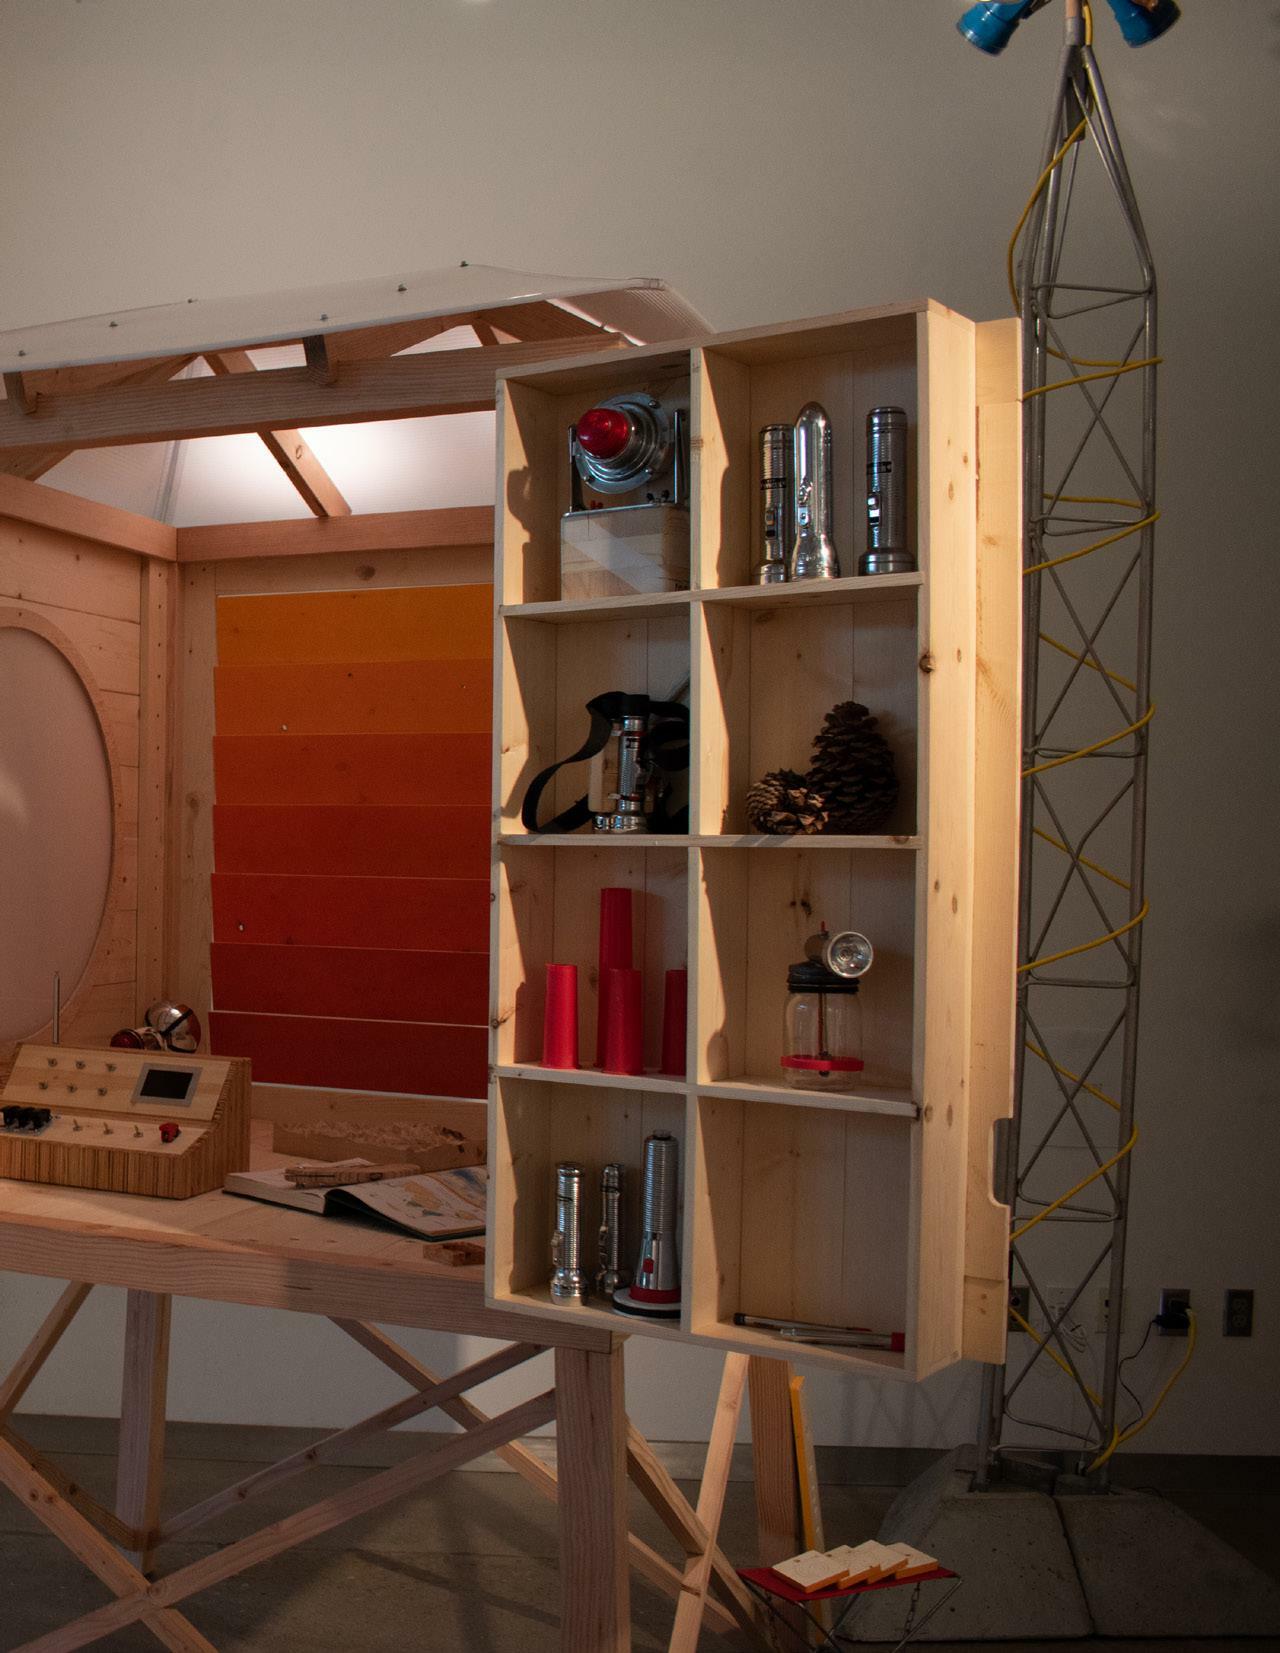
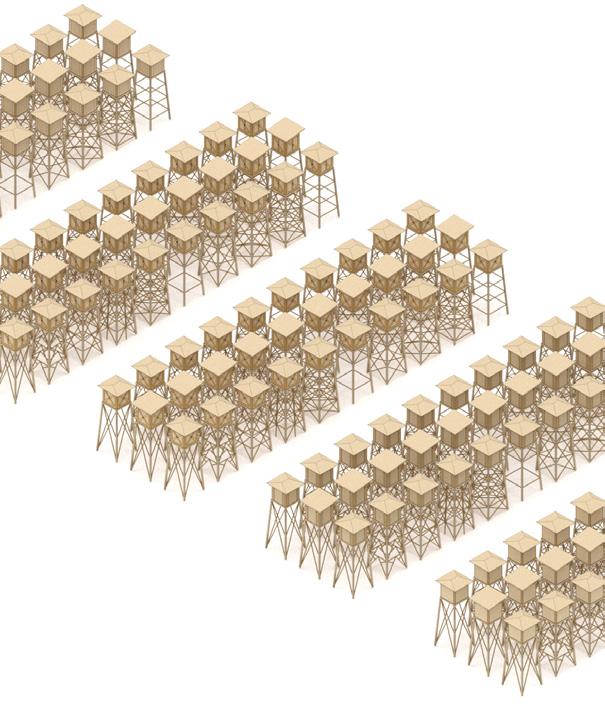
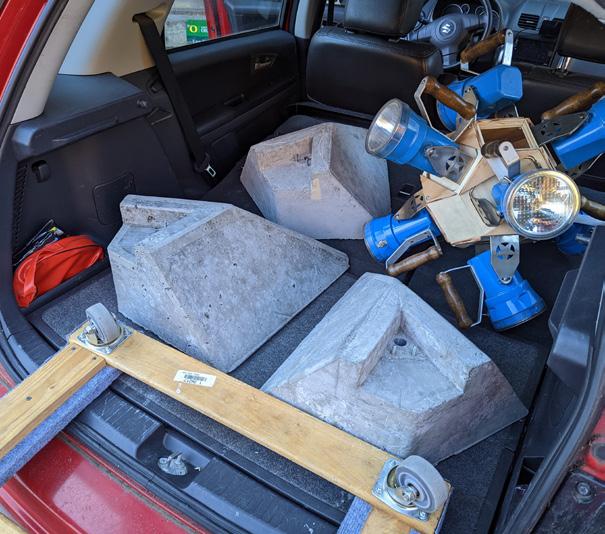
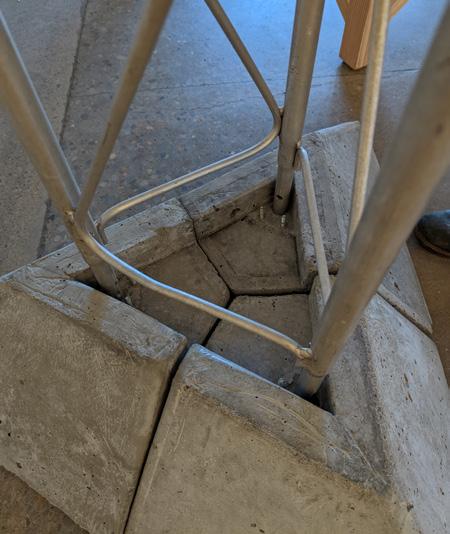
One of the main reasons for my involvement in this project was my known enjoyment of creating complex woodworking forms - such as the chamfered octahedron in these photographs - despite the annoying math and precision involved in making each piece fit into a cohesive final form. Many of these pieces were created with little room - and time - for error - and occasionally an abundance of wood-fill. This project also involved creating multi-use concrete molds for supporting the repurposed transmission tower for this exhibit, as well as the CNC ready pieces to create the affectionately titled ‘blueberry’ that fit at the top of this tower. To mix the concrete we requested the ability to use UO facilities, and upon not hearing anything back, we mixed concrete on the loading dock and hoped that nobody cared. The most complicated part of this exhibition - and the part that required the most collaboration and deliberation - is the climate station shown on the previous spread. We invested time in a parametric exploration of the known fire-tower typologies in order to arrive at the final form, and bracing of the piece. This work was built on an alumni student named Kennedy Rouh, who did the majority of the research required for the historical data to be combined and used in this exploratory model.


51
Fabrication
Error 507
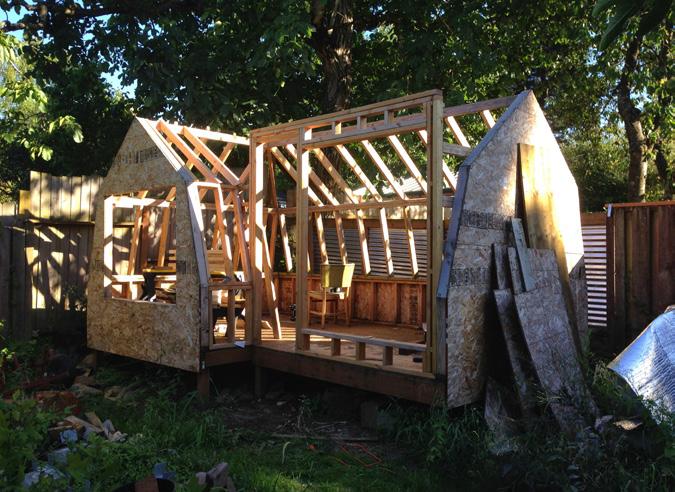
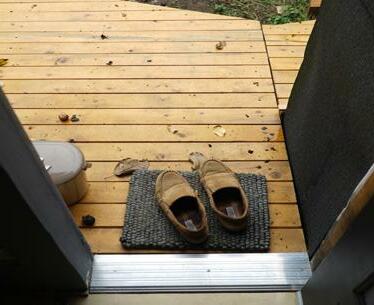
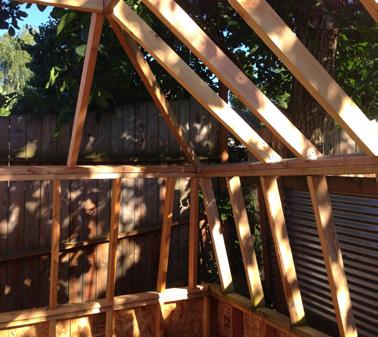
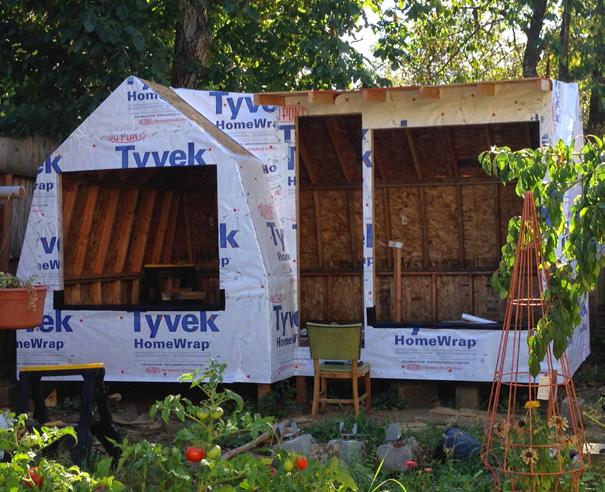
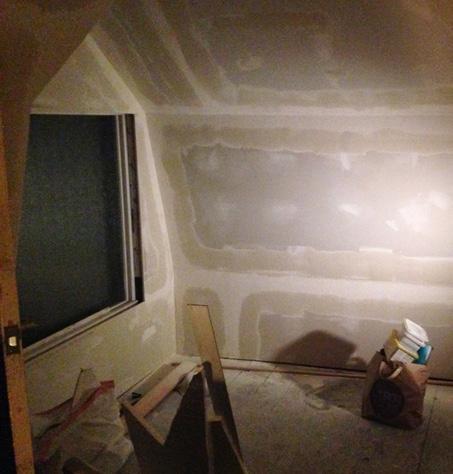
Independent Design / Build Design (7/2014) Build (7/2019)
Location | Portland, Oregon, USA
Self-Financed Design Project
Final Total: $3,550 + Time
This project was envisioned both as a test to make sure architecture was the correct career path, and as a way to get out of my childhood home. Originally sketched during my time at Portland Community College, this ADU was singlehandedly constructed across 3 summers with the only assistance coming from a neighbor offering to lift the heavy windows.
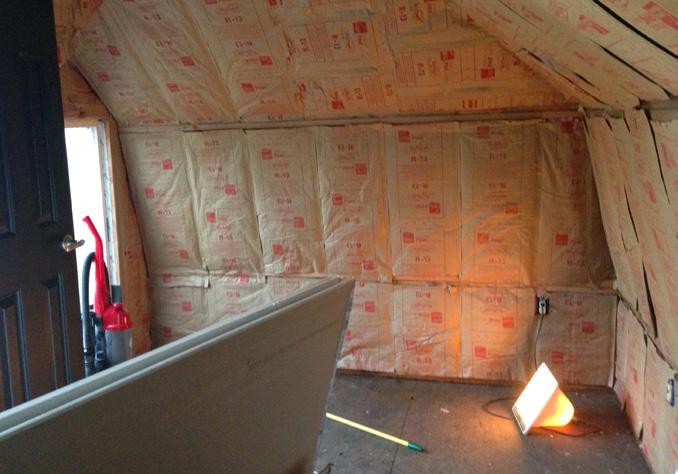
Although this home has a few issues, mainly relating to insulation, it has acted as my only home in Portland and is still used for breaks to this day. The home isn’t plumbed but has wired internet, grid electricity, and a small grid-tie solar setup. Without any formal architectural knowledge I relied entirely on YouTube tutorials, building forums, and an ADU building guide provided by the City of Portland.
11
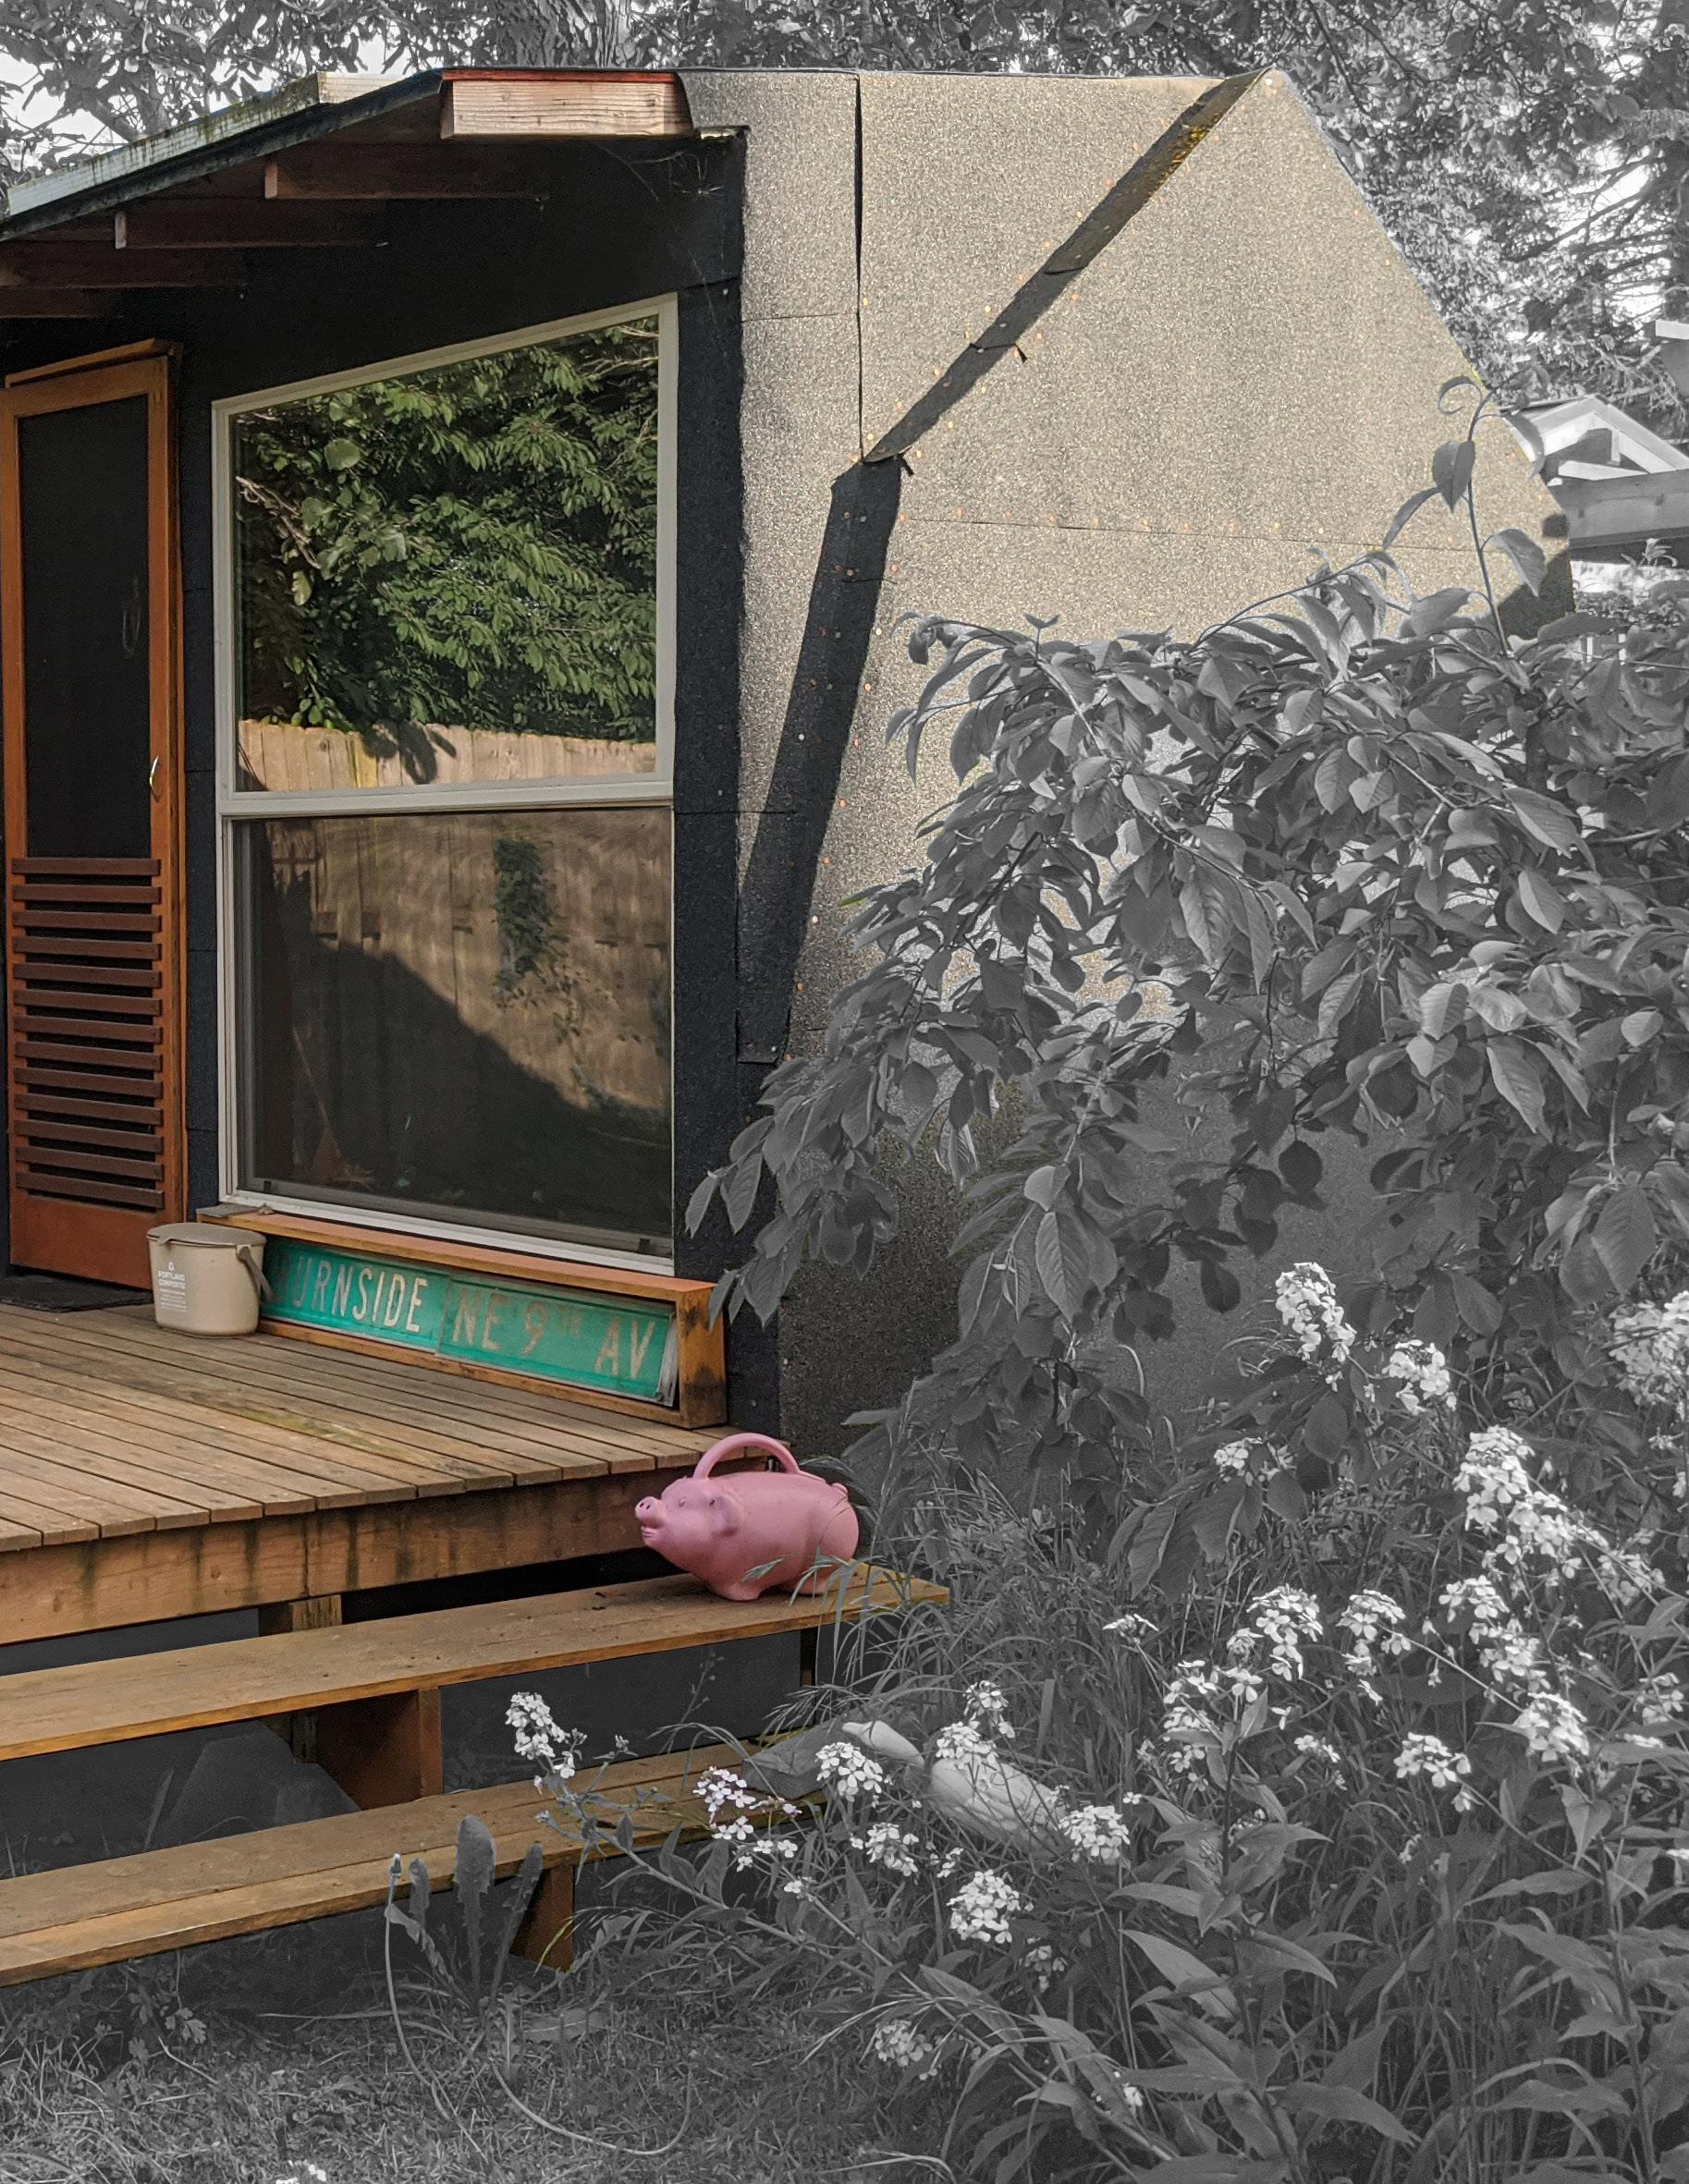
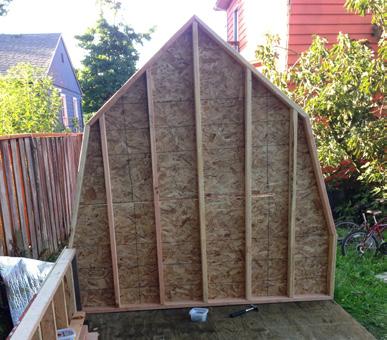
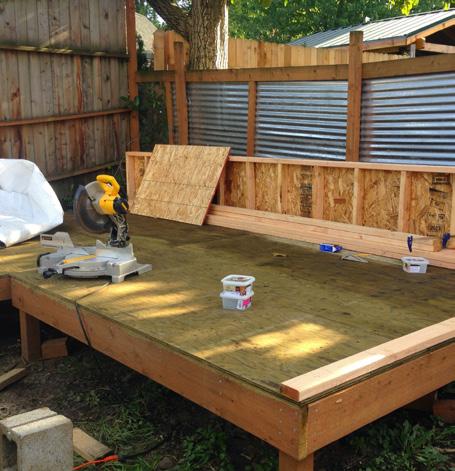
Foundation:
Footings, pillars, and initial framing follows City of Portland ADU Guidelines for lot clearances and maximum total height of structure.
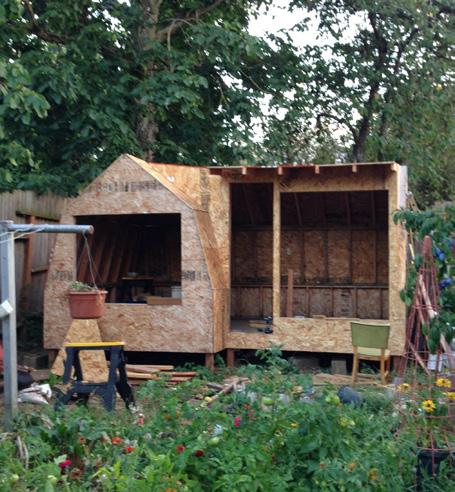
Framing:
Infill follows traditional angles for Dutch gambrel houses. Framing, house wrap, and roofing system matches suggested YouTube ADU examples.
Finishing:
Insulation, drywall, and electrical follow information provided by various trade-books & tutorials. Roofing and roofed siding are experimentations, deck follows Lowe’s decking guide.

54
Phasing &
Explanation


55 Documentation
