

ANNUAL REPORT 2023

Asetek, a global leader in mechatronic innovation, is a Danish garage-to-stock-exchange success story. Founded in 2000, Asetek established its innovative position as the leading OEM developer and producer of the all-in-one liquid cooler for all major PC & Enthusiast gaming brands. In 2021, Asetek introduced its line of products for next level immersive SimSports gaming experiences.
Asetek is headquartered in Denmark and has operations in China, Taiwan and the United States with a total of 134 employees. In 2023 Asetek recorded revenue of $76.3 million.
Asetek A/S
Visiting address: Assensvej 2 DK-9220 Aalborg East Denmark
Phone: +45 9645 0047
Email: investor.relations@asetek.com www.asetek.com
CVR number: 3488 0522
Annual report for the financial year 1 January to 31 December 2023. This annual report is approved by the Board of Directors as of March 8, 2024. The Board will submit this report for approval at the Annual General Meeting on April 30, 2024. This annual report contains prospective information based on Asetek’s current expectations. This information is by nature uncertain and associated with risk. Even if company management considers expectations based on such prospective information to be reasonable, no guarantee can be given that these expectations will prove to be correct. Consequently, actual future results may vary significantly compared with what is set out in the prospective information, for reasons including changed conditions in respect of the economy, market and competition, changes in legal requirements and other political measures, exchange rate variations and other factors. Read more about the risks in the chapter on ‘Risk management’ on pages 32–34 and in note 3 on page 48 ‘Risk management and debt’ in the financial statements.
XXXXX AN NUAL REPORT 2023 / Page 2
XXXXX AN NUAL REPORT 2023 / Page 3 Asetek in brief 4 2023 in brief 6 Comments from CEO 7 Asetek as an investment 9 Strategic framework 10 Business model 11 Logistics 13 Business segments 14 Liquid cooling 15 SimSports 16 Share and shareholders 18 Listing at Nasdaq Copenhagen 20 New headquarters and R&D center 21 Management report 23 Corporate governance 25 Risk management 30 Corporate social responsibility 33 Five year summary 34 Consolidated statement of comprehensive income 36 Consolidated balance sheet 37 Consolidated statement of changes in equity 38 Consolidated cash flow statement 39 Notes 40 Comprehensive income statement, parent company 63 Balance sheet, parent company 64 Statement of changes in equity, parent company 65 Statement of cash flows, parent company 66 Notes, parent company 67 Management statement 71 Independent auditor’s reports 72 Definitions of ratios and metrics 77 CONTENT
FOUNDED ON INNOVATION. DRIVEN BY EXCELLENCE
Asetek has been an innovative force in the global liquid cooling manufacturing industry for more than 25 years. In 2021 we introduced products for SimSports gaming. Asetek is headquartered in Denmark and has operations in China, Taiwan and the United States with a total of 134 employees. The Asetek share is listed on Oslo Stock Exchange and Nasdaq Copenhagen. In 2023 the company recorded revenue of 76.3 million USD.
Who we are
We are a high-tech company with a long history in mechatronic innovation, focusing on gaming hardware. Since our foundation we have disrupted the PC cooling market, setting new standards for performance and efficiency. In 2021, we continued to leverage our extensive capabilities with software, hardware and mechanics and entered into the world of sim racing as Asetek SimSports®. We are a diverse and agile organization located close to some key electronic manufacturing hubs in South-East Asia.
What we do
Asetek is a developer and manufacturer of high-quality gaming hardware. Since 2000, we design, manufacture, and sell high-quality liquid cooling solutions to most major PC and Enthusiast gaming brands. In 2021, we introduced our line of products for next-level immersive SimSports gaming experiences, offering every sim racer in the world the possibility to push limits and redefining what’s possible.
Why we do it
With our market-leading and high-quality product offering our goal is to meet our clients´ requirements for performance, design and longer product lifecycles. Our product development centers around our customers’ needs and reflect an innovative engineering approach combined with superior performance. The Asetek brand name has become synonymous with high product quality in all categories, which is confirmed by great reviews and feedback from gamers and hardware enthusiasts around the world. We are in business to push limits and redefining what’s possible.

“ 72.7 79.8 50.6
76.3
Revenue per quarter, $ million Foreign ownership
Revenue per year, $ million Owner type distribution 14.8
24.5 20.5 16.5
Private Individuals 20.7% Fund company 15.5% Other 13.5% Pension & Insurance 13.2% Investment & PE 1.6% Treasury Shares 1.3% Unknown owner type 34.3%
9.7% of revenue invested in research and development in 2023
ASETEK IN BRIEF AN NUAL REPORT 2023 / Page 4
GROSS PROFIT 2023 $34.7 million REVENUE 2023 $76.3 million
Asetek is a high-tech company with a long history in mechatronic innovation, focusing on gaming hardware 2023 2022 2021 2020
KEY CONCEPTS FOR UNDERSTANDING ASETEK
CUSTOMERS – a global customer base
We design, manufacture, and sell gaming hardware for next-level immersive gaming experiences. We serve some of the world’s leading PC & Enthusiast gaming brands. In 2021 we introduced our line of products for next-level immersive SimSports gaming experiences, offering every sim racer in the world the possibility to push limits and redefining what’s possible.
REACH – well-balanced and global
We have a longstanding local presence in some key electronic manufacturing hubs in South-East Asia. Our headquarter is in Aalborg, north Jutland, Denmark with presence of senior executives in North America. We have a global platform with a solid supply chain creating long-term value for all stakeholders.
PEOPLE – an international organization
We believe that a diverse workforce and an inclusive workplace is a prerequisite for staying competitive, now and in the future. Our highly skilled employees are based in three continents, all sharing the common purpose of challenging industry standards driven by innovation and operational excellence.
INNOVATION – we are a high-tech
company Asetek is a global leader in mechatronic innovation. Our journey began almost 25 years ago when we disrupted the PC cooling market with our groundbreaking all-in-one liquid cooler, setting new standards for performance and efficiency. In 2021, we continued to leverage our extensive capabilities with software, hardware and mechanics and entered into the world of sim racing as Asetek SimSports®. Our goal is to transform the sim racing scene, pushing limits and redefining what’s possible.
HISTORY – founded on innovation
Our history is rooted in innovation that solved a key challenge of performance limitations caused by computer processors running hot. This innovation, still leading today, is the foundation that took Asetek to a world-leading market position within liquid cooling. Since 2021 we are on a mission to become market-leader in the rapidly growing market for sim hardware.
ASETEK IN BRIEF AN NUAL REPORT 2023 / Page 5
KEY MILESTONES AND EVENTS 2023
In 2023, Asetek exceeded the communicated financial guidance from the start of the year and reported the second best financial results in the company´s history. Notable milestones during the year included several product launches within the SimSports segment to broaden the product offering as well as a number of product launches within Liquid Cooling. During the year, Asetek also carried out a successful listing of its shares on Nasdaq Copenhagen.
54 New Liquid Cooling products launched during 2023
In May, a General Meeting resolved on the election of five Board members. Erik Damsgaard, Jukka Pertola, Maria Hjorth and Maja Frølunde SandGrimnitz were re-elected with René Svendsen-Tune elected as new Board member. The Board subsequently comprised three regular Board members, one vice-chairman and one chairman.
2023
Asetek passed a milestone when a total of 11 million products were sold and shipped since the foundation of the company in 2000

In May, Asetek raised net proceeds of $16.1 million a fully underwritten rights issue of 71,166,667 new shares at a subscription price of NOK 3 per share.
In May, the Asetek share commenced trading on the Nasdaq Copenhagen in Denmark.
37 New SimSports products launched during 2023

In June, Asetek announced that Micro Center will start selling a broad offering of Asetek SimSports sim racing products in its physical stores across the USA as well as through its online store.
In December, Oslo Børs approved Asetek’s application to delist its shares. Following the approval the last day of trading of the shares on Oslo Børs is 26 March, 2024.
2023 IN BRIEF AN NUAL REPORT 2023 / Page 6
2023 2022 2021 2020 72.7 79.8 50.6 76.3 Revenue per year, $ million Owner type distribution Q4 Q3 Q2 Q1 14.8 24.5 20.5 16.5 Revenue per quarter, $ million Q4 Q3 Q2 Q1 2.8 6.2 4.8 2.1 Adjusted EBITDA per quarter, $ million Volume per market Foreign ownership Private Individuals 20.7% Fund company 15.5% Other 13.5% Pension & Insurance 13.2% Investment & PE 1.6% Treasury Shares 1.3% Unknown owner type 34.3% Aquis 0.7% Cboe Global Markets 11.6% Euronext 43.6% ITG 0.2% LSE Group 1.8% Nasdaq 42.1% Sigma-X 0.04% Foreign ownership 42.5% Danish ownership 54.5% Norwegian ownership 3.0% 2023 2022 2021 2020 72.7 79.8 50.6 76.3 Revenue per year, $ million Owner type distribution Q4 Q3 Q2 Q1 14.8 24.5 20.5 16.5 Revenue per quarter, $ million Q4 Q3 Q2 Q1 2.8 6.2 4.8 2.1 Adjusted EBITDA per quarter, $ million Volume per market Foreign ownership Private Individuals 20.7% Fund company 15.5% Other 13.5% Pension & Insurance 13.2% Investment & PE 1.6% Treasury Shares 1.3% Unknown owner type 34.3% Aquis 0.7% Cboe Global Markets 11.6% Euronext 43.6% ITG 0.2% LSE Group 1.8% Nasdaq 42.1% Sigma-X 0.04% Foreign ownership 42.5% Danish ownership 54.5% Norwegian ownership 3.0%
WELL POSITIONED FOR THE FUTURE
We are leaving 2023, a year of contrasts behind us. For Asetek, this manifested in a material rebound for our Liquid Cooling business and expansion of the SimSports product program to wide acclaim from the sim racing community. I’m proud of delivering our second-best year ever measured by revenue and profit, reflecting strong demand for our products.
The profitable Liquid Cooling business provides a robust foundation for our SimSports growth strategy. Remember, that in just over two years we have established a portfolio of market-leading products fusing mechatronics with real racing experience. Just as with Liquid Cooling, our core tenets of Passion, Precision and Performance guide us as we develop solutions that enable better gaming experiences.
In the first half of 2023 we secured financing of our new domicile, which required a capital injection by our shareholders. We remain confident of the long-term potential in our markets, but at the same time we continue to experience low near-term revenue visibility. However, we are adapting and have aligned our strategic priorities accordingly, and our focus in 2024 is to execute on these.
Strong position amid shifting demand
Entering 2023, we came from a period with reduced revenue due to chip-shortages, record-high inflation, geopolitical issues and inventory adjustments. We adapted to the new market conditions, appropriately trimming the organization. Therefore, we were well positioned when customers, early in the year, launched several new products triggering a strong rebound in demand for Liquid Cooling products. With support from supply chain partners, we leveraged the increased activity and lowered cost base to deliver increased profitability and strong cash flow. Our reve-
“Our realistic life-like approach to racing gear is paying off, and we are humbled by the many good reviews and positive feedback of our products and customer service.”
nues of USD 76.3 million for the full year was second highest in the history of the company.
However, the strong demand from OEM customers in 2023 was partly due to an inventory build-up, which is now causing softer demand going into 2024. Early indications point to inventories normalizing in the second half of 2024 with demand gradually improving during the year. These factors are included in our Group revenue development expectation for the year of -5% to +5% compared with 2023.
We continuously seek to optimize Liquid Cooling performance and features at the optimal pricing, for instance, via a constant quest to modularize the use of specific components across many products. Lately, we have experienced increased demand from
some of our larger customers for products with a lower price point for the Chinese market as well as other value-oriented markets. In response to this demand, we plan to deploy products tailored for the lower end of the premium segment within Liquid Cooling complementing our traditional focus on the higher end of the market. This means we broaden the addressable market without compromising the quality that the Asetek brand represents. The value offering tailored for the lower end of the premium market is attached with robust EBITDA margins but
gross margins that are somewhat lower than the historical average. It is important to note that this is a natural development and does not constitute a general price or gross margin pressure on high-end liquid coolers. Rather, it is simply a reflection of demand for Asetek products suited for a new and larger market segment. In this way, we are matching the demand from our customers of price competitive high-quality solutions, retaining customers as well as adding additional revenue. We will see the full effect of this materialize in 2025.
COMMENTS FROM CEO AN NUAL REPORT 2023 / Page 7
Exciting opportunity in a fast-paced market We had our second year of SimSports revenue in 2023, and I am pleased that we managed to deliver almost 400% growth from 2022, although coming from low levels. The growth was driven by multiple new products and customers globally. Our ambition is to offer a full portfolio of products rather than being a niche supplier, a position I believe we will attain by the end of 2024. I expect that we can take pole position within sim racing and build market share by providing a full range of high-quality sim racing products based on an open ecosystem.
In 2021, unbeknown to us, at least two Chinese companies entered the sim racing market with a low-cost offering just ahead of us. This has increased competition, with our entry level product series La Prima now being considered a high-end product line in terms of price, quality and features. The last two years, we have been focused on the high-end market segment, something we will continue to do. That said, we also have a plan to leverage our strong brand name to launch a competitive mass-market
product line, which will act as a driver for long-term growth. I am strongly convinced that the winning strategy is to first anchor our brand name in the premium segment before conquering the mass market. Our realistic life-like approach to racing gear is paying off, and we are humbled by the many good reviews and positive feedback of our products and customer service. I believe it is important to note that 2023 revenue in the SimSports segment was almost the same as our best year ever, during the ten years we invested in the now closed-down Data Center venture. I strongly believe we have a great future ahead of us in SimSports.
When comparing our 2023-revenue of $76 million with 2022-revenue of $51 million, it is important to remember that 2023 did not include any Datacenter revenue. The segment was laid dormant in late 2022 but we retain our knowhow and IP, knowing that we have a very good solution to a global problem. But for now, the world is simply moving too slow despite a lot of talk. Should we one day be presented with a persuading business case,
we will re-evaluate. Going forward, we maintain focus on business activities that have more immediate prospects for profitability.
Next steps
Later in 2024, as summer turns to fall, we will move to our new domicile and development center. The construction is on plan, and the team is obviously excited about the move, which will provide a much better working environment. Asetek is a different company than when the construction was decided back in pre-crisis 2020. We have adapted to this new business environment and market conditions, partly through a leaner, more efficient organization. As a consequence, we are looking forward to greeting a tenant who will utilize our excessive space. In 2023, we raised net USD 16 million as part of financing the new domicile and once completed, we will finalize the mortgage financing. We also took the decision to move our listing venue to Nasdaq Copenhagen to be closer to our biggest shareholders. Because of this we are now in the final phase
of de-listing our shares from Oslo Stock Exchange, a process that will be finalized on March 26. We can already now see the benefits through increased liquidity in the Asetek share in Copenhagen compared to recent years in Oslo. I extend my gratitude to the entire Asetek team for their hard work and dedication during the past year. I also wish to thank all our shareholders for their support. I want to ensure you that we work hard every day to earn your trust, and we are thankful that you share our vision for the company. We are on to an interesting journey, and I am happy that you are a part of this.
Thank you for your interest in Asetek!
André S. Eriksen, Founder and CEO

COMMENTS FROM CEO AN NUAL REPORT 2023 / Page 8
FIVE REASONS TO INVEST IN ASETEK
Asetek is well positioned to capitalize on the its competitive strengths through innovation, operational excellence and a leading position as a premium supplier of high-quality gaming hardware.
1.
Large and growing addressable market
2.
Leveraging a leading premium segment position
Revenue in the gaming hardware market is projected to reach almost EUR 150 billion in 2024 and is expected to expand at an annual growth rate (CAGR) of almost 9% the coming five years 1. Growth is mainly driven by consumer demand for high-performing gaming hardware which enhance gaming experiences. The rise of eSports a a global phenomenon, attracting millions of viewers and generating substantial revenue, in just a few years is another growth driver. Upgrade cycles for high-spend PC builders are about 3–4 years 2, supported by product launch cycles from major graphic card manufacturers, also contributing to demand.
1 https://es.statista.com/outlook/amo/media/ games/gaming-hardware/worldwide
2 https://www.dfcint.com/dfc-issues-2024-gameindustry-outlook/
Asetek has a leading position in the premium segment of the gaming hardware market. Since 2000, we design, manufacture, and sell high-quality liquid cooling solutions to most major PC and Enthusiast gaming brands. In 2021, Asetek expanded its business into the rapidly growing SimSports market for racing simulator gear. Asetek has earned a leading position in the premium segment of both the Liquid Cooling as well as SimSports market. The leading market position combined with our strong brand name and high-quality products can be leveraged into increasing the addressable market. This is accomplished by targeting the low-end of the premium Liquid Cooling market segment and launching a new SimSports product line with strong value offering towards entry-level end-users.
3.
Strong innovation capability supporting future growth
Continuous product development is crucial for maintaining and strengthening competitiveness in an industry that is characterized by competition and technological progress. Asetek is renowned for being an innovative, high-tech and entrepreneurial company that provides products with a very high quality. At Asetek, product development centers around customers’ needs and reflects an innovative engineering approach combined with superior performance. The company has two R&D centers – one in Denmark and one in China. In 2023, Asetek spent 9.7% of total revenue, or USD 7.4 million on R&D, securing continued competitiveness trough future launches of world-class products.
4.
Profitable Liquid Cooling business provides a robust foundation for SimSports growth strategy
Asetek invented the all-in-one liquid cooler and has been solving thermal challenges for almost 25 years. Our business segment Liquid Cooling has over the last 10 years generated total revenues of about $519 million with an average adjusted EBITDA margin of 29%. The profitable Liquid Cooling operation provides a robust financial foundation for the growth strategy of the SimSports business. The strategic fit and synergies between the two segments are visible and will act as a driver for future value creation.
5.
Strong SimSports growth potential
In 2023, the SimSports segment revenue increased by almost 400% compared to 2022. This was due to multiple new products as well as new end-users and re-sellers globally. Growth in 2023 was mainly driven by a combination of multiple new products and a strong increase in new end-users and resellers globally. Gaming simulation is a rapidly expanding segment of the gaming hardware market, with a projected annual growth rate (CAGR) exceeding 15% the coming 6 years 1. Asetek has a clear ambition to grow faster than the market by offering a full portfolio of high-quality products based on an open ecosystem.
1 https://www.alliedmarketresearch.com/ gaming-simulators-market-A06821
ASETEK AS AN INVESTMENT AN NUAL REPORT 2023 / Page 9
ASETEK´S APPROACH TO VALUE CREATION
Asetek’s strategy is based on operational excellence, innovative product development, superior customer service and expansion of the addressable market. In that way we will secure long-term sustainable organic growth. The goal is to be the leading brand in the markets in which we operate.
The strategic framework at Asetek consists of core values, goals, strategic focus areas and operational priorities. By adhering to our strategic framework, Asetek secures a strong platform for long-term sustainable growth.
Core values
The core values at Asetek – innovation and excellence – are rooted in our DNA and have been our guidelines from the start. Asetek was founded almost 25 years ago with the intention of solving problems for our customers. Since then, we believe staying close to our customers’ problems also means being closer to the solution.
Goals
Looking ahead, Asetek has set both a long-term growth ambition and short term financial goals. Asetek has also committed to set sustainability goals, which provides a pathway to reduce emissions in the future. On a group level, we are aiming for a long-term average annual revenue growth of 15 percent. Our market is characterized by low visibility and volatile market dynamics meaning that the growth between different years can vary substantially. That is why we also publish short-term financial goals expressed as our guidance.
Strategic focus areas
Asetek will continue to do what we are best at –launching high-quality gaming hardware products and continue to develop our customer service. At the same time, we plan to expand our addressable market and increasing our marketing and brand building efforts. Additionally, we will also expand the number of SimSports resellers and compete for new OEM Liquid Cooling customers. All these actions will drive organic growth going forward.
Operational priorities
Asetek is a well-established brand name in the premium market segment. We are guided by a strong belief that there are very good opportunities for growth by leveraging our current market position and strong brand name.
In the short to medium term, our operational priorities are to focus on expanding our potential market and revenues both within our Liquid cooling business unit as well as within SimSports. This will be accomplished by new product launches and by updating the existing product range, targeting the low-end of the premium market. Doing this, we will strengthen Asetek’s market position in all product categories and market segments.
Liquid Cooling
SimSports
OUR STRATEGIC FRAMEWORK AN NUAL REPORT 2023 / Page 10
VALUES STRATEGIC FRAMEWORK AT ASETEK Innovation Operational excellence Customer centricity GOALS Long-term growth ambition Short-term financial goals Sustainability goals STRATEGIC FOCUS AREAS
Asetek’s market position Establish new sales channels
our brand name OPERATIONAL PRIORITIES
CORE
Strengthen
Strengthening
Broadening addressable market
Introducing new produt line
A GLOBAL PLATFORM SUPPORTING GROWTH
Asetek’s leading position is based mainly on the competitive strength that originates from the company’s operational excellence in offering high-quality gaming hardware products. During 20 years, Asetek has built up a wealth of experience that is unique among companies in our industry and is recognized for premium quality.
Innovation and product development
Product development is and always has been the main focus for Asetek. Since its inception, the company has successfully launched innovative products with high quality. Asetek’s R&D team and technology lab are based in Aalborg, Denmark. These teams are responsible for innovation, concept and design of our products and also manage collaboration with Asetek’s global customer base to define requirements and develop cutting edge technology. We continuously try to keep our R&D teams close to the customers, which encourages faster, more responsive and effective feedback for improvements to our existing product range as well as new developments. The Aalborg team works closely with the R&D team in Xiamen, China, to identify the optimal sources for the necessary components to fulfill specific customer requirements.
Sourcing and production
Asetek’s manufacturing and logistics team in Xiamen, China, evaluates and sources components and suppliers for the finished product to be assembled, allowing us greater control over product quality. Our cooling solutions are assembled by the company’s principal contract manufacturer based in Xiamen and from 2023, a likewise contract manufacturer produces many of our SimSports products. Asetek’s business model concentrates primarily on having contractual relationship with tier-1 contract manufacturers.
A quality team is divided in two groups: one in Denmark and one in Xiamen. Their main focus is to conduct ongoing inspections to ensure control over all aspects of quality and compliance with a growing number of regulated parameters.
Logistics and sales
Finished products are primarily delivered directly to customer hubs in China, with smaller quantities shipped directly to Europe and USA. Logistics are often outsourced, and except our own webshop for SimSports products, our partners handle deliveries to end-users themselves.
Liquid coolers are sold through two channels. The main sales channel is a white-label approach, meaning products are sold as a standalone product to partners who are in turn selling it under their label. Asetek’s liquid coolers are also sold to partners using it as a component to build a complete PC, which is then sold to end-users. Regarding sale of SimSports products this is done either through our webshop directly to end-users or to resellers, selling both online and via physical stores to end-users.

OUR BUSINESS MODEL EXPLAINED AN NUAL REPORT 2023 / Page 11
Marketing and customer service
The sales, marketing and product management teams, based principally in Denmark, USA and Taiwan, oversee customer relationships to facilitate communication and development, ensuring that the developed product meets or exceeds customer demands.
Considering our history and DNA, Asetek is in many ways synonymous to innovative and
high-quality liquid cooling solutions. As a consequence, our marketing efforts mainly focus on leveraging this position and building the Asetek SimSports brand name. The overall marketing strategy will benefit both SimSports sales channels – currently done through online reviews using influencers and strategic partnerships as well as presence on tradeshows and other key events.
Delighted customers are our best ambassadors, and we know that they happily share their experience and trust in us. Our dedicated marketing and sales teams are responsible for providing customer service and support, making it easier to establish closer relations to them. In the end it is our customers that can tell us how we can provide a premium customercentric experience.
Calgary
• Sales
• Management
• Sales
Silicon Valley
• Product management
• Management
Aalborg
• E-commerce
• Product management
• R&D and prototyping
• Sourcing
• In-house manufacturing
• Quality
• Order management
• Branding and outbound marketing
• Finance
• Management
Austin
• Operations
• Management
Xiamen
• Product management
• R&D
• Sourcing
• Outsourced manufacturing
• Quality
• Order management
Taipei
• Sales
• Product management
Malaysia
• Outsourced manufacturing
• Quality
OUR BUSINESS MODEL EXPLAINED AN NUAL REPORT 2023 / Page 12
offices Asetek representation OEM HQ SimSports resellers
Asetek
GLOBAL DEVELOPMENT CHALLENGES ASETEK’S LOGISTICS
Establishing production in Malaysia and adding webshop hubs in Europe and the USA –ensures an agile supply chain.
The world has not become a more peaceful place, and local and regional conflicts challenge globally-oriented tech companies like Asetek. Asetek produces many components in the Far East, especially China, while selling its finished products worldwide, including high volumes sold in the USA.
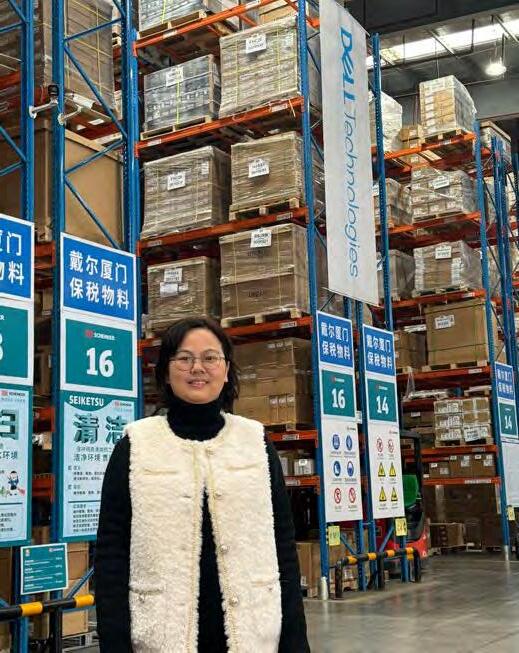
“Specifically, we have seen the freight cost for a container from the East fluctuate wildly between $2,000 and $15,000 within a relatively short period. Likewise, the delivery time for components can now reach up to 400 days, where previously it was very stable at around 100 days. This makes it difficult to price, to enter contracts, and to deliver when the customer needs it,” explains Janice Cheng, Asetek’s Logistics Supervisor in the company’s logistics department in Xiamen, China.
The instability began in earnest with COVID-19. Suddenly there were no people to support docking and transport around the world’s ports, leading to significant bottlenecks. These bottlenecks are still being addressed, as the war in Ukraine and the USA’s skeptical approach to China complicate matters. And then of course, the recent conflict in the Middle East has restricted transport through the Suez Canal, which is the most direct transport from the Far East to Europe.
“If the freight instead has to go all the way around Africa, it requires two additional weeks of delivery time and consequently higher costs from extra wages, extra fuel,” explains Janice Cheng. Besides a very costly air freight alternative, she notes that
the Trans-Siberian freight train option is no longer available due to the Ukraine crisis.
Then there is the issue of the USA’s tariffs on goods produced in China. Like most other tech companies, Asetek has a significant portion of its components manufactured in China.
“Recently, Asetek has established additional production in Malaysia, where we manufacture, test and package our components principally for the USA. We also maintain an extra production line open for risk management purposes. It’s more expensive than producing everything in China but collectively much cheaper for the American market, when we factor in the saved American tariff,” she explains.
Finally, the company has opened two webshop hubs for its growing SimSports business: one primarily for the EU currently in Odense, Denmark, and one in Miami, Florida, for the American market. These geographical locations can be moved relatively quickly depending on where the highest volume customers are located. Packing and shipping to the Asian and Australian markets can now be done from the new production and packaging facility in Johor Bahru, Malaysia.
“Logistics are challenged but not impossible. Good thing we have such skilled and creative people on the task,” concludes Janice Cheng.
LOGISTICS AN NUAL REPORT 2023 / Page 13
LIQUID COOLING AND SIMSPORTS –AN ATTRACTIVE COMBINATION
Our Liquid Cooling business has over the last 10 years generated total revenues of USD 519 million with an average annual adjusted EBITDA margin of 29%. This profitable enterprise provides a robust financial foundation for the growth strategy of our other key business, SimSports.
The profitable Liquid Cooling busniss enables us to execute on the growth opportunities in SimSports. It also also offers a strong strategic fit, enabling synergies between the two business segments and driving future value creation. Synergies include the potential to increase sales in the liquid cooler segment through new sales channels opened by SimSports, as well as bundle SimSports products with liquid coolers in sales to resellers.
White-label and own webshop
main sales channels
Liquid coolers are sold through two channels. The main sales channel is a white-label approach, where OEM partners purchase and resell as standalone products under their own label. We also sell liquid coolers to partners who incorporate them as a key component to build a complete PC, which is then sold to end-users.
Our main SimSports sales channel is our own webshop, where products are sold either directly to end-users or to resellers. Resellers is the other SimSports sales channel, offering our products to end-users through both online and physical stores.
Liquid cooling and SimSports sales channels
LIQUID COOLING
White-label approach to partners
ASETEK SIMSPORTS
Own webshop OEM partners Resellers
LIQUID COOLING AVERAGE ANNUAL ADJUSTED EBITDA MARGIN, LAST 10 YEARS 29%
A LEADING GAMING HARDWARE OFFERING AN NUAL REPORT 2023 / Page 14
End-users End-users
MARKET LEADER WITHIN PREMIUM LIQUID COOLING SOLUTIONS
Asetek invented the all-in-one liquid cooler and has been solving thermal challenges ever since. Since the beginning, liquid coolers from Asetek have delivered high performance while providing superior reliability.
Today, Asetek is a global leader in liquid cooling solutions for computer hardware enthusiasts and gamers. Asetek’s Gaming and Enthusiast products are all-in-one coolers that provide reliable, maintenance-free liquid cooling to gaming and high-performance PC customers as well as eSports athletes to enjoy top-tier performance from their equipment. Through the use of circulating liquid, which by nature is a much stronger heat capacitator than air, Asetek’s products provide significantly higher cooling per consumed wattage than competing products based on air cooling.
The gaming market is expanding and changing, making the definition of a “gamer” more nuanced. While mobile dominates the gaming market, the revenue split across different platforms does not always match the preferences of the core global gaming community. Most core gamers still prefer playing on PC and console as games are more immersive and complex, mainly explained by the fact that only PC/console games enable high-engagement and demanding more focus and dedication from the gamer. However mobile games attract more casual players who enjoy “time killer” games, not identifying themselves as “gamers” 1
Huge market with stable growth
According to forecasts there are an estimated 1.86 billion PC gamers worldwide, up from 1.55 billion PC gaming users five years ago 2. Total revenue in the Gaming Hardware market (including PC, console and accessories) is projected to reach almost €150bn in 2024 and is expected to expand at an annual growth rate (CAGR) of almost 9% the coming five years 3 Growth is mainly driven by consumer demand for high-performing gaming hardware which enhance gaming experiences. An additional growth driver is the strong rise of eSports – which has emerged as a global phenomenon in just a few years, attracting millions of viewers and generating substantial revenue.
What is liquid cooling?
Liquid cooling is a system used to lower the temperature of a computer or other electronic device by circulating a coolant through its internal components. The coolant, which is usually water or a water-based solution, absorbs heat from the PC and carries it away, keeping the PC cooler than if it were relying on air cooling alone.
1 https://www.bcg.com/publications/2023/drivers-of-global-gaming-industry-growth 2 https://www.statista.com/statistics/420621/number-of-pc-gamers/ 3 https://es.statista.com/outlook/amo/media/games/gaming-hardware/worldwide
Source: DFC Intelligence, https://www.dfcint.com/pc-gamer-hardware-spending-2024-by-region/
Why is liquid cooling better than air cooling?
Air cooling systems use a fan and heat sink to move heat away from the CPU. A liquid cooling system uses a water pump and radiator to move heat away from the CPU. The main advantages of liquid cooling compared to air cooling are:
1. Liquid cooling is more efficient at removing heat from components than air cooling
2. Liquid cooling is not affected by dust buildup or other air flow obstructions
3. Liquid cooling is typically quieter than the fans used for air cooling
$69.0 million
LIQUID COOLING AN NUAL REPORT 2023 / Page 15
LIQUID COOLING REVENUE 2023
0 5 10 15 20
LATIN AMERICA WESTERN EUROPE EASTERN EUROPE / MENA CHINA ASIA / RoW
PC
market in
by region (billion USD) TOTA L L IQ UI D C OO L IN G REVENUE, LAST 10 YEARS 12.5 2,8 16,7 14,3 16,4 10,9
NORTH AMERICA
Estimated
gamer hardware
2024,
ASETEK SIMSPORTS – A LEADING OFFERING IN A FAST GROWING MARKET
In 2021, Asetek introduced its first line of sim racing products. In 2023, revenue in the SimSports business segment rose by almost 400% compared to 2022. Growth was mainly driven by a combination of multiple new products and a strong increase in new end-users and resellers globally.
Products for every type of Sim racer
From the start in 2021, Asetek has positioned the SimSports product offering in the high-end of the market, targeting competitive and committed gamers as well as racing and automobile enthusiasts. Asetek’s mission is to make high-quality sim racing products available for everyone, which is why we have three different product lines ranging from entry-level to high-end, giving end-users the opportunity to assemble the preferred sim racing setup.
SIMSPORTS REVENUE 2023
$7.2 million
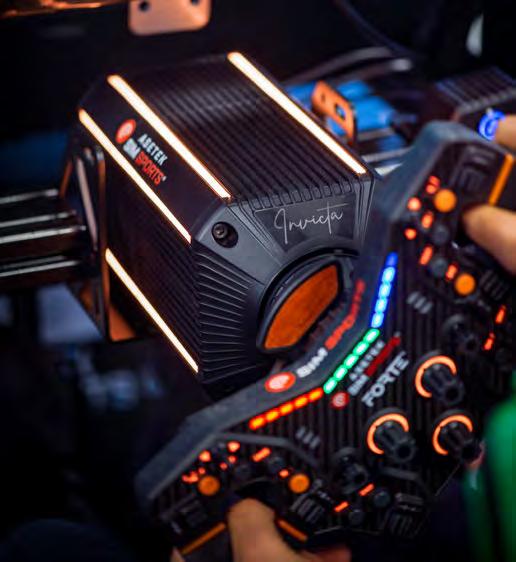
The La Prima Product line is our entry-level solution, which is possible to upgrade and adjust to fit all needs. The Forte Product Line is the mid-tier offering, for end-users that want to maintain high quality in build and design combined with sublime performance and user experience. Invicta is our premium product line, offering an immersive and authentic sim racing experience.
Strong growth opportunity
Gaming simulation is a very fast growing segment in the gaming hardware market, with a projected annual growth rate (CAGR) exceeding 15% the coming 6 yearst. Asetek has a clear ambition to grow considerably faster than the market by offering a full portfolio of high-quality products based on an open ecosystem.
What is sim racing?
Simulator games enable players to experience situations and scenarios in great details and recreate real-world situations. Sim racing (simulation racing) is basically motorsport in a virtual environment. This means that sim racers are driving virtual cars on computer-generated tracks. The sim racing games are designed to mimic the feeling of driving a real car as closely as possible, and the racing is done using specialized software and hardware. The hardware sim racers use plays a crucial role to enhance the realism and overall driving experience.
Learn all sim racing terms
There are a lot of technical terms in sim racing, and motorsports in general. At Asetek’s webpage, you will find a glossary where you are introduced to the most important racing terms, in order to better understand both sim racing and motorsports.
https://www.asetek.com/blogs/glossary-sim-racing-and-motorsports-terms/

https://www.alliedmarketresearch.com/gaming-simulators-market-A06821

SIMSPORTS AN NUAL REPORT 2023 / Page 16
1
NEW SIMSPORTS DIVISION SHOWS STRONG PROGRESS
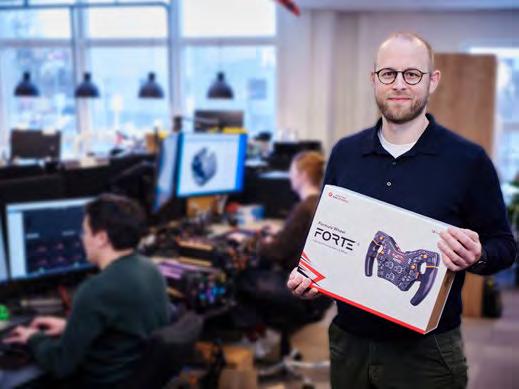
With almost 40 product launches in 2023, Asetek moved much closer to delivering an entire suite of products for the simracing universe.
Asetek SimSports has progressed nicely as a result of product manager Niels Mortensen’s leadership. One and a half years ago, Niels was enticed to join Asetek after winding down his co-ownership of a small toy development company that had achieved success with online sales.
“Asetek saw an idea in hiring me as a kind of coordinator with my unique background as a former owner-manager who had experience with design, production and online sales, and was also a car and motorsports enthusiast,” explains Niels. Within the Asetek organization he serves as a strategic link between different departments. He oversees the product strategy, development pace, and market development. The goals are ambitious, and the pace is fast.
In 2023, Niels contributed to executing and generating sales with close to 40 product launches under Asetek’s three product lines for discerning customers worldwide: Invicta, Forte, and La Prima.
Asetek’s Simsports products make a bold statement by offering users the most realistic simulation of driving a real race car with steering wheels and pedals born out of hands-on (and feet-on...) experiences from motorsport. While not necessarily offering the most cushy gaming experience for those who just want to comfortably game at home on the couch, Asetek’s real racecar feel has truly been a success in the market, and several of the world’s real racing sports practitioners have increasingly embraced it with enthusiasm. Simultaneously, the products have taken reviewers by storm, as the Invicta wheelbase (the system’s heart) was named
the best wheelbase in 2023 by one of the most important reviewers of simulator equipment. By starting with high-end products, Asetek has created a brand value based on high quality and impressive features. Asetek expects to apply these values to other customer and product segments in the future.
“Our products give consumers a unique feeling of driving a real race car, and it feeds the dream of being a real racer. For a fraction of the price of participating in just a single training day on a real track, or for the cost of just a single set of tires, they can now train the entire season, and even several subsequent seasons, at home with our equipment,” explains Niels Mortensen.
The products are so realistic that racecar drivers use them as training tools. This market approach has created a series of genuine and fantastic racing sports ambassadors for Asetek. Professional racers utilizing Asetek gear can inspire their thousands of fans and motorsports enthusiasts.
“Our initial collaboration with Formula 1 driver Kevin Magnussen provided both excellent racer input and jumpstarted public awareness of Asetek SimSports. Our engineers obtain excellent feedback from our own racer, Valdemar Eriksen, and we receive priceless word-of-mouth marketing that is spreading through the racing environment,” tells Niels Mortensen.
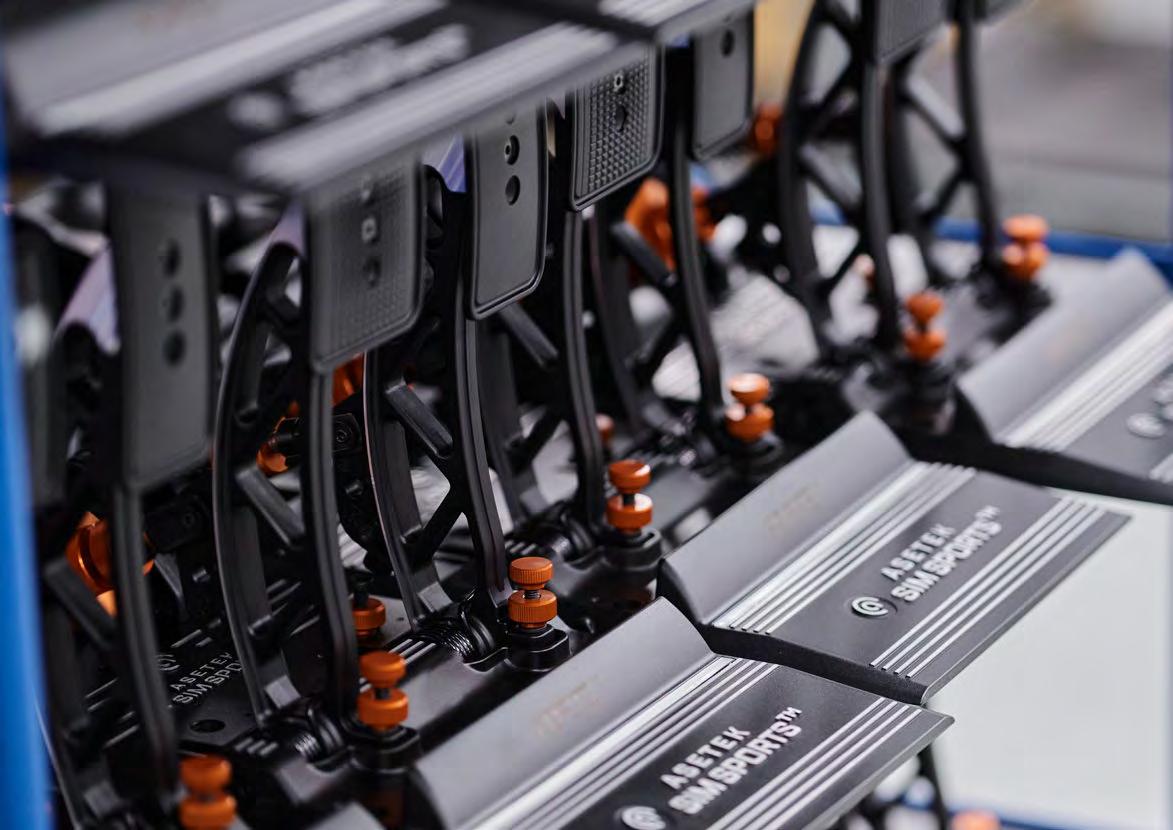
A meaningful steering wheel solution
Today, Asetek offers nearly all necessary components required for gamers to build a complete racer simulator, tailored to the user’s own desires down to the very small details. Asetek offers pedal sets in six variants, four different wheelbases, five steering wheels and accessories for all categories.
Of these products, the steering wheel is the most specialized, and Asetek has so far produced 2 popular models in several variants and has a 3rd wheel with an integrated display on the way. However, the company anticipates that it won’t be able to meet all of the many individual needs for steering wheels – interestingly, this may actually be one of Asetek’s virtues. Niels Mortensen outlines the steering wheel strategy:
“Steering wheels are so personal for each racer that it would be impossible to create only a few steering wheels for universal use by everyone. Instead, the company is taking a different, less compromising route: Asetek is the first and only supplier to deliver a simple quick release adapter that makes it possible, with integrated electronics and interface, to mount most of the existing steering wheels from other manufacturers on our wheelbase and thus integrate them into our ecosystem.”
This approach of opening up to different products helps Asetek ensure a central market position across other products.
SIMSPORTS AN NUAL REPORT 2023 / Page 17
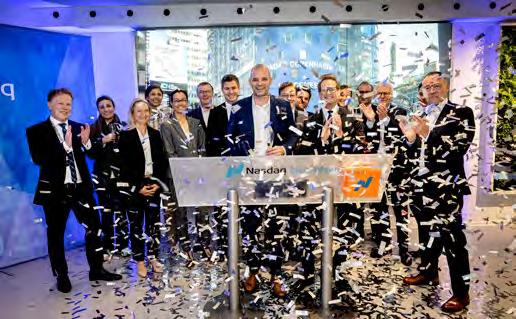
ASETEK SHARES TO BE LISTED ONLY ON NASDAQ COPENHAGEN FROM MARCH 2024
In 2023, the Asetek share was successfully listed on the Nasdaq Copenhagen. As a consequence of this, Oslo Stock Exchange (Oslo Børs) approved the de-listing of Asetek in December 2023. Last day of trading of Asetek shares on Oslo Stock Exchange will be 26 March, 2024.
Rights issue and move to Nasdaq Copenhagen
In May 2023, Asetek raised net proceeds of 16.1 million USD in a fully underwritten rights issue of 71,166,667 new shares at a subscription price of NOK 3 per share.
Since the company’s IPO on February 11, 2013, the Asetek share had been listed on the Oslo Stock Exchange. On May 17, 2023, the share was dual-listed on NASDAQ and Asetek announced the intention to delist its shares from Oslo Stock Exchange. In December 2023, an extraordinarily general meeting approved the de-listing of Asetek’s shares, followed by an approval from Oslo Stock Exchange in the same month. As an effect of both approvals, Asetek shares will be de-listed from Oslo Stock Exchange with effect from March 26, 2024.
Share price development and turnover
The Asetek share trades under the symbol ASTK on both Nasdaq Copenhagen and the Oslo Stock Exchange. The share’s ISIN code is DK0060477263 (Technology: Computer Hardware), segment Small Cap. At the close of 2023, Asetek’s share price was NOK 5.80 in Oslo and DKK 3.90 in Nasdaq Copenhagen. This is equivalent to a market capitalization of NOK 570.2 million (DKK 383.4 million). The highest
price quoted during the financial year of 2023 on Oslo Stock Exchange was NOK 11.20 (August 11) and the lowest price was NOK 2.48 (March 30). In 2023, the total turnover of Asetek shares traded on all marketplaces amounted to 146.4 million shares, corresponding to 149 percent of the total number of shares at December 31, 2023.
Share capital
On December 31, 2023, the share capital in Asetek amounted to DKK 9,831,389.20 divided into 98,313,892 shares with a nominal value of DKK 0.10. All shares are of the same class and the same share of capital and earnings. Each share entitles the holder to one vote at the General Meeting and each shareholder is entitled to vote for all shares held by the shareholder.
Ownership structure
At the end of 2023, the ten largest shareholders controlled 32.76 percent of the capital and votes. Board members and executive management held a total of 4.2 percent of the capital and votes. Other members of management held an additional 1.09 percent of the capital and votes. The total number of shareholders in Asetek was 5,362 at December 31, 2023.
ConcentrationShares
The 30 largest owners 44,058,657 46.48%
Share repurschases
In 2023, no shares were repurchased. As of December 31, 2023, Asetek holds a total of 1,256,115 treasury shares.
Investor Relations (IR) at Asetek
Aseteks’ goal is that the company should be valued on the basis of relevant, correct and current information. This involves a clear financial communication strategy, reliable information and regular contact with various stakeholders in the financial markets. The management and Board of Directors of Asetek have a clear ambition to keep an ongoing dialog with the media and the capital market. This takes place through presentations of quarterly reports and meetings with analysts, investors and the media at various events, seminars, one-on-one
meetings and during visits to Asetek offices. Interested parties can download presentation materials and listen to audio recordings from presentations of quarterly reports on Asetek’s website.
Financial information regarding Asetek is available to download from https://ir.asetek.com/overview/default.aspx. This includes financial reports, press releases and other presentations. The company’s press releases are distributed via Cision and are also available on the company’s website.
Financial calendar 2024
April 30, 2024 Q1 2024 financial report
April 30, 2024 Annual General Meeting
August 13, 2024 Q2 2024 financial report
November 7, 2024 Q3 2024 financial report
March 7, 2025 Q4 and annual 2024 financial report
Shareholder contact
Per Anders Nyman, Head of Investor Relations
Mobile: +45 2566 6869
investor.relations@asetek.com
SHARE PRICE DEVELOPMENT AND TURNOVER AN NUAL REPORT 2023 / Page 18
Capital and votes
owners 32,208,033 32.76%
owners 40,154,145 41.68%
The 10 largest
The 20 largest
Private Individuals 20.7%
Fund company 15.5%
Other 13.5%
Pension & Insurance 13.2%
Investment & PE 1.6%
Treasury Shares 1.3%
Unknown owner type 34.3%
Source: Monitor by Modular Finance AB.
Foreign ownership 42.5%
Danish ownership 54.5%
Norwegian ownership 3.0%
Source: Monitor by Modular Finance AB.
Aquis 0.7%
Cboe Global Markets 11.6%
Euronext 43.6%
ITG 0.2%
LSE Group 1.8%
Nasdaq 42.1%
Sigma-X 0.04%
Source: Monitor by Modular Finance AB.
Source: Monitor by Modular Finance AB.
ASETEK SHARE AND OUR SHAREHOLDERS AN NUAL REPORT 2023 / Page 19
distribution Holding size SharesCapital and votes 1 –1,000 1,011,962 1.03% 1,001–5,000 3,270,488 3.33% 5,001–10,000 2,768,421 2.82% 10,001–100,000 11,425,012 11.75% 100,001–500,000 9,011,494 11.10% 500,001–1,000,000 5,506,149 5.60% 1,000,001–5,000,000 16,523,186 16.81% 5,000,001–10,000,000 7,028,893 7.15% 10,000,001– 11,844,051 12.05% Unknown holding size 29,924,236 28.37% Total 98,313,892 100.00%
Shareholding
2023 2022 2021 2020 72.7 79.8 50.6 76.3 Revenue per year, $ million Owner
distribution Q4 Q3 Q2 Q1 14.8 24.5 20.5 16.5 Revenue per quarter, $ million Q4 Q3 Q2 Q1 2.8 6.2 4.8 2.1 Adjusted EBITDA per quarter, $ million
Source: Monitor by Modular Finance AB.
type
Volume per market Foreign ownership
0 2 4 6 8 10 12 Jan 23 NOK Feb23Mar23Apr23May23 Jun23Jul23 Aug23Sep23Oct23Nov23Dec23
Share price development 2023
MOVING ASETEK’S SHARE TO NASDAQ COPENHAGEN WAS A SUCCESS
The listing in Copenhagen provided both the expected proceeds from the simultaneous capital increase and created more trading in the share.
On May 17th last year, a significant financial event occurred for Asetek when the share was listed on NASDAQ Copenhagen. Since the company’s IPO in 2013, Asetek share had been listed on the Oslo Stock Exchange.
“Asetek was initially listed in Norway, where it made sense in the financial environment at the time. Since then, both Asetek and the conditions at the stock exchange in Copenhagen have changed, making a listing in Copenhagen increasingly relevant. And since we conducted a capital increase, noting that we are a Danish company, we found the timing appropriate to make the change,” says Asetek’s CEO, André Sloth Eriksen.
As expected, the move turned out to be complex, though well-prepared. The legal systems of two countries and two stock exchanges – four sets of rules had to be considered. The switch required a lot of documentation work and also an extended transition period to March 2024 – during when the company have a temporary dual listing in both Oslo and Copenhagen.
“Today, we can happily state that the decision has been a success. Many shareholders have transferred their shares, and at the same time, we can see that trading volumes and interest in the share, as expected, has increased,” explains Asetek CFO, Peter Dam Madsen, who has been overall responsible for the successful process at Asetek. He continues:
“Moving the share listing to Copenhagen specifically aimed to bring us closer to Danish institutional and private investors and strengthen our position in terms of delivering on our long-term ambitions for growth and value creation. Although Asetek is globally oriented, its principal shareholder base is Danish. Thus, it makes most sense today that the share is listed in Copenhagen. This change also eliminates the foreign currency risk for Danish shareholders.”
From Garage to Headquarters
André Sloth Eriksen founded Asetek over 20 years ago with the invention of VapoChill, the precursor to the all-in-one water cooler. It happened in his parents’ garage in Brønderslev, 40 km north of Aalborg. The company has since grown and expanded its physical presence in Denmark, while evolving into a global leader in mechatronic innovation, delivering products based on passion, precision, and performance. And now, further expansion to a new global headquarters will take place later in 2024. The capital increase in 2023 generated the expected net proceeds of 16.1 million US dollars, helping to finance the new facility.
Today, Asetek technology cools the CPUs and GPUs in advanced gaming PCs from global brands like Dell Alienware and is incorporated into the offerings from enthusiast PC equipment providers such as ASUS and NZXT. The sim racing product line reflects the merging of mechatronic competencies and the company’s deep knowledge of the gaming market. The products have received enthusiastic feedback from the global sim racing audience.

LISTING AT NASDAQ COPENHAGEN AN NUAL REPORT 2023 / Page 20
NEW DOMICILE SUPPORTS CREATIVITY
The construction is nearly complete, and Asetek’s team in Aalborg is eagerly anticipating their move into the architectural and engineering gem that, beginning this fall, will become Asetek’s new prominent headquarters on the southern outskirts of Aalborg. It is conveniently located close to the E45 motorway and the rest of the world.

There’s an increasingly pressing need for more square footage at the current headquarters in Aalborg. Asetek’s home since 2013, it requires ever greater agility to navigate among the many desks and workstations that have gradually been squeezed together.
The new headquarters, which was put on the drawing board in 2020, is designed and built to accommodate the planned future growth of Asetek. With extra room to spare for a larger organization, the current employees will enjoy plenty of space on
the 14,000 square meters, 20 percent of which have been leased to other businesses until Asetek grows into it.
The building is designed by the internationally renowned Danish architectural firm Arkitema, which has expressively drawn inspiration from Asetek’s DNA. “The facade’s many vertical lines resemble cooling grilles, which characterize some of Asetek’s core products,” the architectural firm notes. The domicile is being constructed by TL Byg with additional engineering assistance from Cowi.
Asetek’s management is excited about the significant and soon-to-be-ready headquarters:
“We are convinced that an optimal environment for our employees leads to the best and most creative work process and, ultimately, the best results. Our product engineers will have ample space for technology development, including fully equipped laboratories and photo studios. The basement of the new domicile will be ideal for an active state-ofthe-art Asetek Simsports academy, utilizing our own products. Our new headquarters and Development
Center will provide an experience that can both inspire our team and hopefully also help attract future top-tier employees,” explains Asetek CEO André Sloth Eriksen.
The move is expected in the third quarter of 2024.

NEW HEADQUARTERS AND R&D CENTER AN NUAL REPORT 2023 / Page 21
MANAGEMENT REPORT Management report 23 Corporate Governance 25 Risk management 30 Corporate Social Responsibility 33 Five year summary 34
MANAGEMENT REPORT
PERFORMANCE IN 2023
Profit and loss
Total revenue for 2023 was $76.3 million, representing an increase of 51% from 2022 ($50.7 million).
Sealed loop cooling unit shipments for 2023 totaled 1.17 million compared with 0.8 million in 2022. Revenue and unit shipment changes reflect increased shipments of liquid cooling products. Average Selling Prices (ASP) for liquid coolers in 2023 increased to $59.29 from $56.21 in 2022.
Gross margin was 45.5% in 2023 compared with 41.0% in 2022. The change reflects a richer product
mix, reduced costs and favorable exchange rates. In 2023, total operating expense decreased by 3% to $25.3 million, from $26.2 million in 2022. Operating expense in 2023 included net one-time charges of $0.8 million associated with the Company’s dual listing on Nasdaq Copenhagen in May 2023. The change in operating expense was principally due to reduced legal costs associated with intellectual property defense and reduced personnel costs.
Personnel expense decreased 3% in 2023 compared with 2022. Legal cost incurred associated with intellectual property settlements, defense of existing IP and securing new IP was $0.2 million in
2023 ($3.4 million in 2022). Share-based compensation cost associated with warrants and options issued to employees was $0.5 million in 2023 ($0.4 million in 2022).
Adjusted EBITDA was $15.9 million in 2023, compared with $0.8 million loss in 2022. Adjusted EBITDA in 2023 represents operating income of $9.4 million, plus depreciation of $5.1 million, plus share-based compensation of $0.5 million, plus one-time cost of $0.8 million associated with dual listing on Nasdaq Copenhagen.
Foreign currency transactions in 2023 resulted in a $1.0 million loss ($0.3 million loss in 2022).
As a result of the operating income, income tax expense was $2.5 million in 2023, compared with $1.6 million benefit in 2022. Income tax expense in 2023 includes $0.8 million associated with the U.S. Global Intangible Low-Taxed Income (GILTI) inclusion, which requires U.S. companies to report foreign corporation intangible income that exceeds 10% return on foreign invested assets.
Asetek had a total comprehensive income of $6.7 million for 2023, compared with total comprehensive loss of $6.3 million in 2022. Comprehensive income included a positive $0.7 million translation adjustment in 2023 (negative $2.0 million in 2022).

MANAGEMENT REPORT ASETEK Annual Report 2023 / Page 23
Balance sheet
Asetek’s total assets at December 31, 2023 were $102.7 million, compared with $78.6 million at the end of 2022. The principal factors affecting the change were as follows: Property, plant and equipment increased by $22.8 million as a result of building construction for a future development center and headquarters facility; Inventory increased by $2.1 million due to increased investment to support higher sales volumes; Trade receivables increased by $1.8 million due to higher sales in the fourth quarter of 2023 compared with the same period of 2022. These increases were partly offset by utilization of deferred tax assets and other receivables.
Total liabilities increased by $0.7 million in 2023, due to offsetting factors. Short-term debt decreased by $4.2 million and long-term debt increased by $0.9 million as a result of refinancing and principal payments on lines of credit. Trade payables increased by $3.9 million due to increased production volumes and continued proactive management of vendors.
Working capital (current assets minus current liabilities) totaled negative $3.2 million at December 31, 2023 (negative $6.3 million in 2022). The change reflects improved operating cash flow during 2023.
Statement of cash flows
Net cash provided by operating activities was $16.3 million in 2023 ($8.4 million used in 2022). The change was principally due to net income generated in 2023 resulting in increased cash receipts from higher revenue.
Cash used by investing activities was $27.4 million compared with $25.4 million used in 2022. Investment in construction of a future development center and headquarters facility continued in 2023, with additions totaling $22.8 million ($19.7 million invested in 2022). Additions to capitalized
assets under development associated with future products decreased by $0.8 million from 2022.
Cash provided by financing activities was $12.3 million in 2023 compared with $18.3 million provided in 2022. In May 2023, Asetek issued 71.2 million new common shares in a rights offering, raising net proceeds of $16.1 million. This was partly offset by $2.9 million of net payments on lines of credit associated with construction of a new development center and HQ facility ($18.6 million additions to lines of credit in 2022).
Net increase in cash and cash equivalents was $1.7 million in 2023, compared with decrease of $15.9 million in 2021. Cash and cash equivalents at December 31, 2023 was $9.1 million ($7.4 million in 2022).
Liquidity and financing
In 2023, the Company had operating income of $9.4 million and as of December 31, 2023, has working capital of negative $3.2 million and non-current liabilities of $2.6 million.
Included in current liabilities is $14.7 million of debt related to facilities construction, which was subsequently refinanced in January 2024 to be due and payable January 1, 2025. At that time, the Company expects to convert the loan to a long-term mortgage.
In May 2023, the Company issued 71.2 million new common shares in a rights offering, raising net proceeds of $16.1 million.
While there is no assurance that the Company will generate sufficient revenue or operating profits in the future, Asetek’s management estimate that the Company’s cash position and the liquidity available from its operations, external borrowings and other sources currently available is sufficient to satisfy its working capital requirements for the foreseeable future, based on financial forecasts. To the extent necessary to fund expansion or
other liquidity needs, management will consider offerings of debt, equity, or a combination thereof, depending on the cost of capital and the status of financial markets at that time.
2023 RESULTS vs. EXPECTATIONS
In the 2022 report, the Company communicated expectations of revenue growth between 5% to 15% for 2023, with expected operating income of between $2 and $4 million. During 2023, consumer demand exhibited more strength than originally expected, and the economy generally stabilized. As a result, the Company updated its outlook a few times during the year, increasing its expectations for revenue and operating income. The Company’s last outlook provided in the Q3 2023 earnings release estimated revenue growth of 40% to 45% and operating income of $8 to $9 million for 2023. Due to sustained consumer demand at the end of 2023, the Company’s actual results reflected revenue growth of 51% and operating income of $9.4 million, which exceeded management’s expectations.
EXPECTATIONS FOR 2024
The macro-economic environment in the beginning of 2024 is continuing to show signs of improvement, although the picture is mixed in different regions. Geo-political tensions are still causing some market volatility and uncertainty, somewhat dampening discretionary consumer spending.
As stated in previous years, future revenue visibility remains low. In the latter part of 2023, strong demand from major OEM customers reflected their build-up of inventory levels. The higher inventory levels heading into 2024 are resulting in softer demand for Asetek products, with indications pointing to more normalized inventory levels and customer demand in the second half of 2024. Considering the above factors, revenue development for 2024 at the Group level is expected to be in the range of -5% to
5% compared with 2023. The Group 2024 revenue outlook is derived from expected revenue development in the Liquid Cooling segment in the range of -10% to 0%, and for the SimSports segment revenue growth in the range of 40% to 60% compared with 2023. Adjusted EBITDA margin for the Group is expected to be in the range of 12% to 17%.
MANAGEMENT REPORT ASETEK Annual Report 2023 / Page 24
CORPORATE GOVERNANCE
The objective of corporate governance is to ensure that Asetek is managed as efficiently as possible in order to create shareholder value. This is achieved through a clear division of responsibilities between the Annual General Meeting, the Board and the executive management, as well as through clear regulations and transparent processes.
Framework for corporate governance
In this process, Asetek uses the corporate governance recommendations from Nasdaq Copenhagen as an important source of inspiration. The recommendations can be found at: http://www.nasdaqomx.com/listing/europe/surveillance/copenhagen/corporategovernance
The Board of Directors is fundamentally in full agreement with Danish Committee on Corporate Governance recommendations for good company governance. Asetek endeavors to follow the relevant recommendations for the Company, which support the business and ensure value for the Company’s stakeholders. The statutory report on Corporate Governance, cf. section 107b of the Danish Financial Statements Act, is available on the Company’s website: https://ir.asetek.com/Corporate-Governance-Statement-2023/
Communication between the Company and its shareholders
The communication between Asetek and shareholders primarily takes place at the Company’s Annual General Meeting and via company announcements. Asetek shareholders are encouraged to subscribe to the e-mail service to receive company announce-
ments, interim management statements, interim reports and annual reports as well as other news via e-mail.
The general meeting
The General Meeting has the final authority over the Company. The Board of Directors emphasize that shareholders are given detailed information and an adequate basis for the decisions to be made by the General Meeting.
The General Meeting elects the Board of Directors, which currently consists of five members. The board members are elected for one year at a time with the option for re-election.
Amendment of Articles of Association
Unless otherwise required by the Danish Companies Act, resolutions to amend the Articles of Association must be approved by at least 2/3 of the votes cast as well as at least 2/3 of the voting share capital represented at the General Meeting.
Board responsibilities
The Board of Directors’ main tasks include participating in, developing, and adopting the Company’s strategy, performing the relevant control functions and serving as an advisory body for the executive management. The Board reviews and adopts the Company’s plans and budgets. Items of major strategic or financial importance for the Company are items processed by the Board. The Board is responsible for hiring the CEO and defining his or her work instructions as well as setting of his or her compensation. The Board periodically reviews the
Company’s policies and procedures to ensure that the Group is managed in accordance with good corporate governance principles, upholding high ethics.
Financial reporting
The Board of Directors receives regular financial reports on the Company’s business and financial status.
Notification of meetings and discussion of items
The Board schedules regular meetings each year. Ordinarily, the Board meets eight to ten times a year, of which four are quarterly update teleconferences. The meetings are typically conducted at either the facility in Aalborg, Denmark or via telephone. Additional meetings may be convened on an ad hoc basis.
All Board members receive regular information about the Company’s operational and financial progress in advance of the scheduled Board meetings.
The Board members also regularly receive operations reports and participate in strategy reviews.
Danish Recommendation for Corporate Governance 20232022
Participation:
Complies with recommendations 3838
Explanation provided 22
The Company’s business plan, strategy and risks are regularly reviewed and evaluated by the Board. The Board Members are free to consult the Company’s senior executives as needed.
Ordinarily, the Chairman of the Board proposes the agenda for each Board meeting. Besides the Board Members, Board meetings are attended by the Executive Board.
Other participants are summoned as needed. The Board approves decisions of particular importance to the Company including the strategies and strategic plans, the approval of significant investments, and the approval of business acquisitions and disposals.
Conflicts of interest
In a situation involving a member of the Board personally, this member will exclude him or herself from the discussions and voting on the issue.
Use of Committees
Currently, the Company has a Nomination Committee, an Audit Committee and a Compensation Committee.
CORPORATE GOVERNANCE ASETEK Annual Report 2023 / Page 25
// The Nomination Committee is elected directly by the General Meeting. The Committee consists of three members and must be independent from the Board of Directors and the management, however, it is recommended that the chairman of the Board of Directors is a member. The tasks include proposing candidates for the Board of Directors, propose remuneration for the Board of Directors as well as perform the annual assessment of the Board of Directors. Members: Ib Sønderby (chairman), Claus Berner Møller and René Svendsen-Tune.
Nomination committee meetings
Meetings held during the year: 4
Participation:
Ib Sønderby (chair) (independent)100%
Claus Berner Møller (independent)100%
René Svendsen-Tune joined board May 9, 2023, no meetings held since he joined. N/A
Jukka Pertola (attended all four meetings during committee term which ended May 9, 2023
1) Joined board 9 May, 2023. Attended all meetings since joining
2) Attended all meetings through term, which ended 9 May, 2023
The Board’s self-evaluation
100%
// The Audit Committee is elected among the members of the Board of Directors and has responsibilities related to financial reporting, the independent auditor, internal reporting and risk management, including cybersecurity risks. The Committee consists of at least two shareholder elected Board members. Members: Maria Hjorth (chair), Erik Damsgaard.
// The Compensation Committee has responsibilities related to developing proposals for the applicable remuneration policy and remuneration of the Management Board. Members: Jukka Pertola (chairman) and René Svendsen-Tune.
The Board’s composition, competencies, working methods and interaction are discussed on an ongoing basis and evaluated formally on an annual basis. In this connection, the Board also evaluates its efforts in terms of corporate governance.
The composition of the Board is considered appropriate in terms of professional experience and relevant special competences to perform the tasks of the Board of Directors. The Board of Directors continuously assesses whether the competencies and expertise of members need to be updated. All of the members are independent persons, and none of the Board members participates in the day-to-day operation of the Company. At the 2023 Ordinary General Meeting on May 9, 2023, Mr. René Svendsen-Tune was elected to the Board, receiving 99% of the votes cast. Mr. Svendsen-Tune was elected Chairman of the Board by the Board of Directors on May 9, 2023.
Risk management
Refer to the Risk Management section of the Management Report as well as Note 3 of the consolidated financial statements.
Internal audit
The need for an internal audit function is considered regularly by the Audit Committee. However, due to the size of the Company and the established control activities, the Audit Committee so far considers it unnecessary to establish an independent internal executive audit board. As part of risk management, Asetek has a whistle-blower function for expedient and confidential notification of possible or suspected wrongdoing.
Name Elected IndependentShare holdingsBoard meetings Compensation committeeAudit committee René Svendsen-Tune1 2023 Yes 241,842 6/6 6/6Erik Damsgaard 2019 Yes 145,267 12/12 - 4/4 Jukka Pertola 2019 Yes 164,171 12/12 8/8Maria Hjorth 2019 Yes 39,685 12/12 - 4/4 Maja Sand-Grimnitz 2022 Yes 53,583 12/12 -Jørgen Schmidt2 2012 Yes 6/6 2/2 -
CORPORATE GOVERNANCE ASETEK Annual Report 2023 / Page 26
BOARD OF DIRECTORS SHARE AUTHORIZATION
Meeting Date Meeting TypeAction Shares Nominal Value Price April 23, 2014 Board Board issues warrants to employees and Board members 118,210 DKK 0.10/share NOK40.10 August 12, 2014 Board Board issues warrants to employees and Board members 32,970 DKK 0.10/share NOK33.90 August 11, 2015 Board Board issues warrants to employees and Board members 700,000 DKK 0.10/share NOK10.50 April 29, 2016 Board Board issues warrants to employees and Board members 600,000 DKK 0.10/share NOK19.50 April 25, 2017 Board Board issues warrants to employees and Board members 509,687 DKK 0.10/share NOK76.25 July 7, 2017 Board Board issues warrants to employees 106,999 DKK 0.10/share NOK113.00 April 25, 2018 General Board authorized to acquire the Company's own shares October 31, 2018 Board Board introduces employee stock option program to replace warrant program and issues options to employees 378,500 DKK 0.10/share NOK46.30 April 10, 2019 General Board authorized to acquire the Company's own shares September 8, 2019 Board Board issues options to employees 494,900 DKK 0.10/share NOK24.70 April 22, 2020 General Board authorized to acquire the Company's own shares April 23, 2020 Board Board issues options to employees 320,300 DKK 0.10/share NOK38.33 April 21, 2021 Board Board issues options to employees 216,300 DKK 0.10/share NOK100.15
22, 2021 General Board authorized to acquire the Company's own shares April 28, 2022 General Board authorized to acquire the Company's own shares September 7, 2022 Board Board issues options to employees 376,500 DKK 0.10/share NOK15.04 March 8, 2023 Board Board authorized capital increase to raise DKK140 million in fully underwritten rights issue71,166,167DKK 0.10/share NOK3.00 May 9, 2023 General Board authorized to acquire the Company's own shares December 12, 2023 Board Board issues options to employees 2,956,850 DKK 0.10/share DKK4.07 CORPORATE GOVERNANCE ASETEK Annual Report 2023 / Page 27
April
BOARD OF DIRECTORS
Executive and other positions held
RENÉ SVENDSEN-TUNE, CHAIRMAN
Nilfisk A/S - CEO and Member of the Board
Stokke As - Chairman of the Board
NKT A/S - Deputy Chairman
Committee participation: Compensation; Nomination
Asetek equity holdings: 241,842 owned shares
2023 cash compensation: $41,763
ERIK DAMSGAARD, VICE CHAIRMAN
OJ Group of companies - Managing director
Bitzer Electronices A/S - Managing director
Masentia Group of companies - Chairman of the Board
Tentoma A/S - Member of the Board
ED Management Holding ApS - Owner and Managing director
ED Management ApS - Owner and Managing director
CRD Invest ApS - Managing director
TRD Invest ApS - Managing director
Committee participation: Audit
Asetek equity holdings: 145,267 owned shares
2023 cash compensation: $55,000
JUKKA PERTOLA, BOARD MEMBER
Tryg A/S and Tryg Forsikring A/S - Chairman of the Board
COWI Holding A/S - Chairman of the Board
Siemens Gamesa Renewable Energy A/S – Chairman of the Board
GN Store Nord A/S - Chairman of the Board
Committee participation: Compensation (chair)
Asetek equity holdings: 164,171 owned shares
2023 cash compensation: $52,150
Age and gender Qualifications
68 Male Former CEO at GN Store Nord A/S for 8 years; International management, Management of listed companies, Specialist expertise in technology, service businesses, large account sales and strategy development with sustainability focus.
Date appointed to end of current term Independence status
May 9, 2023 to April 30, 2024 Independent
59 Male 20+ years of senior positions in electronics & electrical manufacturing, business development. April 10, 2019 to April 30, 2024 Independent
64 Male Former executive at Siemens A/S for 25+ years; Technology, Finance, Corporate governance, Risk management. Extensive board experience with multiple Chairman roles for 10+ years.
April 10, 2019 to April 30, 2024 Independent
CORPORATE GOVERNANCE ASETEK Annual Report 2023 / Page 28
BOARD OF DIRECTORS
Executive and other positions held
MARIA HJORTH, BOARD MEMBER
Thylander Gruppen A/S - Chairman of the Board
Maj Invest Holding A/S - Board Member
Trifork Holding AG - Board Member
Topdanmark A/S - Board Member
Top-Danmark-Fonden - Board Member
Adform A/S - Board Member
Nolu Holding ApS - Managing director
Committee participation: Audit (chair)
Asetek equity holdings: 39,685 owned shares
2023 cash compensation: $45,000
MAJA FRØLUNDE SAND-GRIMNITZ, BOARD MEMBER
Consultant, private practice
Committee participation: Audit
Asetek equity holdings: 53,583 owned shares 2023 cash compensation: $45,000
Age and gender Qualifications
51 Female Board Professional, Former CEO Mercer Denmark, 20+ years in finance covering business development, M&A, investor relations.
Date appointed to end of current term Independence status
January 14, 2019 to April 30, 2024 Independent
43 Female Experienced commercial marketing leadership in B2C (FMCG, Consumer tech, Sports & Entertainment). Expertise in Brand GTM strategy, commercial growth, process & organizational development and implementation.
June 15, 2022 to April 30, 2024 Independent
CORPORATE GOVERNANCE ASETEK Annual Report 2023 / Page 29
RISK MANAGEMENT
Asetek’s potential to realize the Company’s strategic and operational objectives are subject to a number of commercial and financial risks. Asetek is continuously working to identify risks that can negatively impact the Company’s future growth, activities, financial position and results as well as CSR-related risks. Asetek conducts its business with significant focus on continuous risk monitoring and management.
The overall goal of risk management is to ensure that the Company is run with a level of risk, which is in a sensible ratio to the activity level, the nature of the business, and the Company’s expected earnings and equity. To the largest extent possible, Asetek tries to accommodate and limit the risks which the Company can affect through its own actions.
Insurance
It is the Company’s policy to mitigate significant risk areas with commercially available insurance products. This currently includes insurance for product liability, operating material and inventory as well as compulsory coverage, which varies from country to country. Management assessments indicate that the necessary and relevant precautions have been taken to thoroughly cover insurance issues. Asetek’s insurance policies and overall coverage approach are reviewed at least annually.
Below, some of the risk factors management considers as being of special importance to the Group are described in no specific order.
CSR-related risks
Please see the separate Asetek Sustainability Report 2023 for identified risks and remedies.
Capital resources and indebtedness
As of December 31, 2023 the Company has total debt of $18.4 million, of which $16.2 million is associated with the construction of a new development center and HQ facility, and outstanding commitments for additional construction costs totalling DKK 26.3 million ($3.9 million). The Company’s construction loan is based on a variable interest rate (Danish CIBOR 3) and, after its refinancing in January 2024, matures on January 1, 2025. At that time, the Company expects to convert the loan to a long-term mortgage. Construction of the facility is expected to be completed in mid-2024, with sections of the facility not utilized by Asetek to be leased to external tenants.
Economic recession
A general slowdown in the global economy, including a recession, inflation or a tightening of the credit markets could negatively impact Asetek’s business, financial condition and liquidity. Adverse global economic conditions have caused or exacerbated significant slowdowns in the markets in which the Company operates, which have adversely affected Asetek’s results of operations in the past. Macroeconomic weakness and uncertainty also make it more difficult for management to accurately forecast revenue, gross margin, and expenses. Further economic downturn or increased uncertainty may also lead to increased credit and collectibility risks, reduced availability of capital and credit markets, reduced liquidity and potentially adverse impacts on Asetek’s suppliers.
Investment in SimSports
In 2020 and 2021, Asetek acquired technology and intellectual property in support of the Company’s entrance into the fast-growing SimSports gaming market. In March 2022, the Company shipped the first of its SimSports products and released several new products in 2022 and 2023. Revenue generated from SimSports products totaled $7.2 million in 2023, approximately 9% of the Group’s total revenue for the year. The SimSports segment is not yet profitable, generating an adjusted EBITDA loss of $6.7 million in 2023. There is no assurance that the SimSports segment will generate operating profits in the future.
Customer concentration
In 2023, three customers accounted for 38%, 24% and 13% of total revenue. In the event of a decline or loss of any of these customers, replacement of the revenue stream would be difficult for Asetek to achieve in the short term. The Company is actively working with its other customers to grow their respective market shares and order volumes.
Competition
The markets in which the Company operates are competitive, the technological development is rapid, and the Company may in the future also be exposed to increased competition from current market players or new entrants.
Credit risk
Credit risk is the risk of a counterpart neglecting to fulfill its contractual obligations and in so doing imposing a loss on Asetek. The Group’s credit risk
originates mainly from receivables from the sale of products as well as deposits in financial institutions. Receivables from the sale of products are split between many customers and geographic areas.
Three customers represented 35%, 16% and 12% of trade receivables at December 31, 2023. A systematic credit evaluation of all customers is conducted, and the rating forms the basis for the payment terms offered to the individual customer. Credit risk is monitored centrally.
Intellectual property defense
Asetek has filed and defended lawsuits against competitors for patent infringement. While some of the cases have been settled or dismissed, some may continue, and new cases may be initiated. Such cases may proceed for an extended period and could potentially lead to an unfavorable outcome to Asetek. Asetek has historically incurred significant legal costs associated with litigation and may continue to do so in the future to the extent management believes it is necessary to protect intellectual property.
New chip releases
Asetek’s liquid cooling revenue is dependent upon timely releases by major suppliers of new GPU’s and CPU’s. In recent years, the global economy was subject to an unprecedented shortage of semiconductor chips due to production constraints and increased demand brought on by accelerated digital transformation. This shortage negatively impacted demand – Asetek’s OEM customers waiting for components were limited in their ability to build products with Asetek coolers; and end users who were
RISK MANAGEMENT ASETEK Annual Report 2023 / Page 30
waiting for new GPUs were delayed in purchasing new liquid coolers. The global chip shortage eased in 2023; however, the Company’s revenue continues to be dependent upon timely releases of GPU’s and CPU’s, and future shortages could negatively impact customer demand.
Manufacturing supply
Asetek relies upon suppliers and partners to supply products and services at competitive prices. Supply constraints, such as shutdowns in China and disruptions in the global supply chain may increase component costs and limit the Company’s ability to fulfill customer demand.
Asetek’s liquid cooling products have been historically assembled in Xiamen, China by a single contract manufacturer which may be difficult to substitute in the short term if the need should arise. Suppliers are proactively managed by the Company’s operations teams based in Xiamen and Aalborg. In the second quarter of 2023, the Company began outsourced manufacturing of certain products in Malaysia.
U.S. import tariffs
The U.S. has imposed a 25% tariff on imports of goods manufactured in China, which include Asetek products. The existence of the tariff has contributed
to market uncertainties, particularly in the liquid cooling segment. The Company continues to work to minimize the impact of the tariff on Asetek and its customers.
Foreign exchange rates
Substantially all of Asetek’s revenue is billed in USD. However, many customers resell Asetek products to end users in countries where USD is not the transactional currency. As a result, there is a risk that fluctuations in currency will affect the cost of product to the end user and negatively impact market demand for Asetek products. Asetek estimates
that about one third of its sold products ultimately are delivered in Europe or Japan, which are the two geographical areas which could have the largest potential impact due to USD fluctuation. Asetek believes that other factors in the end users’ buying decision play a larger role than price fluctuation on the liquid cooling component. During 2023, the USD weakened against both the DKK and EUR by 3% and strengthened against the Japanese Yen by 7%.
Asetek’s raw materials are predominantly purchased with USD, from vendors whose underlying currency is CNY. The USD strengthened against the CNY by 2% in 2023.

RISK MANAGEMENT ASETEK Annual Report 2023 / Page 31
Asetek recognizes that USD appreciation can result in sales price pressure for its suppliers. Historically, the Company has not seen significant reaction from its markets. In addition, Asetek believes that competing products are prone to the same exchange rate scenarios as Asetek.
A significant portion of Asetek’s overhead costs are incurred in DKK. As a result, fluctuations in USD vs. DKK will continue to have an influence on results of operations and financial position. The Group has not entered into any forward exchange instruments.
Research and development, product innovation, market development
The Company’s future success, including the opportunities to ensure growth, depends on the ability to continue developing new solutions and products adapted to the latest technology and the clients’ needs as well as improving existing solutions and market position. As such, the Company develops new releases on a regular basis, with emphasis on higher performance, improved efficiency and noise-reduction. Providing new and innovative applications for Asetek’s cooling technology is also a focus, as evidenced by the new SimSports products released during 2023.
Projects and contracts
It is important to Asetek’s overall success that development projects are executed at high quality and at predetermined timeframes and cost prices. Risks are attached to the sale, analysis and design, development and initial manufacturing phases. Asetek has carefully defined the individual phases and the activities contained therein, with a view to active risk management and efficient implementation. Through project reviews and ongoing analyses before, during, and after initiation, Asetek works to ensure that agreements are adhered to and that revenue and margins are as planned.
Knowledge resources
Asetek is a knowledge-intensive company and in order to continue to develop innovative products and attain satisfactory financial results, it is necessary to attract and develop the right employees. Asetek has the goal of maintaining an attractive workplace and achieves this through various programs including a stock option incentive program and attractive working conditions. The Company seeks to support a company culture founded on individual responsibility and performance as well as team accomplishment.
IT security
Asetek continuously implements measures to monitor and respond to data breaches and cyberattacks. Management ensures that security assessments, including vulnerability assessments and assumed breach tests are performed on a regular basis. Additional security measures to mitigate phishing and spam mails are delivered to employees and password policies are maintained to mitigate the risk of password dictionary attacks or other forms of brute force hacking of individuals. The Company maintains ongoing efforts with external specialists to continuously improve and strengthen the IT Infrastructure security. Mandatory training in cybersecurity is carried out for all employees, and the knowledge level of cybersecurity is thus being changed from awareness-based to training- and compliance-based. During 2023, Asetek experienced a breach of one of its websites, which affected the functionality of the Company’s webstore for less than two days. Asetek followed its cybersecurity contingency plans, the websites were cleaned and restored, and the access methods and perimeter security were reinforced.
The Company has entered into an information security risk insurance policy. This area is actively monitored by the Board of Directors’ Audit Committee.
Taxation
The tax situation of the Company is complex. In connection with its initial public offering in 2013, Asetek moved its Parent company from the U.S. to Denmark.
However, USA – in a unilateral tax treaty override – still considers Asetek A/S a U.S. tax subject, resulting in double taxation of Parent company earnings. Asetek has approached both countries’ tax authorities with the aim of resolving the situation as per the double taxation treaty. However, a determination may take several years, and the authorities are not obligated to resolve the problem. The Company continues to make progress in working with the tax authorities of Denmark and U.S. to possibly resolve this issue.
In June 2019, the U.S. released regulation for its Global Intangible Low-Taxed Income (GILTI) inclusion for U.S. taxation, effective beginning with tax year 2018. The GILTI regulation requires U.S. companies to report foreign corporation intangible income that exceeds 10% return on foreign invested assets. Under prior law, U.S. owners of foreign corporations were able to defer recognizing taxable income until there was a distribution of earnings back to U.S. owners. In 2023, The GILTI regulation caused incremental utilization of the Company’s available deferred tax assets of approximately $0.8 million. GILTI did not materially impact deferred tax asset utilization in 2022. Because of Asetek’s U.S. tax status as described above, management believes that the impact of the GILTI regulation as it applies to the Company could be reformed in the future; however, such reform is not certain. The Company continues to work with its tax advisors to clarify and address these matters.
RISK MANAGEMENT ASETEK Annual Report 2023 / Page 32
CORPORATE SOCIAL RESPONSIBILITY
Asetek seeks to be a good corporate citizen in everything that it does, and therefore has combined its operating principles into one framework policy.
The Asetek Sustainability Report 2023 is the Company’s Report on Corporate Social Responsibility, c.f. Section 99a of the Danish Financial Statements Act. Please refer to the Report here: https://ir.asetek.com/ ESG-Report-2023
Pursuant to section 99b of the Danish Financial Statements Act, the Company is reporting on its Gender Distribution in Management in the following sections.
The Asetek Sustainability Report 2023 is the Company’s Report on Data Ethics, c.f. Section 99d of the Danish Financial Statements Act. Please refer to the Report here: https://ir.asetek.com/ESG-Report-2023
Pursuant to section 107d of the Danish Financial Statements Act, the Company is reporting on its diversity policy in the following sections. Furthermore, Asetek’s diversity policy is available here: https:// ir.asetek.com/Diversity-Policy.
This statement of Asetek’s diversity policy is a component of the Management’s Report in the Annual Report for 2023 and covers the financial period 1 January - 31 December 2023:
Asetek believes that diversity among employees and management, including an even distribution of age, nationality and educational background, contributes positively to the work environment and strengthens the company’s competitiveness and performance.
Historically, Asetek has been a diverse workplace, where employees have very different backgrounds, competencies and living conditions. Not only in relation to gender, age and origin, but equally in relation to education, experience and personality. It is therefore Asetek’s goal that the management should equally reflect the diversity among our employees. In order to promote diversity among the company’s management and Board of Directors, there is a focus on this in recruiting new managers. In 2023, Asetek has therefore sought to ensure broad diversity among applicants when recruiting and promoting.
The board members of Asetek cover a wide range of experiences from both the Danish and international business community and the high-tech industry. This composition is considered appropriate, as it ensures a breadth in the members’ approach to the tasks, and thus helps to ensure qualified considerations and decisions.
At the end of the financial year, 20% of the Executive Board and Board of Directors are of a nationality other than Danish. In terms of age composition, 0% of management is under 40 years old, 71% are between 40 and 60 years old, and 29% of management is over 60.
As of December 31, 2023, the Board of Directors consists of 5 individuals, of which 60% are men and 40% are women, which is considered equal gender diversity according to Section 99b of the Danish Financial Statements Act. Thus, Asetek continued to maintain a distribution of women and men on the Board in accordance with Section 99b of the Danish Financial Statements Act. Asetek’s goal is to continue to maintain, at minimum, a 60/40 balance of gender into the future.
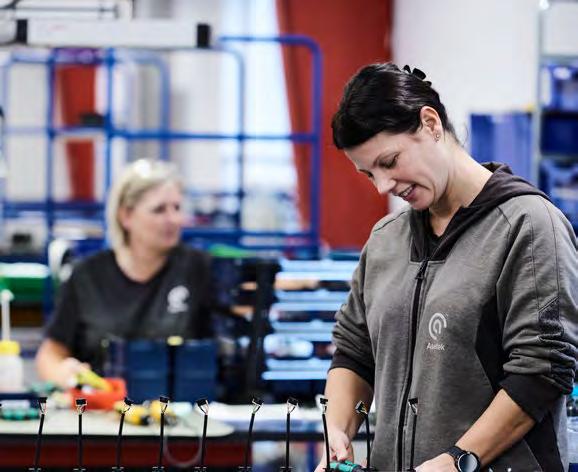
In accordance with section 99b of the Danish Financial Statements Act, Asetek has a target for “other management levels”, defined as a first management level, which is identified as officers, and a second management level comprising other executives reporting to the first management level. Here, the goal is to achieve a minimum of 25% female and 75% male at other management levels by 2030.
In 2023, the number of employees at other management levels was 9 individuals, of which 11% were women. Asetek will continue to work towards the 2030 target. During 2023, the Company continued to actively encourage women to apply for open positions and has continued communicating with educational institutions that train both male and female candidates.
Statutory reporting of gender diversity for Asetek 2023
Board of Directors
Number of members 5
Minority gender in % 40%
Target in % 40%
Other management levels
Number of members 9
Minority gender in % 11%
Target in % 25%
Year of target 2030
CORPORATE SOCIAL RESPONSIBILITY ASETEK Annual Report 2023 / Page 33
FIVE-YEAR SUMMARY
FINANCIALS FISCAL YEAR 2023 202220212020 2019 COMPREHENSIVE INCOME ($000’S) Revenue 76,332 50,650 79,803 72,750 54,334 Gross profit 34,708 20,765 33,373 34,194 23,005 Operating income 9,403 (5,401) 779 10,928 1,048 Financial items, net (905) (477) 618 (1,502) 406 Income before tax 8,498 (5,878) 1,397 9,426 1,454 Income for the year 6,001 (4,325) 1,337 9,195 (628) Comprehensive income 6,722 (6,296) (372) 11,587 (1,072) Operating income before amortization, depreciation and financial items (EBITDA), unaudited 14,503 (1,231) 4,529 14,681 5,105 Adjusted EBITDA 15,864 (791) 7,223 15,600 6,161 BALANCE SHEET ($000’S) Total assets 102,739 78,615 75,354 71,393 54,105 Total equity 66,126 42,748 48,388 47,525 39,008 Interest-bearing debt 18,378 21,689 3,243 4,129 4,292 Working capital (3,232) (6,312) 20,603 32,837 27,919 Invested capital 112,177 99,346 80,900 81,786 81,949 Investment in property, plant and equipment 24,902 22,215 8,322 2,597 1,127 Investment in intangible assets 2,561 3,405 10,196 2,876 1,441 CASH FLOW ($000’S) Operating activities 16,280 (8,354) 14,317 11,430 8,870 Investing activities (27,373) (25,395) (13,204) (4,816) (2,154) Financing activities 12,316 18,327 (4,636) (5,088) (648) Total cash flow 1,710 (15,885) (3,803) 2,594 5,878 RATIOS & METRICS FISCAL YEAR 2023 202220212020 2019 PROFIT & LOSS Gross margin 45.5%41.0%41.8%47.0%42.3% Operating margin 12.3%-10.7%1.0%15.0%1.9% Return on invested capital (ROIC) 5.3%-4.4%1.7%11.2%-0.8% Organic growth 50.7%-36.5%9.7%33.9%-19.3% BALANCE SHEET Quick ratio 0.6 0.6 1.6 2.4 3.1 Current ratio 0.9 0.8 1.8 2.5 3.3 Days sales outstanding 50.6 63.1 69.6 116.1 88.6 Inventory turns per year 5.2 4.8 11.5 18.4 13.9 Days payable outstanding 129.0 132.2 145.4 133.6 96.2 Debt to equity 27.8%50.7%6.7%8.7%11.0%
Earnings per share, basic (USD) 0.07 (0.08) 0.03 0.18 (0.01) Earnings per share, diluted (USD) 0.07 (0.08) 0.03 0.17 (0.01) Shares issued (000's) 98,314 27,147 26,970 26,433 25,789 Treasury shares (000's) 1,256 1,256 1,262 931 185 Share price (DKK) 3.90 8.46 30.58 76.74 23.52 Share price to earnings 7.87 - 90.56 35.98Market capitalization ($000's) 56,122 31,413 119,825 323,054 90,205
STOCK MARKET
Sealed loop units shipped (000's) 1,165 797 1,386 1,201 895 Average selling price per unit, liquid coolers (USD) 59.3 56.2 52.6 53.9 57.9 Revenue per employee ($000's) 570 362 528 661 560 Average number of employees 134 140 151 110 97 FIVE-YEAR SUMMARY ASETEK Annual Report 2023 / Page 34 Refer to the Definitions of Ratios and Metrics on page 77 of this report.
BUSINESS DRIVERS

FINANCIAL STATEMENTS Consolidated statement of comprehensive income 36 Consolidated balance sheet 37 Consolidated statement of changes in equity38 Consolidated cash flow statement 39 Notes 40
CONSOLIDATED STATEMENT OF COMPREHENSIVE INCOME
(USD 000’s) Note 2023 2022 Revenue 4 76,332 50,650 Cost of sales 8 (41,624) (29,885) GROSS PROFIT 34,708 20,765 Research and development (7,379) (5,163) Selling, general and administrative (17,079) (20,884) Special items 8 (847)Other income 8 - (119) TOTAL OPERATING EXPENSES (25,305) (26,166) OPERATING INCOME 9,403 (5,401) Foreign exchange gain (loss) 9 (1,015) (344) Finance income 9 265 45 Finance costs 9 (155) (178) TOTAL FINANCIAL INCOME (905) (477) INCOME BEFORE TAX 8,498 (5,878) Income tax (expense) benefit 10, 11(2,497) 1,553 INCOME FOR THE YEAR 6,001 (4,325) Other comprehensive income items that may be reclassified to profit or loss in subsequent periods: Foreign currency translation adjustments 721 (1,971) TOTAL COMPREHENSIVE INCOME 6,722 (6,296) INCOME PER SHARE: (IN USD) Basic 12 0.07 (0.08) Diluted 12 0.07 (0.08) FINANCIAL STATEMENTS ASETEK Annual Report 2023 / Page 36
CONSOLIDATED BALANCE SHEET
(USD
NON-CURRENT
(USD
Share
NON-CURRENT
Long-term
TOTAL
CURRENT
ASSETS
000’s) Note 2023 2022
ASSETS
assets 1412,05012,014 Property, plant and equipment 1553,89731,084 Deferred income tax assets 115,6897,366
assets 318335 TOTAL NON-CURRENT ASSETS 71,95450,799 CURRENT ASSETS Inventory 179,0536,973 Trade and other receivables 1612,61113,432 Cash and cash equivalents 9,1217,411 TOTAL CURRENT ASSETS 30,78527,816 TOTAL ASSETS 102,73978,615
Intangible
Other
EQUITY
000’s) Note 2023 2022 EQUITY AND LIABILITIES
capital 181,478444
76,02954,406
Retained earnings
Translation and other reserves (11,381) (12,102)
66,12642,748
TOTAL EQUITY
LIABILITIES
debt 192,5961,739
NON-CURRENT LIABILITIES 2,5961,739
LIABILITIES
debt 19, 2015,78219,950
liabilities 1,7901,896
compensation and employee benefits 1,7331,454 Trade payables 14,71210,828
CURRENT LIABILITIES 34,01734,128
LIABILITIES 36,61335,867
EQUITY AND LIABILITIES 102,73978,615 FINANCIAL STATEMENTS ASETEK Annual Report 2023 / Page 37
Short-term
Accrued
Accrued
TOTAL
TOTAL
TOTAL
CONSOLIDATED STATEMENT OF CHANGES IN EQUITY
(USD 000’s) Share capital Share premium Translation reserves Treasury share reserves Retained earnings Total EQUITY AT DECEMBER 31, 2022 442 - 1,075 (11,206)58,077 48,388 Total comprehensive income for 2022 Income for the year - - - - (4,325) (4,325) Foreign currency translation adjustments - - (1,971) - - (1,971) Total comprehensive income for 2022 - - (1,971) - (4,325) (6,296) Transactions with owners in 2022 Shares issued upon exercise of options 2 - - - 214 216 Share-based payment expense - - - - 440 440 Transactions with owners in 2022 2 - - - 654 656 EQUITY AT DECEMBER 31, 2022 444 - (896) (11,206)54,406 42,748 Total comprehensive income for 2023 Income for the year - - - - 6,001 6,001 Foreign currency translation adjustments - - 721 - - 721 Total comprehensive income for 2023 - - 721 - 6,001 6,722 Transactions with owners in 2023 Shares issued in rights offering, net of issuance costs 1,034 15,108 - - - 16,142 Transfer - (15,108) - - 15,108Share-based payment expense - - - - 514 514 Transactions with owners in 2023 1,034 - - - 15,622 16,656 EQUITY AT DECEMBER 31, 2023 1,478 - (175) (11,206) 76,029 66,126 FINANCIAL STATEMENTS ASETEK Annual Report 2023 / Page 38
CONSOLIDATED CASH FLOW STATEMENT
(USD 000’s) Note 2023 2022 CASH FLOWS FROM OPERATING ACTIVITIES Income (loss) for the year 6,001 (4,325) Depreciation and amortization 14,15 5,100 4,170 Gain on sale of property, plant and equipment - (53) Impairment of intangible assets 14 60 111 Finance income recognized 9 (265) (45) Finance costs incurred 9 1,284 663 Finance income, cash received 265 45 Finance costs, cash paid (1,243) (609) Income tax expense (income) 10, 11 2,497 (1,553) Cash receipt (payment) for income tax 543 20 Share-based payments expense 7 514 440 Changes in trade receivables, inventories, other assets (847) 1,891 Changes in trade payables and accrued liabilities 2,371 (9,109) NET CASH PROVIDED BY OPERATING ACTIVITIES 16,280 (8,354) CASH FLOWS FROM INVESTING ACTIVITIES Additions to intangible assets 14 (2,561) (3,405) Purchase of property, plant and equipment 15 (24,902) (22,215) Disposal of long-term assets 15 90 225 NET CASH USED IN INVESTING ACTIVITIES (27,373) (25,395) FREE CASH FLOW (11,093) (33,749) (USD 000’s) Note 2023 2022 CASH FLOWS FROM FINANCING ACTIVITIES Borrowings (repayment) on line of credit for building construction19 (2,874) 18,582 Borrowings (repayment) on line of credit 19 - (690) Proceeds from issuance of share capital 18 17,020 216 Costs incurred for issuance of share capital 18 (878)Financing of previously purchased equipment 19 181 1,129 Principal payments on equipment financing 19 (293) (75) Principal payments on leases 20 (840) (835) NET CASH PROVIDED (USED) BY FINANCING ACTIVITIES 12,316 18,327 Effect of exchange rate changes on cash and equivalents 487 (463) NET CHANGES IN CASH AND CASH EQUIVALENTS 1,710 (15,885) Cash and cash equivalents at beginning of period 7,411 23,296 CASH AND CASH EQUIVALENTS AT END OF PERIOD 9,121 7,411 SUPPLEMENTAL DISCLOSURE – NON-CASH ITEMS Assets acquired under leases 20 273 95 FINANCIAL STATEMENTS ASETEK Annual Report 2023 / Page 39
NOTES
1. GENERAL INFORMATION
Asetek A/S (‘the Company’), and its subsidiaries (together, ‘Asetek Group’, ‘the Group’ or ‘Asetek’) designs, develops and markets liquid cooling solutions used in personal computers, servers and data centers. The Group’s core products utilize liquid cooling technology to provide improved performance, acoustics and energy efficiency. The Company is based in Aalborg, Denmark with personnel in USA, China and Taiwan. The Company’s shares trade on the Nasdaq Copenhagen under the symbol ‘ASTK’.
1.1. Liquidity from rights offering
On May 17, 2023, the Company issued 71,166,167 new common shares of stock in a rights offering, raising net proceeds of $16.1 million after deduction of total issuance costs of $3.7 million (Refer to Note 18). As a result of this capital increase, the Company’s liquidity is sufficient to eliminate the going concern uncertainty that existed as of the publication of the 2022 Annual Report.
2. SUMMARY OF SIGNIFICANT ACCOUNTING POLICIES
The principal accounting policies applied in the preparation of these consolidated financial statements are set out below. These policies have been consistently applied to all the years presented, unless otherwise stated.
2.1. Basis of preparation
The consolidated financial statements have been prepared on a historical cost convention, in accordance with International Financial Reporting Standards (IFRS) as adopted by the European Union (EU) and the supplementary Danish information requirements for class D publicly listed companies.
2.2. Consolidation
The consolidated financial statements comprise the Company and its consolidated subsidiaries. Subsidiaries are all entities (including structured entities) over which the Group has control. The Group controls an entity when the Group is exposed to, or has rights to, variable returns from its involvement with the entity and has the ability to affect those returns through its power over the entity. Subsidiaries are fully consolidated from the date on which control is transferred to the Group. They are deconsolidated from the date that control ceases. Intercompany transactions, balances, income and expenses on transactions between Group companies are eliminated. Profits and losses resulting from the intercompany transactions that are recognized in assets are also eliminated. Accounting policies of subsidiaries are consistent with the policies adopted by the Group.
2.3. Foreign currency
Items included in the financial statements of each of the Group’s entities are measured using the currency of the primary economic environment in which the entity operates (‘the functional currency’). The functional currency of the Company’s operations in the United States of America, Denmark and China are the U.S. dollar, Danish kroner, and Chinese Yuan Renminbi, respectively. The consolidated financial statements are presented in U.S. dollars, which is the Group’s presentation currency.
Foreign currency transactions are translated into the functional currency using the exchange rates prevailing at the dates of the transactions. Foreign exchange gains and losses resulting from the settlement of such transactions and from the translation at year-end exchange rates of monetary assets and liabilities denominated in foreign currencies are recognized as operating expense in the income statement in foreign exchange (loss)/gain.
Group companies that have a functional currency different from the presentation currency are translated into the presentation currency as follows:
// Assets and liabilities for each balance sheet presented are translated at the closing rate at the date of that balance sheet;
// Income and expenses for each income statement are translated at average exchange rates;
// All resulting exchange differences are recognized in other comprehensive income
2.4. Property and equipment
Property and equipment are stated at historical cost less accumulated depreciation. For assets constructed, borrowing costs that are directly attributable to the acquisition, construction or production of a qualifying asset are capitalized as part of the historical cost (Note 2.16). Subsequent costs are included in the asset’s carrying amount or recognized as a separate asset, as appropriate, only when it is probable that future economic benefits associated with the item will flow to the Group and the cost of the item can be measured reliably. The carrying amount of any replaced part is derecognized. All other repairs and maintenance are charged to the income statement during the financial period in which they are incurred. Depreciation is provided over the estimated useful lives of the depreciable assets, generally three to five years, using the straight-line method. The assets’ useful lives and residual values are reviewed, and adjusted if appropriate, at the end of each reporting period. Gains and losses on disposals are determined by comparing the proceeds with the carrying amount and are recognized as other income or expense in the consolidated income statement. Property, plant and equipment is grouped as follows:
NOTES ASETEK Annual Report 2023 / Page 40
Group
Buildings
Leasehold improvements
Plant and machinery
Tools and fixtures
2.5. Research and development
Estimated Useful Life
30–50 years
Lesser of 5 years or lease term
5 years
3 to 5 years
Research costs are expensed as incurred. Costs directly attributable to the design and testing of new or improved products to be held for sale by the Group are recognized as intangible assets within development projects when all of the following criteria are met:
// it is technically feasible to complete the product so that it will be available for sale;
// management intends to complete the product and use or sell it;
// there is an ability to use or sell the product;
// it can be demonstrated how the product will generate probable future economic benefits;
// adequate technical, financial and other resources to complete the development and to use or sell the product are available; and
// the expenditures attributable to the product during its development can be reliably measured.
Directly attributable costs that are capitalized as part of the product include the employee costs associated with development. Other development expenditures that do not meet these criteria are recognized as expense when incurred. Development costs previously recognized as expense are not recognized as an asset in a subsequent period. Development costs recognized as assets are amortized on a straight-line basis over their estimated useful lives, which generally range between three and sixty months. Amortization expense related to capitalized development costs is included in research and development expense.
2.6. Impairment of non-financial assets
Assets that are subject to amortization are reviewed for impairment annually, and whenever events or changes in circumstances indicate that the carrying amount may not be recoverable. An impairment loss is recognized for the amount by which the asset’s carrying amount exceeds its recoverable amount. The recoverable amount is the higher of 1) an asset’s fair value less costs to sell or 2) its value in use. For the purposes of assessing impairment, assets are grouped at the lowest levels for which there are separately identifiable cash flows (cash-generating units). Non-financial assets other than goodwill that previously suffered an impairment are reviewed for possible reversal of the impairment at each reporting date. Goodwill is tested for impairment annually and whenever there is indication that the goodwill may be impaired. If an impairment loss on goodwill is identified, it is recognized as an expense and is not reversed in a subsequent period.
2.7. Financial assets Recognition and Measurement
The Group determines the classification of its financial assets at initial recognition. Financial assets within the scope of IFRS 9 Financial Instruments are classified as follows:
// ‘Amortized cost’ are financial assets representing contractual cash flows held for collection, where such cash flows solely represent payment of principal and interest.
// ‘Fair value’. All other financial assets, representing other debt and equity instruments that do not meet the ‘amortized cost’ criteria, are recognized at fair value. All fair value movements on financial assets are taken through the income statement, or for certain debt instruments that qualify, through other comprehensive income.
For all years presented, the Group’s financial assets are all classified as ‘amortized cost’.
Impairment of financial assets
For financial assets carried at amortized cost, the Group measures at the end of each reporting period the expected credit losses to be incurred for a financial asset or group of financial assets. The Company utilizes historical experience, evaluation of possible outcomes, current conditions and forecasts of future economic conditions to determine expected credit losses. Evidence may include indications that the debtors or a group of debtors is experiencing significant financial difficulty, default or delinquency in interest or principal payments, the probability that they will enter bankruptcy or other financial reorganization, and where observable data indicate that there is a measurable decrease in the estimated future cash flows, such as changes in arrears or economic conditions that correlate with defaults.
2.8. Financial liabilities
Recognition and measurement. Financial liabilities within the scope of IFRS 9 are classified as financial liabilities at fair value through profit or loss, or other liabilities. The Group determines the classification of its financial liabilities at initial recognition. Financial liabilities are recognized initially at fair value less, in the case of other liabilities, directly attributable transaction costs. The measurement of financial liabilities depends on their classification as follows:
// ‘Financial liabilities at fair value through profit or loss’ are derivatives entered into that do not meet the hedge accounting criteria as defined by IFRS 9. Gains or losses on liabilities held for trading are recognized in profit and loss. At December 31, 2023, the Company has no liabilities measured at fair value through profit and loss.
// ‘Other liabilities’ – After initial recognition, interest bearing debt is subsequently measured at amortized cost using the effective interest rate method. Gains and losses are recognized in the income statement when the liabilities are derecognized as well as through the amortization process. The calculation takes into account any premium or discount on acquisition and includes transaction costs and fees that are an integral part of the effective interest rate.
NOTES ASETEK Annual Report 2023 / Page 41
Offsetting of financial instruments. Financial assets and financial liabilities are offset, and the net amount reported in the consolidated balance sheet if, and only if, there is a currently enforceable legal right to offset the recognized amounts and there is an intention to settle on a net basis, or to realize the assets and settle the liabilities simultaneously.
2.9. Inventories
Inventories are stated at the lower of actual cost or net realizable value. Cost is determined using the first-in, first-out (FIFO) method. Net realizable value is the estimated selling price in the ordinary course of business less estimated costs necessary to make the sale. Adjustments to reduce the cost of inventory to its net realizable value, if required, are made for estimated excess, obsolescence, or impaired balances.
2.10. Trade receivables
Trade receivables are amounts due from customers for product sold in the ordinary course of business. Trade receivables are recognized initially at fair value and subsequently measured at amortized cost using the effective interest method, less any provision for expected credit losses. If collection is expected in one year or less, trade receivables are classified as current assets. Expected credit losses are determined utilizing the simplified approach allowed under IFRS 9 Financial Instruments.
2.11. Cash and cash equivalents
Cash and cash equivalents includes cash on hand, deposits with banks, overdrafts and other short-term highly liquid investments with original maturities of three months or less.
2.12. Share capital
Ordinary shares are classified as equity. Incremental costs directly attributable to the issue of new ordinary shares or options are shown in equity as a deduction, net of tax, from the proceeds.
2.13. Share-based payments
The Company issues options (or warrants) that allow management and key personnel to acquire shares in the Company. Through equity-settled, share-based compensation plans, the Company receives services from employees as consideration for the granting of equity options to purchase shares in the Company at a fixed exercise price. The fair value of the employee services received in exchange for the grant of the options is recognized as an expense. The total amount to be expensed is determined by reference to the fair value of the options granted, excluding the impact of any non-market service and performance vesting conditions. The grant date fair value of options granted is recognized as an employee expense with a corresponding increase in equity, over the period that the employees become unconditionally entitled to the options (vesting
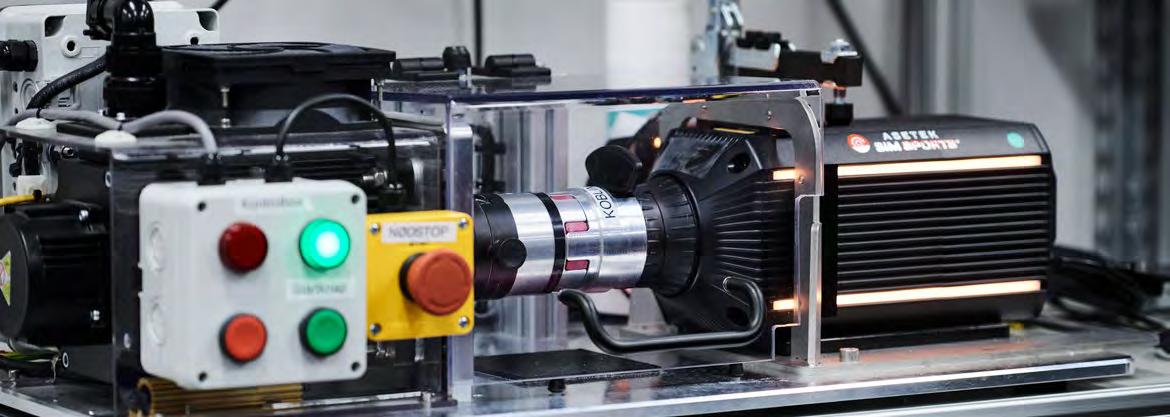
NOTES ASETEK Annual Report 2023 / Page 42
period). The fair value of the options granted is measured using the Black-Scholes model, taking into account the terms and conditions as set forth in the share option program. Measurement inputs include share price on measurement date, exercise price of the instrument, expected volatility, weighted average expected life of the instruments (based on historical experience and general option holder behavior), expected dividends, and the risk- free interest rate. Service and non-market performance conditions attached to the transactions are not taken into account in determining fair value. At each reporting date, the Company revises its estimates of the number of options that are expected to vest based on the non-market vesting conditions. The impact of the revision to original estimates, if any, is recognized in the Statement of Comprehensive Income, with a corresponding adjustment to equity.
2.14. Current and deferred income tax
The tax expense for the period comprises current and deferred tax. Tax is recognized in the income statement, except to the extent that it relates to items recognized in other comprehensive income or directly in equity. In this case, the tax is also recognized in other comprehensive income or directly in equity, respectively.
The current income tax expense is calculated on the basis of the tax laws enacted or substantively enacted at the balance sheet date in the countries where the Company and its subsidiaries operate and generate taxable income. Management periodically evaluates positions taken in tax returns with respect to situations in which applicable tax regulation is subject to interpretation. Management establishes provisions where appropriate on the basis of amounts expected to be paid to the tax authorities.
Deferred income tax is recognized, using the liability method, on temporary differences arising between the tax bases of assets and liabilities and their carrying amounts in the consolidated financial statements. However, deferred tax liabilities are not recognized if they arise from the initial recognition of goodwill; deferred income tax is not accounted for if it arises from initial recognition of an asset or liability in a transaction other than a business combination that at the time of the transaction affects neither accounting nor taxable profit or loss and does not give rise to equal taxable and deductible temporary differences. Deferred income tax is determined using tax rates (and laws) that have been enacted or substantively enacted by the balance sheet date and are expected to apply when the related deferred income tax asset is realized or the deferred income tax liability is settled.
Deferred income tax assets are recognized only to the extent that it is probable that future taxable profit will be available against which the temporary differences can be utilized.
Deferred income tax assets and liabilities are offset when there is a legally enforceable right to offset current tax assets against current tax liabilities and when the deferred income tax assets and liabilities relate to income taxes levied by the same taxation authority on either the same taxable entity or different taxable entities where there is an intention to settle the balances on a net basis.
2.15. Revenue recognition and other income
Revenue represents sale of the Group’s products to customers which are principally resellers and original equipment manufacturers. Revenue is measured at the fair value of the consideration received or receivable, and represents amounts receivable for goods supplied, stated net of discounts, sales tax, returns and after eliminating sales within the Group.
The Group’s revenue is predominantly comprised of shipment of Asetek products in fulfillment of customer purchase orders. As such, the Company recognizes revenue when a valid contract is in place and control of the goods have transferred to the customer. Customer purchase orders and/or contracts are used as evidence of an arrangement. Delivery occurs and control of the goods is deemed to transfer when products are shipped to the specified location and the risks of obsolescence and loss have been transferred to the customer. For certain customers with vendor-managed inventory, delivery does not occur until product is acquired by the customer from the vendor-managed inventory location. The Company assesses collectability based primarily on the creditworthiness of the customer as determined by credit checks and customer payment history. Customers do not generally have a right of return.
Income received as a result of patent litigation settlement is recorded as other income as an offset to operating expense in the period the award is granted. Estimated costs for future product returns under warranty are charged to cost of sales and included in accrued liabilities.
2.16. Borrowings and related costs
Borrowings are initially recognized at fair value, net of transaction costs incurred. Borrowings are subsequently measured at amortized cost. Any difference between the proceeds (net of transaction costs) and the redemption amount is recognized in profit or loss over the period of the borrowings using the effective interest method. Fees paid on the establishment of loan facilities are recognized as transaction costs of the loan to the extent that it is probable that some or all of the facility will be drawn down. In this case, the fee is deferred until the draw down occurs. To the extent there is no evidence that it is probable that some or all of the facility will be drawn down, the fee is capitalized as a prepayment for liquidity services and amortized over the period of the facility to which it relates.
Borrowings are removed from the balance sheet when the obligation specified in the contract is discharged, cancelled or expired. The difference between the carrying amount of a financial liability that has been extinguished or transferred to another party and the consideration paid, including any non-cash assets transferred or liabilities assumed, is recognized in profit or loss as other income or finance costs.
General and specific borrowing costs that are directly attributable to the acquisition, construction or production of a qualifying asset are capitalized during the period of time that is required to complete and prepare the asset for its intended use or sale. Qualifying assets are assets that necessarily take a substantial period of time to get ready for their intended use or sale. Investment income earned on the temporary investment of specific borrowings pending their expenditure on qualifying assets is deducted from the borrowing costs eligible for capitalization. Other borrowing costs are expensed in the period in which they are incurred.
2.17. Leases
Lease liabilities are accounted for under IFRS 16 Leases and measured at the present value of the remaining lease payments, discounted using the lessee’s incremental borrowing rate. Lease liabilities include the net present value of: fixed lease payments, amounts expected to be payable under residual value guarantees, any purchase options that are reasonably expected to be exercised, and any penalties for termination reflected in the lease term. The corresponding rental obligations, net of finance charges, are included in other long-term debt. Amounts due within one year are included in short-term debt.
NOTES ASETEK Annual Report 2023 / Page 43
Each lease payment is allocated between the liability and finance cost. The finance cost is charged to profit or loss over the lease period to reflect a constant periodic rate of interest on the remaining balance of the liability for each period.
Leased assets are recognized as a right-of-use asset at the date at which the leased asset is available for use by the Group, initially measured at the present value of the lease liability and included in Property and equipment on the balance sheet.
2.18. Provisions
A provision is recognized when the Company has a present legal or constructive obligation as a result of past events, it is probable that an outflow of resources will be required to settle the obligation, and the amount has been reliably estimated. If the impact of time value is significant, the provision is calculated by discounting anticipated future cash flow using a discount rate before tax that reflects the market’s pricing of the present value of money and, if relevant, risks specifically associated with the obligation. Provisions are reviewed at each balance sheet date and adjusted to reflect the current best estimate.
2.19. Contingent liabilities
Contingent liabilities are not recognized in the financial statements. Significant contingent liabilities are disclosed, with the exception of contingent liabilities where the probability of the liability occurring is remote.
2.20. Segment reporting
Business segmentation. The Group is reporting on three segments, Liquid cooling, SimSports and Data center. The three segments are identified by their specific sets of products and specific sets of customers. The splitting of operating expenses between segments is based on the Company’s best judgment and done by using the Company’s employee/project time tracking system to capture total hours charged by project code. Operating expenses that are not divisible by nature (rent, telecommunication expenses, etc.) have been split according to actual time spent on the three businesses, and the Company’s best estimate for attribution. Costs incurred for intellectual property defense and headquarters administration have been classified separately as headquarters costs and excluded from segment operating expenses. The CEO is the Group’s chief operating decision maker. The CEO assesses the performance of the Group principally on measures of revenue and adjusted EBITDA.
Geographical segmentation. Each of the Group’s offices in its three principal geographies fulfills a particular function that serves the Asetek Group as a whole. The majority of costs incurred in each of the geographies are generally incurred for the benefit of the entire Group and not to generate revenue in the respective geography. As a result, the financial results of the Group are not divided between multiple geographical segments for key operating decision-making. Revenue and assets by geography is measured and reported in Note 4, Geographical information.
2.21. Cash flow statement
The cash flow statement is prepared using the indirect method.
2.22. Critical accounting estimates and judgments
The preparation of financial statements in conformity with IFRS requires management to make estimates and assumptions that affect the amounts reported in the financial statements and accompanying notes. Actual results could differ from those estimates. Areas where significant judgment has been applied are:
// Valuation of deferred tax assets: deferred income tax assets are recognized to the extent that the realization of the tax benefit to offset future tax liabilities is considered to be probable. The Company has recorded deferred tax assets representing the estimated amount of net operating losses that will be utilized to offset future taxable income, based on income projections for the next five years. In future periods, management will continue to assess the probability of realization of the assets’ value and adjust the valuation in accordance with IAS 12.
// Capitalization of development costs: the Group’s business includes a significant element of research and development activity. Under IAS 38, there is a requirement to capitalize and amortize development spend to match costs to expected benefits from projects deemed to be commercially viable. The application of this policy involves the ongoing consideration by management of the forecasted economic benefit from such projects compared to the level of capitalized costs, together with the selection of amortization periods appropriate to the life of the associated revenue from the product. If customer demand for products or the useful lives of products vary from management estimates, impairment charges on intangibles could occur.
2.23. Defined contribution plan
In 2008, the Company established a defined contribution savings plan (the “Plan”) in the U.S. that meets the requirements under Section 401(k) of the U.S. Internal Revenue Code. This Plan covers U.S. employees who meet the minimum age and service requirements and allows participants to defer a portion of their annual compensation on a pre-tax basis. Company contributions to the Plan may be made at the discretion of the Board of Directors. In the year ended December 31, 2023, the Company made matching contributions totaling $17,000 ($39,000 in 2022).
2.24. Special items
The Company may identify special items that are significant non-recurring items that management does not consider to be part of the Group’s ordinary activities. Such special items may include one-time impairment costs, restructuring, and strategic considerations regarding the future of the business, and are presented separately in the Consolidated Statement of Comprehensive Income to provide a more comparable basis for the Company’s operations. Management assesses which items are to be identified as special items and shown separately, in order to give a correct presentation of the statement of profit or loss and other comprehensive income.
NOTES ASETEK Annual Report 2023 / Page 44
2.25. ESEF Regulation
The Company’s Annual Report is prepared, in all material respects, in compliance with the Commission Delegated Regulation (EU) 2019/815 on the European Single Electronic Format (ESEF Regulation) which includes requirements related to the preparation of the Annual Report in XHTML format and iXBRL tagging of the Consolidated Financial Statements.
2.26. Changes in accounting policy and disclosures
Applied new standards and amendments included in Annual Report for 2023. Certain new standards, amendments to standards, and annual improvements to standards and interpretations are effective for annual periods beginning after January 1, 2023 and have been applied in preparing these consolidated financial statements. These applications did not materially impact the Group’s consolidated financial statements.
2.27. New standards and amendments not applied in the Annual Report for 2023. There are some new standards and amendments to standards and interpretations that have not been applied in preparing these consolidated financial statements. None of these is expected to have a significant effect on the consolidated financial statements of the Group:
Standard Content
EU endorsed as of December 31, 2023
Amendments to IFRS 16 Leases: Lease Liability in a Sale and Leaseback Specifies how a sale and leaseback is accounted for when reporting after the date of the transaction.
Amendments to IAS 1 Presentation of Financial Statements: Classification of Liabilities as Current or Non-current and Classification of Liabilities as Current or Non-current - Deferral of effective date; and Non current Liabilities with Covenants
The amendments specify that the conditions which exist at the end of the reporting period are those which will be used to determine if a right to defer settlement of a liability exists. Management expectations about events after the balance sheet date are not relevant to the determination. In addition, amendments specify that covenants to be complied with after the reporting date do not affect the classification of debt as current or non-current at the reporting date. Covenant details should be disclosed in notes to financial statements.
Not endorsed by EU as of December 31, 2023
Amendments to IAS 7 Statements of Cash Flows and IFRS 7 Financial
Instruments: Disclosures: Supplier Finance Arrangements
Amendments to IAS 21 The Effects of Changes in Foreign Exchange Rates: Lack of Exchangeability
Describes the characteristics of supplier finance arrangements; requires disclosures of their terms and conditions, how arrangements impact liabilities, cash flows and exposure to liquidity risk, and effects on carrying amounts of related financial liabilities. Adds supplier finance arrangements as an example within the liquidity risk disclosure requirements in IFRS 7.
Amends IAS 21 to 1) specify when a currency is exchangeable to another currency and when it is not; 2) specify how to determine the exchange rate to apply when a currency is not exchangeable; 3) require disclosure of additional information when a currency is not exchangeable.
Effective date
1-Jan-24
1-Jan-24
1-Jan-24
1-Jan-25
NOTES ASETEK Annual Report 2023 / Page 45
3. RISK MANAGEMENT AND DEBT
The Group’s activities expose it to a variety of risks: liquidity risk, market risk (including foreign exchange risk and interest rate risk) and credit risk. The primary responsibility for Asetek’s risk management and internal controls in relation to the financial reporting process rests with executive management.
Asetek’s internal control procedures are integrated in the accounting and reporting systems and include procedures with respect to review, authorization, approval and reconciliation. All entities in the Asetek Group report financial and operational data to the executive office on a monthly basis, including commentary regarding financial and business development. Based on this reporting, the Group’s financial statements are consolidated and reported to executive management. Management is in charge of ongoing efficient risk management, including the identification of material risks, the development of systems for risk management, and that significant risks are routinely reported to the Board of Directors.
Liquidity risk. The Group incurred losses from operations and negative cash flows from operations from inception through 2015. Positive operating cash flows and operating income were first generated in 2016 and continued through 2021. In 2022, the Company incurred operating losses and began facilities construction which required new capital. In 2023, the Company issued 71.2 new common shares of stock in a rights offering, raising net proceeds of $16.1 million (refer to Note 18). In 2023, the Company generated $9.4 million of operating income and $16.3 million of operating cash flows. Current liabilities of the Company at December 31, 2023 includes $14.7 million of debt related to facilities construction, which was subsequently refinanced in January 2024 to be due and payable January 1, 2025. At that time, the Company expects to convert the loan to a long-term mortgage. The Company believes that its cash position and the liquidity available from its operations, external borrowings and other sources currently available is sufficient to satisfy its working capital requirements for the foreseeable future.
The Group’s corporate finance team monitors risk of a shortage of funds through regular updates and analysis of cash flow projections and maturities of financial assets and liabilities. The finance teams also review liquidity, balance sheet ratios (such as days’ sales outstanding, inventory turns) and other metrics on a regular basis to ensure compliance both on a short- and long-term basis.
Asetek will continue to invest its capital principally in the development and marketing of its products. In 2016, the Board of Directors implemented a policy under which it may declare and distribute dividends to shareholders. At the Annual General Meetings in 2023 and 2022, the Board was authorized to acquire the Company’s own shares and subsequently initiated a share buyback program. In 2023 and 2022, the Company did not repurchase shares. When considering payment of dividends or Asetek share purchases, the Board takes into consideration the Company’s growth plans, international tax implications, liquidity requirements and necessary financial flexibility.
Debt covenants. Under lines of credit terms with Jyske Bank, the Company is required to comply with the following financial covenants at each quarter-end:
// Group solvency of at least 45%
// Non-interest bearing debt to EBITDA maximum ratio of 2.5
// Positive free cash flow after adjustment for property investment
// Segment reporting on EBITDA
The Company has complied with the above covenants since their inception. There are no indications that the Company will not comply with these covenants in the next reporting period (Q1 2024).
Under the lines of credit with Sydbank, the Company had covenants requiring minimum EBITDA and liquidity levels, and construction cost controls. The lines of credit with Sydbank were transitioned to Jyske Bank in January 2024 (refer to Note 24).
The following are contractual maturities of financial liabilities, including lease and other financing payments on an undiscounted basis:
AS OF DECEMBER 31, 2023
(USD 000’s)
On Demand Less than 3 months 3 to 12 months 1 to 5 yearsTotal
Construction commitments - (1,689) (2,213) - (3,902)
Lines of credit - - (14,700) (1,489) (16,189)
Leases and equipment financing - (256) (910) (1,180) (2,346)
Payables and accrued liabilities - (17,447) (788) - (18,235) - (19,392) (18,611) (2,669) (40,672)
AS OF DECEMBER 31, 2022
(USD 000’s)
On Demand Less than 3 months 3 to 12 months 1 to 5 years Total
Construction commitments - (6,873) (14,622) (2,828) (24,323)
Lines of credit (18,971) - - - (18,971)
Leases and equipment financing - (270) (832) (1,806) (2,908)
Payables and accrued liabilities - (13,589) (589) - (14,178) (18,971) (20,732) (16,043) (4,634) (60,380)
NOTES ASETEK Annual Report 2023 / Page 46
Market risk factors. The Group’s current principal financial liabilities consist of short-term and long-term construction lines of credit, short-term operating line of credit and amounts owed on facilities and equipment leases. The Group’s financial assets mainly comprise trade receivables, cash and deposits. The Group’s operations are exposed to market risks, principally foreign exchange risk and interest rate risk.
(a) Foreign exchange risk. With few exceptions, the Group’s inventory purchase and sale transactions are denominated in U.S. dollars. The Group operates internationally and is exposed to foreign exchange risk arising from currency exposures, principally with respect to the Danish kroner. Foreign exchange risk arises from operating results and net assets associated with Denmark-based operations where the Danish krone is the functional currency. Translation of the Denmark entity balance sheet accounts from Danish kroner to U.S. dollars affect the equity balances of the Group. The Group has available lines of credit totaling 180 million Danish krone, of which DKK 109 million (USD 16.2 million) is outstanding at December 31, 2023 (the lines of credit are further described in “(b) Interest rate risk” below). The Group does not enter into derivatives or other hedging transactions to manage foreign exchange risk. Management mitigates this exposure through timely settlement of intercompany operating liabilities.
The ending exchange rate at December 31, 2023 was 6.74 Danish kroner to one U.S. dollar (6.97 to the U.S. dollar at December 31, 2022). The effect of a 10% strengthening (weakening) of the Danish kroner against the U.S. dollar for the reporting period would have resulted in an increase (decrease) in pre-tax income for fiscal year 2023 of ($1,640,000) (in 2022, decrease of the pre-tax income of ($1,519,000)).
(b) Interest rate risk. The Group’s interest rate risk consists of the following credit lines. As of December 31, 2023, Asetek has three lines of credit totaling 180 million Danish krone (USD 26.7 million), of which USD 16.2 million has been utilized, principally to finance construction of a new development center and HQ facility.
// Asetek A/S, the Parent company, has a line of credit with Sydbank for DKK 100 million (USD 14.8 million), for which the total USD 14.7 million was utilized at December 31, 2023. This line carries interest at Danish CIBOR 3 rate plus 1.25 percentage points which in total was 5.16% at December 31, 2023, and payment in full is due December 31, 2024.
// Asetek Danmark A/S has a construction line of credit with Jyske Bank for DKK 75 million. The value of line in U.S. dollars is approximately USD 11.1 million, of which USD 1.5 million was utilized at December 31, 2023. The line carries interest at the Danish CIBOR 3 rate plus 1.95 percentage points, which in total was 5.86% at December 31, 2023, and payment in full is due January 1, 2025.
// Asetek Danmark A/S has an operating line of credit with Sydbank for DKK 5 million. The value of line in U.S. dollars is approximately USD 0.7 million, of which zero was utilized at December 31, 2023. The line carries interest at the Danish CIBOR 3 rate plus 1.95 percentage points, which in total was 5.86% at December 31, 2023, and payment in full is due December 31, 2024.
The variable nature of the Danish CIBOR 3 rate results in risk of increased interest cost due to potential changes in rates. At the level of borrowings as of December 31, 2023, the effect of a 50% relative increase in the Danish CIBOR 3 rate would result in increased annual interest cost of $0.3 million ($0.2 million in 2022). Capital and debt management. To date the Company’s primary focus has been to support its product development initiatives, maintain liquidity through use of financing alternatives, and maximize shareholder value. The Group manages its capital and debt structure with consideration of the liquidity needs of the
NOTES ASETEK Annual Report 2023 / Page 47
Company and existing economic conditions. In May 2023, to bridge a short-term working capital deficit associated with its facility construction, the Company issued 71,166,167 new common shares of stock in a rights offering, raising net proceeds of $16.1 million.
Credit risk factors. Credit risk refers to the risk that a counterparty will default on its contractual obligations resulting in financial loss to the Group. The Group is exposed to credit risk primarily through trade receivables and cash deposits. Management mitigates credit risk through standard review of customer credit-worthiness and maintaining its liquid assets primarily with banks with credit ratings of A or higher, such as Wells Fargo Bank in the U.S. and Jyske Bank in Denmark. The carrying amount of the financial assets represents the maximum credit exposure.
Trade receivables that are deemed uncollectible are charged to expense with an offsetting allowance recorded against the trade receivable. Historically, bad debt expense has not been significant. Certain customers have accounted for a significant portion of the Company’s revenue in the years presented, as follows. In 2023, the Company’s three largest customers, all in the liquid cooling segment, accounted for 38%, 24% and 13% of revenue (three customers accounted for 32%, 22% and 18% of revenue in 2022), respectively. The Company mitigates risk with its largest customer by requiring two remittances per month as well as frequent monitoring and communicating regarding invoices coming due.
At December 31, 2023 three customers, all in the liquid cooling segment, represented 35%, 16% and 12% of outstanding trade receivables (three represented 38%, 24% and 10% at December 31, 2022), respectively. The reserve for uncollectible trade accounts was $59,000 at December 31, 2023 and $41,000 at December 31, 2022. The aged trade receivables and bad debt reserve balances for all years presented are provided in Note 16.
The maximum exposure to credit risk at the reporting dates was:
4. GEOGRAPHICAL INFORMATION
The Group operates internationally in several geographical areas, principally in Asia, Europe and the Americas. The following table presents the Group’s revenue and assets in each of the principal geographical areas:
For the purpose of the above presentation, the information pertaining to revenue and current assets is calculated based on the location of the customers, whereas information pertaining to non-current assets is based on the physical location of the assets. The information pertaining to current assets is calculated as a summation of assets such as trade receivables and finished goods inventories reasonably attributable to the specific geographical area.
(USD 000’s) 2023 2022 Cash and cash equivalents 9,1217,411 Trade receivables and other 12,61113,432 Other assets 318 335 MAXIMUM CREDIT EXPOSURE 22,05021,178
2022 (USD 000’s) Revenue Current assets Noncurrent assetsRevenue Current assets Noncurrent assets Asia 65,25211,045 119 40,216 10,041 167 Americas 5,1305,369 1,099 6,017 2,849 1,866 Europe 5,95014,371 70,736 4,417 14,926 48,766 TOTAL 76,33230,78571,954 50,650 27,816 50,799
2023
Non-current assets (USD 000’s) 2023 2022 Denmark 70,73648,766 USA 1,0991,866 China 119 167 TOTAL 71,95450,799 Revenue (USD 000’s) 2023 2022 Denmark 525 250 China 8,576 6,665 Singapore 6,756 7,177 Taiwan 46,737 24,215 USA 4,917 5,621 Japan 2,667 1,381 All others 6,154 5,341 TOTAL 76,332 50,650 NOTES ASETEK Annual Report 2023 / Page 48
5. SEGMENT INFORMATION
In 2023, the Company reports on three segments, Liquid cooling, Data center and SimSports. The three segments are identified by their specific sets of products and customers. The CEO is the Group’s chief operating decision-maker. The CEO assesses the performance of each segment principally on measures of revenue and adjusted EBITDA. Refer to page 77 for definition of adjusted EBITDA. The following tables represent the results by operating segment in 2023 and 2022. Disaggregation of revenue by sales channel is also presented for the major markets within each segment. Revenue generated from retailers and online webstore is principally from the sale of SimSports products.
Segment operating results – years ended December 31
Reconciliation of Adjusted EBITDA to Income before tax (USD 000’s) 2023 2022 EBITDA adjusted - Liquid Cooling 25,86111,230 EBITDA adjusted - Data center 192 706 EBITDA adjusted - SimSports (6,688) (6,618) Special items (847)Headquarters costs, net (3,501) (6,109) Share-based compensation (514) (440) Depreciation and amortization (5,100) (4,170) Total financial income (expenses) (905) (477) CONSOLIDATED INCOME BEFORE TAX 8,498 (5,878) Disaggregation of revenue (USD 000’s) 2023 2022 OEM and System Integrators 69,153 48,934 Retailers 4,289 893 Online webstore 2,890 823 TOTAL 76,332 50,650
2023 2022 (USD 000's) Liquid CoolingData centerSimSports Not allocable to divisionsTotal Liquid CoolingData centerSimSports Not allocable to divisionsTotal Revenue 69,052 102 7,178 - 76,332 44,798 4,028 1,824 - 50,650 Adjusted EBITDA 25,861 192 (6,688) (3,501)15,864 11,230 706 (6,618) (6,109) (791) NOTES ASETEK Annual Report 2023 / Page 49
6.
The Company’s CEO has an agreement of twelve months’ severance pay in case of termination or termination in connection with change of control. The Company’s CFO has an agreement of seven months’ severance pay in case of termination or termination in connection with change of control. Except for the Company’s CEO and CFO and other members of the executive group, no member of the administrative, management or supervisory bodies has contracts with the Company or any of its subsidiaries providing for benefits upon termination of employment.
Share ownership of officers, including immediate family members, at December 31,
* Other executives include the Chief Operating Officer and other members of the executive team who are leaders of the key functions (Engineering, Sales and Operations).
REMUNERATIONS (USD 000’s) 2023 2022 Salaries 11,38211,943 Retirement fund payments to defined contribution plan 578 584 Social cost 1,5411,658 Share-based payment 514 440 Other expenses 806 719 TOTAL PERSONNEL COSTS 14,82115,344 Less: Costs applied to inventory production (1,592) (1,127) Less: Capitalized as development cost (1,940) (1,648) TOTAL PERSONNEL EXPENSES IN OPERATING EXPENSE 11,28912,569 AVERAGE NUMBER OF EMPLOYEES 134 140 (USD 000’s) 2023 2022 Research and development 4,5174,121 Selling, general and administrative 10,30411,223 TOTAL PERSONNEL EXPENSES COSTS 14,82115,344 Options Granted 2023 2022 Board of Directors -Officers 1,543,400 202,175 Other executives 646,900 50,975 Other employees 766,550 123,350 TOTAL 2,956,850 376,500
SALARY COSTS AND
2023: André S. Eriksen Peter D. Madsen Common shares 1,391,128 467,594 Options at DKK 4.07 1,150,000 393,400 Options at DKK 4.49 151,900 50,975 Options at DKK 7.37 106,800 61,750 Options at DKK 11.44 68,500 42,075 Options at DKK 13.82 53,300 26,500 Options at DKK 29.89 57,200 17,700 Warrants at: DKK 22.76 132,981 44,215 TOTAL SHARES CONTROLLED 3,111,809 1,104,209 Compensation to Board of Directors, Officers and Other Executives* 2023 2022 (USD 000’s) DirectorsOfficers Other Executives Total DirectorsOfficers Other Executives Total Salary - 1,047 887 1,934 - 954 858 1,812 Bonus - 520 637 1,157 - 223 369 592 Share-based - 258 117 375 - 230 112 342 Other 255 219 65 539 236 193 64 493 TOTAL 255 2,044 1,706 4,005 236 1,600 1,403 3,239
NOTES ASETEK Annual Report 2023 / Page 50
7. SHARE BASED PAYMENT
Asetek’s Equity Incentive Program is a share compensation program where the employees that deliver services to the Group have been granted share options (or warrants). The options, if vested and executed, will be settled in common shares of the Company.
The options are granted at the time of employment and, under other circumstances, at the discretion of the Board of Directors. The options are granted with exercise prices equaling the fair market value of the underlying security. The exercise prices of option grants are determined based on the closing market price of the shares for the five most recent trading days prior to the grant date. Share-based compensation expense was $514,000 and $440,000 for the years ended December 31, 2023 and 2022, respectively. The goals of the equity incentive program are as follows:
// To attract and retain the best available personnel for positions of substantial responsibility;
// To provide additional incentive to employees, directors and consultants, and
// To promote the success of the Company’s business.
In July 2023, in consideration of the dilution effect of the Company’s May 2023 rights offering (Note 18), and transition of listing to the Nasdaq Copenhagen, the Board of Directors reduced the exercise prices of outstanding share options by 45% and converted the currency denomination to Danish krone. Stock compensation expense in 2023 associated with the exercise price adjustments was $142,000. The repricing of options is summarized as follows:
Activity for exercise prices of DKK 4.07 to DKK 7.37
Weighted Average Exercise
2023
granted
The Company’s shares trade principally on the Nasdaq Copenhagen at prices denominated in Danish krone (DKK). The exchange rate at December 31, 2023 of DKK to USD was 6.74.
In December 2023, the Company granted 2,956,850 options with exercise prices of DKK 4.07 per share. In September 2022, the Company granted 376,500 options which have exercise prices of DKK 4.49 per share after the effect of the Company’s option repricing in July 2023. Movements in the number of share options outstanding and their related weighted average exercise price are specified on the following table.
2023 Weighted Average Exercise price (DKK) 2022 Weighted Average Exercise price (DKK) Outstanding on January 1 1,226,419 20.15 1,290,144 14.69
Options/warrants granted - - - -
Options/warrants
forfeited
Grant year Original Exercise Price Revised Exercise Price 2022 NOK 15.04 DKK 4.49 2021 NOK 100.15 DKK 29.89 2020 NOK 38.33 DKK 11.44 2019 NOK 24.70 DKK 7.37 2018 NOK 46.30 DKK 13.82 2017 NOK 76.25 DKK 22.76 2017 NOK 113.00 DKK 33.72 2016 NOK 19.50 DKK 5.82
price (DKK) Outstanding on January 1 992,460 5.94 822,371 4.41 Options/warrants
2,956,850 4.07 376,500 4.49
Weighted Average Exercise price (DKK) 2022 - - (183,091) 3.30 Options/warrants forfeited (228,307)5.84 (23,320) 7.23 OUTSTANDING ON DECEMBER 31 3,721,003 4.46 992,460 5.94 EXERCISABLE ON DECEMBER 31 558,766 6.52 595,917
Options/warrants exercised
6.61
The weighted average market price per share on the date of exercise for the above shares was DKK 8.20 in 2022.
Activity for exercise prices of DKK 11.44 to DKK 33.72
(27,943) 18.32
18.93 OUTSTANDING ON DECEMBER 31 1,198,476 20.20 1,226,419 20.15 EXERCISABLE ON DECEMBER 31 1,170,239 20.19 1,079,800 20.12 NOTES ASETEK Annual Report 2023 / Page 51
Options/warrants exercised - - - -
(63,725)
The composition of options and warrants outstanding at December 31 is as follows:
Options and Warrants Outstanding at December 31
Total outstanding options and warrants represents 5.0% of total common shares issued at December 31, 2023 (8.2% in 2022).
The Company calculated the fair value of each option award on the date of grant using the Black-Scholes option pricing model, which requires subjective assumptions, including future stock price volatility and expected time to exercise. The Company sets the exercise price of shares granted as the average closing price of the Company’s shares for the five most recent trading days prior to the grant date. The expected volatility was based on the historical volatility of the Company’s stock price. The weighted average remaining contractual term of options outstanding is 3.6 years. The options granted in December 2023 have an estimated total value of $1.2 million. The options granted in September 2022 have an estimated total value of $0.3 million.
Expected volatility is calculated based on the actual volatility experienced during the three-year period prior to each option’s grant date. The following weighted average assumptions were used for the period indicated.
8. EXPENSES BY NATURE
Depreciation and amortization expense classfication
(USD 000’s)
Depreciation and amortization expense included in:
Research and development
Selling, general and administrative
TOTAL
2022
Special item and other income. In May 2023, in conjunction with the rights offering described in Note 18, the Company began transition of its shares for trading from Oslo Stock Exchange to Nasdaq Copenhagen. Operating expense in 2023 includes $0.8 million of non-recurring costs associated with this listing change, classified as a special item in operating expense on the income statement.
In October 2022, Asetek announced a settlement of the pending patent infringement lawsuit with CoolIT Systems and Corsair Gaming. Total costs incurred including legal fees and settlement associated with this lawsuit was $3.4 million in 2022 and is included in selling, general and administrative expense. Total operating expense in the consolidated statement of comprehensive income includes a separate component of other income (expense) totaling $0.1 million expense in 2022.
2023 2022 DKK 4.07 2,956,850DKK 4.49 370,381 375,500 DKK 5.82 - 216,418 DKK 7.37 393,772 400,542 DKK 11.44 258,427 264,687 DKK 13.82 278,791 287,853 DKK 22.76 384,054 392,747 DKK 29.89 180,205 184,133 DKK 33.72 96,999 96,999 TOTAL 4,919,479 2,218,879
Valuation assumptions 2023 2022 Risk-free interest rate 4.33%4.58% 3.34%3.41% Dividend yield 0.0% 0.0% Expected life of options (years) 2.5 - 3.96 2.5 - 3.96 Expected volatility 114% 75% - 82%
Expenses by Nature (USD 000’s) Note 2023 2022 Inventories recognized as cost of sales 18 41,624 29,885 Personnel expenses 6 14,821 15,344 Depreciation and amortization 14,15 5,100 4,171 Legal, patent, consultants and auditor 2,269 5,202 Facilities and infrastructure 1,192 1,079 Special items 847Other expenses 3,6373,656 TOTAL OPERATING EXPENSES BEFORE CAPITALIZATION 69,49059,337
capitalized costs for development projects 14 (2,561) (3,405) TOTAL EXPENSES 66,92955,932
Less:
2023
2,5602,117
2,5402,053
5,1004,170
NOTES ASETEK Annual Report 2023 / Page 52
9. FINANCE COSTS AND INCOME
Interest
Other banking and finance fees
(80)
11. DEFERRED INCOME
between
At December 31, 2023, potential income tax assets totaled $6.7 million (2022: $8.3 million) in respect of timing differences and losses to be carried forward amounting to $23.5 million that should be applied to different tax rates. The losses can be carried forward against future taxable income. In 2023, the Group recorded deferred tax assets totaling $5.7 million ($7.4 million in 2022), which represents the net tax benefit that the Company considers probable to be realized in the future, based on Company budget for the following year and estimates for the subsequent years.
10. INCOME TAXES
Asetek A/S, the Group’s parent company, moved from U.S. to Denmark in 2013 and is currently subject to income tax in both U.S. and Denmark. The Company is working with the U.S. and Danish tax authorities to negotiate a resolution in accordance with international double taxation treaties.
The tax expense on the group’s income before tax differs from the theoretical amount that would arise using the weighted average tax rate applicable to profits of the consolidated entities as follows:
In accordance with IAS 12, the Company recognizes deferred tax assets arising from unused tax losses or tax credits only to the extent that the entity has sufficient taxable temporary differences or there is convincing other evidence that sufficient taxable profit will be available against which the unused tax losses or unused tax credits can be utilized by the Company.
The estimated tax benefit is calculated considering historical levels of income, expectations and risks associated with estimates of future taxable income. The calculation utilizes the statutory tax rates that are expected to apply to taxable income for the years in which the asset is expected to be realized.
Though the Company incurred net losses in 2022, Asetek’s revenue and operating income performance for 2023 resulted in net utilization of $1.7 million of deferred tax assets during the year. In 2024, revenue from the Liquid Cooling segment is expected to be close to 2023 revenue and revenue in the SimSports segment is expected to increase compared to 2023. Management’s financial projections estimate that deferred tax assets associated with net operating loss carryforwards will be utilized within the next four years.
Losses of the U.S. parent company and U.S. subsidiary will begin to expire in 2028 for carryforward purposes. Losses of the Denmark subsidiary do not expire. Expiration of the carryforward of losses is summarized as follows:
(USD 000’s) 2023 2022 FOREIGN EXCHANGE GAIN (LOSS) (1,015) (344) FINANCE INCOME 265 45 Interest cost on line of credit (1,009) (506)
cost on leases and equipment financing (109)
(77)
(166)
Subtotal (1,284) (663) Less: amount capitalized 1,129 485 FINANCE COST (155) (178)
(USD 000’s) 2023 2022 INCOME (LOSS) BEFORE TAX 8,498 (5,878) Tax calculated at domestic rates applicable to profits/losses in respective countries (1,902) 1,222 Tax effects of: R&D credit 50 292 Timing differences between book and tax, recognized 70 57 Timing differences between book and tax, not previously recognized - 295 Effect of U.S. GILTI regulation applied to foreign corporation income (766)Other permanent differences between book and tax 51 (313) TAX (EXPENSE) BENEFIT (2,497) 1,553
TAX (USD 000’s) 2023 2022 Potential tax assets from net losses 6,064 7,740 Potential tax
618 585 Tax assets not recognized (993) (959) DEFERRED INCOME TAX ASSETS 5,689 7,366
assets resulting from timing differences
book and tax
(USD 000’s) Tax effected loss Expire in years 2028 to 2034 1,049 Do not expire 3,991 TOTAL 5,040 NOTES ASETEK Annual Report 2023 / Page 53
12. EARNINGS PER SHARE
Basic earnings per share is calculated by dividing the profit or loss attributable to equity holders of the Company by the weighted average number of common shares outstanding during the period. Diluted earnings per share is calculated by adjusting the number of common shares outstanding used in the Basic calculation for the effect of dilutive equity instruments, which include options and warrants to the extent their inclusion in the calculation would be dilutive.
As described in Note 18, in a rights offering in May 2023, the Company issued new shares to existing shareholders at a discounted price from fair market value. IAS 33 requires that the price discount be recognized as a bonus element, with retrospective adjustment to the denominators for both basic and diluted earnings per share amounts for all periods before the rights issue. In accordance with IAS 33, the Company calculated and applied a bonus factor of 2.05 to the weighted average shares outstanding for all prior periods.
Based on current interest rates and its recent bank financing negotiations, the Company believes that book value approximates fair value for all financial instruments as of December 31, 2023. The values of the Group’s assets and liabilities are as follows:
At
Instruments with potentially dilutive effect: Warrants and options (000's) - -
At December 31, 2023
(USD 000’s)
13. FINANCIAL INSTRUMENTS CATEGORY AND FAIR VALUE ESTIMATION
The Company uses the following valuation methods for fair value estimation of financial instruments:
// Quoted prices (unadjusted) in active markets (Level 1).
// Inputs other than quoted prices included within level 1 that are observable for the asset or liability, either directly (as prices) or indirectly (derived from prices) (Level 2)
// Inputs for the asset or liability that are not based on observable market data (unobservable inputs) (Level 3).
All of the Company’s financial assets as of December 31, 2023 are classified as “amortized cost” having fixed or determinable payments that are not quoted in an active market (Level 3). As of December 31, 2023, all of the Company’s financial liabilities are carried at amortized cost having fixed or determinable payments that are not quoted in an active market (Level 3).
At December 31, 2022
(USD 000’s) 2023 2022 Income attributable to equity holders of the Company (USD 000's) 6,001 (4,325) Weighted average number of common shares outstanding (000's) 81,642 52,978 BASIC EARNINGS PER SHARE $0.07 $(0.08) Weighted average number of common shares outstanding (000's) 81,642 52,978
Weighted average number of common shares outstanding, diluted (000's) 81,642 52,978 DILUTED EARNINGS PER SHARE $0.07 $(0.08)
December
(USD 000’s) Amortized cost Assets as per balance sheet: Trade receivables and other 12,611 Cash and cash equivalents 9,121 21,732 At December 31, 2022 (USD 000’s) Amortized cost Assets as per balance sheet: Trade receivables and other 13,432 Cash and cash equivalents 7,411 20,843
31, 2023
Liabilities at fair value through profit and loss Other Financial Liabilities at amortized cost Total Liabilities as per balance sheet: Long-term debt - 2,596 2,596 Short-term debt - 15,782 15,782 Trade payables and accrued liabilities - 18,235 18,235 - 36,613 36,613
(USD
Liabilities at fair value through profit and loss Other Financial Liabilities at amortized cost Total Liabilities as per balance sheet: Long-term debt - 1,739 1,739 Short-term debt - 19,950 19,950 Trade payables and accrued liabilities - 14,178 14,178 - 35,867 35,867 NOTES ASETEK Annual Report 2023 / Page 54
000’s)
14. INTANGIBLE ASSETS
In 2021, the Company purchased intellectual property and other assets from a third party which included intangible assets with an estimated fair value of $7.8 million, the majority of which were in development. As the assets are placed in service, they are being amortized over their estimated useful lives ranging from 6 to 10 years.
Goodwill. Goodwill of $0.5 million originated from an acquisition by the Company in 2020. Goodwill is not amortized but reviewed for impairment once a year and also if events or changes in circumstances indicate the carrying value may be impaired. If impairment is established, goodwill is written down to its lower recoverable amount. The goodwill recorded is denominated in Danish krone and is subject to fluctuation in the consolidated financial statements due to changes in foreign exchange rates.
The Company’s intangible assets are pledged as security for lines of credit outstanding as per Note 19. Intangible assets as of December 31 are as follows:
Capitalized
Capitalized development costs. The Group routinely incurs costs directly attributable to the design and testing of new or improved products to be held for sale. These costs are capitalized as intangible assets and amortized over the estimated useful lives of the products, typically three to sixty months.
Impairment tests are performed annually on developed assets and assets under construction. Impairment tests are also performed on completed assets whenever there are indications of a need for write-offs and for assets still in development regardless of whether there have been indications for write downs. If the value of expected future free cash flow of the specific development project is lower than the carrying value, the asset is written down to the lower value. The booked value includes capitalized salary and related expenses for the cash flow producing project. Expected future free cash flow is based on budgets and anticipations prepared by management. The main parameters are the development in revenue, EBIT and working capital. Impairment losses represent principally assets which are no longer associated with a future income stream.
In 2023 and 2022, the Company recognized impairment of $0.1 million and $0.1 million on capitalized development costs, respectively, as a result of updated prioritization of future commercial projects.
The following table presents a summary of the Company’s development projects.
Deletions - completion of useful life
(507)
BALANCE AT DECEMBER 31 9,8507,487
ACCUMULATED AMORTIZATION AND IMPAIRMENT LOSSES:
Balance at January 1 (2,724) (2,724)
Amortization for year (2,053) (1,763)
Amortization associated with deletions 611,367
Amortization associated with impairment losses 77 396
BALANCE AT DECEMBER 31 (4,639) (2,724)
CARRYING AMOUNT
Other intangible assets
000’s)
COST:
2022
Exchange rate differences
ACCUMULATED AMORTIZATION AND IMPAIRMENT LOSSES:
- -
(436)
6,958
Balance at January 1 (233) (247)
Amortization for year (637) -
Exchange rate differences (29) 14
BALANCE AT DECEMBER 31 (899) (233) CARRYING AMOUNT
6,725
Impairment assessment. Due to losses incurred in 2022, management performed an impairment test and concluded that the net present value of expected future cash flows was sufficient to support the value of intangible assets at December 31, 2022. In 2023, management did not identify indicators of potential impairment of capitalized development costs or other intangible assets.
(USD 000’s) 2023 2022 Goodwill 543 526 Capitalized development costs 5,2114,763 Other assets 6,2966,725 TOTAL INTANGIBLE ASSETS 12,05012,014
(USD 000’s) 2023 2022
at January
7,4875,956 Additions 2,5613,405
development costs
COST: Balance
1
(61)
(137)
(1,367) Impairment loss
5,2114,763
(USD
2023
6,958
Additions
Balance at January 1
7,394
7,195
237
BALANCE AT DECEMBER 31
6,296
NOTES ASETEK Annual Report 2023 / Page 55
15. PROPERTY, PLANT AND EQUIPMENT
In 2023, the Company capitalized $22.8 million of costs associated with the construction of a new development center and headquarters facility, including $1.1 million of borrowing costs ($19.7 million and $0.5 million, respectively in 2022). Reference Note 19.
At December 31, 2023, the Company had outstanding commitments for additional construction costs totalling DKK 26.3 million ($3.9 million).
The Company’s plans for the new development and HQ facility are to lease sections of the building that are not occupied by Asetek for three to five years and to subsequently occupy the entire facility thereafter. The sections to be leased to others are contiguous with the premises occupied by Asetek and cannot be feasibly separated. As a result, the asset is accounted for as a domicile property, recorded at cost and depreciated over its estimated useful life after it is placed in service.
The following table presents total property, plant and equipment.
(USD 000’s) Leasehold ImprovementsMachinery Other fixtures, fittings, tools, equipmentProperties Building under construction Total COST: Balance at January 1, 2022 1,759 6,256 3,475 6,148 4,107 21,745 Additions - 1,338 1,038 92 19,747 22,215 Disposals - (232) (745) (98) - (1,075) Exchange rate differences (102) (319) (195) (173) - (789) BALANCE AT DECEMBER 31, 2022 1,657 7,043 3,573 5,969 23,854 42,095 Balance at January 1, 2023 1,657 7,043 3,573 5,969 23,854 42,095 Additions 20 1,517 843 29 22,766 25,175 Disposals (141) (852) (788) (654) - (2,435) Exchange rate differences (34) 246 92 98 - 402 BALANCE AT DECEMBER 31, 2023 1,502 7,954 3,720 5,442 46,620 65,237 ACCUMULATED DEPRECIATION: Balance at January 1, 2022 (1,236) (4,739) (2,462) (1,576) - (10,013) Disposals - 232 771 (100) - 903 Depreciation for the year (300) (902) (629) (576) - (2,407) Exchange rate differences 67 236 135 68 - 506 BALANCE AT DECEMBER 31, 2022 (1,469) (5,173) (2,185) (2,184) - (11,011) Balance at January 1, 2023 (1,469) (5,173) (2,185) (2,184) - (11,011) Disposals 141 849 701 654 - 2,345 Depreciation for the year (151) (1,058) (611) (590) - (2,410) Exchange rate differences 38 (173) (61) (68) - (264) BALANCE AT DECEMBER 31, 2023 (1,441) (5,555) (2,156) (2,188) - (11,340) CARRYING AMOUNT AT DECEMBER 31, 2022 188 1,870 1,388 3,785 23,854 31,084 CARRYING AMOUNT AT DECEMBER 31, 2023 61 2,399 1,564 3,254 46,620 53,897 NOTES ASETEK Annual Report 2023 / Page 56
16. TRADE RECEIVABLES AND OTHER
Trade receivables are non-interest bearing and are generally on payment terms of Net 30 days.
The trade receivables of Asetek Danmark A/S carry a general lien on the business of Asetek Danmark A/S (refer to Note 25). The carrying amount of trade receivables is approximately equal to fair value due to the short term to maturity. Regarding credit risks, refer to Note 3.
Credit Loss Provision Matrix 2022
The aging of trade receivables as of reporting date is as follows:
Past
000’s)
Past due:
Not yet due1 to 30 days
to 60 days Over 60 days
Lifetime expected credit loss (41) (6) (10) (22) (3)
17. INVENTORIES
The Company’s inventories are pledged as security for lines of credit outstanding as per Note 19. Inventories at December 31 are as follows:
(USD 000’s)
2023 2022
Raw materials and work-in-process 5,3204,234
Finished goods 4,9953,520
Total gross inventories 10,3157,754
Less provision for inventory reserves (1,262) (781)
TOTAL NET INVENTORIES 9,0536,973
(USD 000’s)
2023 2022
Inventories recognized as cost of sales during period (41,624) (29,885)
Write-down of inventories to net realizable value (1,262) (781)
A summary of the activity in the provision for inventory reserves is as follows:
Provision for inventory reserves
(USD 000’s)
Past due:
2023 2022
Balance at January 1 (781) (631)
Additions (1,262) (781)
Write-offs 781 631
BALANCE AT DECEMBER 31 (1,262) (781)
(USD 000’s) 2023 2022 Gross trade receivables 10,6418,792 Provision for uncollectible accounts (59) (41) NET TRADE RECEIVABLES 10,5828,751 Other receivables 1,1533,514 Prepaid assets 8761,167 TOTAL TRADE RECEIVABLES AND OTHER 12,61113,432
for uncollectible accounts (USD 000’s) 2023 2022 Balance at January 1 (41) (33) Additions (59) (41) Reversals 41 33 BALANCE AT DECEMBER 31 (59) (41)
Provision
due: (USD 000’s) Total Not yet due1 to 30 days 31 to 60 days Over 60 days December 31, 2023 10,641 9,355 1,142 71 73 December 31, 2022 8,792 5,797 1,821 410 764 Credit Loss Provision Matrix 2023
(USD 000’s) Total Not yet due1 to 30 days 31 to 60 days Over 60 days Gross carrying amount 10,641 9,355 1,142 71 73 Expected credit loss rate 0.1%0.4%4.2%58.9% Lifetime expected credit loss (59) (8) (5) (3) (43)
Total
31
Gross carrying amount 8,792 5,797 1,821 410 764 Expected credit loss rate 0.1%0.5%5.4%0.4%
(USD
NOTES ASETEK Annual Report 2023 / Page 57
18. SHARE CAPITAL
In May 2023, the Company issued 71,166,167 new common shares of stock in a rights offering, raising net proceeds of $16.1 million after deduction of total issuance costs of $3.7 million. The shares were issued through an offering to then-existing shareholders to purchase 2.62 common shares for each share held at a price of NOK3.00 per share, representing a 64% discount on fair market value. The transaction meets the requirements for exemption from accounting for derivative financial instruments per IAS 32 Financial Instruments Presentation.
In conjunction with the rights offering, the Company established a dual listing of its shares for trading on Nasdaq Copenhagen, in addition to its existing listing on Oslo Børs Stock Exchange. The Company plans to delist from Oslo Børs in March 2024. Operating expense in 2023 includes $0.8 million of non-recurring costs associated with the dual listing, classified as a special item in operating expense on the income statement.
In 2022, a total of 183 thousand options (0.6% of total shares, nominal value DKK 18.3 thousand) were exercised resulting in $216,000 received by the Company. In 2023, there were no stock options exercised.
As of December 31, 2023, there are 97,058 thousand common shares outstanding with a nominal value of 0.10 DKK per share and 1,256 thousand shares (1.3% of total shares, nominal value DKK 125.6 thousand) held in treasury. Included in equity is a reserve for treasury shares of approximately $11,206 thousand at December 31, 2023. All common shares outstanding are fully paid and carry no special rights.
The Company does not cancel shares that are repurchased but maintains them in treasury to fulfill option exercises. Refer to ‘Shareholder information’ in this report for information regarding the composition of Asetek shareholders.
The following table summarizes the common share activity in the years presented:
19. NET DEBT
In December 2023, the Company began to transition its existing lines of credit from Sydbank to Jyske Bank. The transition was completed in January 2024 (refer to Note 24). The Company’s debt at December 31, 2023 consists of the following:
// Asetek A/S, the Parent company, has a line of credit with Sydbank for DKK 100 million (USD 14.8 million), of which USD 14.7 million was utilized at December 31, 2023. This line is secured by the land and building under construction and carries interest at Danish CIBOR 3 rate plus 1.25 percentage points which in total was 5.16% at December 31, 2023. Payment in full is due December 31, 2024.
// Asetek Danmark A/S has a construction line of credit with Jyske Bank for DKK 75 million (USD $11.1 million), of which USD 1.5 million was utilized at December 31, 2023. The line is secured by the assets of Asetek Danmark A/S and carries interest at the Danish CIBOR 3 rate plus 1.95 percentage points, which in total was 5.86% at December 31, 2023. Payment in full is due January 1, 2025.
// Asetek Danmark A/S has a revolving line of credit with Sydbank for DKK 5 million (USD $0.7 million), of which zero was utilized at December 31, 2023. The line is secured by the assets of Asetek Danmark A/S and carries interest at the Danish CIBOR 3 rate plus 1.95 percentage points, which in total was 5.86% at December 31, 2023. Payment in full is due December 31, 2024.
Debt covenants. Under the terms of the lines of credit, the Company is required to comply with certain financial covenants as described in Note 3. As of December 31, 2023, the Company is in compliance with all covenants.
The capitalization rate for borrowing costs on lines of credit was 100% in both 2023 and 2022, as all funds drawn were utilized for additions to the qualifying asset.
In June 2023 and September 2022, the Company entered into agreements to finance $0.2 million and $1.1 million, respectively, of previously purchased equipment. The amortized cost of the equipment at transaction date was used as the estimate of fair value and the liability is accounted for at amortized cost using the effective interest rate method. The financing agreements carry interest at the Danish CIBOR 3 rate plus 2.4 to 3.1 percentage points, which in total ranged from 6.3% to 7.0% at December 31, 2023. The following is a summary of the Company’s net debt and reconciliation of the lines of credit:
(USD 000’s)
2023 2022
Line of credit - due within one year (14,700) (18,971)
Equipment financing - due within one year (270) (228)
Leases - amounts due within one year (812) (751)
DEBT INCLUDED IN CURRENT LIABILITIES (15,782) (19,950)
Line of credit - due after one year (1,489)Equipment financing - due after one year (756) (826)
Leases - amounts due after one year (351) (913)
TOTAL DEBT (18,378) (21,689)
Less cash and cash equivalents 9,121 7,411
NET DEBT (9,257) (14,278)
(USD 000’s)
2023 2022
Beginning balance, line of credit (18,971) (743)
Net paid (drawn) on line of credit 2,874 (17,892)
Foreign exchange impact (92) (336)
ENDING BALANCE, LINE OF CREDIT (16,189) (18,971)
(USD 000’s) 2023 2022 Common shares outstanding - January 1 25,891 25,708 Common shares issued in rights offering 71,167Options and warrants exercised and shares issued - 183 COMMON SHARES OUTSTANDING – DECEMBER 31 97,058 25,891
NOTES ASETEK Annual Report 2023 / Page 58
20. LEASES
Asetek leases certain equipment, its principal office facilities and certain motor vehicles. Contracts are typically for fixed periods of five years or more for office facilities, five years for equipment, and two years or less for motor vehicles. The leased asset is depreciated over the shorter of the asset’s useful life and the lease term on a straight-line basis. Operating expenses associated with leases of one year or less are not significant in 2023 and 2022.
The Company’s office space in Aalborg, Denmark is under lease through July 2025. The Company’s office space in Taipei, Taiwan is under lease until August 2025.
Right-of-use Assets. The following table presents a summary of the Right-of-use assets under lease, which is a subset of the property, plant and equipment presented in Note 15:
Total cash payments for leases was $840,000 and $826,000 in 2023 and 2022, respectively.
minimum lease payments are as follows as of the balance sheet date:
for the year - (76) (590) (666)
(1) (66) (67)
Reconciliation of lease liability (USD 000’s) 2023 2022 Beginning balance 1,664 2,500 Additions to lease liabilities 273 95 Payments of lease liabilities (802) (835) Adjustments/reductions to leases (54) (33) Foreign exchange impact 82 (63) ENDING BALANCE 1,163 1,664
Future minimum lease payments (USD 000’s) 2023 2022 Minimum lease payments at December 31 1,0101,687 Asset residual at end of lease 183 51 Less: amount representing interest (30) (74) TOTAL OBLIGATIONS UNDER LEASES 1,1631,664 Obligations under leases due within one year 812 751 Obligations under leases due after one year 351 913 TOTAL OBLIGATIONS UNDER LEASES 1,1631,664
Future
(USD
Machinery Other fixtures, fittings, tools, equipmentProperties Total COST: Balance at December 31, 2022 1,402 143 3,439 4,984 Additions - 290 29319 Disposals and transfers - (95) (654) (749) Exchange rate differences - 1 98 99 BALANCE AT DECEMBER 31, 2023 1,402 339 2,9124,653 ACCUMULATED DEPRECIATION: Balance at December 31, 2022 (1,098)
Disposals and transfers - 41
Depreciation
Exchange rate differences
BALANCE AT DECEMBER 31, 2023 (1,098) (68)
(3,326) CARRYING AMOUNT AT DECEMBER 31, 2022 304 111 1,281 1,696 CARRYING AMOUNT AT DECEMBER 31, 2023 304 271 7521,327 NOTES ASETEK Annual Report 2023 / Page 59
000’s)
(32) (2,158) (3,288)
654 695
-
(2,160)
21. TRANSACTIONS WITH RELATED PARTIES
The Company’s CEO serves as Chairman of the Board for a vendor that supplies information technology services to the Company. In 2023, the Company purchased services totaling $0.8 million ($0.7 million in 2022) from this vendor. At December 31, 2023 and 2022, the Company had outstanding payables to this vendor of $66,000 and $51,000, respectively.
The Company sponsors and occasionally purchases equipment and other services from Valdemar Eriksen Racing A/S (“VER”), an organization partially owned by the Company’s CEO. In the years ended December 31, 2023 and 2022, the Company paid $2,000 and $147,000 to VER.
22. SUBSIDIARIES
The following entities are included in the consolidated accounts:
Company Domicile Stake Voting ShareActivity
Asetek A/S Denmark 100%100% Trading
Asetek Holdings, Inc. USA 100%100% Inactive
Asetek USA, Inc. USA 100%100% Trading
Asetek Danmark A/S Denmark 100%100% Trading
Xiamen Asetek Computer Industry Co., Ltd. China 100%100% Trading
JMH Gallows Pound Technologies Limited United Kingdom 100%100% Inactive
23. AUDIT FEES
The Group’s principal auditors perform audits for all of Asetek’s entities except for the Xiamen, China subsidiary, which is audited by a local firm. The Group’s principal auditors received a total fee of $586,000 and $240,000 in 2023 and 2022, respectively.
Fees for services other than statutory audits provided by PricewaterhouseCoopers Statsautoriseret Revisionspartnerselskab to the group amount to $294,000 ($54,000 in 2022) and consists principally of financial review and verification of filings associated with the Company’s rights offering and listing on Nasdaq Copenhagen in May 2023, as well as tax advice related to transfer pricing and other miscellaneous services.
The fee is distributed between these services:
(USD 000’s) 2023 2022 Audit 215 130 Other assurance services 294 6 Tax services 62 88 Other services 15 16 TOTAL 586 240 NOTES ASETEK Annual Report 2023 / Page 60
24. POST BALANCE SHEET EVENTS
The Company has evaluated the period after December 31, 2023 up through the date of the Management Statement and determined that there were no transactions that required recognition in the Company’s financial statements, except for the following:
On January 5, 2024, the Company completed the transition of its principal banking relationship, moving the Asetek A/S line of credit totaling DKK 100 million (USD 14.8 million) to Jyske Bank. This line is secured by the land and building under construction and carries interest at Danish CIBOR 3 rate plus 1.25 percentage points. Payment in full is due January 1, 2025.
Also on January 5, 2024, the Company transitioned the Asetek Danmark A/S operating line of credit totaling DKK 5 million (USD 0.7 million) to Jyske Bank. This line of credit is secured by collateral as stated in Note 25, carries interest at Danish CIBOR 3 rate plus 1.95 percentage points, and payment in full is due January 1, 2025.
25. CONTINGENT LIABILITIES
Debt collateral. In conjunction with the debt referenced in Note 19, Asetek’s creditors have secured the following as collateral for the credit provided:
// Asetek Danmark A/S lines of credit totaling DKK 80 million (DKK 75 million with Jyske Bank and DKK 5 million with Sydbank) are secured by a lien on the Asetek Danmark A/S business totaling DKK 105 million (USD 15.6 million).
// Asetek A/S, line of credit with Sydbank of DKK 100 million (USD 14.8 million), is secured by the Company’s property and building under construction at Skjoldet 20, 9230 Svenstrup, Denmark.
Legal proceedings. In the ordinary course of conducting business, the Company is involved in various intellectual property proceedings, including those in which it is a plaintiff that are complex in nature and have outcomes that are difficult to predict. Asetek records accruals for such contingencies to the extent that it is probable that a liability will be incurred, and the amount of the related loss can be reasonably estimated. The Company’s assessment of each matter may change based on future unexpected events. An unexpected adverse judgment in any pending litigation could cause a material impact on the Group’s business operations, intellectual property, results of operations or financial position. In addition to the above, Asetek Group is engaged in various other ongoing cases. In the opinion of Management, neither settlement nor continuation of such proceedings are expected to have a material effect on Asetek’s financial position, operating profit or cash flow.
The Company has challenged the Danish tax authorities in a matter related to the deductiblity of expenses related to stock options granted to certain employees of a subsidiary. The maximum tax exposure for the Company is about $0.1 million. A formal complaint has been initiated and further proceedings are pending.
In May 2021, Asetek filed a patent infringement lawsuit against Shenzen Apaltek Co. Ltd. and Apalcool (Guangdong Ang Pai Liquid Cooling Technology Co., Ltd.) in the Western District of Texas (WDTX) seeking judgment that Apaltek and Apalcool infringe Asetek’s U.S. Patent Nos. 8,240,362 (“the ’362 patent) and 8,245,764 (“the ’764 patent). Asetek moved to dismiss this case in 2023. The court granted Asetek’s motion to dismiss and denied Apaltek’s motion for attorneys’ fees. Apaltek also filed review petitions with the Patent Trial and Appeal Board (PTAB) of the U.S. Patent and Trademark Office (USPTO) to challenge the validity of Asetek’s ’362 and ’764 patents. Asetek did not file oppositions to Apaltek’s petitions. The PTAB found Asetek’s ’362 and ’764 patents unpatentable (invalid) in January 2024. The PTAB has also ruled that Asetek’s U.S. Patent Nos. 10,078,354 (“the ’354 patent”) and 10,078,355 (“the ’355 patent”) invalid. The court of appeal affirmed the PTAB’s finding for the ’354 patent and may also affirm for the ’355 patent. The matter is not expected to result in a significant expense to the Company.
In June 2021, Cooler Master Co., Ltd. and CMI USA, Inc. filed an action in the United States District Court, Northern District of California, requesting declaratory judgment that certain Cooler Master products do not infringe Asetek’s ‘362, ‘764, ’354 and ‘355 patents, or Asetek’s U.S. Patent Nos. 10,599,196 (“the ’196 patent), a 10,613,601 (“the ’601 patent”). The court granted Asetek’s motion to stay this case in view of other ongoing proceedings summarized herein. The case remains stayed.
NOTES ASETEK Annual Report 2023 / Page 61
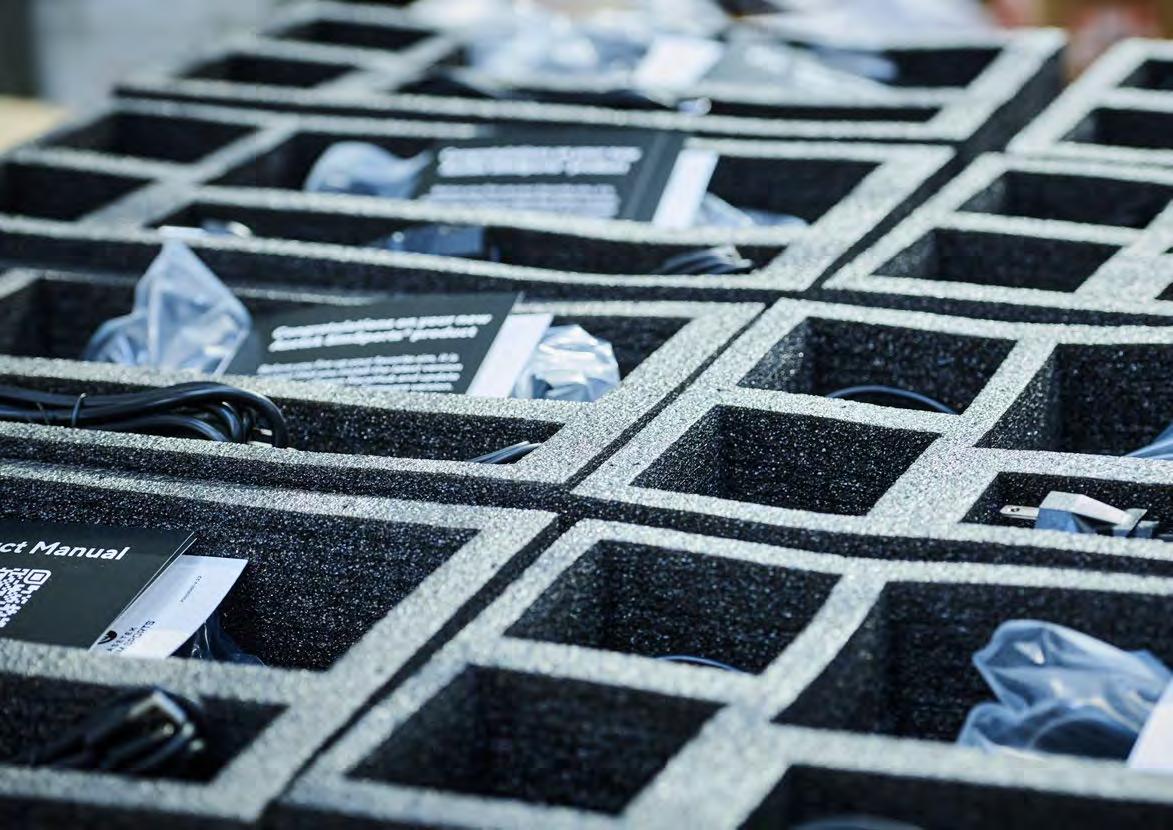
PARENT COMPANY FINANCIAL STATEMENTS Comprehensive income statement, parent company 63 Balance Sheet, parent company 64 Statement of changes in equity, parent company 65 Statement of cash flows, parent company66 Notes, parent company 67
COMPREHENSIVE INCOME STATEMENT, PARENT COMPANY
(USD 000’s) Note 2023 2022 Service fees 14 3,699 3,737 TOTAL REVENUE 3,699 3,737 Research and development 3, 4 (61) (64) Selling, general and administrative 3, 4 (3,769) (2,975) Special items 3 (847)TOTAL OPERATING EXPENSES (4,677) (3,039) OPERATING INCOME (978) 698 Foreign exchange gain (loss) 6 (294) (821) Finance income 6 101 405 Finance costs 6 (333) (18) TOTAL FINANCIAL INCOME (526) (434) INCOME BEFORE TAX (1,504) 264 Income tax (expense) benefit 10 58 (154) INCOME FOR THE YEAR (1,446) 110 TOTAL COMPREHENSIVE INCOME (LOSS) (1,446) 110 FINANCIAL STATEMENTS, PARENT COMPAMY ASETEK Annual Report 2023 / Page 63
BALANCE SHEET, PARENT COMPANY
(USD 000’s) Note 2023 2022 ASSETS NON-CURRENT ASSETS Investments in subsidiaries 1120,10020,100 Property, plant and equipment 7 49,54926,430 Receivables from subsidiaries 12 3372,432 TOTAL NON-CURRENT ASSETS 69,98648,962 CURRENT ASSETS Other assets 9992,452 Cash and cash equivalents 1831,609 TOTAL CURRENT ASSETS 1,1824,061 TOTAL ASSETS 71,16853,023 (USD 000’s) Note 2023 2022 EQUITY AND LIABILITIES EQUITY Share capital 131,478444 Retained earnings 58,96144,785 Translation and other reserves (11,206) (11,206) TOTAL EQUITY 49,23334,023 NON-CURRENT LIABILITIES Payables to subsidiaries 125,323385 TOTAL NON-CURRENT LIABILITIES 5,323385 CURRENT LIABILITIES Short-term debt 8, 914,89614,294 Accrued liabilities 153275 Accrued compensation and employee benefits 65246 Trade payables 1,4983,800 TOTAL CURRENT LIABILITIES 16,61218,615 TOTAL LIABILITIES 21,93519,000 TOTAL EQUITY AND LIABILITIES 71,16853,023 FINANCIAL STATEMENTS, PARENT COMPAMY ASETEK Annual Report 2023 / Page 64
PARENT
(USD 000’s) Share capital Share premium Translation reserves Treasury share reserves Retained earnings Total EQUITY AT DECEMBER 31, 2021 442 - - (11,206) 44,022 33,257 Total comprehensive income for 2022 Income for the year - - - - 110 110 Total comprehensive income for 2022 - - - - 110 110 Transactions with owners in 2022 Shares issued upon exercise of options 2 - - - 214 216 Share-based payment expense - - - - 440 440 Transactions with owners in 2022 2 - - - 654 656 EQUITY AT DECEMBER 31, 2022 444 - - (11,206) 44,785 34,023 Total comprehensive income for 2023 Income for the year - - - - (1,446) (1,446) Total comprehensive income for 2023 - - - - (1,446) (1,446) Transactions with owners in 2023 Shares issued in rights offering, net of issuance costs 1,034 15,108 - - 16,142 Transfer - (15,108) - - 15,108Share-based payment expense - - - - 514 514 Transactions with owners in 2023 1,034 - - - 15,622 16,656 EQUITY AT DECEMBER 31, 2023 1,478 - - (11,206) 58,961 49,233 FINANCIAL STATEMENTS, PARENT COMPAMY ASETEK Annual Report 2023 / Page 65
STATEMENT OF CHANGES IN EQUITY,
COMPANY
STATEMENT OF CASH FLOWS, PARENT COMPANY
(USD 000’s) Note 2023 2022 CASH FLOWS FROM OPERATING ACTIVITIES Income (loss) for the year (1,446)110 Depreciation and amortization 7 86 43 Share-based payments expense 4 514 440 Finance cost incurred 6 1,062 205 Finance cost, cash paid 6 (1,058) (203) Income tax expense (income) 10 (58)154 Cash received (paid) for income taxes 841 481 Changes in other assets 3,548 (2,140) Changes in trade payables and accrued liabilities (3,385)634 NET CASH PROVIDED (USED) BY OPERATING ACTIVITIES 104 (276) CASH FLOWS FROM INVESTING ACTIVITIES Purchase of property and equipment 7 (22,985) (19,747) Net receipts from (payments to) subsidiaries 12 4,938 3,357 NET CASH USED IN INVESTING ACTIVITIES (18,047) (16,390) FREE CASH FLOW (17,943) (16 666) (USD 000’s) Note 2023 2022 CASH FLOWS FROM FINANCING ACTIVITIES Lease payments on right-of-use assets 9 (88) (42) Borrowings on line of credit 8 464 14,236 Proceeds from issuance of share capital 13 17,019 216 Costs incurred for issuance of share capital 13 (878)NET CASH PROVIDED (USED) BY FINANCING ACTIVITIES 16,517 14,410 NET CHANGES IN CASH AND CASH EQUIVALENTS (1,426) (2,256) Cash and cash equivalents at beginning of period 1 6093 605 CASH AND CASH EQUIVALENTS AT END OF PERIOD 183 1,609 SUPPLEMENTAL DISCLOSURE - NON-CASH ITEMS Right-of-use assets acquired under leases 273 95 FINANCIAL STATEMENTS, PARENT COMPAMY ASETEK Annual Report 2023 / Page 66
NOTES, PARENT COMPANY
1. GENERAL INFORMATION
Regarding accounting policies, refer to Note 1 to the Consolidated Financial Statements.
2. SUMMARY OF SIGNIFICANT ACCOUNTING POLICIES
The 2023 financial statements for Asetek A/S have been prepared in accordance with International Financial Re- porting Standards (IFRS) as issued by IASB and adopted by the EU.
The financial statements are presented in U.S. Dollars (USD), which is the functional currency.
The accounting policies for the Parent Company are the same as for the Asetek Group, as per Note 2 to the consolidated financial statements, with the exception of the items listed below:
1.1. Dividends on investments in subsidiaries, joint ventures and associates. Dividends on investments in subsidiaries, joint ventures and associates are recognized as income in the income statement of the Parent Company in the financial year in which the dividend is declared.
1.2. Investments in subsidiaries, joint ventures and associates. Investments in subsidiaries, joint ventures and associates are measured at the lower of cost or the recoverable amount. An impairment test on the investment in subsidiaries is performed if the carrying amount of the subsidiaries’ net assets is below the carrying value of the Parent Company’s investments in the consolidated financial statements.
3. TOTAL OPERATING EXPENSES
Operating expenses consisted of the following for the year ended December 31
Special item. In May 2023, In conjunction with the rights offering described in Note 18 of the consolidated financial statements, the Company began transition of its shares for trading from Oslo Stock Exchange to Nasdaq Copenhagen. Operating expense in 2023 includes $0.8 million of non-recurring costs associated with this listing change, classified as a special item in operating expense on the income statement.
4. PERSONNEL EXPENSES
Total personnel costs by type for the year ended December 31
Total
The average number of employees in the Parent company is two for both years presented. The figures listed above include a portion of the executive management’s cash compensation based on an estimate of the actual resources allocated to the management of the Parent company. The figures include incentive-based compensation in the form of share options and warrants granted to employees in the Asetek Group. Refer to Notes 6 and 7 in the Consolidated Financial Statements for information regarding incentive compensation programs and management remuneration.
Remuneration of the Group Board of Directors is specified in Note 6 to the Consolidated Financial Statements. The Company’s share-based incentive pay program is described in Note 7 to the Consolidated Financial Statements.
(USD 000’s) 2023 2022 Personnel expenses (Note 4) 2,4622,047 Legal, consultants and auditor 622 400 Special item 847Other expenses 746 592 TOTAL EXPENSES 4,677 4,6773,039
(USD 000’s) 2023 2022 Salaries, pension and other 1,9481,607 Share-based payment 514 440 TOTAL PERSONNEL EXPENSES 2,4622,047
personnel
December 31 (USD 000’s) 2023 2022 Research and development 61 64 Selling, general and administrative 2,4011,983 TOTAL EXPENSES 2,4622,047
costs by classification in the income statement for the year ended
NOTES, PARENT COMPANY ASETEK Annual Report 2023 / Page 67
5. AUDIT FEES
Fees associated with the Parent company financial statements for services provided by the Company’s principal auditors were as follows:
7. PROPERTY, PLANT AND EQUIPMENT
The Company’s plans for the new development and HQ facility are to lease sections of the building that are not occupied by Asetek for three to five years and to subsequently occupy the entire facility thereafter. The sections to be leased to others are contiguous with the premises occupied by Asetek and cannot be feasibly separated. As a result, the asset is accounted for as a domicile property, recorded at cost and depreciated over its estimated useful life after it is placed in service.
As of December 31, 2023 and 2022, carrying value of vehicles under right-of-use leases totaled $195,000 and $76,000, respectively, and their associated leases are for terms of 12 months. Total property, plant and equipment is specified as follows:
Services other than statutory audit are described in Note 23 in the consolidated financial statements.
6. FINANCIAL INCOME AND COSTS
(USD 000’s) 2023 2022 Audit 157 76 Other assurance services 294 5 Tax services 62 11 Other services 14TOTAL 527 92
(USD 000’s) 2023 2022 FOREIGN EXCHANGE GAIN (LOSS) (294) (821) Interest income on loans to subsidiaries 90 402 Interest from bank accounts 12 3 FINANCE INCOME 101 405 Interest cost on loans from subsidiaries (326)Interest cost on line of credit (698) (127) Interest cost on leases (4) (2) Other banking and finance fees (34) (76) Subtotal (1,062) (205) Less: amount capitalized 729 187 FINANCE COST (333) (18)
Company Vehicles and softwareProperties Building under construction Total COST: Balance at January 1, 2022 118 2,493 4,107 6,718 Additions 95 - 19,747 19,842 Disposals (55) - - (55) BALANCE AT DECEMBER 31, 2022 158 2,493 23,854 26,505 Balance at January 1, 2023 158 2,493 23,854 26,505 Additions 492 - 22,766 23,258 Disposals (95) - - (95) BALANCE AT DECEMBER 31, 2023 555 2,493 46,620 49,668 ACCUMULATED DEPRECIATION: Balance at January 1, 2022 (53) - - (53) Disposals 21 - - 21 Depreciation for the year (43) - -
BALANCE AT DECEMBER
Balance at January
-
Disposals 42 - - 42 Depreciation for the year (86) - - (86) BALANCE AT DECEMBER 31, 2023 (119) - - (119) CARRYING AMOUNT AT DECEMBER 31, 2022 83 2,493 23,854 26,430 CARRYING AMOUNT AT DECEMBER 31, 2023 436 2,493 46,620 49,549 NOTES, PARENT COMPANY ASETEK Annual Report 2023 / Page 68
(43)
31, 2022 (75) - - (75)
1, 2023 (75)
- (75)
8. NET DEBT
Asetek A/S has a line of credit with Sydbank for DKK 100 million (USD 14.8 million), of which $14.7 million is outstanding at December 31, 2023. This line carries interest at Danish CIBOR 3 rate plus 1.25 percentage points which in total was 5.16% at December 31, 2023, and payment in full is due December 31, 2024.
Net debt is as follows at December 31:
10. INCOME TAX
At December 31, 2023 and 2022, the tax benefit (provision) for Asetek A/S differed from the statutory tax rate as a result of share compensation expenses that are treated differently for tax purposes.
(USD 000’s) 2023 2022 INCOME BEFORE TAX (1,504) 264
Tax calculated at domestic rates applicable to profits/losses in respective countries 331 (58)
Differences between book and tax (273) (96)
58 (154)
11. INVESTMENT IN SUBSIDIARIES
(USD 000’s)
9. LEASES
Obligations
are as follows:
Total lease obligations due within one year were $196,000 and $58,000 at December 31, 2023 and 2022, respectively. Operating expenses associated with leases of one year or less are not significant.
Asetek A/S acquired 100% of Asetek Holdings, Inc. through the exchange of shares in February 2013. At the time of acquisition, Asetek Holdings, Inc. had negative net equity, resulting in the initial investment to be valued at zero. Asetek Holdings, Inc. represents Asetek A/S’s only direct investment in subsidiaries.
(USD 000’s) 2023 2022 Line of credit - due within one year (14,700) (14,236) Leases - amounts due within one year (196) (58) TOTAL DEBT (14,896) (14,294) Less cash and cash equivalents 183 1,609 NET DEBT (14,713) (12,685) Reconciliation of line of credit (USD 000’s) 2023 2022
balance (14,236)Net paid (drawn) on line of credit (464) (14,236) ENDING BALANCE, LINE OF CREDIT (14,700) (14,236)
Beginning
under leases
(USD 000’s) 2023 2022 Minimum lease payments as of December 31 15 7 Asset residual value at end of lease 184 52 Less: amount representing interest (3) (1) TOTAL OBLIGATIONS UNDER LEASES 196 58
INCOME TAX (EXPENSE)
Investment
Asetek
Balance at
20,100 Additions
Balance at December 31, 2023 20,100 CARRYING AMOUNT AT DECEMBER 31, 2022 20,100 CARRYING AMOUNT AT DECEMBER 31, 2023 20,100
in
Holdings, Inc.
December 31, 2022
-
NOTES, PARENT COMPANY ASETEK Annual Report 2023 / Page 69
12. NET RECEIVABLES FROM (PAYABLES TO) SUBSIDIARIES
Net receivables is as follows at December 31:
Asetek Danmark A/S has a line of credit to support the construction of the development center and headquarters facility for Asetek A/S. The total outstanding on this line of credit was $1.5 million as of December 31, 2023. Refer to Note 19 to the Consolidated Financial Statements. Borrowing costs of $0.4 million and $0.3 million incurred in 2023 and 2022, respectively, on the Asetek Danmark A/S line of credit are included as capitalized cost of the building under construction.
13. EQUITY
Refer to Note 18 to the Consolidated Financial Statements.
14. TRANSACTIONS WITH RELATED PARTIES
Asetek A/S charges its subsidiaries a management service fee. Reference Notes 4, 6 and 12 regarding transactions with subsidiaries. With regard to transactions with related parties that are not subsidiaries, refer to Note 21 to the Consolidated Financial Statements.
15. EVENTS AFTER THE REPORTING PERIOD
Refer to Note 24 to the Consolidated Financial Statements.
16. CONTINGENT LIABILITIES
The Danish group enterprises are jointly and severally liable for tax on group income subject to joint taxation, as well as for Danish withholding taxes by way of dividend tax, royalty tax, tax on unearned income and any subsequent adjustments to these. Asetek A/S has executed a guarantee to its Group’s principal bank, Jyske Bank, for all outstanding matters with its wholly owned subsidiary, Asetek Danmark A/S. Refer to Note 25 to the Consolidated Financial Statements.
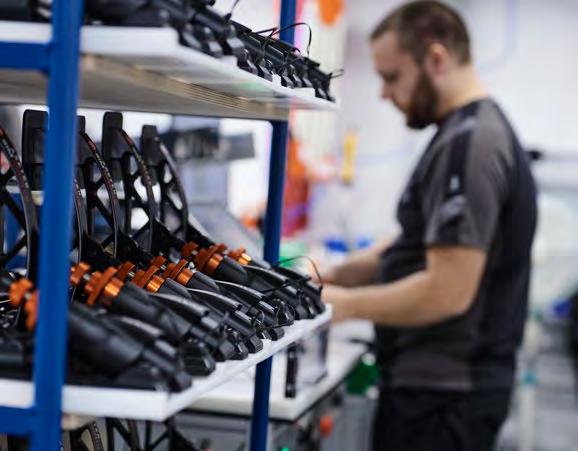
(USD 000’s) 2023 2022 Asetek Danmark A/S (5,323) (385) Asetek USA, Inc. 1352,291 Asetek Xiamen 109 49 Asetek Holdings, Inc. 93 92 NET DUE FROM (TO) SUBSIDIARIES (4,986)2,047 AVERAGE EFFECTIVE INTEREST RATE 10.2%7.4%
NOTES, PARENT COMPANY ASETEK Annual Report 2023 / Page 70
MANAGEMENT STATEMENT
The Board of Directors and Executive Board have today considered and adopted the Annual Report of Asetek A/S for the financial year January 1 – December 31, 2023. The Annual Report has been prepared in accordance with International Financial Reporting Standards as adopted by the EU and further requirements in the Danish Financial Statements Act.
In our opinion, the Consolidated Financial Statements and Parent Company Financial Statements give a true and fair view of the financial position at December 31, 2023 of the Group and the Parent company and of the results of the Group and Parent company operations and cash flows for 2023.
In our opinion, Management’s Report includes a true and fair account of the development in the operations and financial circumstances of the Group and the Parent company as well as a description of the most significant risks and elements of uncertainty facing the Group and the Parent company.
In our opinion, the annual report of Asetek A/S for the financial year 1 January to 31 December 2023 with the file name Asetek-2023-12-31-en.zip is prepared, in all material respects, in compliance with the ESEF Regulation.
Aalborg, Denmark March 8, 2024 Management


 André S. Eriksen CEO
Peter Dam Madsen CFO Board of Directors
René Svendsen-Tune Chairman
Erik Damsgaard Vice chairman
Maria Hjorth Member
Jukka Pertola Member
Maja Frølunde Sand-Grimnitz Member
André S. Eriksen CEO
Peter Dam Madsen CFO Board of Directors
René Svendsen-Tune Chairman
Erik Damsgaard Vice chairman
Maria Hjorth Member
Jukka Pertola Member
Maja Frølunde Sand-Grimnitz Member
MANAGEMENT STATEMENT ASETEK Annual Report 2023 / Page 71
INDEPENDENT AUDITOR’S REPORTS
To the shareholders of Asetek A/S
REPORT ON THE AUDIT OF THE FINANCIAL STATEMENTS
Our opinion
In our opinion, the Consolidated Financial Statements and the Parent Company Financial Statements give a true and fair view of the Group’s and the Parent Company’s financial position at 31 December 2023 and of the results of the Group’s and the Parent Company’s operations and cash flows for the financial year 1 January to 31 December 2023 in accordance with IFRS Accounting Standards as adopted by the EU and further requirements in the Danish Financial Statements Act. Our opinion is consistent with our Auditor’s Long-form Report to the Audit Committee and the Board of Directors.
What we have audited
The Consolidated Financial Statements and Parent Company Financial Statements of Asetek A/S for the financial year 1 January to 31 December 2023 comprise statement of comprehensive income, balance sheet, statement of changes in equity, cash flow statement and notes, including material accounting policy information for the Group as well as for the Parent Company. Collectively referred to as the “Financial Statements”.
Basis for opinion
We conducted our audit in accordance with International Standards on Auditing (ISAs) and the additional requirements applicable in Denmark. Our responsibilities under those standards and requirements are further described in the Auditor’s responsibilities for the audit of the Financial Statements section of our report. We believe that the audit evidence we have obtained is sufficient and appropriate to provide a basis for our opinion.
Independence
We are independent of the Group in accordance with the International Ethics Standards Board for Accountants’ International Code of Ethics for Professional Accountants (IESBA Code) and the additional ethical requirements applicable in Denmark. We have also fulfilled our other ethical responsibilities in accordance with these requirements and the IESBA Code.
To the best of our knowledge and belief, prohibited non-audit services referred to in Article 5(1) of Regulation (EU) No 537/2014 were not provided.
Appointment
Following the admission of the shares of Asetek A/S for listing on Oslo Stock Exchange, we were first appointed auditors of Asetek A/S on 24 April 2014. We have been reappointed annually by shareholder resolution for a total period of uninterrupted engagement of 10 years including the financial year 2023.
INDEPENDENT AUDITOR’S REPORTS ASETEK Annual Report 2023 / Page 72
Key audit matters
Key audit matters are those matters that, in our professional judgement, were of most significance in our audit of the Financial Statements for 2023. These matters were addressed in the context of our audit of the Financial Statements as a whole, and in forming our opinion thereon, and we do not provide a separate opinion on these matters.
Key audit matter
Capitalisation of development costs
The Group capitalises development costs when certain criteria according to IFRS are met. The criteria for recognition and measurement of development costs are subject to Management’s judgment and assumptions, which is uncertain by nature. Completed development projects are assessed for impairment indications. For in-progress development projects impairment tests are performed at least annually. The impairment tests are based on the strategy plan approved by Management and value-in-use calculations based on expected future cash flows.
We focused on this area because the criteria for recognition and measurement of development projects are subject to Management judgments and assumptions.
Refer to note 14 in the Consolidated Financial Statements.
How our audit addressed the key audit matter
We assessed whether the Group’s accounting policies are in accordance with IFRS Accounting Standards.
We carried out risk assessment procedures in order to obtain an understanding of IT systems, business processes and relevant controls regarding capitalised development costs. For the controls, we assessed whether they were designed and implemented to effectively address the risk of material misstatement.
We selected a sample of in-progress development projects and considered whether all criteria described in IFRS Accounting Standards were met as basis for capitalisation.
We evaluated and challenged Management’s assessment of impairment indicators of completed development projects based on the commercial prospects of the projects. For in-progress development projects and projects with impairment indicators, we challenged the key assumptions applied in the value-in-use calculations. Our work was based on our understanding of the business cases and significant assumptions applied.
We challenged whether the intent to finalise the projects remain and whether the projects are expected to generate future economic benefits exceeding the carrying values.
INDEPENDENT AUDITOR’S REPORTS ASETEK Annual Report 2023 / Page 73
Statement on Management’s Review
Management is responsible for Management’s Review.
Our opinion on the Financial Statements does not cover Management’s Review, and we do not express any form of assurance conclusion thereon. In connection with our audit of the Financial Statements, our responsibility is to read Management’s Review and, in doing so, consider whether Management’s Review is materially inconsistent with the Financial Statements, or our knowledge obtained in the audit, or otherwise appears to be materially misstated. Moreover, we considered whether Management’s Review includes the disclosures required by the Danish Financial Statements Act.
Based on the work we have performed, in our view, Management’s Review is in accordance with the Consolidated Financial Statements and the Parent Company Financial Statements and has been prepared in accordance with the requirements of the Danish Financial Statements Act. We did not identify any material misstatement in Management’s Review.
Management’s responsibilities for the Financial Statements
Management is responsible for the preparation of consolidated financial statements and parent company financial statements that give a true and fair view in accordance with IFRS Accounting Standards as adopted by the EU and further requirements in the Danish Financial Statements Act, and for such internal control as Management determines is necessary to enable the preparation of financial statements that are free from material misstatement, whether due to fraud or error. In preparing the Financial Statements, Management is responsible for assessing the Group’s and the Parent Company’s ability to continue as a going concern, disclosing, as applicable, matters related to going concern and using the going concern basis of accounting unless Management either intends to liquidate the Group or the Parent Company or to cease operations, or has no realistic alternative but to do so.
Auditor’s responsibilities for the audit of the Financial Statements
Our objectives are to obtain reasonable assurance about whether the Financial Statements as a whole are free from material misstatement, whether due to fraud or error, and to issue an auditor’s report that includes our opinion. Reasonable assurance is a high level of assurance but is not a guarantee that an audit conducted in accordance with ISAs and the additional requirements applicable in Denmark will always detect a material misstatement when it exists. Misstatements can arise from fraud or error and are considered material if, individually or in the aggregate, they could reasonably be expected to influence the economic decisions of users taken on the basis of these Financial Statements.
As part of an audit in accordance with ISAs and the additional requirements applicable in Denmark, we exercise professional judgement and maintain professional scepticism throughout the audit. We also:
• Identify and assess the risks of material misstatement of the Financial Statements, whether due to fraud or error, design and perform audit procedures responsive to those risks, and obtain audit evidence that is sufficient and appropriate to provide a basis for our opinion. The risk of not detecting a material misstatement resulting from fraud is higher than for one resulting from error, as fraud may involve collusion, forgery, intentional omissions, misrepresentations, or the override of internal control.
• Obtain an understanding of internal control relevant to the audit in order to design audit procedures that are appropriate in the circumstances, but not for the purpose of expressing an opinion on the effectiveness of the Group’s and the Parent Company’s internal control.
• Evaluate the ppropriateness of accounting policies used and the reasonableness of accounting estimates and related disclosures made by Management.
INDEPENDENT AUDITOR’S REPORTS ASETEK Annual Report 2023 / Page 74
• Conclude on the appropriateness of Management’s use of the going concern basis of accounting and based on the audit evidence obtained, whether a material uncertainty exists related to events or conditions that may cast significant doubt on the Group’s and the Parent Company’s ability to continue as a going concern. If we conclude that a material uncertainty exists, we are required to draw attention in our auditor’s report to the related disclosures in the Financial Statements or, if such disclosures are inadequate, to modify our opinion. Our conclusions are based on the audit evidence obtained up to the date of our auditor’s report. However, future events or conditions may cause the Group or the Parent Company to cease to continue as a going concern.
• Evaluate the overall presentation, structure, and content of the Financial Statements, including the disclosures, and whether the Financial Statements represent the underlying transactions and events in a manner that gives a true and fair view.
• Obtain sufficient appropriate audit evidence regarding the financial information of the entities or business activities within the Group to express an opinion on the Consolidated Financial Statements. We are responsible for the direction, supervision, and performance of the group audit. We remain solely responsible for our audit opinion.
We communicate with those charged with governance regarding, among other matters, the planned scope and timing of the audit and significant audit findings, including any significant deficiencies in internal control that we identify during our audit.
We also provide those charged with governance with a statement that we have complied with relevant ethical requirements regarding independence, and to communicate with them all relationships and other matters that may reasonably be thought to bear on our independence and, where applicable, actions taken to eliminate threats or safeguards applied.
From the matters communicated with those charged with governance, we determine those matters that were of most significance in the audit of the Financial Statements of the current period and are therefore the key audit matters. We describe these matters in our auditor’s report unless law or regulation precludes public disclosure about the matter.
Report on compliance with the ESEF Regulation
As part of our audit of the Financial Statements we performed procedures to express an opinion on whether the annual report of Asetek A/S for the financial year 1 January to 31 December 2023 with the file name Asetek-2023-12-31-en.zipis prepared, in all material respects, in compliance with the Commission Delegated Regulation (EU) 2019/815 on the European Single Electronic Format (ESEF Regulation) which includes requirements related to the preparation of the annual report in XHTML format and iXBRL tagging of the Consolidated Financial Statements including notes. Management is responsible for preparing an annual report that complies with the ESEF Regulation. This responsibility includes:
• The preparing of the annual report in XHTML format;
• The selection and application of appropriate iXBRL tags, including extensions to the ESEF taxonomy and the anchoring thereof to elements in the taxonomy, for all financial information required to be tagged using judgement where necessary;
• Ensuring consistency between iXBRL tagged data and the Consolidated Financial Statements presented in human-readable format; and
• For such internal control as Management determines necessary to enable the preparation of an annual report that is compliant with the ESEF Regulation.
Our responsibility is to obtain reasonable assurance on whether the annual report is prepared, in all material respects, in compliance with the ESEF Regulation based on the evidence we have obtained, and to issue a report that includes our opinion. The nature, timing and extent of procedures selected depend on the auditor’s judgement, including the assessment of the risks of material departures from the requirements set out in the ESEF Regulation, whether due to fraud or error. The procedures include:
• Testing whether the annual report is prepared in XHTML format;
• Obtaining an understanding of the company’s iXBRL tagging process and of internal control over the tagging process;
INDEPENDENT AUDITOR’S REPORTS ASETEK Annual Report 2023 / Page 75
• Evaluating the completeness of the iXBRL tagging of the Consolidated Financial Statements including notes;
• Evaluating the appropriateness of the company’s use of iXBRL elements selected from the ESEF taxonomy and the creation of extension elements where no suitable element in the ESEF taxonomy has been identified;
• Evaluating the use of anchoring of extension elements to elements in the ESEF taxonomy; and
• Reconciling the iXBRL tagged data with the audited Consolidated Financial Statements.
In our opinion, the annual report of Asetek A/S for the financial year 1 January to 31 December 2023 with the file name Asetek-2023-12-31-en.zip is prepared, in all material respects, in compliance with the ESEF Regulation.
Aarhus, March 8, 2024
PricewaterhouseCoopers
Statsautoriseret Revisionspartnerselskab
CVR no 3377 1231

Mads Melgaard Line Borregaard
State Authorised Public Accountant State Authorised Public Accountant mne34354 mne34353

INDEPENDENT AUDITOR’S REPORTS ASETEK Annual Report 2023 / Page 76
DEFINITIONS OF RATIOS AND METRICS
Asetek uses various metrics, financial and non-financial ratios which provide shareholders with useful information about the Group’s financial position, performance and development.
PROFIT & LOSS
Adjusted EBITDA Operating income + amortization & depreciation + share-based compensation + special items
Gross margin Gross profit / Revenue
Operating margin Operating income / Revenue
Return on Invested Capital (ROIC)
Income for the year / Invested capital
Organic growth (Revenue current year – Comparable revenue* prior year) / Comparable revenue* prior year
BALANCE SHEET
Invested capital Equity raised from sale of shares and conversion of debt + interest bearing debt
Quick ratio (Cash and cash equivalents + Trade receivables and other) / Total Current Liabilities
Current ratio
Total current assets / Total current liabilities
Days sales outstanding Trade receivables / (Revenue / 365 days)
Inventory turns per year Cost of sales / (beginning inventory + ending inventory / 2)
Days payable outstanding Trade payables / (Cost of sales / 365 days)
Debt to equity Interest-bearing debt / Total equity
* Comparable revenue excludes changes in revenue attributable to foreign exchange rates and any acquisitions or divestments.
STOCK MARKET
Earnings per share, basic Refer to Note 12 of the Consolidated financial statements
Earnings per share, diluted Refer to Note 12 of the Consolidated financial statements
Share price to earnings Share price / NOK to USD exchange rate / Earnings per share, diluted. If earnings is negative, not reported.
Market capitalization (Shares issued – Treasury shares) x (Share price in NOK / NOK to USD exchange rate)
BUSINESS DRIVERS
Average selling price per unit, Liquid Cooling Liquid cooling revenue / Sealed loop units shipped
Revenue per employee Revenue / Number of employees
DEFINITION OF RATIOS AND METRICS ASETEK Annual Report 2023 / Page 77
