El Niño
A Review of Scientific Understanding and the Impacts of 1997/98 Event in Malaysia
El Niño -
A Review of Scientific Understanding and the Impacts of 1997/98 Event in Malaysia
2018
El NiñoA Review of Scientific Understanding and the Impacts of 1997/98 Event in Malaysia
© Academy of Sciences Malaysia 2018
All Rights Reserved. No part of this publication may be reproduced, stored in a retrieval system,or transmitted in any form or by any means, electronic, mechanical, photocopying, recording or otherwise without prior permission in writing from the Academy of Sciences Malaysia.
Academy of Sciences Malaysia Level 20, West Wing, MATRADE Tower
Jalan Sultan Haji Ahmad Shah off Jalan Tuanku Abdul Halim 50480 Kuala Lumpur, Malaysia
Cataloguing-in-PublicationData
ElNiño:AReviewofScientificUnderstandingandtheImpactsof1997/98Eventin Malaysia.
Modeofaccess:Internet eISBN978-983-2915-87-4
1.ElNiñoCurrent.
2.Oceancurrents--PacificOcean.
3.Governmentpublications--Malaysia.
4.Electronicbooks. 551.6
PerpustakaanNegaraMalaysia
CONTENTS List of Abbreviations i Lead Authors and Contributors ii Executive Summary iv Chapter 1: General Introduction 1 Chapter 2: Scientific understanding of El Niño-Southern Oscillation (ENSO) and its climatic impacts in Malaysia and surrounding region 5 Chapter 3: Environmental, Social and Economic Impacts of the 1997/98 El Niño event in Malaysia 32 Chapter 4: Coping with El Niño: Lessons learned from the 1997/98 El Niño event 61 Chapter 5: Conclusions and Policy Recommendations 80 References 83 Appendices 94
ACRONYMS
APCC APEC Climate Center
APEC Asia-Pacific Economic Cooperation
API Air Pollution Index
AR5 Fifth Assessment Report (IPCC)
ARI Average Recurrence Interval
ASEAN Association of Southeast Asian Nations
ASM Academy of Sciences Malaysia
CCA Canonical Correlation Analysis
CFS Canadian Forest Service
CPC Climate Prediction Center (NOAA)
DDSOP Drought Disaster Standard Operating Procedure
DID Department of Irrigation and Drainage
DJF December-January-February
DOE Department of Environment
DOSM Department of Statistics Malaysia
DRR Disaster Risk Reduction
EEOF extended empirical orthogonal function
EEPSEA Economy and Environment Program for Southeast Asia
EMI El Niño Modoki Index
ENSO El Niño Southern Oscillation
FDRS Fire Danger Rating System
FFB fresh fruit bunches
FRIM Forest Research Institute Malaysia
GCM General Circulation Model
GDP Gross Domestic Product
GTS Global Telecommunication System
GWP Global Warming Potential
HFA Hyogo Framework for Action
IDM Integrated Drought Management
IOD Indian Ocean Dipole
IPCC Intergovernmental Panel on Climate Change
IRI International Research Institute for Climate and Society [United States]
ISV Intra-seasonal Variability
IWRM Integrated Water Resources Management
JICA Japan International Cooperation Agency
JJA Jun-July-August
JMG Department of Minerals and Geoscience Malaysia
KA key action
KeTTHA Ministry of Energy, Green Technology and Water
MAM March-April-May
MARDI Malaysian Agricultural Research and Development Institute
MP Malaysia Plan
MJO Madden-Julian Oscillation
MMD Malaysian Meteorological Department
MOA Ministry of Agriculture & Agro-Based Industry
MOE Ministry of Education
MOH Ministry of Health
MOS Model Output Statistics
MOSTI Ministry of Science, Technology and Innovation
MPOB Malaysian Palm Oil Board
NAHRIM National Hydraulic Research Institute of Malaysia
NAO North Atlantic Oscillation
NCEP National Centers for Environmental Prediction i
NOAA National Oceanic and Atmospheric Administration [United States]
NRE Ministry of Natural Resources and Environment
NSC National Security Council
PAH Polycyclic Aromatic Hydrocarbon
PDO Pacific Decadal Oscillation
PSI Pollutants Standard Index
R&D Research and Development
RH Relative Humidity
RHAP Regional Haze Action Plan
RM Ringgit Malaysia (Malaysian Ringgit)
SDG Sustainable Development Goal SEA Southeast Asia
SEANDRR South-East Asia Network for Drought Risk Reduction
SOI Southern Oscillation Index
SON September-October-November
SPI Standard Precipitation Index
SST Sea Surface Temperature
STIPAC Science, Technology and Innovation Policy Advisory Committee
TAO Tropical Atmosphere OceanTmax Maximum Surface Air Temperature
TOGA Tropical Ocean-Global Atmosphere
TSP Total Suspended Particulates
UN United Nation
UNCCD United Nations Convention to Combat Desertification
UNCED UN Conference on Environment and Development
UNESCAP United Nations Economic and Social Commission for Asia and the Pacific
UNFCCC United Nations Framework Convention on Climate Change
CBD Convention on Biological Diversity
UNICEF United Nations Children’s Fund
UNISDR United Nations International Strategy for Disaster Reduction
US$ United States Dollar
WHO World Health Organization
WTP water treatment plant
WWB Westerly Wind Burst
WWF World Wide Fund for Nature (formerly World Wildlife Fund)
Chemical Formulae
Al Aluminium
C2H6 Ethylene
CO2 Carbon Dioxide
KCl Potassium Chloride
Na+ Sodium
NH4Cl Ammonium Chloride
NO3- Nitrate
SO2 Sulphur Dioxide
SO42- Sulphate
Ti Titanium Zn Zinc
Unit Measurements
Gt Gigaton Ha Hectare Kg Kilogram kWh Kilowatt-hour MJ Megajoule mld Million Litres Per Day mm Millimetre
Mt Million Tonnes MW Megawatt cm centimetre
ii
LEAD AUTHORS AND CONTRIBUTORS
Chair of Task Force and Editor: Low Pak Sum
Executive Summary
Low Pak Sum and Fredolin Tangang
Chapter 1: General Introduction
Low Pak Sum and P. Loganathan
Chapter 2: Scientific understanding of El Niño-Southern Oscillation (ENSO) and its climatic impacts in Malaysia and surrounding region Fredolin Tangang, Liew Juneng, Ester Salimun and Ahmad Fairudz Jamaluddin
Chapter 3: Environmental, social and economic impacts of the 1997/98 El Niño event in Malaysia
Low Pak Sum and Talib Mohd Latif
Contribuors: Tapsir Serin, Khairul Hafifi Maidin, Abul Quasem Al-Amin, Juneng Liew, Sharifah Munirah Alatas, Loh Chia Hur, Susan Wong and Fatin Nur Ashikin
Chapter 4: Coping with drought: Lessons learned from the 1997-98 El Niño event Low Pak Sum, Yap Kok Seng and Muhammad Helmi Abdullah
Contributors: Loh Chia Hur and Susan Wong
Chapter 5: Conclusions and Policy Recommendations
Low Pak Sum
Contributor: Fredolin Tangang
iii
Executive Summary
Scientific Understanding
The El Niño – Southern Oscillation (ENSO) events are phenomena that resulted from coupled interactions between the atmosphere and ocean in the tropical Pacific Ocean. Its effects around the globe are tele-connected through disruption in the Walker Circulation and anomalous regional air-sea interaction. The typical coupling with warming at the eastern region of the Pacific Ocean is referred to as conventional ENSO with conventional El Niño (La Niña) as its warm (cold) phase. There is also a tendency for the coupled atmosphere-ocean system to evolve differently with the maximum warming located in the central region rather than the eastern part of the Pacific Ocean. This coupling is recognised as a different mode of the tropical Pacific Ocean coupled system and known as the El Niño – Southern Oscillation (ENSO) Modoki. The warm (cold) phase of this mode of coupling is El Niño (La Niña) Modoki.
The different positions of heating in the tropical Pacific Ocean induce different perturbations to the Walker Circulation and exert different impacts and climate anomalies around the world. In Malaysia and the greater Southeast Asian region, conventional ENSO and ENSO Modoki exert different impacts. During June-July-August of the conventional El Niño year (JJA(0)), Peninsular Malaysia, Sumatra and southern Borneo experience drought conditions, which are often associated with severe haze episodes. During SeptemberOctober-November (SON(0)), southern parts of Sumatra, Java and the entire Borneo experience drier-than-normal condition. During this period, the condition over Peninsular returns to normal. However, haze episodes could still develop during this period due to the dry conditions over Sumatra
and Borneo. During December through January and February of thefollowing year (DJF(0/1)), the drought condition persists over northern Borneo and southern Philippines but over other regions (Peninsular Malaysia, Sumatra, southern Borneo), the conditions return to normal. During the ending phase of a conventional El Niño, only the northern tip of Borneo, southern Philippines and Indochina regions are affected. In contrast to the conventional type, El Niño Modoki exerts drier condition to both northern Borneo (Sabah and Sarawak) and Peninsular Malaysia (especially northern region) during DJF(0/1).
On an interannual timescale, Malaysian climate is modulated by the ENSO with generally drier than normal condition during El Niño and wetter than normal condition during La Niña. However, the severity of these conditions depends on the season and the location as well as the strength of the event. A recent study shows that most drought episodes in Malaysia are associated with El Niño. The region that experiences rainfall deficit or drought condition does not only vary seasonally but also spatially. The ENSO events are largely predictable within certain levels of uncertainties by at least 6 months to a year lead-time. With real-time observations of the current states of the atmosphere and ocean in the tropical Pacific Ocean, and forecasts provided by the Climate Prediction Center, National Oceanic and Atmospheric Administration (NOAA), United States of America, ENSO development can basically be monitored and tracked.
In addition to ENSO, Malaysia is also influenced by Indian Ocean Dipole (IOD) and Madden-Julian Oscillation (MJO). The impacts of IOD on the Malaysian climate are less clear but a recent study seems to suggest that IOD could enhance the severity of a drought episode if it co-occurs with an El Niño episode. MJO is characterised by eastward propagation of alternating large-scale enhanced and suppressed convective systems
iv
from the Indian Ocean to Pacific Ocean and these often cause drought and flood over the Maritime Continent region, including Malaysia. Extreme events can also occur because of interactions of these phenomena. Apart from natural variability, Malaysian climate also experiences long-term changes associated with global climate change. For example, it has experienced significant increase of mean temperature and extreme events since the middle of the 20th century.
Coupled with various forecasting systems, and within certain levels of uncertainties, the development of ENSO can be largely predicted and tracked in almost real time. Malaysia needs to monitor this phenomenon using forecast products from established forecast centres. In addition, Malaysia also needs to increase its research on local and regional climate variability and build its own seasonal forecasting system.
Environmental, Social and Economic Impacts and Costs
The prolonged drought induced by the 1997/98 El Niño event (May 1997 – April 1998) in Malaysia caused profound impacts on environmental, social and economic sectors, which are interlinked and each has knock-on effects on the others. The economic-wide impacts are unknown but expected to be enormous.
Constraint on the availability of water resources significantly affected the productivity of agriculture (e.g., oil palm yield/ha decreased by 16.8% and paddy yield/ha decreased by 11.3%). However, the rubber yield did not seem to have been affected by the
El Niño event, at least not noticeable over a short-term. The prolonged drought also affected the fruit setting of Cocoa Production.
There was a significant decrease in hydropower (i.e., 23.8% from 1996 to 1997), made up by the increased use of diesel and gas-generated electricity, implying a higher emission of greenhouse gases. The Gross Domestic Product (GDP) contributed by manufacturing decreased by 4.7% from 1996 to 1998. The decrease in GDP in 1997 and 1998 was largely due to the regional financial crisis exacerbated by the impacts of the El Niño event that affected the agricultural and industrial productivity.
Enhanced sea surface temperature (SST) during the 1997/98 El Niño event affected the marine ecosystems, including fishery and coral bleaching, while enhanced air temperature affected terrestrial ecosystems, public health and air quality due to the production of photochemical smog under strong sunlight. The worsening air quality was compounded by the transboundary haze caused by biomass burning in Indonesia during the prolonged drought period. The transboundary haze reduced visibility, disrupted air flights, affected school activities and tourism. The health of high-risk groups such as children, senior citizens, smokers, people who work outdoors or sufferers of asthma, bronchitis, pneumonia, chronic lung diseases, cardio-vascular problems or allergies were also affected. Nipah Virus outbreak, a disease the Malaysian government was unprepared for, was linked to the prolonged drought.
Wild fires were reported at a few locations in East Malaysia during the 1998 drought period. In Sabah, about 1,580 km2 was engulfed in wild fire, of which more than 100 km2 were agricultural lands. The hill paddy crops in some villages were totally destroyed prompting authorities to send food supply. A similar situation was experienced in the north-eastern part of Sarawak near Miri. A number of districts exercised water rationing to ease off the drought situation.
v
1
The 1997/98 El Niño event brought widespread economic losses across South-East Asia, including Malaysia. It was reported that in Peninsular Malaysia and Sabah alone, more than 2,797 km2 and 170,000 people, including 7,200 farmers were directly affected. Tawang et al. (2002) estimated the total economic loss of oil palm, rubber and rice from 1980 to 1999 due to the effects and impacts of El Niño events and it was more than RM3.3 billion, excluding the various secondary spin–off losses resulting from other downstream activities. Of these losses, oil palm production accounted for RM2.651 billion1(or about 80.3%), followed by rubber, RM357 million2 (or about 10.8%) and rice, RM218 million3 (or about 0.6%). These had resulted in the loss of foreign exchange because of the loss from potential export earnings of palm oil (estimated at RM2,129 million in 1998) and rubber (estimated at RM179 million), as well as the need to import more rice to meet the country’s demand. However, significant productivity losses for other agricultural subsectors, such as fruits, vegetables, sugarcane, and selected livestock industries were not evident. For the 1997/98 El Niño event, the economic losses of oil palm and paddy were estimated at RM1,982.0 million and RM159.6 million respectively for the year 1998. No estimate of economic loss for rubber was provided for 1998.
The total direct and indirect costs due to the 1997/98 El Niño event for Malaysia are unknown, though various costs have been reported without given proper methodologies or peer-reviewed references. However, a more systematic study estimated that
the total economic losses in Malaysia associated with the transboundary haze episode during August-October 1997 amounted to RM801.9 million (or US$321 million at 1997 exchange rate). These losses were partly due to the loss in productivity during the state of emergency in Sarawak from 19 to 28 September 1997, RM393.51 million (USS$157.4 million), which accounted for 49.07%; followed by decline in tourists arrival, which accounted for RM318.55 million (US$ 127.42 million), or 39.72%; and decline in fish landing, RM40.58 million (US$ 16.23million) or 5.00%; cost of fire-fighting, RM25 million (US$ 10million) or 3.12%; adjusted cost of illness RM21.02 million (US$8.41 million) or 2.62%; cloud seeding, RM2.08 million (US$0.83million) or 0.26%; expenditure on masks, RM0.71 million (US$0.28 million) or 0.09%; and cancellation of flights, RM0.45 million (US$0.18 million) or 0.06%, respectively. However, the above estimate was very conservative as it did not account for the economywide costs, and the losses in biodiversity and ecosystem services were also not estimated. It would be useful to assess the total cost over the whole period of the El Niño event. Malaysia’s estimated total cost of damage due to fires and haze during August-October 1997 was about 3.3 times lower than that of Indonesia, but 4.2 times higher than that of Singapore. The total combined cost was estimated at about US$4.5 billion for Indonesia and other ASEAN countries. This estimate was also conservative. It is likely that the actual total cost could be at least a few orders of magnitude higher if the period for assessment was extended to the whole period of the haze episode until 1998.
3
2
For the years 1982, 1983, 1991 and 1998. See Table 5.5 of Tawang et al. (2002).
For the years 1981, 1982 and 1990. See Table 5.8 of Tawang et al. (2002).
For the years 1980, 1981 and 1998. See Table 5.11 of Tawang et al. (2002).
vi
Coping with El Niño: Lessons learned
Despite the escalating impacts of drought (recurrent drought, El Niño-induced or climate change-induced drought), very few developing countries, including Southeast Asian countries, are able to effectively respond to and cope with these events. There is a lack of emphasis on the development of national policies and response measures for drought risk reduction, including drought disaster management, based on the best available scientific data and information. In addition, the lack of human and institutional capacity to cope with drought is also a pressing issue that needs to be addressed. These shortcomings were fully exposed during the 19971998 transboundary haze event that seriously affected the South-East Asian countries, not only environmentally, but also socially and economically.
In Malaysia, apart from the National Security Council (NSC) Directive No. 20: The Policy and Mechanism for National Disaster Management and Relief, an executive directive of the Prime Minister enforced since 11 May 1997 and updated on 30 March 2012, currently there is no national coordination mechanism for El Niño in place, though the Malaysian Meteorological Department (MMD) does provide forecasting and report on its occurrence and inform relevant government departments. However, there is a need to further strengthen the national coordination mechanism for addressing drought, including the possible establishment of a National Drought Committee, which could complement the existing National Haze and Hot Weather Main Committee chaired by the Ministry of Natural Resources and Environment (NRE) participated by a number of related line ministries.
Drought management should not be a crisis management, reactive rather than preventive. It should be focused on risk reduction. In order to reduce drought risks in Malaysia, it is important to identify and minimise the factors that contribute to the vulnerability of Malaysia to drought. These factors could be related to policy, technical, technological (e.g., early warning system), environmental, social, economic, financial, cultural, as well as the institutional and human capacity for coping with and adapting to drought (this includes measures for prevention, preparedness and mitigation), among others.
It is also important to learn from past lessons. There are variations in vulnerabilities and impacts (environmental, social and economic) across various sectors and geographical locations. Based on past El Niño events, which may be classified as weak, moderate or strong, these variations could be analysed, studied and taken into account in dealing with the impacts of future El Niño events, including various measures for mitigating drought and adapting to drought.
There are various technical and technological measures are available to mitigate drought. These include both Integrated Drought Management and Integrated Water Resources Management, which are complementary to each other. While new technologies and research play an important role in strengthening practices to alleviate drought impacts to improve reliability and affordability, there are many simple technologies, such as rain harvesting and water conservations which can effectively help cope with drought. Effective policy measures should be implemented to reduce the adverse effects of drought.
There is a need for Malaysia to develop a framework with explicit focus on drought risk reduction to promote the understanding of natural and human-
vii
induced drought, as well as the environmental, social and economic factors and policies that are vulnerable to drought. The framework may be based on the guiding principles and criteria of the Hyogo Framework for Action (HFA) for Disaster Risk Reduction 2005-2015 and the Sendai Framework for Disaster Risk Reduction 2015-2030; and specifically, the Drought Reduction Framework by United Nations International Strategy for Disaster Reduction (UNISDR) within the context of Malaysia. These global frameworks embrace the vision of building countries’ and communities’ resilience to disasters, including drought, and encourage nations to shift from reactive to anticipatory disaster risk management. The national drought risk reduction framework, taking into account potential synergies, would need to address institutional and implementation capacities.
Based on the framework on drought risk reduction, there is a need for Malaysia to develop a national policy on drought to address various vulnerabilities of drought-related disasters, with a view to minimise its impacts. Indeed, the lack of appropriate national policy and response measures based on the best available scientific data and information, and the lack of national capacity for drought risk reduction will have significant implications for sustainable development and for achieving the SDGs.
A national drought risk reduction policy should be an integral part of national climate change policy, which, in turn, should be an integral part of national sustainable development policy. A new policy for drought risk reduction must include the economics of drought. These include the cost of prevention versus the cost of mitigation, and the cost of action versus the cost of inaction. Indeed, ineffective policies for addressing drought could have significant implications for environmental, social and economic impacts and consequences. Thus, the costs of ineffective policies need to be considered and included in the economics of drought.
Drought risk reduction, like any other natural or human-induced disaster risk reduction, cannot be adequately implemented by the government and its agencies alone, because other stakeholders, such as communities, academia, civil societies and private sectors, are needed to play active roles. Inclusive public participation, based on a comprehensive com munication and public awareness strategy targeted at various specific groups, is essential to ensuring the success of drought risk reduction at the national, state and local levels.
Some major initiatives toward implementing the priority areas of the HFA have been taken in Ma laysia as evidenced by the development of National Action Plan for Disaster Risk Reduction. In terms of drought, the process of drought risk reduction and its mainstreaming into national climate change and development frameworks and policies must be comprehensive and participatory, involving a wide range of stakeholders such as national, state and lo cal governments, community-based and civil society organisations, regional and sub-regional organisa tions, multilateral and bilateral international bodies, the scientific community, the private sector and the media.
It is proposed to establish a South-East Asia Net work for Drought Risk Reduction (SEANDRR) to facilitate sub-regional collaboration for drought risk reduction, especially capacity development activities, so as to build resilience for drought risk reduction within the ASEAN members. This Network will complement and strengthen national capacity development programmes to enhance human and institutional capacities to better cope with future episodes of drought. It will be an important platform for sharing information on drought risk reduction, including scientific research, national programmes and policies, as well as good practices and lessons learned. Malaysia may take the lead to initiate the establishment of this Network perhaps under the auspices of the ASEAN Secretariat.
viii
Research gaps
Contrary to the prediction in early 2014, including those by the leading scientific institutions in the world, the widely expected strong El Niño event was not developed by the end of the year (see Chapters 1 and 2). This demonstrates that there is still scientific uncertainty in terms of El Niño forecasting. It seems that many developing countries, including Malaysia, are closely following the forecasting of El Niño provided by leading scientific institutions in the world. Thus, it is also important to develop national scientific and research capabilities, to ensure the forecasting of El Niño is more relevant to the nation and local environment for better prevention, mitigation and adaptation measures.
Large knowledge gaps remain, particularly in terms of how the frequency of extreme El Niño and its teleconnection patterns over the Southeast Asian region will change in future warmer climate and vice versa. More research needs to be carried out on this issue. Further research also needs to be conducted on IOD and how it might affect Malaysia in future warmer climate. Malaysia also needs to develop its seasonal climate forecasting system that could incorporate changes from the Indian Ocean and the Pacific Ocean.
Research needs to be conducted to answer questions on how climate change will influence synoptic atmospheric circulation over the Southeast Asian region, affect the advection of transboundary pollutants in future haze episodes and how would the spatial and temporal variations of haze aerosols and ozone modify the regional radiative and convective processes during the haze episodes.
There is a need to further strengthen scientific and policy research on the environmental, social and economic impacts of the El Niño-induced drought to
identify the factors, both climatic and non-climatic, that make Malaysia and Malaysians vulnerable to drought and the possible response measures that may be proposed to reduce their vulnerabilities and the risk to drought.
Past estimates of the environmental, social and economic impacts of the 1997/98 El Niño event were incomplete. Scientific research on the impacts of El Niño-induced drought or non-El Niño-induced drought on agricultural crops, biodiversity, terrestrial and marine ecosystems, and fisheries (e.g., especially on the migration of fishes and fish landing) have also been limited, including the spatial distribution of these impacts, and how these impacts could affect the national water, food and energy security. In view of the changing climate with increasing air and ocean temperatures, there is an urgent need to strengthen the scientific research in these areas.
In order for policy makers to make better decisions, extensive research is needed to assess the environmental, social and economic costs of prolonged drought induced by the past El Niño events, including the direct, indirect and economywide costs; the cost of prevention versus the cost of mitigation; as well as the cost of action versus the cost of inaction.
Answering the question on how could climate change affect the onset, magnitude, intensity and frequency of El Niño is needed to assess the links between climate change and El Niño. The Academy of Sciences Malaysia (ASM), with its extensive network of experts could play a useful role in facilitating similar scientific research in the country.
It is important to develop a national drought policy, that would be an integral part of the national climate change policy and the national sustainable development policy. A new policy for drought risk reduction must go beyond the reactive crisis
ix
management. It must include the economics of drought that considers both the direct and indirect environmental, social and economic costs, as well as the economic-wide costs. The valuation of ecosystem services is an important component of the economics of drought. Drought leads to loss of biodiversity and land degradation. Thus, the economics of drought could be an integral part of the economics of climate change, biodiversity and land degradation. Much research is needed in the synergies between these areas.
Ineffective policies for addressing drought could have significant implications on environmental, social and economic impacts and consequences. Thus, the costs of ineffective policies should be considered and included in the economics of drought.
Data collection
In the future, all climatic, environmental, social and economic data relating to an El Niño event should be systematically collected by the relevant government agencies, perhaps in collaboration with ASM which has an extensive academic and scientific network, so as to facilitate research and analysis for future policy development.
Capacity development
Strengthening of human and institutional capacity, in a multidisciplinary manner, at the national, state and local levels are needed for drought risk reduction. Capacity development covers the scientific, technical, technological and policy aspects of drought risk reduction. Malaysia’s higher education system and ASM have an important role to play in capacity development.
x
Chapter 1: General introduction
1.1 Background
Earlier in 2014, it has been predicted by various scientific sources that a strong El Niño event was likely to be developed during the year (NOAA, 2014; WMO, 2014). Because of this prediction, the Academy of Sciences Malaysia (ASM) has submitted a proposal to the Ministry of Science, Technology and Innovation (MOSTI), offering to undertake a study on the Social Impacts of El Niño, with a view to preparing a Position Paper for MOSTI’s consideration based on the results of this s tudy; and based on this Position Paper, MOSTI may then prepare a Cabinet Paper to advise the Government on appropriate actions to be undertaken for mitigating the impacts of the predicted strong El Niño event.
In order to undertake the above study, ASM ha s initiated the formation of a Task Force with wide representation from various ministries. The Task Force is entrusted with the study and the preparation of the Position Paper to be submitted to the ASM Science, Technology and Innovation Policy Advisory Committee (STIPAC). The ASM Council, at its 111 th meeting held on 5 September 2014, has appointed Professor Dr Low Pak Sum as the Chair of the Task Force
L etters were sent by the ASM Secretariat in early September 2014 to relevant ministries, inviting them to appoint representatives to participate in the first Task Force meeting which was held on 18 September 2014. In addition, individual experts from universities and the World Wildlife Fund Malaysia (WWF Malaysia) were also invited to attend the meeting. The list of invitees is attached as Appendice 1. In particular, the following ministries have been contacted:
Ministry of Energy, Green Technology and Water (KeTTHA)
Ministry of Agriculture & Agro Based Industry (MOA)
Malaysian Agricultural Research and Development Institute ( MARDI)
Malaysian Meteorological Department (MMD)
National Hydraulic Research Institute of Malaysia ( NAHRIM ) Ministry of Health (MOH)
Malaysian Palm Oil Board (MPOB)
The first Task Force meeting, chaired by Professor Dr Low Pak Sum and serviced by the ASM Secretariat, was participated by 13 members. However, by this time, it was clear that the original predicted strong El Niño event was not going to happen, while a w eak event was expected to evolve over the following months. Thus, the Task Force members were of the view that instead of preparing the Position Paper for an El Niño event that was still uncertain, it would be better to focus on a more comprehensive and longer term study that will lead to an integrated national strategy and policy for coping with future El Niño events. In addition, both adequate time and financial resources are needed for such a comprehensive study if it is going to be useful.
Despite the recommendation of the Task Force members to focus on a longer term study, the ASM Secretariat is of the view that a short term desk study would still be useful, and the results of this short term study could be used for soliciting research funding for the longer term study. With the support and guidance of the Chair, the Outline of the short term desk study was developed and shared with the Task Force members. The short term study would only focus on the scientific understanding of El Niño and the impacts of
1
the 1997/98 strong El Niño event, to be used as a case study. This report is the outcome of the short term study, and it could form the basis for a more comprehensive longer term study to be undertaken later.
1.2 Mandate
Contrary to the prediction in early 2014, the widely e xpected strong El Niño event had not been developed by the end of the year. By 8 January 2015, the overall atmosphere ocean system remained El Niño Southern Oscillation ( ENSO) neutral, though most models pr edicted “ the SST anomalies to remain at weak El Niño levels (3 month values of the Niño 3.4 index between 0.5°C and 0.9°C) during December February 2014 15, and lasting into the Northern Hemisphere spring 2015 ”. If El Niño were to emerge, the forecaster consensus favors a weak event that ends in early Northern Hemisphere spring. In summary, there is an approximately 50 60% chance of El Niño conditions during the next two months, with ENSO neutral favored thereafte r ” 1 (http://www.cpc.ncep.noaa.gov/products/analysis_monitoring/ens o_disc_jan2015/ensodisc.pdf)
Consequently, the original mandate provided by the ASM to the Task Force had to be modified. Instead of assessing the impacts or potential impacts of the expected strong El Niño event in 2014 2015, the Task Force has assessed the impacts of the strong 1997/98 El Niño event in Malaysia, with a view to drawing lessons learned from this case study.
However, while this report is being prepared in 2015, El Niño conditions were observed d uring February 2015. T he atmospheric and oceanic features reflect “ an ongoing and strengthening ” El Niño during June 2015 (http://www.cpc.ncep.noaa.gov/products/analysis_monitoring/enso_disc_jul20 15/ensodisc.pdf) and “ a significant and strengthening” El Niño du r ing July 2015 (http://www.cpc.ncep.noaa.gov/products/analysis_monitoring/enso_disc_aug20 15/ensodisc.pdf) A strong El Niño continued from August 2015 to September 2015, which represented the peak of the event (http://www.esrl.noaa.gov/psd/enso/mei/#ElNino); and “strong and mature” during October 2015 (http://www.cpc.ncep.noaa.gov/products/analysis_monitoring/enso_disc_nov20 15/ensodisc.pdf) and “has matured” during November 201 5 (http://www.cpc.ncep.noaa.gov/products/analysis_monitoring/enso_disc_dec20 15/ensodisc.pdf ). The El Niño conditions remained strong until March 2016 , but weakening in April 2016.
During April 2016, “sea surface temperature (SST) anomalies decreased across the equatorial Pacific Ocean, with near to below average SSTs recently emerging in the eastern Pacific”. T he Climate Prediction Center (CPC) of National Oceanic and Atmospheric Administration (NOAA) predicted in May 2016 that “La Niña is favo u red to develop during the Northern Hemisphere summer 2016, with about a 75% chance of La Nina during the fall and wi nter 2016 17.” 2
However, t h e above development of the El Niño event in 2015 /16 has not
1 http://www.cpc.ncep.noaa.gov/products/analysis_monitoring/enso_disc_jan2015/ensodisc.pdf) 2 http://www.cpc.ncep.noaa.gov/products/analysis_monitoring/enso_advisory/ensodisc.pdf
2
changed the objectives of this report. In any case, it will take time to assess the impacts of t he 2015/ 16 El Niño event, which may be the focus of another ASM assessment report la ter, even though Section 2.7 does provide some information on the drought condition in West and East Malaysia induced by this 2015/16 El Niño event.
1.3 Objectives of the study
The objectives of this study are to:
(i) Discuss the scien tific aspects of El Niño and its implications for Malaysia.
(ii) Us e the 1997/98 strong El Niño event as a case study, assess the social and economic impacts of El Niño on various key sectors (e.g., w ater, e nergy, a griculture, b iodiversity and health , etc.) in the country.
(iii) Identify and propose steps and measures that are required to be undertaken for addressing the adverse effects of El Niño ; and make policy recommendations for reducing drought risk associated with future El Niño.
(iv) Based on the report of the study, ASM may prepare a Position Paper for MOSTI ; and based on this Position Paper, MOSTI may prepare a Kertas Makluman for the Cabinet for consideration and for possible actions.
1.4 Scope of the study
This report is based on a comprehensive and critical review and analysis of existing literature and data collected from various sources , including data from the Department of Statistics Malaysia (DOSM) : Official Portal , and Bank Negara Malaysia, and publ ished peer reviewed lite rature . However, n ewspaper reports are excluded. A number of authors, some of whom are Task Force members , contributed to this report
1.5 Structure of the report
This report is divided into five chapters: Chapter 1 provides the background, mandate, the objectives and the scope of the study; Chapter 2 discusses the scientific understanding of El Niño, including its climatic implications for Malaysia; Chapter 3 focuses on the environmental, social and economic impac ts of the 1997/98 El Niño event, which was one of the strongest events in recent history, on various key sectors (i.e., water resources, energy, agriculture, industries, marine and terrestrial ecosystems; health, tourism and education); Chapter 4 highlight s the lessons learned from the case study of the 1997/98 El Niño, including the further strengthening of scientific research, and some of the technical, technological and policy measures that are required for coping with future El Niño events; and Chapter 5 provides the conclusions and some policy recommendations for further actions, including some important gaps for further research.
This report is divided into five chapters:
3
• Chapter 1 provides the background, mandate, the objectives and the scop e of the study
• Chapter 2 discusses the scientific understanding of El Niño, including its climatic implications for Malaysia
• Chapter 3 focuses on the environmental, social and economic impacts of the 1997/98 El Niño event, which was one of the strongest events in recent history, on various key sectors (i.e., water resources, energy, agriculture, industries, marine and terrestrial ecosystems; health, tourism and education)
• Chapter 4 highlights the lessons learned from the case study of the 1997/98 El Niño , including the further strengthening of scientific research, and some of the technical, technological and policy measures that are required for coping with future El Niño events
• Chapter 5 provides the conclusions and some policy recommendations for fur ther actions, including some important gaps for further research
4
Chapter 2: Scientific understanding of El Niño-Southern Oscillation (ENSO) and its climatic impacts in Malaysia and surrounding region
2.1 Introduction
The Earth’s climate system is complex and inherently nonlinear. Due to this, in addition to the regular seasonal changes, the climate system is also characterised by the irregular natural variability of various timescales. Phenomena such as the Madden Julian Oscillation (MJO), Indian Ocean Dip ole (IOD), the El Niño Southern Oscillation (ENSO), Pacific Decadal Oscillation (PDO), and North Atlantic Oscillation (NAO) are known examples of large scale natural climate variability that exert impacts around the globe. In order to understand the im pact of climate over a particular region or a locality, natural climate variability must be understood and quantified.
Malaysia is situated in the heart of the South east Asia region where its mean climate is governed by the Australian Asian monsoon system. Figure 2.1 shows the annual cycles of precipitation at a number of stations in the west coast of Peninsular Malaysia, east coast of Peninsular Malaysia and East Malaysi a (Sabah and Sarawak). During the northeast monsoon, rainfall amount reaches its maximum value in east coast of Peninsular Malaysia and Sarawak due to strong moisture convergence that is regulated by the cold surges and Borneo vortex circulations (Chang et al. , 2005). During the southwest monsoon, Malaysia experiences its driest season as moisture brought by the southwest wind is blocked by the Barisan M ountain s ranges over Sumatra. Interestingly, due to the blocking effect of the Titiwangsa mountain range s, rainfall over west coast of Peninsular Malaysia also does not peak during the northeast monsoon period. In fact, the annual cycle for stations over the west coast of Peninsular Malaysia shows its double peaks during March April May (MAM) and September O ctober November (SON), corresponding to the inter monsoon periods. During inter monsoon periods, wind is usually much weaker and such conditions allow local convection to flourish and this usually results in afternoon to late afternoon / evening heavy prec ipitation. Hence, the presence of mountain ranges and the synoptic circulation such as the Borneo Vortex, create various monsoonal climatic patterns over Malaysia.
Due to its unique location (i.e., situated in between two large oceans ( Indian Ocean at its western side and Pacific Ocean at its eastern side), Malaysian climate is also characterised by variability associated with climate phenomena induced by
5
KotaDeviation
Figure 2.1 Annual cycles of rainfall at several locations in the west coast of Peninsular Malaysia, east coast of Peninsular Malaysia and East Malaysia (Sabah and Sarawak)
changes in these oceans. On the intra seasonal timescales of 20 60 days, Malaysian climate is regulated by the MJO (Jamaludin, 2014). MJO is characterised by eas tward propagation of alternating large scale enhanced and suppressed convective systems from the Indian Ocean to Pacific Ocean and these often cause drought and flood over the Maritime Continent region, including Malaysia. The prolonged drought event exper ienced during March April 2014 over Peninsular Malaysia can be linked to this phenomenon. Malaysia is also largely affected by the ENSO phenomenon. However, the severity of impacts varies seasonally and spatially (Tangang 2001; Tangang and Juneng, 2004; Juneng and Tangang, 2005; Salimun et al., 2014a). A recent study by Arif (2014) show ed that most droughts episodes in Malaysia are associated with El Niño. Tangang et al. (2010) indicated that Malaysia does not only suffer from drought but also poor air quality due to the haze episode induced by the drought condition. The impacts of IOD on the Malaysian climate is less clear but a recent study Salimun (2014) seems to suggest that IOD could enhance the severity of a drought episode if it co occurs with an El Niño episode.
6
JFMMJJASOND
0 200 400 600 800 Rainfall (mm)Sandakan
A Standard
JFMMJJASOND
JFMMJJASOND
0 200
600 800
JFMMJJASOND0A0
JFMMJJASOND A
JFMMJJASOND
JFMMJJASOND
JFMMJJASOND
MonthMonth
Kinabalu 0 100 200 300 400
A 200 400 600 800 Miri
A
400
Rainfall (mm)KualaTerengganu
Kuantan 0 100 200 300 400
Kuching 0 100 200 300 400
A 0 200 400 600 800 Rainfall (mm)
A BayanLepas 0 100 200 300 400
A AlorSetar 0 Rainfall (mm)
Standard Deviation Standard DeviationStandard Deviation
Nino4 Nino4 Nino 3Nino 3.4 Nino 1+2 1+2 W
Figure 2.2 The regions used to define El Niño and El Niño Modoki indices
Extreme events can also occur because of interactions of these phenomena. For example, Tangang et al. (2008) attributed the occurrence of the widespread flood at the southern region of Penins ular during end of December 2006 and early January 2007 to the complex interaction between strong cold surges, Borneo Vortex, MJO and IOD. In addition to natural variability, Malaysian climate also experiences long term changes associated with global clima te change (e.g. Tangang et al., 2012; Tangang et al., 2013; Kwan et al., 2014). Malaysia has experienced significant increase of mean temperature and extreme events since the middle of 20 th century (Tangang et al., 2007; Salinger et al., 2014). Due to the prominence and the severity of impacts it can exert, this Chapter provides an assessment of scientific knowledge of the ENSO phenomenon and its impacts on the Malaysian climate based on published literatures and other relevant sources.
2.2 The ENSO p henomenon and its different types of variations
7
The ENSO phenomenon is the most dominant inter annual mode of oscillation associated with the coupled ocean atmosphere interaction in the tropical Pacific Ocean. The phenomenon generated a great interest from the scientific community in the early 1980s whe re extensive literature can be found describing its characteristics, mechanisms and impacts. Wang and Picaut (2004) provided a comprehensive review of the understanding of ENSO physics. The coupled atmosphere ocean system oscillates to produce warmer ocean temperature anomaly in the eastern tropical Pacific Ocean and if the anomaly reaches more than 0.5 o C, the coupled system may enter an El Niño condition. The typical index used to monitor this is the so called Niño3.4 Index, which is the average SST anomaly of 5 o S 5 o N, 170ºW 120ºW (Figure 2 .2 ). The SST anomaly could also swing into negative values where the coupled system may enter into a La Niña state. Moreover, since this is a coupled atmosphere ocean phenomenon, warming (cooling) in the eastern Pacific Ocean occurs in conjunction with rising (decreasing) surface pressure C E
Figure 2. 3 The Niño3.4 and SOI indices indicating the coupled nature of the ocean and atmosphere in the tropical Pacific Ocean. The values in the Y axis represent standardised values
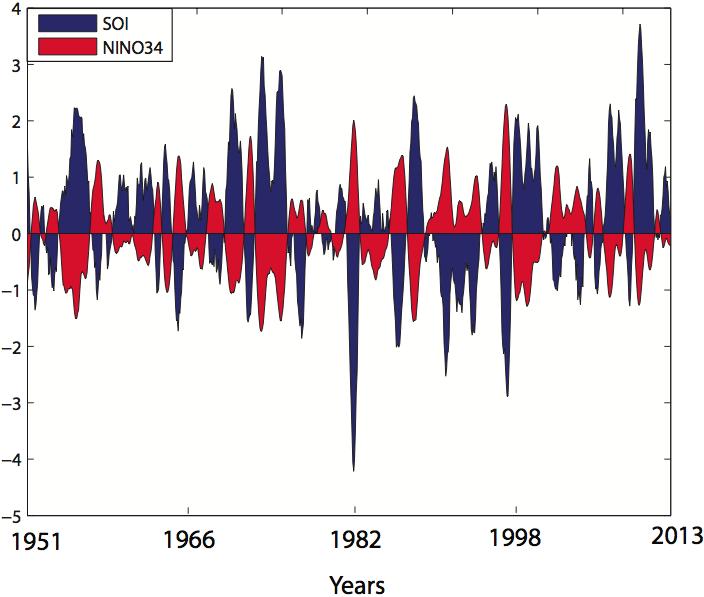
over eastern Pacific Ocean. Tahiti is usually taken as a reference point for this surface pressure changes. Since the changes in the coupled system is basin wide, increasing (decreasing) surface pressure over the eastern side of the Pacific Ocean is matched by a decreasing (increasing) surface pressure over the western side of the Paci fic Ocean, in which Darwin is taken as a reference point. The pressure swings between Tahiti and Darwin is known as the Southern Oscillation and the index used to represent this is the Southern Oscillation Index (SOI). On the first order, the SOI can be ta ken as the opposite of Niño3.4 Index (Figure 2. 3). Although the discovery of El Niño and Southern Oscillation occurred differently, it was in the 1980s that the scientists realised that the two phenomena are coupled and hence the terminology ENSO was used to represent the coupled tropical Pacific Ocean oscillation (e.g. Neelin , 2012). The warm phase of ENSO is El Niño while the cold phase is La Niña.
The oscillation in the atmosphere ocean coupled system in the tropical Pacific O cean does not only involve changes in the surface pressure and ocean surface temperature but the entire components of the system. These include changes in the ocean temperatures at depths, equatorial and off e quatorial thermocline, sea level, surface winds, tropical convection centres and the Walker Circulation. Such changes in the multi components of the tropical Pacific Ocean system can be visuali sed in Figure 2. 4. During an El Niño event, the increase of SST and decrease of surface pressure in eastern region of the tropical Pacific Ocean results in weakening of the trade winds. This weakening of trade winds creates domino effects where the east west sea level gradient can no longer b e maintained and consequently, warm surface water from the west surges to the east to reinforce the initial warming. This also triggers Kelvin waves that travel eastward that further depress the thermocline in the eastern part of the Pacific Ocean. Deeper than normal thermocline and coupled with weakened or the absence of upwelling process reinforces further warming in eastern Pacific Ocean and subsequent development of the El Niño. Further warming in eastern Pacific Ocean and eastward advection of surface warm
8
2)
water from the west also causes the migration of the high surface atmospheric pressure centre from over the Maritime Continent to the central Pacific Ocean. This changes the structure of the Walker Circulation from one cell circulation into two cell circulation . The condition over the Maritime Continent changes from a “rising” branch to a “subsiding” branch of the Walker Circulation. The rising branch that coincides with a region of anomalous convective activities migrates to the central Pacific Ocean leaving th e Maritime Continent with much drier conditions and stable atmosphere. This explains why Maritime Continent experiences drought condition during an El Niño event.
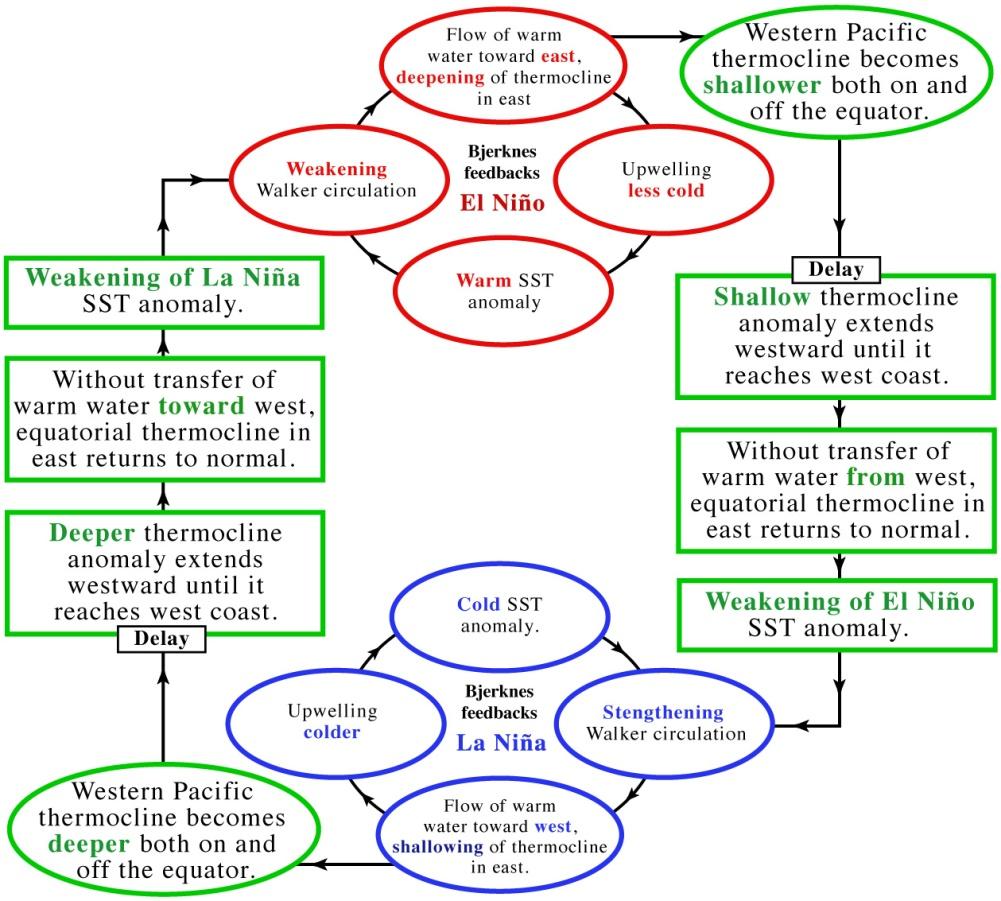
The coupling between the ocean and atmospheric components described above basically follows the Bjerknes feedback mechanisms. Similar but opposite feedback responses can be argued for a La Niña event. However, the subsequent transition of the state of the coupled system from an El Niño state to normal or La Niña state requires delayed response th at is provided by the generated off equatorial Rossby waves that propagate westward. Interestingly, these off equatorial Rossby waves are triggered by the downwelling Kelvin waves that arrived at the east coast. Once such waves reach the west coast, the en ergy is used to trigger upwelling equatorial Kelvin waves that propagate back to the east and eventually lift the thermocline to its normal position and ends the El Niño condition. These delayed responses through off equatorial Rossby waves are the essence of the Delayed ENSO Oscillator theory (e.g.
9
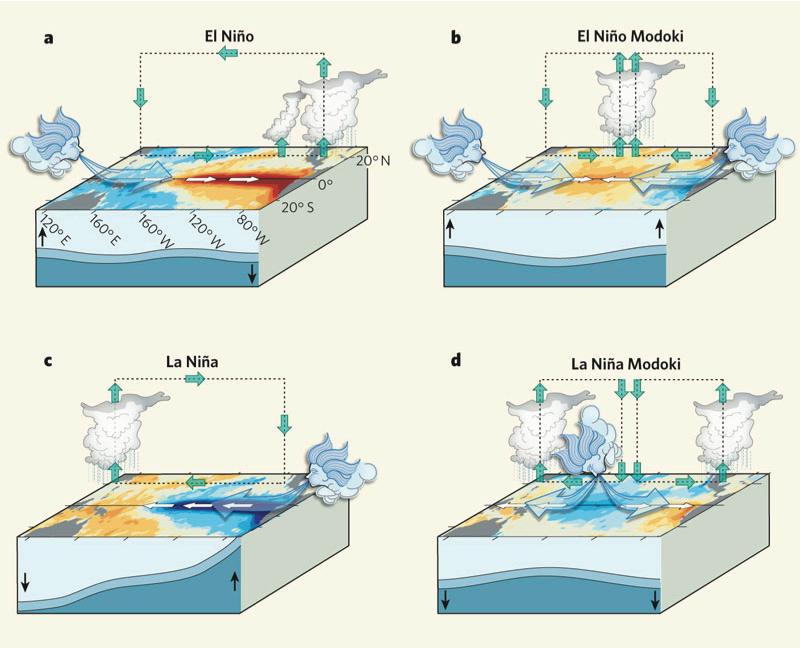
Figure 2. 4 Schematic illustrations of conventional El Niño and La Niña and El Niño and La Niña Modoki (Ashok and Yamagata 2009; Figure
Figure 2. 5 Schematic illustration of ENSO Delayed Oscillator (Neelin , 2012; Figure 4.14)
Graham and White , 1988; Suarez and Schopf , 1 9 88; Battisti and Hirst , 1989). The complete cycle of the coupled system is schematically presented in Figure 2. 5. However, there are other theories put forward to explain the termination of an El Niño state (Wang and Picaut , 2004). These include the recharge oscillator (Jin , 1997), the western Pacific Oscillator (Weisberg and Wang , 1997) and the advective reflective oscillator (Picaut et al. , 1997). Most of these theories outline regular and never ending oscillation from El Niño state to a La Niña state and vice versa. In reality , however, the oscillation is irregular but seasonally phase locked with periodicity of about four years. The seasonal cycle contributes to the irregularity and phase locking of ENSO while the intra seasonal variability causes both variability and irregular ity of ENSO (Wang and Picaut , 2004). Hence, an El Niño event may not necessary be generated from the previous La Niña but can be triggered by “external” factor. An “external” factor that is usually attributed to El Niño initiator is the intra seasonal vari ability (ISV) that has higher frequencies than ENSO. Westerly wind burst (WWB) in the western region of the Pacific and the MJO are parts of the ISV. WWB and MJO generate pulses of downwelling Kelvin waves that propagate to the east depressing the thermocline and to initiate the El Niño development.
There is also a tendency for the coupled atmosphere ocean system to evolve different with the maximum warming located in the central region
10
rather than eastern part of the Pacific Oce an. This coupling is recognised as a different mode of the tropical Pacific Ocean coupled system and known as the ENSO Modoki (Ashok et al. , 2007). The warm (cold) phase of this mode of coupling is El Niño (La Niña) Modoki. The ENSO Modoki oscillation is monitored using the El Niño Modoki Index (EMI ) = C 0.5 x (E + W)). The letters in the equation represent the area averaged SST anomalies over Regions C (165ºE 140ºW, 10ºS 10ºN), E (110ºW 70ºW, 15ºS 5ºN), and W (125ºE 145ºE, 10ºS 20ºN), as indicated in Figure 2. 2. The typical coupling with warming at the eastern region of the Pacific Ocean is referred as conventional ENSO with conventional El Niño (La Niña) as its warm (cold) phase. Figure 2. 4 shows schematically the different patterns of conventional ENSO and ENSO Modoki. Other terminologies have b een used for the central Pacific warming such as the central Pacific El Niño (Kao and Yu , 2009) and warm pool El Niño (Kug et al. , 2009). The ENSO Modoki becomes prominent after the 1980s due to the changes in the subsurface ocean temperature distribution in the tropical Pacific Ocean (Ashok et al. , 2007; Kao and Yu , 2009; Kug et al. , 2009). The different positions of heating in the tropical Pacific Ocean induce different perturbations to the Walker Circulation and exert different impacts and climate anomal ies around the world. In Malaysia and the greater Southeast Asia region, conventional ENSO and ENSO Modoki exert different impacts (Tangang 2001; Tangang and Juneng , 2004; Juneng and Tangang , 2005; Feng et al. , 2010; Tangang et al. , 2012; Salimun et al ., 2014a). Further discussion on this will be provided in the sections below.
2.3 Conventional El Niño and El Niño Modoki: Their different evolution s and characteristics
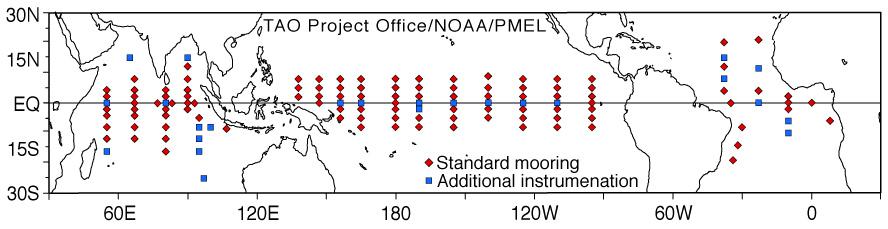
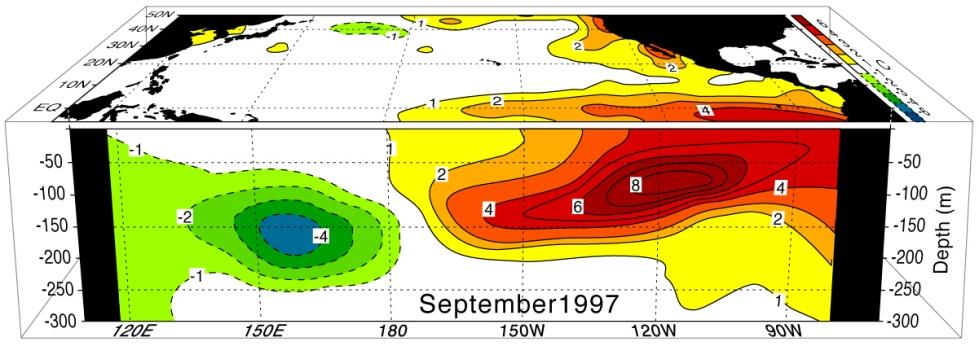
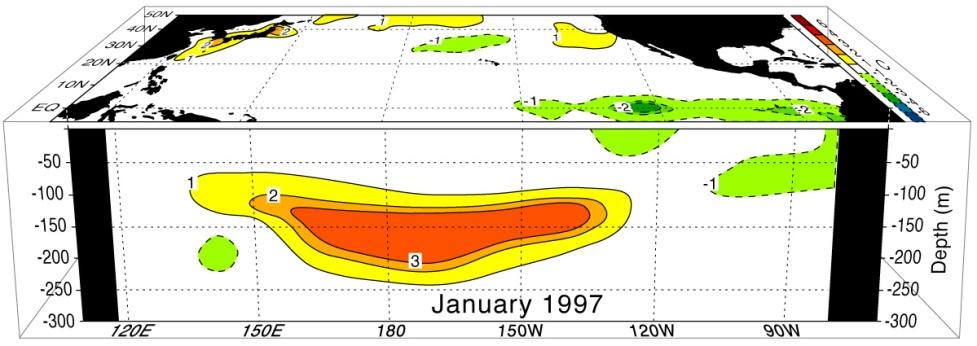
Table 2 .1 shows the recorded conventional El Niño and El Niño Modoki occurrences since early 1950s (Salimun et al., 2014a) . Typically a conventional El Niño begins during in May, peaks towards the end of the year or early months of the following year and subsides in the following spring season. Conventional El Niño events occur in different strengths with the 1997/98 El Niño was recognised as the strongest El Niño ever recorded (Figure 6). During its peak, the SST anomaly in eastern coast of the Pacific Ocean reached 5 o C warmer than normal. Figure 2. 7 shows the SST anomaly during several phases of the 1997/98 El Niño. As can be seen during the mature phase, the warm anomalies of SST extend eastward as far as the dateline. Since the establishment of the Tropical Atmosphere Ocean ( TAO) Array in 1994 under the Tropical Ocean Global Atmosphere (TOGA) programme year (e.g., McPhaden et al., 1998) (Figure 2.8), scientists have been able to monitor the subsurface temperature of the tropical Pacific Ocean and the condition of the thermocline in almost real time. Figure 2.9 provides the sequence of subsurface temperature anomaly in the equatorial Pacific Ocean beginning in January 1997 until May 1998. During January 1997, the surface condition at the eastern part of the Pacific Ocea n was still normal. However, the condition at the subsurface proved different with the existence of warmer anomalies of greater than 3 o C cent r e d at depth of about 150 m, indicating that the thermocline was depressed. This is the signature of downwelli ng Ke l vin waves travelling eastward and depressing the thermocline
11
Table 2.1 The list of conventional El Niño and El Niño Modoki years used for composite analysis. The identification of conventional El Niño and El Niño Modoki is based on the CDC and Ashok et al. (2007)
* The letters W, M, S, and VS correspond to weak, moderate, s trong and very strong El Niño, respectively. There is no known classification of El Niño in the literature
Conventional El Niño El Niño Modoki
1957/58(S) 1979/80 1963/64(M) 1986/87 1965/66(S) 1990/91 1968/69(M) 1991/92 1972/73(S) 1992/93 1976/77(W) 1994/95 1977/78(W) 2002/03 1982/83(VS) 2004/05 1987/88(M) 1997/98(VS)
2.5
2
3
3.5 57/58 63/64 65/66 68/69 72/73 76/77 77/78 82/83 87/88 97/98
1.5
1
0.5
0
0.5
1
1.5
FebJulyDecMay
Figure 2.6 The values of Niño3 index of various El Niño highlighted in Table 2.1 for a period of March of an El Niño year to May of the following year. During the 1997/98 El Niño, Niño3 SST Anomalies attained the highest values among all the episodes. Unit is in o C
12
13
Figure 2.7 Seasonal evolution of SST anomaly during the 1997/98 El Niño. Unit is in o C
Figure 2.8 The global tropical moored buoy array. Those arrays in the tropical Pacific Ocean are the original arrays of the TAO Project meant to monitor ENSO development (Neelin, 2012; Figure 4.7)
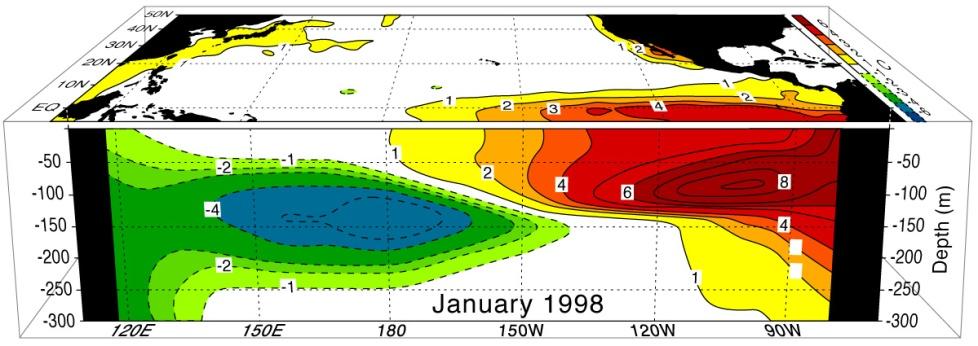
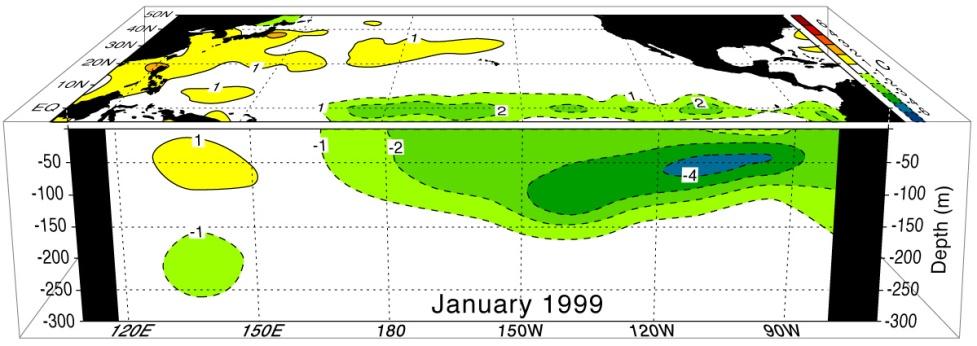
along the way. By April 1997, the Kelvin waves arrived at the east coast and subsequently initiated further development of the El Niño 1997. By May 1997, sea surface at the eastern regio n began to warm and the SST anomaly continued to increase in the next couple of months and expanded westward until it reached the maximum values in January 1998. By March 1998 , it began to weaken and the El Niño was considered ended in May 1998. It is also interesting to note that during September 1997, a negative anomaly of subsurface temperature anomaly of lower than 4 o C began to appear and cent r e d at 150 m 200 m depth and 160 o E. This condition signal l ed the uplifting of the thermocline higher than its normal position. This uplifting was due to the upwelling Kelvin waves as described in the Delayed ENSO Oscillator Theory and eventually terminated the 1997/98 El Niño. On the first order, the evolution of a conventional La Niña can be taken as opposite to that of the conventional El Niño. In fact, the 1997/98 conventional El Niño was immediately followed by the 1998/99 La Niña (Figure 2.10).
The evolution of El Niño Modoki events is different from that of the conventional El Niño. While the warmest SST anomalies is located at the eastern Pacific Ocean during the conventional El Niño, the warmest SST anomalies during El Niño Modoki is located at the central of Pacific Ocean and sandwiched by cooler SST anomalies on its east and west (Figure 2.4 ). The condition of the SST anomalies during El Niño Modoki is associated with more westward and smaller spatial scale westerly anomalies which cent red in the equatorial central to western Pacific (Kao and Yu, 2009; Kug et al., 2009). Meanwhile, significant easterly anomalies also appear over the tropical eastern Pacific during the El Niño Modoki. The convergence of the equatorial westerly anomalies indu ces downwelling Kelvin waves while the equatorial easterly anomalies that induce downwelling Rossby waves deepen the thermocline in the central Pacific to produce the El Niño Modoki (Ashok et al., 2007). After an El Niño Modoki reaches its mature phase, th e anomalous easterlies as well as the equatorial upwelling in the eastern Pacific are further strengthened. Together, the excited downwelling Rossby waves that propagate further west and the weakening westerlies in the western Pacific terminate the El Niño Modoki events. Figure 2.11
14
Figure 2.9 The evolution of subsurface and surface temperature anomalies based on TAO array data during the 1997/98 El Niño (Neelin, 2012; Figure 4.8)

15
Figure 2.10 Evolution of subsurface and surface temperature anomalies during the La Niña 1998/99 (Neelin, 2012; Figure 4.9)

indicates the EMI values for El Niño Modoki listed in Table 2.1. Clearly there are differences from one episode to another. The spatial patter ns of the SST anomalies during the 1990/91 El Niño Modoki are also different from the typical warming patterns of a conventional El Niño (Figure 2.12)
2.4 ENSO p redictability and p rediction
The number of research activities on ENSO began to increase in the early 1980s, especially after the strong 1982/83 and surged in the 1990s. The research activiti es were not just focusing on the understanding of ENSO based on observation and theoretical approaches but also on its predictability. Models have been developed to forecast ENSO development. The Zebiak Cane Model, an intermediate coupled model, was developed in 1986 and considered a pioneer and a milestone in ENSO forecasting (Zebiak Cane , 1987). The development of coupled models for ENSO forecasting continues un til recent years. A number of statistical models have also been developed. An example of such model is the UBC NNET, which is an ENSO statistical prediction model using neural network developed by the first author in fulfil ment of his PhD at the Universit y of British Columbia, Vancouver, Canada (Tangang et al ., 1997; Tangang et al. , 1998a; 1998b). This is one of the models used by the International Research Institute for Climate and Society, Columbia University in its ENSO forecasts 3 In addition, hybrid models , i.e. a combination of dynamical and statistical models have
16
3 http://iri.columbia.edu/our expertise/climate/forecasts/enso/
Figure 2.11 The EMI values for El Niño Modoki episodes. Unit is in o C
also been developed. Latif et al. (1998) provided a complete review of ENSO models developed in the 1980s and 1990s. Generally, ENSO models (both dynamical and statistical) provided forecast skills higher than persistence at 6 12 months lead times (Latif et al. , 1998). In a more recent paper, Barnston et al. (2012) compared the performances of 23 ENSO models (15 dynamical and 8 statistical models , including UBC NNET) and concluded that for a period of recent decades, the dynamical models outperformed the statistical models. Overall, research and development activities since the early 1980s contributed to a much better understanding of ENSO and deve lopment of a variety of forecasting models. With the latest atmospheric and oceanic observations in the Pacific and latest forecasts of various ENSO models, the CPC of the NOAA o f the United State s of America regularly produces ENSO advisories in Weekly ENSO Update and Monthly Climatic Diagnostics Bulletin 4 . These advisories are extremely useful especially for countries affected by ENSO events in monitoring ENSO latest development and forecasts. Malaysia should benefit from such products and should incorporate them in monitoring ENSO impacts in this country.
2.5 Conventional ENSO and ENSO Modoki impacts on climate in the Malaysia and the Southeast Asia n region
The impacts of conventional ENSO and ENSO Modoki events in Malaysia and the South East Asia region are mainly tele connected through changes in atmospheric 4 http://www.cpc.ncep.noaa.gov/products/analysis_monitoring/enso_advisory/
17
o C
18
Figure 2.12 Seasonal evolution of SST anomalies of El Niño Modoki 1990/91. Unit is in
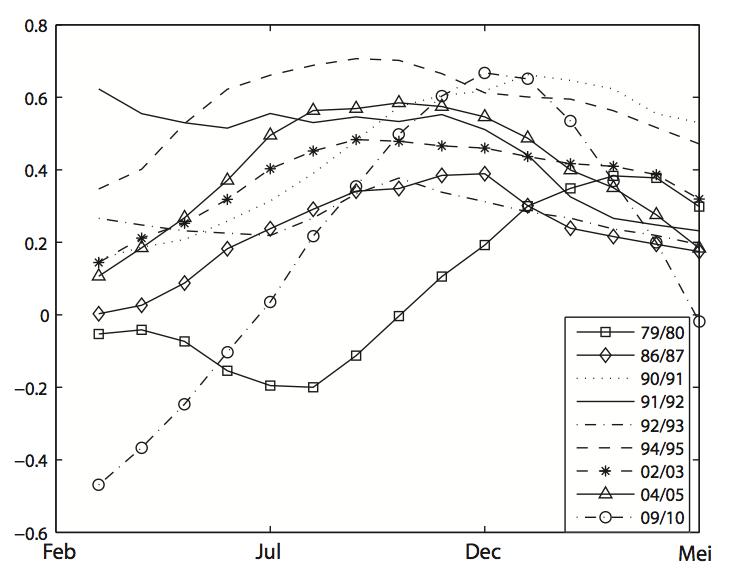
Figure 2.13 The spatial patterns of the most dominant extended empirical orthogonal function ( EEOF ) mode of the Southeast Asia rainfall anomalies at different seasons throughout the ENSO evolution period. For an El Niño event, the negative values are associated with deficit rainfall. This mode correlates well with Niño3.4 index and explains about 20% of the variance (Juneng and Tangang, 2005; Figure 1)
circulation and subsequently through changes in regional air sea interactions. During the occurrence of a conventional El Niño event, Malaysia and the Southeast Asia region generally experience drought con dition. Figure 2. 13 shows the most dominant mode of the extended empirical orthogonal function (EEOF) of precipitation anomaly over the Southeast Asia region (Juneng and Tangang, 2005). The temporal coefficient of this mode is highly correlated with ENSO occurrences. Interestingly, as shown in Figure 2.13, the region that experiences rainfall deficit or drought condition does not only vary seasonally but also spatially. This can be considered as the typical patterns of impacts of conventional El Niño over this region. During June July August of the El Niño year (JJA(0)), Peninsular Malaysia, Sumatra and southern Borneo experience drought conditions, which are often associated with severe haze episodes (Tangang et al., 2010). During September October Novembe r (SON(0)), southern parts of Sumatra, Java and the entire Borneo experience drier than normal condition. During this period, the condition over Peninsular returns to normal. However, haze episodes could still develop during this period due to the dry co ndition over Sumatra and Borneo. During December through January and February of the following year (DJF(0/1)), the drought condition persists over northern Borneo and southern Philippines but over other regions (Peninsular Malaysia, Sumatra, southern Born eo), the conditions return
19
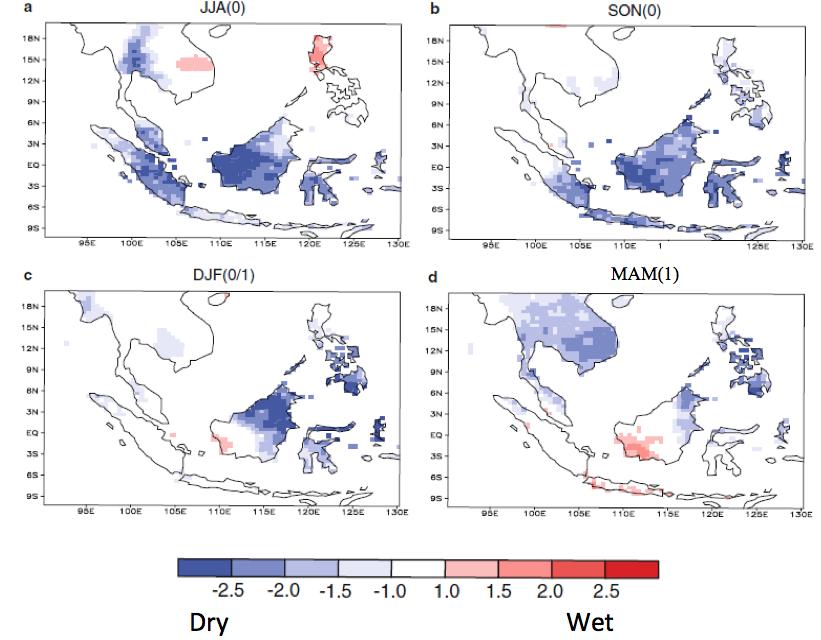
Figure 2.14 The composite of December January February rainfall anomalies for a) Conventional El Niños, b) El Niño Modoki. Hatched region indicates significant at 95% level. Unit is mm month 1 (Salimun et al., 2014a; Figure 2)
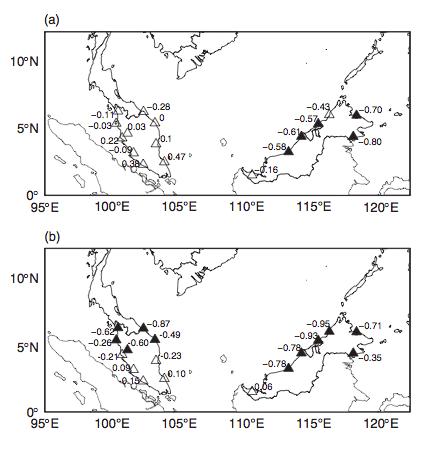
Figure 2.15 As in Figure 2.14 except the composites were based on station data. Dark triangles indicate significance at 95%. Unit is mm month 1 (Salimun et al., 2014a; Figure 3)
to normal. During the ending phase of a conventional El Niño, only the northern tip of Borneo, southern Philippines and Indochina regions are affected.
20
Throughout the sequence from the early development of a conventional El Niño until the ending phase, the c overage of drier than normal area appears to evolve in north eastward direction. Such a north eastward evolution is actually associated with the regional air sea interactions induced by the El Niño perturbation over this region (Juneng and Tangang, 2005). Such perturbation induces anomalous anti cyclonic circulations over the south eastern Indian Ocean (SIO) during SON( 0) and over the western North Pacific during DJF (0/1) (Wang et al., 2003). The strengthening and weakening of these anti cyclonic circulations modulate north eastward evolution of the drier than normal condition over the South E ast Asia region. Hence, th e regional air sea interaction is important in communicating the local and regional impacts of a conventional El Niño. In conjunction with this, monsoonal winds strengthen during JJA(0) while weaken during DJF(0/1) (Juneng and Tangang, 2005). The SST anomaly in South E ast Asia regional seas (particularly the South China Sea) tends to lag by at least a season compared with the eastern Pacific anomaly (Juneng and Tangang, 2005). During JJA(0), the SST anomaly in the South China Sea still appears normal but begin to warm in subsequent seasons. In addition, surface waves in the South China Sea are also influenced by El Niño occurrences (Mirzaei et al., 2013).
The impacts of El Niño Modoki on Malaysian rainfall differ from that of th e conventional El Niño (Salimun et al., 2014a; Salimun, 2014). This is particularly striking during DJF(0/1) where Peninsular Malaysia also tends to be significantly influenced during El Niño Modoki. Hence, during DJF(0/1) of an El Niño Modoki, both Sabah Sarawak and Peninsular would experience drier than normal condition (Figures 2.14 and 2.15). While the impact of El Niño tends to cause drier than normal condition over the region, the La Niña occurrences cause the opposite i.e. wetter than normal conditio ns (Tangang and Juneng et al., 2004; Juneng and Tangang 2005). This is due to the strengthening of trade winds over the Pacific Ocean resulting in anomalous convergence of moisture in the South East Asia region. In such a situation, the probability of floo d occurrences increases. Generally, the evolution of La Niña related anomalies over the region can be viewed as opposite to that of the El Niño.
The ENSO phenomenon does not only affect the rainfall distribution but surface air temperature also. Table 2.2 shows the maximum surface air temperatures (Tmax) recorded during conventional El Niño and El Niño Modoki events at a number of stations throughout the country. Generally, the Tmax increases during both conventional El Niño and El Niño Modoki. During an El Niño event, because of stable atmosphere and lack of clouds, insolation over Malaysia usually increases. This increase in heat flux increases surface air temperature, which in turn r a ises the energy demand for cooling. Tangang et al. (2007) analy sed the trend and variability of 42 years (1961 2002) surface air temperature data of 11 measurement stations through Malaysia. The study concluded that the surface air temperature over Malaysia had
21
Table 2.2 The Tmax recorded during conventional El Niño and El Niño Modoki events at some selected stations throughout the country. Also shown is the mean Tmax for each station. Unit is o C
Station Name Normal Tmax El Niño 1968/69 El Niño 1972/73 El Niño 1976/77 El Niño 1977/78 El Niño Modoki 1979/80
El Niño 1982/83 El Niño Modoki 1986/87
El Niño 1987/88 El Niño Modoki 1990/91
El Niño Modoki 1991/92
El Niño Modoki 1994/95
El Niño 1997/98 El Niño Modoki 2002/03
El Niño Modoki 2004/05
Bayan Lepas 31.4 32.9 33.1 32.2 33.0 33.0 32.4 32.4 32.9 32.3 32.4 32.1 32.7 33.9 33.0 Chuping 32.7 36.0 36.0 34.8 35.4 35.2 35.5 34.4 34.8 36.0 35.2
Ipoh 33.0 34.3 33.8 34.0 34.2 34.4 33.9 34.2 35.0 34.4 34.7 33.9 34.1 35.4 33.8
Kuantan 31.7 32.3 33.1 33.0 33.2 33.8 33.1 33.6 33.5 33.4 34.0 33.0 34.8 33.8 34.5
Mersing 30.7 33.0 32.8 31.0 31.7 32.2 31.4 32.3 31.9 32.3 31.5 31.4 33.3 32.6 33.4
Kota Kinabalu
31.5 31.2 31.9 31.5 31.9 32.1 32.9 32.9 32.8 32.6 32.8 32.8 32.8 33.6 34.0
Kuching 31.6 32.7 33.7 33.3 33.3 33.9 33.6 33.0 33.3 33.3 32.9 33.0 33.7 33.1 33.5
Source: Tangang et al. (2007)
22
increased during the 42 years in most of the stations at rates higher than the rate of increase of global surface air temperature estimated by the Intergovernmental Panel on Climate Change ( IPCC ) . Interestingly, 60 80% of inter annual variability of surface air temperature over Malaysia was due to ENSO fluctuations. During an El Niño, depending on season and location, the increase in mean temperature can be as high as 2 o C. However, unlike rainfall, the impacts of ENSO on surface temperature appear to have much le ss spatial and temporal variability.
Figure 2.16
2.6 The predictability of Malaysian anomalous rainfall associated with ENSO
Due to the modulation of ENSO on rainfall over Malaysia, some levels of predictability of rainfall anomaly can be expected from ENSO signals. This issue has been investigated by a number of papers. Juneng and Tangang (2008) evaluated the skills of forecast ing of rainfall anomaly over Malaysia by using the canonical correlation analysis (CCA) technique to model the relationship between rainfall anomaly and ENSO related indices. This study indicated useful skills (>0.5 correlation) for a lead time of five mon ths can only be found over Sabah during January February March period. In another study, Juneng et al. (2010) showed that the forecast skills can be improved if dynamical and statistical approaches can be combined. In this study, a number of dynamical seasonal forecasts from several General Circulation Models (GCMs) were used as input to the CCA. This type of model l ing is commonly referred
23
The Hovm Ö ller plot of zonal 850 hPa wind anomalies, averaged over 5 o S 5 o N, over the tropical Indian Pacific Ocean from January to mid June 2014. Unit is in ms 1 . The figure is provided by the CPC NCEP ( National Centers for Environmental Prediction) NOAA
as a Mod el Output Statistics (MOS) approach and by averaging the results from several GCMs, multi model ensemble method was actually used. Using this method,
Figure 2.17 The evolution of subsurface temperature anomalies along the equatorial Pacific Ocean from early March 2014 to the third week of April 2014, indicating thermocline depressions by Kelvin waves. The plot was provided by the CPC NCEP NOAA
Juneng et al. (2010) showed skill improvements particularly over Peninsular Malaysia. In a recent work, Salimun et al. (2014b) also indicated GCM seasonal forecast usually had lower forecast skills in forecasting rainfall anomaly over Malaysia due to the low resolution of such global model and the complexity of regional circulation over the region. However, using a MOS approach, forecast skills can be improved
2.7 Recent development in the tropical Pacific Ocean
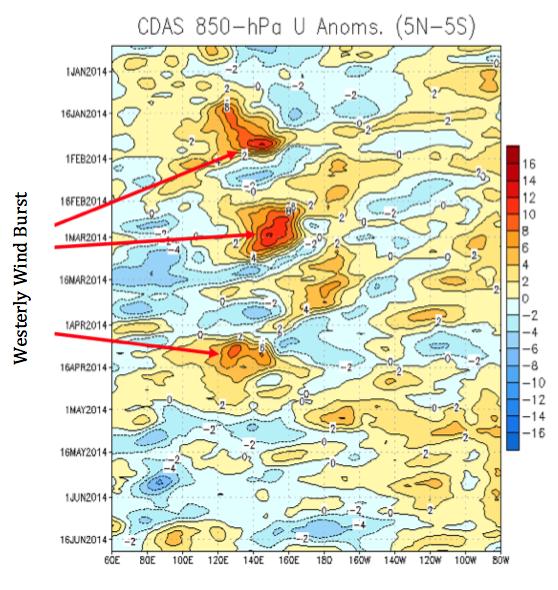
During the early months of 2014, Peninsular Malaysia experienced severe drought due to strong and persistent MJO propagations from Indian to the Paci fic Ocean. However, during the same period, interior parts of Sabah experienced floods. Droughts and floods were typical impacts of the suppressed and enhanced convective envelopes when they were propagating eastward associated with this phenomenon. Interestingly, MJO propagations also could trigger strong westerly over western Pacific Ocean. Figure 2.16 indicates the occurrences of strong westerly winds over the western Pacific Ocean from middle of January 2014 to early February 2014, from middle of February 2014 to early March 2014 and from early April to middle of April 2014.
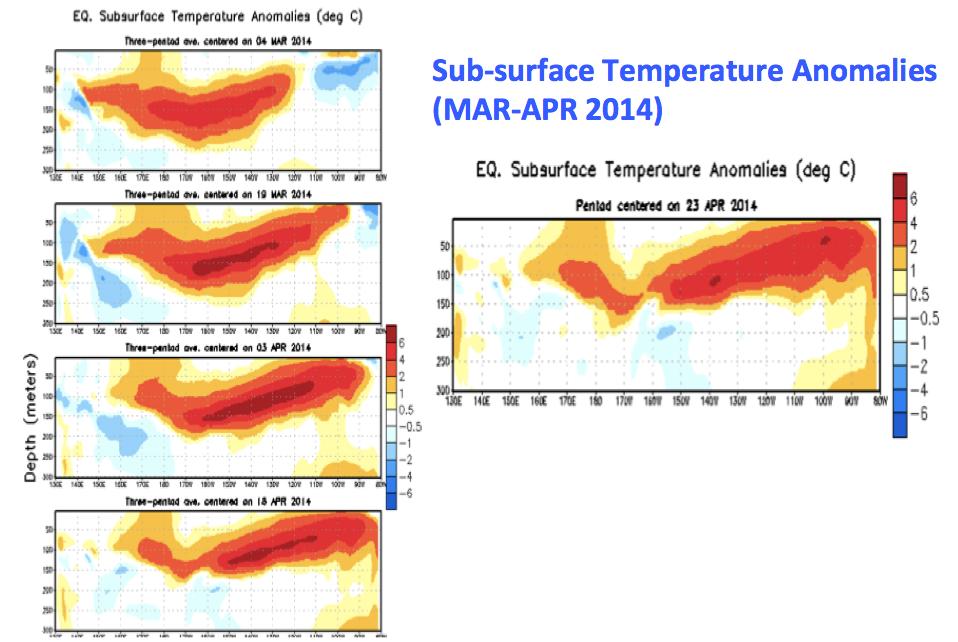
As outlined in Section 2.2, such bursts of westerly wind provide the energy for the generation of packets of downwelling Kelvin waves that propagate eastward to east coast of t he Pacific Ocean depressing the thermocline along their paths. The signatures of depressed thermocline are shown in Figure 2.17. Throughout the months
24
Figure 2.18 Average SST anomalies during a period from 8 June 2014 5 July 2014. Unit is o C. The plo t was provided by the CPC NCEP NOAA
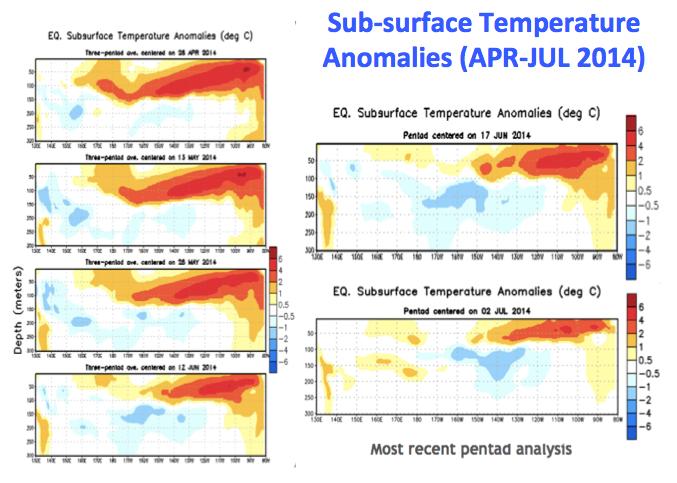
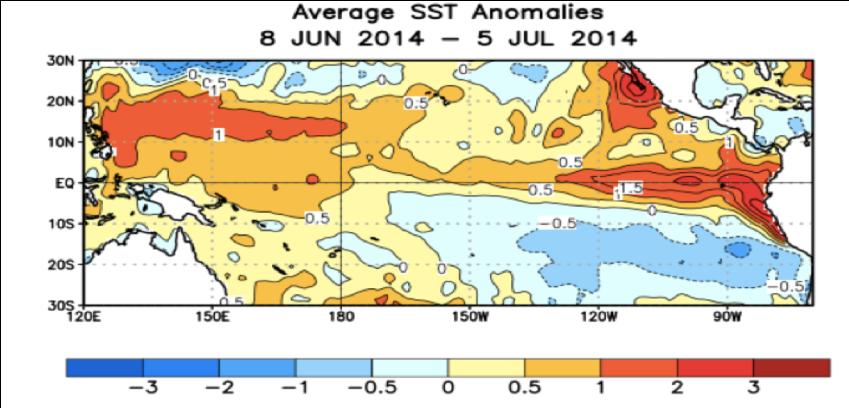
Figure 2.19 As in Figure 17 except for a period of 24 April 2014 02 July 2014. The plot was provided by the CPC NCEP NOAA
of March and April 2014, strong depressions of thermocline were indicated and these were due to the Kelvin waves generated in earlier months. These early developments were similar to those of the strongest 1997/98 El Niño, prompting many scientists to believ e that another strong El Niño was underway. The spatial pattern of SST anomaly during 8 June 6 July 2014 (Figure 2. 18) clearly indicated an early stage of El Niño development. At Niño3 and Niño1+2 regions, temperature anomalies have already exceeded 1. 5 o C. In early 2014, the CPC of NOAA issued ENSO advisory with probability of more 50% for an El Niño to occur in the boreal summer of 2014.
25
Figure 2.20 The equatorial upper ocean heat anomalies for 180 100W from July 2013 to June 2014. Unit is o C. The plot was provided by the CPC NCEP NOAA

Despite the favo u rable conditions at the surface, developments at the subsurface appeared unfavo u rable for sustaining further development of the El Niño. By June and July 2014, the Kelvin waves activities sig nificantly reduced (Figure 2.19). This could be due to the absence of westerly wind burst starting in mid April until June 2014. This was also reflected in the equatorial upper ocean heat anomalies where the values peaked in April 2014 but continued to dec rease after that (Figure 2.20). Niño indices also showed declined and in fact, the Niño3.4 Index did not reach 0.5 o C for the event to be officially declared as an El Niño event (Figure 2.21).
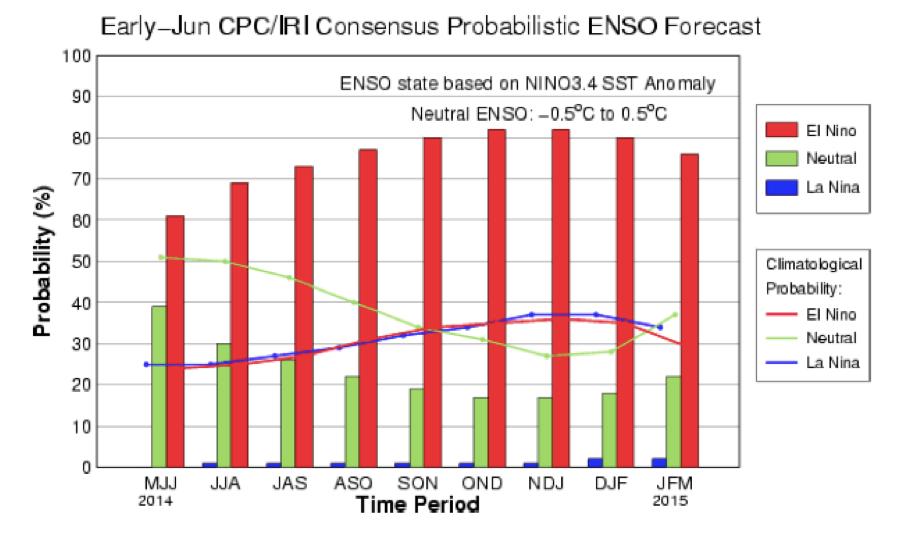
The failure of this event to develop after the “perfect kick st art” in April 2014 poses an interesting question to investigate. In fact, the initial warming at the eastern Pacific in June 2014 (Figure 2.18) should have trigged the weakening of easterly trade winds and weakened the east west sea level pressure gradient that could trigger more packets of Kelvin Waves to sustain the development of the event. In fact, the International Research Institute for Climate and Society (IRI) /CPC in early June 2014, issued an ENSO forecast with more than 70% probability of occurrence during the boreal summer of 2014 (Figure 2.22). The questions of whether the “perfect kick start” failed to initiate the subsequent ocean atmosphere interactions or the ocean atmosphere interaction failed to weaken the trade winds require furthe r investigation. However, had the event evolved into a very strong El Niño similar to the 1997/98 event, Malaysia would have suffered tremendously given the fact it had already endured a drought period in March and April 2014 due to the MJO in which it its elf considered to have initiated the development of the event.
26
Figure 2.21 Time series of Niño indices from July 2013 until Jul y 2014. Unit is in o C. The plot was provided by the CPC NCEP NOAA
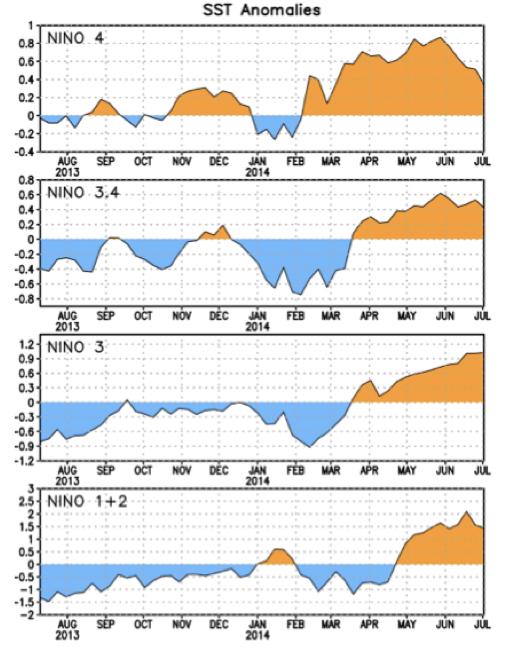
Figure 2.22 The IRI/CPC probabilistic ENSO forecast issued in early June 2014. The plot was provided by the CPC NCEP NOAA
Despite the “aborted” El Niño development in June 2014, the ocean atmosphere interaction over the tropical Pacific Ocean re strengthened during the spring of 2015 and subsequently the coupled system evolved into the 2015/2016 El Niño (Figure 2.23). Since April 2015, the SST anomaly in the tropical Pacific Ocean had gradually increased and by May
27
2015 the entire equatorial Pacific Ocean had warmed up above normal temperature indicating the ongoing development phase of the 2015/2016 El Niño. The surface warming continued for the next couple of months and peaked during November or December 2015 (Figure 2.24). By January 2016, the SST anomaly be gan to decrease indicating the decaying phase of the El Niño event. The 2015/2016 El Niño was forecasted to end by May or June 2015. According to the March 2016 forecast of CPC/IRI, there is about 50% likelihood that La Niña may develop by September or Oct ober 2016. Anomalously strong northeast monsoon later this year is expected if La Niña develops in September or October 2016.
Figure 2.23 The SSTA depicting the evolution of the 2015/2016 El Niño. The plots were provided by the CPC NCEP, NOAA
Based on the magnitude of the SST anomaly increases, the intensity of the 2015/2016 El Niño is comparable to that of the 1997/98 El Niño. Both are considered as a conventional type of El Niño. The evolution of these two El Niño events is also remarkably si milar. In terms of impacts, the severity of droughts was also similar. The Indonesian region of Sumatra and Kalimantan had experienced severe drought conditions from June to November 2015 and this provided favo u rable conditions for widespread forest fires in the region. The uncontrolled forest fires in Kalimantan and Sumatra had resulted into another severe haze episode that engulfed a number of countries in the Southeast Asia region including Malaysia for a continuous three months period from September to November 2015.
By January 2016, the El Niño induced drought condition shifted to northern Sarawak and Sabah. In February 2016, a number of newspaper reports indicated drought condition enraged in areas such as Miri, Bekalalan Sarawak and Tawau Sabah. For est fires and serious haze have also been reported in Miri. Interestingly, during the same time, areas in the southern part of Sarawak including Kuching, Kota Samarahan have experienced above normal rainfall and floods. Pontianak in Kalimantan had also exp erienced similar floods during the same period (as reported in Tribun Pontianak). The opposite conditions i.e. drought over northern Sawarak and Sabah and wetter than normal (possibly flood) in
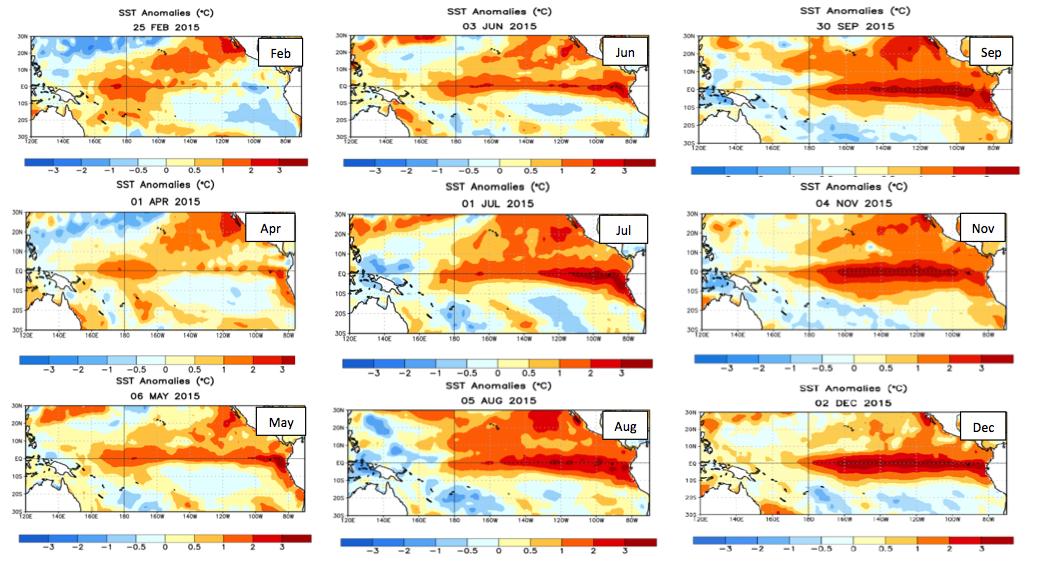
28
southern Sarawak and Kalimantan are very much consistent the t ypical El Niño induced effect in northern Borneo as indicated Figure 2.13. In fact, the Asia Pacific Economic Cooperation (APEC) Climate Center (APCC) in Busan, South Korea, had also issued a probabilistic forecast in January 2016 that covered a period f rom February to April 2016 with 80% likelihood of drier than normal condition for northern Sarawak and Sabah while 80% likelihood of wetter than normal condition for southern Sarawak and Kalimatan (Figure 2.25). As forecasted, northern Sarawak and Sabah experienced severe drought condition from February to April 2016. Peninsular Malaysia, especially the northern region was also affected.
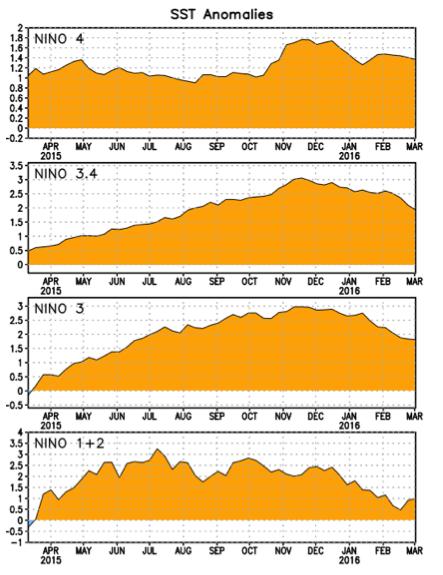
29
Figure 2.24 The Niño indices as in Figure 2. 21 except for duration from March 2015 to March 2016
2.8 El Niño and climate change
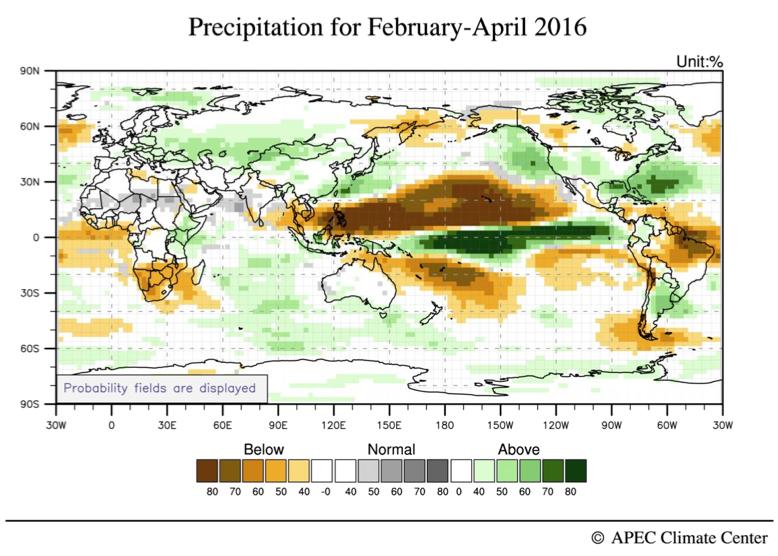
The question of whether and how ENSO and its teleconnections would be changing in a warmer future climate is an important one. The IPCC Fifth Assessment Report ( AR5 ) of Working Group 1 in its Chapter 14 (Climate Phenomena and their relevance to regional cl imate change) addresses this question. The finding of this report indicates that ENSO will remain the dominant mode of inter annual variability in a warmer future climate. Also, due to the changes in moisture availability in a warmer future climate, ENSO induced rainfall variability in regional scales will intensify (Christensen et al. 2013). The report also indicates that model s without external forcing also show similar modulation as observed and hence there is little consensus of whether long term ENSO changes can be attributed to external forcing or natural variability (Christensen et al. 2013). There is also low confidence that ENSO will intensify or change its spatial pattern (Christensen et al. 2013). However, a recent study by Cai et al. (2014) (not assessed by IPCC in AR5) indicated that the frequency of extreme El Niño such as the 19 82/83 and 1997/98 episodes may incre ase in a warmer future climate.
2.9 Scientific gaps within the context of Malaysia
Significant progress has been made in scientific understanding of how ENSO modulates regional climate, particularly over Malaysia (Tangang et al., 2012). However, large knowled ge gaps remain, particularly in terms of how the frequency of extreme El Niño and its teleconnection patterns over the South E ast Asian region will change in a warmer future climate. The latest IPCC AR5 seems inconclusive on whether ENSO will intensify. Nonetheless , Cai et al. (2014) indicated that the frequency of extreme El Niño is projected to increase in a warmer climate. These would have profound impacts not just in Malaysia but
30
Figure 2.25 The AP C C rainfall probabilistic forecast for February to April 2016 issued in January 2016
also the Southeast Asia region. More research needs to be carried on this issue. More research also needs to be conducted on IOD and how it will affect Malaysia in a warmer future climate. Malaysia also needs to develop its seasonal climate forecasting system that could incorporate changes from the Indian Ocean and the Pacific Ocean.
2.10 Summary
The ENSO phenomenon is the largest inter annual climate fluctuation in the Earth’s climate system and it occurs naturally due to the coupled atmosphere ocean interaction in the Pacific Ocean. Malaysia is impacted by this phenomenon but the severity of the impacts depends on the intensity. During an El Niño event, Malaysia tends to experience drought condition. However, this depends on season, location and also types of the El Niño. During a La Niña event, Malaysia tends to experience the opposite. For the last three decades, tremendous progress ha s been made in scientific understanding of ENSO system, both in theoretical and observational aspects. The setting up of the TAO Arrays in 1994 made the monitoring of the state of ENSO system possible in almost real time. Coupled with various forecasting s ystems, the development of ENSO can be predicted and tracked in almost real time. Malaysia needs to monitor this phenomenon using forecast products from established forecast centres. In addition, Malaysia also needs to increase its research on local and re gional climate variability and build its own seasonal forecasting system.
31
Chapter 3: Environmental, Social and Economic Impacts of the 1997/98 El Niño event
in Malaysia
3.1 Introduction
While the environmental, social and economic impacts of the strong 2015/16 El Niño event in Malaysia have yet to be assessed, this chapter draws lessons from the similarly strong 1997/98 El Niño event, with particular focus on the following sectors and are as:
• Water resources
• Energy
• Agriculture
• Forestry
• Industries
• Marine and terrestrial ecosystems
• Air quality
• Health
• Education and Tourism
The coverage of this chapter is constrained by the lack of data.
3.2 Water resources
Malaysia’s water resources are mainly dependent on rainfall , which is influenced by the monsoon seasons. It has an annual average rainfall ranging from about 2, 500 mm in Peninsular Malaysia (notably wettest in August) to 5 ,0 8 0 mm in East Malaysia (notably with main rainy season from November to February) 5 . . Most of Malaysia’s agriculture, forests and biodiversity are rain fed ( MONRE , 2011)
The 1997/98 El Niño event caused extensive and prolonged drought in Malaysia, though the severity of affected areas varied.
Ahmad and Low (2003) highlighted the following:
• Between late January and mid April 1998 , most parts of Malaysia received less than one fifth of the normal expected rainfall. As a result, there was water shortage, giving rise to a water crisis that afflicted many states , not only in Peninsular Malaysia (e.g., Selangor including Kuala Lumpur Federal Territory ; Penang, Kedah, Kelantan ) , but also in East Malaysia ( Sabah and Sarawak ) In particular in Bangi and Kajang, which draw water supply from t he upper Langat River catchment , the re were periods of domestic water supply disruptions during April September 1998, which affected 1.8 million residents in the Klang Valley
• In Sarawak, b etween July to September 1997, a prolonged dry spell was experienced in western part where a number of stations recorded more than 30 days without rain S ince the end of December 1997 , the north eastern region around Miri was seriously affected where the station recorded 102 days without rain the longest period for no rain ever recorded in the state The dry spell had resulted in wildfire s that had destroyed a sizable area of agriculture crops , and caused schools shut down due to poor air quality because of haze The impacts related to haze are discussed in Section 3.9
• M inimum river flows were observed in various rivers For example, Langat River at Dengkil recorded a minimum flow of 0.94 m 3 /s The reduced water flow has also been contributed by uncontrolled development, such as the extensive urbani s ation process on the catchment where natural vegetation has been replaced by paved surfaces , and
https://weather and climate.com/average monthly Rainfall Temperature Sunshine in Malaysia
32
5
numerous storages or depressions (mining ponds) have been filled up and paved. This has resulted in less infiltration to the groundwater thus reducing the base flow rate. In a ddition , domestic and industrial discharges have also compounded the low flow characteristics.
• Sabah was most affected by the 1998 drought as it suffered extremely high rainfall deficit ( some as low as 90% of long term mean) from four to nine months. Water rationing was imposed in a number of districts, affecting more than 2,797 km 2 and 170,000 people. About 1580 km 2 was engulfed in wild fire, of which more than 100 km 2 were agricultural lands. More than 7,200 farmers were affected The authority needed to send in food supply to the affected areas where the hill pad dy crops were completely wiped out.
Mastura Mahmud ( 2009a) reported that at Kuching, Sarawak, the total average rainfall of 887 mm from May to October in 1997 were 40% below the 30 year climatological mean total of 1 , 487 mm.
A joint report (2014) prepared by the M MD , Department of Irrigation and Drainage (DID ) and Forest Research Institute of Malaysia (FRIM) indicated that the 1998 drought affected Malaysia from Perlis to Negeri Sembilan and Melaka, and the worst hit region was the Federal Territory of Kuala Lumpur and part of Selangor where water rationing had to be exercised. Some 3.2 million u sers were affected for about five months (April to September) during the “national water crisis” in 1998.
The 1997/98 El Niño event exposed Malaysia’s fragile water security situation that it is extremely susceptible to water stress, be it in excess or deficit (Chan, 2004).
Tawang and Tengku Ahmad (200 3 ) compared the differences in the total amount of annual rainfall between normal and El Ni ñ o years. In particular, during the 1997/98 El Ni ñ o event, the total annual rainfall registered a deficit of 9% and 23% for Kedah and Perlis, respectively. The monthly deficits for the months of March to July 1997 were higher, with Kedah received only two thirds of its normal rainfall, while Perlis received 73% of its normal rainfall. It may be noted that the significant rainfall deficits from January to May coincided with the off season paddy planting.
As Kedah and Perlis are important agricultural and food producing areas in the country, any rainfall deficits would have profound impacts on rice productivity and food security.
The water deficit in various parts of Malaysia has a “knock on” effect on other socio economic sectors, as evidenced in the discussion in the following sections.
3.3 Agriculture
Agriculture is one of the key economic sectors in Malaysia The sector contributed 9.2% to the Gross Domestic Product (GDP) in 2014 (Department of Statistics Malaysia, Official Portal) 6 .
It is highly vulnerable to the influences of El Niño events , both in terms of rainfall deficits and temperature changes Tawang and Tengku Ahmad ( 200 3 ) found that in Kedah and Perlis where they conducted their study , the mean monthly temperature, maximum and minimum temperatures were higher during the El Ni ñ o years compared to those of normal years. For example, the mean monthly increases in temperature during the 1997/98 El Niño event were 1.09 o C for Kedah and 1.6 o C for Perlis. 6
33
https://www.statistics.gov.my/index.php?r=column/ctwoByCat&parent_id=45&menu_id=Z0VTZGU1UHBUT1VJMFlpaXRRR0xpdz09
3.3.1
Responses of crops to drought and temperature
Mohamad Zabawi Abd. Ghani (2014) explained the effect s of drought and high temperature on agricultur al crops , which respond different ly for different crops. Drought stress decreases the rate of photosynthesis of plants, hence hindering their growth and reducing their productivity. The effects of drought on crops depend on plant growth stage, stress intensity, water shortages and duration of the condition. S hort term crops with shallow roots such as vegetables, corn, paddy and peanuts are easily affected by drought even in a short period of time It seems that drought affect s the yield from flowering, fruiting and grain producing plants more than the yield from leafy plants, especially during flowering stage. As perennial crops such as fruit trees, cocoa, rubber and oil palm have deep root system that enables them to get water supply from soil for normal growth, t he i mpact of water shortage for a short time period during drought is not significant. However, prolonged period of dr ought will limit their growt h and production of the fruit s For example, i n the case of star fruit, it was observed that a two month drought could stunt the plant’s growth, resulting in reduced flower production and smaller fruits. Drought condition also affects papaya growth, including flowers drop off , structural change in fruit, as well as causing an infertility phase. Cocoa plant , a perennial crop , is also sensitive to water shortage. However, for mild stress of water shortage, the plant produces more fruits instead.
Reaction of perennial crops to high temperature varies. Mohamad Zabawi Abd. Ghani ( 2014) noted that most tropical plants ha ve minimum, optimum and maximum temperature for growth. If temperature increases beyond critical level for a long period of time, plant experiences photorespiration, where most of the biomass/food produced through photosynthesis is reused for respiration, re sulting in less biomass/yield harvested. For paddy, the impact of high temperature varies according to various growing stages. If high temperature condition occurs after grain filling stage , it tends to accelerate maturity and harvesting period. On the other hand , if it occurs at seedling production stage, it is very likely that the seedlings will decrease, followed by reduction in yield .
3.3.2 Impacts of the 1997/98 El Niño on agricultural crops
Table 3.1 shows the yield of three major commodities of Malaysia, oil palm, rubber and paddy from 1992 to 2003. The data are also plotted in Figure 3.1.
Table 3.1 Oil palm, rubber and paddy yield in Malaysia from 199 0 to 2003
Source:
from
of Statistics
34
1995 1996 1997 1998 1999
2001 2002 2003
Data
Department
Malaysia , Official Portal https://www.statistics.gov.my/index.php?r=column/ctimeseries&menu_id=NHJlaGc2Rlg4ZXlGTjh1SU1kaWY5UT09 Yield (kg/ha) 1990 1991 1992 1993 1994
2000
Oil palm 18,530 17,850 17,830 20,260 18,420 18,930 18,950 19,100 15,980 19,260 18,330 19,140 17,970 18,990 Rubber 1,329 1,338 1,332 1,293 1,417 1,291 1,301 1,273 1,330 1,447 1,289 1,358 1,381 1,343 Paddy 2,769 2,818 2,992 3,035 3,061 3,162 3,251 3,068 2,883 2,941 3,064 3,110 3,238 3,360
Yield of Rubber, Paddy and Oil Palm by Year
25,000
20,000
15,000
10,000
5,000
Yield of Rubber & Paddy (kg/ha) Yield of Oil Palm (kg/ha)
0
Rubber Paddy Oil Palm
0
Year


Figure 3.1 Oil palm, rubber and paddy production in Malaysia from 1990 to 2003
(A) Oil palm production
Oil palm production, and hence the price movement, are greatly affected by rainfall. A continuous low rainfall (<100 mm) for two months would have significant effects on palm yield, as evidenced in the past severe El Niño events (Haniff et al , 2010).
The 1997/98 El Niño event significantly affected the oil palm yield and productivity in Malaysia As shown in Table 3.1 and Figure 3.1, the “Yield per Hectare” of oil palm in 1998 showed a significant decrease compared to previous years and the years after, from 18,950 kg/ha in 1996, 19,100 kg/ha in 1997, decreased to 15,890 kg/ ha in 1998 (or a drop of 16.8% from 1997 to 1998), and then increased to 19,260 kg /ha in 1999. Ironically, the oil palm price was the highest since 1960, at RM 2377.50 RM/ tonne (Department of Statistics, Malaysia, Official Portal).
Bank Negara Malaysia (1998) reported that “ Crude palm oil production recorded a decline of 8.3% to 8.3 million tonnes in 1998. The decline was due mainly to lower yields brought about by the rev ersal in the biological yield cycle of the oil palm trees, which occurs once every three or four years. To some extent, the lower yields were also attributable to the lagged impact of the haze and dry weather, which occurred during the second half of 1997, while labour shortages resulted in a lower harvest as loose fruits tended to be uncollected.”
Similar significant decrease was also observed in 1983, another strong El Niño year, from 17,750 kg/ha in 1981, 20,140 kg/ha in 1982, decreased to 15,900 kg/ha in 1983 (or a drop of 21.1% from 1982 to 1983), and then increased to 18,190 kg/ha in 1984 (Table 3.2, and Figure 3.2).
35
500 1000 1500 2000 2500 3000 3500 4000 1990 1991 1992 1993 1994 1995 1996 1997 1998 1999 2000 2001 2002 2003
Table 3.2
Oil palm, rubber and paddy yield in Malaysia from 1981 to 1986
Yield (kg/ha) 19 81 19 8 2 19 83 19 84 19 85 19 86


Oil palm 17, 750 20, 140 1 5,900 18, 190 18,950 18,980 Rubber 1, 425 1 420 1,41 9 1, 387 1, 414 1, 492 Paddy 2,842 2,762 2,605 2,491 2,975 2,640
Source: Data from Department of Statistics Malaysia , Official Portal, https://www.statistics.gov.my/index.php?r=column/ctimeseries&menu_id=NHJlaGc2Rlg4ZXlGTjh1SU1kaWY5UT09
20000
15000
10000
5000
Yield (kg/ha) Year
25000 1981 1982 1983 1984 1985 1986
Oil Palm Rubber Paddy
0
Figure 3.2 Oil palm, rubber and paddy production in Malaysia from 1981 to 1986
The oil palm price was RM 991.00 RM/tonne in 1983, slightly higher than the price in 1981 but lower than the price in 1984. This shows that the market price of oil palm is determined by many factors (Department of Statistics Malaysia, Official Portal: Oil Palm).
Haniff et al. (2010) analy s ed rainfall and oil palm yield records from 1995 to 2009 , and showed that severe El Niño occurrence often resulted in months with less than 100 mm of rainfall at the beginning of each month in the year. In 1998, the number of months with less than 100 mm of rainfall was one month for Sarawak, three months for Peninsular Malaysia and four months for Sabah. It seems that the number of months receiving le ss than 100 mm of rainfall could be coupled to the reduction in fresh fruit bunches ( FFB) yield. Haniff et al. (2010), however, found the mechanisms diffic ult to explain since they could be a combination of complex l ong term and short term stress responses by the palms.
Tawang et al. (2002) found that oil palm y ields decreased when the T otal Suspended Particulate s (TSP), an indicator of air quality, increased. During El Niño events, the concentrations of TSP were high because of the occurrence of haze , which affected the photosynthesi s of plants due to reduced sunlight. Even without the occurrence of haze, a drier weather condition during an El Niño event is expected to be more inductive to higher levels of TSP.
Shahwahid and Othman ( 1999 ) observed that the 1997/98 haze episode ha d a delayed effect on oil palm crops. When the haze event occurred, f ruit bunches were already grown ,
36
some matured, while others still young Therefore, a decline in the FFB production was not obvious between September and early December 1997 , other than the normal decline that begins once the high yield season of August and September was over. The low yield in January and February 1998 was due to low fertilization rates in September 1 997. However, in an extended study, Haniff et al (2016) found that annual FFB yield in 1998 was significantly reduced compared to that in previous years , and they attributed the yield reduction to the severe 1997/98 El Niño event. The economic impact of th e haze impact in 1997/98 on oil palm is still unclear , though yield reduction brings higher FFB prices ( Shahwahid and Othman, 1999)
(B) Rubber yield
At least during the short term, t he rubber yield did not seem to be affected by the El Niño event in 1997/98, with 1,301 kg/ha in 1996 , 1273 kg/ha in 1997 and 1330 kg/ha in 1998, and an increase to 1,477 kg/ha in 1999 (Table 3.1 and Figure 3.1).
However, during 1982/83, another strong El Niño event, the rubber yield in 1981 , 1982 and 1983 were about the same (i.e., 1,425, 1,420, 1,419 kg/ha, respectively), though there was a slight decrease from 1,419 kg/ha in 1983 to 1,387 kg/ha in 1984 (or a drop of about 2.3% from 1983 to 1984), which may not be statistically significant (Table 3.2, and Figure 3.2) (Department of Statistics Malaysia, Official Portal: Rubber).
It has been reported that on the rubber estate, El Ni ñ o contributed positively due to the increase in the number of tapping days, which resulted in an increase in yield and income Other benefits included the reduction in the application of weedicides and fertilizers (Tawang and Tengku Ahmad , 2003)
(C) Paddy yield
The 1997/98 El Niño event clearly affected the paddy yield. As shown in Table 3.1 and Figure 3.1, t he paddy yield dropped from 3,251 kg/ha in 1996, to 3,068 kg/ha 1997 and to 2,883 kg/ha in 1998 (or about 11.3% from 1996 to 1998), before a slight increase to 2,941 kg/ha in 1999.
Similar effect was also evident d uring another strong El Niño event in 1982/83, when the paddy yield dropped from 2,842 kg/ha in 1981 to 2,762 kg/ha in 1982, to 2,605 kg/ha in 1983, and to 2,491 kg/ha in 1984 (or about 12.4% from 1981 to 1984, before a slight increase to 2,975 kg/ha in 1985 (Table 3.2 and Figure 3.2) (Department of Statistics Malaysia, Official Portal: Paddy).
Figure 3.3 shows the paddy and rice production from 1992 to 2003, which correlate d well with each other
37
Paddy and rice production (kilo tonne) in Malaysia (1990-2003)
kilo tonne
0
1990 1991 1992 1993 1994 1995 1996 1997 1998 1999 2000 2001 2002 2003

Year
Paddy Rice
Figure 3.3 Paddy and rice production from 1990 to 2003
Tawang and Tengku Ahmad (2003) found that rainfall and air quality were important factors that affected the pad dy yield. The 1997 haze affected the level of sunlight, which was important for photosynthesis, and thereby reducing second harvest paddy yields, probably by about 10% , according to Shahwahid and Othman ( 1999). Indeed, t he paddy yield dropped by about 11.3% from 1996 to 1998 , as shown in Table 3.1 and Figure 3 .3
There are few details on how the reduced paddy and rice production due to the 1997/98 El Niño event affected the farmers’ income. However, it has been reported that the shortfall of rice yields “ necessitated the import of over million tons to safeguard food availability in Malaysia ” ( Abul Quasem Al Amin and Gazi Mahabubul Alam , 2016).
(D) Cocoa
As shown in Table 3.3, t he production of dry cocoa beans in Malaysia has been declining, from 121,185 tonnes in 1992 to 6,851 tonnes in 2003 . One major factor is the conversion of cocoa plantations to other profitable ventures, especially oil palm (Bank Negara Malaysia, 1997).
Although the yield per hectare shows a small increase from 1996 (0.76 tonne/ha) to 1997 (0.81 tonne/ha) and 1998 (0.86 tonne/ha), the production of dry cocoa beans actually decreased from 54,778 tonnes in 1996 to 37,245 tonnes in 1997 and 29,972 tonnes in 1998, as shown in Figure 3.4. The above data make the assessment of the impacts of the 1997/98 98 El Niño event on the yield of cocoa difficult.
However, according to Bank Negera Malaysia (1997; 1998) , the “severe drought arising from the El Nino weather phenomenon” had affected fruit setting particularly towards the second half of 1997, and “had also delayed the fruit setting for the second season” in 1998. “Besides the weather factor, cocoa output was also affected by rising production cost due to increased labour cost and higher prices of agricultural inputs.” (Bank Negara Malaysia , 1998)

38
500 1000 1500 2000 2500
Table 3.3
Cocoa production in
Year Production of dry cocoa beans (tonne)
Malaysia from 1990 to 2003
Yield per hectare (tonne) Total number of employment Reduction in number of employment compared to previous year
1990 120,826 0.77 56,424 1991 110,377 0.72 52,674 3,750 1992 121,185 0.85 46,733 5,941 1993 101,599 0.79 42,268 4,465 1994 78,932 0.69 37,393 4,875 1995 67,349 0.83 28,267 9,126 1996 54,778 0.76 23,848 4,419 1997 37,245 0.81 15,930 7,918 1998 29,972 0.86 12,472 3,458 1999 22,573 0.86 10,300 2,172 2000 16,941 0.82 7,765 2,535 2001 15,999 0.92 6,686 1,079 2002 10,203 0.73 5,640 1,046 2003 6,851 0.53 5,306 334

Source: Malaysian Cocoa Board (Data reported in Department of Statistics Malaysia , Official Portal) https://www.statistics.gov.my/index.php?r=col umn/ctimeseries&menu_id=NHJlaGc2Rlg4ZXlGTjh1SU1kaWY5UT09
140
120
100
80
60
40
20
0.9
0.8
0.7
0.6
0.5

0.4
0.3
Kilo tonne Yield per hectare (tonne)
0.2
0.1
0
1 0
1990 1991 1992 1993 1994 1995 1996 1997 1998 1999 2000 2001 2002 2003
Year
Figure 3.4 T he production of dry cocoa beans from 1990 to 2003
Produc=on of dry cocoa beans (kilo tonne)
Yield per hectare (tonne)
It is noted that the total number of employment in the cocoa sector decreased from 1990 to 2003 (Table 3.3). In particular, there was a drastic reduction of employment from 23,848 in 1996 to 15,930 in 1997 ( or a total of 7,918 ) compared to other previous years, with the exception of 1995.
3.3.3 Social and economic impacts on agricultural sector
Tawang et al. (2002) estimated the total economic loss of oil palm, rubber and rice from 1980 to 1999 due to the effects and impacts of El Ni ñ o events and it was more than RM 3.3 billion , excluding the various secondary spin off losses resulting from other
39
7
downstream activities. Of th ese losses , o il palm production accounted for RM 2.65 1 billion 7 (or about 80.3% ) , followed by rubber , RM 357 million 8 (or about 10.8% ) and rice , RM 218 million 9 (or about 0.6% ). These losses had resulted in the loss of foreign exchange because of the loss from potential export earnings of palm oil (estimated at RM 2,129 million in 1998) and rubber (estimated at RM 179 million), as well as the need to import more rice to meet the country’s demand ( Tawang et al., 2002) However, Tawang et al. (2002) did not find evidence of significant productivity losses for other agricultural sub sectors , such as fruits, vegetables, sugarcane, and selected livestock industries.
F or the 1997 / 98 El Ni ñ o event, Tawang et al. (2002) estimated the economic losses of oil palm and paddy at RM 1 , 982.0 million and RM 159.6 million respectively for the year 1998. No estimate of economic loss for rubber was provided for 1998.
Based on the same methodology of Tawang et al. (2002), Tawang and Tengku Ahmad (2003) focused on the states of Kedah and Perlis in the northwest region of Peninsular Malaysia , and estimated the economic losses of oil palm for the Kedah Perlis region at RM 113.2 million due to the 1997 / 98 El Ni ñ o event 10 T hey also estimate d the economic losses of paddy for the Kedah Perlis region at RM 49 .0 million 11 due to the 1997 / 98 El Ni ñ o event However, they showed that the 1997 / 98 El Ni ñ o event did not seem to have significantly affect ed the yield performance of rubber in the same region.
3.3.4 Practical measures to reduce impacts on agricultural sector
Although limited mitigating measures have been introduced, a more holistic approach and comprehensive measures are needed to reduce the impacts of future El Ni ñ o events in the agricultural sector. As discussed by T awang et al. (2002) and Tawang and Tengku Ahmad (2003), t hese include approach such as sustainable water resources management, including practices related to water management within the irrigation scheme ; continuous improvement of irrigation infrastructures, and the enhancement of support services with improvements in storage, delivery and the distribution system so as to ensure an effective and efficient use of irrigated water ; ability to reschedule water supply; application of an efficient water control and management system ; water recycling ; water saving agronomic practices and overall efficiency in water use. The most successful mitigating measure undertaken by the plantation in coping with drought was the construction of artificial lakes as a source of water supply. By using a mobile sprink ler system the effects of the prolonged drought period were drastically reduced.
3.4 Forestry
There have been some studies on the impacts of drought on forests. For example, Nakagawa et al. (2000) assessed the i mpacts of severe drought associated with the 1997 / 98 El Niño event in tropical forest in Sarawak They compared that the tree mortality during non drought period (1993 1997) and drought period (1997 1998) , and found that the mortality rates during drought period were significantly higher than for the non drought period. They concluded that the severe drought associated with the 1997 / 98 El Niño event had a big impact on tropical forest dynamic by causing unusually high mortality.
Aiba and Kitayama (2002) examined the effects of the 1997/98 El Niño drought on nine rain forests of Mount Kinabalu at four altitudes (700 m , 1700 m , 2700 m and 3100 m) on contrasting geological substrata (ultrabasic versus non ultrabasic). Measurements of ra infall and atmospheric aridity indicated that the departure from normal conditions during the drought became greater with increasing altitude. During 1997 99 (drought period)
For the years 1982, 1983, 1991 and 1998 See Table 5.5 of Tawang et al. (2002).
8 For the years 1981, 1982 and 1990. See Table 5.8 of Tawang et al. (2002).
9 For the years 1980, 1981 and 1998. See Table 5.11 of Tawang et al. (2002).
10 Tawang and Tengku Ahmad assumed that for the case of oil palm, the effects of El Niño only impacted yield one year after of the event
11 For the years 1997 and 1998. See Table 4.11 of Tawang and Tengku Ahmad (2003).
40
compared to 1995 97 (pre drought period), median growth rates of stem diameter of trees decreased for both smaller (4.8 cm 10 cm) and larger ( ≥ 10 cm) diameter classes in the six upland forests ( ≥ 2700 m on ultrabasic substrata and ≥ 1700 m on non ultrabasic substrata), but for neither diameter class in the other forests. The majority of species decreased or did not change growth rates during 1997 99, whereas some did increase. Tree mortality increased during 1997 99, at the larger diameter class in the two lowland forests (700 m) on both substrata, and at least at the smaller diameter class in the four upland forests ( ≥ 1700 m) on non ultrabasic substrata. In two of these upland forests, mortality was restricted to particular understorey species. Mortality did not significantly increase in the three upland forests ( ≥ 1700 m) on ultrabasic substrata; this suggests that the adaptation to nutrient poor soils might have provided the resistance to drought.
Potts (2003) assessed the mortality rates of forests in the Lambir Hills National Park located in Sarawak for the pre drought (1993 97) and drought periods (b etween late January and mid April in 1998 when less than one fifth of the normal expected rainfall was received ) He found that the f orest wide mortality rates during the drought were 7.63% per year as compared to 2.40% per year during the pre drought period. In other words, the mortality rate during the drought period was three times higher than during the pre drought period Potts (2003) used l ogistic regression to investigate the habitat effects , and found that d uring the pre drought period, soil type was the most important predictor of tree survival, while during the drought period, slope was the most important.
In addition, Potts (2003) found that d uring the drought, different families responded differently in terms of relative increases in mortality. Thus, drought may have induced changes in community diversity and composition. Nakagawa et al. (2000) also found that sensitivity and tolerance to dr ought varied among taxonomic groups. F or the purpose of effective forest management during drought periods in Malaysia , it is important to assess the various disturbances or impacts imposed by drought on the survival between rare and common species , and establish the ecological basis of any differences (Potts, 2003)
Bank Negara Malaysia (1997) reported that heavy and thick haze during August and September in 1997 led to lower production of saw logs in the second half of the year, as harvesting operations were halted due to poor visibility .
3.5 Energy
Hydropower is the most vulnerable to prolonged drought. There was a significant decrease in electricity generated by hydropower stations during the 1997/98 El Niño event, from 5,139 million kWh (kilowatt hour) in 1996 to 3,917 million kWh in 1997 (or a decrease of 23.8% from 1996 to 1997) and 4,799 million kWh in 1998 (or a decrease of 6.62% from 1996 to 1998) to 7,460 million kWh in 1999 (Department of Statistics Malaysia, Official Portal). Th e shortfall of hydroelectric was made up by the diesel and gas generated electricity (Figure 3.5). This implies a higher cost for producing energy and a higher emission of greenhouse gases.
41
60,000
Electricity generated in Malaysia from 1990 to 2003
50,000
40,000
30,000
20,000
10,000
0
Million KWH Year
1990 1991 1992 1993 1994 1995 1996 1997 1998 1999 2000 2001 2002 2003

Steam Sta=ons Diesel Sta=ons Hydro Sta=ons Gas Turbines
Figure 3.5 Electricity generated in Malaysia from 1990 to 2003
3.6 Industry
It is difficult to gauge the impact s of the 1997/98 El Niño event on industry without further analysis in each industrial sub sector It is expected that th e subsectors that rely heavily on water resources would be more affected.
The GDP contributed by manufacturing decreased from RM 53,387 million in 1996 to RM 50,899 million in 1998 (or a decrease of 4.7%) , and it recover ed to RM 56,840 million in 1999 (Department of Statistics Malaysia, Official Portal). The decrease in GDP contributed by manufacturing in 1998 could be due to the economic downturn exacerbated by the prolonged drought that affected the industrial production activities due to the constraint in water resources
The industrial productivity index is plotted fo r mining, manufacturing and electricity, which clearly indicates a decrease in manufacturing from 1997 to 1998 (Figure 3.6).
42
Industrial Productivity Index (2005 = 100), Malaysia from 1990 - 2003
Index (Weights) Year
Mining Manufacturing Electricity
0
1990 1991 1992 1993 1994 1995 1996 1997 1998 1999 2000 2001 2002 2003

Figure 3.6 Industrial productivity index, Malaysia from 1992 to 2003
Source: Department of Statistic Malaysia: Official Portal
3.7 Ecosystems and ecosystem services
3.7.1 Terrestrial ecosystems
Ecosystems represent a key asset in Malaysia contributing to the national economy by providing food , water , as well as natural resources such as timber and fisheries that are major sources of national income
However, v ery little is known about the impacts of the 1997/98 El Niño event on the terrestrial ecosystems, apart from the reported loss of endangered species and biodiversity due to drought induced forest fires , which have profound effects on the structure and dynamics of the affected ecosystems (Schweithelm et al., 1999; Glover and Jessup, 1999).


The costs of many of the impacts of the forest fires and the associated hazes on the f ragile terrestrial ecosystems as well as the loss of ecosystem services during the 1997/98 El Niño event are difficult to quantify due to the lack of data and research. S ome of these effects could be long term, and it c ould take many years to recover (Hughes et al., 1998).
3.7.2 Marine ecosystems
In Malaysia, the coastal zone has a special socio economic and environmental significance because m any people rely on coastal ecosystems, such as coral reefs and mangroves, to provide their daily food and income (Sulaiman and Zainal Abidin, 2012).
(A) Coral reefs
Coral reefs provide important marine ecosystem services They buffer adjacent shorelines from wave action and prevent erosion, property damage and loss of life (NOAA, 2008). They s upport important subsistence fisheries (WCMC, 1992 ) , and contribut e to local economies through tourism (NOAA, 2008)
43
20 40 60 80 100 120
Malaysia is part of the “Coral Triangle” (Figure 3.7), an area recogni sed by scientists to have the world’s highest marine biodiversity. T he t otal reef area in Malaysia is 4,000 km 2 , of which Sabah accounts for three quarters. Coral diversity is highest in East Malaysia at an estimate of over 550 species while Peninsular Malaysia has over 360 species of coral.
Figure 3.7 The Coral Triangle
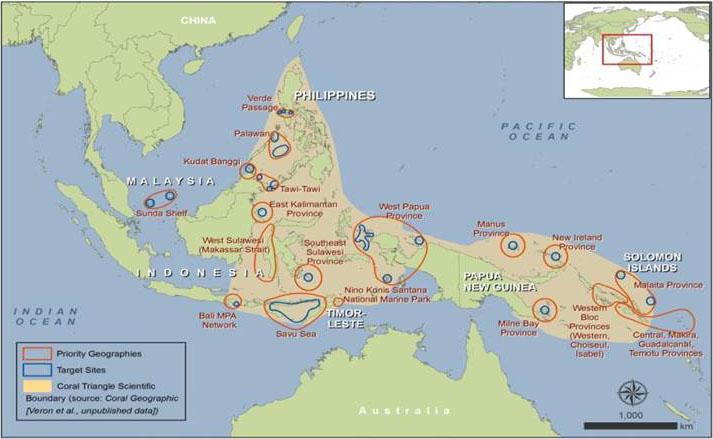
Pe ñ aflor et al. (2009) reviewed the s ea surface temperature and thermal stress in the Coral Triangle over the past two de c ades Citing various literature (e.g., Wilkinson, 1998; McPhaden et. al., 2006; Oliver et al., 2009 ), they found that t he Coral Triangle as a whole has experience d a pronounced increase in SST during El Niño events , including the intense ocean warming during the 1997/98 El Niño event that led to the widespread occurrences of coral bleaching. It was estimated that t he 1997/98 El Niño event alone had caused the bleaching of 16% of the world’s coral reefs (World Bank, 2007).
However, l arge proportions of the Coral Triangle in Malaysia have already been severely impacted by overfishing. By comparis on, the main coral reef areas surrounding Sabah is in much poorer health than the rest of the country (WWF and UQ, 2009). Although the natural El Niño events continue to threaten the Coral Triangle, human caused factors , including human induced global warming, continue to play a significant role in its degradation.
Although coral reefs bleaching have been widely reported during the 1997/98 El Niño event, there is a need for systematic scientific research on the impacts of El Niño events in the Malaysian coastal regions , including coral reefs One particular interesting aspect is research on coral farming which may be undertaken to restore the dying and damaged reefs 12 12
http://www.coralvita.co/coral farming/
44
Source: NOAA, undated
(B) Mangroves
Mangrove s also provide important ecosystems services , and its values are well d ocumented in the literature They are a significant source of wood and fuel , and they provide habitat for shellfish, crustaceans and fish (W CMC , 1992 ; MEA, 2005a; FAO, 2007; 2010) They are used by coastal communities as nurseries for many fishery species, and also as sites for agricultural production, especially rice production (MEA, 2005a).
The data provided by the Forestry Department Peninsular Malaysia (2017) show that the mangroves area in Peninsular Malaysia for the year 2014 was 110,000 ha , while the total area of mangrove forest s in Sabah was about 340,000 ha i n 201 5 (Sabah Forestry Department, 2015) , and 86,258 ha in 2013 in Sarawak (Forestry Department Sarawak, 2013). The total area was about 536,258 ha.
It was reported in 1992 that Malaysia ha d 6 3 0,000 h a of mangrove forest s of which 105,000 h a were located in Peninsular Malaysia, 350,000 h a were located in Sabah and 175,000 h a were located in Sarawak (WCMC, 1992). It is clear that the total area of mangrove forests has been decreasing since the 1990s. Apart from Peninsular Malaysia that shows a slight increase in mangroves area (from 105,000 ha in 1992 to 110,000 ha in 2014), both Sabah and Sarawak have recorded a decrease, especially in Sarawak, which had about half of its mangrove area (86,258 ha) in 2013 compared to 175,000 ha in 1992.
The main drivers for these losses are attributed to illegal cutting, conversion to other uses (such as mariculture and other forms of coastal development) and land based industrial pollution. Malaysia has a long tradition of production of mangrove charcoal for national and international markets (FAO, 2007). However , there have been effort s to restore the degraded mangrove areas (Forestry Department Sarawak, 2013; Sabah Forestry Department, 2015) For example, Sabah Forestry Department has planted a total of 1 , 220.21 ha in degraded mangroves and coastal areas with suitable mangrove and associated species a s of December 2015 ( Sabah Forestry Department, 2015 ).
Gilman et al. (2008) , citing Field (1995) and Ellison (2000) , have highlighted the following expected impacts of increased surface temperature on mangroves :
• C hanging species composition (extinction)
• C hanging phenological patterns (e.g., timing of flowering and fruiting)
• I ncreasing mangrove productivity where temperature does not exceed an upper threshold
• E xpanding mangrove ranges to higher latitudes where range is limited by temperature, but is not limited by other factors, including a supply of propagules and suitable physiographic conditions
However, the above expected impacts on mangroves are supposed to be in response to longer term climate change rather than the short term El Niño events , even though El Niño events are likely to exacerbate the effects of climate change and vice versa. Interestingly, Holmgren et al. ( 2001) reported that El Niño effects have been linked to the almost complete defoliation of mangroves
In view of the pr ojected increase of El Niño frequency with global warming, the profound El Niño impact on ecosystems justifies a substantial future research effort to provide a comprehensive understanding of El Niño effects on terrestrial and marine ecosystems (Holmgren et al., 2001)
45
3.7.3
Ecosystem services and valuation
Sections 3.71 and 3.72 have briefly touched upon the ecosystem services provided by the terrestrial and marine ecosystems. This section provides a brief general discussion on ecosystem services and valuation, which are important from the perspectives of environmental economics or natural resources economics.
Ecosystem services are the benefits that ecosystems provide to humans. The Millennium Ecosystem Assessment (2005 a ) has categori sed ecosystem services as provisioning, supporting, regulating and cultural services. These services have provided the benefits to the humans, as illustrated in Figure 3.8.
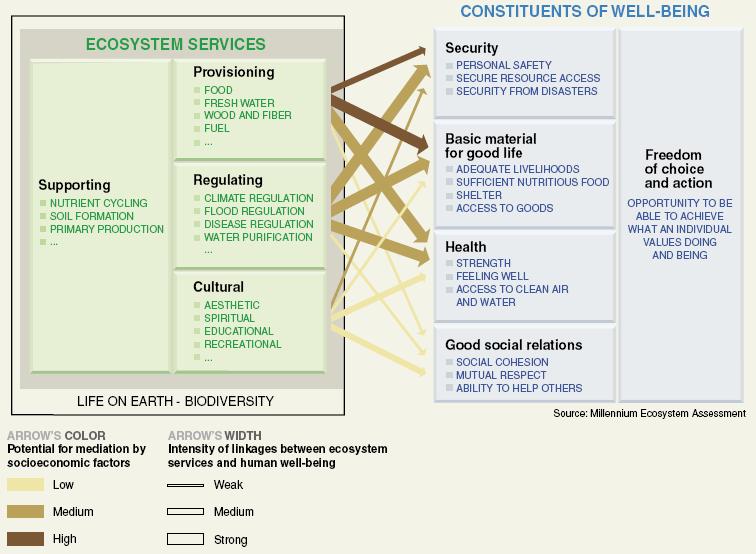
The degradation of ecosystems reduces their ability to provide benefits, thus negatively affecting human welfare in a number of ways. Methodologies are available for valuing different types of ecosystem services. Methodologies of valuation of ecosys tem services are available, though further improvements are still needed (see Costanza et al., 1997; TEEB, 2010a, 2010b; Grainger et al., 2013; Olsen, 2013; Poulsen, 2013).
Despite the complexity of ecosystems and their interactions with our social and economic systems has made the valuation of all ecosystem services difficult, the valuation of different types of ecosystem services is an important element in the assessment of the economics of the impacts caused by the past and future El Niño events, especially the impacts of prolonged drought and the forest fires induced by drought (see Section 4.9). A systematic and coordinated research in these areas in Malaysia by relevant agencies and research institutes is needed , perhaps with funding from the government
Figure 3.8 Services provided by ecosystems
Source: MEA (2005 a )
46
There is evidence to show that the 1997/98 El Niño event affected fish migration and fish landing in Malaysia, though the extent was difficult to assess. However, Shahwahid and Othman (1999) estimated that the loss due to the decline in fish landing was RM 40.58 million (US$ 16.23 million ) or 5.00% of the total cost of RM 801.9 million (or US$ 321 million at 1997 exchange rate) during the months of August to October (see Section 3.12).
Tawang et al. (2002) and Tawang and Tengku A h mad (2003) have highlighted the problems faced by aquaculture breeders during the El Niño events These included (i) the unavailab ility of water to the pond due to prolonged drought; and (ii) h igher water temperature which could affect fish feeding because the fish became less active and avoided the water surface. Consequently, less food was consumed by the fish, resulting in feed wastage , and slower fish growth.
Tawang et al. (2002) investigated the relationship between the level of TSP associated with haze and fish landings during the El Nino e vents, and found no real link between the two probably due to the short duration of the haze to have any signifi cant effect on annual marine landings. Although technical studies indicate that haze tends to negatively affect the yields of aquaculture farms because of unhealthy air quality that affects the survival rates and weight gain of prawns, fishes and other aquacultural species, Tawang et al. (2002) observed that El Niño events had no significant effect on the annual productivity of both the pool type and cage type aquaculture farms.
During the 1997 /98 El Niño event, warmer ocean temperature caused widespread coral bleaching in Malaysia. Within South East Asia, the potential sustainable economic value of coral reefs is substantial. Equally so is the potential economic loss if these resources are degraded, such as reduced productivity of reef fisheries. One estimate puts the value of coral reefs at US$115,740 per hectare per year. This places Malaysia’s reefs, with a cover of 4,000 km 2 , at a value of RM145 billion per year. Economically, coral re ef related businesses in Malaysia have been estimated at approximately US$ 635 million annually, in food, fisheries, tourism and even pharmaceuticals 13
3.9 Air quality
3.9.1 Forest fires haze
During the 1997/98 El Ni ñ o event, especially from July to September 1997, air quality in Malaysia and the neighbouring countries was seriously affected by haze produced by the extensive forest fires in Indonesia. The causes and the impacts of the fires have been comprehensively discussed by Dudley et al. (1997), Schweithelm and Glover (1999), as well as by a recent report prepared by the Haze Task Force established by ASM (ASM, 2016).
About 10 million hectares of forest in Indonesia was destroyed in the 1997/ 9 8 haze episode, mostly due to the burning of forests to prepare land for plantation development on peat soil ( Jepson et al., 2001 ; Murdiyarso and Adiningsih, 2007 ; Saharjo and Munoz, 2005 ; Suyanto et al., 2004 )
The environmental, social and economic impacts of the haze have been well documented ( Schweithelm and Glover, 1999; Shahwahid and Othman, 1999; Tacconi, 2003 ) The haze significantly affected both the natural and human environment, traffic navigation, human health (see Section 3.10), and tourism (see Section 3.11) in Malaysia and in the region.
The Department of Statistics Malaysia, Official Portal only provides Air Pollution Index (API) data at a few selections, namely in Cheras, Kuala Lumpur; Larkin, Johor Bahru;
47
3.8 Fisheries
13 http://www.reefcheck.org.my/donate
Bandaraya Me laka; Seberang Jaya; Kuching; Kota Kinabalu and Miri since 1998. The air pollutants included in Malaysian’s API calculation are Ozone (O 3 ), Carbon Monoxide (CO), Nitrogen Dioxide (NO 2 ), Sulphur Dioxide (SO 2 ) and Particulate Matter of less than 10 microns in size (PM 10 ). The index value to indicate the status of the air quality are categori sed in Table 3. 4.
Table 3. 4 Status of the air quality
Value of API Status 0 50 Good 51 100 Moderate 101 200 Unhealthy 201 300 Very unhealthy Above 300 Hazardous
Source: Department of Statistics Malaysia, Official Portal: Environment
Table 3. 5 Annual m aximum and m inimum Air Pollutant Index for s elected Stations, 1998 1999, Malaysia Yea r
Air Quality Air Pollution Index (API) Cheras Kuala Lumpur
Bandaraya Melaka Seberang Jaya Kuching Kota Kinabalu Miri Max Min Max Min Max Min Max Min Max Min Max Min Max Min
Larkin Johor Bahru
199 8 140 10 116 7 92 4 111 16 90 3 459 1 649 6 199 9 137 3 114 6 77 3 79 10 76 4 70 1 120 4
(Source: Department of Statistics Malaysia, Official Portal: Environment)
Table 3. 5 presents the annual m aximum and m inimum Air Pollutant Index for seven s elected s tations, 1998 1999 in Malaysia. These data reveal that in 1998, the annual maximum API registered 140 (unhealthy) 459 (hazardous) in Kota Kinab alu and 649 (hazardous) in Miri, which were likely to be contributed during the forest fires induced haze during the 199 8 drought period , as the annual maximum API in 199 9 in Kota Kinaba lu and Miri had drastically reduced to 70 and 120 ( Department of Statistics Malaysia, Official Portal: Environment). Unfortunately, API data for 1997 are not available from the same source for comparison. However, Shahwahid and Othman ( 1999 ) reported that the 1997 haze reached new levels of intensity and duration compared to previous events in 1983 , 1991 and1992, with API readings reached hazardous levels and a state of emergency was declared for a 10 day period in Sarawak. One report even provided that t he API exceeded 800 in Kuching 14
Mastura Mahmud (2009b) investigated the air quality over a 5 day period from 14 to 17 September 1997. On 14 September 1997 the air quality worsened in Selangor, where average PM 10 concentrations were >400 m g m 3 On 15 September, the neighbouring state Negeri Sembilan was the only one where the high PM10 concentration >400 m g m 3 persisted. By 16 September air quality improved slightly; Melaka experienced PM 10 concentrations of >300 m g m 3 (Mastura Mahmud, 2009b). Interestingly, s he found that there was recirculation
48
14 http://rainforests.mongabay.com/08indo_fires.htm
of haze particles which moved towards the shore during the day because of land breeze, and away from the shores during the night because of sea breeze . It is clear that land and sea breezes play an important role in the dispersion of air pollutants in the Klang Valley. More studies o n this aspect are needed to assess the air dispersion patterns in the Klang Valley under different synoptic weather conditions during the El Ni ñ o event s
It seems that the API reported is usually based on PM 10 It would also be useful to monitor PM 2.5 , which has now been practis ed by many countries. In addition, API does not provide the synergistic effects of various pollutants, which could be more harmful than the individual impact of one particular pollutant which has the highest API reading.
It was estimated that between 0.81 and 2.57 gigatonnes (Gt) of carbon we re released to the atmosphere in 1997 as a result of burning peat and vegetation in Indonesia ( Page et al., 2002 ) This is equivalent to 13 40 % of the mean annual global carbon emissions from fossil fuels. Indeed, Page et al. ( 2002 ) concluded that the 1997 fires were "a major contributor to the sharp increase in atmospheric CO 2 concentrations detected in 1998." Indeed, t he carbon dioxide ( CO 2 ) concentration data at Mauna Loa, Hawaii, the baseline station operated by NOAA , showed an increase f rom 1 22 ±0.11 ppm in 1996 to 1.93 ±0.11 ppm in 1997 and 2.93 ±0.11 ppm in 1998 , which was dropped to 0.93±0.11 ppm in 1999 ( ftp://aftp.cmdl.noaa.gov/products/trends/co2/co2_gr_mlo.txt ).
Most of the carbon released in the Indonesian fires came not from burning trees but from smoldering peat bogs which lost between 25 cm and 85 cm of their depth in the fires (Lazaroff, 2002). Apart from CO 2 , ot her emissions from forest fires were nitrous oxide ( N 2 O ) ( Ishizuka et al., 2005) , a strong greenhouse gas with Global Warming Potential (GWP) of 296 (IPCC 2001 estimation), and an ozone deplete r ; as well as nitrogen oxides ( NO x ), methane (C H 4 ) and non methane hydrocarbons, which are precursors for the photochemical production of ozone, an important greenhouse gas (Low 1998; Thompson, 2001; Ishizuka et al., 2005). Methane is also a greenhouse gas with a GWP of 23 (IPCC 2001 estimation)
The tropospheric ozone and aerosol index over Indonesia and Malaysia on 6 July, 10 September, 10 October and 21 October 1997 are shown in Figure 3.9. The significant smog or tropospheric ozone is represented by red and green and regions of significant smoke index are in shades of white and gray. The blanket of pollution spread to the southern part of Thailand and the Philippines, and even stretched as far as to the northern pa rt of Australia.
49
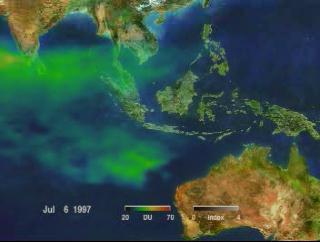
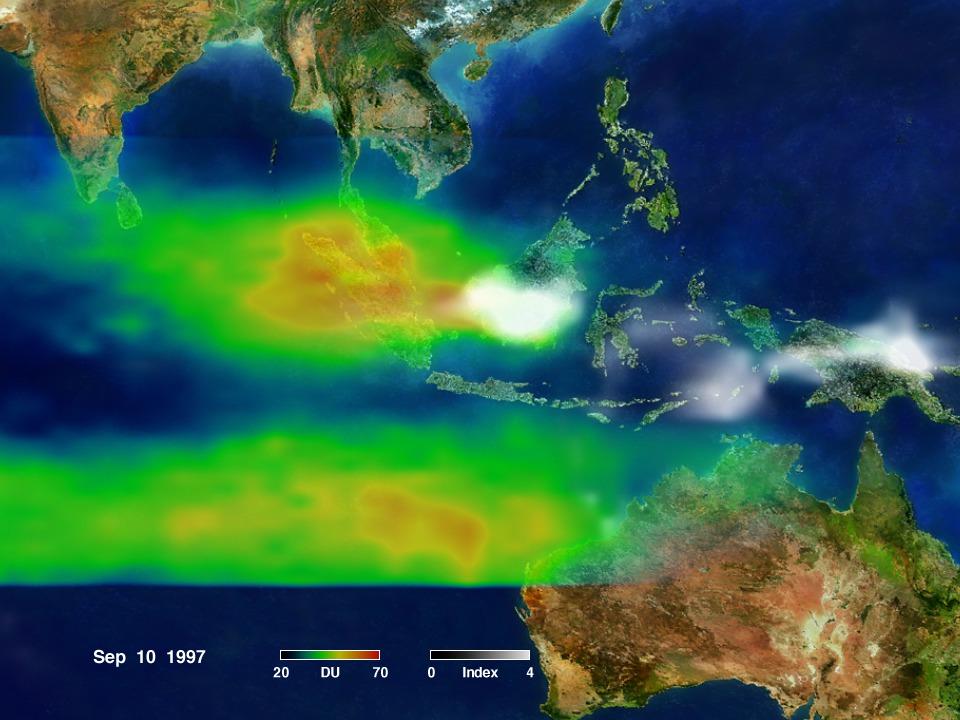
50
Source: http://svs.gsfc.nasa.gov/2004 NASA/Goddard Space Flight Center Scientific Visualization Studio
Figure 3.9 The tropospheric ozone and aerosol index over Indonesia and Malaysia on 6, July 10 September, 10 October and 21 October 1997, respectively
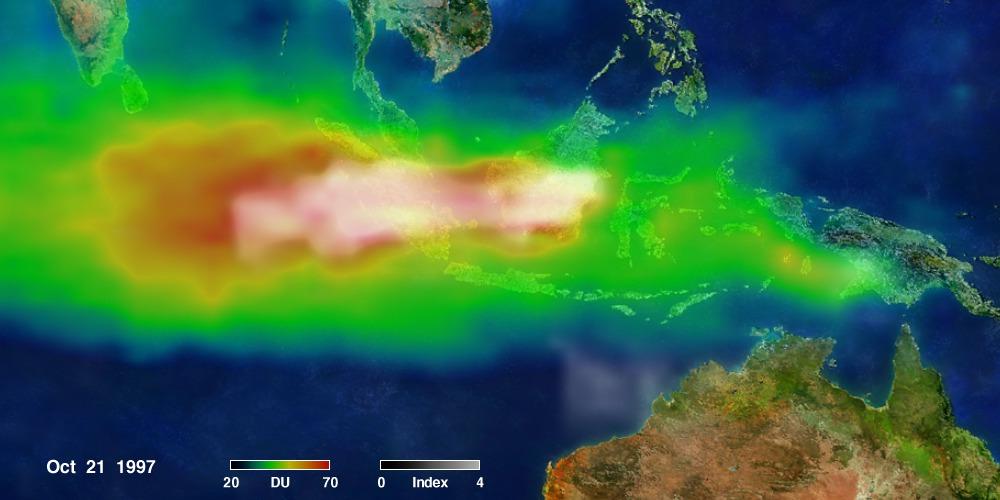
In response to this human induced disaster, ASEAN initiated a Regional Haze Action Plan (RHAP). As part of this Act ion Plan, a monitoring and warning system for forest/vegetation fires was developed and implemented, namely the Regional South East Asia Fire Danger Rating System (SEA FDRS), adopted from the Canadian Forest Fire Danger Rating System. The daily responsibil ity of producing the SEA Fire Danger Rating (SEA FDR) was handed over to the MM D by the Canadian Forest Service (CFS) in mid September 20 03. Since then, the MM D has been producing SEA FDR products on a daily basis to be used to
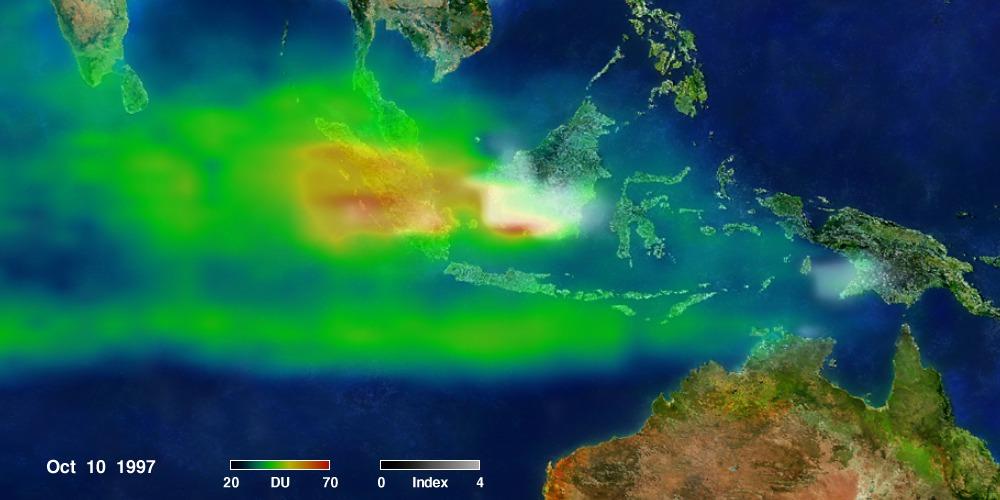
51
predict fire behaviour and to guide policy makers in developing actions to protect life, property and the environment.
The ASM Haze Study Group has just completed a comprehensive study on the transboundary haze issues (ASM, 2016). The report assesses the causes of the forest fires induced haze, and its environmental (including climatic), social and economic impacts , with a view to providing solutions for future actions
3.9.2 Composition of biomass burning haze
Biomass combustion is an important primary source of many trace substances that are reactants in atmospheric chemistry and of soot particulate matter that decreases visibility and absorbed incident radiation. Chemically , biomass smoke particles contain thermally unaltered and partially altered biomarker compound from the vegetation and can change climate by altering the radiation balance ( von Hoyningen Huene et al., 1999 ) The atmospheric impact of these emissions is controlled by the type, location, strength and duration of the burning source, and also by their subsequent vertical distribution with implications for their atmospheric transport and chemistry ( Monks et al., 2009 )
Results from the study by Siao et al. (2007) in three sampling stations in Sumatra, Indonesia , showed that apart from black carbon, anions (SO 4 2 , NO 3 ), cations (K + , Na +) and trace metals were present in atmospheric aerosols during biomass burning. High ionic content in biomass burning, especially from plant materials, may be related to the characteristics of the ecosystem where the trees have grown ( Gonçalves et al., 2010 ) . Study by Liu et al. ( 2000 ) indicated that major inorganic fine particle types that were emitted during the flaming phase of forest fires consist of pure compounds of KCl and NH 4 Cl. Acidification reaction with SO 2 with various sources including the biomass burning increase the concentration of K Sulfate and NH 4 Sulfate in atmospheric aerosols within rather short distance from fire.
Combustion from biomass burning during haze episode also found to distribute the amount of carcinogenic substances such as polycyclic aromatic hydrocarbon (PAH) ( Shen et al., 2013 ). According to Reisen and Brown ( 2006 ), PAH levels achie ved more than 30 times higher than the level normally measured during haze episode in several part of Indonesia. In Kuala Lumpur, PAH measurement s were recorded more than eight time s higher during haze com pared to non haze days ( Omar et al., 2006 ). Benzo(a)pyrene as one of the most toxic PAHs were recorded 15 times hig h er during haze episode. Further study by Siao et al. (2007) shows that Phenanthrene is the dominant PAH molecules in atmospheric aerosols during haze episode in Sumatra. Ind/Ind + BPe of PAH ratio value during haze episode in Sumatra (0.62 076) indicate the biomass burning cont ribute to the amount of PAH in atmospheric aerosols during haze episode.
3.9.3 Photochemical haze
It may be noted that not all haze aerosols were created by forest fires. It is likely that during dry and hot conditions, photochemical haze could also be produced locally under the sunlight with emissions from motor vehicles and industry. Photochemical haze could also be transported from neighbouring regions. Ozone is the important component of photochemical haze (Low, 1998).
It is m ost likely tha t the haze episode Malaysia and neighbouring countries have experienced during the outbreak of forest fires in an El Nino event could be a combination of both transboundary forest fires haze and the locally produced photochemical haze. The contrib ution of forest fire haze and the photochemical haze and their synergistic effects in any haze episode needs to be scientifically assessed.
52
El Ni ñ o events could affect human health in many ways. The direct impact would be the heat stress as a result of higher air temperature. For example, Tawang and Tengku Ahmad (2002) reported that during the 1997/98 El Ni ñ o event, the monthly temperature increases ranged between 0.1 o C and 1.9 o C (with the mean at 0.9 o C) in Kedah and between 0.1 o C and 2.4 o C (with a mean of 1.36 o C) in Perlis The maximum and minimum temperatures were also higher during the El Ni ñ o years compared to those of normal years.
The poor air quality caused by continuous hazy conditions affect the health of all, especially hi gh risk groups such as children, senior citizens and people who smoke, people who work outdoors or sufferers of asthma, bronchitis, pneumonia, chronic lung diseases, cardio vascular problems or allergies , as identified by Shahwahid and Othman ( 1999 ). It has been estimated that for the period from August to October 1997, the total cost related to treatment of the 1997 haze related illnesses, which included both at the private and government hospitals and clinics and for self treatment, was RM 21.02 mill ion (US$8.408 million) ( Shahwahid and Othman , 1999) However, the costs of the long term effects on health caused by the haze were not included in the above study. If the adverse effects of drought (i.e., not only haze) on health were taken into accou nt, the costs will be more difficult to quantify in part because many of the adverse effects may only be felt for years to come (Hughes et al , 1998).
A 14% decrease in lung function in school children during the 1997 haze was reported (Brauer, 1998; WHO, 1999). Recent study by Sahani et al. (2014 ) also claimed that biomass burning in South East Asia caused haze exposure with immediate and delayed effects on mortality. A good example is the haze episode in the Klang Valley, Malaysia, between 2001 to 2010, that was responsible for an immediate effect of respiratory mortality with a 19% increment for all respiratory mortality, and 34% and 41% increments in respiratory mortality for all males and elderly male residents respectively. Delayed effects of ha ze were found in cases of natural mortality of children and respiratory mortality of adult females aged 15 59 years old, with incremental of 41.4% and 66% respectively. Another study by Othman et al. (2014) showed that haze occurrence was associated with an increase in inpatient cases by 2.4 per 10,000 populations each y ear, representing an increase of 31% from normal days. The average annual economic loss due to the inpatient health impact of haze was valued at RM273,000.
In addition, haze affects the degree of sunshine hours in the region (Tawang et al. , 2002). The blockage of sunlight during haze episode may promote the spread of harmful bacteria and viruses that would otherwise be killed by ultraviolet B radiation ( Afroz et al., 2003 )
The outbreak of the Nipah Virus (Ni V ) spread by fruit bats, which was reported to have been first identified in Kampung Sungai Nipah, Malaysia, in 1998 , could be linked to the 1997/98 El Ni ñ o event . According to Looi and Chua (2007) , it was probable that “initial transmission of NiV from bats to pigs occurred in late 1997/early 1998 through contamination of pig swill by bat excretions, as a result of migration of these forest fruit bats to cultivated orchards and pig farms, driven by fruiting failure of forest trees during the El Nino related drought and anthropogenic fires in In donesia in 1997 1998”.
It was clear that t he Malaysian government was unprepared for this new disease and subsequently bore high costs from the outbreak, including more than 100 human lives lost, as well as an economically devastating collapse of its pig farming industry. Before the outbreak, Malaysia had 2.4 million pigs, of which approximately 1.1 million of them had to be culled, costing about US$97 million. Compensation paid to farmers cost the government up to US$35 million. In addition, the expor t of pigs to Hong Kong and Singapore was halted, resulting in a loss exceeding US$100 million in trade for Malaysia. In total, the outbreak cost the Malaysian government more than U S $450 million. Of great concern too
53 3.10
Health
was the impact on livelihoods. Although the government provided free public health care to patients many of whom required intensive care during the initial stages of the illness which protected the affected families from destitution, most of the pig farms were family run businesses that pro vided income and stability for entire communities. The collapse of the industry therefore had a severely negative impact on these people (Kahn, 2011)
Malaysia first documented de ngue in 1902 and the disease was made notifiable in 1973 (George and Lam, 1997). W orld Health Organization (W HO ) reported that d uring 1997/98, M alaysia recorded an increase in dengue incidence , with 19,544 dengue cases in 1997 (the highest since 1973) , which was 37.4% hi g her than the number reported in 1996 Among these cases, 806 were dengue h a emorrhagic fever resulting in 50 deaths. Cases were reported throughout the year but peaked in July 1997 , and most cases were reported in urban areas with high population density (WHO, 1998) . It is likely that several factors m ight have affected the disease patterns , including t he prolonged drought caused by the 1997/98 El Niño event that could affect vector density , as well as the economic downturn during the time that greatly reduced the construction activities which were previously associated with dengue outbreaks (WHO, 1998)
In addition, d uring the 1997/98 El Niño event, significant outbreaks of cholera were reported in Malaysia, as well as in Indonesia and the Philippines These outbreaks were linked primarily to the lack of clean drinking water associated with the severe El Nino related drought (Harvard Medical School, 1999).
3.11 Tourism
When the Malaysian economy was hit by the regional haze crisis during late 1997, tourism along with leisure and restaurant businesses suffered profoundly . The Bank Negara Malaysia (1997) reported that the prolonged haze severely affected tourist arrivals a nd related services receipts during the months of July October 1997. For example, “the occupancy rates of hotels dropped from a norm of 60 65% to as low as 30 50% for some hotels in the Kuala Lumpur Golden Triangle area”. The negative reports on the h aze situation contributed to this tourist decline.
According to the Tourist Development Corporation of Malaysia , tourism sector saw a decreased number of international visitors arrival in Malaysia from 7.14 million in 1996 to 6.21 million in 1997 (or a decline by 13%) and 5.55 million in 1998 (or a decline by 22.3%), before the number increased to 7.93 million in 1999 (Table 3.7). Similarly, there was a decrease in tourism revenue from RM 10.35 billion in 1996 to RM 9.70 billion in 1997 and RM 8.58 billion in 1998, before an increase to RM 13.45 billion in 1999 ( Table 3. 6 ).
Table 3. 6 International tourist arrivals and receipts to Malaysia
Year Arrivals (million) Receipts (RM billion)
1990 7.45 4.50 1991 5.85 4.30 1992 6.02 4.60 1993 6.50 5.07 1994 7.20 8.30 1995 7.47 9.17 1996 7.14 10.35 1997 6.21 9.70 1998 5.56 8. 58 1999 7.93 1 3.45 2000 10.22 17.3 4 2001 12.78 24.2 2 2002 13.29 25. 7 8 2003 10.58 21. 29
Source: Annual Statistics Report, Tourism Malaysia as cited in Salleh et al. ( 2007 )
54
T ourists arrival and the tourism expenditure received from 1990 to 2003 are shown in Figure 3.10. There was a significant decrease in both the tourists arrival and the expenditure received during the 1997/98 El Niño event It is interesting to note that similar decrease in both the tourists arrival and the expenditure received also occurred during 2002/03, another El Niño event that was not as strong as the 1997/98 El Niño event.
Tourists Arrival and Tourism Receipts for Malaysia from 1990 - 2003
14
12
10
8

6
4

2
1990 1991 1992 1993 1994 1995 1996 1997 1998 1999 2000 2001 2002 2003
Year
Tourists Arrival Tourism Receipts (RM Billion)
25.00
20.00
15.00
10.00
Arrivals (Million) Tourism Receipts (RM Billion)
5.00
30.00 0
0.00
Figure 3.10 International tourists arrival and expenditure in Malaysia, 1990 2003, respectively Both significant decreases in tourists arrival and tourism receipts occurred during the 1997/98 and 2002/03 El Nino events
Source: http://corporate.tourism.gov.my/research.asp?page=facts_figures
Bank Negara Malaysia (1997, 1998) also reported that in 1997, “the performance of the tourism industry was affe cted particularly by the prolonged haze in the South East Asian region. The net surplus in the travel account declined by almost RM1 billion to RM3.8 billion, the first decline since 1991. The decline in tourist arrivals by 13% to 6.2 million more than off set the increase in average per capita expenditure of 8.2%. Average per capita expenditure rose during the year as per diem expenditure of tourists increased by 9.6%, while the length of stay of tourists per visit stood at 5.3 days (1996: 5.4 days). The nu mber of excursionist arrivals also declined by 8.1%. Consequently, the combined earnings from various categories of travellers, namely tourists (who stayed more th an one day), excursionists (day travellers) and transit passengers, declined by RM740 million to RM10.5 billion. ”
“In 1998, the regional economic downturn affected the performance of the tourism industry. The net surplus in the travel account fell to RM3.1 billion, representing an annual decline of 13.6%. Tourist arrivals fell for the third cons ecutive year, by a further 10.6% to 5.6 million, below the initial official target of 6.8 million visitors for the whole of 1998. Average per capita expenditure of tourists also declined, albeit at a marginal rate of 1%, due primarily to a 5% reduction i n per diem expenditure as the length of stay of tourists per visit
55
increased to 5.5 days (1997: 5.3 days). Similarly, the number of excursionist arrivals also dropped by 16.4%. As a result, the combined earnings from tourists (who stayed for more than o ne day), excursionists (day travellers) and transit passengers, fell by RM1.2 billion to RM9.3 billion”
One would expect international tourists to take advantage of the economic downturn that occurred at the same time in Malaysia during 1997 1998. However, this was clearly not the case as the prolonged haze had driven a significant number of international tourists away, while those tourists from the neighbouring countries were reluctant to travel not only because of haze, but also because of the eco nomic downturn in their own countries.
3.12 Education
During the 1997/98 El Ni ñ o event , severe haze episodes disrupted children’s education and school activities. Parts of Sarawak were under a state of emergency at the height of the crisis, forcing schools to close for periods of days to weeks ( Schweithelm and Glover , 1999) . It is noted that i n Singapore, a 24 hour response plan based on Pollutants Standard Index (PSI) was put in place by the Ministry of Edu cation (MOE) and Sports Council , under the Haze Action Plan, to close schools and sports complexes ( Hon, 1999)
Shahwahid and Othman ( 1999 ) reported that t he corporates such as The Star and Dupont Malaysia launched a campaign to create awareness among school children for the need to wear masks during the haze period. Under this campaign, 20,000 masks were distributed to selected schools in areas where the API was the highest on the peninsula (i.e., Gombak, Nilai, Penang, Kuala Lumpur, and Petaling Jaya ). A large number of masks 300,000 were donated by the Federal Government, 20,000 by the United Nations Children's Fund (UNICEF), and 10,000 by the Japan Int ernational Coopera tion Agency (JICA) , were also sent to Sarawak , reflecting the emergency situation in the state. However, the masks may not be effective enough for filtering submicron particles.
3.13 Social and economic costs of haze
From October 1997 to May 1998 , the Economy and Environment Program for Southeast Asia (EEPSEA) and the World Wide Fund for Nature (WWF) Indonesia conducted a quick assessment and valuation of the damages caused by the fires and haze in Indonesia, Malaysia and Singapore (Glover and Jessup, 1999). The assessment report was prepared while the fires of 1998 were still raging It assessed the damages during the first outbreak of fires in 1997. As o nly the damages for 1997, not 1998, were assessed, the total damages for the entire 1997 /98 El Niño related event were considerably higher than those reported. Furthermore, the study did not attempt to value every possible damage. For example, data were unavailable in some cases, while in others, there was no widespread agreement, even among economists, on estimation methods. This is particularly true for damages such as loss of life or biodiversity. As a result, a large portion of the cost associated with the fires and haze was omitted in the study, so the es timates presented were largely conservative “lower bounds” figures. In reality, the damages c ould be considerably higher. Even the editors of the study report admitted that the assessed damage of about US$ 4.5 billion was “conservative” (Glover and Jessup, 1999).
Despite the shortcomings, the damage estimates were significant. Th e assessment covered losses f rom fire, such as damage to timber, agriculture, a wide range of direct and indirect forest benefits, capturable biodiversity (for Indonesia only), fire fighting costs, and release of carbon dioxide that affect s climate change; and from haze, short term health costs, tourism losses and some losses in production. The estimates are provided in Table s 3. 7 3. 9 be side
56
Table 3. 7
Fire and Haze Related Damages from the 1997 Indonesian Forest Fires (US$ millions)
Type of Loss
1. Fire related damages
Loss to Indonesia Loss to Other Countries Total
Timber 493.7 493.7 Agriculture 470.4 470.4
Direct forest benefits 705.0 705.0
Indirect forest benefits 1,077.1 1,077.1
Capturable biodiversity 30.0 30.0
Fire fighting costs 11.7 13.4 25.1
Carbon release 272.1 272.1
Sub total 2,787.9 285.5 3,073.4
2. Haze related damages (summary)
Short term health 924.0 16.8 940.8 Tourism 70.4 185.8 256.2 Others 17.6 181.5 199.1
Sub total 1,012.0 384.1 1,396.1
Total damages 3,799.9 (85%) 669.6 (15%) 4,469.5
Note: Where Asian currency values were used, they were converted to U.S. dollars at the July 1997 exchange rates of US$1 = Rp2,500/RM2.5/S$1.4.
Fires and haze affected 5 million hectares in Indonesia and 70 million people throughout the region.
Agriculture losses: include those to plantations and smallholdings. They do not include possible haze damage via reduced photosynthesis, pollination, and so on.
Direct forest benefits: include non timber forest products such as food, local medicines, raw materials, and recreation.
Indirect forest benefits: include storm protection, water supply and regulation, erosion control, soil formation, nutrient cycling, and waste treatment.
Capturable biodiversity: refers to the potential income lost to Indonesia from international conservation expenditures, i.e., the amount that international agencies and N GOs have shown they are willing to pay to conserve tropical forests. It does not reflect the intrinsic value of species whose extinction has been hastened, the potential value of ecotourism or internationally marketed pharmaceuticals, the human cultural di versity of indigenous forest based cultures, or other benefits too difficult to value. These losses are shared by Indonesia and the rest of the world.
Carbon release: the release of carbon from fires will contribute to climate change, which will in turn r esult in economic damage. This figure reflects the amount of damage that the 1997 release is expected to cause.
Haze related damages not estimated here include long term health damages, reduced crop productivity, aesthetic value of reduced visibility, ave rtive expenditures, accidents, loss of life, evacuations, and loss of confidence by foreign investors.
Source: Schweithelm et al. (1999)
57
Table 3. 8 Haze r elated d amages a rising from the 1997 f orest f ires, in d etail (millions)
Indonesia Malaysia Singapore
Type of Damage Rp * US$ * RM * US$ * S$ * US$ * Total US$
Short term health damages 2,310,000 924 20.1 8.0 12.5 8.8 940.9
Industrial production losses U U 393.5 157.4 N N 157.4
Tourism losses 176,000 70.4 318.5 127.4 81.8 58.4 256.2 Airline and airport losses 44,000 17.6 0.5 0.2 9.7 6.9 24.7
Fishing decline U U 40.6 16.2 N N 16 2 Cloud seeding U U 2.1 0.8 N N 0.8 Total 2,530,000 1,012 794.3 310.0 104.0 74.1 1,396.1
Note: Damages exclude long term health damages, reduced crop productivity, aesthetic value of reduced visibility, avertive expenditures, accidents, loss of life, evacuations, and loss of confidence by foreign investors. Small discrepancies in totals reflect rounding off.
* In July 1997 the exchange rates were US$ = Rp2,500/RM2.5/S$1.4.
N = negligible or not applicable U = unknown: data unavailable
Source: Schweithelm et al. (1999)
Table 3. 9 Aggregate v alue of h aze d amage from Aug ust to Oct ober, 1997 , Malaysia
Type of Damage 1
RM Million US$ Million Percentage
Adjusted cost of illness 21.02 8.41 2.62
Productivity loss during the state of emergency 393.51 157.40 49.07
Decline in tourist arrivals 318.55 127.42 39.72 flight cancellations 0.45 0.18 0.06 Decline in fish landings 40.58 16.23 5.00 Cost of fire fighting 25.00 10.00 3.12 Cloud seeding 2.08 0.83 0.26 Expenditure on masks 0.71 0.28 0.09 Total damage cost 801.90 321.00 100.00
Source: Shahwahid and Othman (1999)
Shahwahid and Othman (1999) provided a comprehensive estimate of economic losses in Malaysia associated with the 1997 haze episode for three months during the months of August to October (Table 3. 9 ). They estimated that the total damage cost was RM 801.9 million (or US$ 321 million at 1997 exchange rate), mainly contributed by the loss in productivity during the state of emergency in Sarawak from 19 to 28 September, which accounted for 49.07%; followed by decline in tourists arrival, which accounted for 39.72%; and decline in fish landing, RM 40.58 million (US$ 16.23 million ) or 5.00%; cost of fire fighting, RM 25 million (US$ 10 million ) or 3.12%; adjusted cost of illness RM 21.02 million (US$ 8.41 million) or 2.62%; cloud seeding, RM 2.08 million (US$ 0.83 million ) or 0.26%; expenditure on masks, RM 0.71 million (US$ 0.28 million) or 0.09%; and cancellation of flights, RM 0.45 million (US$ 0.18 million) or 0.06%, respectively.
It was reported that t he cost of the haze could have been used to finance various social projects and poverty alleviation related programmes, as well as envi ronmental
58
conservation and biodiversity programmes which were planned by the government (e.g., Kuala Selangor Nature Park) ( Shahwahid and Othman, 1999).
Malaysia’s total cost of damage was about 3.3 times lower than that of Indonesia, but 4.2 times higher than that of Singapore (Table 3.7).
However, the above estimate was very conservative, as the damages excluded “long term health damages, reduced crop productivity, aesthetic value of reduced visibility, avertive expenditures, accidents, loss of life, evacuations, and loss of confidence by foreign investors”. In addition, the above estimation did not include economy wide costs (see Section 3.14). It also did not include the valuation of ecosystem services, including the cost of the long term e ffects on the fragile terrestrial ecosystems which are difficult to quantify; the cost of destroyed biodiversity, the cost of climate change as a result of the emission of greenhouse gases, and the cost of land degradation as a result of extensive damage t o land. The fire affected fragile ecosystems would take many years to recover (Hughes et al., 1999). The effects of haze on plant life were not assessed. Choong (1997) found that leaden sky reduced flowering and fruiting in plants. Crops affected included rice, fruit, and vegetables ( Shahwahid and Othman, 1999).
The monetary costs of the widespread and often serious impacts on health caused by the drought will be more difficult to quantify in part because many of their effects will be felt for years to come
With more data and new valuation methodologies, including the improved methodologies for the valuation of ecosystem services, it would be useful to reassess the above study undertaken by Shahwahid and Othman (1999) , not only for the period of August October 1997, but also extend ing the period of the study to March or April 1998 after the disappearance of the forest fires haze Better still, it would be very useful if the total cost due to drought over the whole period of the El Niño event (i.e., from February 1997 to April 1998) can be estimated (see Sections 3.14 and 3.15).
3.14 Economy wide costs
While the direct and indirect costs attributable to the 1997/98 El Niño related events (drought, forest fires, haze) may be largely estimated within limits of uncertainty, these two costs can, through a complex chain of influences, lead to a multitude of other costs throughout an economy. For example, rainfall deficit c ould lead to a decrease in agricultural and industrial productivity, which eventually could affect the export earnings and the number of employment. These c ould, in turn, lead to a series of "knock on" effects throughout the economy by affecting the cir culation of income and international trade flows. Grainger et al. (2013) discussed the economy wide costs as a result of land degradation. Similarly, it would be useful to estimate the economy wide costs of the 1997/98 El Niño event , and indeed, for any El Niño event s in the future.
3.15 GDP in 1997 1998
The GDP figures in Malaysia from 1990 to 2003 are provided in Ta ble 3. 10 and plotted in Figure 3.11.
The GDP showed a decline from 1997 to 1998 due to the regional financial crisis during these two years. However, the loss of productivity in key economic sectors as a result of the impacts of the 1997/98 El Niño event was likely a contributing factor.
59
Table 3. 10 GDP in Malaysia for 12 years (1990 2003)
1990 1991 1992 1993 1994 1995 1996
GDP (RM/billion) 119.081 135.124 150.682 172.194 195.461 222.473 253.732
GDP (% change) 11.63 11.87 10.33 12.49 11.9 12.14 12.32
1997 1998 1999 2000 2001 2002 2003
GDP (RM/billion) 281.795 283.243 300.764 356.401 352.579 383.213 418.769
GDP (% change) 9.96 0.51 5.83 15.61 1.08 7.99 8.49


Source: Department of Statistics, Official Portal, https://www.statistics.gov.my/index.php?r=column/ctimeseries&menu_id=NHJlaGc2Rlg4ZXlGTjh1SU1kaWY5UT09
Malaysia GDP (RM/Billion) and GDP Change (%) by Year
450
400
350
300
250
200
150
100
50
16%
14%
12%
10%
8%
6%
GDP (RM/Billion) GDP Change (%)
4%
2%
0%
-2%
18% 0
1990 1991 1992 1993 1994 1995 1996 1997 1998 1999 2000 2001 2002 2003
Year
Source: Department of Statistics Mal aysia, Official Portal, https://www.statistics.gov.my/index.php?r=column/ctimeseries&menu_id=NHJlaGc2Rlg4ZXlGTjh1SU1kaWY5UT09
Figure 3.11 GDP and percentage change in GDP compared to previous year in Malaysia for 1990 to 2003
The percentage change in GDP compared to the previous year is also calc ulated and provided in Table 3. 10 and plotted in Figure 3.11. It is clear that there was a significant percentage change from 1997 to 1998.
Indeed, Bank Negara Malaysia (1997) reported that GDP remained strong at 8.5% during the first half of 1997, but moderated to 7.1% during the second half of 1997. In 1998, the full effect of the regional financial crisis on the Malaysian economy was felt, and the real GDP declined by 6.7% (Bank Negara Malaysia, 1998). In particular, the GDP had a 4.0 % for agriculture, forestry and fishery, a 10.2% for manufacturing and a 24 .5 % for construction in 1998. In 1999, economic activity in Malaysia rebounded from a contraction of 7.5% in 1998 to record a strong positive growth of 5.4%. The value of GDP has returned to almost the same level as in 1997 (Bank Negara Malaysia, 1999).
60
Chapter 4: Coping with El Niño: Lessons learned from the 1997/98 El Niño event
4.1 Drought and drought risk reduction
Drought 15 is an extreme climatic event, often described as a “natural” hazard, though it is now increasingly clear that human activities could exacerbate this hazard. For example, human induced climate change could cause the shift in seasonal and latitudinal precip itation patterns, as well as an increase in extreme weather events ( though there may have regional variations ), both of which could have significant implications for drought. The regional precipitation patterns can also be influenced by the distribution of air pollutants (aerosols), as evidenced by the “ atmospheric brown cloud ” (Ramanathan et al. , 2005).
Outline for MEI webpage (updated on May 6 th , 2016)
Figure 4.1 Multivariate ENSO index since 1950. The “ El Niño ” warm phase (red spike areas) and the “La Niña ” cold phase (blue spike areas) of the ENSO phenomenon are indicated (Source: NOAA Climate Diagnostics Center 16
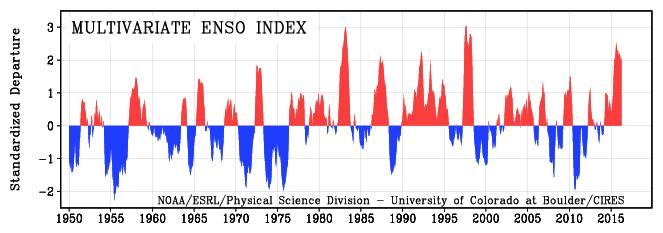
There is evidence to suggest that t he frequency, persistence and magnitude of El Niño events seem to have increased in the last 40 years, as indicated by the multivariate ENSO Index, an index of six observed variables (i.e., pressure, air and sea surface temperatures, zonal and meridional w inds, cloudiness) over the tropical Pacific, which is used to monitor the coupled ocean atmosphere phenomenon known as the ENSO (Figure 4.1). This trend is projected to continue.
El Niño induces drought in western Pacific, including the South East Asian region, as well as many other parts of the world (see Chapter 2) Indeed, Cook et al. (2010) , based on tree ring samples, provides evidence of at least four epic droughts that have shaken Asia over the last thousand years, including one that may have helped bring down China's Ming Dynasty in 1644 because of peasants’ rebellion s They also observed a mega drought in the wider region around Angkor from the 1340s to the 1360s, followed by a more severe but
15 Drought is generally defined as “a deficiency of precipitation over an extended period of time, usually a season or more, which results in a water shortage”. However, droughts may be classified as (a) Meteorological drought, which is usually “defined by a precipitation deficiency over a pre determined period of time” (e.g., 50% of normal precipitation over a six month period; (b) Agricultural drought, which is “defined more commonly by the lack of availability of soil water to support crop and forage growth”; (c) Hydrological drought, which is “normally defined by deficiencies in surface and subsurface water supplies relative to average conditions” at various time through the seasons; and (d) Socio economic drought “reflects the relationship between the supply and demand for some commodity or economic good (such as water, livestock forage, or hydroelectric power) that is dependent on precipitation. See UNISDR (2009). 16 http://www.cdc.noaa.gov/people/klaus.wolter/MEI/
61
shorter drought from the 1400s to 1420s. It would be interesting to trace if these droughts were linked to the historical El Niño events 17 .
Apart from El Niño, monsoon failure could also have implications for drought in the South East Asian region. Some studies suggest that El Niño often coincides with a weak monsoon and drought (C ook et al. 2010 ; Ummenhofer et al., 2013 )
However, drought by itself does not trigger an emergency that requires immediate relief . Whether it becomes an emergency depends on its impact on local people and the environment , which, in turn, depends on their vulnerability and resilience to such a ‘shock’ (Wilhite, 2000; UNISDR, 2003).
62
17
http://www.sciencedaily.com/releases/2010/04/100422153929.htm
Hazard (Drought)
Risk Vulnerability
(A function of physical, social, economic, environmental, and even policy and political factors)


• Exposure;
• Lack of financial & natural resources;
• Lack of scientific, technical, technological & institutional capacity (adaptive capacity);
• Lack of adaptation technologies (EWS; water conservation technologies);
• Unsustainable land use practices;
• Environmental degradation;
• Unsustainable development policies & practices;
• Population growth;
• Lack of public awareness;
• Culture; religion
• Poverty
Figure 4.2 Relation between hazard (drought), vulnerability and risk. This figure is based on the conceptual framework s as presented in Figure 1.4 and Figure 1.6 in Birkmann (2006) but with modifications
As shown in Figure 4.2, vulnerability is a function of many parameters , including physical, social, economic, environmental and even policy and political factors To reduce drought risk, it is important to identify and minimi se the factors that contribute to the reduction of the vulnerability of a country to drought. T hese factors could be related to the duration of exposure, as well as environmental (including natural ecosystems that provide the environmental services), social, economic, technical, technological and political (including policy). For example, a country with an intact natural ecosystem is l ikely to be more resilient to drought risks. Similarly, a country with effective policies and more financial and technological resources (e.g., an effective early warning system) for mitigation and adaptation (includ ing drought preparedness), is more able or more resilient , and hence less vulnerable , to the adverse effects of drought. Strengthening of coping or adaptive capacity is crucial in ensuring a drought resilient society or a society with reduced risk to the a dverse effects of drought. Poverty could be an important factor that makes poor people more vulnerable to drought because they have fewer resources for coping in adapting to drought Similar concept has been discussed by Low (2010) in terms of vulnerability of a society to climate change , in which drought will be a common feature in the future
4.2 Lessons learned
Although no two El Niño events are exactly the same or even closely similar in their global , regional or national characteristics or effects ( H ughes et al. , 1998) , a number of lessons can still be learned from the impacts of the 1997/98 El Niño event in Malaysia. This will prepare us to better cope with future El Niño events, as well as any drought events induced by climate change which is less predictable. The lessons include scientific, technical and technological aspects, including valuation of environmental, social and e conomic impacts, as well as national policies that are conducive to reducing the vulnerability of both natural and human environments to future El Niño events. P ublic awareness also plays an important role in contributing to drought preparedness and mitiga tion , as well as adaptation The following sections will discuss these aspects.
63
4.3 The need for scientific, social and economic research
Contrary to the prediction in early 2014, including those by the leading scientific institutions in the world, such as NOAA, IRI and the UK Meteorological Office, the widely expected strong El Niño event had not been developed by the end of the year (see Chapters 1 and 2). This demonstrates that there is still large uncertainty in the long range prediction of El Niño. With monthly updates of the state and forecast of the evolution of the El Niño, the operational outlooks which have been practi s ed in recent years are useful for risk management planning for periods within or less than a season. Additionally , the impacts of El Niño can be expected to prevail and are likely to worsen based on past El Niño events.
It seems that many developing countries, including Malaysia, are closely following the forecasting of El Niño provided by leading scientific institutions in the world This is understandable given the strong scientific and technical capabilities of these advanced institutions. However, it is also essential for the developing countries, including Malaysia, to develop national scientific and research capabilities, so that the forecasting of El Niño is more relevant and specific to national and local environment for better mitigation and adaptation measures.
While there were some estimates about the social and economic impacts of the 1997 98 El Niño event in certain sectors, we still do not have the whole picture , as seen in Chapter 3 So far the scientific research on the impacts of El Niño on agricultural crops, and on the terrestrial and marine ecosystems has been limited in Malaysia, including the spatial distribution of these impacts, and how these impacts could affect the phonological changes of plants and animal species in the longer term timescale In view of the changing climate, there is an urgent need to strengthen this scientific research.
Thus, it is essential to map the variations in vulnerabilities and impacts (environmental, social and economic) across various sectors and geographical loca tions in the country. Based on past El Niño events, which may be classified as weak, moderate and strong events, these variations could be analysed and studied and taken into consideration in addressing the potential impacts of future El Niño events (UNU, 2000)
In order to provide policy makers for better decision making, much research is also needed to assess the environmental, social and economic costs of prolonged drought induced by the past El Niño events, including the cost of actions versus non actions.
How could climate change affect the onset, magnitude, intensity and frequency of El Niño? Further research on these aspects is needed to assess the links between climate change and El Niño.
64
4.4 Prevention and mitigation
Prevention of forest fires and associated haze is always a better solution than mitigation, as it is less costly. In terms of forest fire prevention and mitigation, science and technology covers various aspects, therefore there is a need for an appropriate balance of focus, depending on perceived needs. While most of the skills needed at the field level are to be developed locally, certain sophisticated technology can be acquired through technology transfer. The use of geosynchronous satellites and space borne sensors for early warning of fires and atmospheric pollution; investigation of candidate systems for weather conducive to forest fires, and fire danger forecasting; assessing influence of inter annual climate variability; and interpretation of fire scar charact eristics are some of the areas where there is need to build national capability.
4.4.1 Technical , technological and infrastructural constraints
During the 1997/98 El Niño event , several factors have aggravated the causes of fires. ADB (2001) has highlighted a number o f these causes , which are related to technical, technological and infrastructural constraints These includ e lack of appropriate technology; inadequate knowledge and appreciation about technological possibilities as well as limitations; insufficient tools and equipment; inadequately trained personnel; lack of research support; inadequacies in forest fire management exemplified by lapses in monitoring , fire danger warning , fire protection measures; pre suppre ssion plan ning and preparedness , and fire fighting; and reluctance to adopt zero burning techniques of land preparation and low impact logging ; as well as “l ack of infrastructure such as access roads, fire corridors, fuelbreaks, observation towers, water reservoir s, communication and mapping facilities, satellite stations, etc. ”. All of the above factors affect the efficiency of fire management.
4.4.2 Drought m onitoring
Historically, t he drought monitoring programme in Malaysia was initiated by the DID in 2001 as a result of the 1997/ 98 drought event. Among its first initiative was the establishment of the website http://infokemarau.water.gov.my to wholly focus on drought monitoring and to act as repository for information. The objective is to assist relevant agencies to make early preparation for the drought events. In 2013, the website was further improved to include additional features to better r eflect the drought situation in Malaysia. DID Malaysia is given the responsibility to repor t on river water and reservoir water level. In this web site, it is reported that 21 water level stations have been set up to monitor reservoirs level and another 23 stations for rivers.
DID uses the Standard Precipitation Index (SPI) and water level in rivers and dams as a tool to monitor hydrological drought. Hydrological drought , as defined in Footnote 1, is the deficiencies in surface and subsurface water supplies relative to average conditions” . A hydrological drought situation would occur when any river discharge reduces or any dam level decreases continuously. This situation can be defined by the changes stated below:
(a) River Discharges low flow excee d 5 years Average Recurrence Interval (ARI) continuously for 3 months, a drought event is considered as occurring. On a daily basis, DID Malaysia reports the 7 day low flow for ARI of 2, 5 and 20 year for 23 stations throughout Peninsular Malaysia and upl oad the information via its website known as InfoKemarau.
(b) Dam Levels / Storage Dam Drought event would be considered when a dam levels falls below the normal level for 3 months continuously. DID Malaysia reports the water level in 23 dams and include useful information such as maximum water level, percentage of balance of storage, danger and critical level. This information may also be derived from the InfoKemarau. The website proved to be useful reference during the last drought episode. Information on the water level of some of the dams operated by other operators is also
65
reported online. For comprehensive monitoring of the nation’s water supply, an integrated dam level information hub is necessary.
In recent years , a more coordinated mechanism for monitoring of drought has evolved where three main agencies namely t he MMD , t he DID and t he Department of Minerals and Geoscience Malaysia (JMG) are entrusted with the task of monitoring drought The MMD uses the SPI and rainfall anomalies to reflect the drought severity in Malaysia. It will issue drought early warning if there is possibility of drought based on weather and climate forecasting tools including numerical modelling and related index which indicate early signs of drought due to certain phenomena such as El Niño.
However, i t may be noted that predictive models sometimes could prove unreliable, so other efforts must be made to monitor the onset and the development of drought. Apart from observations of rainfall and water supply (including water levels of dams and lake s ), monitoring of soil moisture, food supply and food prices, especially in rural areas, could provide an early warning of approaching drought problems (Hughes et al., 1998).
4.4.3 Drought early warning system
Drought early warning in Malaysia is issued based on the criteria as provided in Table 4.1.
Table 4.1 Drought e arly w arning c riteria
MONITORING STATUS LEVEL
LEVEL 1: ALERT
LEVEL 2 : WARNING
LEVEL 3 : EMERGENCY
LEVEL 4 : TERMINATION
Deficit for total rainfall for at least 3 consecutive months above 35% from normal and the latest SPI index is less than 1.5, OR the deficit for 6 consecutive months above 35% and latest SPI index is less than 1.5.
Deficit for total rainfall for at least 3 and 6 consecutive months above 35% from normal and the latest 3 months SPI index is less than 1.5, and drought ALERT level has been declared.
Deficit for total rainfall for at least 3 and 6 consecutive months above 35% from normal and the latest 3 months SPI index is less than 2.5, and drought W ARNING level has been declared.
SPI index become positive and/or total rainfall for the current month above normal.
For effective drought risk management, a comprehensive and robust early warning system encompassing meteorological, hydrological and agricultural droughts must be established at national and local levels, with the support of communities. A comprehensive integration with common national standards of the meteorological and hydrological networks of DID and M M D need s to be undertaken to enable optimal use of resources. Maintenance issues must be addressed adequately to ensure timely availability and reliability of the observations.
The main constraints on the implementation of early warning information system are :
• Lack of a national drought policy framework ;
66
• Limited coordination institutions that provide different types of drought early warning, risk management and risk reduction that results from a national policy ;
• Inadequate social impact indicators to form part of a comprehensive early warning system and inform policy response (e.g., the social impacts of food shortages and higher food prices on poor people in both the rural and urban areas).
United Nations Economic and Social Commission for Asia and the Pacific ( UNESCAP ) (2015a) has provided some guidance on early warning and monitoring strategies to its member states, which includes Malaysia:
• S trengthening seasonal forecasts for drought;
• S trengthening knowledge networks for transferring information and alerts from g overnment agencies to farmers;
• I mproved education of community and farmers; and
• D eveloping El Niño contingency plans by governments.
In addition, UNESCAP’s Regional Drought Mechanism, launched in 2013, has provided an important platform for sharing free satellite based data and products on drought monitoring and early warning system among drought prone Asia Pacific countries in a timely manner (UNESCAP, 2014). This platform, which complements WMO’s Global Framework for Climate Services, provides more detailed and locali sed forecast and monitoring that can be updated during the growing season of crops (UNESCAP, 2015b).
4.4.4 Forest fires and haze monitoring
Monitoring of forest fires and haze, which calls for reasonably sophisticated technological know how , is essential in order to mitigate their impacts. Monitoring techniques vary considerably among South East Asian countries. Malaysia’s monitoring experience in the 1997 / 98 event was w idely aerial surveillanc e for f i re detection and monitoring. Hot spot information was received from the National Meteorological Services , among others
The Department of Environment (DOE) operates an Air Pollution Monitoring System through Alam Sekitar Malaysia Sdn Bhd, where hourly reading of API for 52 monitoring sites throughout the country are published in the DOE ’s website. The monitoring system classifies an API reading of 0 50 as good , 51 100 as moderate, 101 200 as unhealthy, 201 300 as very unhealthy and values above 300 as hazardous (see Table 3. 4 in Section 3.9). Forest fires are monitored and put under control by the respective state department of forest and the Fire and Rescue Services Department with the help of the Police. Not all districts have an air pollution monitoring system hence during haze emergency episodes decisions on actions in those districts without API readings have to be dependent on interpolated values which may not serve the purpose for early warning
For transboundary haze, the MMD operates the HYSPLIT mode for prediction of the movement of the haze particles. The informat ion on the places where hot spots are occurring in the region uses the NOAA satellite and haze map information provided by the ASEAN Specialised Meteorological Centre in Singapore as agreed by the ASEAN member countries. This information is further corroborated by satellite information from MMD and Malaysia Remote Sensing Agency.
After the 1997/98 El Niño event, ASEAN initiated a RHAP that established a monitoring and warning system for forest/vegetation fires, namely the SEA FDRS , adopted
67
from the Canadian Forest Fire Danger Rating System (http://haze.asean.org/fire danger rating sy stem fdrs for southeast asia 2/). The daily responsibility of producing the SEA FDR was handed over to the MMD by CFS in mid September 2003. Since then, the MMD has been producing SEA FDR products on a daily basis to be used for predict ing fire behaviour and for guid ing policy makers in developing actions to protect life, property and the environment.
The meteorological variables used ( temperature , r elative humidity, rainfall and wind speed ) are those measured at the meteorological stations throughout the region that are made available on the Gl obal Telecommunication System (GTS). Spatial Analysis is carried out using the ArcView software 4.4.5 Communication strategy
A comprehensive communication strategy, targeted at various vulnerable communities and groups, is needed to timely communicate early warning to all environmental, social and economic sectors, so as to reduce the impacts of El Niño and its prolonged drought , or the recurrent drought due to human induced climate change.
The 11MP (Focus Area D, Strategy D1 “Strengthening Disaster Risk Management”) provides for improvement in disaster detection and early warning capacity by upgrading detection technology and forecasting systems. Mapping of disaster prone and high risk areas is regarded as essential and it will enhance disaster detection efforts. Capabilities of all parties involved in disaster preparedness, response and recovery, including capacity to conduct forecasting analysis , will be strengthened to improve response tim e and effectiveness of disaster risk management. The f ollowing discussion will highlight the need to better integrate drought issues into policies and strategies. This must be construed to include wildfires induced by prolonged drought.
4.5 Drought coping mechanism
4.5.1 Existing policy and measures
There is no existing policy specific for drought. In Malaysia, the management of disasters is guided by the National Security Council (NSC) Directive No. 20: The Policy and Mechanism for National Disast er Management and Relief. This Directive covers all disasters, including drought, which is regarded as a “natural disaster”, even though drought can also be human induced because of human induced climate change.
4.5.2 Improve drought coordination mechanism
T he National Security Council (NSC) Directive No. 20: The Policy and Mechanism for National Disaster Management and Relief is an executive directive of the Prime Minister enforced since 11 May 1997 and updated on 30 March 2012.
68
Figure 4.3 The policy and mechanism for national disaster management and relief
As illustrated in Figure 4.3, t he Directive prescribes three levels of disaster management mechanism ( F ederal, S tate and D istrict) depending on the severity of the disaster. This is achieved through the establishment of the Disaster and Relief Management Committee at the three respective levels, with the NSC at the respective level acting as the secretariat to the committee. At the Federal level, the Committee is chaired by a Ministe r appointed by the Hon. Prime Minister ; and at the S tate level it is chaired by the State Secretary. At the D istrict level, the District Officer chairs the district level committee. The scope of work and responsibilities of the NSC and the three level committees are prescribed in the directive. For the committee at the F ederal level, capacity building, public awareness and recommendation of financial requirements for prevention, preparedness, response and recovery are also among the scope of work listed for the committee. For the committee at the state and district levels, mainstreaming measures in disaster risk reduction effectively through the government agencies at the state and district levels has been listed in the committees’ scopes of work The responsibility of the Chairman of the State Disaster Management Committee to the Chairman of the Working Committee on State Security includes provi sion of advice on measures on disaster risk reduction , including disaster prevention.
For the management of drought disasters, the directive is supported by the Drought Disaster Standard Operating Procedure (DDSOP) which was formulated by all the relevant agencies and overseen by the NSC of the Prime Minister’s Department. The DDSOP was formulated following several drought events that had occurred in Malaysia, particularly the ones in 1992 and 1998 , and it was first circulated in December 2011. The DDSOP provides guidelines on matters related to classification of droughts, the responsible agencies for monitoring drought, severity of drought, line of communication and roles and
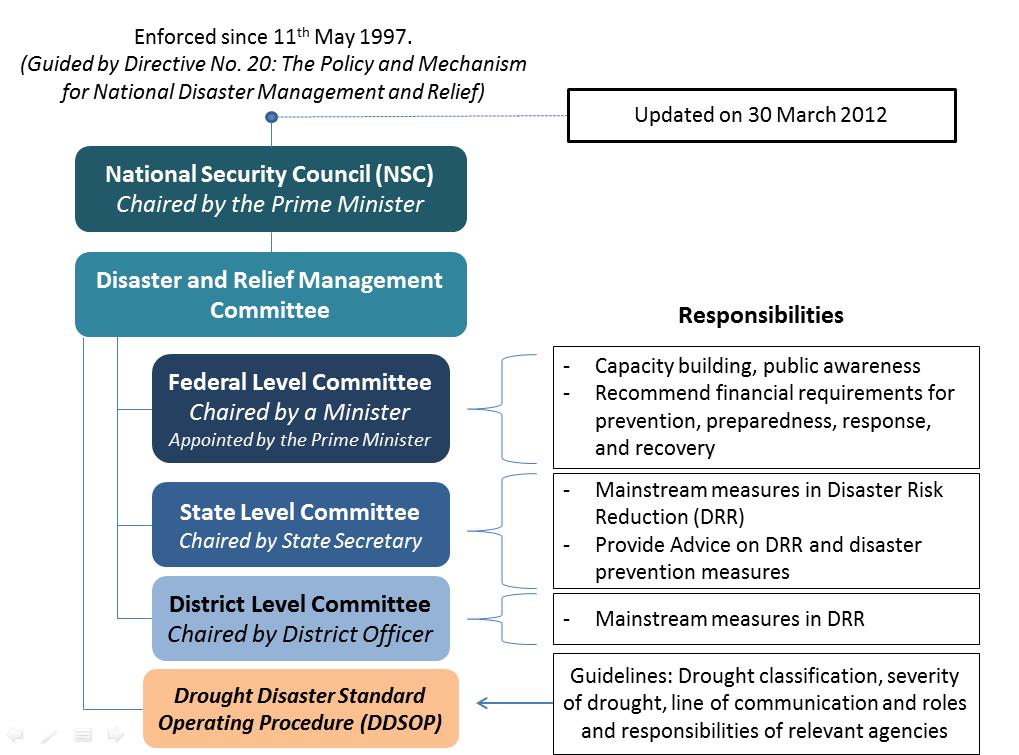
69
responsibilities of relevant agencies should the drought event be classified to have reached dangerous level.
Regarding El Niño , currently MMD monitors its occurrence and development, informs relevant government departments, and provides regular update s.
Inter agency coordination and collaboration in preventing and mitigating drought, including monitoring, has always been a challenge especially where some r esponsibilities are overlapped.
4.5.3 National Drought Committee
When drought occurs, haze is often a major issue. A National Haze Committee chaired by the NRE was established in 1996 with the participation of National Security Council, Forestry Department (Peninsular Malaysia), Malaysian Meteorological Department, Department of Agriculture, Ministry of Health, Ministry of Education, and Fire and Rescue Department, to decide on the acti ons to be undertaken to reduce the adverse effect s of haze when it happens during the drought period.
The Task Force of this report propose s to establish a National Drought Committee in parallel to the National Haze and Hot Weather Main Committee, with the participation of the same ministries and departments, as shown in Figure 4.4. Perhaps the Ministry of Industry may be included. The National Drought Committee is to coordinate all activities relating to drought risk reduction, from monitoring, earl y warning to drought prevention, preparedness, recovery and assessment of environmental, social and economic impacts. Its role and activities are to complement the National Haze and Hot Weather Main Committee It is important to bring out the synergies between the proposed National Drought Committee and the current National Haze and Hot Weather Main Committee
Figure 4.4 Proposed establishment of a National Drought Committee
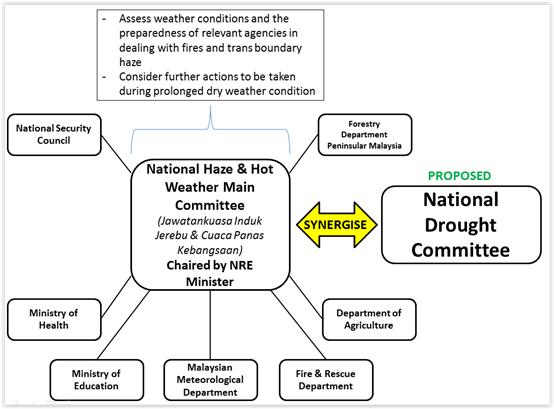
70
4.5. 4 Public participation
So often the general public and communities are left out in the national coordination mechanism for combating drought, forest fires and haze. An effective national coordination mechanism must include the active participation of the local communities, which are most vulnerable to the impacts of El Niño. A strategy to mobili se the participation of local communities should be developed at the district level. This strategy may be developed as an integral part of climate change adaptation strategies.
4.6 Mitigating the adverse effects of drought
4.6.1 Technical and technological measures
There are technical and technological measures for drought risk reduction and for mitigating the adverse effects of drought (Ahmad and Low, 2003 ; UNISDR, 2003, 200 7 ), including the following:
(A) Adaptation to increase resilience
This is definitely a critical part of the solution to the El Niño events in order to minimise the impact s of increasingly frequent and severe extreme weather events. Over time in Malaysia, innovative and adaptive ways to cope with prolonged dry periods have taken the form of dams, huge lake reservoirs and systematic irrigations. How will new technology and innovation play a role in mitigating and adapting to more inten se drought as a recurring hazard in a changing climate ?
(B) Integrated D rought M anagement (IDM)
This approach cuts across sectors, disciplines, and institutional jurisdictions WMO and the Global Water Partnership have launched the Integrated Drought Management Programme in 2015. Under this initiative, WMO set up a HelpDesk on Drought Management and launched various projects at the regional level through the ne twork of the Global Water Partnership. (See: http://public.wmo.int/en/media/news/wmo highlights integrated drought man
(C) In tegrated Water Resources Management (IWRM)
This is another option to reduce the occurrences of water shortage especially during drought. It aims to integrate management of water resources at the basin or watershed scale, integrating both supply side and demand side approaches and infrastructure sys tem improvements to overcome the problems of water shortages during the period of drought. T he technology identified as having great potential impact on the water sector relates to efficient water use and distribution, to water pollution, and to the selection of drought , pest and salt resistant crops that are expected to reduce water usage and, subsequently, enhance water availability. This will include water reuse and water recycling technology and the use of renewable energy in the water sector. Some examples of IWRM in the agricultural sector have been discussed by T awang et al. (2002) and Tawang and Tengku Ahmad (2003) as provided in Section 3.3 4.
There is a need to assess existing water resources (including groundwater and its quality) and the consumption patterns in Malaysia , and estimate the future availability and consumption trends in the next 10, 20, 30 and 50 years based on the climate change scenarios. In addition, i t is important to develop an IWRM plan for the region, including drought adaptation and coping mechanisms.
IWRM and IDM are complement ary to each other
71
There are a number of potential areas for cooperation across government agencies, statutory bodies, private sector and communities, as highlighted by Low (2014):
(i) Manage water resources in an integrated manner;
(ii) Minimise wastage by effectively managing demand ;
(iii) Reduce contamination by minimising preventable water pollution ;
(iv) Diversify sources of water ;
(v) Invest in Research & Development (R&D) in developing technologies that can reduce the cost of supplying water.
New technology and research play an important role in strengthening good practices to alleviate drought impacts to improve reliability and affordability.
(D) Cloud seeding
The main effort in times of drought is to create rain on water catchment areas. The MMD undertakes cloud seeding activities and make decisions on the suitability of the operation, taking into consideration the presence of suitable rain clouds, high humidity, and unstable weather conditions. However , the scientific understanding, technology and success rates of cloud seeding are low. Enhanced scientific knowledge in weather modifications and better technology are needed to enable the MMD to coordinate more effective cloud seeding operations with other agencies , such as the National Security Coun cil, Royal Malaysian Air Force, DOE and State Water Board.
(E) Pahang Selangor Raw Water Transfer Project
Another mitigation measure put in place by the Government is the interstate raw water transfer project, a technological solution to transfer raw water from the Semantan River in Pahang to the Hulu Langat W ater T reatment P lant (WTP) in Selangor and to be di stributed to meet the water demands in S elangor and Federal Territory (Kuala Lumpur and Putrajaya). The project, which is under the auspices of KeTTHA , involves construction of three 44.6 km long tunnels , the longest tunnel in South East Asia T he project , expected to complete by 2019, will have the capacity to channel 1.89 billion litres of water a day from Pahang to Selangor . The WTP will have a capacity of 1,200 million litres per day 18 .
However, t he sustainability of water resources from Semantan River remains a great challenge in the future.
(F) Water conservation
Just like energy conservation is an important measure to save energy, water conservation is also an important measure to reduce the consumption of water, especially during the drought period With daily water consumption of about 230 litres per person per day, Malaysia’s average water consumption is much higher than that of Singapore at 150 litres per person per day and of Thailand at 180 litres per person per day (Air Selangor, 2015) Raising pub lic awareness on water conservation and minimising the loss of non revenue water should be an integral part of sustainable water resources management.
http://www.water technology.net/projects/pahang selangor raw water transfer tunnel project/
72
18
(G) Rain water harvesting
In the Pacific small island states, such as Tuvalu where fresh water resources are limited, rain water harvesting is a common practice for every household. However, rain water harvesting is not widely practised in Malaysia, especially at the household level Th e G overnment has introduced a set of guidelines in 1999 to encourage rainwater harvesting , so that the rainwater collected can be used for domestic purpose s (Raj, 2007)
The potential for rainwater harvesting during rainy season is enorm ous. It is important to raise public awareness on the significance of rain water harvesting , which only involves simple technology. The literature on rain water harvesting is abundant.
The investment for a simple household rain water harvesting system is modest. T he cost s cover water storage tanks , the gutters and pipes that direct rainwater from the roof catchment to the storage tank s , and the cost of installation Rain water harvesting may also be designed for larger i ndustrial and c ommercial buildings.
It would be useful to undertake an a ssessment of ways and means to enhance rain water harvesting in drought prone areas, including the feasibility for establishment of groundwater recharge systems.
4.6.2 Policy measures
An effective policy will ensure an effective strategy, which, in turn, will ensure an effective strategic plan to address all scientific, technical , technological , as well as social and economic issues related to drought.
Policy measures could include both legal (e.g., laws and legislations ) and economic instruments (e.g., tax; water charge ; subsidy ; fines; incentives or disincentives) for water consumption and water conservation.
Other policy measure s could include p lanning and zoning, which are also for drought risk reduction , especially in drought prone areas . Raj (2007) highlighted the importance of b asin wide planning f or water resource augmentation , which has implications for both flood and drought risks reduction. B asin wide planning requires extensive knowledge of water users and their consumption patterns; water diversions and storage ; and management practices in all parts of the basin, as well as the past , present, and projected future meteorological and hydrological conditions ( Raj , 2007)
Raj (2007) also highlighted the importance of i nter agency collaboration , in view of the fact that reservoirs for irrigation, water supply and flood mitigation have conflicting operational rules.
It may be necessary to amend existing environmental legislations and water laws to enable effective drought risk reduction to be implemented throughout Malaysia. In particular, Raj (2007) pointed out that u nder the Federal Constitution , the State Governments have jurisdiction on matters pertaining to water, rivers, land, and forest , a nd hence they are responsible for managing any disasters and risks related to these sectors Thus, it may be necessary to amend the Federal Constitution, so that the various state jurisdictions can be implemented in a more coordinated and consistent manner, even though politically it may not be easy to achieve due to competing state interests Within this context, inter state collaboration is also important in terms of strengthening drought risk reduction throughout Malaysia.
73
4.7 Public Awareness
Article 6 of the United Nations Framework Convention on Climate Change (UNFCCC) emphasi ses the importance of education and public awareness in addressing climate change, of which drought will be a permanent feature. Indeed, enhancement of public awareness on drought risk reduction may be undertaken as an integral part of any climate change awareness programmes, though the focus should be specific to drought.
Public awareness programme s on drought risk reduction may be undertaken via mass media (e.g., newspapers, radio, TV, brochures ; relevant government websites , etc.). They could cover the scientific, technical and technological, as well as social and economic issues related to El Niño and drought risk reduction in various social and economic sectors. In particular, good local and community practices, including indigenous knowledge, that reduce the vulnerability of populations in drought prone areas , should be widely disseminated.
The civil societies and non governmental organi s ations, which are working closely with local communities, can play an important role in raising the awareness of the local communities on El Niño and drought risk reduction.
Relevant websites of the Government are useful information sources for enhancing public awareness. For example, MMD 19 provides forecasting on the development of El Niño within certain limit of uncertainty DOE has set up the website http://apims.doe.gov.my/v2/advice.html to disseminate haze related information, for queries and to warn the public against certain a ctivities, such as under certain meteorological conditions, open burning is prohibited as it may worsen the haze situation.
The 11MP provides for comprehensive communication and awareness programmes to coordinate and integrate public awareness messages communicated by different public sector agencies and on different themes, including climate change and disaster risk management. In addition, t here are synergies between the three Rio Conventions , namely UNFCCC , Convention on Biological Diversity (CBD) , and the U nited N ations Convention to Combat Desertification (UNCCD) , on addressing drought These synergies should be encouraged in the public awareness programmes developed under the implementation of these three Conventions by the Government
4.8 Capacity development
Malaysia’s adaptive capacity to deal with El Niño, especially in the agricultural sector, has been weak ( Abul Quasem Al Amin and Gazi Mahabubul Alam , 2016). It is clear that much human and institutional capacity development is needed across all socio economic sectors, not only at the scientific, technical and technological levels, but also at the policy levels (i.e., among policy and decision makers).
The scientific and technical capacity of the local community, especially rural communities, may also be enhanced through a properly designed training and public awareness programme s
Capacity development for drought risk reduction can be coordinated, implemented and monitored under a holistic and integrated coordination mechanism, such as the proposed National Drought Committee (see Section 4.5.2)
Sub regional collaboration within the framework of ASEAN could facilitate capacity development on drought risk reduction among ASEAN members. To this end, a South East Asia Network for Drought Risk Reduction (SEANDRR) may be established under the auspices of the ASEAN Secretariat to facilitate sub regional collaboration for drought risk reduction,
74
19 http://www.met.gov.my/
especially capacity development activities, so as to build resilience for drought risk reduction within the ASEAN members (see Section 4.13).
In addition, international and regional cooperation, including UNESCAP’s Regional Drought Mechan ism, and South South Cooperation , can also play an important role in capacity development activities. These include collaboration in scientific, technical and technological research, Visiting Fellowships programme, and scientists exchange programme, join t publications, among others.
Under the UNFCCC , there are capacity building activities on adaptation to drought. Similarly, under the UNCCD , there are also capacity building on mitigating the adverse effects of drought. Malaysia, as a Party to the above conventions, may make use of the opportunities for capacity building activities offered by these two conventions.
4.9 Economics of drought
It is clear that the 1997/98 El Niño induced drought has caused negative impacts on various socio economic sectors in Malaysia. However, d rought, as well as forest / peatland fires and associated haze, also occur red during non El Niño years. Thus, Malaysia must develop a comprehensive and an integrated framework (see Section 4.10) and strategy guided by effective policy (see Section 4.11) so as to better cope with drought, forest/peatland fires and associated haze.
In order to provide decision makers with an important tool for making decision, it is imperative for the scientific community (including social scientists and economists) in Malaysia to undertake a comprehensive assessment on the economics of drought. This assessment would include direct and indirect costs, economy wide costs, the valuation of biodiversity and ecosystem services, and the cost of contribution to climate change. In particular, the cost of prevention versus mitigation, and the cost of action versus inaction.
In view of the interactions of drought with climate change, biodiversity and land degradation, t he economics of drought can be an integral part of the economics of climate change, biodiversity and land degradation, which, in turn, are integral parts of the economics of sustainable development. There are synergies between climate change, biodiversity and land degradation.
Much research is needed in the above mentioned areas.
4.10 A framework for drought risk reduction
In many developing countries, drought management practices are largely based on crisis management, implying that practices are reactive rather than proactive, and therefore, they do not address the underlying causes for vulnerabilities and hence the risks associated with drought.
Globally, disaster risk governance mechanisms have been considered effective in regulating disaster risk at international and national levels over the last two decades. For instance, the Hyogo Framework for Action (HFA) for Disaster Risk Reduction (DRR) 20 05 2015, which embraces the vision of building countries’ and communities’ resilience to disasters, has encouraged countries in the developing world to gradually shift from reactive to anticipatory disaster risk management. The HFA effectively provides the international foundation for reducing disaster risks, as agreed by Governments at the World Conference on Disaster Reduction in January 2005. The Sendai Framework for Disaster Risk Reduction 2015 2030 the successor of the HFA is built on the facts tha t continuity in risk reduction cannot be adequately implemented by the member states alone, because other stakeholders such as academia, civil societies and private sectors are needed to play active roles. The
75
framework was adopted by member states at the Third UN World Conference on DRR in Sendai, Japan, on 18 March 2015.
Some major initiatives toward implementing the priority areas of the HFA have been taken in Malaysia as evidenced by the development of National Action Plan for Disaster Risk Reduction (Pereira et al, 2014). In terms of drought, the process of drought risk reduction and its mainstreaming into national development frameworks should be participatory, involving a wide range of stakeholders such as national and local governments, community based and civil society organisations, regional and sub regional organi s ations, multilateral and bilateral international bodies, the scientific community, the private sector and the media.
The United Nations International Strategy for Dis aster Reduction (UNISDR) proposes a framework that contributes to the priorities of the HFA (UNISDR, 200 7 ). This global framework contains five elements, as follows:
• Element 1: Policy and governance
• Element 2: Drought risk identification, risk monitoring and early warning
• Element 3: Drought awareness, knowledge management and education
• Element 4: Reducing underlying factors of drought risk
• Element 5: E nhancing mitigation measures and preparedness for drought
Guiding principles are provided for each of the above elements.
This framework, which is attached in Appendice 2, may be used as a good reference for guiding the development of a national framework for drought risk reduction within the context of Malaysia, b ased on national circumstances, including national, state and local needs and division of responsibilities, community participation, networks and coordination mechanisms at all levels and resource availability , taking into account potential synergies in terms of institutional and implementation capacities among government agencies and other stakeholders
4.11 Drought, c limate c hange and s ustainable d evelopment
4.11.1
National climate change policy
Malaysia has a National Policy on Climate Change that “provides the framework to mobilise and guide government agencies, industry, community as well as other stakeh olders and major groups in addressing the challenges of climate change in a holistic manner”. “Emphasis is on strengthening capacity of the nation to reduce the country’s vulnerability to climate change whilst promoting mitigation response that also enhances sustainable development” (MONRE, 2009).
The objectives of the National Policy on Climate Change are:
(a) “ Mainstreaming climate change through wise management of resources and enhanced environmental conservation resulting in strengthened economic competitiveness and improved quality of life. ”
(b) “ Integration of responses into national policies plans and programmes to strengthen the resilience of development from arising and potential impacts of climate change. ”
76
(c) “ Strengthening of i nstitutional and implementation capacity to better harness opportunities to reduce negative impacts of climate change. ”
Although “drought” has not been specifically mentioned in the National Policy, one of the key actions (KA) in the National Policy (i.e. , KA28 ST7 ) is to “establish and implement a national R&D agenda on climate change taking into account the following areas: Agriculture and food security; water security and services; forestry and ecosystem services; public health services and delivery; l ocalised modelling for projection of future scenarios; vulnerability due to extreme weather events and natural disasters”, among others.
KA27 ST6 “Enhance the coordinating mechanism to oversee the planning, implementation and monitoring of climate change measures”.
KA33 ST7: “Institutionalise measures to strengthen effective linking climate science and policy”.
KA36 ST8: “ Promote community based climate change responses and programmes ”
As drought will be a frequent natural or human induced hazard in a changing climate, it should be an integral part of the effective climate change strategy and policy that are essential to guide national sustainable development.
4.11.2 National sustainabl e development policy
Sustainable development promotes environmental, social and economic sustainability ( Brundtland , 1987; United Nations, 2012) , which are inclusive and mutually supportive, and which should not be “balanced” among each other but to be “ integrated ” into one entity So often environmental protection is sacrificed at the mercy of economic development, and it has become an afterthought rather than an element that should be considered right from the beginning on the drawing board Thus , there is a need for paradigm shift for achieving However, sustainable development can only be achieved with effective policy , political commitment and good governance
Following the mainstream in the world guided by the United Nations (UN) , Malaysia has been an active participant in all conferences related to sustainable development organi s ed by the United Nations since the UN Conference on Environment and Development (UNCED) or Earth Summit at Rio de Janeiro held in 1992. Malaysia has a local Agenda 21: A global action p lan for sustainable development Malaysia is a Party to the three Rio Conventions UNFCCC , CBD , and the U nited N ations Convention to Combat Desertification (UNCCD) , all of which aim to achieve sustainable development In September 2000, Malaysia was a Party that adopted the Millennium Development Goals. O n 25 September 20 1 5 , the UN General Assembly (including Malaysia ) adopted the SDGs (United Nations, 2015) 20
The 11MP has also included Green Growth, which promotes environmental sustainability by efficient use of natural resources and minimi s ation of adverse environmental impacts ( Ekins , 200 0 ; UNESCAP, 2013 ), as an important agenda for sustainable development.
Several policies in Malaysia have been developed to advance the sustainable development and green growth agenda.
(a) National Policy on Climate Change 2009: To mainstream climate changes through wise management of resources and enhanced environmental conservation resulting in strengthen economic competitive ness and improved quality of life.
(b) National (Second) Physical Plan 2010: Spatial planning that guides the direction and pattern of development, use and maintenance of the strategic land ( 15 20 years).
http://www.un.org/sustainabledevelopment/sustainable development goals/
77
20
(c) National Urbanisation Plan 2006: Comprises 30 specific policies to be referred in order to plan, develop and manage the urban environment.
(d) National Green Technology Policy 2009: Toward a low carbon economy through the usage of green technology as a solution for global warming (Rosly, 2011)
The 11MP informs that national sustainable development will be achieved in a resilient, low carbon, resource efficient, and socially inclusive manner.
However, all policies, no matter how good they are, must be efficiently and effectively implemented. Otherwise they remain useless.
4.11.3 Mainstreaming drought risk reduction into climate change and sustainable development policies
As drought is expected to be a more frequent event in the changing climate, thus it should be an integral component of the national climate change policy and strategies, which, in turn, should be an integral component of national sustainable development policies and strategies , as illustrated in Figure 4.5
Figure
4.5 Mainstreaming drought risk reduction into climate change and sustainable development policies
However, m ainstreaming drought risk reduction into national climate change and sustainable development policy frameworks will require a holistic approach, comprehensive scientific and policy research, strong institutions, good inter agencies coordination, extensive and inclusive stakeholders (including communities) participation, as well as political commitment at all levels for effective implementation , and appropriate governance.
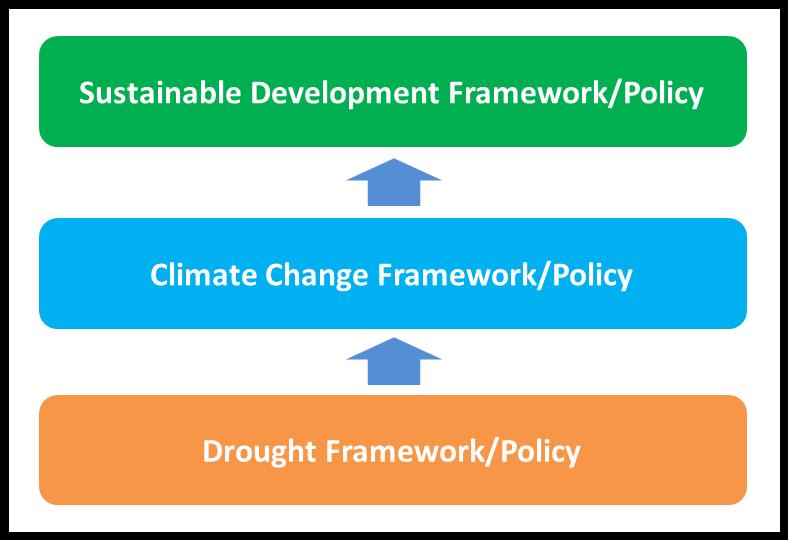
4.12 Towards a new policy for drought risk reduction
The slow onset and the non structural damage caused by drought seem to have attracted less attention by policy makers compared to the more rapid onset hazards usually characterised by massive structural losses such as flood.
Ahmad and Low (2003) advocate d the need for a drought policy and management strategies in Malaysia after the prolonged drought induced by the 1997/98 El Niño event. They commented then that “ Drought management in Malaysia currently has been reactive, relying largely on crisis management. This approach has its weaknesses such as untimely response, poor coordination, and poorly targeted to drought stricken groups or areas.”
78
However, a lmost 20 years after the 1997/98 El Niño event , the focus in Malaysia seems to be still on drought management rather than drought risk reduction. The approach for drought management remains largely the same: reactive rather than proactive.
Wilhite et al. (2014) also highlighted the importance of adoption of national drought policies that are focused on risk reduction and complemented by drought mitigation or preparedness plans at various levels of government, so as to improve the coping capacity of nations to manage drought events in association with a changing climate.
Thus , a fundamental shift in focus and approach is needed if an integrated policy for drought risk reduction is to be formulated in Malaysia, taking into account the projected more frequent and/or intense drought events caused by human induced climate change.
The 11MP 2016 2020 seeks to drive disaster risk management and climate change resilience. However, instead of managing drought risks, the new national drought policy must seek to reducing drought risks.
A new policy for drought risk reduction must in clude the economics of drought. Indeed, i neffective policies for addressing drought could have significant implications for environmental, social and economic impacts and consequences. Thus, the costs of ineffective policies should be considered and included in the analysis on the economics of drought.
4.13 South East Asia Network for Drought Risk Reduction (SEANDRR)
It is more cost effective to improve drought coping and adaptation capacity through a regional partnership. Thus, it is proposed to establish a SEANDRR to facilitate sub regional collaboration for drought risk reduction, especially capacity development activities, so as to build resilience for drought risk reduction within the ASEAN members.
This Network will complement and strengthen national capacity development programmes to enhance human and institutional capacities to better cope with future drought events I t will be an important platform for providing and sharing information , dat a, expertise, good practices and lessons learned on all scientific, technical, technological and policy aspects related to drought risk reduction.
Malaysia may take the lead to initiate the establishment of this network under the auspices of the ASEAN Secretariat.
79
Chapter 5: Conclusions and Policy Recommendations
5.1 Conclusions
Based on the information and analyses provided in Chapters 2, 3 and 4, a number of conclusions can be drawn, as follows:
(1) El Niño is a natural phenomenon that has profound impacts around the world. It typically brings drought condition in the western Pacific region, including Malaysia. Drought is the world’s most destructive natural or human induced hazard.
(2) In the past three decades, tremendous progress has been made in scientific understanding of ENSO system, both in theoretical and observational aspects. The setting up of the TAO Arrays in 1994 made the monitoring of the state of ENSO system possible in almost real time.
(3) T he recent initiative to develop an El Nino Action Plan that is based on a rainfall depletion indicator would ensure better uniformity, coordination and implementation of efforts to reduce the negative impacts of El Nino , which induces prolonged drought and the outbreak of forest fires and associated haze.
(4) As evidenced by the 19 97/98 El Niño event, which was one of the strongest El Niño events on record, the impacts of El Niño on the environmental, social and economic sectors are profound. S ignificant reduction in rainfall had greatly affected water supply, which, in turn, had resulted in the loss of agricultural (e.g. oil palm, paddy and cocoa) and industrial productivity, as well as reduced hydro electricity production. In addition, prolonged drought affected terrestrial ecosystems, while the warmer ocean temperature affecte d marine ecosystems and caused extensive coral bleaching, affected fisheries with reduced fishes landing. Forest fires destroyed forests, animal habitats, biodiversity (including endangered species, such as orangutan), while the greenhouse gas emissions from the forest fires have significant implications for climate change. The transboundary haze generated by the forest fires seriously affected health, and disrupted tourism and education, among others.
(5) It was estimated that the economic losses in Malaysia associated with the haze episode during August October 1997 was RM 801.9 million (or US$ 321 million at 1997 exchange rate), mainly contributed by the loss in productivity during the state of emergency in Sarawak from 19 to 28 September, RM 393. 51 million (USS$ 157.4) , which accounted for 49.07% of the total; followed by decline in tourists arrival, RM 318.55 million (US$ 127.42), or 39.72% of the total. Other losses included decline in fish landing (RM 40.58 million (US$ 16.23 million ) or 5.00%; cost of fire fighting RM 25 million (US$ 10 million) or 3.12%; adjusted cost of illness RM 21.02 million (US$ 8.41 million) or 2.62%; cloud seeding, RM 2.08 million (US$ 0.83 million ) or 0.26%; expenditure on masks, RM 0.71 million (US$ 0.28 million) or 0.09%; and cancellation of flights, RM 0.45 million (US$ 0.18 million) or 0.06%, respectively. However, the above estimate was very conservative as it did not account for t he economy wide cost s, as well as the loss of biodiversity and ecosys tem services With new data and new methodologies, an assessment of the total cost over the whole period of the 1997/98 El Niño event would be very useful.
(6) Although El Niño induced drought could not be prevented, but its impacts, such as forest fires and associated haze, could be prevented. Scientific (e.g., monitoring and early warning), technical (e.g., integrated drought management; integrated water resources management) and technological measures (e.g., water conservation, rain harvesting) are available to reduce the impacts of drought. Effective policy measures,
80
including an effective national drought risk reduction coordination mechanism, are essential for coping with prolonged drought.
(7) To reduce the risk for drought exposure, it is important to identify and minimi se the factors (e.g., prevention, preparedness, mitigation, environmental, social, economic, technical, technological, financial, human capacity and policy, among others) that may reduce the vulnerability of a country to drought. Poverty could be an important factor that makes the poor people more vulnerable to drought.
(8) El Niño events are caused by natural climate variability. However, t he frequency, magnitude, intensity and duratio n of El Niñ o may be exacerbated by human induced climate chang e. T hus , drought risk reduction is an integral part of climate change adaptation to drought, and drought risk reduction framework and policy should also be an integral part of climate change framework and policy, which, in turn, should be an integral part of susta inable development framework and policy.
(9) Although lessons may be learned from the past El Nino events, it may be noted that, as pointed out by Hughes et al. (1998) , no two ENSO events are the same or even closely similar in their global characteristics or effects, let alone at the regional or national level.
5.2 Policy Recommendations
A number of policy recommendations are provided for policy makers, as follows:
(1) Any actions to address the impacts of El Niño events and limit their impacts must be science based . These include assessment on t he need for more coordinated action for monitoring and early warning systems that deliver timely information to decision makers and the general public and communities ; improved impact asse ssment procedures; risk management measures and preparedness plans; and stronger emergency response programmes.
(2) There is a need to monitor El Niño using forecast products from established forecast centres. There is also a need to monitor other climate phenomena such as the IOD and MJO.
(3) There is a need for a holistic and proactive approach in addressing the impacts of El Niño In order to strengthen the national coordination mechanism for drought risk reduction, a National Drought Committee may be established based on the model of National Haze and Hot Weather Main Committee, with a view to coordinating all issues relating to drought risk reduction, including prevention and mitigation measures.
(4) Malaysia must develop effective policies that engend er cooperation and coordination at all levels of authority to increase their capacity to cope with extended periods of water scarcity in case of a drought. The ultimate goal of these efforts is to create societies that are more resilient to drought
(5) There is a need to strengthen scientific, technical and technological research, including research on local and regional climate variability and build Malaysia’ s own seasonal forecasting system.
81
(6) The occurrences of El Niño and La Niña have caused changes to the annual historical rainfall pattern. Rainfall records are the basis of “hydrological procedures” used for designing hydraulic structures and systems like dams and irrigation system. Therefore, there is a need to review these hydrological procedures to ensur e accurate design and operation & maintenance of the structures and systems.
(7) There is a need to develop a long term policy for drought risk reduction preventive, proactive and risk based, rather than reactive and ‘crisis based’ ; and to mainstream drought risk reduction into climate change and sustainable development frameworks and policies.
(8) It is important to map the variations in vulnerabilities and impacts (environmental, social and economic) across various sectors and geographical locations in the coun try. Based on past El Niño events , which may be classified as weak, moderate and strong events, these variations could be analysed and studied and taken into account in dealing with the impacts of future El Niño events.
(9) There is a need to strengthen social and economic research on the impacts of El Niño , including the economics of drought (e.g., the valuation of biodiversity and ecosystem services; the cost of prevention versus mitigation; the cost of action versus inaction), so as to provide the policy and decision makes with a good basis for making informed decisions.
(10) Further strengthening of human and institutional capacity at the national, state and locals is needed for drought risk reduction, which is multi disciplinary. Malaysia’s higher education system has an important role to play in capacity development.
(11) Malaysia may take the lead to initiate the establishment of a SEANDRR perhaps under the auspices of the ASEAN Secretariat. This sub regional Network will facilitate capacity development by bringing together people and institutions within the ASEAN members with the goal of increasing interactions and linkages for sharing regional and national policies and strategies to improve droug ht preparedness and management, and mitigate the effects of drought. It will share data and information relating to drought, including case studies on good practices and lessons learned. It will complement and strengthen national capacity development programmes to enhance human and institutional capacities to better cope with future episodes of drought.
82
References
Abul Quasem Al Amin and Gazi Mahabubul Alam (2016) Impact of El Niño on Agro economics in Malaysia and the Surrounding Regions: An Analysis of the Events from 1997 98 . Asian J. Earth Sci., 9 (1): 1 8, 2016. http://scialert.net/fulltext/?doi=ajes.2016.1.8.
ADB (Asian Development Bank). 2001. Fire, smoke, and haze. The ASEAN response strategy. Manila, The Philippines: ADB. https://www.a db.org/sites/default/files/publication/28035/fire smoke haze.pdf.
Afroz, R., Hassan, M.N. and N.Ibrahim, N.A. (2003) Review of air pollution and health impacts in Malaysia. Environmental Research 92: 71 77.
Ahmad Jamalluddin Bin Shaaban and Low, K. S. (200 3) Droughts in Malaysia: A Look at Its Characteristics, Impacts, Related Policies and Management Strategies. Water and Drainage 2003 Conference, 28 29 April 2003, Kuala Lumpur. (http://www.nahrim.gov.my/en/publications/technicalpapers/60 droughts in mala ysia a look at its characteristics impacts related policies and management strategies.html). http://www.nahrim.gov.my/images/LampiranPDF/KertasTeknikal/drought_in_malaysia.pdf.
Aiba, S. and Kitayama, K. (2002) Effects of the 1997 1998 El Niño drought on rain forests of Mount Kinabalu, Borneo. J Trop Ecol (PDF Download Available). Available from: https://www.researchgate.net/publication/231878637_Effects_of_the_1997 1998_El_Nino_drought_on_rain_forests_of_Mount_Kinabalu_Borneo_J_Trop_Ecol [accessed May 7, 2016].
Air Selangor (2015) Air Selangor Performance Report for 2015. https://www.syabas.com.my/uploads/FINAL%20REPORT%20new.pdf.
Arif, F. N. 2014. Kajian pencirian fenomena kemarau di Malaysia. Tesis Ijazah Sarjana Universiti Kebangsaan Malaysia.
Ashok, K. and T. Yamagata. 2009. Climate change: The El Niño with a difference. Nature 461 : 481 484 : doi:10.1038/461481a.
Ashok, K., S.K. Behera, S.A. Rao, H., Weng and T. Yamagata. 2007. El Ni˜no Modoki and its possible teleconnection. J. Geophys. Res. 112 : C1 1007, DOI: 10.1029/2006JC003798.
ASM (2016) Haze: Help Action toward Zero Emissions. ASM Task Force on Haze, Interim Report, 5/5/2016. Academy of Sciences Malaysia.
Awang, M. B., Jaafar, A. B., Abdullah, A. M., Ismail, M. B., Hassan, M. N., Abdu llah, R., Johan, S., and Noor, H. (2000). Air quality in Malaysia: Impacts, management issues and future challenges. Respirology 5, 183 196.
Bank Negara Malaysia (1997) Chapter 1. The Real Economy. http://www.bnm.gov.my/files/publication/ar/en/1997/Chap ter1.pdf.
Bank Negara Malaysia (1998) Chapter 1. The Real Economy. http://www.bnm.gov.my/files/publication/ar/en/1998/Chapter1.pdf.
Bank Negara Malaysia (1999) Chapter 1. The Real Economy. http://www.bnm.gov.my/files/publication/ar/en/1999/Chapter1.pdf.
Barnston, A.G., M.K. Tippett, M.L. L'Heureux, S. Li and D.G. DeWitt. 2012. Skill of Real Time Seasonal ENSO Model Predictions during 2002 11: Is Our Capability Increasing?. Bulletin of the A merican Meteorological Society 93 (5): 631 651.
Battisti, D. S., and A. C. Hirst. 1989. Interannual variability in the tropical atmosphere ocean model: influence of the basic state, ocean geometry and nonlineary, J. Atmos. Set, 45: 1687 1712.
Birkmann, J. (Ed.) (2006) Measuring Vulnerability to Natural Hazards: towards disaster resilient societies. United Nations University.
83
Brauer, M., and Hisham Hashim, J. (1998). Fires in Indonesia: Crisis and reaction. Environmental Science and Technology 32.
Brundtland, G. (1987) Our Common Future . World Commission on Environment and Development (Brundtland Commission), Oxford, Oxford University Press.
Cai, W., S. Borlace, M. Lengaigne, P. Van Rensch, M. Collins, G. Vecchi, A. Timmermann, A. Santoso, M.J. M cPhaden, L. Wu, M.H. England, G. Wang, E. Guilyardi and F. F. Jin. 2014. Increasing frequency of extreme El Niño events due to greenhouse warming. Nature Climate Change DOI: 10.1038/NCLIMATE2100.
Chang, C. P., P. A. Harr and H J. Chen. 2005. Synoptic dist urbances over the equatorial South China Sea and western Maritime Continent during boreal winter. Monthly Weather Review 133: 489 503.
Chin, L.S. (2001) Satelite detection of forest fires and burn scars. In: Radojevic, M., ed. Workshop on minimizing the im pact of forest fire on biodiversity in Asean. Brunei Darusalam: Nova Science Publishers.
Christensen, J.H., K. Krishna Kumar, E. Aldrian, S. I. An, I.F.A. Cavalcanti, M. de Castro, W. Dong, P. Goswami, A. Hall, J.K. Kanyanga, A. Kitoh, J. Kossin, N. C. Lau , J. Renwick, D.B. Stephenson, S. P. Xie and T. Zhou. 2013. Climate Phenomena and their Relevance for Future Regional Climate Change. In: Climate Change 2013: The Physical Science Basis. Contribution of Working Group I to the Fifth Assessment Report of the Intergovernmental Panel on Climate Change [Stocker, T.F., D. Qin, G. K. Plattner, M. Tignor, S.K. Allen, J. Boschung, A. Nauels, Y. Xia, V. Bex and P.M. Midgley (eds.)]. Cambridge University Press, Cambridge, United Kingdom and New York, NY, USA, pp. 1217 1308, doi: 10.1017/CBO9781107415324.028.
Cook, E.R., Anchukaitis, K.J., Buckley, B.M., D'Arrigo, R.D., Jacoby, G.C., Wright, W.E. (2010) Asian monsoon failure and megadrought during the last millennium. Science 328(5977):486 9.
Costanza, R. et al. (1997) The value of the world’s ecosystem services and natural capital. Nature 387, 253 260.
Department of Statistics Malaysia. n.d. Time series data. (https://www.statistics.gov.my/index.php?r=column/ctimeseries&menu_id=NHJlaGc2Rlg4ZXlGTjh1SU1k aWY5UT09). Last accessed on 05 November 2015.
Dudley, N., Jeanrenaud, J P and Stolton, S. (1997). The year the world caught fire. A report to WWF International. http://www.equilibriumresearch.com/upload/document/theyeartheworldcaughtfire.pdf.
Ellison, J. (2000) How South Pacific mangroves may respond to predicted climate change and sea level rise. In: Gillespie, A., Burns, W. (Eds.), Climate Change in the South Pacific: Impacts and Responses in Australia, New Zealand, and Small Islands States. Kluwer Academic Publishers, Dordrecht, Netherlands, (Chapter 15), pp. 289 301.
FAO (2005) Global Forest Resources Assessment 2005. Thematic Study on Mangroves, Malaysia, Country Profile, Draft, August 2005. Food and Agriculture Organization of the United Nations (FAO). http://www.fao.org/forestry/9396 01019f1bc81f58cabde2af84054a1a42d.pdf.
FAO (2007) The world’s mangroves 1980 2005. Asia. A thematic study prepared in the framework of the Global Forest Resources Assessment 2005. Forestry Paper 153. Food and Agricultural Organization of the United Nations (FAO) Rome, Italy: FAO.
FAO (2010) Global Forest Resources Assessment 2010. Main report. Food and Agriculture Organization of the United Nations (FAO), Rome. FAO Forestry Paper 163.
FAO (n.d.) Malaysia’s water vision. Food and Agricultural Organization of the United Nations (FAO). [http://www.fao.org/docrep/004/ab776e/ab776e02.htm ]. Last accessed on 05 November 2015.
Feng, J., L. Wang, W. Chen, S.K. Fong and K.C. Leong. 2010. Different impacts of two types of Pacific O cean warming on Southeast Asian rainfall during boreal winter. J. Geophys. Res. 115 : D24122, DOI: 10.1029/2010JD014761.
84
Field, C. (1995) Impacts of expected climate change on mangroves. Hydrobiologia 295, 75 81.
Forestry Department Peninsular Malaysia Offi cial Website, 2017. Forestry Statistics 2014. Retrieved from https://www.forestry.gov.my/index.php/en/2016 06 07 02 53 46/2016 06 07 03 12 29
Forestry Department Sarawak (2013) Forestry Department Sarawak Annual Report 2013.Retrieved from: http://www.forestry.sarawak.gov.my/modules/web/pages.php?mod=download&id=Annual%20Rep ort&menu_id=0&sub_id=132.
George, R. and Lam S.K. (1997) Dengue virus i nfection the Malaysian experience. Ann Acad Med Singapore 26(6):815 9.
Gilman, E.L., Ellison, J., Duke N. C & Field, C. (2008) Threats to mangroves from climate change and adaptation options: A review. http://mangroves.elaw.org/node/72.
Glover, D. and Jessup, T. (eds) (1999) Indonesia's fires and haze : the cost of catastrophe. Singapore: Institute of Southeast Asias Studies (ISEAS), 149pp. http://www.eepsea.org/pub/book/113538.pdf.
Gonçalves, C., Alves, C., Evtyugina, M., Mirante, F., Pio, C., Cas eiro, A., Schmidl, C., Bauer, H., and Carvalho, F. (2010) Characterisation of emissions from woodstove combustion of common woods grown in Portugal. Atmospheric Environment 44: 4474 4480.
Graham, N.E. and W.B. White. 1988. The El Niño cycle: A natural osci llator of the Pacific Ocean atmosphere system. Science. 24: 1293 1302.
Grainger, A., Wong, G., Kabubo Mariara, J., Mbuvi, D. and Low, P.S. (2013) Chapter 2 : Economic and Social Impacts Assessment of DLDD. In Low, P.S. (ed) (2013) Economic and Social impacts of desertification, land degradation and drought. White Paper I. UNCCD 2nd Scientific Conference, prepared with the contributions of an international group of scientists. Available from: http://2sc.unccd.int (accessed 26 March 2013.) http://2sc.unc cd.int/fileadmin/unccd/upload/documents/WhitePapers/White_Paper_1.pdf.
Haniff M.H., Zuraidah Yahya, Afifah Abdul Razak, Jusoh Latif, M. Ayatollah Khomeini, A. Rahman and Norman Kamarudin (2016) Impact of El Nino and La Nina on oil palm FFB yield produc tion in Malaysia. International Journal of Agriculture and Environmental Research 2 (5).1084 1100. http://ijaer.in/uploads/ijaer_02__74.pdf.
Haniff, M.H., Ahmad Tarmizi Mohammad, Mohd Roslan Md Noor, Ahmad Kushairi Din, Jusoh Latiff, Abdul Rahim Abdullah Sani, Ramli Abdullah. (2010) Impact of El Niño occurrence on oil palm yield in Malaysia. The Planter, Kuala Lumpur, 86 (1017), 873 852. https: //www.researchgate.net/profile/Mohd_Harun/publication/235350544_Impact_of_El_Nino_Occurre nce_on_Oil_Palm_Yieldin_Malaysia/links/0fcfd511317e4088df000000/Impact of El Nino Occurrence on Oil Palm Yieldin Malaysia.pdf?origin=publication_detail.
Harrison, R. (2001) Drought and the consequences of El Niño in Borneo. A case study of figs. Population Ecology 43: 63 75. Tokyo, Japan: The Society of Population Ecology Springer Verlag.
Harrison, R.D. (2000) Repercussions of El Niño: drought causes extinction and the breakdown of mutualism in Borneo. Proceedings of the Royal Society of London Series B: Biology Sciences 267 : 911 915. In: Potts, M.D. (2003) Drought in a Bornean everwet rain forest. Journal of Ecology 91 (3): 467 474. [http://onlinelibrary.wiley.com/do i/10.1046/j.1365 2745.2003.00779.x/epdf]. Last accessed on 23 October 2015.
Harvard Medical School (1999) Extreme Weather Events: The Health and Economic Consequences of the 1997/98 El Niño and La Niña. The Center for Health and the Global Environment, H arvard Medical School, Oliver Wendell Holmes Society, 260 Longwood Avenue, Boston, Massachusetts 02115, January, 1999. http://www.chgeharvard.org/sites/default/files/Extremeweatherreport.pdf.
Holmgren, M., M. Scheffer, E. Ezcurra, J.R. Gutiérrez and G.M. J. Mohren (2001) El Niño effects on the dynamics of terrestrial ecosystems. TRENDS in Ecology & Evolution 16 (2). February 2001.
85
Hon, Priscilla M.L. (1999) Singapore. In: Glover, D. and T. Jessup T (eds). Indonesia’s Fire and Haze, the cost of catastrophe. The Institute of Southeast Asian Studies (ISEAS): 51 85.
Hughes, P., Allen, B., Bourke, M., Fox, J. and Lindesay, J. (1998) Measuring the Effects of the 1997 98 El Niño on Countries within the Australian Aid Program. Submitted to AusAID by ANUTECH Pty Ltd. 15 June 1998.
http://www.pacificdisaster.net/pdnadmin/data/original/JB_DM558_1998_Measuring_effects_of_El_Nino .pdf.
IASC and UNISDR (Inter Agency Standing Comm ittee and United Nations Office for Disaster Risk Reduction). 2008. Disaster risk reduction strategies and risk management practices: critical elements for adaptation to climate change. Submission to the UNFCCC Adhoc Working Group on Long Term Cooperative Action.11 November 2008.
Ibrahim, A. 2014. ‘Malaysia’s water future: Assessment of challenges and opportunities’. [http://www.akademisains.gov.my/download/2%20Backdrop_Dr%20Low NST ASM%20Insight.pdf]. Last accessed on 05 November 2015.
IPCC (Intergovernmental Panel on Climate Change). 2014. Climate change 2014. Synthesis report summary for policymakers. [http://www.ipcc.ch/pdf/assessment report/ar5/syr/AR5_SYR_FINAL_SPM.pdf ] . Last accessed on 05 November 2015.
Ishizuka, S., Iswandi, A., Nakajima, Y., Yonemura, S., Sudo, S., Tsuruta, H., Muriyarso, D. (2005) Emission in a tropical rainforest in Indonesia. Nutrient Cycling in Agroecosystems . January 2005, Volume 71, Issue 1, pp 55 62.
Jamaludin, F. 2011. Impak Ayunan Madden Julian terhadap taburan Hujan dan Peredaran Atmosfera di Kepulauan Benua Maritim. Tesis Ijazah Sarjana. Universiti Kebangsaan Malaysia.
Jepson, P., J.K. Jarvie, K. MacK innon and K.A. Monk (2001) The end for Indonesia's lowland forests?. Science 292: 859 861.
Jin, F F. 1997. An equatorial ocean recharge paradigm for ENSO. Part I: Conceptual model. J. Atmos. Sci. 54: 811 829.
Jones, D. S. (2006). ASEAN and transboundary ha ze pollution in Southeast Asia Asia Europe Journal 4, 431 446.
Juneng, L. and F.T. Tangang. 2005. Evolution of ENSO related rainfall anomalies in Southeast Asia region and its relationship with atmosphere ocean variations in Indo Pacific sector. Climate Dynam. 25 : 337 350.
Juneng, L. and F.T. Tangang. 2008. Level and source of predictability of seasonal rainfall anomalies in Malaysia using canonical correlation analysis. Int. J. Climatol. 28 : 1255 1267, DOI: 10.1002/joc.1617.
Juneng, L., F.T. Tangang, H. Kang, W.J. Lee and T.K. Seng. 2010. Statistical downscaling forecasts for winter monsoon precipitation in Malaysia using multimodel output variables. Journal of Climate 23 : 17 27.
Kahn, L.H. (2011) Deforestation and emerging diseases. Bulletin of the Atomic Sciences. [http://thebulletin.org/deforestation and emerging diseases]. Last accessed on 23 October 2015.
Kao, H.Y. and Yu, J.Y. 2009. Contrasting Eastern Pacific and Central Pacific Types of ENSO. Journal of Climate 22: 615 632.
Ketterings, Q. M., Tri Wibowo, T., Van Noordwijk, M., and Penot, E. (1999) Farmers' perspectives on slash and burn as a land clearing method for small scale rubber producers in Sepunggur, Jambi Province, Sumatra, Indonesia. Forest Ecology and Management 120, 157 169.
Khairul , H.M. and S. Tapsir (2014) An impact of natural disasters on the paddy production and its economic implications. Half year project monitoring report. MARDI 2014. unpublished.
86
Kug, J.S., F.F. Jin and S.I. An. 2009. Two types of El Ni˜no events: cold Tongue El Niño and warm pool El Niño. J. Climate 22(6) : 1499 1515, DOI: 10.1175/2008JCLI2624.1.
Kwan, M. S., Tangang, F. T., and Juneng, L. 2014. Present day regional climate simulation over Malaysia and western Maritime Continent region using PRECIS forced with ERA40 reanalysis. Theoretical and Applied Climatology 115:1 14.
Latif, M., D. Anderson, T Barnett, M. Cane, R. Kleeman, A. Leetmaa, J. O’Brien, A. Rosati and F. Schneider. 1998. A review of the predictability and prediction of ENSO. Journal of Geophysical Research ,103: 14375 14393.
Lazaroff, C. (2002) Indonesia Rainforest Fires Doubled CO 2 Levels Globally. http://www.albionmonitor.com/0211a/rainfire2.html.
Liu, X., P. Van Espen, F. Adams, J. Cafmeyer and W. Maenhaut (2000) ‘Biomass burning in southern Africa: Individual particle characterization of atmospheric aerosols and savanna fire samples’. Journal of Atmospheric Chemistry 36: 135 155.
Looi L.M. and Chua K.B. (2007) Lessons from the Nipah virus outbreak in Malaysia. Malays J Pathol. 29 (2):63 67.
L ow, P.S. (1998) Tropospheric Ozone: The Missing GHG in the UNFCCC Equation. Linkages Journal , Vol.3, No.4, 28 October 1998, IISD, NY (http://www.iisd.ca/journal/low.html).
Low, P.S. (2001) Early Warning Systems for Drought Recent Development. Proceedings of the Third Asia Africa Forum on Combating Desertification and Mitigation the Effects of Drought, 21 25 June 2001, Ulan Bator, Mongolia , p. 79 82. UNCCD Secretariat, Bonn, Germany.
Low, P.S. (2010) Opening Message. Sub theme 1: Vision of a Climate Resilient Society. E discussion on Climate Change and Human Development ; United Nations Development Programme (UNDP) Asia Pacific Human Development Report. http://www.ilankelman.org/articles1/aphdn2011.pdf (pages 28 29).
Low, P.S. (ed) (2013) Economic and Social impacts of desertification, land degradation and drought. White Paper I. UNCCD 2nd Scientific Conference, prepared with the contributions of an international group of scientists. Available from: http://2sc.unccd.in t (accessed 26 March 2013.) http://2sc.unccd.int/fileadmin/unccd/upload/documents/WhitePapers/White_Paper_1.pdf.
Mastura Mahmud (2009a) Mesoscale model simulation of low level equatorial winds over Borneo during the haze episode of September 1997. J. Earth Syst. Sci. 118 , No. 4, August 2009, pp. 295 307.
Mastura Mahmud (2009b) Simulation of equatorial wind field patterns with TAPM during the 1997 haze episode in Peninsular Malaysia. Singapore Journal of Tropical Geography 30 (2009) 312 326.
Mazlan, A.G., Zaidi C. C., Wan Lotfi, W.M. and Othman B.H.R. (2005) On the current status of coastal marine biodiversity in Malaysia. Indian Journal of Geo Marine Sciences 34(1):76 87 March 2005.
McPhaden, M., A.J. Busalacchi, R. Cheney, J.R. Dongu y, K.S. Gage, D. Halpern, M. Ji, P. Julian, G Meyers, G.T. Mitchum, P.P. Niiler, J. Picaut, R.W. Reynolds, N. Smith, and K. Takeuchi. 1998: The Tropical Ocean Global Atmosphere Observing System: A Decade of Progress. Journal of Geophysical Research, 103: 1 4169 14240.
McPhaden, M.J., Zebiak S.E., Glantz, M.H. (2006) ENSO as an integrating concept in Earth science. Science 314:1740 1745.
MEA (Millennium Ecosystem Assessment) (2005a) Living Beyond Our Means: Natural Assets and Human Well Being. Island Press, W ashington, DC.
MEA (Millennium Ecosystem Assessment) (2005b) Ecosystems and Human Well Being: Desertification Synthesis . World Resources Institute, Washington DC.
MET Malaysia (Malaysian Meteorological Department). 2015. ‘Current sea surface temperature an d outlook for November 2015 to April 2016’. ENSO Outlook. Updated 14 September 2015.
87
Mirzaei, A., Tangang, F., Juneng, L., Mustapha, M., Husain, M., and Akhir, M. (2013). Wave climate simulation for southern region of the South China Sea. Ocean Dynamics, 63:961 977.
Mohamad Zabawi Abd. Ghani (2014) El Niño: Source and consequences to weather and impact on agriculture. Scientia MARDI, Vol. 002, 2014, page 9, MARDI. https://issuu.com/scientiamardi/docs/scientia_mardi_ _vol_002_2014
Mohd Shahwahid H.O. and Jamal Othman (1999) In D. Glover & T. Jessup (Eds.), Indonesia's Fires and Haze: The Cost of Catastrophe. Singapore: Institute of Southeast Asian Studies. pp 22 50.
Monks, P. S., Granier, C., Fuzzi, S., Stohl, A., Williams, M. L., Akimoto, H., Amann, M., Baklanov, A., Baltensperger, U., Bey, I., Blake, N., Blake, R. S., Carslaw, K., Cooper, O. R., Dentener, F., Fowler, D., Fragkou, E., Frost, G. J., Generoso, S., Gino ux, P., Grewe, V., Guenther, A., Hansson, H. C., Henne, S., Hjorth, J., Hofzumahaus, A., Huntrieser, H., Isaksen, I. S. A., Jenkin, M. E., Kaiser, J., Kanakidou, M., Klimont, Z., Kulmala, M., Laj, P., Lawrence, M. G., Lee, J. D., Liousse, C., Maione, M., M cFiggans, G., Metzger, A., Mieville, A., Moussiopoulos, N., Orlando, J. J., O'Dowd, C. D., Palmer, P. I., Parrish, D. D., Petzold, A., Platt, U., Pöschl, U., Prévôt, A. S. H., Reeves, C. E., Reimann, S., Rudich, Y., Sellegri, K., Steinbrecher, R., Simpson, D., ten Brink, H., Theloke, J., van der Werf, G. R., Vautard, R., Vestreng, V., Vlachokostas, C., and von Glasow, R. (2009) Atmospheric composition change global and regional air quality. Atmospheric Environment 43, 5268 5350.
MONRE (Ministry of Natural Resources and Environment Malaysia) (2011) Malaysia Second National Communication to the UNFCCC. http://unfccc.int/resource/docs/natc/malnc2.pdf.
Murdiyarso, D. and E.S. Adiningsih. 2007. Climate anomalies, Indonesian vegetation fires and terrestrial carbon emissions. Mitigation and Adaptation Strategies for Global Change 12: 101 112.
Nakagawa, M., K. Tanaka, T. Nakashizuka, T. Ohkubo, T. Kato, T. Maeda, K. Sato, H. Miguchi, H. Nagamasu, K. Ogino, S. Teo, A.A. Hamid and H.S. Lee. 2000. Impact of sev ere drought associated with the 1997 1998 El Niño in a tropical forest in Sarawak. Journal of Tropical Ecology 16 (03): 355 367. http://journals.cambridge.org/action/displayAbstract?fromPage=online&aid=60863&fileId=S0266467400 001450.
National Oceanic and A tmospheric Administration) (NOAA), Department of Commerce, USA. [http://coralreefwatch.noaa.gov/satellite/analyses_guidance/global_bleaching_update_20150602.php]. Last accessed on 23 October 2015.
Neelin, J. D. 2012. Climate change and climate modeling . Ca mbridge University Press, pp.282.
NOAA (2008) Importance of Coral Reefs. NOAA Ocean Service Education. Revised March 25, 2008. National Oceanic and Atmospheric Administration (NOAA), Department of Commerce, USA. http://oceanservice.noaa.gov/education/kits/corals/coral07_importance.html.
NOAA (2015) ‘2014 16 bleaching events continues. June 2015 update’. Coral Reef Watch.
NRE (2009) National Policy on Climate Change. Ministry of Natural Resources and Environment , Putrajaya, Malaysia, 20 November 2009.
NRE (2011). National Action Plan for peatlands. Ministry of Natural Resources and Environment, Putrajaya, Malaysia.
Oliver, J.K., Berkelmans, R., Eakin, C.M. (2009) Coral bleaching in space and time. In: van Oppen M , Lough JM (eds) Coral bleaching: Patterns, processes, causes and consequences. Springer, Heidelberg, pp 21 39.
Olsen, N. (2013) Chapter 3: Tool Box of Problem Oriented Methodologies. In Low, P.S. (ed) (2013) Economic and Social impacts of desertificatio n, land degradation and drought. White Paper I. UNCCD 2nd Scientific Conference, prepared with the contributions of an international group of scientists. Available from: http://2sc.unccd.int (accessed 26 March 2013.) http://2sc.unccd.int/fileadmin/unccd/up load/documents/WhitePapers/White_Paper_1.pdf.
88
Omar, N. Y. M. J., T.C. Mon, N.A. Rahman and M.R.B. Abas (2006) ‘Distributions and health risks of polycyclic aromatic hydrocarbons (PAHs) in atmospheric aerosols of Kuala Lumpur, Malaysia’. Science of the Tota l Environment 369: 76 81.
Othman, J., M. Sahani, M. Mahmud, M.K. Sheikh Ahmad (2014) Transboundary smoke haze pollution in Malaysia: Inpatient health impacts and economic valuation’. Environmental Pollution 189: 194 201. (http://ukm.pure.elsevier.com/en/pu blications/transboundary smoke haze pollution in malaysia(976c65fb 9075 47aa ab9a ef5f6f0571ce).html). Last accessed on 23 October 2015.
Page, S. E., Siegert, F., Rieley, J. O., Boehm, H. D. V., Jaya, A., and Limin, S. (2002). The amount of carbon released from peat and forest fires in Indonesia during 1997. Nature 420, 61 65.
Paul Ekins, P. (2000), Economic Growth and Environmental Sustainability: The Prospects for Green Growth; New York, Routledge.
Pe ñ aflor, E.L., Skirving, W.J., Strong, A.E., Heron, S.F. and David, L. T. (2009) Sea surface temperature and thermal stress in the Coral Triangle over the past two decades Coral Reefs 28:841 850, DOI 10.1007/s00338 009 0522 8. http://www.ac ademia.edu/12994675/Sea surface_temperature_and_thermal_stress_in_the_Coral_Triangle_over_the_past_two_decades.
Pereira, J.J., N. Kamarudin and M.A. Baharom. n.d. ‘Climate extremes and disaster risk reduction’. [https://cgss.usm.my/images/pdf file/climate exchange and risaster risk reduction ms joy jacqueline pereira.pdf]. Last accessed on 05 November 2015.
Picaut, J., F. Masia, and Y du Penhoat. 1997. An advective reflective conceptual model for the oscillatory nature of the ENSO, Science, 277: 663 666.
Potts, M.D. (2003) Drought in a Bornean everwet rain forest. Journal of Ecology 91 (3): 467 474. [http://onlinelibrary.wiley.com/doi/10.1046/j.1365 2745.2003.00779.x/epdf]. Last accessed on 23 October 2015.
Poulsen, L. (2013) Costs and Benefits of Policie s and Practices Addressing Land Degradation and Drought in the Drylands ”. White Paper II. UNCCD 2nd Scientific Conference. UNCCD Secretariat, Bonn. Available at http://2sc.unccd.int. Available from http://2sc.unccd.int (accessed 26 March 2013).
Raj, D. ( 2007) Flood And Drought Management in Malaysia”. Keynote Lecture. Ministry Of Natural Resources & Environment, 21 June 2007.
Ramanathan et al. (2005) in Proceedings of National Academy of Sciences, March 2005.
Reisen, F. and Brown, S. K. (2006). Implications for community health from exposure to bushfire air toxics. Environmental Chemistry 3, 235 243.
Reisen, F. and Brown, S.K. (2006) Implications for community health from exposure to bushfire air toxics. Enviro nmental Chemistry 3: 235 243.
Rosly, D. 2011. ‘The advancing the sustainable development agenda through aligning Malaysia plans and policies’. Presentation at National Consultation Workshop United Nations Conference on Sustainable Development 2012. [http:/ /www.epu.gov.my/epu theme/pdf/Advancing%20the%20Sustainable%20Development%20Agenda.pdf]. Last accessed on 05 November 2015.
Sabah Forestry Department (2015) Sabah Forestry Department Annual Report 2015. Mangrove Forest Management & Restoration. Retrieved from http://www.forest.sabah.gov.my/annual reports/2015. http://www.forest.sabah.gov.my/images/pdf/publications/AR2015/22.pdf.
Saharjo, B. H. (1997) Fire protection and industrial plantation management in the Tropics. Commonwealth Forestry Review 76: 203 205.
Saharjo, B. H. (2007) Shifting cultivation in peatlands. Mitigation and Adaptation Strategies for Global Change 12: 135 146.
89
Saharjo, B. H. and Munoz, C.P. (2005) Controlled burning in peat lands owned by small farmers: A case study in land p reparation. Wetlands Ecology and Management 13: 105 110.
Salimun, E. 2014. Impak El El Niño Konvensional, El Niño Modoki dan IOD ke atas Taburan Hujan Anomali di Malaysia. Tesis Ijazah Kedoktoran . Universiti Kebangsaan Malaysia.
Salimun, E., F.T. Tangang, L. Juneng, F.W. Zwiers and W.J. Merryfield. 2014b. Skill evaluation of CanCM4 for seasonal climate forecast over Malaysia during the early and late winter monsoon periods. International Journal of Climatology DOI: 10.1002/joc.4361.
Salimun, E., F.T. Tanga ng, L. Juneng, S.K. Behera and W. Yu. 2014a. Differential impacts of conventional El Niño versus El Niño Modoki on Malaysian rainfall anomaly during winter monsoon. International Journal of Climatology , 34:2763 2774.
Salinger, M. J., M. L.Shrestha, W. Dong , J.L. McGregor and S. Wang. 2014. Climate in Asia and the Pacific: Climate Variability and Change. In Climate in Asia and the Pacific . pp. 17 57. Springer Netherlands.
Salleh, N. H. M., Othman, R. and Ramachandran, S. (2007) Malaysia’s Tourism Demand from Selected Countries: The ARDL Approach to Cointegration. Int. Journal of Economics and Management 1(3): 345 363.
Schweithelm J. and Glover D. (1999) Causes and Impacts of the Fires. In: Indonesia’s Fire and Haze, the cost of catastrophe. In: Glover, D. and Jessup T. (eds), Indonesia’s Fire and Haze, the cost of catastrophe. The Institute of Southeast Asian Studies (ISEAS), 1 21.
Schweithelm, J., Jessup, T. and Glover, D. (1999) Conclusions and Policy Recommedations. In: Glover, D. and Jessup T. (eds), Indonesia’s Fire and Haze, the cost of catastrophe. The Institute of Southeast Asian Studies (ISEAS), 130 143.
Shahwahid, M.H.O. and Othman, J. (1999) Malaysia. In: Glover, D. and T. Jessup T (eds). Indonesia’s Fire a nd Haze, the cost of catastrophe. The Institute of Southeast Asian Studies (ISEAS): 22 50.
Shen, H., Huang, Y., Wang, R., Zhu, D., Li, W., Shen, G., Wang, B., Zhang, Y., Chen, Y., Lu, Y., Chen, H., Li, T., Sun, K., Li, B., Liu, W., Liu, J. and Tao, S. (2013) Global atmospheric emissions of polycyclic aromatic hydrocarbons from 1960 to 2008 and future predictions. Environmental Science and Technology 47: 6415 6424.
Siao, W. S., Balasubramanian, R., Rianawati, E., Karthikeyan, S., and Streets, D. G. (2 007) Characterization and source apportionment of particulate matter ≤ 2.5 µm in Sumatra, Indonesia, during a recent peat fire episode. Environmental Science and Technology 41, 3488 3494.
Suarez, M. J., and P. S. Schopf. 1988. A delayed action oscillator f or ENSO, J. Atmos. Sci., 45: 3283 3287.
Sulaiman, A.H. (2007) Flood and drought management in Malaysia. Speech presented at National Seminar on Socio Economic Impact of Extreme Weather and Climate Change, organised by the Ministry of Science, Technology an d Innovation, Putrajaya, Malaysia. 21 22 June.
Sulaiman, A.H. and Zainal Abidin, M.R. (2012) Impacts of climate change on coastal resources. Paper presented at National Conference on Extreme Weather and Climate Change: Understanding Science and R&D Capacity Needs (October).
Suyanto, S., Applegate, G., Permana, R.P., Khususiyah N. and Kurniawan, I. (2004) ‘The role of fire in changing land use and livelihoods in Riau Sumatra’. Ecology and Society 9: 15.
Tacconi, L. (2003) Fires in Indonesia : Causes, Costs and Policy Implications. CIFOR Occasional Paper No. 38 . Centre for International Forest Research, Bogor, Indonesia.
Tangang F, Juneng L, Salimun E, Kwan MS, Loh JL.2013. Projected Precipitation Changes over Malaysia by the End of the 21 st C entury Using PRECIS Regional Climate Model, Climate Change and Island and Coastal Vulnerability 2013, pp. 3 20, Springer.
90
Tangang, F., Latif M.T. and Juneng, L. (2010) The roles of climate variability and climate change on smoke haze occurrences in Southea st Asia region. [http://www2.lse.ac.uk/IDEAS/publications/reports/pdf/SR004/NUM.pdf ]
Tangang, F., M.T. Latif and L. Juneng. 2010. The roles of climate variability and climate change on smoke haze occurrences in Southeast Asia region. http://www2.lse.ac.u k/IDEAS/publications/reports/pdf/SR004/NUM.pdf.
Tangang, F.T. 2001. Low frequency and quasi biennial oscillations in the Malaysian precipitation anomaly. International Journal of Climatology 21 : 1199 1210.
Tangang, F.T. and L. Juneng. 2004. Mechanism of Ma laysian rainfall anomalies. J. Climate 17 : 3615 3621.
Tangang, F.T ., B. Tang, A.H. Monahan, and W.W. Hsieh (1998b). Forecasting ENSO events: a neural network extended EOF approach, Journal of Climate , 11(1):24 41.
Tangang, F.T., E. Salimun, L. Juneng. P. N. Vinayachandran. K.S. Yap, C.J.C. Reason, S.K. Behera and T. Yasunari. 2008. On the roles of northeast cold surge, the Borneo vortex, the Madden Julian oscillation and the Indian ocean dipole during the worst 2006/2007 flood Peninsular Malaysia. Journal of Geophysical Research 35 :l14S07. DOI:10.1029/2008Gl033429.
Tangang, F.T. , L. Juneng and S. Ahmad. 2007. Trend and interannual variability of temperature in Malaysia: 1961 2002. Theoretical and Applied Climatology, 89:127 141.
Tangang, F.T ., W.W. Hsieh, a nd B. Tang (1997). Forecasting the equatorial sea surface temperatures by neural network models, Climate Dynamics , 13:135 147.
Tangang, F.T ., W.W. Hsieh, and B. Tang (1998a). Forecasting regional sea surface temperatures of the tropical Pacific by neural n etwork models, with wind stress and sea level pressure as predictors , Journal of Geophysical Research , 103(C4):7511 7522.
Tawang, Ariffin and Tengku Ahmad, Tengku Ariff (2003) Stabilization of upland agriculture under El Niño induced climatic risks: Regional and farm level risk management and coping mechanisms in the Kedah Perlis Region, Malaysia. CGPRT Centre Working Paper N o. 70. http://ageconsearch.umn.edu/bitstream/32695/1/wp030070.pdf.
Tawang, Ariffin and Tengku Ahmad, Tengku Ariff (2003) Stabilization of upland agriculture under El Niño induced climatic risks: Regional and farm level risk management and coping mechanisms in the Kedah Perlis Region, Malaysia. CGPRT Centre Working Paper No. 70. http://ageconsearch.umn.edu/bitstream/32695/1/wp030070.pdf.
Tawang, Ariffin, Tengku Ahmad, Tengku Ariff and Abdullah, Mohd Yusof (2002) Stabilization of upland agriculture under El Nino induced climatic risk: impact assessment and mitigation measures in Malaysia, Working Paper No. 61, Bogor, Indonesia: CGPRT Centre. http://ageconsearch.umn.edu/bitstream/32667/1/wp020061.pdf.
Tawang, Ariffin, Tengku Ahmad, Tengku Ariff and Abdullah, Mohd Yusof (2002) Stabilization of upland agriculture under El Nino induced climatic risk: impact assessment and mitigation measures in Malaysia, Working Paper No. 61, Bogor, Indonesia: CGPRT Centre. http://ageconsearch.umn.edu/bitstream/32667/1/wp02006 1.pdf.
TEEB (2010a), The Economics of Ecosystems and Biodiversity Ecological and Economic Foundations. Edited by Pushpam Kumar. Earthscan, London and Washington. http://www.teebweb.org/our publications/teeb study reports/ecological and economic foundations /
TEEB (2010b) The Economics of Ecosystems and Biodiversity: Mainstreaming the Economics of Nature: A Synthesis of the Approach, Conclusions and Recommendations of TEEB. http://doc.teebweb.org/wp content/uploads/Study%20and%20Reports/Reports/Synthesis%20re port/TEEB%20Synthesis%20Report %202010.pdf.
91
Thompson, A.M., Witte, J.C., Hudson, R.D., Guo, H., Herman, J.R., Fujiwara, M. (2001) Tropical tropospheric ozone and biomass burning, Science, 291, 2128 2132.
Ummenhofer, C.C., D’Arrigo, R., Anchukaitis, K., Buckley, B.M., Cook, E.R. (2013) Links between Indo Pacific climate variability and drought in the Monsoon Asia Drought Atlas. Climate Dynamics, 40 (5), 1319 1334.
UNDP (United Nations Development Programme). 2011. Mainstreaming drought risk management. A primer. [http://www.undp.org/content/dam/undp/library/Environment%20and%20Energy/sustainable%20land% 20management/Mainstreaming%20DRM English.pdf ] . Last accessed on 05 November 2015.
UNESCAP (2013) Shifting from quantity to quality: Growth with equality, efficiency, sustainability and dynamism. United Nations Economic and Social Commission for Asia and the Pacific (UNESCAP), Bangkok, Thailand. http://www.unescap.org/sites/default/files/FINAL%20Q2Q%20Shifting%20from%20quantity%20ESCAP26 75_JP.pdf.
UNESCAP (2014) UN initiative strengthens drought monitoring and early warning in Asia Pacific. Press Release Issued on 1 July 2014. News Number: G/22/2014. United Nations Economic and Social Commission for Asia and the Pacific (UNESCAP), Bangkok, Thailand. http://www.unescap.org/news/un initiative strengthens drought monitoring and early warning asia pacific.
UNESCAP (2015a) Asia Pacific Disaster Report 2015 Disaster Without Borders . United Nations Economic and Social Commission for Asia and the Pacific (UNESCAP). ST/ESCAP/2730.
UNESCAP (2015b) El Niño 2015/2016. Impact Outlook and Policy Implications. Advisory Note December 2015. United Nations Economic and Social Commission for Asia and the Pacific (UNESCAP), Bangkok.
UNISDR (2003) Drought Living with Risk: An Integrated Approach to Reducing Societal Vulnerability to Drought ”; United Nations International Strategy for Disaster Reduction (UNISDR), Geneva, Switzerland, 2003.
UNISDR (2007). Drought Risk Reduction Framework and Practices: Contri buting to the Implementation of the Hyogo Framework for Action. United Nations International Strategy for Disaster Reduction (UNISDR), Geneva, Switzerland.
United Nations (2012) The Future We Want: Rio+20 Outcome Document. https://sustainabledevelopment.un.org/futurewewant.html http://www.un.org/ga/search/view_doc.asp?symbol=A/RES/66/288&Lang=E.
United Nations (2015) Transforming Our World the 2030 Agenda for Sustainable Development. A/RES/70/1. United Nations. Resolutio n adopted by the General Assembly on 25 September 2015. https://sustainabledevelopment.un.org/content/documents/21252030%20Agenda%20for%20Sustainable %20Development%20web.pdf.
UNU (United Nations University) (2000) Lessons Learned from the 1997 98 El Nino: Once Burned, Twice Shy?.A UNEP/NCAR/UNU/WMO/ISDR Assessment. October 2000. Japan: UNU. http://www.unisdr.org/files/1864_VL102131.pdf.
von Hoyningen Huene, W., Schmidt, T., Schienbein, S., Kee, C. A., and Tick, L. J. (1999). Climate relevant aero sol parameters of South East Asian forest fire haze. Atmospheric Environment 33, 3183 3190.
Wang C. and Picaut J. 2004. Understanding ENSO physics a review. Geophysical Monograph Series 147: 21 48.
Wang, B., R. Wu and T. Li. 2003. Atmosphere warm ocean i nteraction and its impacts on Asian Australian monsoon variation. J. Climate 16 : 1195 1211.
WCMC (World Conservation Monitoring Centre) (1992) Global Biodiversity: Status of the Earth's living resources. Chapman & Hall, London, xx I 594.
92
Weisberg, R. H., and C. Wang. 1997. A western Pacific oscillator paradigm for the El Niño Southern Oscillation, Geophys. Res. Lett., 24, 779 782.
WHO (World Health Organization). 1998. Dengue and Dengue Haemorrhagic Fever in Malaysia. [http://www.who.int/csr/don/1998_04_15 /en/]. Last accessed on 23 October 2015.
WHO. 1999. El Niño and Health. Protection of the Human Environment Task Force on Climate and Health. Geneva, Switzerland: WHO.
Wilhite, D.A, and V.K. Mannava and R. Pulwarty. 2014. ‘Managing drought risk in a changi ng climate: The role of national drought policy’. Weather and Climate Extremes 3: 4 13.
Wilhite, D.A., Sivakumar, M.V.K. and Pulwarty, R. (2014) Managing drought risk in a changing climate: The role of national drought policy. Weather and Climate Extr emes 3, 4 13. http://www.sciencedirect.com/science/article/pii/S2212094714000164.
Wilkinson C (ed) (1998) Status of coral reefs of the world: 2000. Australian Institute of Marine Science, Townsville, Queensland, Australia.
World Bank (2007) Executive Summary: Indonesia Climate Change Working Paper on Current Status and Policies. Prepared by Pelangi Energi Abadi Citra Enviro (PEACE), Indonesia. http://siteresources.worldbank.org/INTINDONESIA/Resources/226271 1170911056314/3428109 1174614780539/PEACECl imateChange.pdf.
WWF (World Wide Fund for Nature) and University of Queensland, Australia. 2009. ‘The Coral Triangle and climate change: Ecosystems, people and societies at risk’. A comprehensive study involving over 20 experts and based on 300 peer review ed scientific articles. Sydney, NSW Australia: WWF Australia.
Zebiak, S.E. and M.A. Cane. 1987. A Model El Niñ Southern Oscillation. Monthly Weather Review 115 (10): 2262 2278.
93
Appendices
Appendi x 1: List of ministries and experts contacted for the First Task Force meeting held on 18 September 2014. Those highlighted in yellow attended the meeting.
KeTTHA
YBhg Datuk Loo Took Gee
Secretary General Secretary General Office Ministry of Energy, Green Technology and Water, Block E4/5 Parcel E, Federal Government Administrative Centre, 62668 Putrajaya Malaysia
Tel : 03 8883 6363 Fax : 03 8889 3177 Email : LooTG@kettha.gov.my
Malaysia Meteorological Dept
YBhg Dato' Che Gayah Ismail Ketua Pengarah
Malaysian Meteorological Department Jalan Sultan, Petaling Jaya, Selangor. Tel : 03 7967 8001 Fax : 03 7955 0964 Email : cgayah@met.gov.my
En. Ahma Zaki Mohd. Saad Tel: 013 3680451 Email: ahmzaki@met.gov.my
MARDI
Ybhg Dato' Dr Sharif Haron Ketua Pengarah Institut Penyelidikan dan Kemajuan Pertanian Malaysia (MARDI), Persiaran MARDI UPM, 43400 Serdang, Selangor. Tel : 03 8943 7002 / 019 314 6477 Fax : 03 8948 3664 Email : sharifh@mardi.gov.my
En Tapsir Serin
Deputy Director of Economic Research and Technology Management Tel : 016 7850891 Email : tapsir@mardi.gov.my
Ministry of Agriculture
YBhg Dato' Mohd Arif Bin Ab Rahman Ketua Setiausaha Pejabat Ketua Setiausaha/Timbalan Ketua Setiausa ha Ministry Of Agriculture & Agro Based Industry Malaysia
Aras 15, Menara, 4G1, Wisma Tani, No.28 Persiaran Perdana, Presint 4, Pusat Pentadbiran Kerajaan Persekutuan, 62624 Putrajaya Malaysia Phone : 03 8870 1014 Fax : 03 8888 0181 Email : arif@moa.gov.my
NAHRIM
Ir Hj Ahmad Jamalluddin Shaaban Ketua Pengarah Institut Penyelidikan Hidraulik Kebangsaan Malaysia (NAHRIM), Kementerian Sumber Asli dan Alam Sekitar (NRE)
Lot 5377, Jalan Putra Permai, 43300 Seri Kembangan Selangor, Malaysia Email : ahmadj@nahrim.gov.my Tel : 03 8947 6599 (P.A) Fax : 03 8948 3044
Hj. Zubaidi bin Johar Tel : 012 2603465 Email : zubaidi@nahrim.gov.my
MPOB
YBhg Datuk Dr Choo Yuen May Director General Malaysian Palm Oil Board (MPOB) 6, Persiaran Institusi, Bandar Baru Bangi 43000 Kajang Selangor, P.O. Box 10620 50720 Kuala Lumpur Tel : 03 8769 4207/03 8769 4547 Email : choo@mpob.gov.my Fax : 03 8925 9446
Dr Mohd Hanif Harun Head of Tropical Peat Research Institute Tel : 017 3199561 Email : mhaniff@mpob.gov.my
Ayatollah Ab. Rahman Researcher Tel : 012 7305281 Email : ayat@mpob.gov.my DoF
94
Professor Dr Fredolin Tangang FASc School of Environmental & Natural Resource Sciences
Faculty of Science and Technology Universiti Kebangsaan Malaysia, 43600 Bangi, Selangor. (M): 6019 2718986 (O): 03 89213826 Fax: 03 89253357
Dr Hezri Adnan Director, Technology, Innovation, Environment and Sustainability
Institute of Strategic and International Studies (ISIS) Malaysia No. 1, Persiaran Sultan Salahuddin P O Box 12424, 50778 Kuala Lumpur. Email : hezriadnan@isis.org.my Tel : 03 2693 9366 Fax : 03 2691 5435
YBhg Dato' Ahamad Sabki Mahmood Ketua Pengarah Department of Fisheries Malaysia Wisma Tani, Level 6, Blok Menara 4G2, Precinct 4 62628 Putrajaya Tel : 03 8889 5855 Fax : 03 8889 2460 Email : ahamadsabki@dof.gov.my
YBhg Dato' Dr Dionysius S.K. Sharma D.P.M.P. Executive Director/ Chief Executive Officer WWF Malaysia 1 Jalan PJS 5/28A Petaling Jaya Commercial Centre (PJCC) 46150 Petaling Jaya Selangor, Malaysia Tel : +603 7450 3773 Fax : +603 7450 3777 Email : contactus@wwf.org.my
Dr Sundari Ramakrishna Conservation Director Tel : 017 2745647 Email : sramakrishna@wwf.org.my
Abul Quasem Al Amin, PhD Associate Professor International Business School (IBS) Universiti Teknologi Malaysia (UTM) Level 11, Menara Razak Jalan Semarak 54100 Kuala Lumpur MALAYSIA
Email: abulquasem@ibs.utm.my Tel: +603 2180 5045
MOH
YBhg Datuk Farida Mohd Ali Ketua Setiausaha Kementerian Kesihatan Malaysia Blok E1, Kompleks E, Pusat Pentadbiran Kerajaan Persekutuan, 62590 Putrajaya Tel no. : 03 8883 2539 Fax no. : 03 8888 6187 E mel : farida@moh.gov.my (U/P: Dr Hj Daud bin Abdul Rahim, Bahagian Kawalan Penyakit)
Nor Azian Binti Haji Abd. Rahim Pembantu Khas K etua Setiausaha Tel no. : 03 8883 2539 E mel : norazian.ar@moh.gov.my
MOSTI
YBhg Dato’ Sri Dr Noorul Ainur binti Mohd. Nur Ketua Setiausaha
Kementerian Sains, Teknologi dan Inovasi Pusat Pentadbiran Kerajaan Persekutuan 62662 Putrajaya
Malaysia (U/P: SUB Dana) Faks: 03 8888 9000
Kamel bin Mohamad
Under Secretary of Strategic Planning Section
Tel: 03 8885 8019 019 2707545
Email: kamel@mosti.gov.my
YBhg Dato' Dr Yap Kok Seng FASc 26, Jalan Kasawari 7 Puchong Jaya Puchong Selangor 46667 (M): 019 3801367 (E): yapks1954@gmail.com
95
Mareena Binti Mahpudz
Deputy Under Secretary of Strategic Planning
Section
Tel: 012 323 7758
Email : mareena@mosti.gov.my
Dr Liew Ju Neng
Pensyarah Kanan
Pusat Pengajian Sains Sekitaran & Sumber Alam
Universiti Kebangsaan Malaysia
Tel. : +603 8921 5870 Mobile : +6017 212 5151 Email : juneng@ukm.edu.my
Professor Dr Mastura Mahmud Head of Earth Observation Centre (EOC)
Universiti Kebangsaan Malaysia
43600 UKM Bangi, Selangor Tel : 03 8921 5672 Email : mastura@ukm.my
Prof Dr Khairulmaini Bin Osman Salleh
Department of Geography
Faculty of Arts and Social Sciences
University of Malaya, 50603 Kuala Lumpur Tel : 03 7967 5699 Fax : 03 7967 5457 Email : khairulmaini@gmail.com/khairulo@um.edu.my
Prof Dr Mohd Talib Latif Universiti Kebangsaan Malaysia 43600 UKM Bangi, Selangor MALAYSIA
Phone : 03 8921 3822 Fax : 03 89253357 Email : talib@ukm.my
Professor Dr Soh Aik Chin FASc BiomassPlus Research Programme Director Crops For the Future Research Centre Level 2 Block B, The University of Nottingham, Malaysia Campus, Jalan Broga, 43500 Semenyih, Selangor. Tel : 019 2873441 Fax : 03 8924 8798 Email : soh.aikchin@cffresearch.org / sohac28@gmail.com
Professor Dr Sue Walker CropBase Programme Director Crops For the Future Research Centre Level 2 Block B, The University of Nottingham, Malaysia Campus, Jalan Broga, 43500 Semenyih, Selangor. Tel : 019 3935076 Fax : 03 8924 8798 Email : sue.walker@cffresearch.org
Dr Sharifah Munirah Alatas
Senior Lecturer
Strategic Studies and International Relations Program
Center for History, Politics and Strategy
Faculty of Social Sciences and Humanities
National University of Malaysia
43600 UKM Bangi, Selangor, Malaysia
Tel : 603 8921 3264 (Office) 60 19 298 1596 (Mobile) Fax : 603 8921 3290 Email : peanutminat@gmail.com
Dr Fatimah Kari Faculty of Economics and Administration, University Malaya, 50603 Kuala Lumpur, Malaysia Tel : 79673661 E mail : fatimahkari@gmail.com
96
Appendix 2. Drought Risk Reduction Framework
Element 1: Policy and governance

Based on local needs, community participation and political commitment, networks and mechanisms and resource availability. In addition to national and state/provincial drought policies, increased importance has also been placed on local/community level drought policy and planning, emphasizing self reliance and drought resilience.
The development of national and local strategies for reducing drought risk, together with the implementation of such a strategy, should be guided by the following principles:
1. Political commitment, high level engagement, strong institutional setting, clear responsibilities both at central and local levels and appropriate governance are essential for integrating drought risk issues into a sustainable development and disaster risk reduction process.
2. A bottom up approach with effective decentralization and active community participation for drought risk management in planning, decision making and implementation, is essential to move from policy to practice.
3. Capacity building and knowledge development are usually required to help build political commitment, competent institutions and an informed constituency.
4. Drought risk reduction policies should establish a clear set of principles or operating guidelines to govern the management of drought and its impacts, including the development of a preparedness plan that lays out a strategy to achieve these objectives.
5. Drought related policies and plans should emphasize risk reduction (prevention, mitigation and preparedness) rather than relying solely on drought (often turned into famine) relief;
6. Drought monitoring, risk assessment and other appropriate risk reduction measures are principal components of drought policies and plans.
7. Institutional mechanisms (policy, legislative and organizational) should be developed and enforced to ensure that drought risk reduction strategies are carried out.
8. Sound development of long term investment in risk reduction measures (prevention, mitigation and preparedness) is essential to reduce the effects of drought.
Element 2: Drought risk identification, risk monitoring and early warning
A starting point for promoting a culture of resilience in combination with enhancing knowledge about hazard occurrence, the potential effects of the hazard, and the related vulnerabilities of potentially affected people and activities. Risk assessment methodologies such as hazard assessment, drought impact assessment and vulnerability analysis will be useful in order to better understand specific trends, vulnerability and impacts of drought for specific drought prone areas. It is recommended that common methodologies for defining and assessing risks as well as appropriate drought hazard and vulnerability indicators be developed to meet specific local needs. Enhancing drought monitoring and early warning capacities is also crucial.
Drought risk identification, impact assessment, and early warning activities should be guided by the following principles:
1. Drought risk is the combination of the natural hazard and the human, social, economic and environmental vulnerability of a community or country, and managing risk requires understanding these two components and related factors in space and time.
2. Increasing individual, community, institutional and national capacities is essential to reducing vulnerability to drought impact.
3. Impact assessment plays an important role in drought risk management, in particular, identifying most vulnerable groups and sectors during drought.
4. Drought monitoring and early warning systems play an important role in risk identification, assessment and management.
5. Changing climate and the associated changing nature of drought poses a serious risk to the environment, hence to sustainable development and the society.
97
Element 3: Drought awareness, knowledge management and education
Another enabling factor for drought risk reduction. Collection, compilation, and dissemination of relevant knowledge and information on hazards, vulnerabilities, and capacities should be linked to community drought risk reduction awareness campaigns, programmes, and projects. Interaction between the generators and users of information is essential for developing useful messages and helping to ensure the use of the information. Education for disaster risk reduction is an interactive process of mutual learning among people and institutions which also involves traditional wisdom and local knowledge. Various educational programmes that focus on drought risk reduction exist in addition to general programmes on DRR.
In general, drought awareness and knowledge management activities should be guided by the following principles:
1. The effects of drought can be substantially reduced if people are well informed and motivated toward a culture of disaster prevention and re silience.
2. Effective information management and exchange requires strengthening dialogue and networks among disaster researchers, practitioners, and stakeholders in order to foster consistent knowledge collection and meaningful message dissemination.
3. Public awareness programmes should be designed and implemented with a clear understanding of local perspectives and needs, and promote engagement of the media to stimulate a culture of disaster resilience, including resilience to drought and strong community involvement.
4. Education and training are essential for all people in order to reduce local drought risk
Element 4: Reducing underlying factors of drought risk

Will also contribute to reducing drought vulnerability. These risk factors can be reviewed and reduced by effective environmental and natural resource management, social and economic development practices, and land use planning and other technical measures. These factors that have an impact on vulnerability to drought need to be reflected in national poverty reduction strategies, development plans, sector development planning and programmes, and environment and natur al resource management strategies as well as in post disaster situations so that effective preparedness and mitigation measures can be considered.
The guiding principles are:
1. Mechanisms should be in place to systematically bring together practitioners in disaster risk reduction (e.g., national platform members) and key institutions involved in environmental management (e.g., adaptation to climate change, desertification and biodiversity).
2. Areas of overlap and synergy should be identified between existing environmental programmes and disaster risk reduction activities.
3. A mechanism for carrying out joint assessments should be institutionalised to integrate disaster risk reduction and environmental protection parameters (e.g., integrated risk and environmental impact assessments).
4. Specific attention should be given to socio economic high risk factors such as age, disabilities, social disparities and gender. By focusing on protection of the most vulnerable groups, the impacts of disasters can be reduced.
5. Post drought recovery planning can incorporate drought risk reduction strategies for the future.
6. Safety nets such as insurance mechanisms for properties as well as microcredit and financing for ensuring minimum livelihood means can accelerate post drought recovery process.
98
Element 5: Enhancing mitigation measures and preparedness for drought
Substantially reduce drought impacts and losses if authorities, individuals, and communities are well prepared, ready to act, and equipped with the knowledge and capacities for effective drought management. It should be recognized that mitigation and preparedness have a greater impact on reducing the scale and effects of drought disasters than ad hoc emergency response measures.
The guiding principles are:
1. Prevention, mitigation and preparedness are central components of disaster risk reduction, and are more important than relying solely on ad hoc emergency response measures.
2. Dialogue, exchange of information, and coordination are needed between disaster risk reduction, development and emergency management actors.
3. The selection of appropriate drought risk reduction (prevention, mitigation and preparedness) measures requires many considerations, such as integrated environmental and natural resource management, social and economic development, land use planning opportunities, and climate change adaptations.
4. A combination of top down and bottom up approaches is required for development and implementation of effective mitigation and preparedness measures.
5. Institutional capacity, coordinated mechanisms, identification of local needs and indigenous knowledge are required to implement effective mitigation and preparedness strategies.
6. Monitoring and early warning are key elements of disaster risk reduction and must be closely linked to other risk reduction actions.
7. Drought risk reduction (prevention, mitigation and preparedness) requires a long term commitment of resources.
Source: UNISDR (2007)

99
