

OCTOBER 2024

OCTOBER 2024
OCTOBER 2024
A Partnership between Rhodium Group and the Atlantic Council GeoEconomics Center
ISBN: 978-1-61977-502-2

Atlantic Council
GEOECONOMICS CENTER

China Pathfinder is a joint initiative from the Atlantic Council’s GeoEconomics Center and Rhodium Group that measures China’s economic system relative to advanced market economy systems. Few people, even within the circle of China experts, seem to agree about the country’s economic system, where it is headed, or what that means for the world. This initiative aims to shed light on whether the Chinese economic system is converging with or diverging from open market economies. Over the course of two decades, China has risen from the world’s sixth-largest economy, with a gross domestic product (GDP) of $1.2 trillion in 2000, to the second largest, boasting a GDP of $17.95 trillion in 2022. China now intersects with the interests of all nations, businesses, and individuals. With China’s past and future systemic choices impacting the world in both positive and negative ways, it is essential to understand its global footprint. The hope is that China Pathfinder’s approach and findings can fill in some of the missing puzzle pieces in this ongoing debate—and, in turn, inform policymakers and business leaders seeking to understand China.
The Atlantic Council is a nonpartisan organization that galvanizes US leadership and engagement worldwide, in partnership with allies and partners, to shape solutions to global challenges. By informing its network of global leaders, the Atlantic Council provides an essential forum for navigating the economic and political changes defining the twenty-first century. The Atlantic Council shapes policy choices and strategies to create a more free, secure, and prosperous world through the papers it publishes and the ideas it generates.
Rhodium Group is a leading independent research provider. Rhodium Group has one of the largest China research teams in the private sector, with a consistent track record of producing insightful and path-breaking analysis. Rhodium China provides research, data, and analytics to the private and public sectors that help clients understand and anticipate changes in China’s macroeconomy, politics, financial and investment environment, and international interactions.
Authors
This report was produced by Rhodium Group’s China team in collaboration with the Atlantic Council’s GeoEconomics Center. The principal contributors on Rhodium’s team were Daniel H. Rosen, Matthew Mingey, Charles Austin Jordan, and Laura Gormley. The principal contributors from the Atlantic Council’s GeoEconomics Center were Josh Lipsky, Jeremy Mark, Sophia Busch, and Benjamin Lenain.
The authors wish to acknowledge a superb set of colleagues and fellow analysts who helped us strengthen the study in group review sessions and individual consultations. These individuals took the time, in their private capacity, to critique the indicators and analysis in draft form; offer suggestions, warnings, and advice; and help us to ensure that this initiative makes a meaningful contribution to public debate.
The authors also wish to acknowledge the members of the China Pathfinder Advisory Council: Steven Denning, Gary Rieschel, and Jack Wadsworth, whose partnership has made this project possible.
This report is written and published in accordance with the Atlantic Council’s intellectual independence policy.1 The authors are solely responsible for its analysis and recommendations. The Atlantic Council, Rhodium Group, and its donors do not determine, nor do they necessarily endorse or advocate for, any of this report’s conclusions. This report is published in conjunction with an interactive data visualization toolkit, at http://chinapathfinder.org/. Future quarterly and annual updates to the China Pathfinder Project will be published on the website listed.
1 The Atlantic Council and its staff, fellows, and directors generate their own ideas and programming, consistent with the Atlantic Council’s mission, their related body of work, and the independent records of the participating team members. The Atlantic Council as an organization does not adopt or advocate positions on particular matters. The Atlantic Council’s publications always represent the views of the author(s) rather than those of the institution.
The Atlantic Council maintains strict intellectual independence for all of its projects and publications. Atlantic Council staff, fellows, and directors and those who the Atlantic Council engages to work on specific projects, are responsible for generating and communicating intellectual content resulting from council projects. The Atlantic Council requires all donors to agree to the council maintaining independent control of the content and conclusions of any products resulting from sponsored projects. The Atlantic Council also discloses sources of financial support in its annual reports to ensure transparency.
Can China’s economic system be compared to the world’s largest and most open advanced economies? Four years ago, when we began the China Pathfinder Project, the teams from Rhodium Group and the Atlantic Council GeoEconomics Center set out to answer that question.
In the intervening years, the global economy navigated a pandemic, supply chain shocks, the highest inflation in forty years in the United States, and the return of industrial policy across the Group of Seven and beyond.
That means today’s economic landscape is far different from the one we set out to explore. What began as an effort to create a shared language for understanding China’s economic trajectory—and benchmark its movement toward or away from open market economy norms—has evolved into a project that is trying to understand what it means to be an open market economy in the 2020s.
At the beginning of the project, policymakers and financial leaders in the West still viewed the Chinese economy with cautious optimism. Despite growing tensions between Beijing and Washington during the trade wars of the last decade, China had made modest progress toward market economy norms.
It was an open question whether China would continue that progress. Four years later, we all know the answer. The Chinese economy has shifted away from market norms. But how the movement happened is just as important as the top line.
In nearly every area we have tracked—financial system development, market competition, innovation, trade, and direct and portfolio investment—China’s progress has stalled or, in some cases, backslid. The initial hope that China would adopt more transparent and marketoriented policies has given way to a reality in which systemic state intervention and opaque decisionmaking dominate.
The lack of clarity around China’s decision-making is now seen as a source of global economic risk. The Chinese Communist Party’s growing role in the economy stifles the private sector’s dynamism and fosters a dangerous environment of uncertainty for investors. The decline of the property sector and the correlated focus on manufacturing have raised alarm bells worldwide about a second China trade shock.
Look more closely at China Pathfinder, and you’ll uncover another layer of the story. Like a scientist who begins with one experiment but discovers in the lab that her antibiotic actually treats another disease, the China Pathfinder Project has revealed unexpected outcomes.
China’s prioritization of national security over economic growth has frozen most reform efforts. But what about the world’s advanced economies? Many have begun pursuing a range of policies based on the concept of economic statecraft, which, in our rankings, move their scores further away from open market norms.
This is the value of a data-driven approach to China’s economy. Instead of trying to calibrate policy based on officials’ statements, or one-off events, our method was to be comprehensive, objective, and focused on longterm trends.
All eyes will be on the US presidential election in the coming weeks. The next administration will develop a range of policies to grapple with China on trade, technology, Taiwan, and more. What kind of economic system will they be dealing with? As you will see in the following pages, China Pathfinder helps tell that story.
What has surprised us the most in this process is how universally translatable the story is. These reports have been used by economists from West Point to Warsaw. Whether in London, Paris, Tokyo, or Beijing, you will find China Pathfinder now referenced in your government’s own economic assessments.
And, so, the answer to the question we set out to explore is clear. Is it possible to compare China’s system to the world’s advanced economies? Yes. And it is necessary work.
We are grateful to the teams at the Atlantic Council and Rhodium Group, whose tireless work and dedication made this project possible. We extend our thanks to the policymakers, business leaders, and academics who engaged with and provided feedback on this research. As we close this chapter of China Pathfinder and look forward to the next evolution of the project, we hope that the lessons from China Pathfinder will continue to help policymakers navigate a rapidly changing global economy.
Josh Lipsky Senior Director Atlantic Council GeoEconomics Center
The current cycle of China Pathfinder is coming to a close at a critical time for China’s economy. After delaying major policy moves in 2023, China announced a major slate of reforms at the long-awaited Third Plenum of the Chinese Communist Party in July 2024. It faces enormous challenges: 2023 saw lackluster growth, continued property sector woes, and growing foreign pushback against manufacturing overcapacity and the treatment of foreign firms. China’s reform experience in 2023 and its successes and failures set the stage for the new reforms.
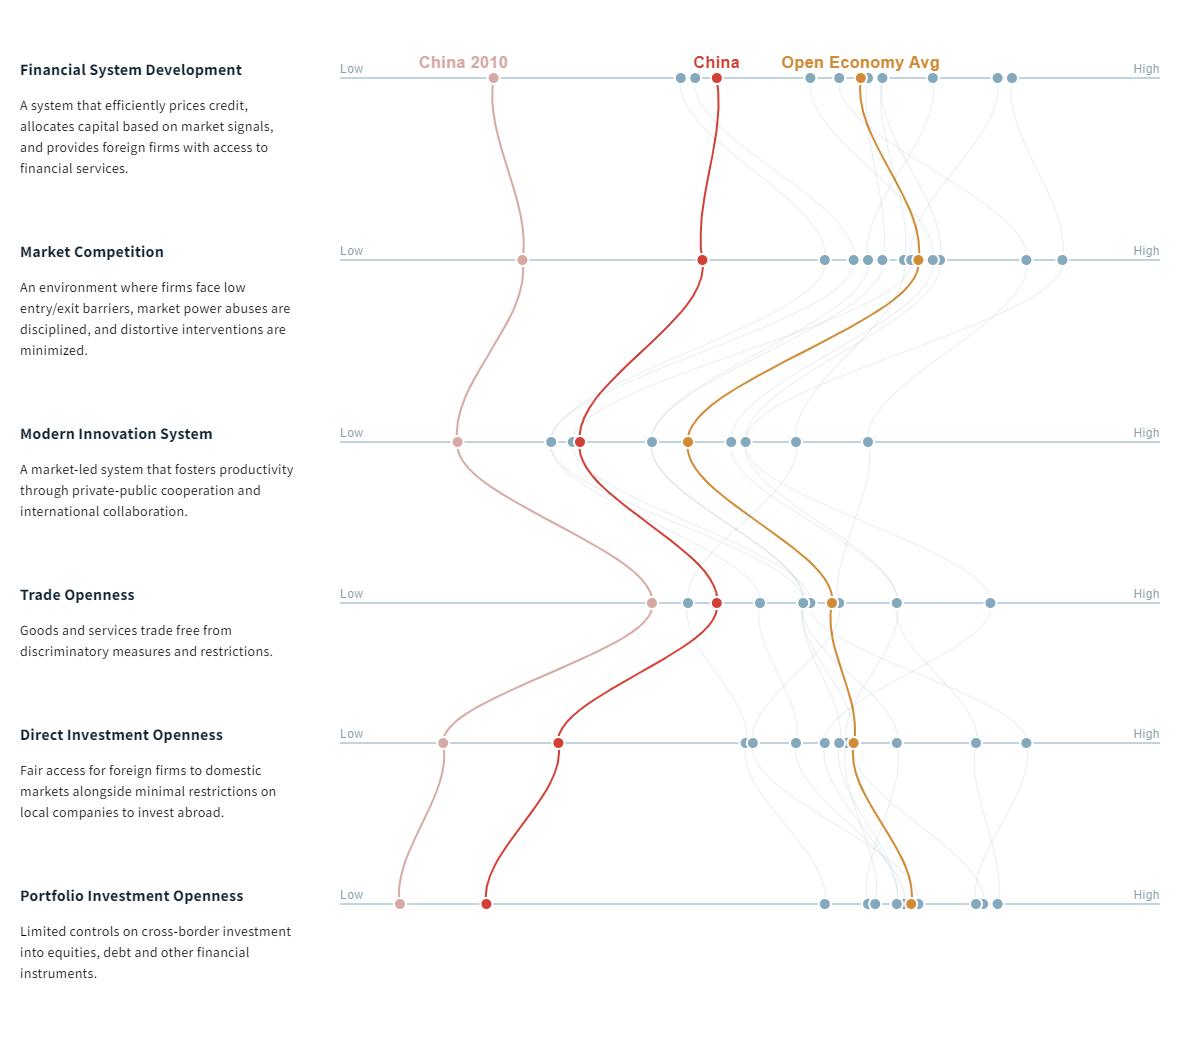
To track Beijing’s reform efforts to date, China Pathfinder compares China’s economic system to those of market economies. Using six components of the market model—financial system development, market competition, modern innovation system, trade openness, direct investment openness, and portfolio investment openness—we established a quantitative framework for understanding China’s progress or regression on reform. China’s outsized role in the global economy and the necessity of reform to maintain the country’s growth make this work key to understanding China’s future trajectory.
Key findings
● Compared to its own 2010 baseline, China has improved. In all of the clusters analyzed by China Pathfinder, China has narrowed the gap with the Organisation for Economic Co-operation and Development (OECD). However, further progress has been elusive, and our indicators suggest China has hit limits on convergence with the OECD. This gap will likely remain in the coming years.
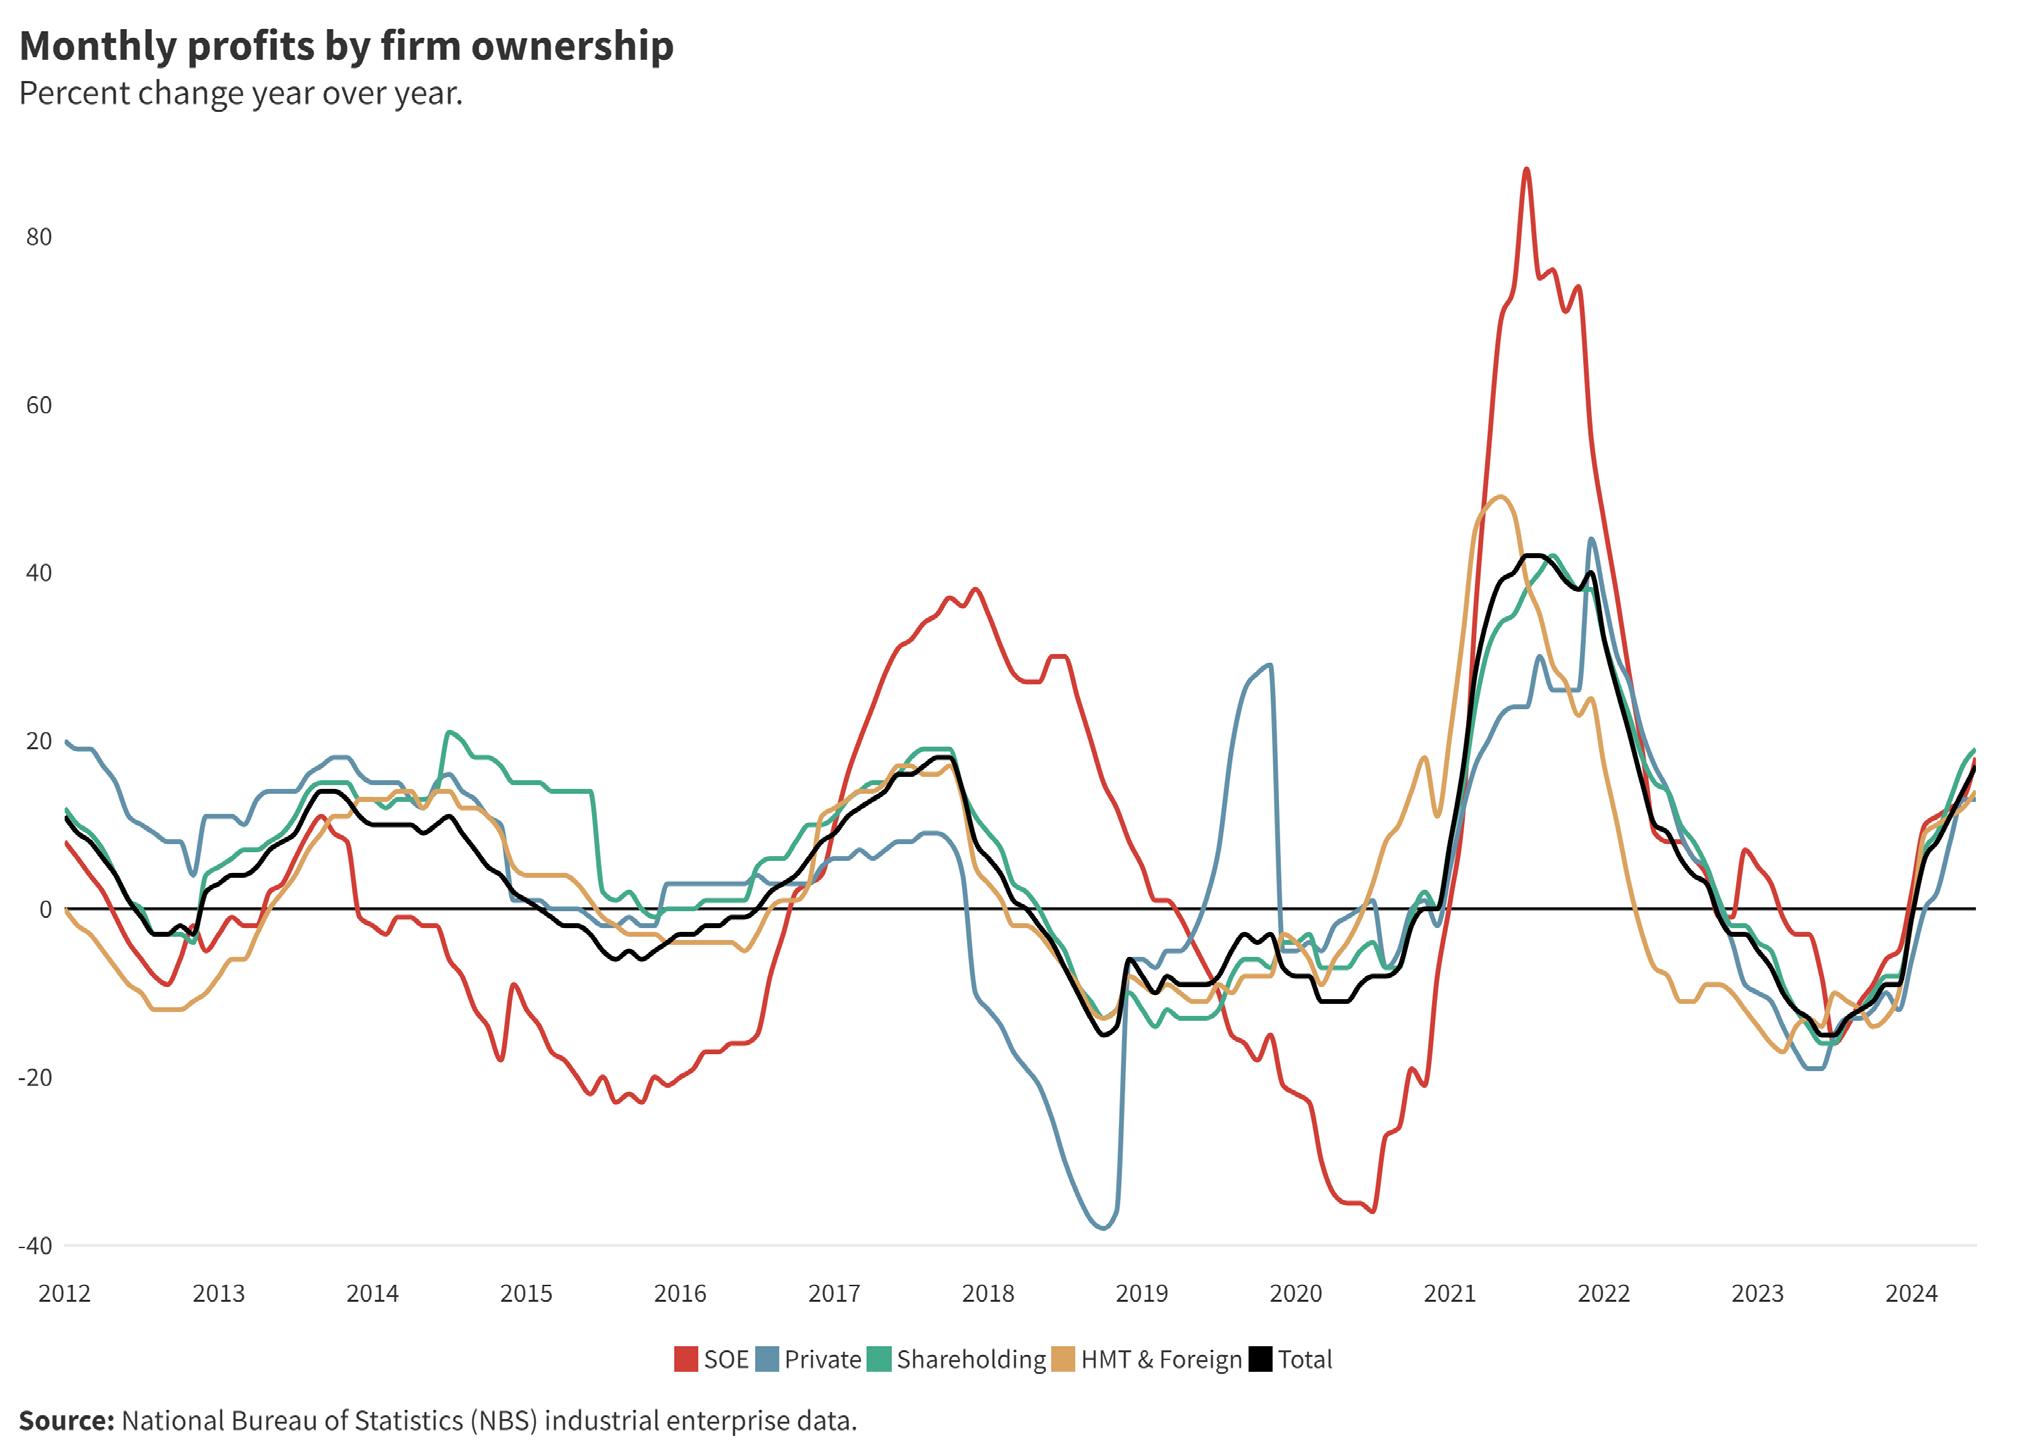
● In market competition—especially seen in the presence of state-owned enterprises in the economy, but also more broadly—China is unwilling to make the concessions to the traditional role of the state in its economy necessary to achieve more durable structural reform.
● China’s progress stalled in several areas tracked by China Pathfinder. These include innovation, as China’s fiscal constraints began to have a meaningful impact on its technological and development capacity by some metrics. They also include trade, where security concerns and geopolitics (including uncertainty over data and security rules) weigh on China’s trade openness. Even as China exported more and more in 2023 and became increasingly important for marginal economic growth, services trade has been affected.
● In a narrow sense, China saw some progress in dealing with financial challenges in 2023. Beijing prevented debt emergencies in the property sector and local government financing space from triggering a general financial crisis; the resulting slowdown in credit (and cleanup) was reflected in an improvement of China’s financial system reform score. Its composite cluster score surpassed that of several OECD countries for the first time since 2020. However, such achievements are modest compared to ongoing problems: poorquality financial intermediation, declining capital productivity, and deviations from market financial regulatory principles.
● Developed market scores continued to decline on average in several categories, including innovation and market competition (marginally). This shows some reform backsliding and a resurgence of industrial policy (and geoeconomic security policy) in the OECD, even as most countries remain well ahead of where they were in 2010.
● There are more data obstacles now to analyzing China’s economy than in 2019, including data lags and delays that hamper study and have a chilling effect on open discussion of economic problems in China. But alternative data—and a rise in frank domestic and international economic commentary—are improving these conditions.
Source: China Pathfinder.
Years of tracking China’s economic policy evolution make clear that its appetite to converge with liberal market economic norms has reached its limit in several areas. This slowing of progress is a major factor behind the developing bifurcation in global economic systems. It is directly reflected in the rise of de-risking and decoupling efforts in developed economies. Such a shift in systemic direction has deep ramifications for the world, creating challenges for liberal economic hopes and a serious macroeconomic slowdown for the citizens of China. Tracking these systemic dynamics is what China Pathfinder was created to do.
China Pathfinder was undertaken as an Atlantic CouncilRhodium Group partnership in 2021 and will complete its four-year funding cycle in the fall of 2024. China Pathfinder built on a prior program, China Dashboard, produced from 2016 to 2020 by Rhodium Group and Asia Society, tracking China’s progress toward its self-stated economic reform goals. We defined those goals in China’s own terms, as laid out at the Chinese Communist Party’s (CCP’s) Third Plenum meeting of November 2013, and analyzed in great detail in the report Avoiding the Blind Alley: China’s Economic Overhaul and Its Global Implications in 2014 2 China Dashboard measured China’s policy footprint benchmarked against where it was in 2013 to document whether Beijing was successful at “making the market decisive,” as it had pledged. While reforms were made in earnest from 2013 to 2015, by 2016, we observed a stall. Since 2021, the emphasis on politics over market signals in guiding the economy has been manifest, and not just as a response to the COVID-19 pandemic.
While we hoped for statistical upgrading, we built China Pathfinder to make do with existing data standards. Unfortunately, that turned out to be overly optimistic. Four problems have arisen to frustrate our methodological game plan. First, over the past four years, several data series we’ve relied on have ceased to be available or have undergone significant changes. These include several published by the OECD and the IMF. Second, the time lags of many of the data series have gotten longer. Third, many data that remain available have shown increasing inconsistencies with other evidence or have been revised without explanation. Fourth, as a result of the preceding realities, rather than setting our methodology at the start of this four-year project and applying it consistently throughout (which best practice requires), we have had to scramble for want of basic data, often late in production cycles, to come up with workarounds for missing information. The risk of distortion has risen as we have had to be increasingly creative to fill these data gaps. CHAPTER 1
Our goal in benchmarking China against those market economies—exemplified by the members of the Organisation for Economic Co-operation and Development (OECD)—has always been to take Beijing’s stated policy ambitions at face value and provide an independent voice to validate evidence of marketization and convergence with the norms of market economy status. In addition to its stated commitment to marketization, China’s leaders unambiguously pledged to continually improve the quality of national economic statistics for the benefit of policymaking at home and transparency for researchers, businesses, and the public in China and abroad.
The ability of China Pathfinder to forge consensus on policy adjustment in China was, by design, contingent on accurate and timely official data. Days after Chinese President Xi Jinping issued his Third Plenum reform blueprint in November 2013, his government committed to upgrading China’s statistical accounting system. Since 2021, we have continued to record assurances that that statistical system would be modernized. Official reports are common. 3 And yet, as of this writing, China is still using a statistical system based on the United Nations System of National Accounts 1993 framework. That is, Beijing is measuring a 2024 economy with a thirty-year-old methodology; OECD nations use the SNA2008 or equivalent and are preparing to upgrade to SNA2025. As research has shown, this has long led to a distorted estimate of economic activity in China, for instance, understating the size of the property bubble and underestimating the value of private sector service activity.4 More recently, unexplained changes to China’s method of counting trade imbalances hid hundreds of billions of dollars of growth in external surpluses during the middle year of our China Pathfinder program. These have often been buried in the appendices of the International Monetary Fund’s (IMF’s) consultations with Chinese officials.5
2 Daniel H. Rosen, Avoiding the Blind Alley: China’s Economic Overhaul and Its Global Implications, Asia Society Policy Institute and Rhodium Group, October 2014, https://rhg.com/wp-content/uploads/2014/10/AvoidingBlindAlley_FullReport.pdf.
3 Global Times, “China’s NBS launches statistical inspection in six provinces to shore up official data authenticity,” July 26, 2023, https://www. globaltimes.cn/page/202307/1295091.shtml.
4 Center for Strategic and International Studies, “Broken Abacus? A More Accurate Gauge of China’s Economy,” September 15, 2015, YouTube video, https://www.csis.org/events/broken-abacus-more-accurate-gauge-chinas-economy.
5 Brad W. Setser, “China’s Imaginary Trade Data,” Follow the Money (blog), Council on Foreign Relations, August 14, 2024, https://www.cfr.org/ blog/chinas-imaginary-trade-data.
Yet, despite challenges, our goal of objective analysis of China’s economy has not wavered. Each year we have noted workarounds and corrections in footnotes and methodological notes. We discuss 2023 updates later in this chapter. We also discuss the next evolution of China Pathfinder in the conclusions of this report.
On net, we believe the insights gleaned through the China Pathfinder Project have justified our methodological approach. Indeed, limitations of our research design as we reach the end of the project’s lifespan are themselves an important takeaway, and the difficulty of accurately assessing China’s progress is, in part, an indication of its status. The developed markets grouping, by definition, can be evaluated on a common statistical basis, and data quality concerns are not generally an issue. The emerging markets world—a much larger set—is frequently characterized by less reliable data and questions about the reliability of statistics. There are wider margins of error around EM performance estimates, and higher risk is attached to dealing with these economies accordingly.
At the start of the China Pathfinder Project just four years ago, there was a broad consensus that China was on the cusp of inclusion in the developed market cohort. Global portfolio indices recommended a growing allocation to China, and most businesspeople believed significant diversification from China—let alone more draconian “decoupling”—was impossible given the logic of continued engagement. In the brief period since then, the world’s largest money managers have asked whether China is “uninvestable.”6 Over the life of China Pathfinder, the value of China plus Hong Kong equities has fallen by $5.1 trillion, and the value of property assets has fallen by about $7 trillion. The sum of these losses constitutes almost 70 percent of China’s gross domestic product (GDP).
For our four-year assessment of China’s economic trajectory, we observe that all (six out of six) dimensions of market economy policy norms have seen narrowing gaps with our OECD benchmark since 2010, using our combination of original and replacement indicators. In at least two of these clusters, the change has as much to do with the OECD’s movement downward as China’s improvement. This reflects how the role of the state is now in flux in high-income economies, too, as appetites for industrial policy grow. These score outcomes based on changes in our indicators largely accord with a common-sense diagnosis of what has happened in the world economy, where post-COVID-19-pandemic policies have given way to increasing economic and geoeconomic competition.
The foremost conclusion we take from these results is that the gulf between China’s economic system and those of open market economies, while narrower than in 2010 and 2020, will remain for years to come. Four years of tracking China’s progress has made it clear that its reform trajectory has plateaued in several areas, adding to mounting evidence of the developing bifurcation in global economic systems. Growing partial decoupling efforts by liberal market economies in recent years are a recognition of this state of affairs. These developments have deep ramifications for nations built on liberal economic foundations.
Not all economic interactions with China are harmful to the interests of developed market economies. A systemic bifurcation does not necessarily mean countries cannot engage in mutually beneficial interactions. However, open market economies need to comprehensively review how to manage this partial decoupling. Such efforts may be contingent upon changes in China’s economy, but the burden of adjustment is on Beijing.
Our final annual net assessment on the six market economy dimensions is detailed in Chapter 2. Three cross-cutting takeaways for the year (the 2023 data year) stand out. First, China saw backsliding away from open economy norms on balance across our benchmarks. Since 2010, there has been marked improvement across most of our indicators to China’s credit. However, these gains appear to have wavered in 2023, with half of our benchmark indicators witnessing slight regression in 2023 compared to the previous year. There are some bright spots in 2023, but the few optimistic trends are overshadowed by the far larger number of benchmarks that have reversed course. In some areas, such as market competition, China remains a stark outlier, especially with respect to state-owned enterprise (SOE) presence in the economy. In other areas, such as innovation, China looked to be converging but was met with stalled progress.
Part of these trends are attributable to global macroeconomic dynamics. Our open economy samples all experienced mild backsliding in 2023—for example, with respect to trade intensity. However, the major source for many of these developments remains China’s policy choices themselves. As our policy year in review sections demonstrate, Beijing has doubled down on a policy direction that steers China, on net, away from open economy norms.
We would also be remiss if we did not reflect on the role COVID-19 played in outcomes over the 2021–24 period. The pandemic triggered state activism in all economies. In all six clusters in our framework, we can easily tell a story about the appropriate insertion of the state in lieu of normal market economy activity. One example can be seen in the market competition cluster, where SOE presence in
6 Hudson Lockett and Joseph Cotterill, “‘Uninvestable’: China’s $2tn stock rout leaves investors scarred,” Financial Times, February 2, 2024. https:// www.ft.com/content/88c027d2-bda6-4e52-97f3-127197aef1bd.
several OECD economies increased after 2020 partly due to a surge of government rescue funding. Yet, we have also carefully evaluated the stated intentions of Chinese policy in the system in our qualitative quarterly China Pathfinder reviews. These have made clear that while the pandemic offered a textbook opportunity for Beijing to rebalance the growth model toward household consumption and away from systemic bias toward the supply side and more capacity creation, leaders did the opposite. This has clearly widened the gap with OECD notions of compatibility.
The China Pathfinder indicators also illustrate how the flows of goods, services, and capital are becoming increasingly strained. China’s portfolio and direct investment benchmark indicators both declined in 2023 after making moderate progress since 2010. Services trade intensity declined, and the services trade restrictiveness index for China worsened slightly. Intellectual property (IP) protection remains a large issue for firms operating in China, reducing incentives for direct investment. Unequal treatment of foreign firms and other problematic market competition dynamics compound these concerns. Overall, the only flow left redeeming the Chinese economy is trade in goods intensity, which saw another increase, consistent with its long-term trend. This is emblematic of an economy that is overly reliant on exports as the last remaining source of reliable growth. At the same time, Germany and Japan within our comparison group have also variously leaned on exports during their economic history; neither has concurrently faced comparable pressures across other financial and trade flows.
Lastly, the outsized role played by the CCP in the economy continues to be a major obstacle to China’s convergence with open market norms. In Chapter 2, we point out in several sections how the CCP continues to influence the economy unduly. Some of these dynamics are intangible or unquantifiable in our framework. The CCP’s reach into the private sector continues apace, with few signs of slowing down, affecting corporate governance and distorting what would otherwise be market-driven innovation and competition dynamics. Many of our benchmarks, however, do underscore these points. On SOE presence in the economy, China is a far outlier amongst the countries under study. Until the state retreats from its influential, structural position, it will be difficult for China to fully converge with open market economy norms in many of our cluster areas.
In Chapter 3, we return to these and other broader conclusions drawn from across the China Pathfinder Project’s lifespan.
China Pathfinder data and analytic methodology: Updates for 2024
As stated in our inaugural 2021 report, the goal of China Pathfinder is to objectively assess China’s structural economic reform progress in order to promote consensus on where China stands in relation
to advanced market economies. We do this with an evaluation framework reliant on data collection, synthesis, and analysis. We draw from many sources and series published by governments, international organizations, and nongovernmental organizations, as well as our own proprietary efforts. The quantitative findings in our reports have tracked the qualitative policy scene closely each year.
Our framework evaluates China’s convergence with market economy norms across six clusters covering both domestic and foreign-facing features of China’s economic system (Table 11). The domestic dimensions include China’s financial system development, market competition policies, and innovation system, while the external clusters include trade, direct investment, and portfolio investment openness. Each cluster is tracked with annual benchmark indicators —readily available data series with cross-country coverage that capture the essence of that dimension. A composite score for each cluster is also calculated by taking the simple average of each benchmark indicator to produce an overview of China’s annual trends.
There are aspects of China’s economy that are not easy to compare with other countries. We recognize the importance of addressing these characteristics and thus include supplemental indicators, which inform our conclusions but do not contribute to the annual composite scores. The final component of our framework is a qualitative review of policy changes in each cluster. Throughout the year, China Pathfinder publishes quarterly updates highlighting major developments and making qualitative judgments on movements closer or further from market economy norms. This annual report synthesizes these updates in Chapter 2, adding nuance to our benchmarks and helping clarify how scoring changes manifest in China’s politics and economics.
We have sought to establish a rigorous and consistent methodology with the China Pathfinder framework. By maintaining a similar approach year after year, we have been able to identify trends in China’s economic reform. Over the project’s lifespan, however, we have had to accept some methodological updates. With each successive report, we have made adjustments while preserving the basic approach. For example, in 2022, we began including 2010 baselines not only for China but also for each OECD country in our sample. The largest change to our methodology came in 2023 when we adopted a new min-max methodology that calculated relative scores for countries drawing from all data in the scope of our analysis. For the 2024 edition, we have elected to carry forward our methodology with no major revisions. Additional improvements would add marginally to precision but at the cost of increased complexity and decreased accessibility. One of the primary goals of our research design was to provide quantitative measures that are rigorous but also accessible to non-economic experts.
While our analytic methodology has seen no change this year, there have been significant changes in data availability, which has become increasingly challenging for the framework. At the outset of this project, we attempted to hedge against this issue by making data availability and consistency key criteria for inclusion in our annual benchmark indicators (the most important data series that feed into our composite scores). Indicators were selected based on whether they correlate with and are essential for openness and market orientation, are consistently available for both China and comparators, have a limited time lag of six months maximum, and are straightforward enough for a broad audience to understand. Many indicators now fail the timeliness and consistency criteria. In the 2024 edition, we encountered availability issues in almost a third (ten out of twenty-nine) of our foundational data series, a marked uptick from previous years. For example, the OECD’s FDI Openness Index, IMF’s Financial Institutions Depth Index and Financial Markets Access Index, and World Integrated Trade Solution (WITS) tariff rates, all key indicators used in our crosscountry comparison, are missing current-year data for 2023 as of the time of publication.
Moreover, gaps are unevenly distributed across the clusters, magnifying the problem. Portfolio investment and direct investment openness both lack data in 2023 for half of their constituent benchmark indicators, requiring us to seek alternatives. While some indicators are no longer published, others have faced increasing time delays in their publication that make their inclusion unfeasible with the cadence of our annual analysis. This is not to mention data quality concerns, such as those noted in the trade balance statistics above.
To be sure, data drop-off is an issue with any longrunning research initiative. To its credit, the immense number of hours devoted to stress testing and the evaluation of our expertise and analytic procedure early on in this project’s life cycle has paid large dividends. For example, pandemic-related disruptions to our data retrieval were minimal. However, as more data series have become unavailable, we are left with difficult choices. We must balance methodological consistency against using alternative data that speaks to the questions at hand. In the latest cycle, the gulf between these two priorities has widened. Assessing China’s progression has forced us to veer further from our original data sources. This is acceptable for an intrayear comparison and benchmark, but it adds greater unreliability to cross-year comparisons. Because the focus of the project is first and foremost on tracking China’s evolution, this presents, in our view, severe obstacles.
The options for addressing all this are imperfect. The choices for gap-filling include:
1. Carry forward the prior year’s data. This reduces or discounts the potential magnitude of change in the cluster.
2. Impute or splice the data by applying some form of average growth rates, across countries within a year or across countries across years. This risks missing surprising forward or backward movements.
3. Draw from alternative data sources that speak to the same underlying issue. This introduces comparability issues across years.
4. Reconstruct missing data indicators. This requires the availability of methodological documentation and additional data series relied upon to construct the indicator, neither of which are always readily available.
For our analysis in this report, we combine these solutions to address data gaps. A consistent principle adopted in China Pathfinder is transparency. To that end, we make clear in each subsection of Chapter 2 the data complications we had and what procedure we adopted as a remedy. Additionally, we put great effort into caveating our conclusions as appropriate. In some instances, the quantitative results present contradictory or surprising findings. We offer a qualified interpretation of these results based on our domain expertise.
As China Pathfinder comes to a close, the data issues outlined here are to be expected. Many would be obviated if China adopted the same data transparency and publication standards as OECD nations. Absent this, however, we believe that our efforts at objectivity, consistency, and rigor provide the next-best solution. The analytic methodology has proven robust, if imperfect, and offers lessons for future research on competing economic systems—lessons that will be carried forward, hopefully, in future China Pathfinder phases.
In the next chapter, we address each of our cluster issue areas. Following that, in Chapter 3, we summarize significant takeaways drawn from specific clusters and build on them to offer cross-cutting conclusions about the past year based on the evidence we collected. Since this is the final edition of this series, we also share lessons learned and principles for success based on our experience analyzing China’s economic system today and over the past four years. Finally, we preview our ideas for a next-generation China Pathfinder 2.0 design and refresh our mission statement for the kind of public policy research we believe will serve the interests of people and policymakers in the advanced economies, China, and the wider emerging world alike.
TABLE 1. SUMMARY OF CHINA PATHFINDER CLUSTERS AND INDICATORS, 2024
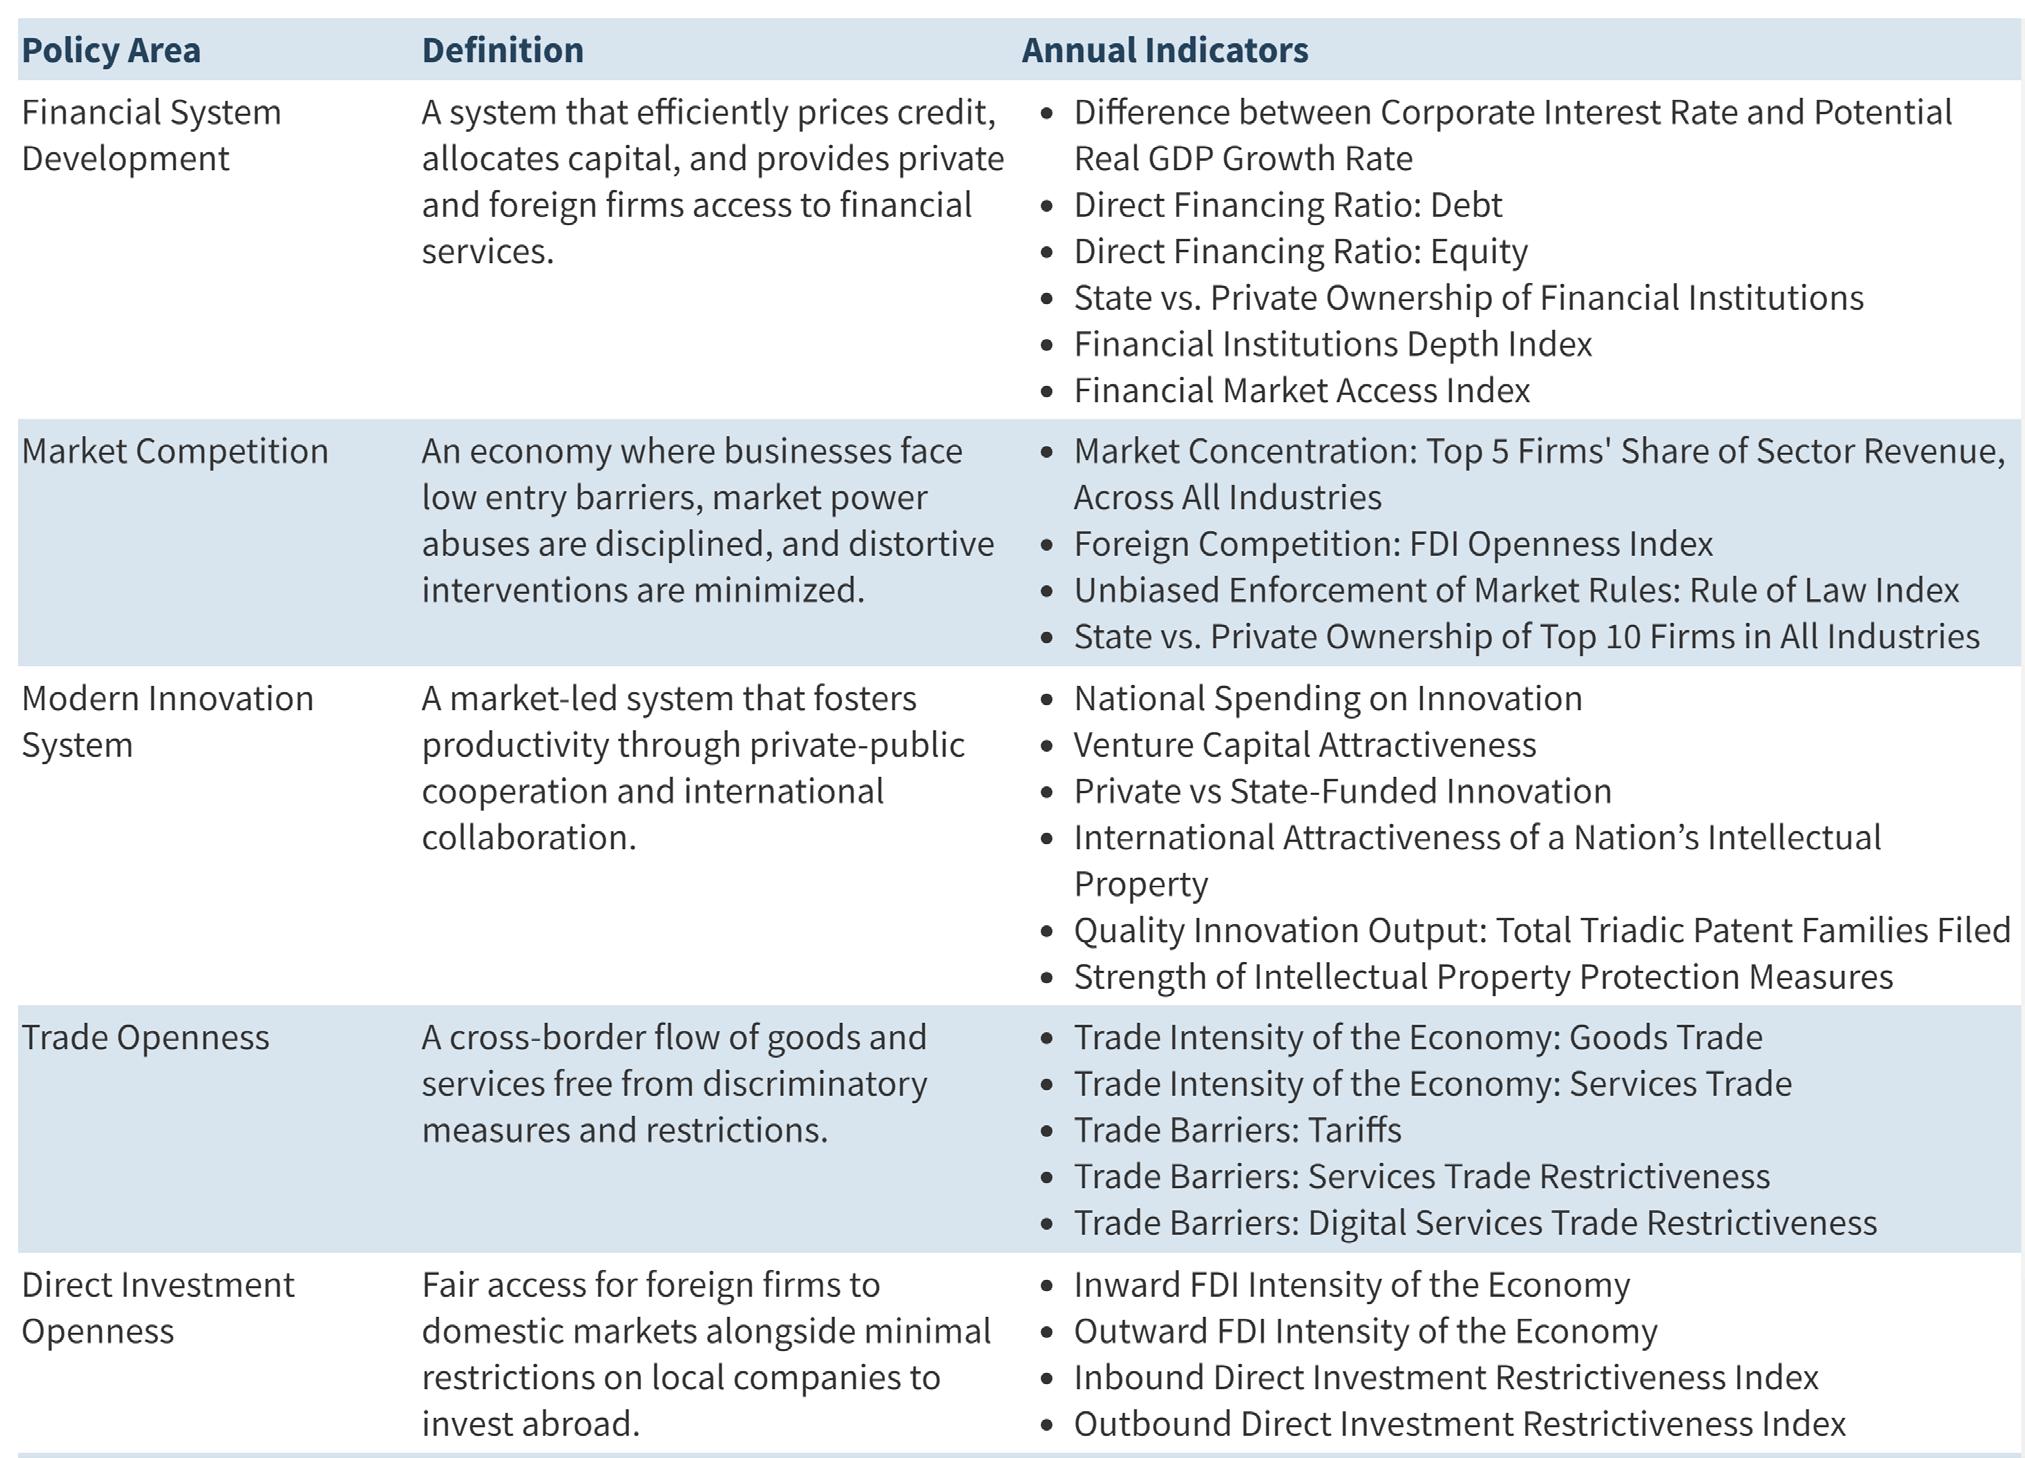
Source: China Pathfinder.
In this chapter, we review each of our six clusters in detail. We define each cluster and its relevance to a market-oriented economy. This provides a framework for how we selected indicators and why they are a fair proxy of that particular area of economic performance. The next section outlines each indicator and its corresponding methodology, followed by an analysis of the 2023 data findings for China and open market economies. The individual indicator stocktaking leads to our overall composite score results, where we assess countries’ relative performance and interesting trends for 2010, 2020, 2021, 2022, and 2023. The six sections of this chapter each conclude with a review of the major policies enacted and other relevant developments that occurred in China in 2023.
Definition and relevance
Open market economies rely on modern financial systems to efficiently price risk and allocate capital.7 Key pillars of modern financial systems are generally
market-driven credit pricing, the availability of a broad range of financial instruments, the absence of distortive administrative controls on credit price and quantity, and access for foreign firms to financial services and foreign exchange markets.
2023 stocktaking: How does China stack up?
In 2023, China’s financial system development score improved over both its 2022 score and its 2010 baseline. However, it continued to lag behind the OECD average in 2023. There were improvements in several indicators, including the efficiency of credit pricing and financial market access. China’s stock market capitalization as a share of GDP also saw improvements, though it was distorted by the slowdown in GDP growth between 2022 and 2023. China continues to maintain a high degree of state ownership in the financial sector compared to OECD economies.
In calculating this score, we chose the following annual indicators to benchmark China’s financial system development against that of open market economies. CHAPTER 2
United
China
Measure of financial system development from 0 (low) to 10 (high). Source: China Pathfinder
7 William Hynes, Patrick Love, and Angela Stuart, eds., The Financial System (Paris: Organisation for Economic Co-operation and Development, 2020), https://doi.org/10.1787/d45f979e-en.
We use the absolute value difference between the average borrowing rates for nonfinancial corporations and projected GDP growth as a proxy for efficient pricing of credit. In an efficient financial system, the cost of capital (the average interest rate) should roughly mirror the expected return (for which we use the projected GDP growth rate). Countries with efficient credit pricing will be close to zero in our chart.
In 2010, China’s projected growth rate far exceeded the real interest rate for corporate borrowers, effectively subsidizing producers and punishing savers.8 In 2023, a combination of tightening credit markets, a sharp slowdown in growth, and China’s slowing economic growth—which have both affected new credit and reduced inflation-adjusted interest rates—has seen the gap narrow in our sample. China’s score for credit pricing has thus significantly improved and now exceeds both the OECD average and the United States’, reaching over 9.0 points in 2023.
As we noted in 2022, in many open economies, high inflation rates outpaced produced a negative real cost of borrowing. Lower growth (with the exception of the United States) and high interest rates in developed markets saw the gap between the two converge across the OECD scores in 2023.
The extent of direct financing in an economy reflects firms’ ability to borrow directly from the market instead of going through banks and other intermediaries. We include two measures of direct financing: stock market capitalization as a share of GDP and outstanding nongovernment debt securities as a share of GDP
China’s stock market capitalization-to-GDP ratio does exceed that of Italy, Germany, and Spain, though it trails behind the OECD average and far behind the United States. Denominator effects are partially at play, given China’s growth slowdown in 2022 and 2023. However, even though credit growth was sluggish last year, growing debt finance helped China surpass all countries in our sample except for South Korea and the United States. Equity finance via the stock market continued to increase as a share of GDP, though China remains well behind most of the OECD.
We again deploy our own composite indicator, looking at the degree of state ownership in the country’s top ten financial institutions by market capitalization. For each country, we look at the proportion of each institution’s public stock owned by the government. We then weigh the results according to each institution’s market capitalization.
The high degree of state participation in China’s financial institutions remains a core systemic difference between China’s financial system and that of open economies. China’s weighted average of government ownership of financial institutions has improved in comparison to when it stood at 47 percent in 2010. However, it has stagnated at 39 to 40 percent from 2021 to 2023. Simultaneously, the OECD weighted average has remained around 3 to 4 percent over the same period. South Korea’s government ownership share is the only other rate exceeding 10 percent. South Korea’s share has not significantly improved from 2010 levels, standing at 18 percent in 2023, yet remains markedly ahead of China.
Previous reports deployed a financial institutions depth indicator compiled by the IMF as a proxy for overall financial system sophistication. However, that indicator ceased updates in 2021. To compensate, we deploy our own composite indicator using the IMF’s methodology and alternative data series with more recent data available for 2023.9 We use this index to generate updated baseline scores for 2010 and 2023. Because they draw on alternative data streams, they are not directly comparable with the previous IMF scores. However, the new index shows similar country ranks and direction of change since 2010.
China’s performance on the composite depth index still lagged behind the OECD average in 2023. However, China’s score markedly improved from 2010 (by 0.9). While it previously ranked just behind Spain and Italy in financial institutional depth, China surpassed those countries last year. This is due (in part) to declining private credit and insurance premium volumes in those countries in 2023.
As with the above, the IMF’s financial markets access indicator is no longer published, requiring us to deploy our own composite indicator based on existing methodology. While the old IMF indicator utilized data on the number of bond issuers per capita, our indicator deploys data on overall corporate debt volume per one hundred thousand adults. It preserves the use of a second input series, the percentage of market capitalization outside of the top ten largest companies, to proxy access to stock markets.
As with the financial system depth indicator, in 2023, China performed better than the lower-performing OECD economies of Italy and Spain. China has also shown substantial improvement since 2010. China’s score reflects the rapid expansion of its bond markets
8 In error, previous China Pathfinder cycles incorrectly calculated real interest rates, affecting scoring for China and the other sample countries. This error is corrected for 2023, and data should be seen as superseding previous versions.
9 Katsiaryna Svirydzenka, “Introducing a New Broad-based Index of Financial Development,” IMF Working Paper WP/16/5, January 2016, https:// www.imf.org/external/pubs/ft/wp/2016/wp1605.pdf.
since 2010. China’s score would likely decrease if our indicator utilized data on issuers rather than the value of issued bonds.
Blending our annual indicators, our Financial System Development Composite Index puts China at 4.4 in 2023, a notable improvement over its score of 3.5 in 2022.10 All OECD countries improved from the previous year except for Japan, which saw a very small technical decrease (less than 0.1 points). Thus, China’s score surpassed Italy and Spain for the first time; until 2022, China consistently scored the lowest among all incountry samples. This reflects nascent improvement in China’s credit allocation, under deleveraging policies and amidst the collapse of its property sector, which caused lenders to pull back on new credit.
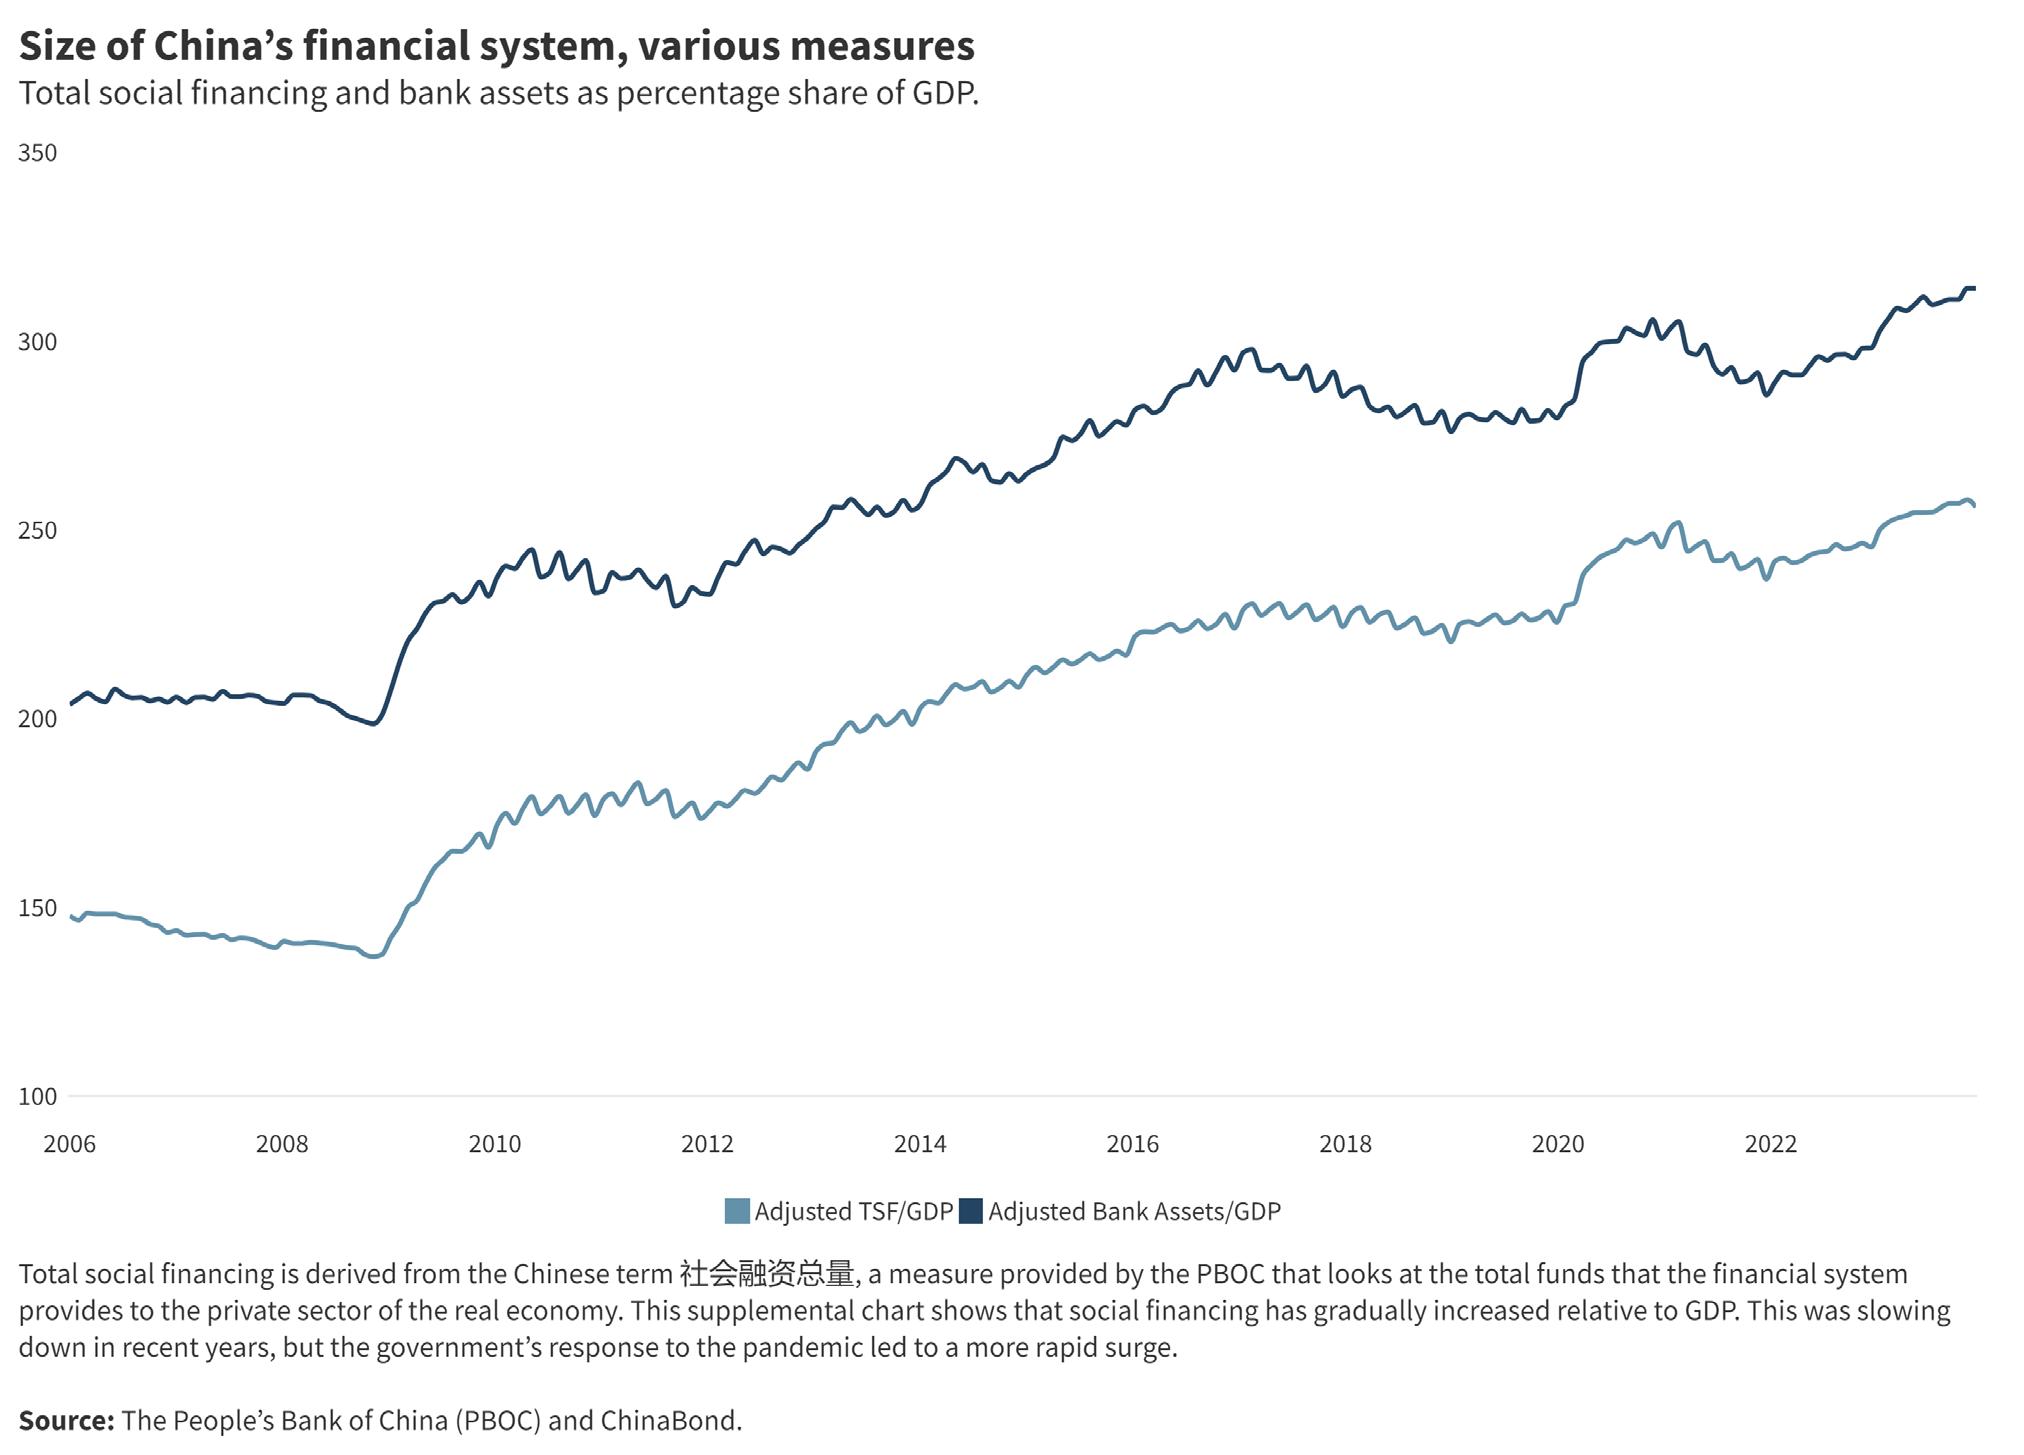
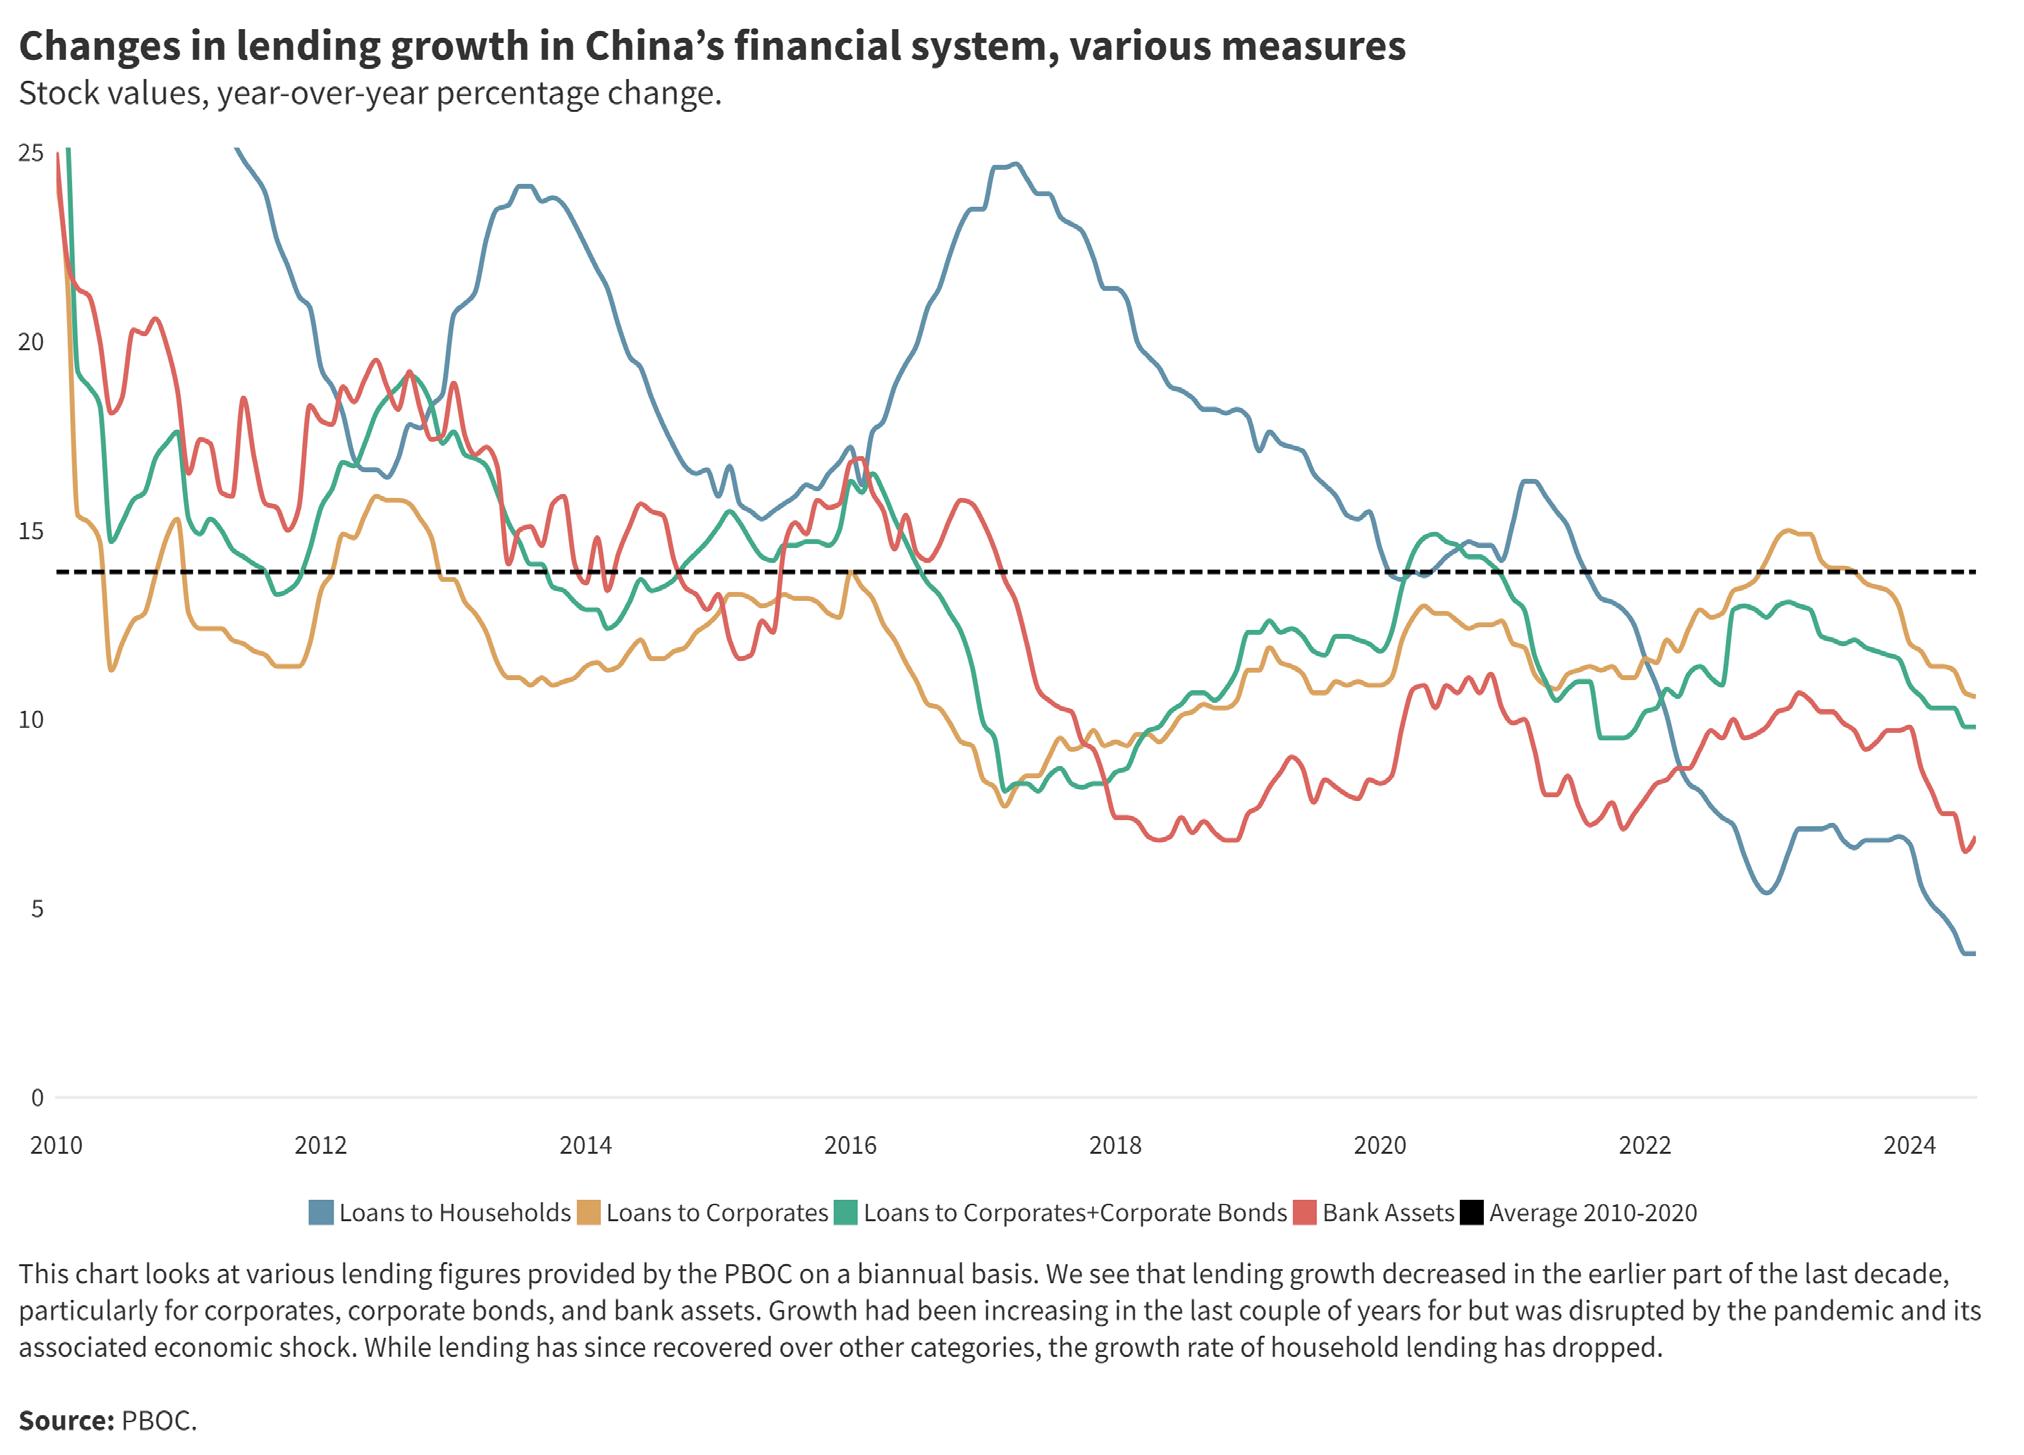
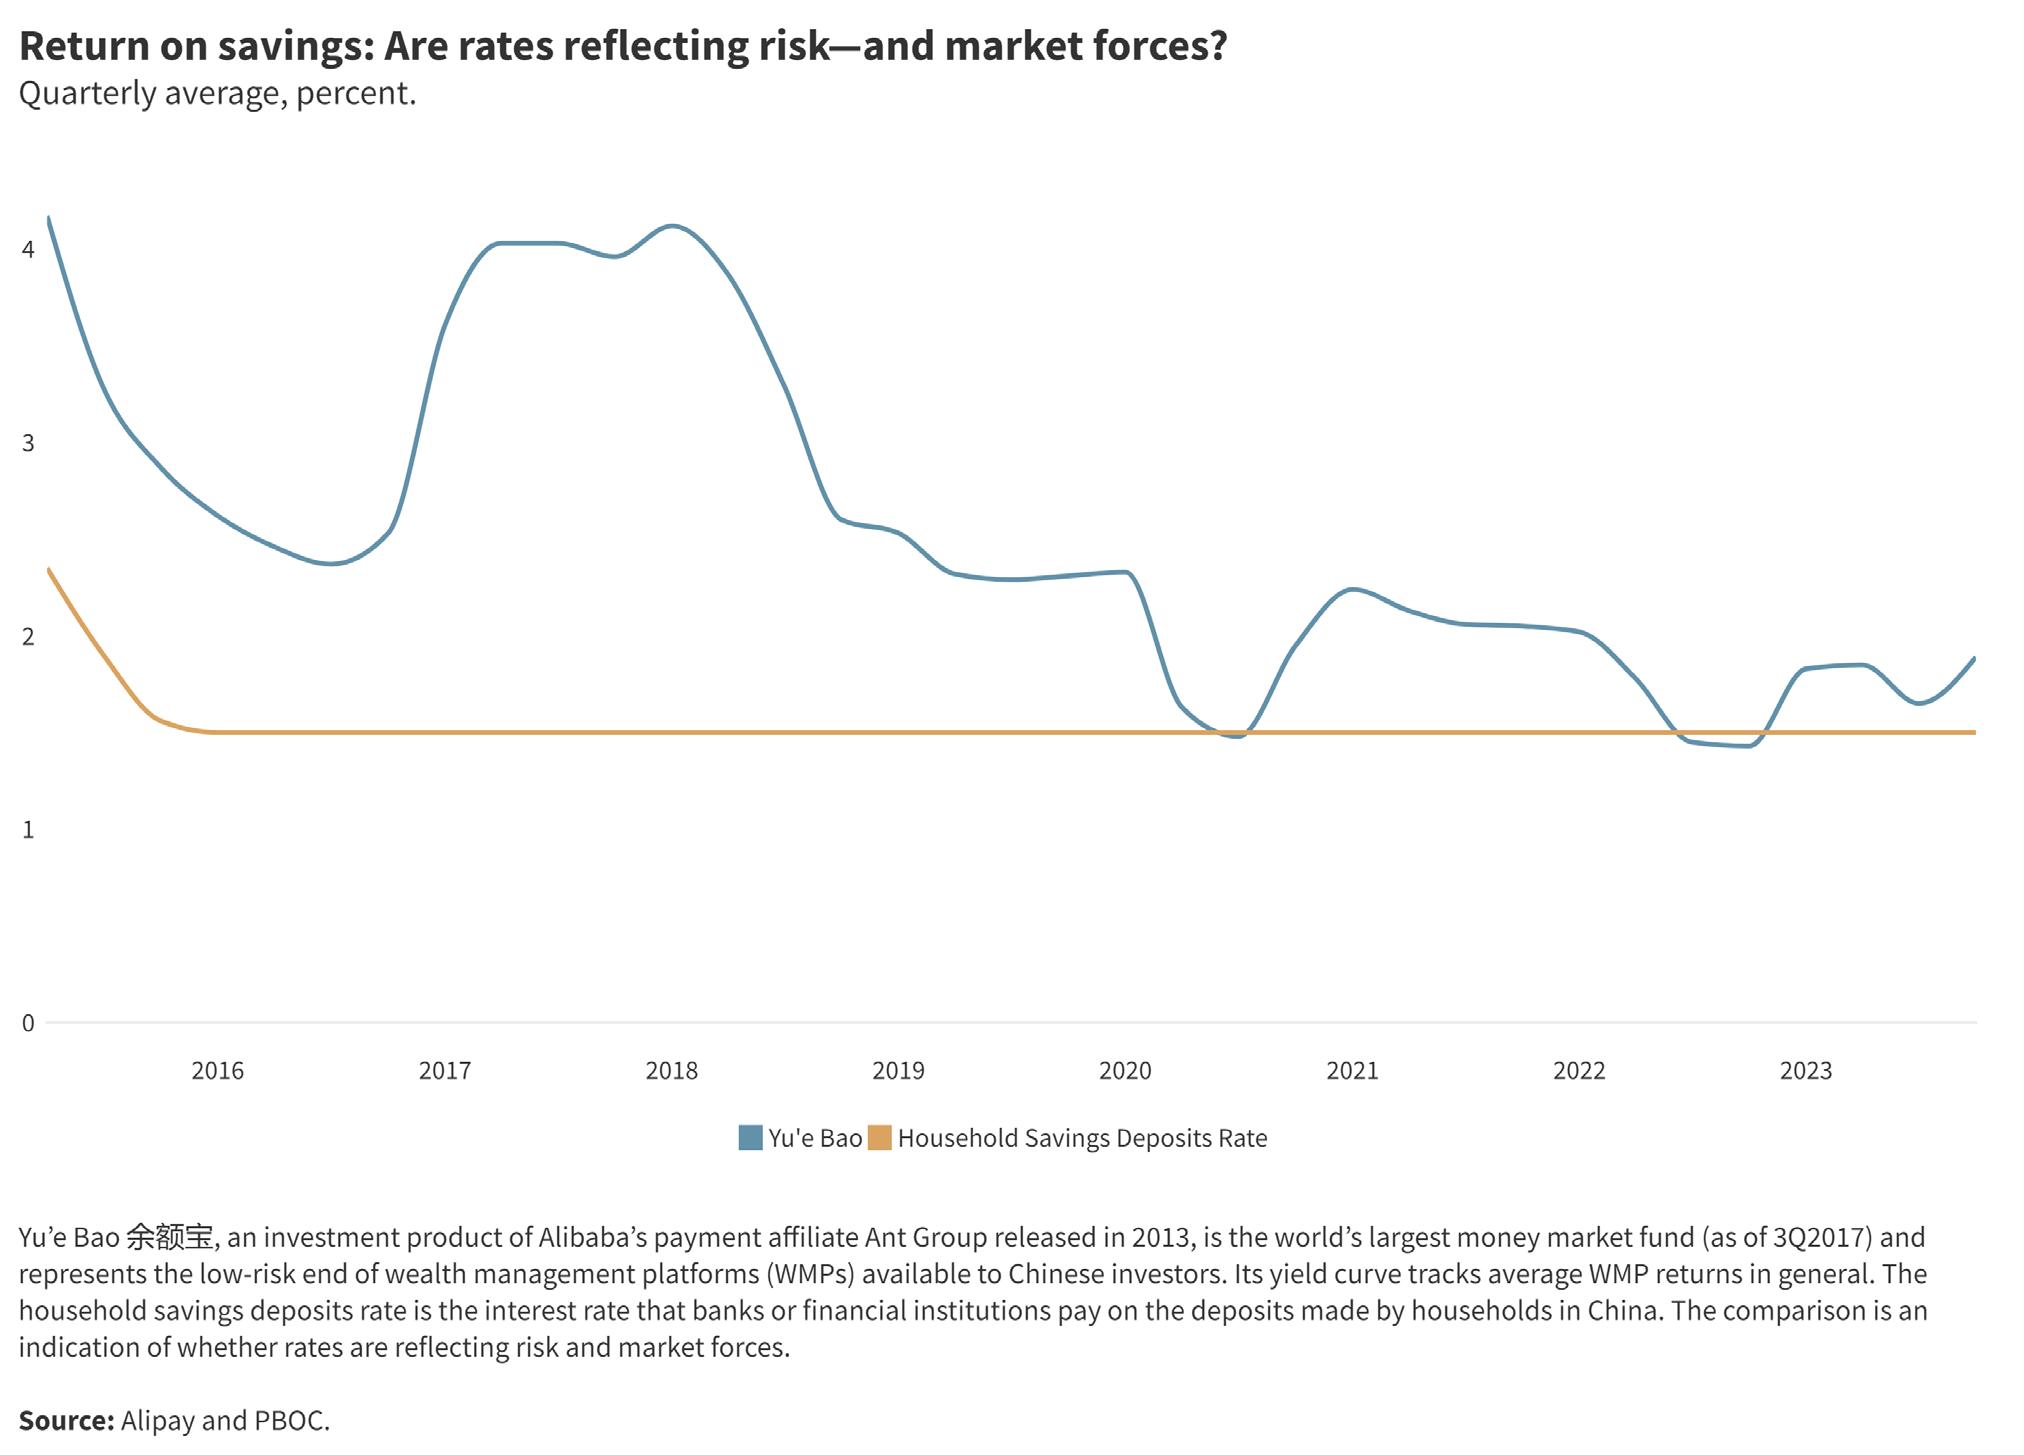
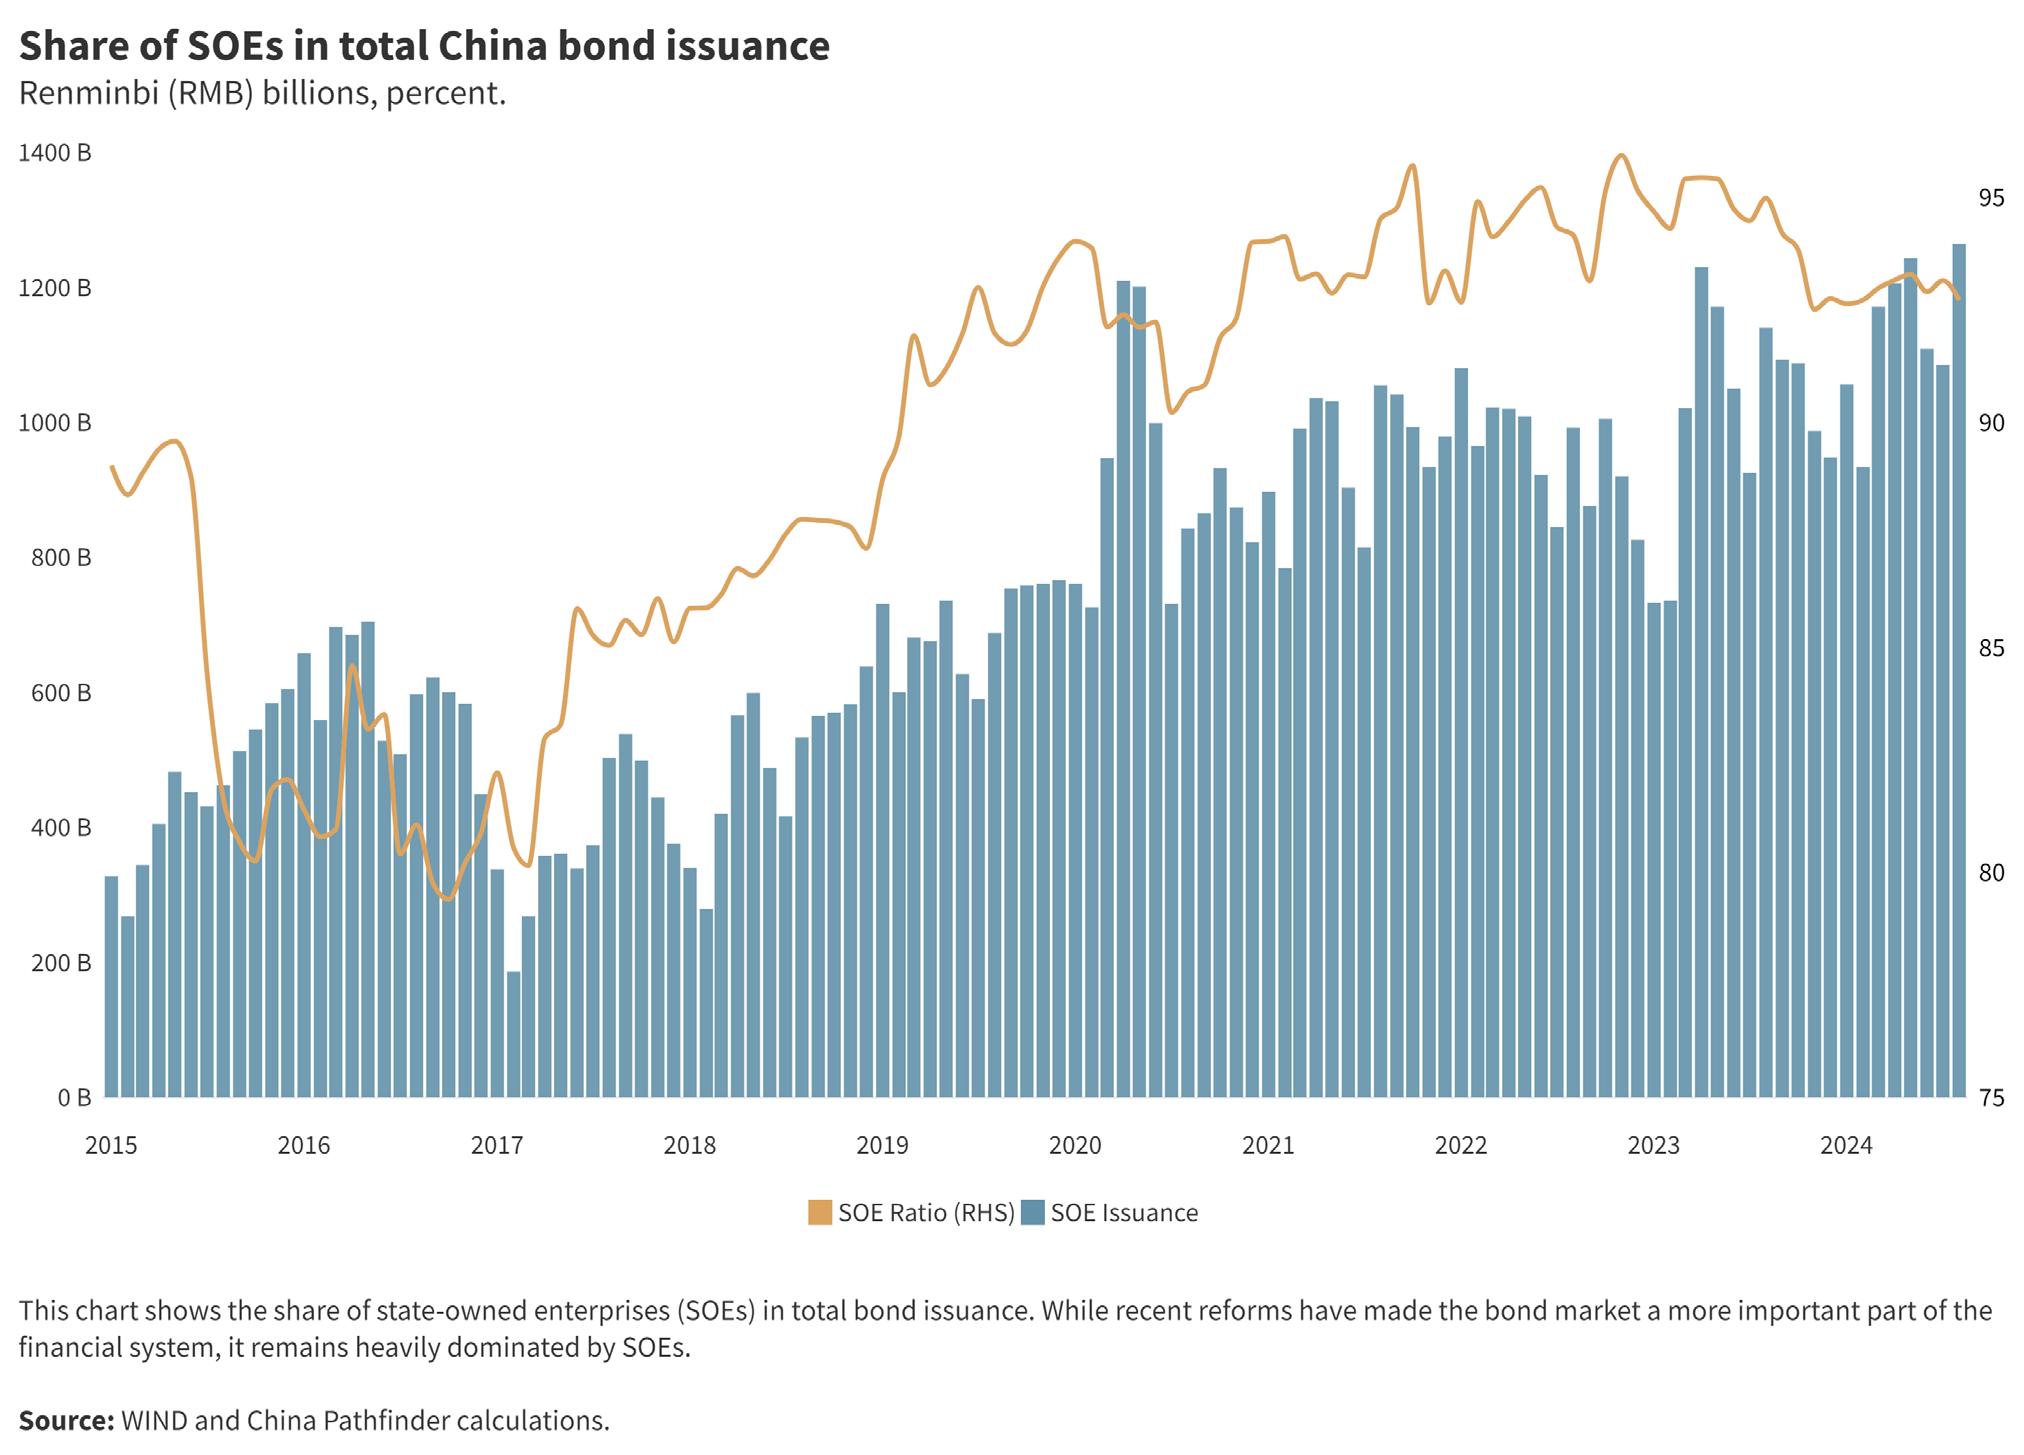
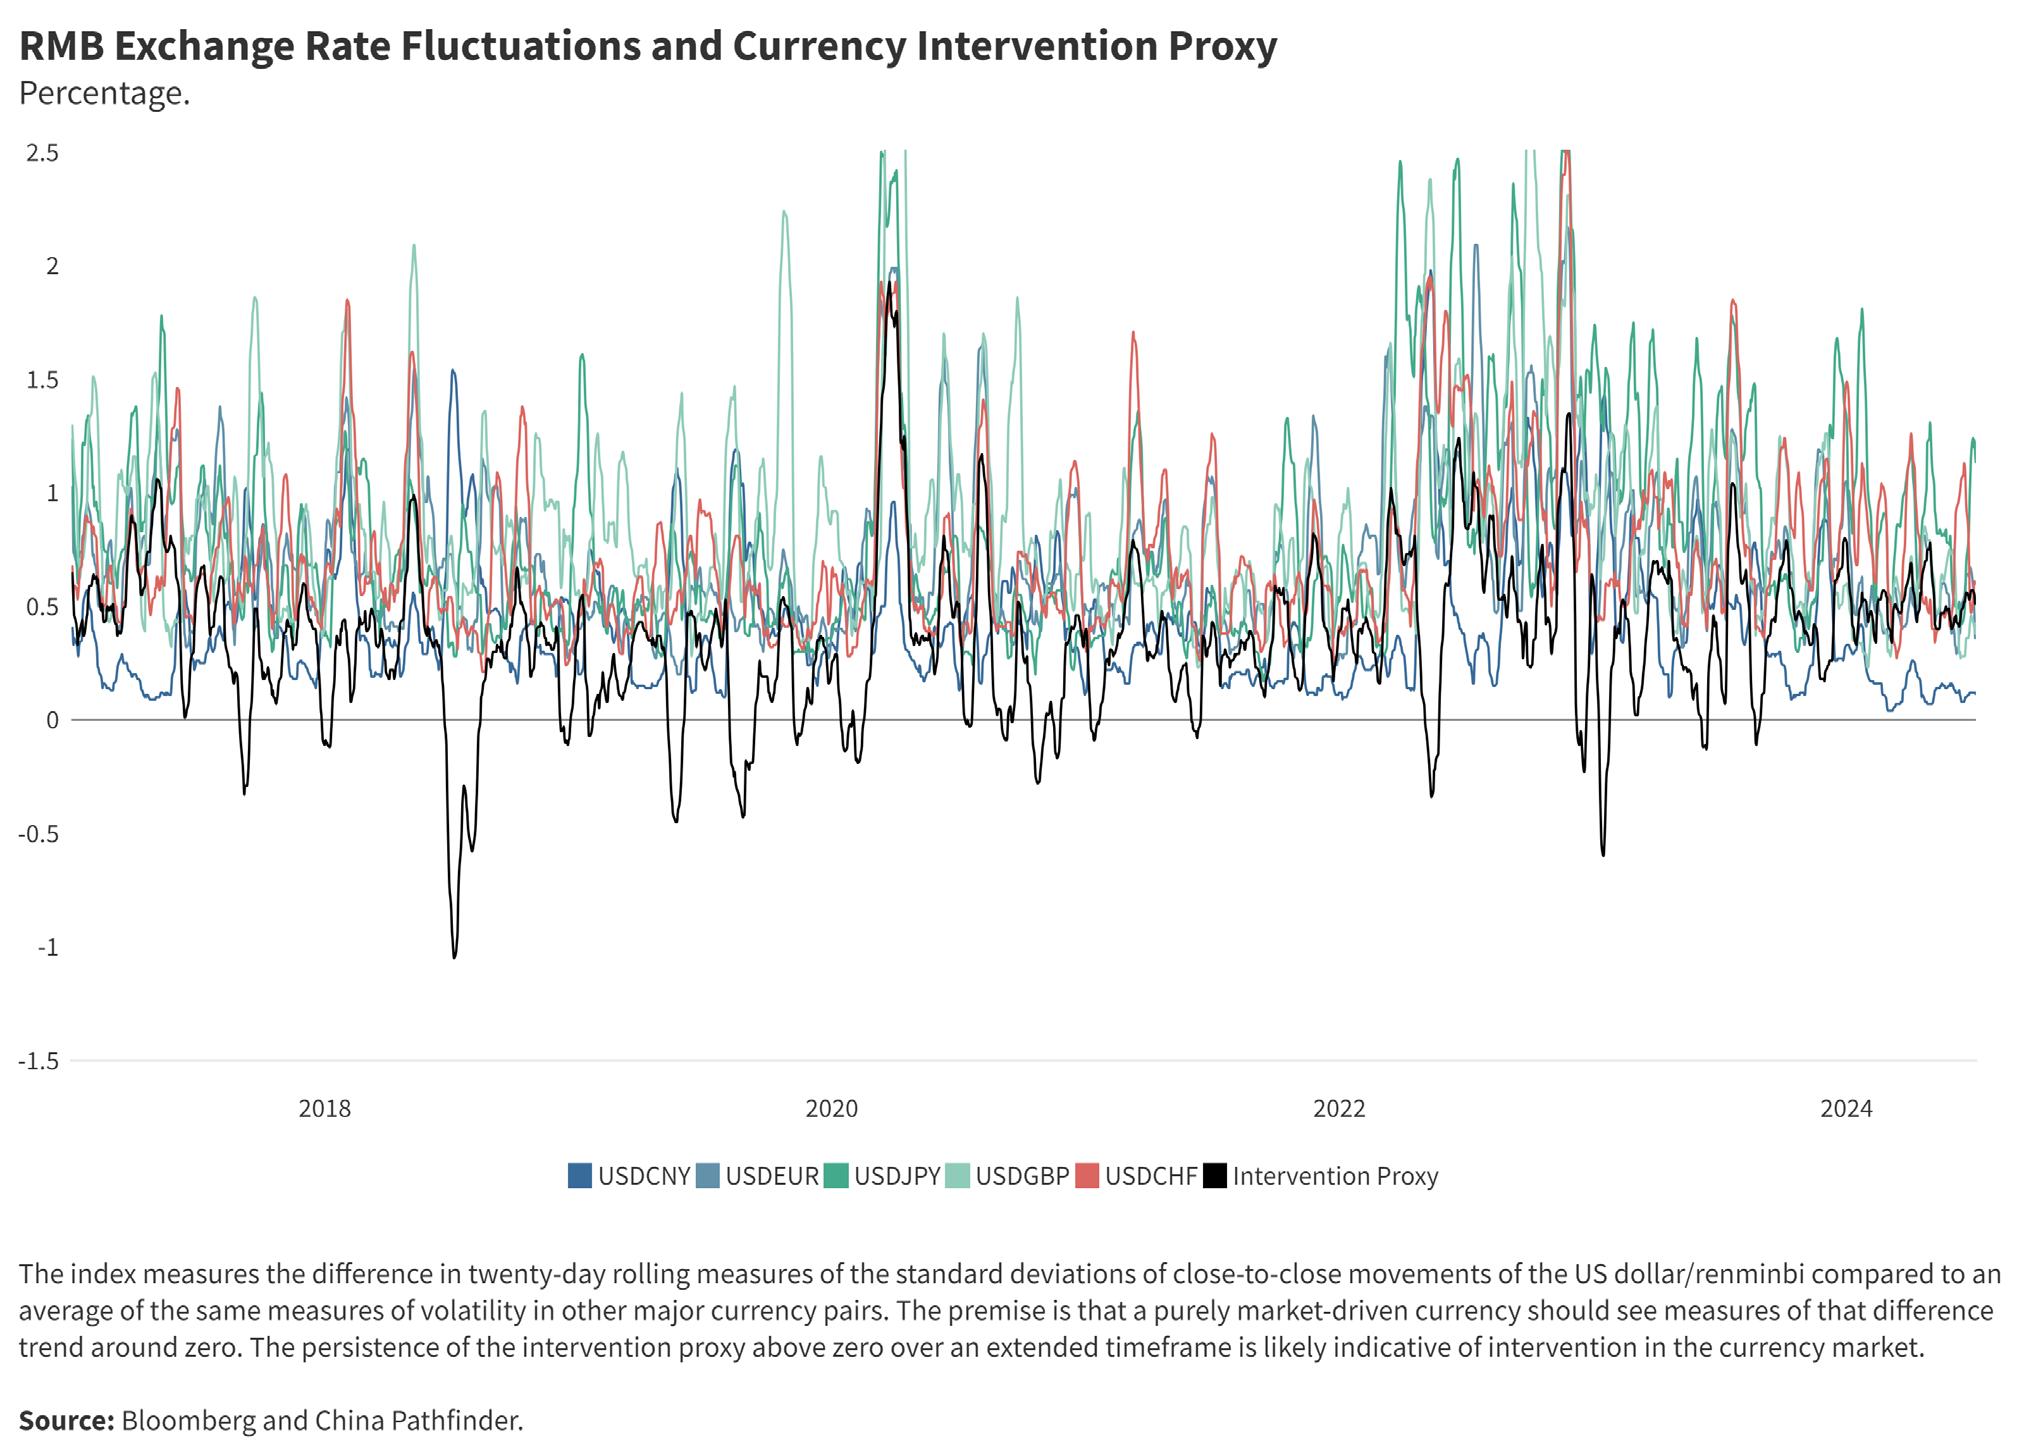
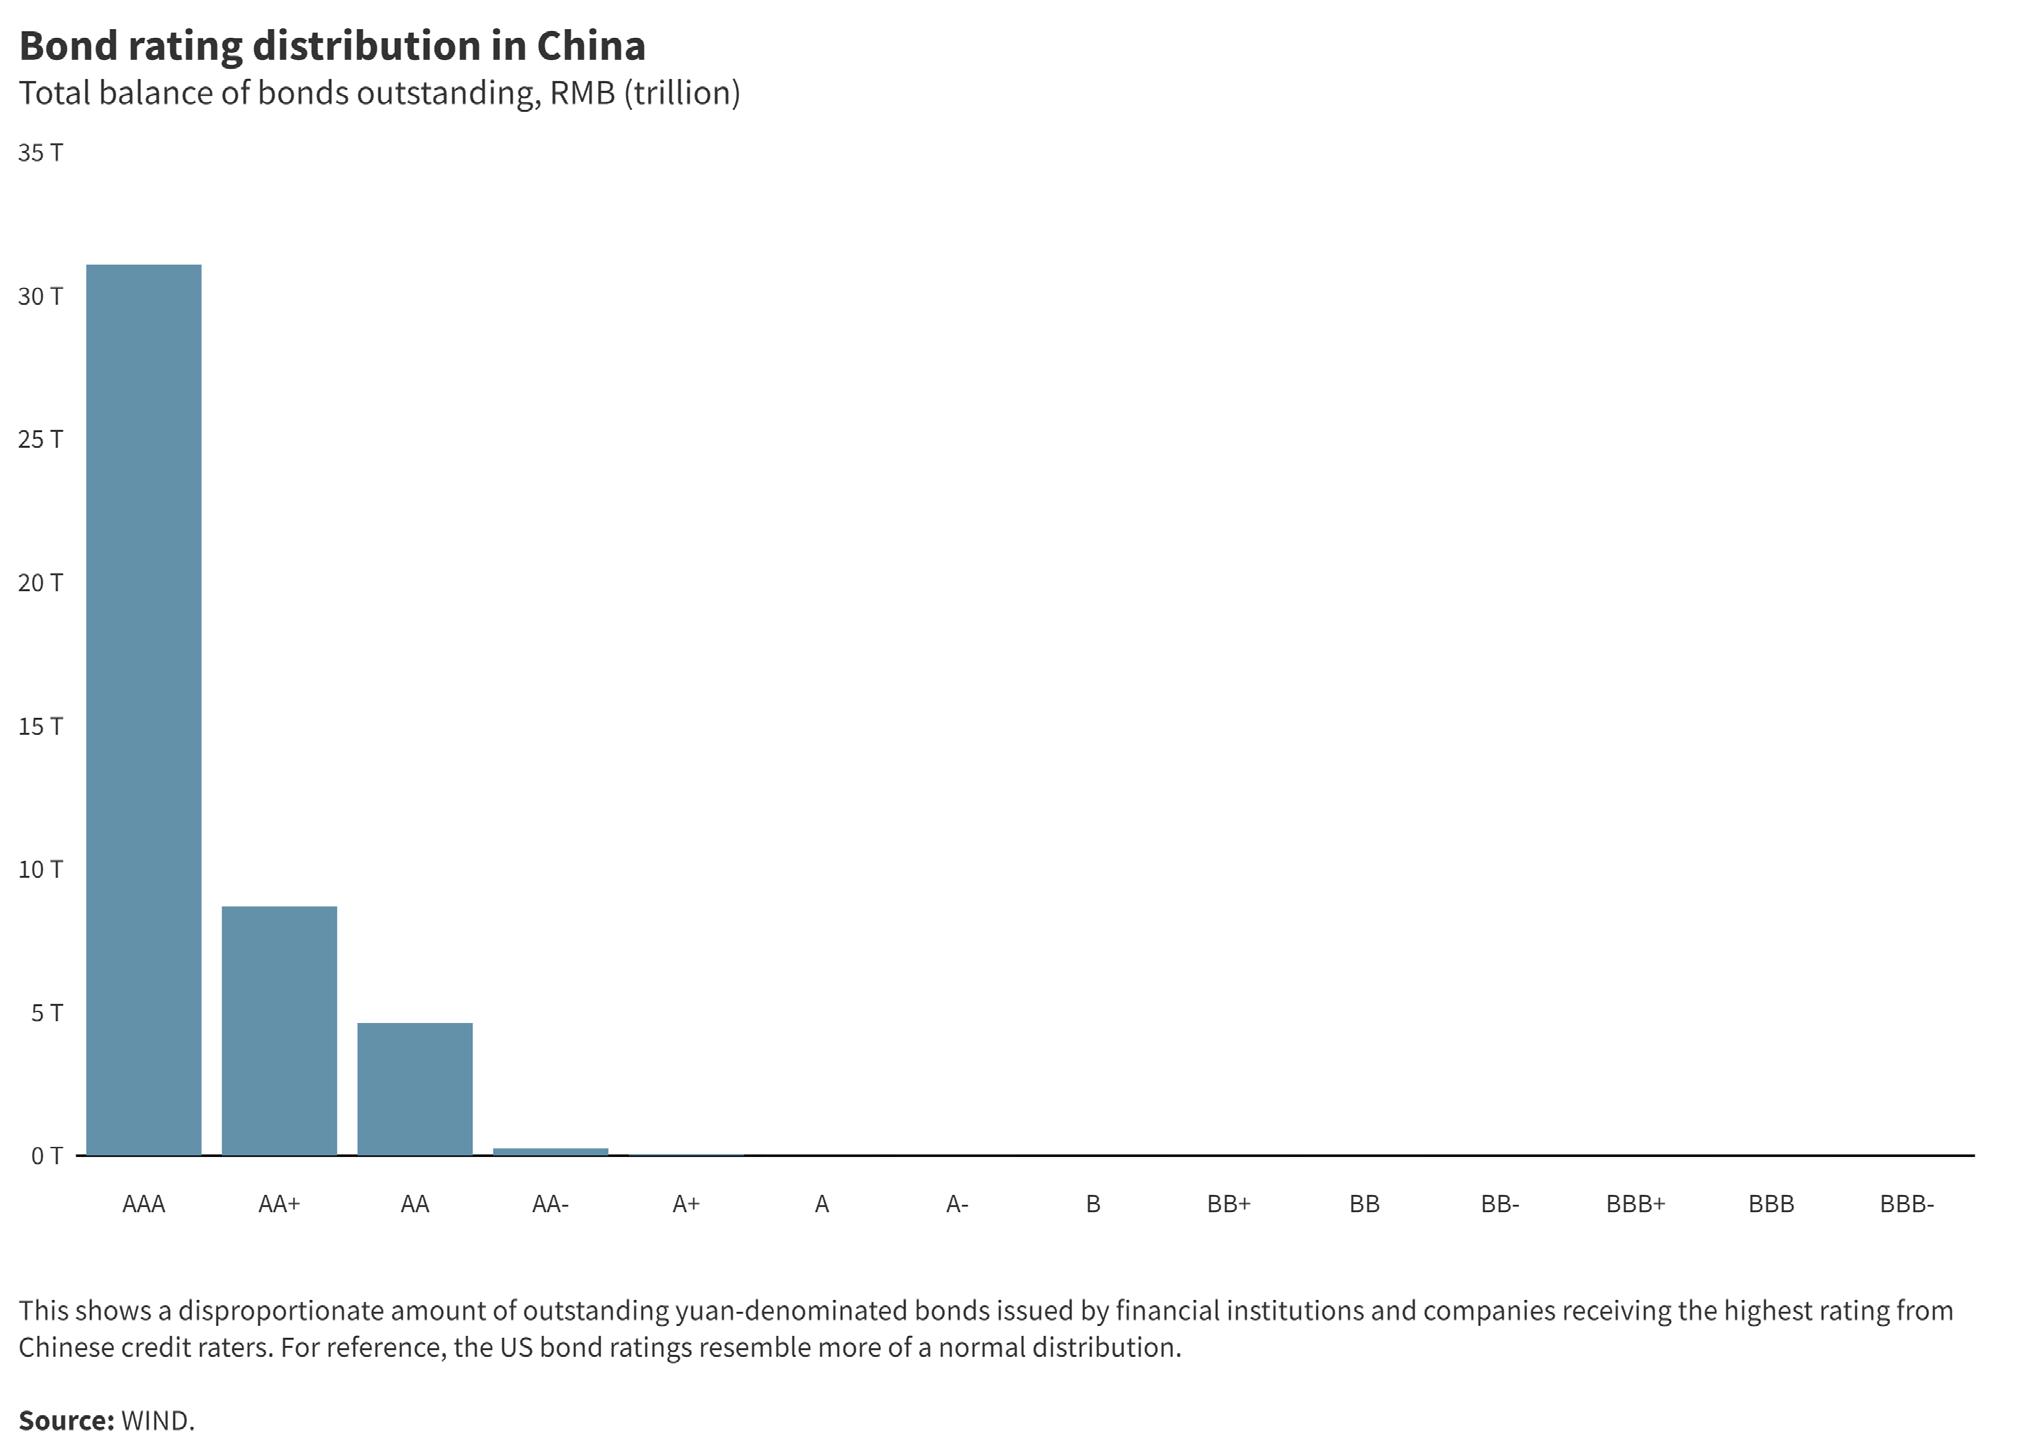
Our composite scoring captures major movements in China’s performance using indicators comparable across economies. In addition to these benchmark indicators, we also track relevant policy signals germane to financial system development and monitor several additional higher-frequency or Chinaspecific indicators. These policies are detailed below, and Figure 23 presents a selected number of these supplemental data points, including the pace of credit growth in the Chinese economy; the distribution of credit to consumers, the private sector, and SOEs; the distribution of Chinese bond ratings; interest rates for savers; and exchange rate dynamics.
A year in review: China’s 2023 financial system policies and developments
In 2023, the Chinese government focused on mitigating the outcomes of domestic financial system stress— including a loss of domestic and foreign business confidence—rather than core structural issues.
Mounting local government debt continued to weigh on financial stability. Calling on a playbook of measures to deal with the property sector, weaker growth, and local government financing vehicle (LGFV) debt in 2014–15, the central government initiated a debt refinancing policy package that would offer extensions and rate cuts on LGFV debt.11 The midyear budget revision increased central government bond issuance by RMB 1 trillion, with RMB 500 billion to be disbursed in 2023.12 The People’s Bank of China (PBOC) also increased the pledged supplementary lending quota by RMB
500 billion at the end of 2023 to support policy loans for housing projects, urban revitalization, and public infrastructure. Of that, RMB 99.4 billion in lending was extended by year-end.13 These measures provide LGFVs a solvency reprieve without addressing the underlying causes of liquidity constraints, perpetuating systemic moral hazard by allowing LGFVs to maintain unsustainable debt positions and increasing the risk of zombie enterprises. These measures also burden financial institutions with fulfilling state policy priorities at the expense of profit maximization.
On the other hand, several market-oriented measures eased local government access to listing SOEs on the stock market. These developments included the rollout of a new registration-based system for initial public offerings (IPOs), which replaced a system that required approval from the securities regulator, and the relaxing of some hard requirements on profitability and other financial ratios, making it easier for SOEs to qualify for listings.14 SOEs are valuable local government assets. Sales can assist in the repayment of local debt.
Throughout the year, the Central Commission for Discipline Inspection’s ongoing anti-corruption campaign in the financial sector and crackdowns on financial sector wages were a continued constraint on market forces. The heightened insecurity caused by crackdowns is likely to make loan officers more conservative and perpetuate pressures to lend to SOEs over private sector actors. There was also little progress on implementing government promises to improve market conditions for the private sector, including improvements to private enterprises’ credit conditions and increased investment in the private sector.
Market reforms for foreign players were slightly more promising. In June, the State Council rolled out new pilot measures for six of China’s twenty-one free trade zones (FTZs) and free trade ports, which included several actions opening the financial sector.15 However, the impacts of the new regulations on the business operating environment will likely take time to manifest. Revisions were made to speed up the processing of investment remittances (e.g., dividends, capital gains, etc.) and to allow individuals and companies to use overseas financial services. The new measures also promise that the government will not be permitted to ask for the source code of any software imported and distributed within the six FTZs.
10 This reflects a rebase from the score in our previous annual report, accounting for China’s score with the new composite indices deployed.
11 Tom Hancock, “China Kicks Off $137 Billion Plan to Tackle LGFV Debt Risk,” Bloomberg, September 27, 2023, https://www.bloomberg.com/ news/articles/2023-09-27/china-starts-local-government-debt-swap-program?embedded-checkout=true&sref=H0KmZ7Wk.
12 Shen Cheng, “透视我国增发2023年国债1万亿元的深意” [The profound meaning of my country’s additional issuance of 1 trillion yuan of national debt in 2023], Xinhua, October 24, 2023, https://www.gov.cn/zhengce/202310/content_6911401.htm.
13 Monetary Policy Analysis Group of the People’s Bank of China, China Monetary Policy Report Q4 2023, People’s Bank of China, February 8, 2024, 17, http://www.pbc.gov.cn/en/3688229/3688353/3688356/4756453/5330013/2024041610102997035.pdf.
14 China Securities Regulatory Commission, “全面实行股票发行注册制制度规则发布实施” [The rules for the full implementation of the stock issuance registration system have been issued and implemented], February 17, 2023, http://www.csrc.gov.cn/csrc/c100028/c7123213/content.shtml.
15 State Council, “推进制度型开放若干措施的通知” [Notice on several measures to promote institutional opening-up], June 29, 2023, https://www. gov.cn/zhengce/content/202306/content_6889026.htm.
China's pricing of credit has become more efficient since 2010
Difference between average interest rate for nonfinancial corporations and forecasted GDP growth, 2023 vs. 2010 (—).
Differences shown in absolute value. The calculation used is as follows: Average annual interest rate for loans to nonfinancial corporations, subtracting the average of the projected GDP growth rate in the current and following year. The indicator serves as a proxy for the efficiency of credit allocation in the financial system.
Source: Average annual corporate borrowing rate from the International Monetary Fund's (IMF's) International Financial Statistics, European Central Bank, and Bank of England; GDP deflator data from the World Bank; and projected GDP growth rates from the IMF World Economic Outlook (annual average calculated from quarterly reports).
direct financing ratio for debt continues to increase
Value
(—).
United States leads in direct financing ratio for equity, China surpasses Germany and other EU market economies
Stock market capitalization as a percent share of GDP, 2023 vs. 2010 (—). Numbers reflect the
Source: World Bank.
China’s state presence in financial institutions persists in 2023
State ownership of top 10 financial institutions by market capitalization, 2023 vs. 2010 (—).
China’s financial depth has improved, though it still lags OECD Financial Institutions Depth Index, 2023 vs. 2010 (—).
This indicator captures bank credit to the private sector, the assets of the mutual fund and pension fund industries, and the size of life and nonlife insurance premiums. The index range is 0–1, where 1 represents the highest level of financial institution depth. This indicator is a useful proxy for the sophistication of the financial system in terms of financial offerings available beyond the banking system.
Source: China Pathfinder estimates based on Organisation for Economic Co-operation and Development (OECD), BIS, National Administration of Financial Regulation (China), and World Bank data.
market access in China
closer
average Financial Market Access Index, 2023 vs. 2010 (—).
The index range is 0–1, where 1 indicates the highest level of financial market access. This indicator combines two variables:(1) the percentage of market capitalization outside of top 10 largest companies to proxy access to stock markets; and (2) bond market access, estimated as the volume of corporate debt issuance in a given year per 100,000 adults. This indicator illustrates the difficulties smaller companies face in accessing the stock market and also captures the comparability between the bond market and population size.
Source: China Pathfinder estimates.
FIGURE 2.3. SELECTED SUPPLEMENTAL INDICATORS: FINANCIAL SYSTEM DEVELOPMENT (2023*)
Measure of market competition from 0 (low) to 10 (high). Source: China Pathfinder
Definition and relevance
Market economies rely on a pro-competitive environment where firms face low entry and exit barriers, market power abuses are disciplined, consumer interests are prioritized, and government participation in the marketplace is limited and governed by clear principles. These dynamics are important to the overall development of an economy because firms with healthy competitors have a greater incentive to innovate and improve productivity. This adds diversity to the market and promotes higher-quality growth.
2023 stocktaking: How does China stack up?
In 2023, China’s market competition score remained mostly unchanged compared to 2022. Persistent problems continue to hinder fair competition in the Chinese economy. The rule of law is still exceedingly weak, and SOEs and other government-controlled or influenced firms continue to have an outsized presence amongst the largest listed firms by market capitalization. While China does have a lower market concentration score than OECD economies, it is excessively low and indicative of other problems in the Chinese economy, such as interprovincial barriers to commercial activity. To its credit, China has not backslid as far as open economies have on several measures in recent years, but it remains far behind those economies on average.
We chose the following annual indicators to benchmark China’s market competition against open market economies.
Market concentration
We measure overall market concentration across all industries using the top five listed companies’ revenue as a share of total industry revenue. The higher the proportion of total revenue the five firms constitute, the more concentrated the industry. The indicator is a simple average of the calculated proportions from eleven industries: communications, consumer discretionary, consumer staples, energy, financials, healthcare, industrials, materials, real estate, technology, and utilities. The industry categorization is consistent across all countries in the sample. For countries with industries comprising less than fifty listed companies, we use the top 10 percent of the total firms in the industry instead of the top five. The indicator was constructed using data from Bloomberg.
Similar to our scoring for China in 2022, China’s economy remained relatively less concentrated than economies in our OECD sample. Our benchmark indicator of concentration decreased marginally from 38.4 percent to 38.2 percent between 2022 and 2023. This is a substantial decrease from China’s baseline measure of 55.7 percent in 2010. By contrast, the open market economy average became slightly more concentrated this year, increasing from 61 percent to 61.6 percent. Canada and France had the largest increases, adding about 5 percent industry concentration, while Germany and Canada decreased by about 5 percent.
Lower market concentration in China should be interpreted carefully, however, as excessively high and abnormally low levels of market concentration may be indicative of problems in the economy. China’s low score on market concentration is mostly the result of structural issues, whereby interprovincial barriers and local government support artificially suppress rates of firms’ market exit. Indeed, the percentage of loss-making firms continues to rise across numerous industries. Where we might expect to see some industries become increasingly concentrated, state intervention is instead enabling fragmentation in the economy. Conversely, a smaller number of industries, such as transportation and energy, are highly concentrated as the state exercises monopoly rights.
One important determinant of market competition is the role of SOEs in the economy. Our indicator for this area is calculated by summing the market capitalization of SOEs in the top ten firms within each industry and dividing it by the total market capitalization of the top ten firms by market capitalization within each industry. This ratio is then averaged across industries to arrive at our measure of SOE presence. This procedure remedies an issue in earlier editions of China Pathfinder, where the massive assets held by Chinese SOEs compared to their counterparts in OECD economies were insufficiently reflected in the benchmark. The process is repeated for the eleven industries listed in the market concentration indicator description.
Government ownership disclosures reported by companies in market economies capture the extent of state ownership more reliably. For these countries, a company was considered an SOE if the government owned 50 percent or more of its shares. However, many Chinese SOEs’ largest shareholders are not clear-cut government entities such as the State-owned Assets Supervision and Administration Commission (SASAC) of the State Council or Ministry of Finance. The team used firm-reported ownership information from WIND supplemented with Chinese-language reporting to conduct outside research on Chinese companies, determining whether a company counted any of the following governmental entities as a key shareholder:
● other SOEs;
● the Central Huijin Investment Co. (a state-owned investment company); or
● The Hong Kong Securities Clearing Company (of which the Hong Kong government is the largest shareholder).
This supplemented the results offered in firm disclosures accessed via Bloomberg. As with prior years, the role of SOEs in China’s economy continues to be a key differentiating factor. In 2023, SOEs comprised 65.4 percent of the top ten firms’ market capitalization across industries. This represents a 14.5 percent increase over 2022’s measure, which was a 30 percent increase over 2021’s. It also increased over the 2010 benchmark, which stood at 53.6 percent. In contrast, open economies SOEs’ presence has been consistently smaller in open economies, with only Italy, France, and South Korea showing more than a couple of percentage points of state presence over the entire study period (and France, as of 2024, scored <0.5 percent). Even Italy, the economy with the largest SOE presence in the top ten firms at 12.6 percent in 2024, does not even remotely approach China’s score.
Overall, rather than show convergence with OECD market norms on the role of the state in the economy, China continues to trend in the opposite direction. As the private sector becomes increasingly marginalized, SOEs will continue to play an outsized role in China’s economy, at least in the near to medium term.
Openness to competition from foreign companies is a characteristic of open market economies. To benchmark this characteristic, China Pathfinder has to date relied upon the OECD’s FDI Regulatory Restrictiveness Index, an established indicator that measures how open an economy is to foreign competition.16 However, this data series is no longer maintained, with the last update made in 2022 (covering policies and practices of countries in 2021). For our calculations, we carry forward the latest entry in this data series. China scores 0.73 on this index, which ranges from zero (most restrictive) to one (least restrictive). The open market economy average is, by comparison, 0.92. While China has improved notably over its 2010 baseline of 0.53, the latest update to this series leaves it far below its market economy counterparts. Indeed, discrimination against foreign firms remains a large problem in China, with continuing complaints from foreign companies regarding forced technology transfers, unequal access to procurement, and little progress on easing the Negative List for foreign investment.
Another key ingredient for a competitive marketplace is the fair and impartial enforcement of rules. The World Bank’s Rule of Law Index captures the extent to which actors have confidence in the law, including elements such as the quality of contract enforcement, property rights, and the courts. Our adjusted index ranges from zero to five, with lower values representing less ruleof-law-based governance. On this indicator, China lags
16 Blanka Kalinova, Angel Palerm, and Stephen Thomsen, “OECD’s FDI Restrictiveness Index. 2010 Update,” OECD Working Papers on International Investment, No. 2010/03, Organisation for Economic Co-operation and Development, August 1, 2010, https://doi. org/10.1787/5km91p02zj7g-en.
far behind its open economy peers. The update to this year’s metric saw China remain around 2.5. The open economy average regressed very slightly from 3.8 to 3.7. China has made little progress on this indicator over its 2010 benchmark, especially compared to its progress on many other indicators.
On balance, China experienced mild backsliding in our Market Competition Composite Index from 4.3 in 2022 to 4.2 in 2023. In comparison, the score for our sample of open market economies also declined marginally from 7.31 to 7.22 over the same period (Figure 25).
While China’s score has improved greatly since 2010 (where it scored a 1.7), it appears that further progress on market competition has stalled. Excluding the data with no new updates for 2023, China backslid on every other benchmark indicator this year (market concentration, SOE presence, and rule of law). While there are segments of the economy that exhibit true competitiveness and have robust market dynamics, overall, China’s economy falls far short of open economy norms. The primary issue is the role of the state in reducing market competitive dynamics. SOEs have monopolies in numerous sectors, government subsidies and interprovincial barriers sustain firms that would otherwise fail, and the reach of the CCP into corporate affairs subverts the rule of law.
While the magnitude of decline on average in our market economy sample was roughly equivalent to that of China’s, these economies have, overall, sustained a much higher level of market competitive dynamics year over year; the average for open economies in 2010 was 7.5, close to their 2023 score. Overall, our quantitative indicators show that China is not on track to close the gap with OECD countries. Moreover, these quantitative indicators only capture market competition in part. Dynamics such as informal barriers to market participation (discrimination in procurement against foreign and private companies), uneven access to industrial policies amongst firms, and the influence of the CCP in corporate governance via grassroots party organization and administrative guidance can’t be adequately quantified by the currently available data, but complement the picture painted by our benchmarks.
To help address these gaps, we track policy developments in 2023 below and present a number of alternative indicators. These include more granular measures of state ownership in the Chinese economy.17
A year in review: China’s 2023 market competition policies and developments
Overall, policy trends in 2023 reinforced the backsliding found in our quantitative indicator. In 2013, Chinese President Xi Jinping emphasized the importance of market mechanisms in guiding resource allocation. Over a decade later, such aspirations have yet to achieve their full potential, and the role of the state in the economy is resurgent. Combined with arbitrary, stringent regulations and a pervasive focus on national security, this left a pessimistic outlook for both the domestic and foreign business communities.
Several pieces of legislation posed heightened challenges for business operations in China in 2023, especially for foreign firms. For example, the Cyberspace Administration of China (CAC) finalized the Cross-border Transfer of Personal Information Standard Contract, which included many provisions that were ultimately stricter than what had been proposed in working drafts. It introduced additional measures enforcing stricter alignment of any crossborder transfer agreement with that of the Standard Contract and heightened the requirement of monitoring by Chinese authorities of foreign recipients of personal information. For foreign companies, especially those in financial services and technology, these rules pose steep barriers to their operations and cause essentially discriminatory treatment in the domestic market.
Similarly, China’s Anti-Espionage Law received an amendment and went into effect in the middle of 2023. It was widely noted to be ambiguous in its formulation, with new language added broadening the scope of potential espionage targets to include “all documents, data, materials, and articles” related to national security interests.18 Because “national security interests” as a term is ill defined and potentially expansive, foreign companies have feared that these rules could be applied arbitrarily. Such worries built off a series of raids on foreign consulting groups, including Mintz Group, Capvision, and Bain & Company, where staff were detained for questioning.19 A large fine was additionally levied on Deloitte for allegedly failing to perform its duties adequately in auditing China Huarong Asset Management Company. 20 Lastly, Chinese regulators directed SOEs and publicly traded domestic firms to heighten scrutiny when hiring foreign accounting firms, which has further restricted the ability of auditors to independently assess Chinese company data. These events highlight the tighter supervision of data, especially sensitive economic data, by Beijing and have disproportionately affected foreign firms.
17 Methodologies to measure market competition,” OECD, accessed September 25, 2024, https://web-archive.oecd.org/temp/2022-12-16/547046methodologies-to-measure-market-competition.htm.
18 Standing Committee of the National People’s Congress, “中华人民共和国反间谍法” [Counterespionage Law of the People's Republic of China], April 26, 2023, https://flk.npc.gov.cn/detail2.html?ZmY4MDgxODE4N2FhMzJmOTAxODdiZDJlNDQwYjA1MmE=.
19 Kelly Ng, “Capvision: China raids another consultancy in anti-spy crackdown,” BBC, May 9, 2023, https://www.bbc.com/news/world-asiachina-65530082.
20 Reuters, “China fines Deloitte $31 million for auditing negligence,” March 17, 2023, https://www.reuters.com/business/china-fines-deloitte-31-mlnauditing-negligence-2023-03-18/.
There were some improvements in the policy environment in the latter half of 2023. The State Council sought public comments on several issues concerning private sector investment, such as market entry barriers, unfair competition, and arbitrary fines. There was a recognition by officials that further guidance and potential easing of cross-border data transfers would be forthcoming, but that has yet to materialize. The CAC hinted that some personal information involved in routine commercial activities, such as cross-border shopping, may be exempt from security assessments.
Ultimately, however, optimism for improvements faded as meaningful changes failed to materialize. Firms, especially foreign ones, have been left facing more uncertainty. Clarifying regulations and standards and ensuring the equal treatment of foreign versus domestic and state versus private firms would do much to repair the loss of confidence in the business community in 2023.
FIGURE 2.5. ANNUAL INDICATORS: MARKET COMPETITION, 2023
China’s market concentration lower than most market economies’ Top five firms’ share of total sector revenue, 2023 vs. 2010 (—).
The market concentration indicator measures the percentage of each sector’s revenue that the top five companies of that sector make up. If five firms make up a higher percentage, then the market is considered more concentrated and less competitive. For sectors with less than 50 listed companies total, the top 10 percent of companies are used (for instance, we use the top three firms in calculating share of total sector revenue if the sector has only 30 listed firms).
Source: Bloomberg.
China reduced policy restrictions on FDI, other economies stagnated FDI Openness Index, 2021* vs. 2010 (—).
The FDI Restrictiveness Index measures statutory restrictions on foreign direct investment (FDI) in twenty-two economic sectors. We use an inverse version of the original index. The range is 0 to 1, where 0 represents the most restrictive on FDI and 1 represents the least restrictions on FDI.
Source: OECD.
State ownership remains prevalent in Chinese market
Proportion of SOEs in top 10 companies, all sectors, 2023 vs. 2010 (—).
The indicator defines an SOE as a company where the government holds at least a 50 percent share. The top 10 companies are determined by firms that have the highest market capitalization in their respective sectors. The process is applied across 11 industries: communications, consumer discretionary, consumer staples, energy, financials, healthcare, industrials, materials, real estate, technology, and utilities.
Source: Bloomberg.
China’s enforcement of market rules improved marginally amidst most market economies’ backsliding Rule of Law Index, 2022* vs. 2010 (—).
The Rule of Law Index reflects perceptions of the extent to which agents have confidence in and abide by the rules of society—in particular, the quality of contract enforcement, property rights, the police, and the courts, as well as the likelihood of crime and violence. We adjust the original range of -2.5 to 2.5 to one of 0–5 for legibility reasons. Higher scores represent stronger governance.
Source: The Worldwide Governance Indicators (WGI), World Bank.
Measure of market competition from 0 (low) to 10 (high). Source: China Pathfinder
Definition and relevance
Market economies rely on innovation to drive competition, increase productivity, and create wealth. Innovation system designs vary across countries. However, market economies generally employ systems that rely on government funding for basic research but emphasize private sector investment, encourage the commercial application of knowledge through the strong protection of IP rights, and encourage collaboration with and participation of foreign firms and researchers, except in defense-relevant technologies.
2023 stocktaking: How does China stack up?
China’s innovation system reform efforts in 2023 were similar to those in the previous year, lagging many of the developed economies in the sample. China’s IP was less attractive globally and fewer high-quality patents were filed by Chinese entities. Increases in OECD spending on research and development (R&D) outpaced that of China’s, as well, though China performed marginally better in securing venture capital (VC) spending than comparable economies. In general, we evaluate that progress in reforming the innovation system has stagnated.
We chose the following annual indicators (also used in previous China Pathfinder reports) to benchmark China’s track record against open market economies in terms of a modern innovation system.
National spending on research and development
R&D expenditures as a percentage share of GDP measure R&D spending relative to comprehensive economic activity across the economies in our sample.
China’s R&D expenditure as a share of GDP has steadily increased from 1.7 in 2010 to 2.55 in 2022, as expected of countries moving toward innovationdriven economic growth. At 2.55 percent, China’s share significantly converged toward the OECD average of 2.64 in 2022. However, in 2023, China’s funding ratio stagnated at its 2022 level, while the OECD average marginally increased to 2.67. While spending on R&D and innovation is likely to remain a high priority for China’s central and local governments, as articulated in high-level policy documents, the need for increased spending for social welfare—for example, on pensions and health care—due to an aging population, alongside stagnating growth prospects and local government fiscal debt burdens, is straining the fiscal space available to continue increasing funding for R&D.
Venture capital attractiveness
While recognizing the limitations of using R&D spending as a measure of innovation, we also look at VC investment as a share of GDP. VC plays a key role in innovation-driven entrepreneurship and shows the confidence of private sector investors in an economy’s ability to catalyze disruptive new technologies. 21
In 2023, all sampled countries experienced a decline in VC investment as a share of GDP as the global venture market took a steep downturn. According to PitchBook data, global capital invested fell to 2018–20 levels, and exit value fell to 2017 levels. 22 The United Kingdom and the United States experienced the greatest decrease in their shares (sixty-three and thirty-eight percentage points, respectively). The OECD average fell from 50 percent in 2022 to 30 percent in 2023. While China was no exception, it fared relatively better, losing only five percentage points and dropping its share from around 40 percent to 35 percent in the same period, demonstrating significant convergence toward the OECD average. This is not as strong as China’s performance in 2021, when it stood at 67 percent, compared to an OECD average of 63 percent, but marks a significant improvement from 2022, when China’s share fell ten percentage points below the OECD average. Along with heightened geopolitical risk, a reassessment in the prioritization of investing domestically, and high federal fund rates in the United States, China’s increasingly challenging business environment for foreign capital in tech and other popular VC destinations still poses barriers for foreign firms. State investment continues to be a significant driver of VC in China through government guidance funds and other vehicles as an alternative to traditional grant funding.
Triadic patent families filed
As an indicator for the quality of innovation output , we use the number of triadic patent families filed, controlled for GDP. Triadic patent families are corresponding patents filed at the European Patent Office, the United States Patent and Trademark Office, and the Japan Patent Office. They are generally considered higherquality patents and, thus, offer a better perspective than purely looking at the number of patents.
China’s total number of filed triadic patents decreased by roughly 100 in the analysis year. The number of filings by other countries either decreased (Japan, the United States, France, Germany) or increased marginally by an average of eleven patent families. Increased costs and disruptions due to the COVID-19 pandemic may have affected new patent filings in the period; China’s drop in our 2023 indicator was not as sharp as that of the United States or Japan.
International attractiveness of a nation’s intellectual property
Another proxy for a country’s innovation output quality and global relevance is the receipts for payments from abroad for the use of IP. Controlled for GDP, this indicator offers a perspective on the relative attractiveness of national IP to other nations. 23 China’s improvement on this indicator in 2022 proved temporary. In 2023, IP receipts as a share of GDP decreased by more than 50 percent to 0.06 percent of GDP, while the open economy average remained roughly the same (0.6 percent of GDP).
To measure the protection of IP, we use the International Intellectual Property Index provided by the US Chamber of Commerce’s Global Innovation Policy Center. The index is composed of fifty individual indicator scores that look at existing regulations and standards and their enforcement. Because the index was not launched until 2012, we use that year as our baseline. China’s performance on IP remains unchanged from the previous year, as do almost all rankings for the OECD countries in our sample.
Our analysis has some limitations. For example, it does not include certain unique aspects of China’s economy, like the presence of SOEs in leading sectors relevant to innovation, including telecommunications, airspace, biotech, and semiconductors. Data constraints also restrict our insight into specific components of China’s innovation ecosystem, such as subsidies or government guidance funds.
In 2023, China’s score on the Modern Innovation System Composite Index remained similar to 2022 levels, at 2.5, short of the OECD average of 4. The United States, the UK, and Germany saw the largest score decreases of 0.3, 0.4, and 0.6, respectively. Poor performance on VC, patenting, and IP attractiveness depressed the OECD average score to its 2020 level of 5.6.
The major development in innovation policy in 2023 was bureaucratic shuffling that indicates Xi and the CCP will drive the direction of China’s innovation for the foreseeable future. For one, the Ministry of Science and Technology was given a lead role in coordinating China’s R&D ecosystem. Moving forward, it will play a key part in determining the allocation of science and research-related funding. Additionally,
21 Tristan L. Botelho, Daniel Fehder, and Yael Hochberg, “Innovation-Driven Entrepreneurship,” Working Paper 28990, National Bureau of Economic Research, 2021, https://www.nber.org/system/files/working_papers/w28990/w28990.pdf.
22 Kyle Stanford, “Final data for 2023 illustrates the extent of VC’s tough year,” PitchBook, January 6, 2024, https://pitchbook.com/newsletter/finaldata-for-2023-illustrates-the-extent-of-vcs-tough-year.
23 One caveat for this indicator is that some of the input data may be subject to distortions from international tax optimization practices and balance of payments (BOP) data quality problems.
the Central Science and Technology Commission, a CCP committee, was elevated to a policymaking role in China’s R&D ecosystem. This centralizes control of China’s innovation infrastructure even further in the hands of the CCP rather than with private actors.
Although some positive indications began to emerge on artificial intelligence (AI) policy, they were ultimately overshadowed by state interference in market dynamics. Overly restrictive regulations on AI research and commercial activity were toned down in 2023, and four large generative AI models passed government assessments. But the state continues to anoint winners, and government-sponsored language models dominate the industry. More strident guidance on data use targets for industries and local authorities also leaves less and less room for the market to play a role, let alone a decisive one.
In 2024, the mood at innovative firms is somber. State sector damage to dynamism has been severe and will be difficult to reverse. Credible policy signals would need to convince anxious private companies, foreign businesses, and venture investors that market-driven innovation will not only be tolerated but promoted. Clear definitions and practical examples of what “important data” means in the CAC’s “toned-down” cross-border data flow regulations would encourage investment. Ongoing Chinese de-risking efforts driven by rising security pressures are also reducing room for technology transfers, hurting the innovation outlook. There are conciliatory steps Beijing could take to arrest that trend, such as tempering brash foreign policy postures, but few expect such a pivot.
South Korea, China, and the United States see largest relative increases in R&D spending R&D expenditures as a percent share of GDP, 2023 vs. 2010 (—).
This indicator looks at total research and development (R&D) expenditures as a percentage of GDP to ensure that those expenditures are roughly comparable regardless of a country’s aggregate economic activity levels.
Source: UNESCO Institute for Statistics.
China surpasses open economy average in venture capital investment Venture capital investment as a percent share of GDP, 2023 vs. 2010 (—).
China ahead of the United States and European countries in R&D funded by private sector Ratio of business enterprise spending to government spending on domestic R&D, 2022* vs. 2010 (—).
This ratio looks at the size of business enterprise spending relative to government spending on domestic R&D. The result is a ratio in which a higher number reflects a greater degree of R&D spending by business enterprises compared to publicly funded R&D.
Sources: OECD, Australian Bureau of Statistics, and China Pathfinder calculations.
Attractiveness of China’s IP remains low
Receipts of payments from abroad for the use of IP as a percent of country’s annual GDP, 2023 vs. 2010 (—). We
China’s quality innovation output lags behind most advanced economies
Total triadic patents filed adjusted by GDP, 2021* vs. 2010 (—).
A triadic patent family is a defined set of patents registered in various countries to protect the same innovation. Triadic patent families are filed at three of these major patent offices: the European Patent Office, the Japan Patent Office, and the United States Patent and Trademark Office. We take the simple count of triadic patent families filed by country provided by the OECD and divide it by each country’s respective GDP (in millions USD) to adjust the count by the size of that country’s economy.
Sources: OECD and patents by main technology and by International Patent Classification (IPC).
China’s IP protection developing, though gap between China and market economies remains Intellectual property protection index, 2024 vs. 2012 (—).
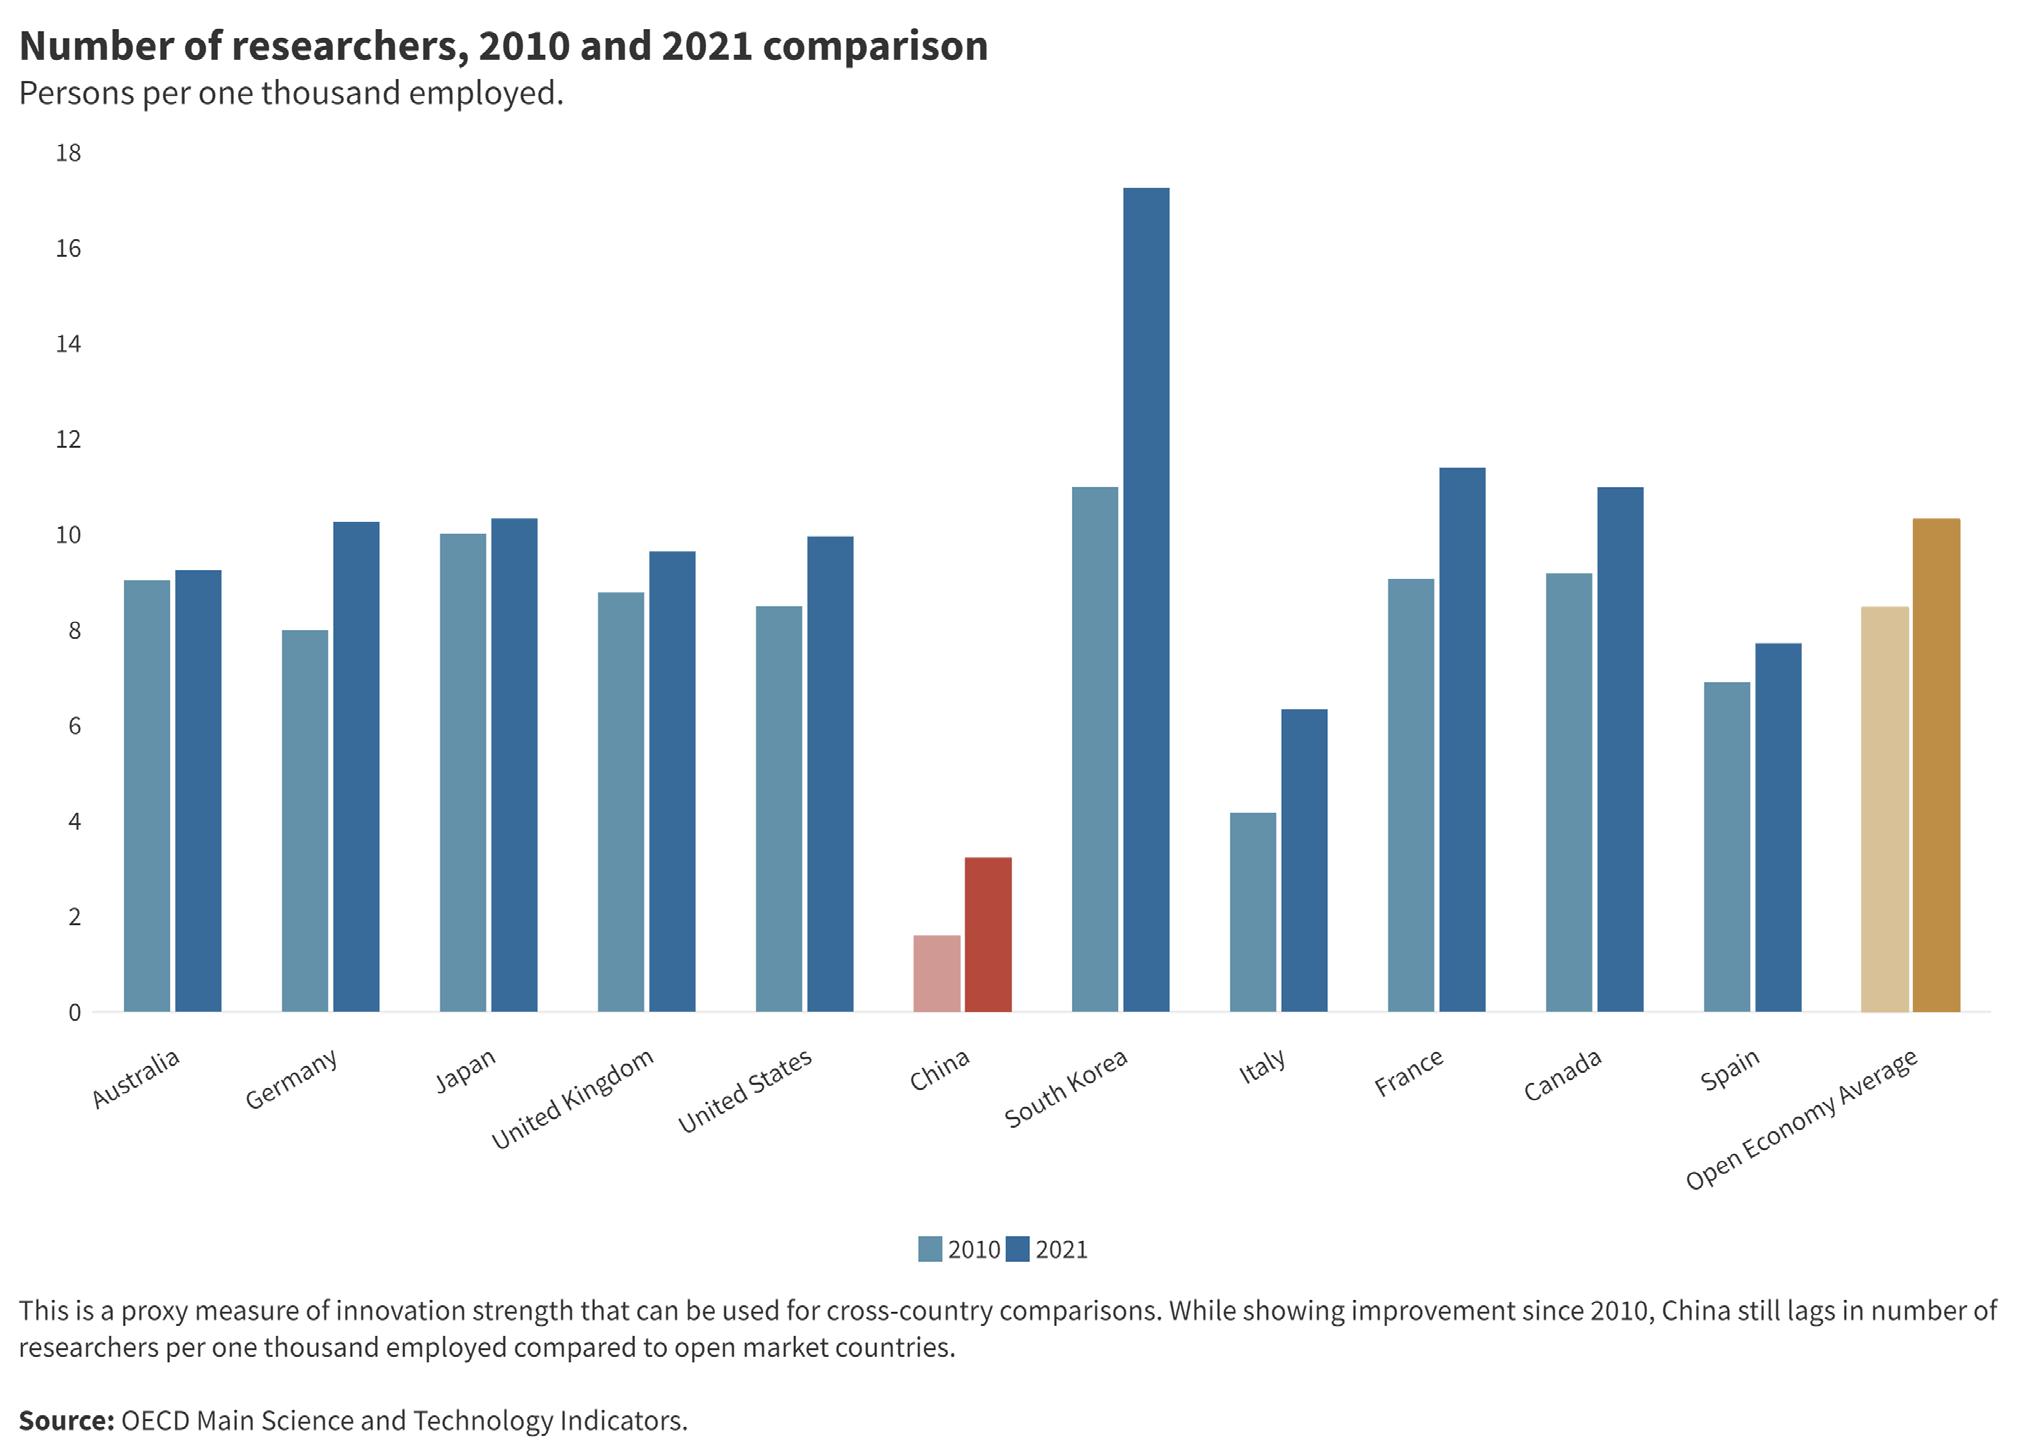
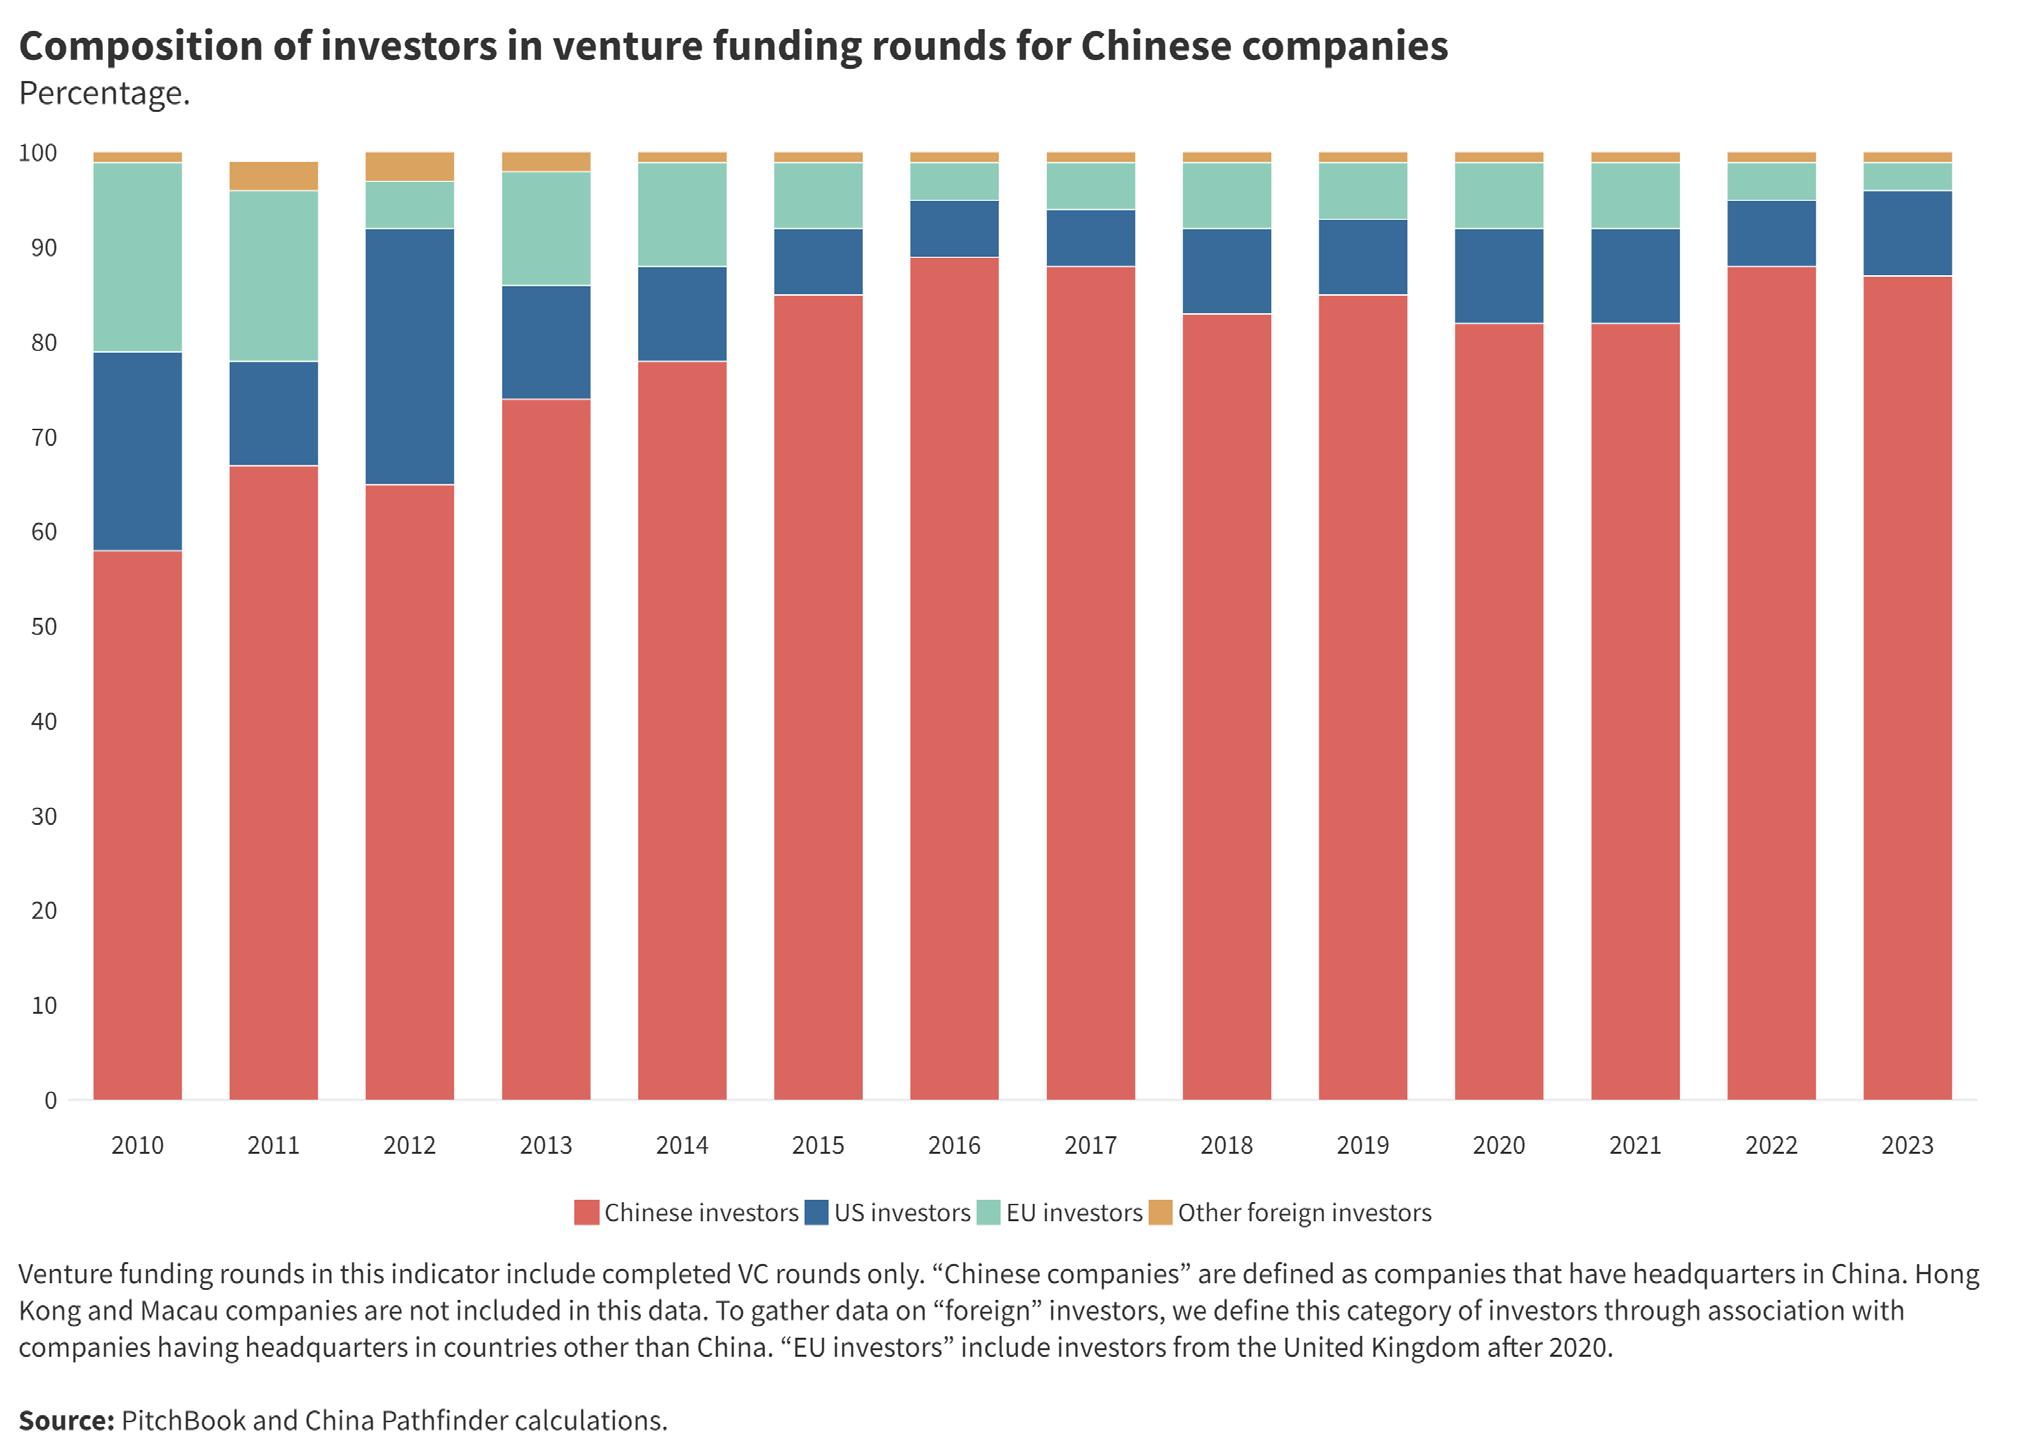
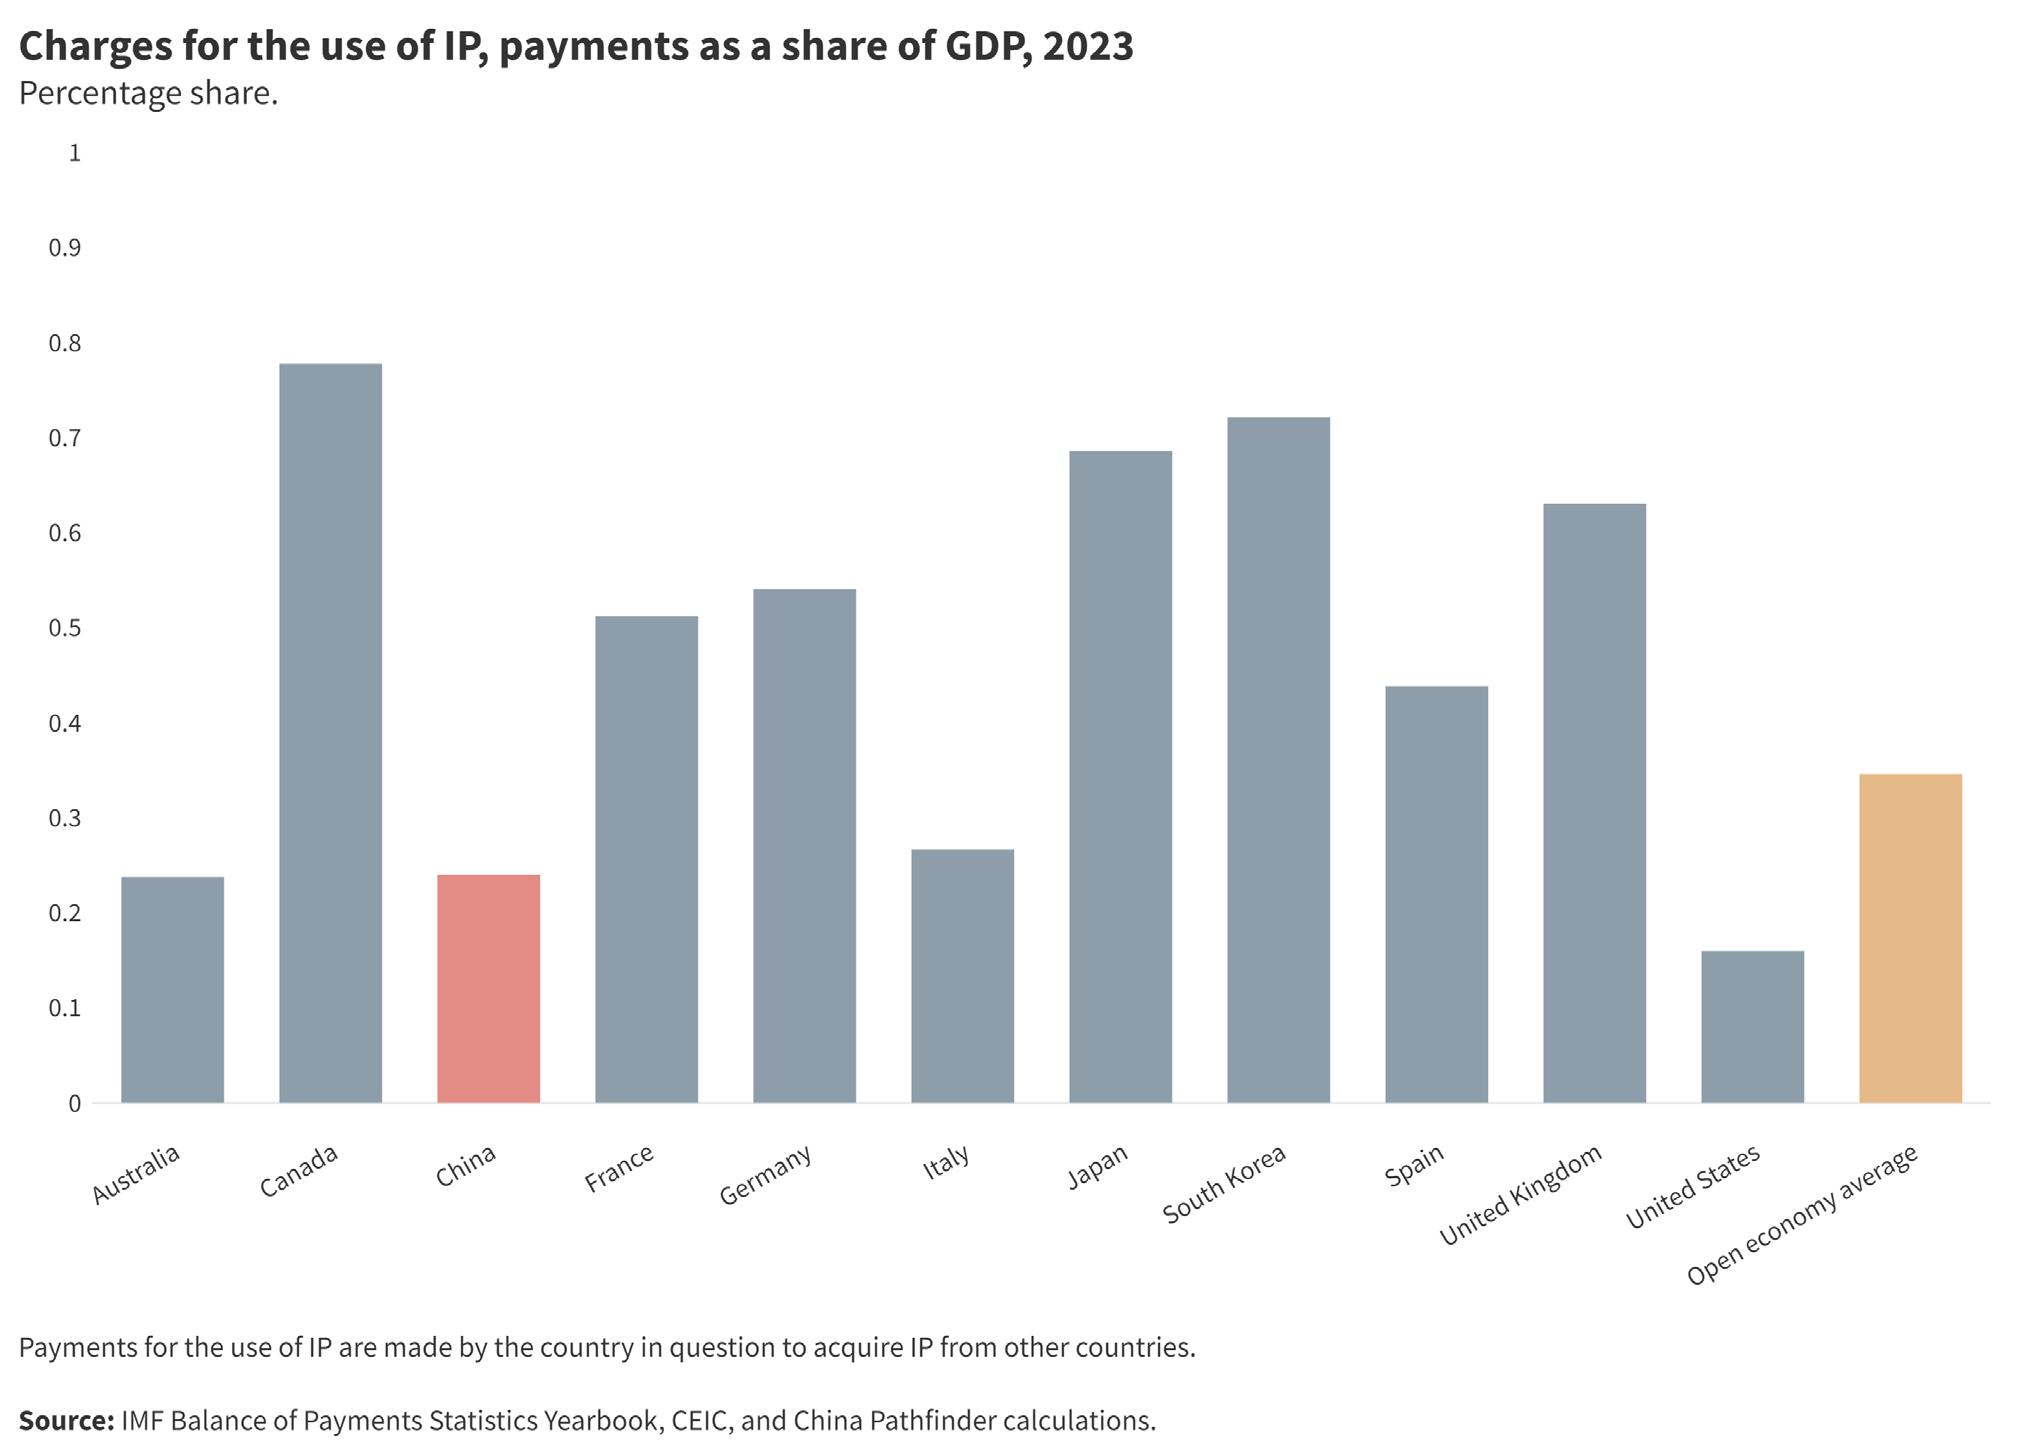
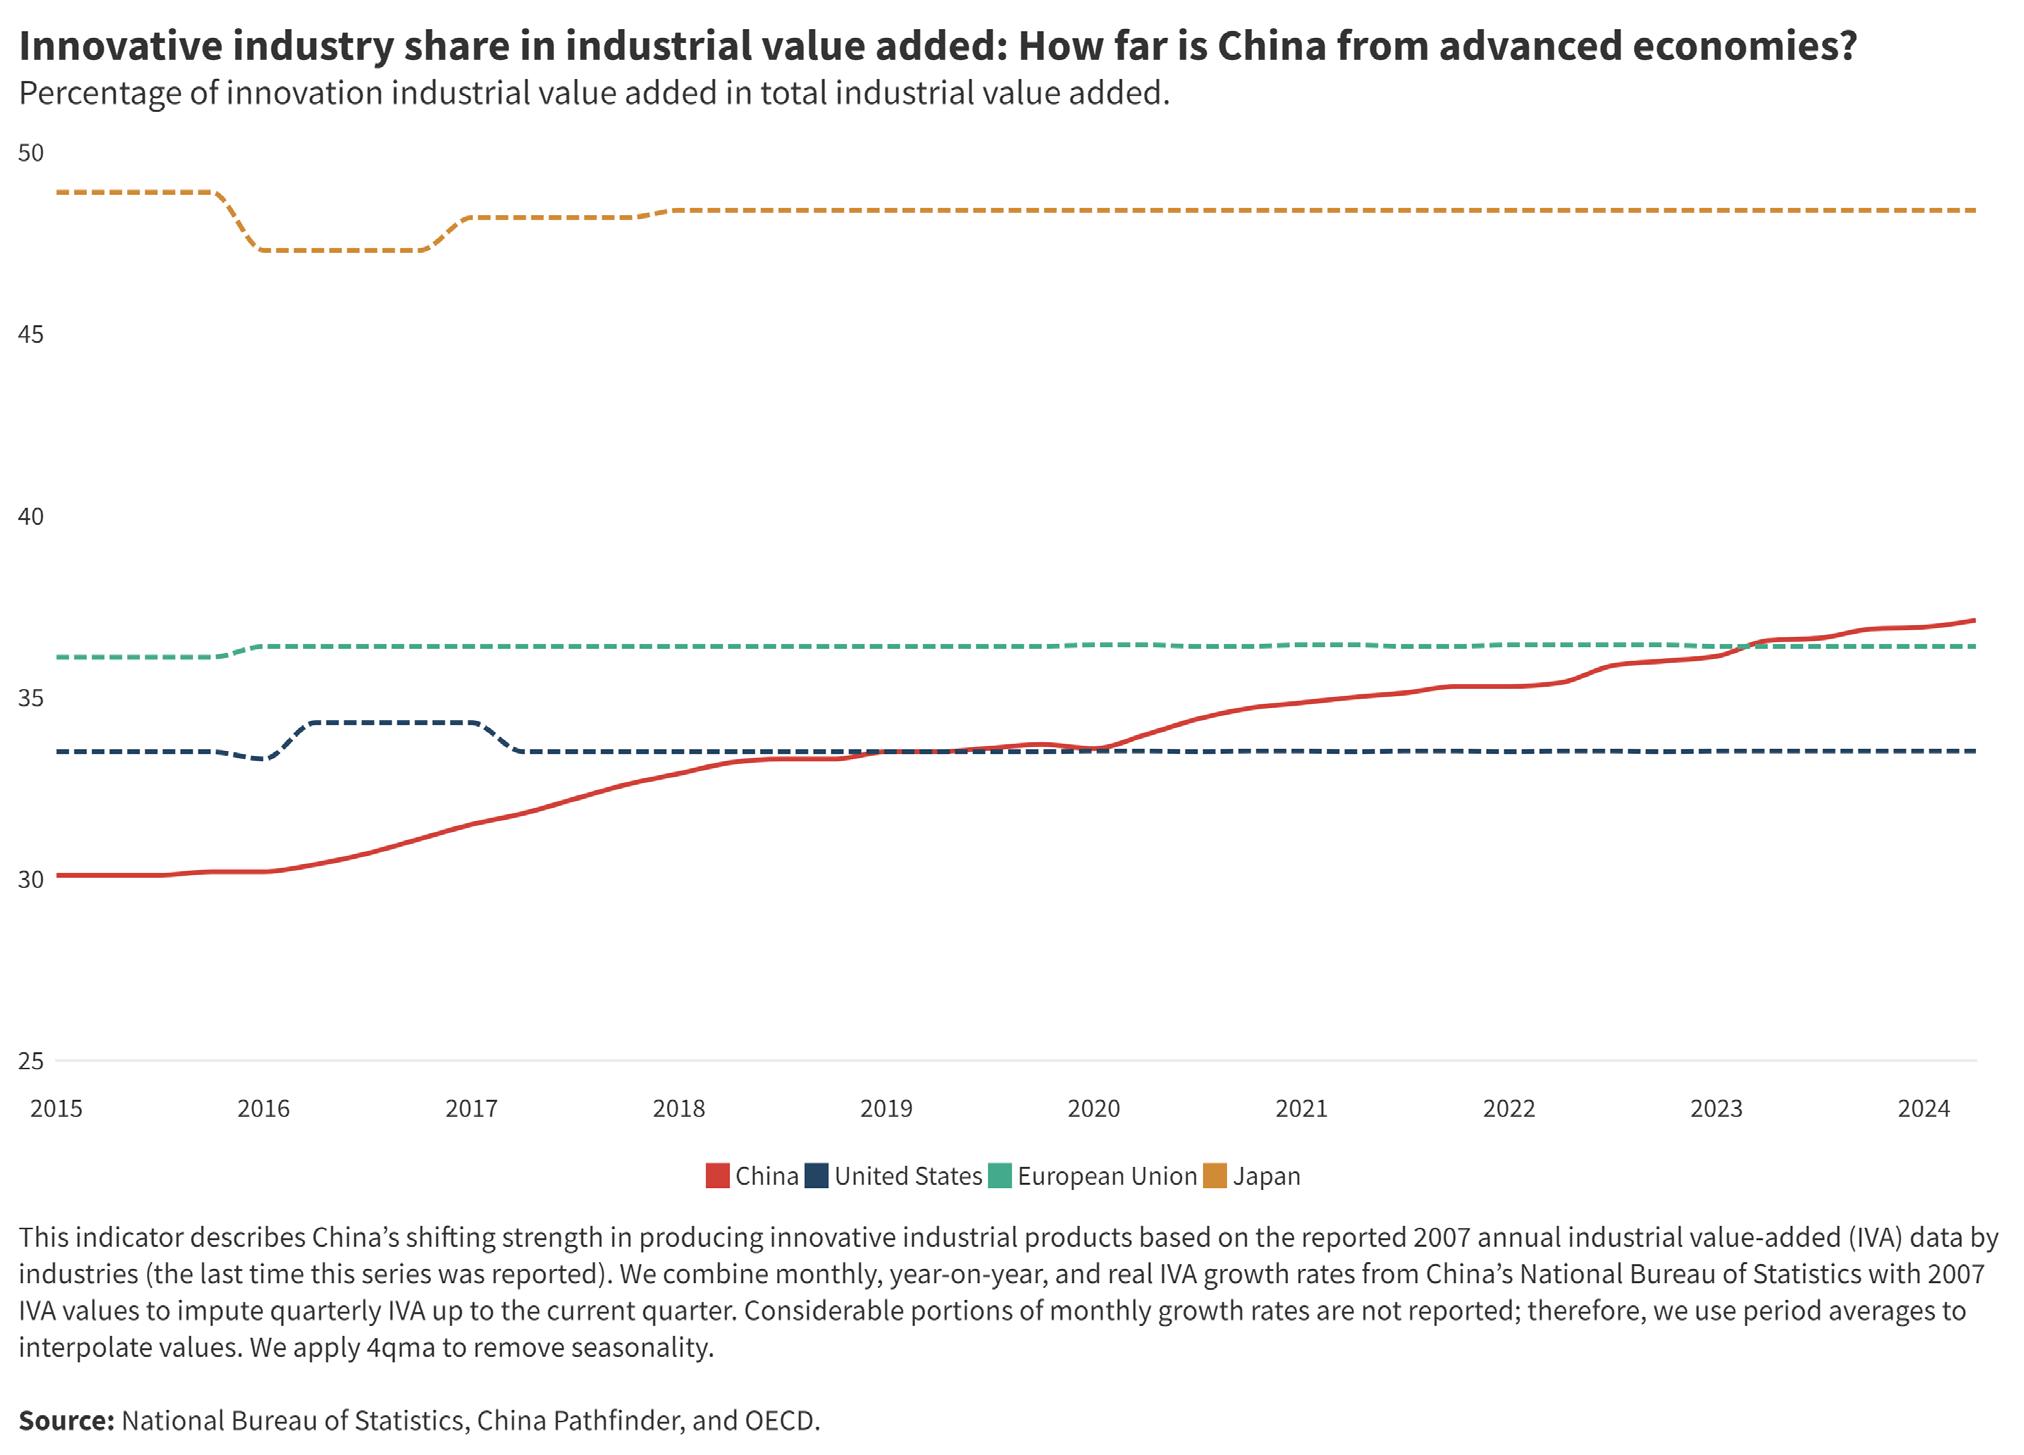
Measure of trade openness from 0 (low) to 10 (high). Source: China Pathfinder.
Definition and relevance
Free trade is a key feature of open market economies to facilitate specialization based on comparative advantage. We define trade openness as the crossborder flow of market-priced goods and services free from discriminatory, excessively burdensome, or restrictive measures. 24
2023 stocktaking: How does China stack up?
In 2023, China backslid heavily in its overall trade openness. China does perform well on metrics concerning trade in goods, but this is unsurprising given the economy’s reliance on exports to drive growth. Conversely, restrictions on trade in services continue to hold back China’s overall progress. To assess this, we apply the following annual indicators to benchmark China against open market economies.
Goods and services trade intensity
Our primary de facto trade openness indicators are gross two-way goods trade as a share of global twoway goods trade and gross two-way services trade as a share of global two-way services trade. This metric is often referred to as the trade openness ratio. However, a
low ratio doesn’t necessarily imply restrictive policies— it can also derive from the size of a country’s economy or a non-trade-friendly geographic location.
Both indicators show that China is heavily integrated into global trade flows. Of the countries under study, China has the highest trade in goods intensity, at 11.9 percent in 2023. This is a slight increase of 3.5 percent over the previous year (11.5 percent intensity), and a 33.7 percent increase over 2010 (8.9 percent intensity) . 25 Open market economies typically sustained lower scores and were more consistent year over year, with the exceptions of Germany and France, which had slight increases in their trade in goods intensity scores in 2023. The United States held the highest trade in goods intensity amongst our OECD sample at 10.6 percent.
Regarding services, China had a trade intensity of 5.2 percent in 2023. This is a decline over its 2022 score of 6.4 percent, though it remains an improvement over its 2010 baseline of 4.2 percent. Services trade intensity declined on average amongst our open economy sample as well, falling from an average of 4.2 percent in 2022 to 3.8 percent in 2023. The United States leads this group with a score of 10.7 percent, while most other open economies scored in the lower single-digit percentages.
24 Halit Yanikkaya, “Trade Openness and Economic Growth: A Cross-Country Empirical Investigation,” Journal of Development Economics 72 (1): 57–89, https://doi.org/10.1016/s0304-3878(03)00068-3.
25 The figures presented here are different from what was previously reported in China Pathfinder 2023. The underlying data series utilized for this benchmark indicator underwent revision as the OECD migrated its data platform. These balances are derivative of BOP figures and were likely updated as the 2023 figures were published. While the precise numbers are different, the direction of change and subsequent conclusions remain the same.
We utilize official tariff rates to judge the formal barriers to trade. Our methodology employs the simple mean of most favored nation (MFN) tariff rates across all product categories. We use a simple mean instead of a weighted average because the latter is often skewed downward (goods facing high tariffs are imported less, lowering their weight in the calculation). 26 The MFN rate is used instead of the applied rate for data availability and comparability across countries.
As of mid-2024, the tariff rate data from the WITS have not been updated. We thus carry forward the latest available data covering 2021. China maintained a tariff rate of 5.3 percent, which is higher than our comparison market economies, though lower than in previous years. However, it is important to note that all sampled countries reduced their tariff rates over the study period. China has reduced its MFN rate to around 3 percent since 2010, down from 8.1 percent.
For a de jure measure for services trade openness, we rely on the OECD’s Services Trade Restrictiveness Index (STRI), which measures policy restrictions on traded services across four major sectoral categories. 27 These are physical, digital, and professional services and logistics, all weighted equally. Each sectoral category also contains several specific industry subindices. A lower score on the index indicates a less open policy to services trade, with scores ranging from zero to one. This index only started to provide data in 2014, so this is the earliest year for benchmark comparison.
In 2023, China’s STRI score was 0.36, slightly higher than its 2022 score of 0.35. This indicates that the services trade became more restrictive both within China (even though it has improved notably since 2010) and in comparison to our open economy sample, which averaged 0.20 in 2022 and 0.21 in 2023. The open economy scores have consistently maintained better services trade openness scores since 2014.
Restrictions on digital services trade
In previous years, China was an even greater outlier in digital services trade, a crucial subcategory of global services trade. Our research adapts the OECD’s Digital Services Trade Restrictiveness Index (DSTRI), which measures barriers that affect trade in digitally enabled services across fifty countries. 28 This includes infrastructure, connectivity, electronic transactions, payment systems, and IP rights. The index ranges from zero to one, with higher scores indicating a greater
degree of restrictiveness. This index only started to provide data in 2014, so this is the earliest year for all countries in our sample.
In 2023, China’s DSTRI score was 0.35. This is an increase (more restrictive) over 2022’s score of 0.31. Throughout the study, China has scored higher on this benchmark than its open economy peers and has, in fact, backslid significantly from 2014. This is likely reflective of the increasing securitization and control of the digital sphere under Xi. On the other hand, OECD economies have moved little from their 2014 benchmark.
China’s Trade Openness Composite Index score in 2023 was 4.36, a notable decline from the previous year’s score of 5.11, though still an improvement over the 2010 baseline score of 3.50 (Figure 211). The primary source of this decline was the enhanced restrictions on digital services trade. China’s DSTRI index for 2023 marked the lowest score of any country in the sample over the study period. This, combined with additional decreases in trade in services intensity and reduced service trade flows, resulted in a much lower score for China’s trade benchmark. While Canada and the United States saw decreased trade scores this year, every other open market economy in the study improved.
While we have good access to basic trade-related data, our coverage faces several shortcomings. China’s trade intensity measures are a yardstick for fairness and openness. The services trade data have flaws, including significant distortions through tourism spending and hot money flows. Also, measuring services trade, including tourism, during the pandemic years can produce skewed results. Finally, some of China’s most problematic practices—for example, nontariff barriers, informal discrimination, and exchange rate interventions—are difficult to capture through internationally comparable datasets.
To help address these shortcomings, we outline below policy developments relative to trade openness and present several supplemental indicators of China’s progress in Figure 2-12.
A year in review: China’s 2023 trade policies and developments
China’s trade openness contracted in the second half of last year, marked by increased controls. Trade dragged on GDP growth in the second half of 2023 despite surging exports in some sectors that are fueling foreign concerns about dumping and spillovers from Chinese overcapacity.
26 Chad P. Bown and Douglas A. Irwin, “What Might a Trump Withdrawal from the World Trade Organization Mean for US Tariffs?” Policy Briefs 1823, Peterson Institute for International Economics, November 2018, https://www.piie.com/publications/policy-briefs/what-might-trump-withdrawalworld-trade-organization-mean-us-tariffs.
27 Organisation for Economic Co-operation and Development, OECD Services Trade Restrictiveness Index: Policy trends up to 2020, January 2, 2021, https://www.oecd-ilibrary.org/trade/oecd-services-trade-restrictiveness-index-policy-trends-up-to-2021_611d2988-en.
28 Janos Ferencz, “The OECD Digital Services Trade Restrictiveness Index,” OECD Trade Policy Papers No. 221, OECD Publishing, 2019, https://doi. org/10.1787/16ed2d78-en.
China maintains domestic subsidies and supply-side policies while decrying policy support for consumer demand as welfarism. This asymmetry leads to overcapacity, aggravating trade imbalances. Rather than acknowledge the unfair implications for producers in other nations and propose some sort of voluntary export restraints, Beijing emphasizes the decarbonization potential of its products and appeals to anxieties about global warming. Exports of electric vehicles (EVs), lithium-ion batteries, and solar products to the European Union (EU) took off in 2022 and remained high through 2023. China has also argued that its exports have a disinflationary effect on the global economy, and that countries struggling to rein in inflation should welcome China’s subsidization of its exports. 29
Parallel to these exports, China imposed export controls on key intermediate inputs for EV batteries, semiconductors, wind turbines, and other technologies. The curbs on graphite, germanium, gallium, and the technology used for making permanent rare earth magnets—China is the top producer globally of all of these—would make it more challenging for other countries to diversify their supply chains. The Ministry of Commerce (MOFCOM) and the Ministry of Science and Technology jointly invoked national security concerns in rolling out export controls on drones, laser radars, and technology used for making optical sensors, among other items. These measures are ostensibly in reaction to US controls on equipment exports and chips related to China’s high-end semiconductor sector.
At the end of 2023, China announced the end of tariff cuts on twelve chemical imports from Taiwan and accused Taipei of violating World Trade Organization (WTO) rules, ratcheting up restrictions on Taiwan trade just prior to Taiwan’s elections. At the same time, Chinese officials extended an olive branch on other goods, rescinding tariffs on Taiwanese grouper and Australian meat and barley.
China’s use of economic statecraft and political influence over trade policy is not likely to change soon. There is ample room for Beijing to change this impression by stepping up reporting of subsidies to the WTO or eliminating existing trade coercion measures. Specific actions that would indicate greater trade openness include moving away from the practice of raising or lowering the value-added tax, which distorts global crop markets; revising China’s decrees on food imports, which were implemented in 2022 and required the registration of all foreign food manufacturers; and publishing data on how Intellectual Property Action Plans have been enforced. This would demonstrate meaningful efforts to achieve fair and transparent trade practices outside of the more common trade opening measures that China has adopted, like adding free trade zones.
29 Joe Leahy et al., “Xi Jinping says China’s exports are helping to ease global inflation,” Financial Times, April 16, 2024, https://www.ft.com/ content/7cc89622-66a7-4b1c-9b2e-138f121a4731.
Tariff rate, most favored nation, simple mean, all products, percent, 2021* vs. 2010 (—).
Simple mean most favored nation (MFN) tariff rate is the unweighted average of MFN rates for all products subject to tariffs calculated for all traded goods. We use the simple average tariff rate because the weighted average could skew the outcome if certain countries had high product-import shares corresponding to limited partner countries.
Source: World Bank.
China improves but remains more restrictive on services trade than open economies
Services Trade Openness Index, 2023 vs. 2010 (—).
The OECD’s Services Trade Restrictiveness Index (STRI) measures policy restrictions on traded services across four major sectoral categories. These are logistics, physical, digital, and professional services. Each sectoral category also contains several specific industry subindices. We take the average of all four sectoral category indices to create our combined STRI index. Values are inversed from the original OECD index described in text above. The range here is 0-1, where 1 is the most open.
China increases policy restrictions on digital services trade
Digital Trade Openness Index, 2023 vs. 2010 (—).
We inverse the index so that lower values on the index indicate more restrictions to digital trade. The OECD’s Digital Services Trade Restrictiveness Index (DSTRI) measures barriers that affect trade in digitally enabled services across fifty countries. This includes policy areas such as infrastructure and connectivity, electronic transactions, payment systems, and IP rights.
Source: OECD.
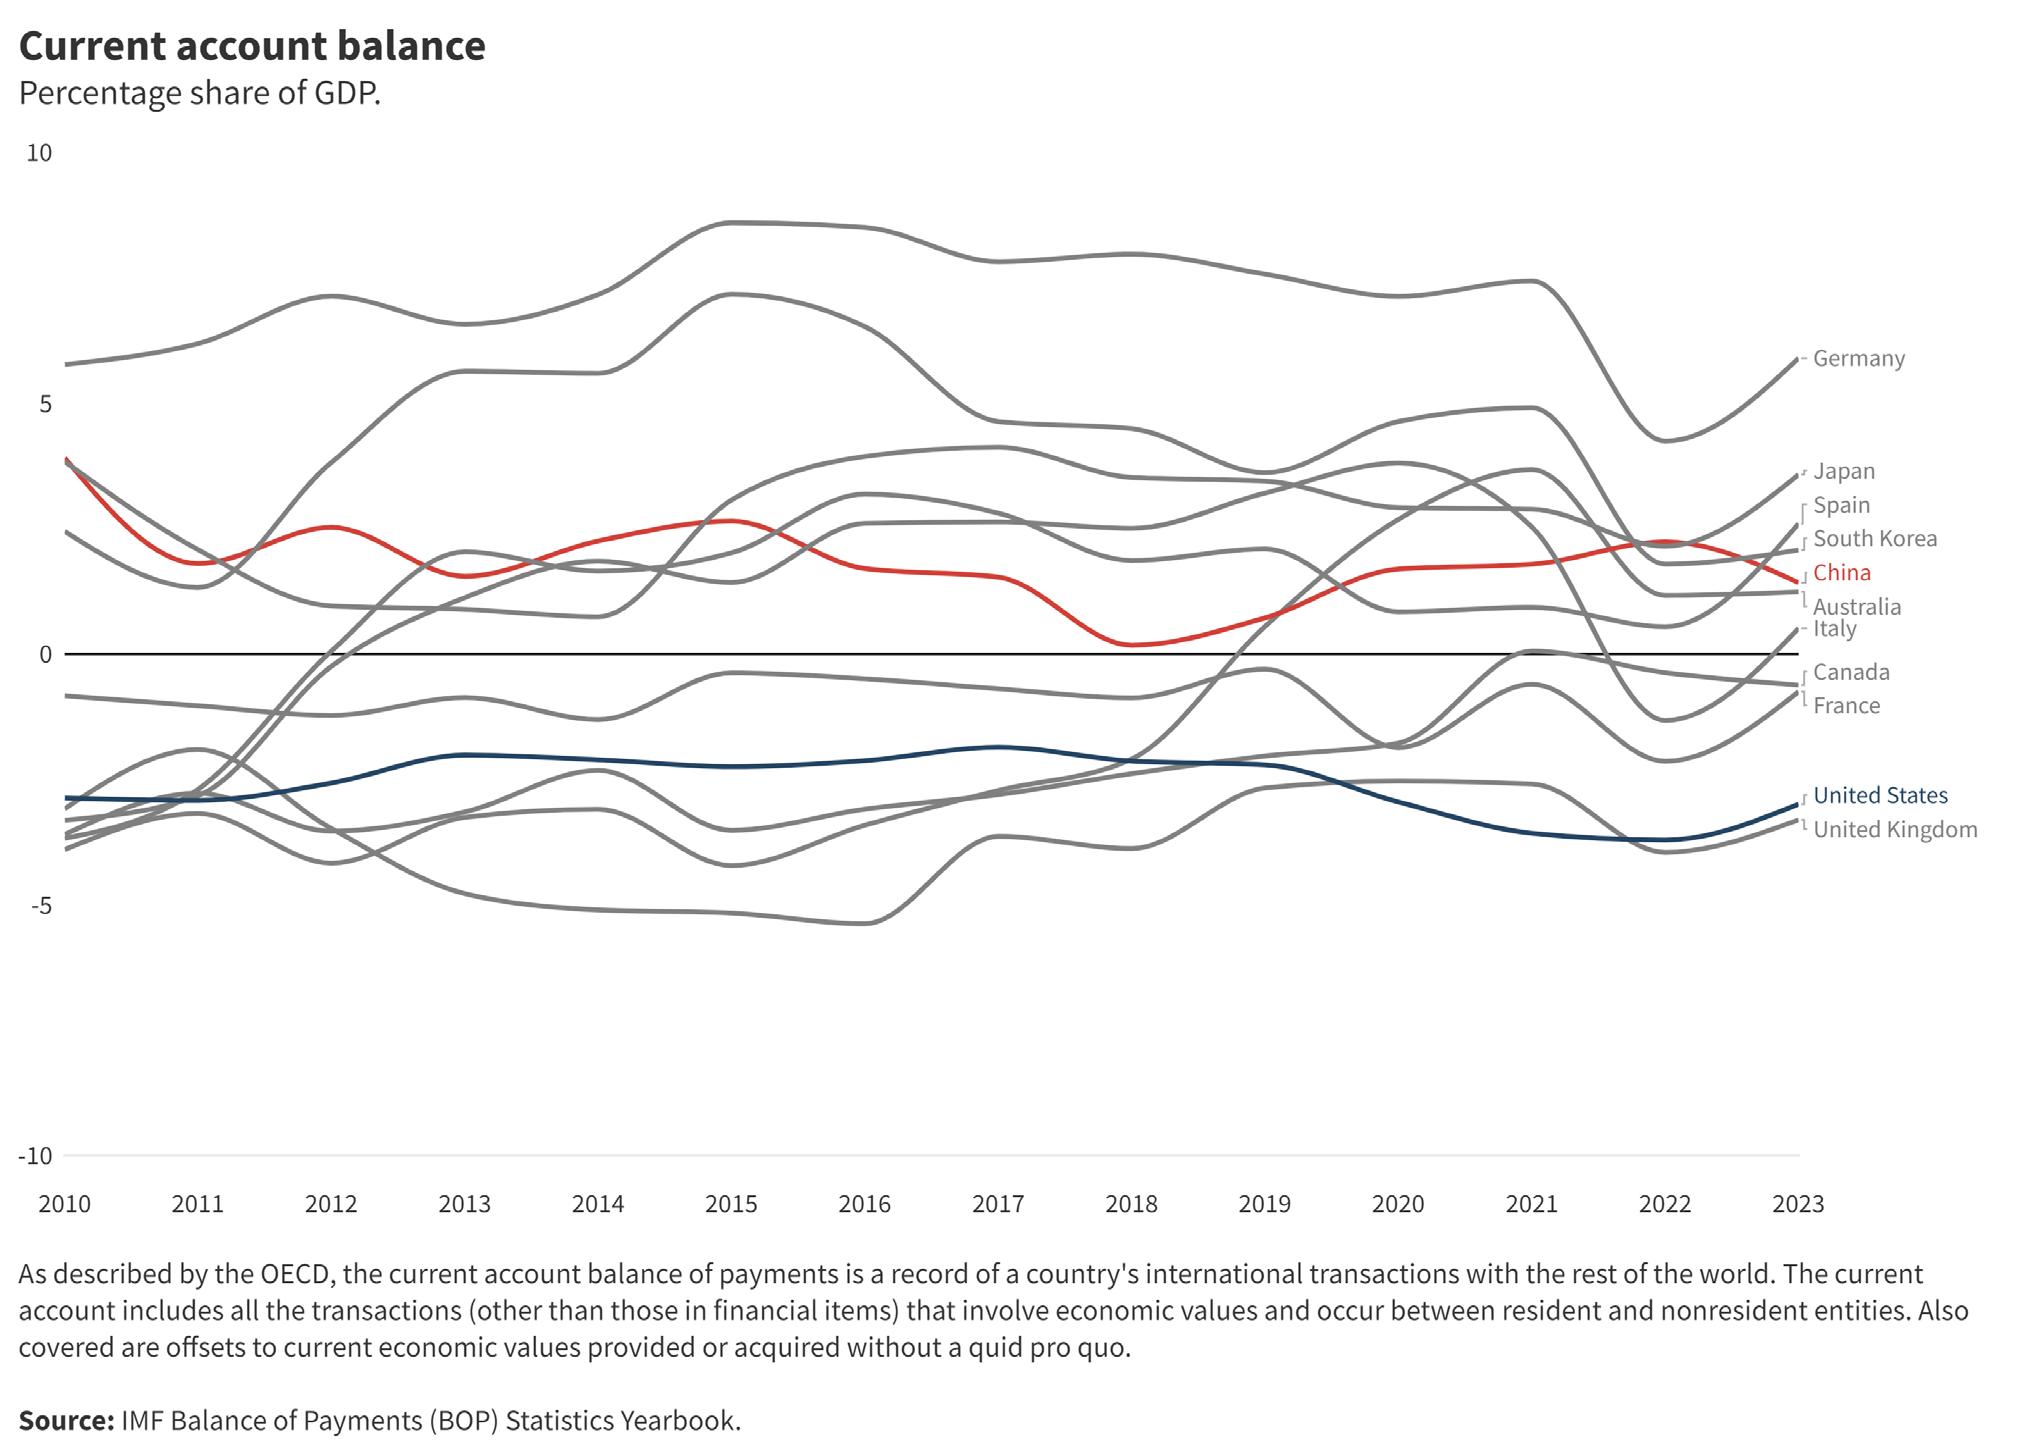
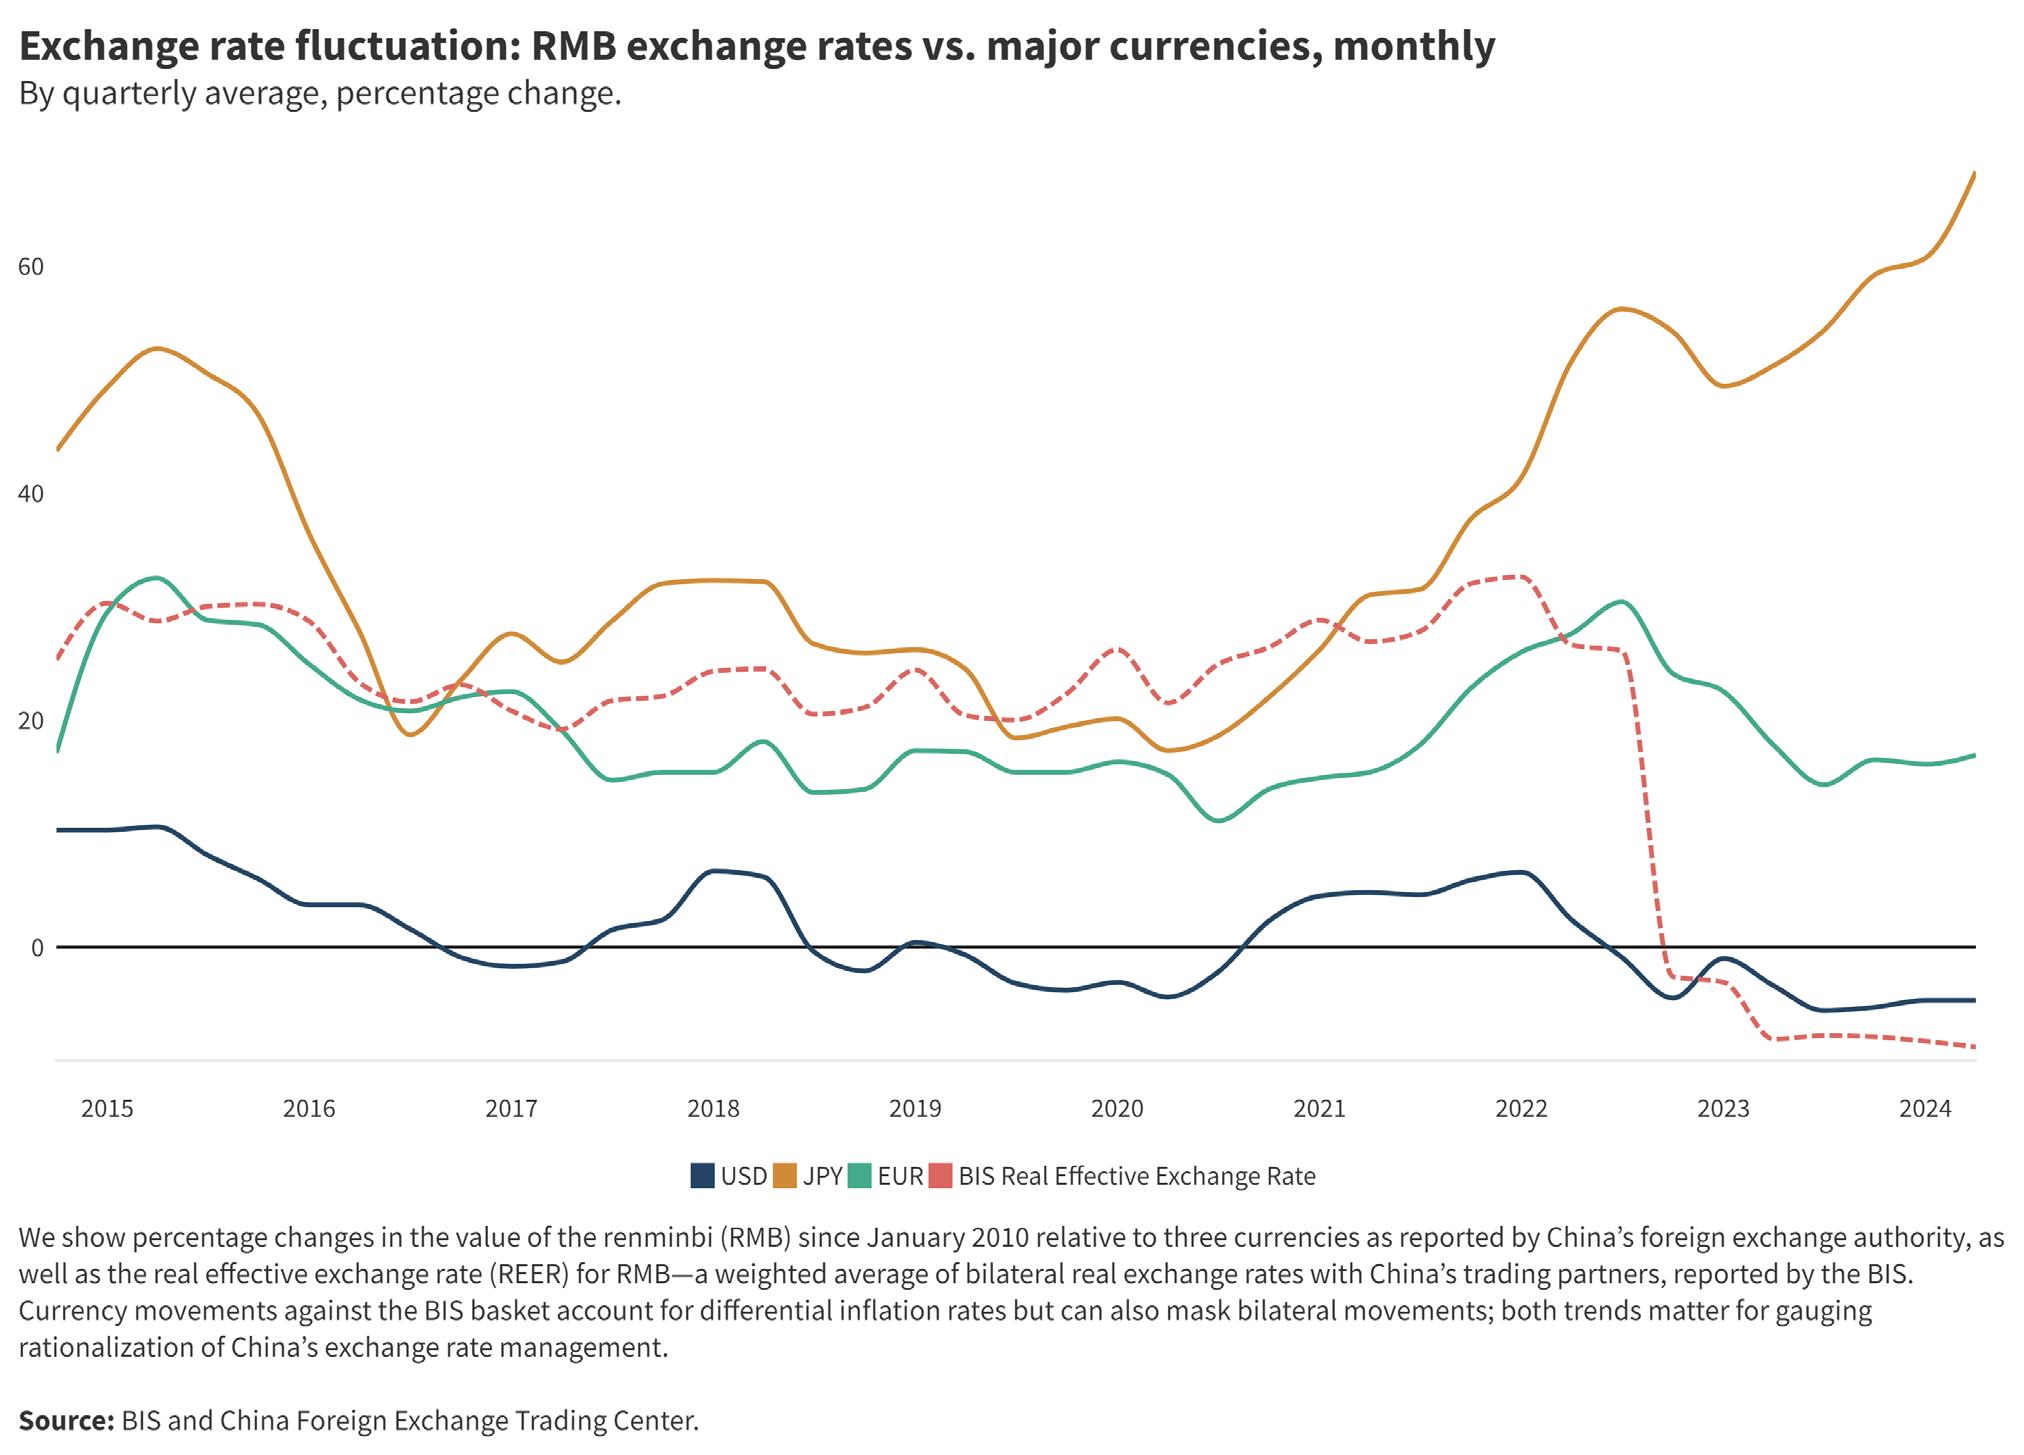
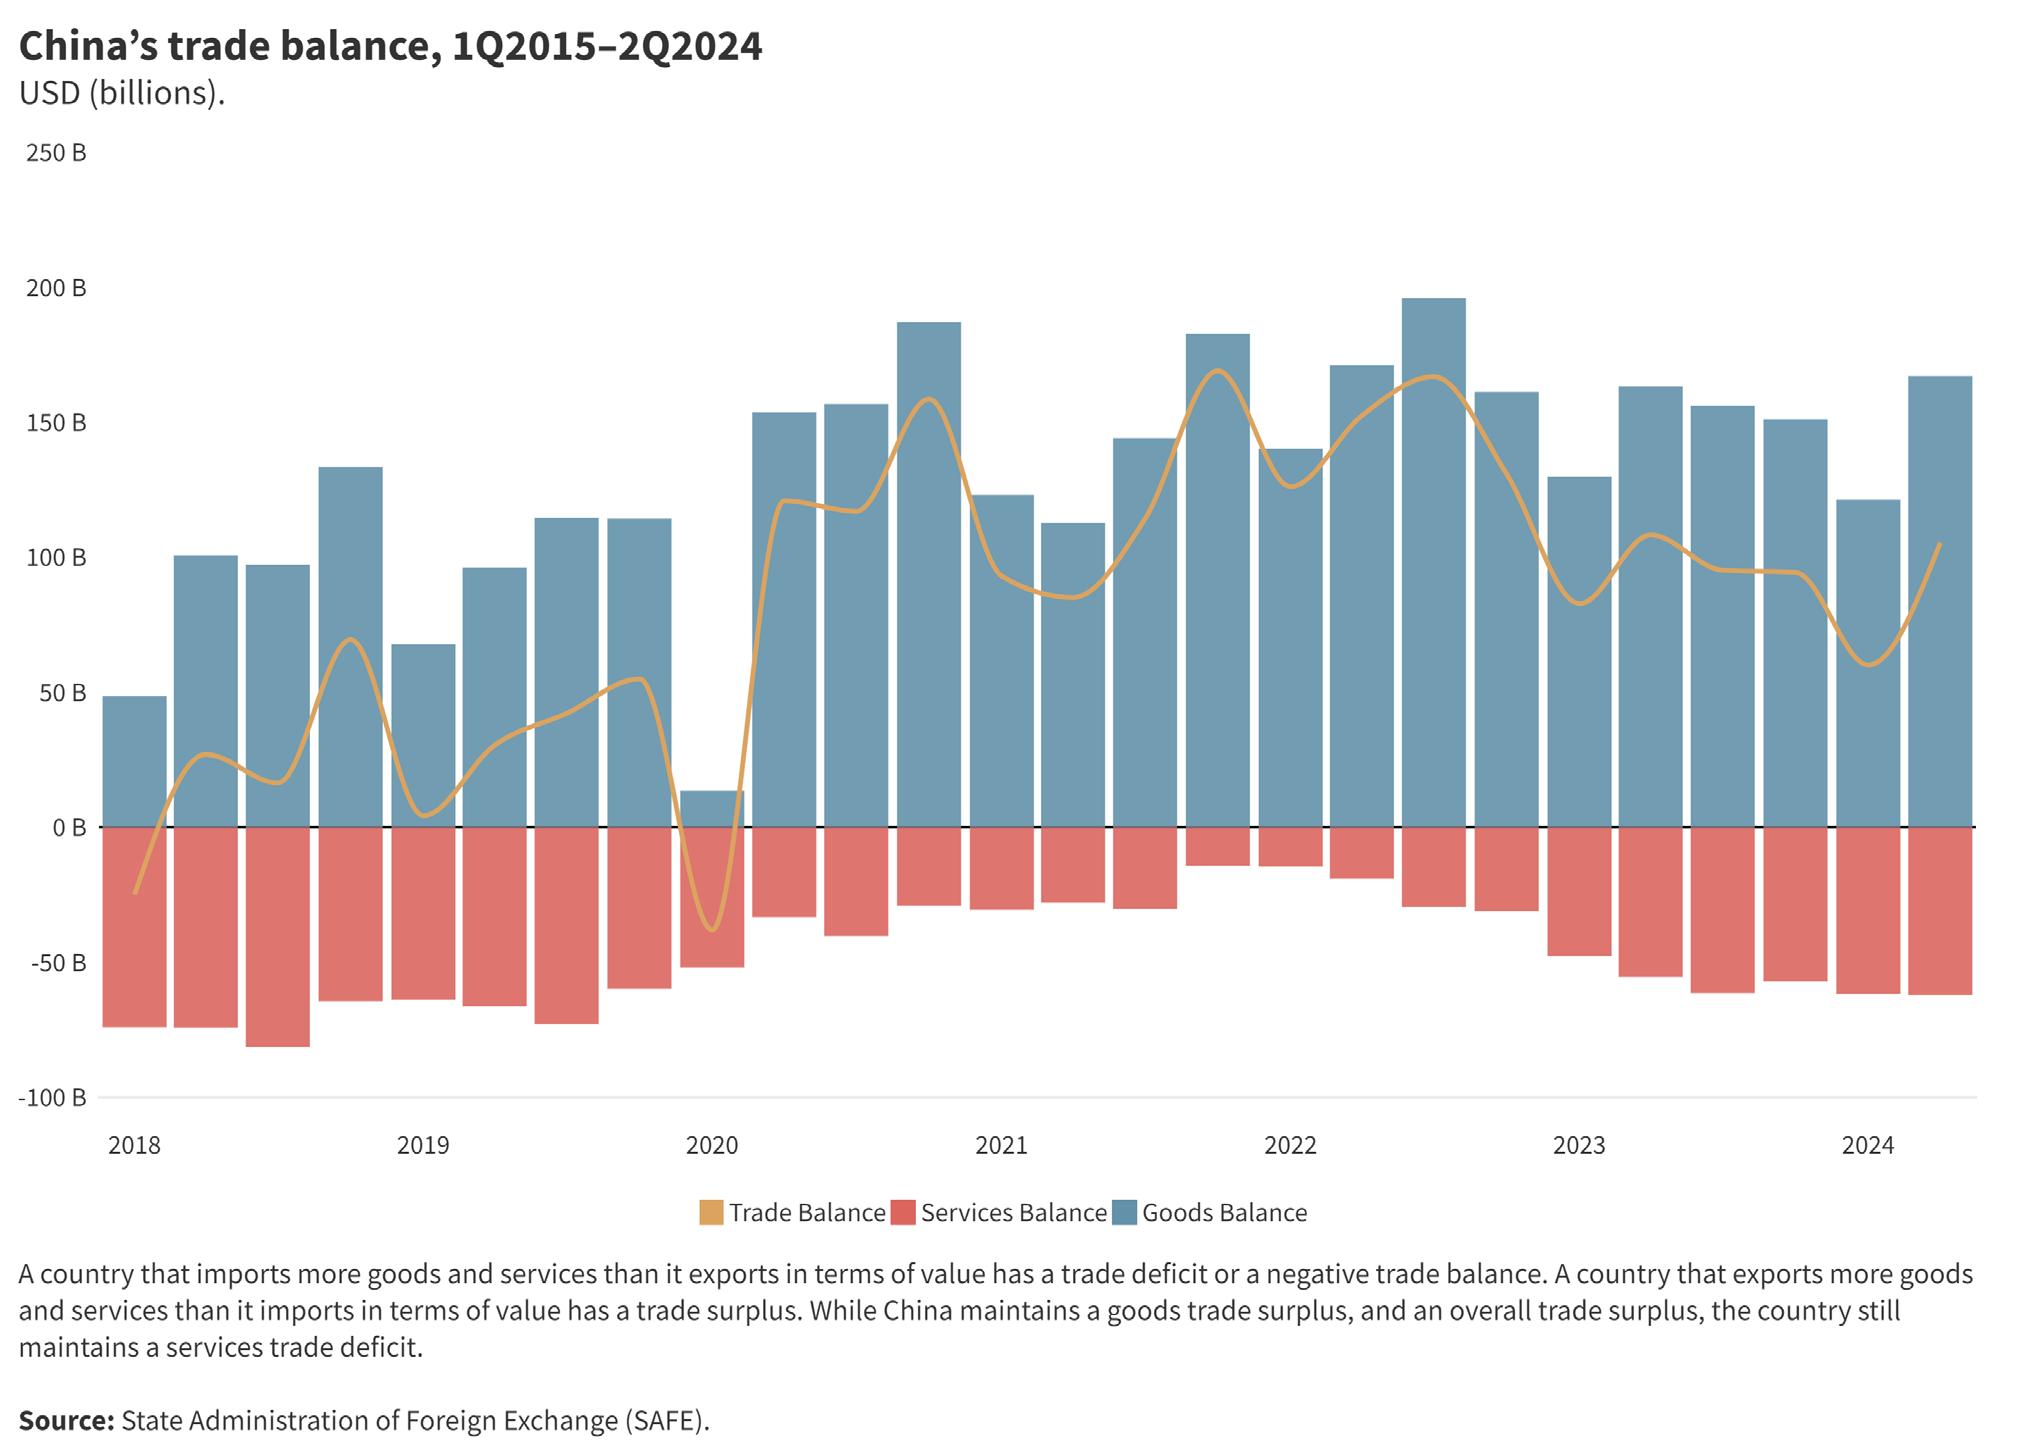
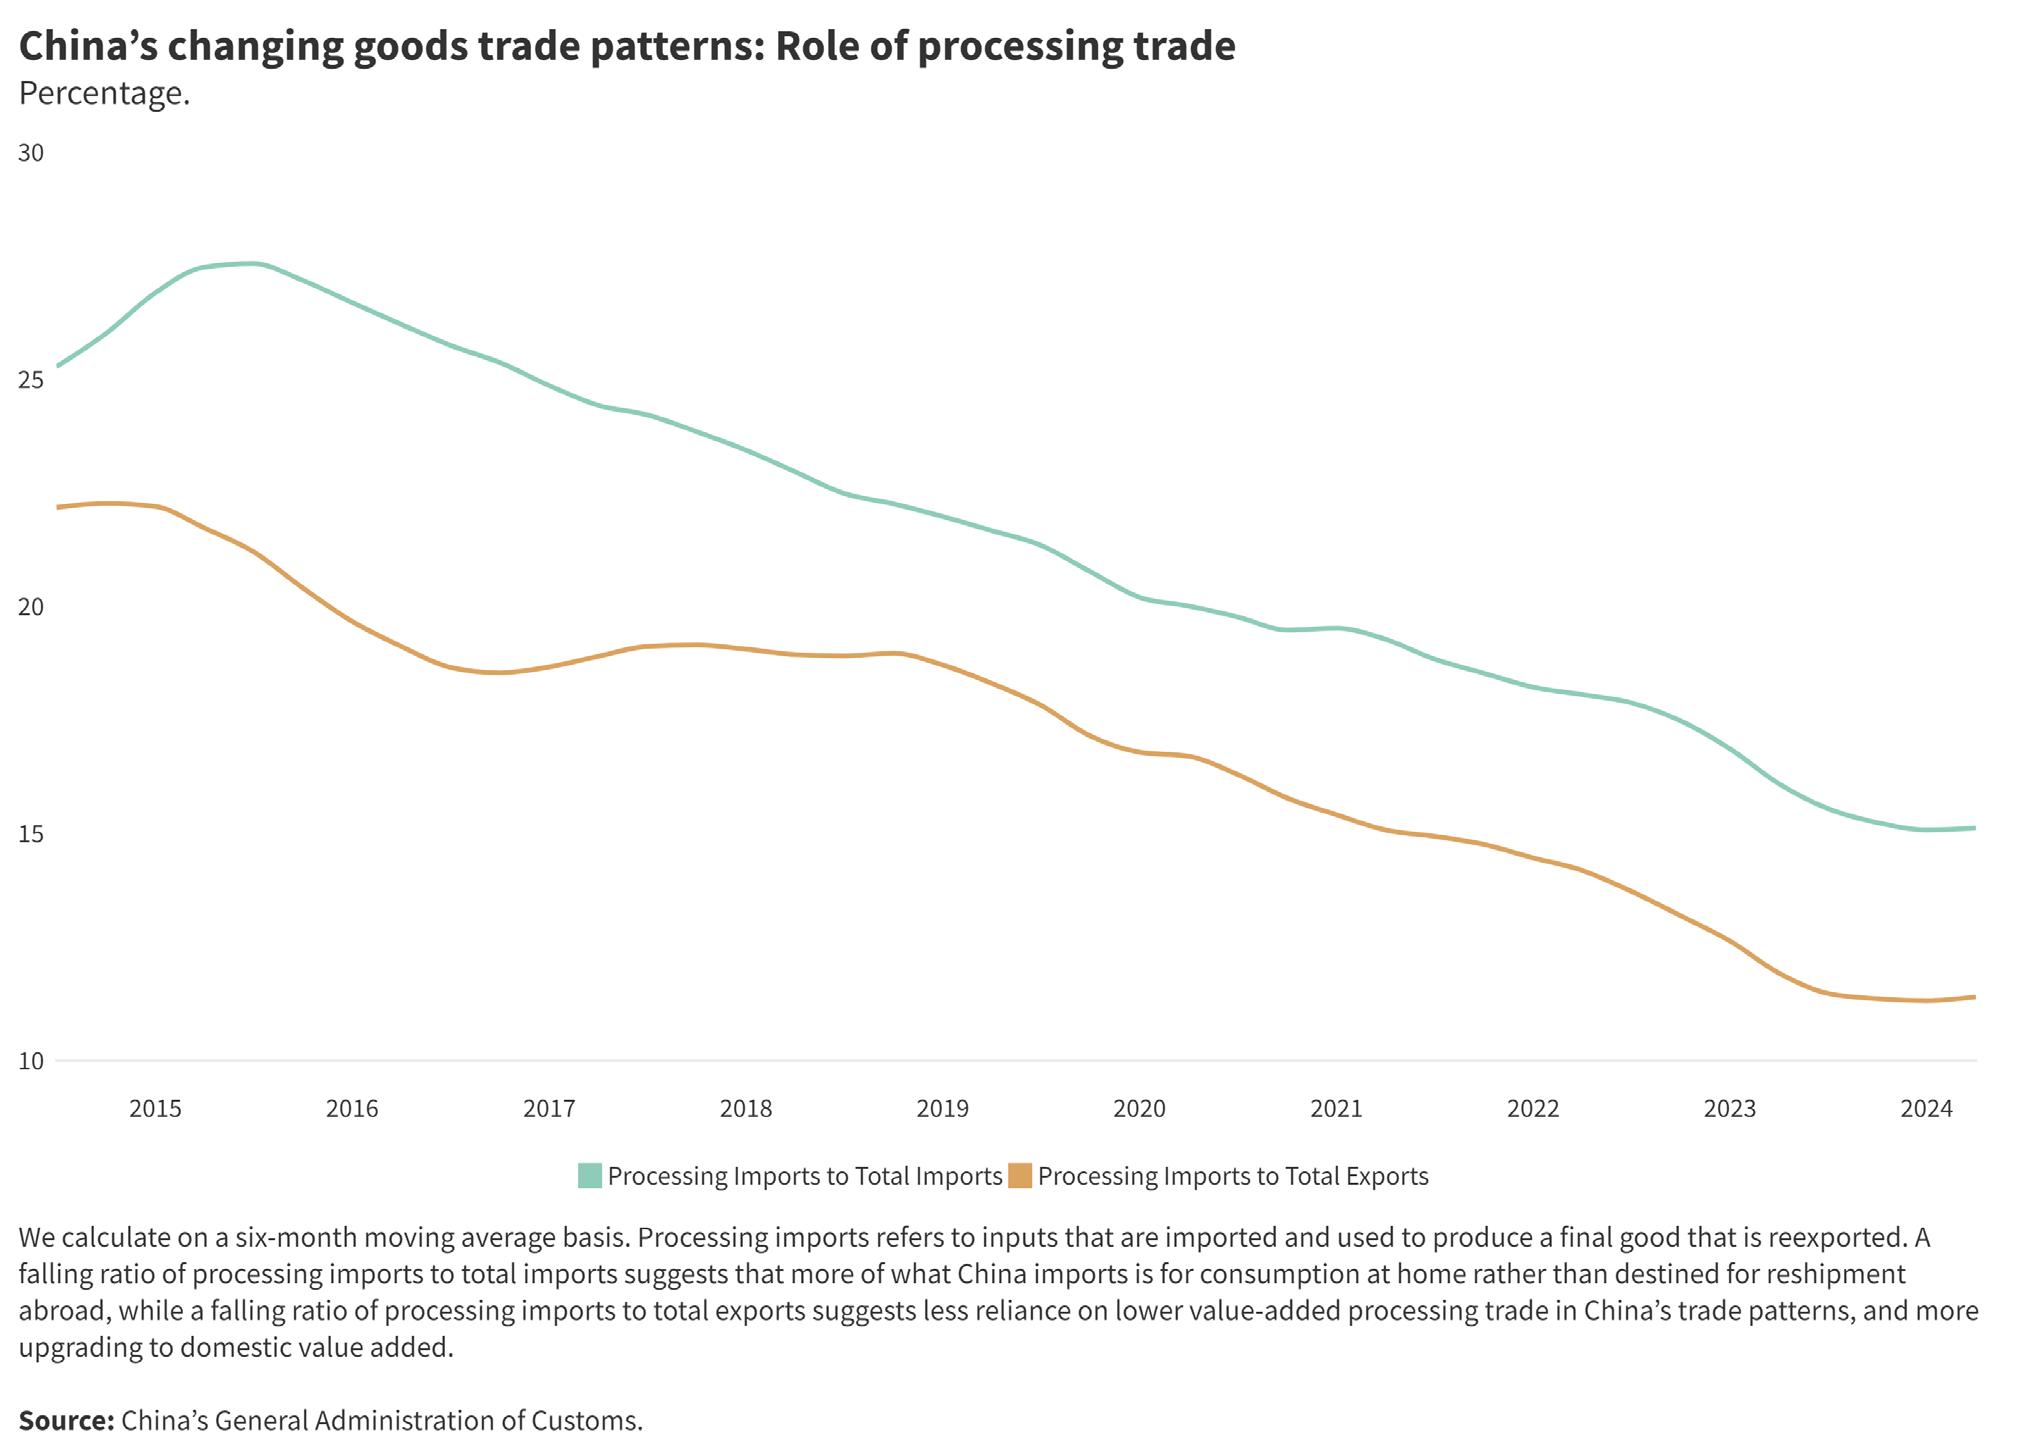
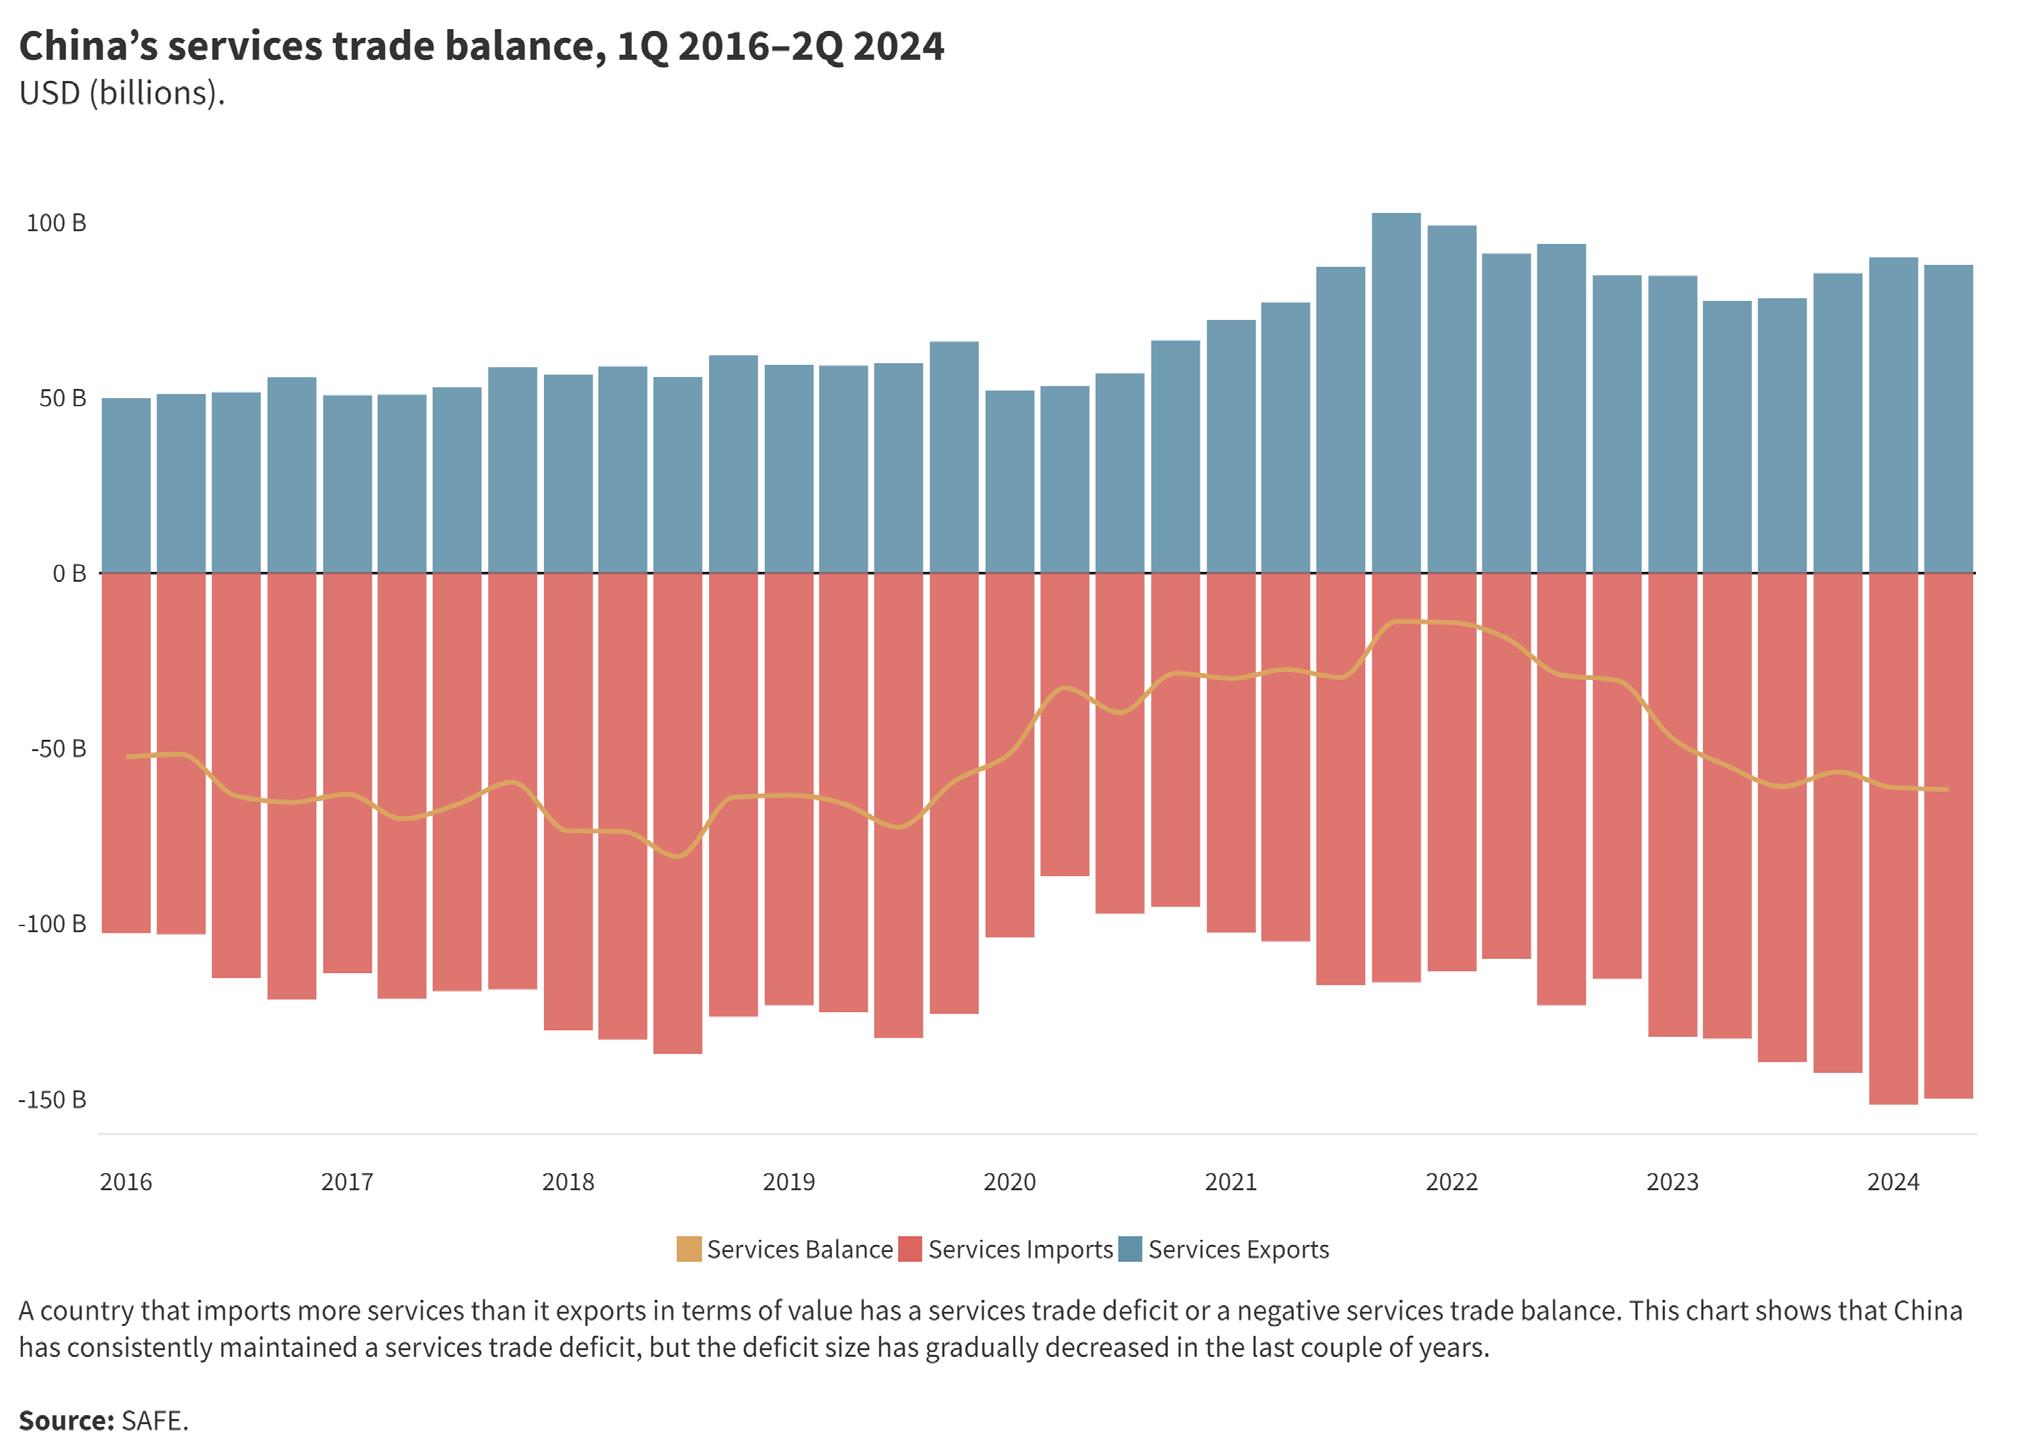
Measure of direct investment openness from 0 (low) to 10 (high). Source: China Pathfinder
Definition and relevance
Direct investment openness refers to fair, nondiscriminatory access for foreign firms to domestic markets and freedom for local companies to invest abroad without restrictions or political mandates. Direct investment openness is a key feature of open market economies that encourages competitive markets and facilitates the global division of labor based on comparative advantage.
In 2023, China made little progress in improving its direct investment openness and it remains far behind open market economies. Inbound and outbound FDI continued to decline as a share of GDP. Developed economies, on the other hand, have become more open and have increased their relative inward and outward FDI in recent years. Direct investment openness is the area where China remains furthest behind its peers. We use the following annual indicators to benchmark China against open market economies in terms of direct investment openness.
FDI intensity
Our main de facto indicator for inbound direct investment is the inbound FDI intensity of the economy, which is calculated by dividing the total inbound FDI stock of an economy by its GDP. In recent years, China’s ratio of inbound FDI stock to GDP has declined from its 2010
level of 26 percent, plateauing at around 20 percent from 2021 to 2023. By contrast, the OECD average has risen more than ten percentage points, from 30 percent in 2010 to a steady 40 percent. In 2023, the United States and Canada’s inbound FDI intensity scores recovered from drops reported in 2022, increasing by eight and ten points, respectively.
Outflows are measured by outbound FDI intensity, which is calculated by dividing outward FDI stock by GDP. China’s outbound investment intensity has experienced an even greater decline than inbound investment. In 2010, China’s level of outbound investment intensity was 35 percent, which declined to around 15 percent by 2021 and remained there in 2022. In 2023, China saw a slight increase in its outbound investment intensity to 17 percent. The OECD average was at a comparable level to China’s in 2010, at 35 percent, but has steadily risen to 52 percent as of 2023, with a two percent age point increase in the past year. The UK’s rate was an exception to the OECD average increase over the past year, declining from 70 percent to 64 percent.
We built our own indicator for direct investment restrictiveness to measure de jure restrictiveness for FDI. While there is a robust body of academic work on cross-border capital controls, existing research was unsuitable for our purposes due to the lack of a magnitude metric, 30 coverage gaps, and significant time
30 Andrés Fernández et al., “Capital Control Measures: A New Dataset,” IMF Economic Review 64 (2016): 548–574, https://doi.org/10.1057/ imfer.2016.11.
lags. 31 Our indicator is compiled for outflows and inflows and covers three types of restrictions: national security reviews, sectoral and operational restrictions, and repatriation requirements and other foreign exchange restrictions. The scoring is based on a proprietary framework derived from information contained in the IMF’s Annual Report on Exchange Arrangements and Exchange Restrictions (AREAER) as well as proprietary research on national security review mechanisms and sectoral restrictions. 32 At the time of publication, IMF AREAER data for 2023 was unavailable, and 2022 values were used in scoring.
From 2010 to 2022, every country sampled, except China, increased restrictions on inbound investment, as measured by the restrictiveness indicator. Likewise, all countries’ scores on outbound investment restrictions showed no change or increased restrictiveness since 2010, with China the only improvement. China’s heavily regulated capital controls set it far behind the OECD average as a baseline, and domestic and foreign firms are still operating in a much smaller market access window than in open economies, with reforms remaining targeted and incremental.
In 2023, China’s score on the Direct Investment Openness Composite Index continued to improve slowly, rising from 2.1 in 2022 to 2.2, driven by growth in both inward and outward FDI stock in 2023, as well as a slight improvement in outbound restrictiveness in 2022 (carried forward to the current scoring period). Over the past four years, regulatory uncertainty and slowing economic growth prospects have changed prospects for investors who rushed in to capitalize on cheaper costs of capital and labor to build manufacturing capacity in the 2010s. China’s attempts to attract foreign investment through investment incentives and the easing of restrictions on certain sectors and special economic zones (reflected in the improvement of China’s inbound restrictions score since 2010) contributed to the slight increase in China’s inward FDI stock as a share of GDP in 2023. Despite recent discussions characterizing China’s outbound FDI in recent years as accelerating, China’s strict capital controls maintain a level of outbound investment flows that are modest for its economic size. China’s score has improved from 0 in 2010 to 0.9 in 2023, but China remains the lowest performer in the group.
However, compared to the other indices covered in China Pathfinder, there is less volatility in the change in open economies’ scores on the Direct Investment Openness Composite Index from 2010 to 2023. China’s 1.6-point score increase from 2010 to 2023 represents the strongest growth out of the sample countries. Canada comes in a close second with a 1.4-point score growth. While the average OECD score stands distinctly ahead of China’s, its improvement has been more modest, from 6.1 in 2010 to only 6.3 in 2023. The scores of several countries, including Australia, Germany, Italy, and South Korea, have declined in 2010, which has largely been driven by worsening scores on inbound and outbound investment restrictiveness.
As with other indicators, our de facto measures for direct investment openness are imperfect because they are influenced by a host of non-policy variables, such as market size, economic growth, and business cycles. Our measures for de jure restrictiveness reflect scoring judgments that are subject to a certain degree of subjectivity. We address these shortcomings below by providing a summary of major policy developments in 2023 pertaining to direct investment openness. Supplemental indicators are presented in Figure 2.15 to help provide additional context.
A year in review: China’s 2023 direct investment policies and developments
According to official data, in 2023, inbound FDI flows hit new lows. MOFCOM data recorded a 19 percent and SAFE a 78 percent year-over-year decrease in inbound FDI, with unprecedented net FDI outflows in quarterly data. 33 Regulatory uncertainty under Xi, China’s changing growth prospects, and the rise of investment screening regimes and other restrictions have resulted in a slowdown in new inbound FDI flows to China since 2021. On the other hand, China’s outbound FDI intensity grew marginally, increasing by one percentage point in 2023 as outbound FDI flows increased, according to MOFCOM data. Diversification pressures and enhanced inbound investment screening regimes in Western countries and Japan have contributed to shifting Chinese outbound investment. Investments are becoming more concentrated in certain sectors while also targeting new destinations. Expanded export controls on Chinese industry are also motivating some targeted industries to expand or move production abroad. Rhodium Group research finds that China’s
31 Menzie D. Chinn and Hiro Ito, “What matters for financial development? Capital controls, institutions, and interactions,” Journal of Development Economics 81 (1): 163–192, https://doi.org/10.1016/j.jdeveco.2005.05.010.
32 Annual Report on Exchange Arrangements and Exchange Restrictions 2019, International Monetary Fund, August 10, 2019, https://www.imf. org/en/Publications/Annual-Report-on-Exchange-Arrangements-and-Exchange-Restrictions/Issues/2020/08/10/Annual-Report-on-ExchangeArrangements-and-Exchange-Restrictions-2019-47102.
33 Rhodium Group analysis of Ministry of Commerce (MOFCOM) and State Administration of Foreign Exchange (SAFE) data. The gap between SAFE and MOFCOM’s estimates reflects reporting and methodological differences; both datasets show a drop in inbound investment in recent years. See Nicholas R. Lardy, “Foreign direct investment is exiting China, new data show,” Realtime Economics (blog), Peterson Institute for International Economics, November 17, 2023, https://www.piie.com/blogs/realtime-economics/foreign-direct-investment-exiting-china-new-data-show.
investment in Europe and the UK dropped to its lowest levels since 2010 and became even more heavily concentrated in the EV supply chain.
34
Over the second half of 2023, China developed several initiatives to bring back foreign investment. At the end of June, new pilot programs for six of China’s 21 free trade zones and ports were announced, with the goal of reducing trade barriers and streamlining customs procedures. 35 In August of 2023, the State Council released a 24-point plan to help boost inbound FDI. These measures were largely devised to restore foreign business confidence, which, after three years of the zero-COVID policy and deteriorating macroeconomic and geopolitical conditions, had reached a new low. 36 In November 2023, the State Council separately released a “23 Tasks” plan to boost Beijing’s services sectors, followed in December by pledges at the Central Economic Work Conference to boost foreign investment in sectors including telecommunications and medical services in 2024. Promises include several pro-market reforms such as reducing the scope of the Negative List that outlines restrictions on foreign investment in some sectors, 37 lifting ownership caps, and increasing opportunities for foreign private companies to participate in government procurement processes. However, the proposed reforms only apply to certain
sectors, and their implementation has been limited so far. In addition, other factors, like evolving data security regulations and the lack of substantive financial system reform, continued to dampen investor sentiment toward the Chinese market.
While these reforms will increase opportunities for foreign firms, China’s application of the Anti-Espionage Law became increasingly unpredictable in 2023. Statedirected raids, threats, and intimidation of foreign businesses—particularly consulting and due diligence companies—undermine efforts to preference market forces and level the playing field for foreign investors. Under the new law, bureaucratic processing times and red tape for investment approval and market research have also increased.
In 2024, foreign-invested enterprises in China are waiting to see action on promised reforms outlined at the Central Economic Work Conference and the implementation of a new data security policy. However, reforms directed toward fundamental issues contributing to heightened costs for foreign investors would be a more significant step toward opening direct investment.
34 Agatha Kratz et al., Chinese FDI in Europe: 2023 Update, Rhodium Group and MERICS, June 6, 2024, https://rhg.com/research/chinese-fdi-ineurope-2023-update/.
35 State Council, “国务院印发关于在有条件的自由贸易试验区和自由贸易港试点对接国际高标准推进制度型开放若干措施的通知]” [Notice of the State Council on Several Measures to Promote Systematic Liberalization by Matching International High Standards on a Pilot Basis in Conditional Pilot Free Trade Zones and Free Trade Ports], June 29, 2023, https://www.gov.cn/zhengce/content/202306/content_6889026.htm
36 State Council, “加大吸引外商投资力度的意见” [Opinions on increasing efforts to attract foreign investment], August 13, 2023, https://www.gov. cn/zhengce/content/202308/content_6898048.htm.
37 China’s National Development and Reform Commission and the Ministry of Commerce jointly maintain a “Negative List” limiting or prohibiting foreign investment, such as in certain areas of manufacturing, healthcare, and telecommunications. See MOFCOM, “跨境服务贸易特别管理措 施(负面清单)2024年版” [Special Administrative Measures for Cross-Border Trade in Services (Negative List) 2024 edition], March 22, 2024, https://www.gov.cn/gongbao/2024/issue_11366/202405/content_6954195.html.
China’s inward FDI intensity declines
Inbound FDI stock as a percent share of GDP, 2023 vs. 2010 (—). We
China’s outward FDI intensity improves, but not enough to catch up with market economies
Outbound FDI stock as a percent share of GDP, 2023 vs. 2010 (—).
China loosened restrictions on inbound FDI AREAER index of 0-10 (high restrictions), 2021 vs. 2010 (—).
This indicator looks at three areas of FDI restrictions: national security review mechanisms, sectoral and operational restrictions on investment, and repatriation requirements as well as other foreign exchange restrictions.
and
China less restrictive on outbound FDI than in 2010 AREAER index of 0-10 (high restrictions), 2021 vs. 2010 (—).
FIGURE 2.15. KEY SUPPLEMENTAL INDICATORS: DIRECT INVESTMENT OPENNESS (2023*)
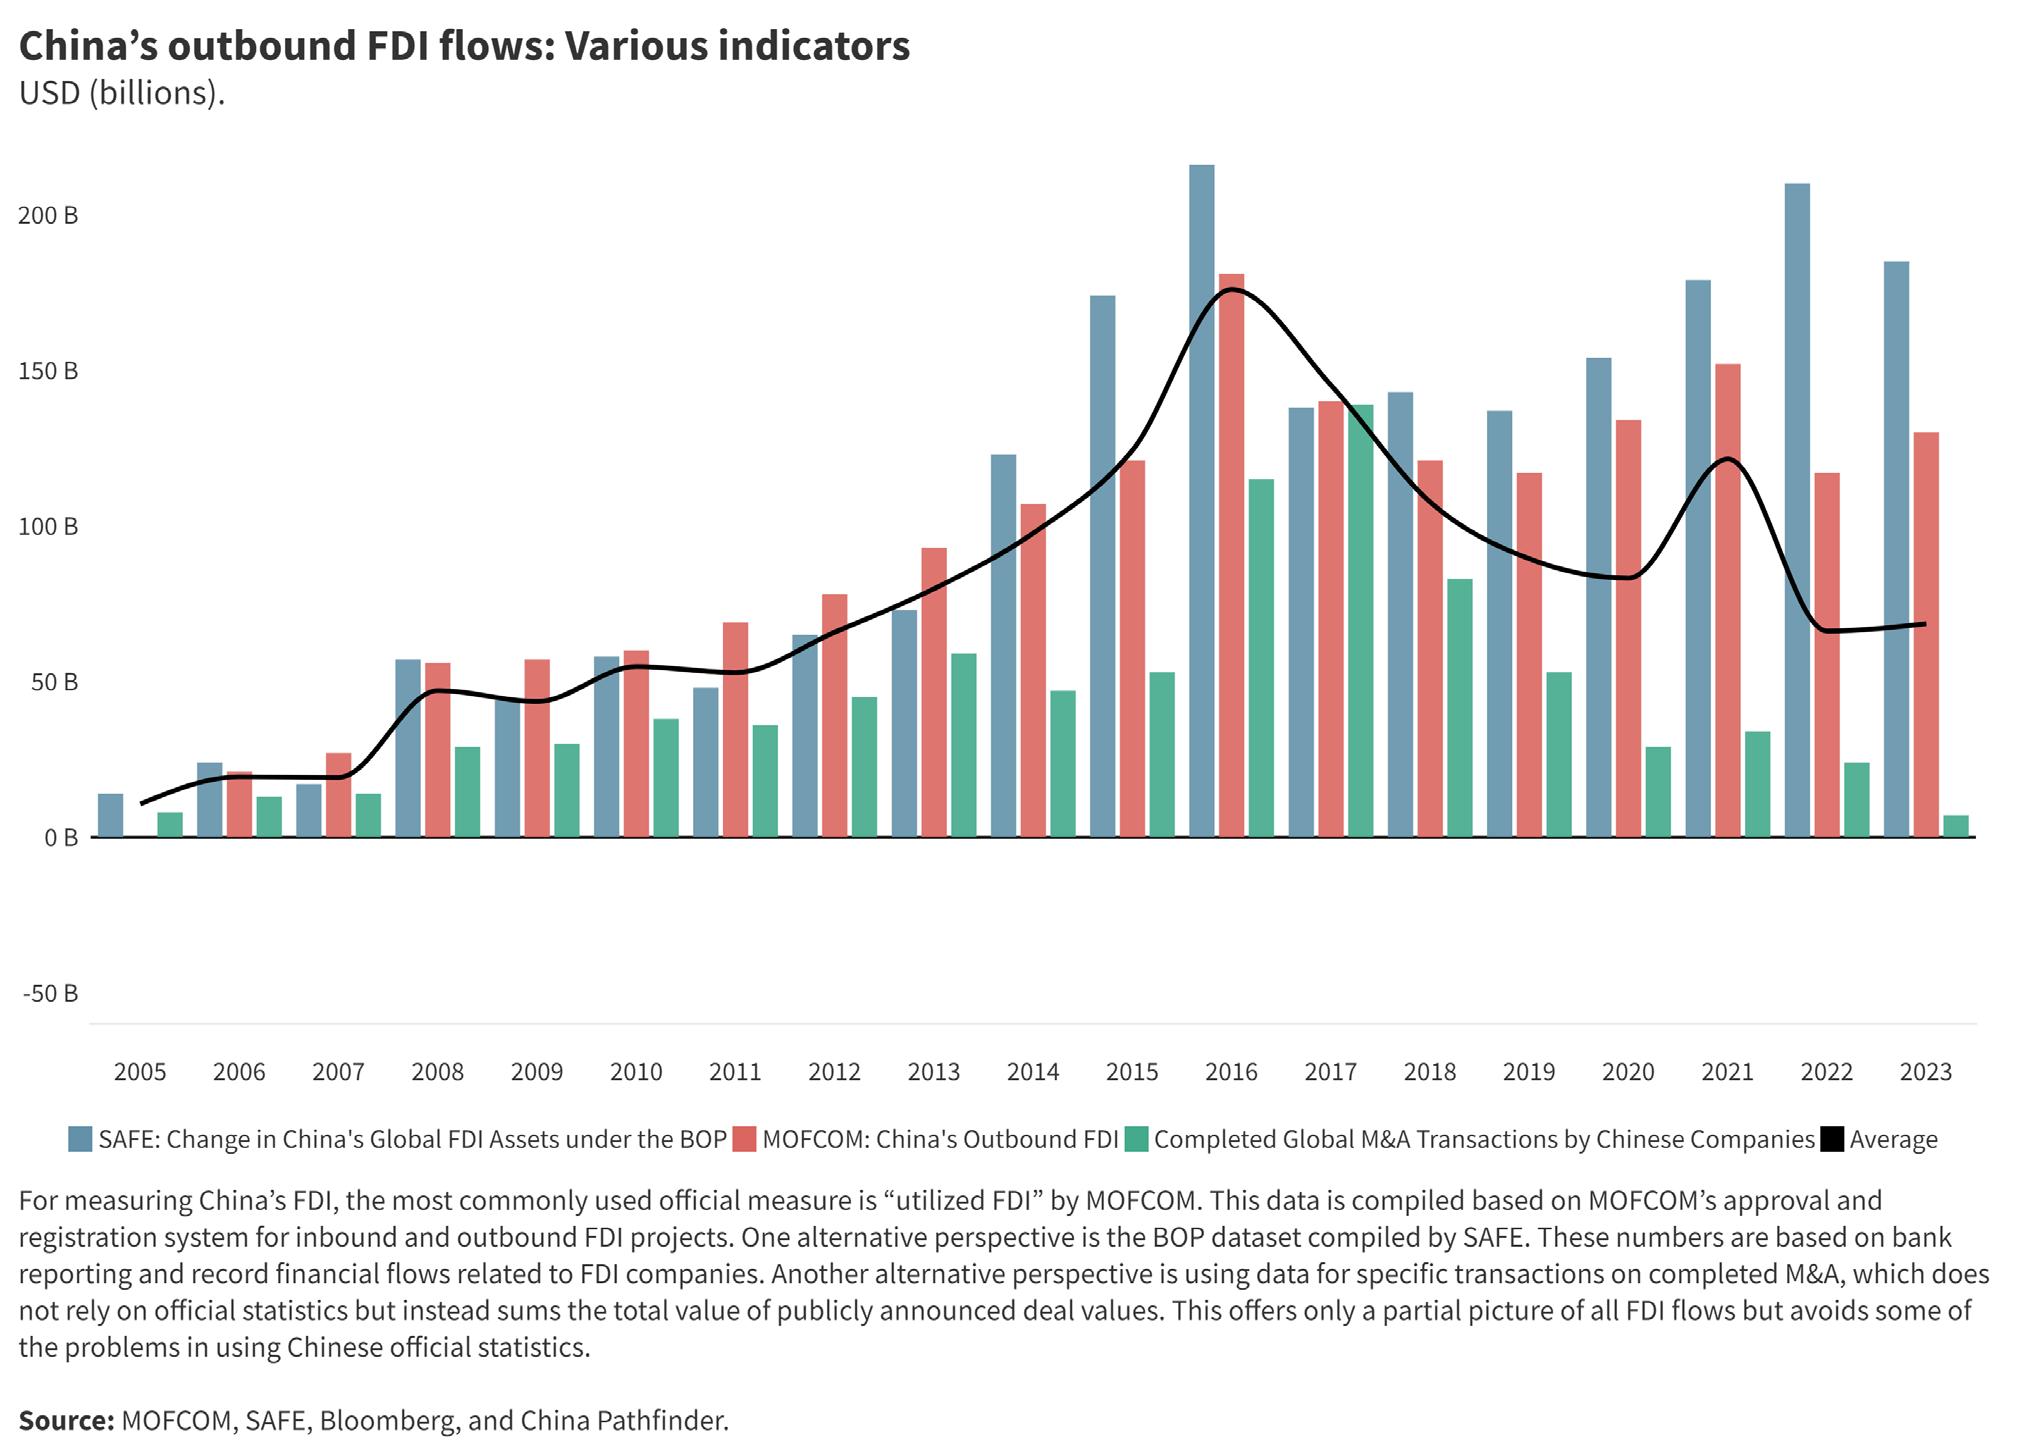
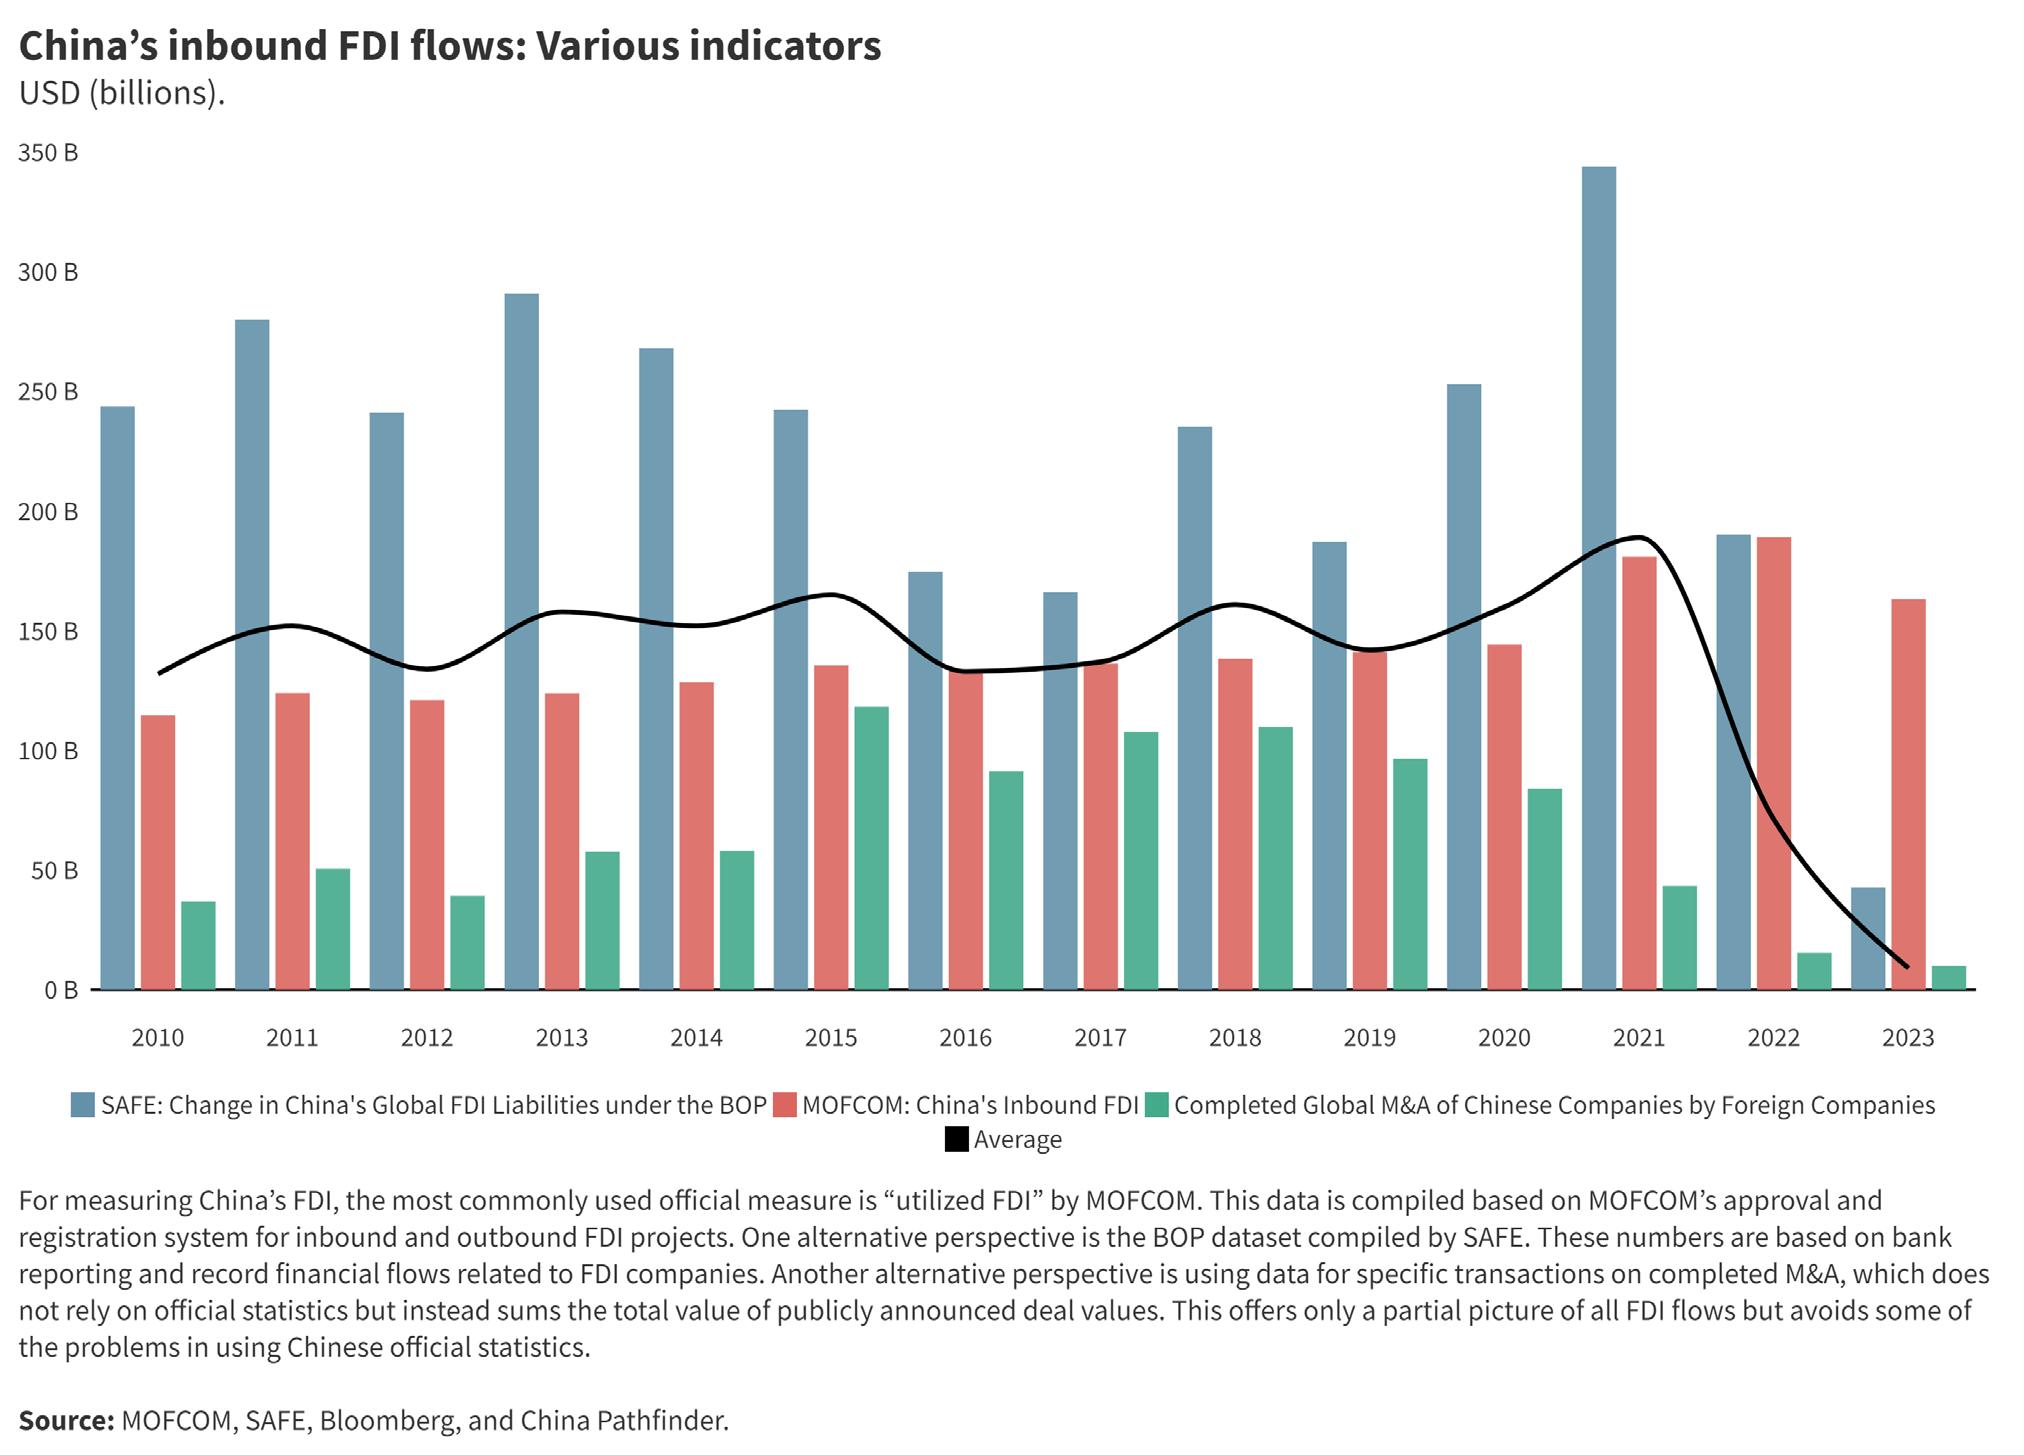
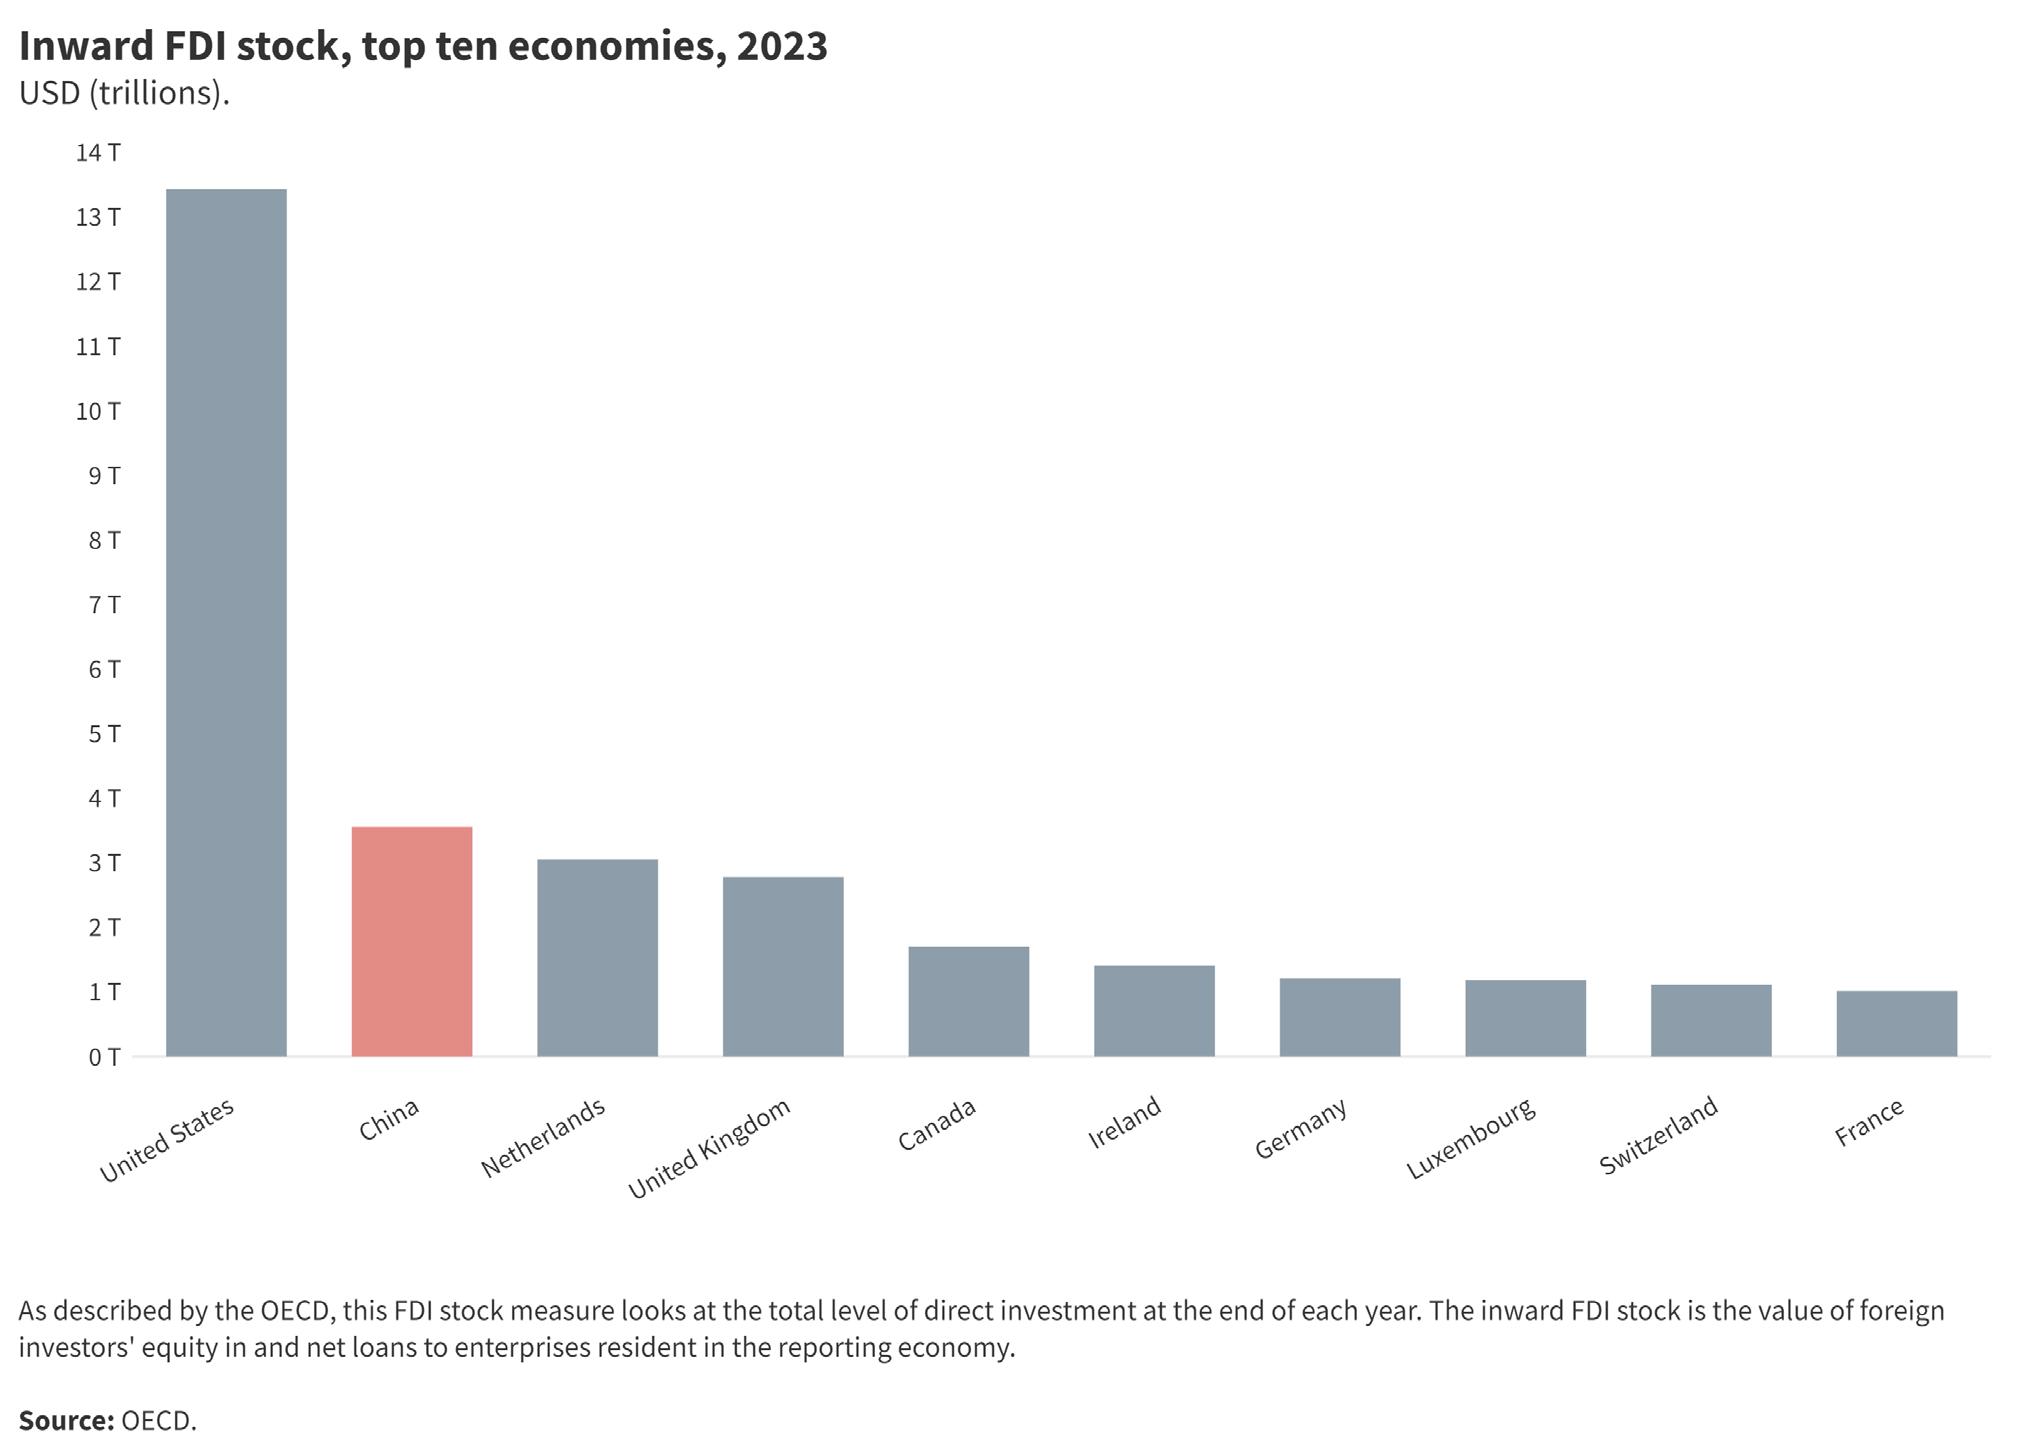
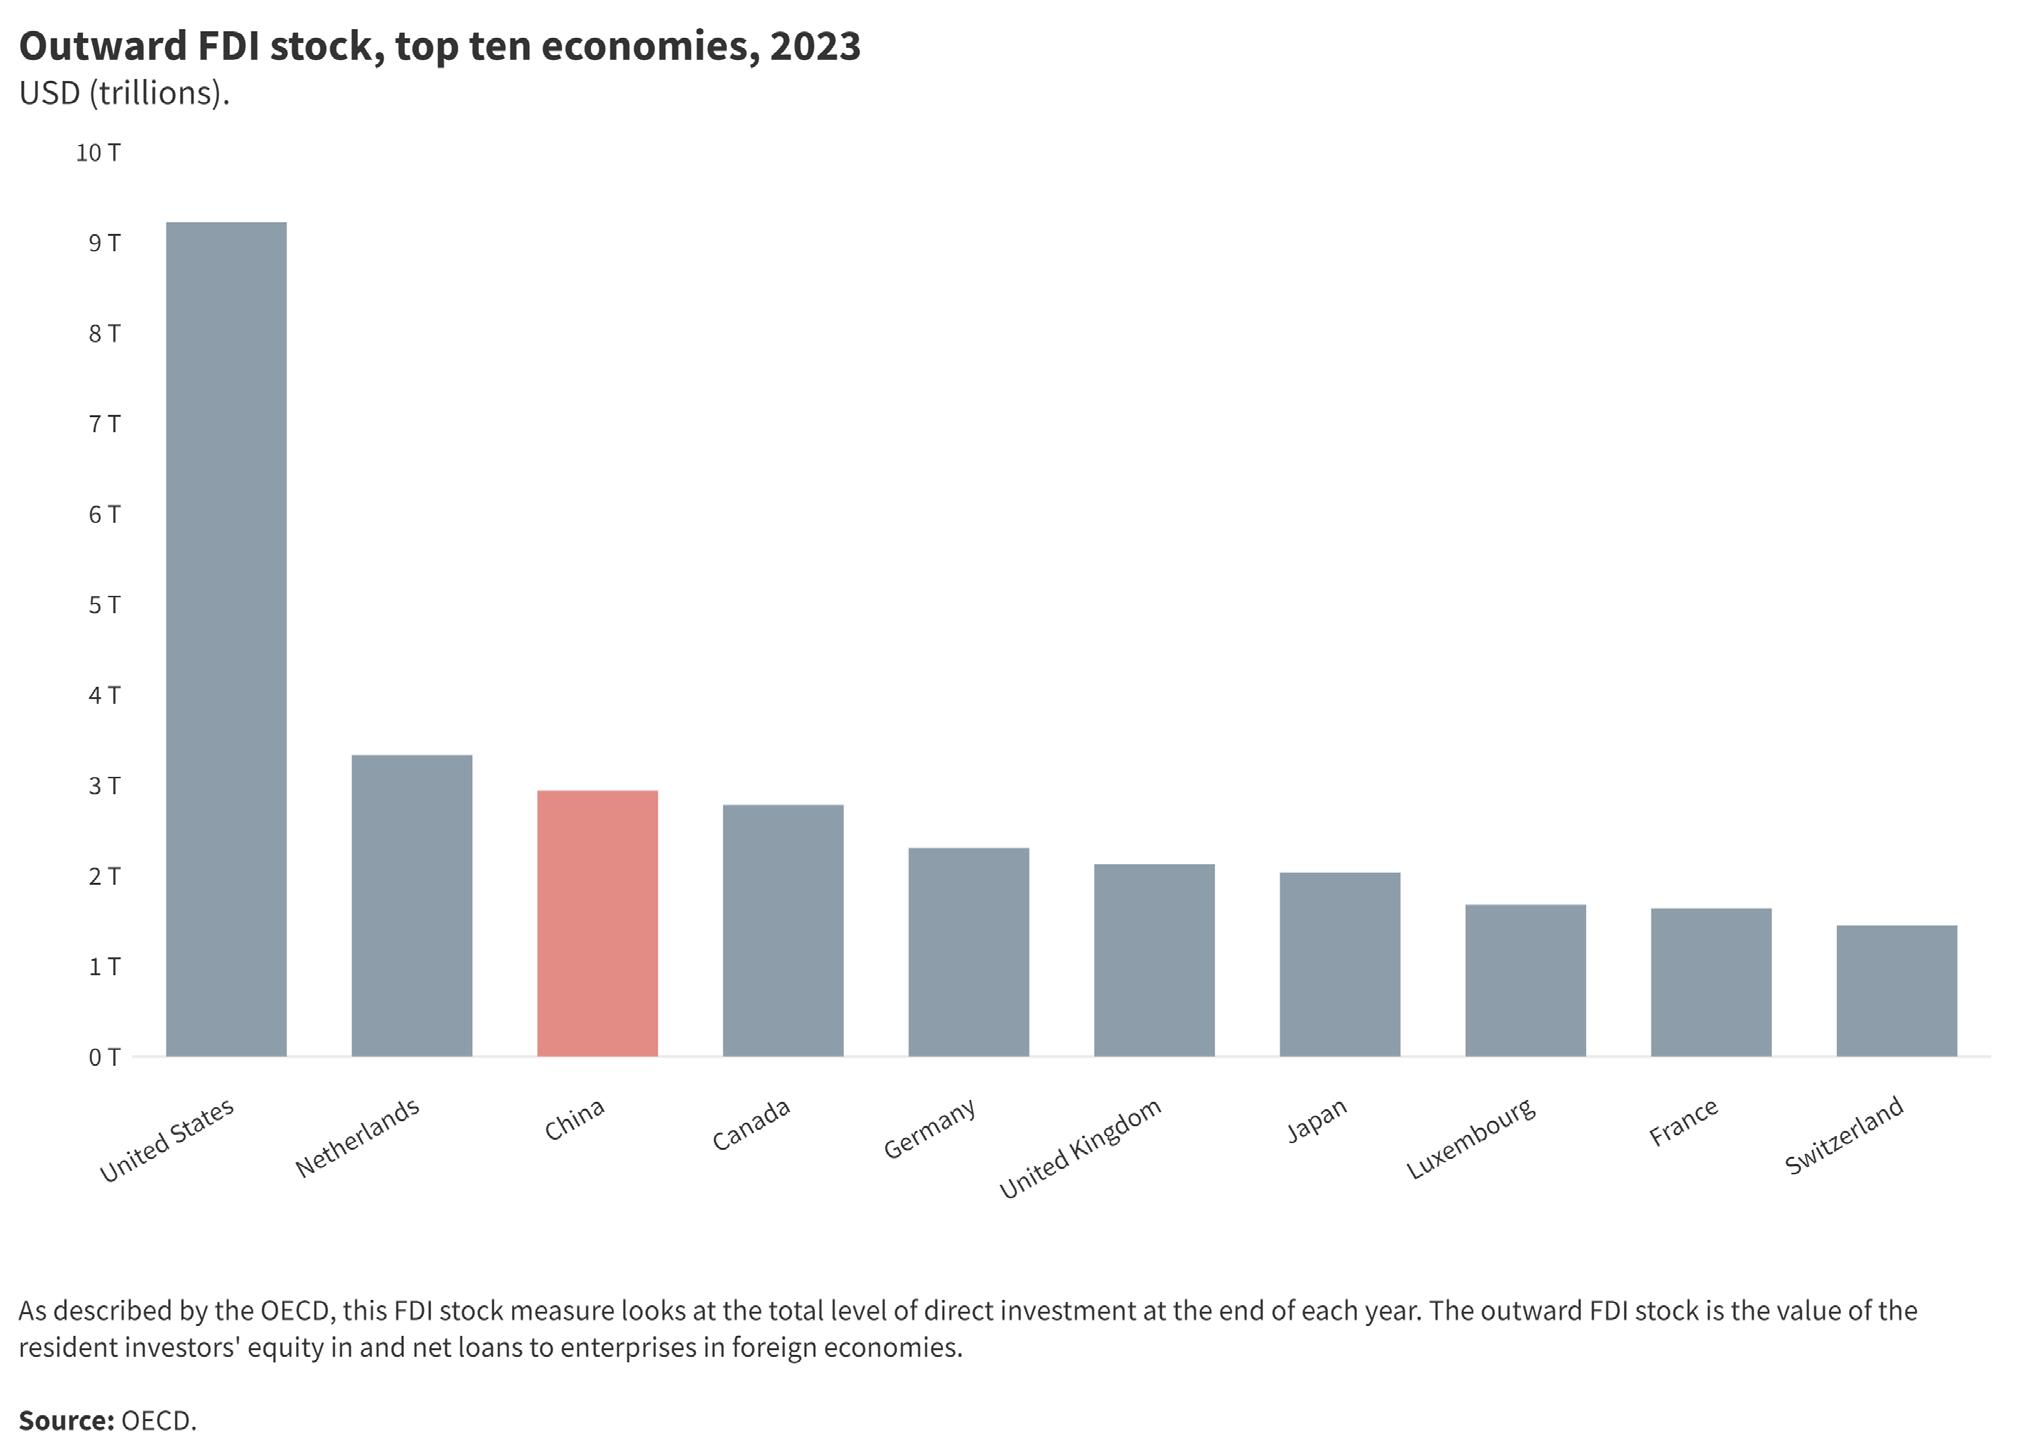
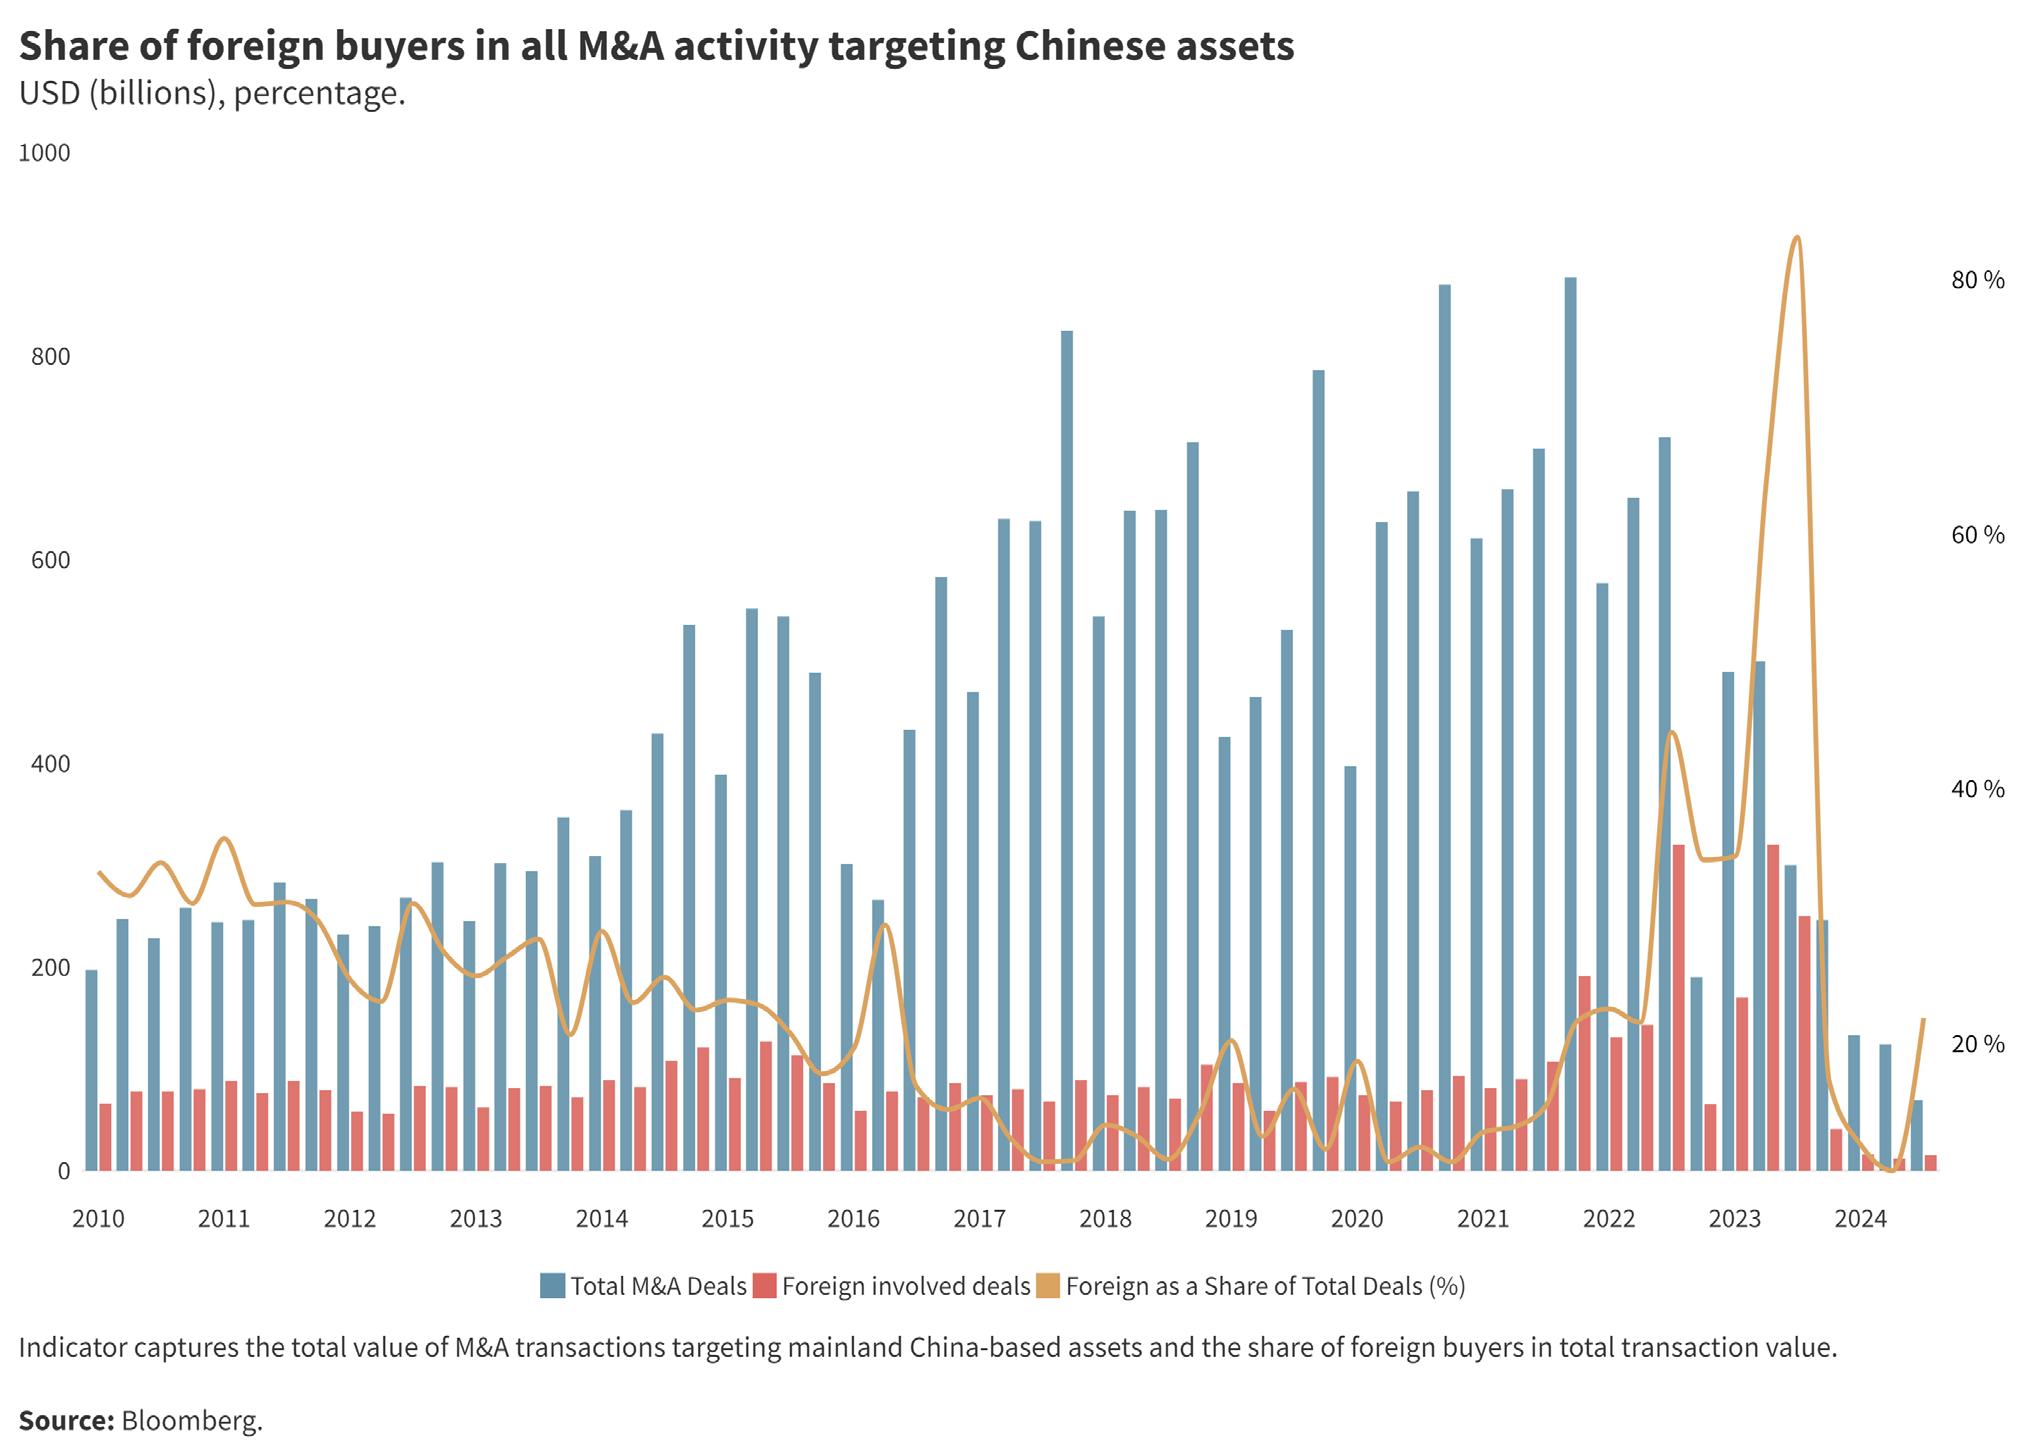
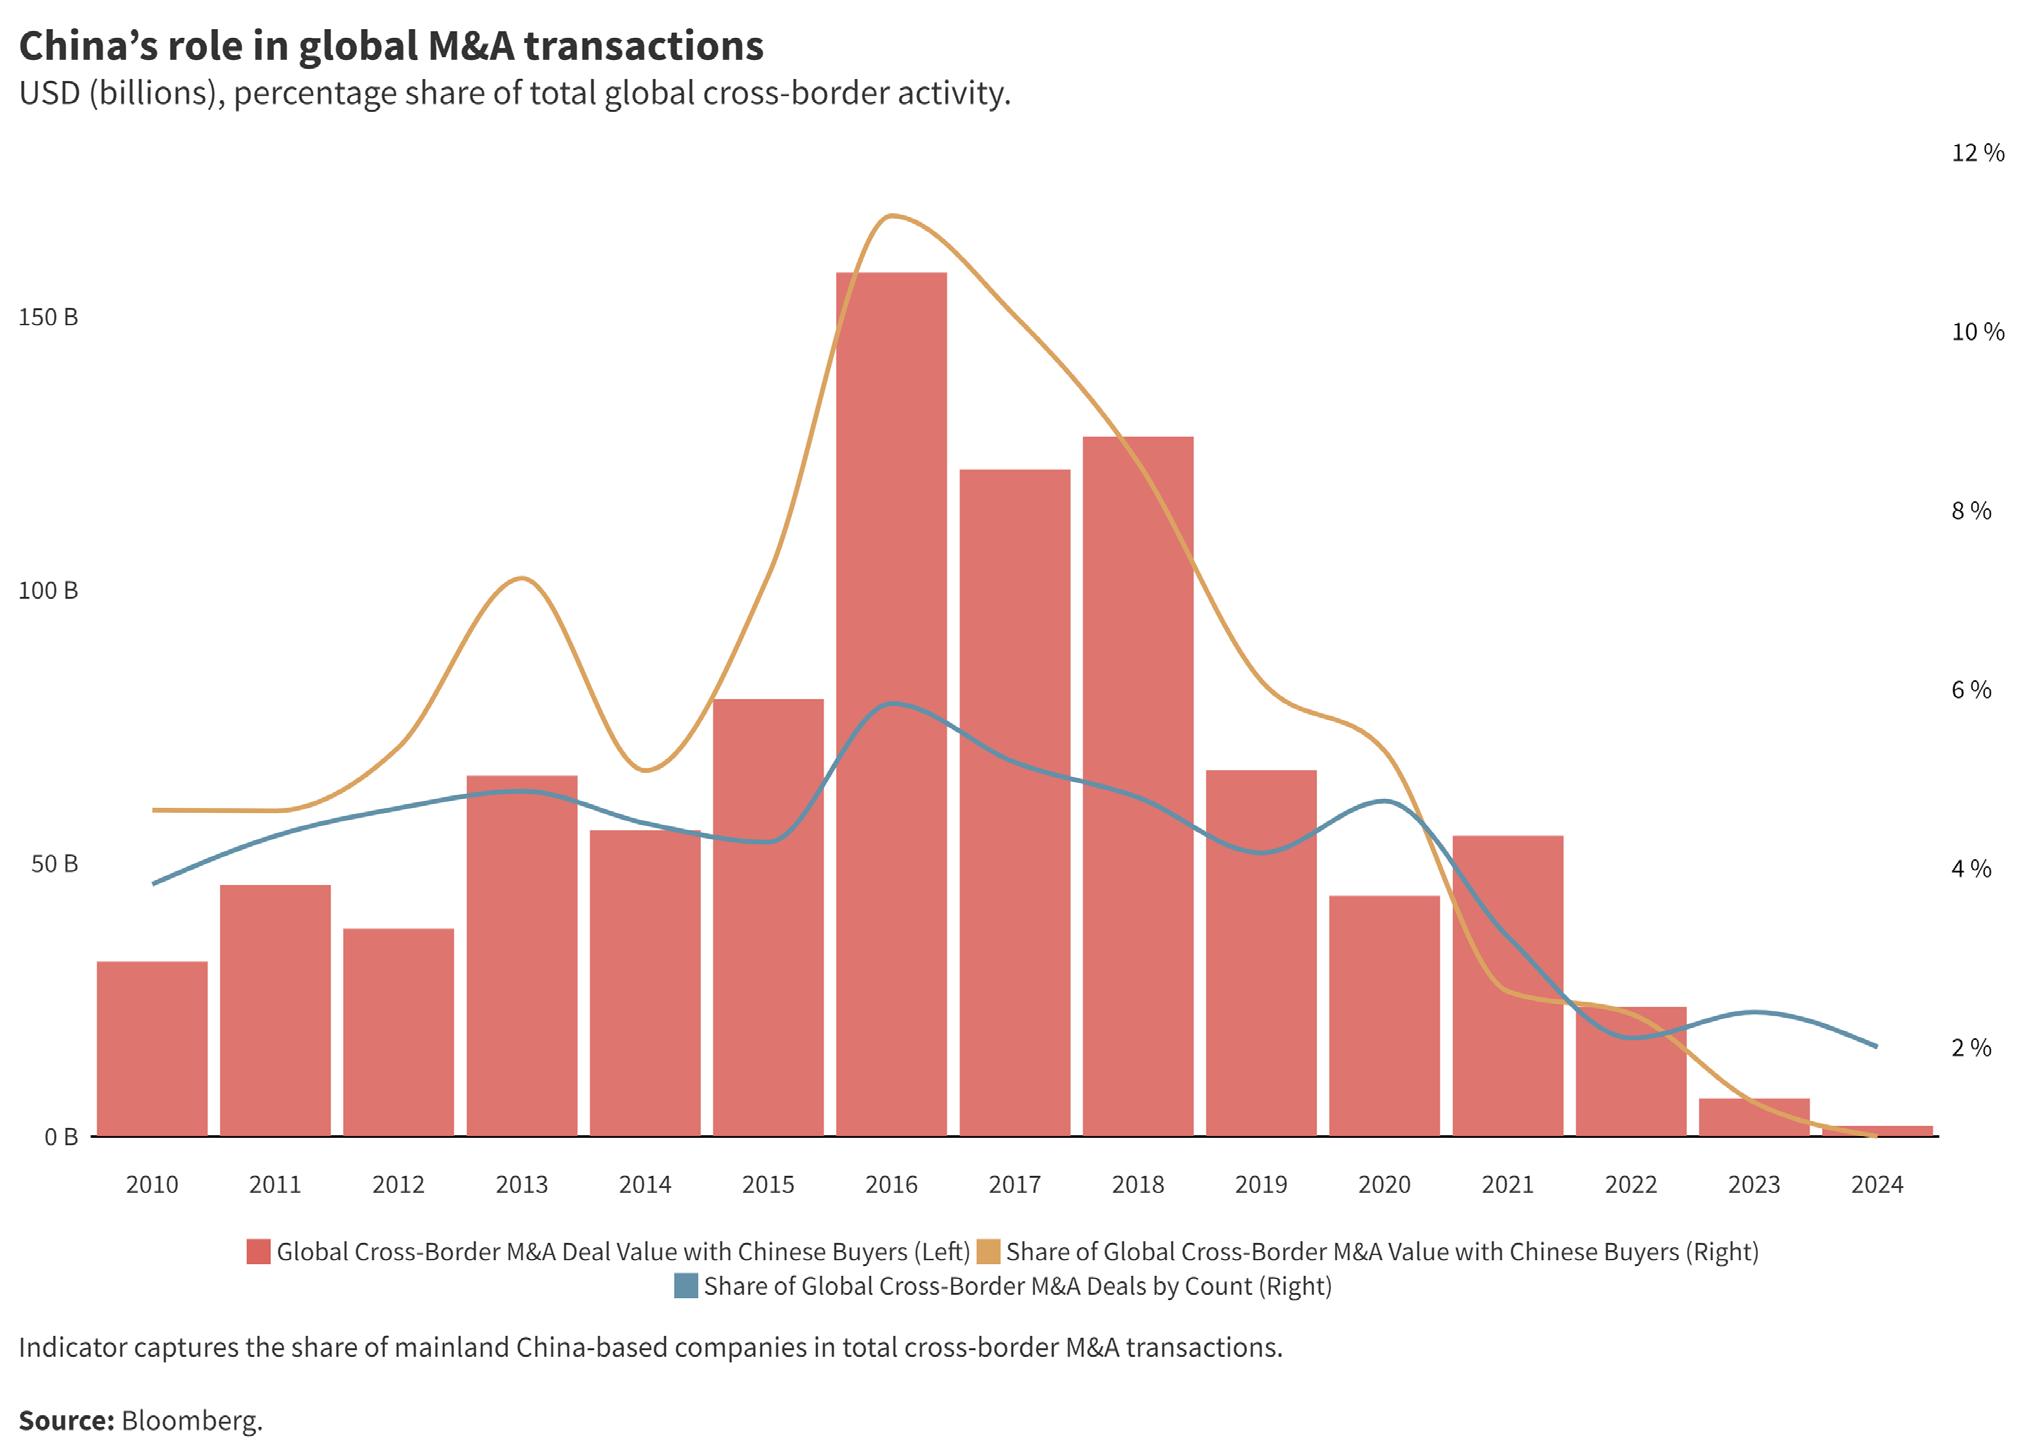
Measure of direct investment openness from 0 (low) to 10 (high). Source: China Pathfinder.
Definition and relevance
Portfolio investment openness refers to limited controls on two-way cross-border investment in equities, debt, and other financial instruments. It is a key ingredient for financial market efficiency and market-driven exchange rate adjustments in open market economies.
China’s portfolio investment openness saw little change between 2022 and 2023. While there has been moderate improvement since 2010, China lags far behind OECD economies in liberalizing cross-border financial flows. We apply the following annual indicators to benchmark China against open market economies in terms of portfolio investment openness.
Internationalization of debt and equity markets
To measure de facto openness to portfolio investment, we calculate the sum of cross-border debt (government and corporate bonds) assets and liabilities relative to the size of the economy, as well as the sum of crossborder equity (stocks) assets and liabilities relative to the size of the economy. Assets are holdings of foreign securities by residents, and liabilities represent foreign holdings of securities issued by residents. China lags significantly behind the open-economy average in both categories.
Since 2010, China’s cross-border debt assets and liabilities as a share of GDP have increased from 3 percent to a steady 6 to 7 percent since 2020, far behind
the OECD average of 83 percent. China’s equity assets and liabilities as a share of GDP have grown even slower. Standing at 8 percent in 2010, China’s share reached 13 percent in 2020 before declining over the past three years to 9 percent in 2023. In 2023, the OECD average rate of equity assets to GDP recovered from a drop in 2022, rising from 86 percent to 93 percent in 2023.
For a de jure perspective, we created our own Portfolio Investment Restrictiveness Indicator that captures regulatory restrictions on portfolio investment flows based on the IMF’s AREAER database and our own research. We calculate separate indices for portfolio outflow and inflow restrictiveness, assigning numerical scores based on the implementation of opening or closing measures during a given year. At the time of publication, IMF AREAER data for 2023 is unavailable and 2022 values were used in scoring.
The inward portfolio restrictiveness indicator captures rules that prevent nonresidents from purchasing bonds and equity securities locally and rules that stop residents from selling and issuing bonds and equity securities abroad. The outward portfolio restrictiveness indicator captures rules that prevent residents from purchasing foreign securities and restrictions on nonresidents selling and issuing bonds and equity securities.
Historically, China has tightly restricted short-term foreign capital inflows, allowing a select number of transactions through narrow programs such as the Qualified Foreign Institutional Investor (QFII) scheme.
Since 2010, China’s inbound restrictiveness score has improved from 0 to 2.9 in 2022. However, it trails far behind the OECD average score, which has remained around 9.3 to 9.4 since 2010. Over the past decade, several schemes such as the 2014 and 2016 Shanghaiand Shenzhen-Hong Kong Stock Connects, the 2017 Bond Connect, and the 2020 China Interbank Bond Market Direct, as well as the loosening of certain restrictions, have opened greater access to China’s markets. Yet, investment quotas and inadequate crossborder settlement infrastructure still pose major barriers for foreign investors.
Concerns about the destabilizing effect of largescale capital outflows guide China’s caution toward liberalizing outward portfolio restrictiveness. In recent years, China has expanded connections with several international exchanges, including the UK, Swiss, and German markets, with the ongoing development of the Shenzhen-London Connect in 2023. However, households remain generally unable to invest in overseas securities, and institutional investors are constrained by special programs, such as the Qualified Domestic Investor Initiative, which is capped by SAFE. As a result, China’s outbound restriction score has only improved from 0 in 2010 to 1.7 in 2022, while the OECD score has remained around 9.5 to 9.6 since 2010.
With limited fluctuation in China’s debt and equity assets as a share of GDP and values for investment restrictiveness carried forward from 2022, China’s Portfolio Investment Openness Composite Index score remained at 1.2 in 2023. China’s score in 2010 was zero, representing the lowest level of openness among all sampled countries across all years. The China Pathfinder normalization method captures countries’ progress or regression compared to their performance in prior years. As such, China remains far behind all other countries, with the OECD average standing at seven in 2023, but has shown a very modest improvement over the past decade.
China exercises a level of control over its capital account that is distinct from open market economies. We have seen large improvements in the ability of foreigners to access and participate in China’s markets relative to 2010 through investment programs such as the QFII, stock and bond connects, and through the raising of quotas for several programs and easing of restrictions (such as reducing the number of industries restricted from listing stocks on the Negative List for foreign investment). However, the de facto indicators of debt and equity asset and liability levels also capture fluctuations with discrete impacts from policy changes,
such as market sentiment, macroeconomic dynamics, and other business environment factors, such as tax optimization and financial system designs.
We noted in 2022 how these factors impacted portfolio volume as a share of GDP data, with sizable declines for both China and OECD economies compared to 2021. In 2023, all open economies sampled showed an improvement in their scores. The average OECD score showed a slight recovery, rising from 6.9 to 7, but has still not reached 2020–21 levels. Since 2010, the scores of all economies sampled, except the UK, have improved. The UK’s score decline is primarily driven by a dropping ratio of debt securities to GDP. On the other hand, Canada and Japan have improved market access the most, both showing significant growth in shares of debt and equity positions to GDP since 2010.
While our benchmark indicators capture major movements in China’s reform progress and allow for a standardized comparison with open market economies, we undergo a qualitative assessment of China’s policy reforms in the section below to provide greater context to China’s progress in 2023. Supplemental indicators relevant to portfolio investment openness are presented in Figure 2.18.
A year in review: China’s 2023 portfolio investment policies and developments
As part of efforts to boost economic growth in 2023, Beijing rolled out several measures that marginally opened capital markets at the beginning of the year. These steps were followed by substantial government intervention to artificially shape supply, demand, and prices in the second half of the year. State interventions sought to regulate the effects of heavy portfolio capital outflow pressures brought about by a yawning interest rate gap with the United States and other market economies and the abysmal performance of China’s stock market in 2023, the worst of major stock markets globally.
In the earlier half of the year, prior to the stock market downturn, there was marginal progress in opening portfolio investment markets in some areas. The Shenzhen and London exchanges took additional steps toward establishing the Shenzhen-London Connect, which will improve capital market connectivity. The China Securities Regulatory Commission (CSRC) also softened restrictions on the offshore listing of Chinese companies with variable interest entity structures, and a new registration-based IPO system will allow investors opportunities to invest in a wider range of companies. 38
38 China Securities Regulatory Commission, “关于上线境内企业境外发行上市备案管理信息系统的通知” [Notice on the launch of the domestic enterprise overseas listing registration management information system], February 17, 2023, http://www.csrc.gov.cn/csrc/c101932/c7124559/ content.shtml.
In the second half of the year, government-guided security purchases aimed to stabilize markets and assuage investor confidence as stock market performance took a steep downturn. China’s Central Huijin Investment fund purchased exchange-traded funds in October, and the China Reform Holdings Corp (another state-owned strategic investor) purchased tech-focused index funds in December. Meanwhile, the government allowed social platforms such as WeChat to direct retail investors to the stock market. Government-backed funding vehicles also acquired “golden share” stakes in Alibaba and Tencent’s local operations, allowing more government oversight of company decisions. In January, CAC was reported to have taken a 1 percent stake in an Alibaba digital media subsidiary in Guangzhou. 39
To regulate supply, the government raised barriers for new public offerings and introduced restrictions on trading, aiming to reduce supply volatility. The CSRC slowed the pace of IPOs and tightened restrictions on refinancing activities for underperforming listed firms. The CSRC also tightened rules on share sales by large shareholders of listed firms and increased scrutiny of program trading, later banning mutual fund managers from selling more shares than they bought daily.
China’s response to portfolio investment troubles also contained some marginal market opening. To reduce transaction costs, China halved the stamp duty on stock trading and reduced transaction handling fees submitted by brokers to the exchanges. Chinese stock exchanges also lowered margin requirements to boost investor financing.
39 Yingzhi Yang, Brenda Goh, and Josh Horwitz, “China acquires ‘golden shares’ in two Alibaba units,” Reuters, January 13, 2023, https://www. reuters.com/technology/china-moving-take-golden-shares-alibaba-tencent-units-ft-2023-01-13/.
China’s
The
FIGURE 2.18. KEY SUPPLEMENTAL INDICATORS: PORTFOLIO INVESTMENT OPENNESS (2023*)
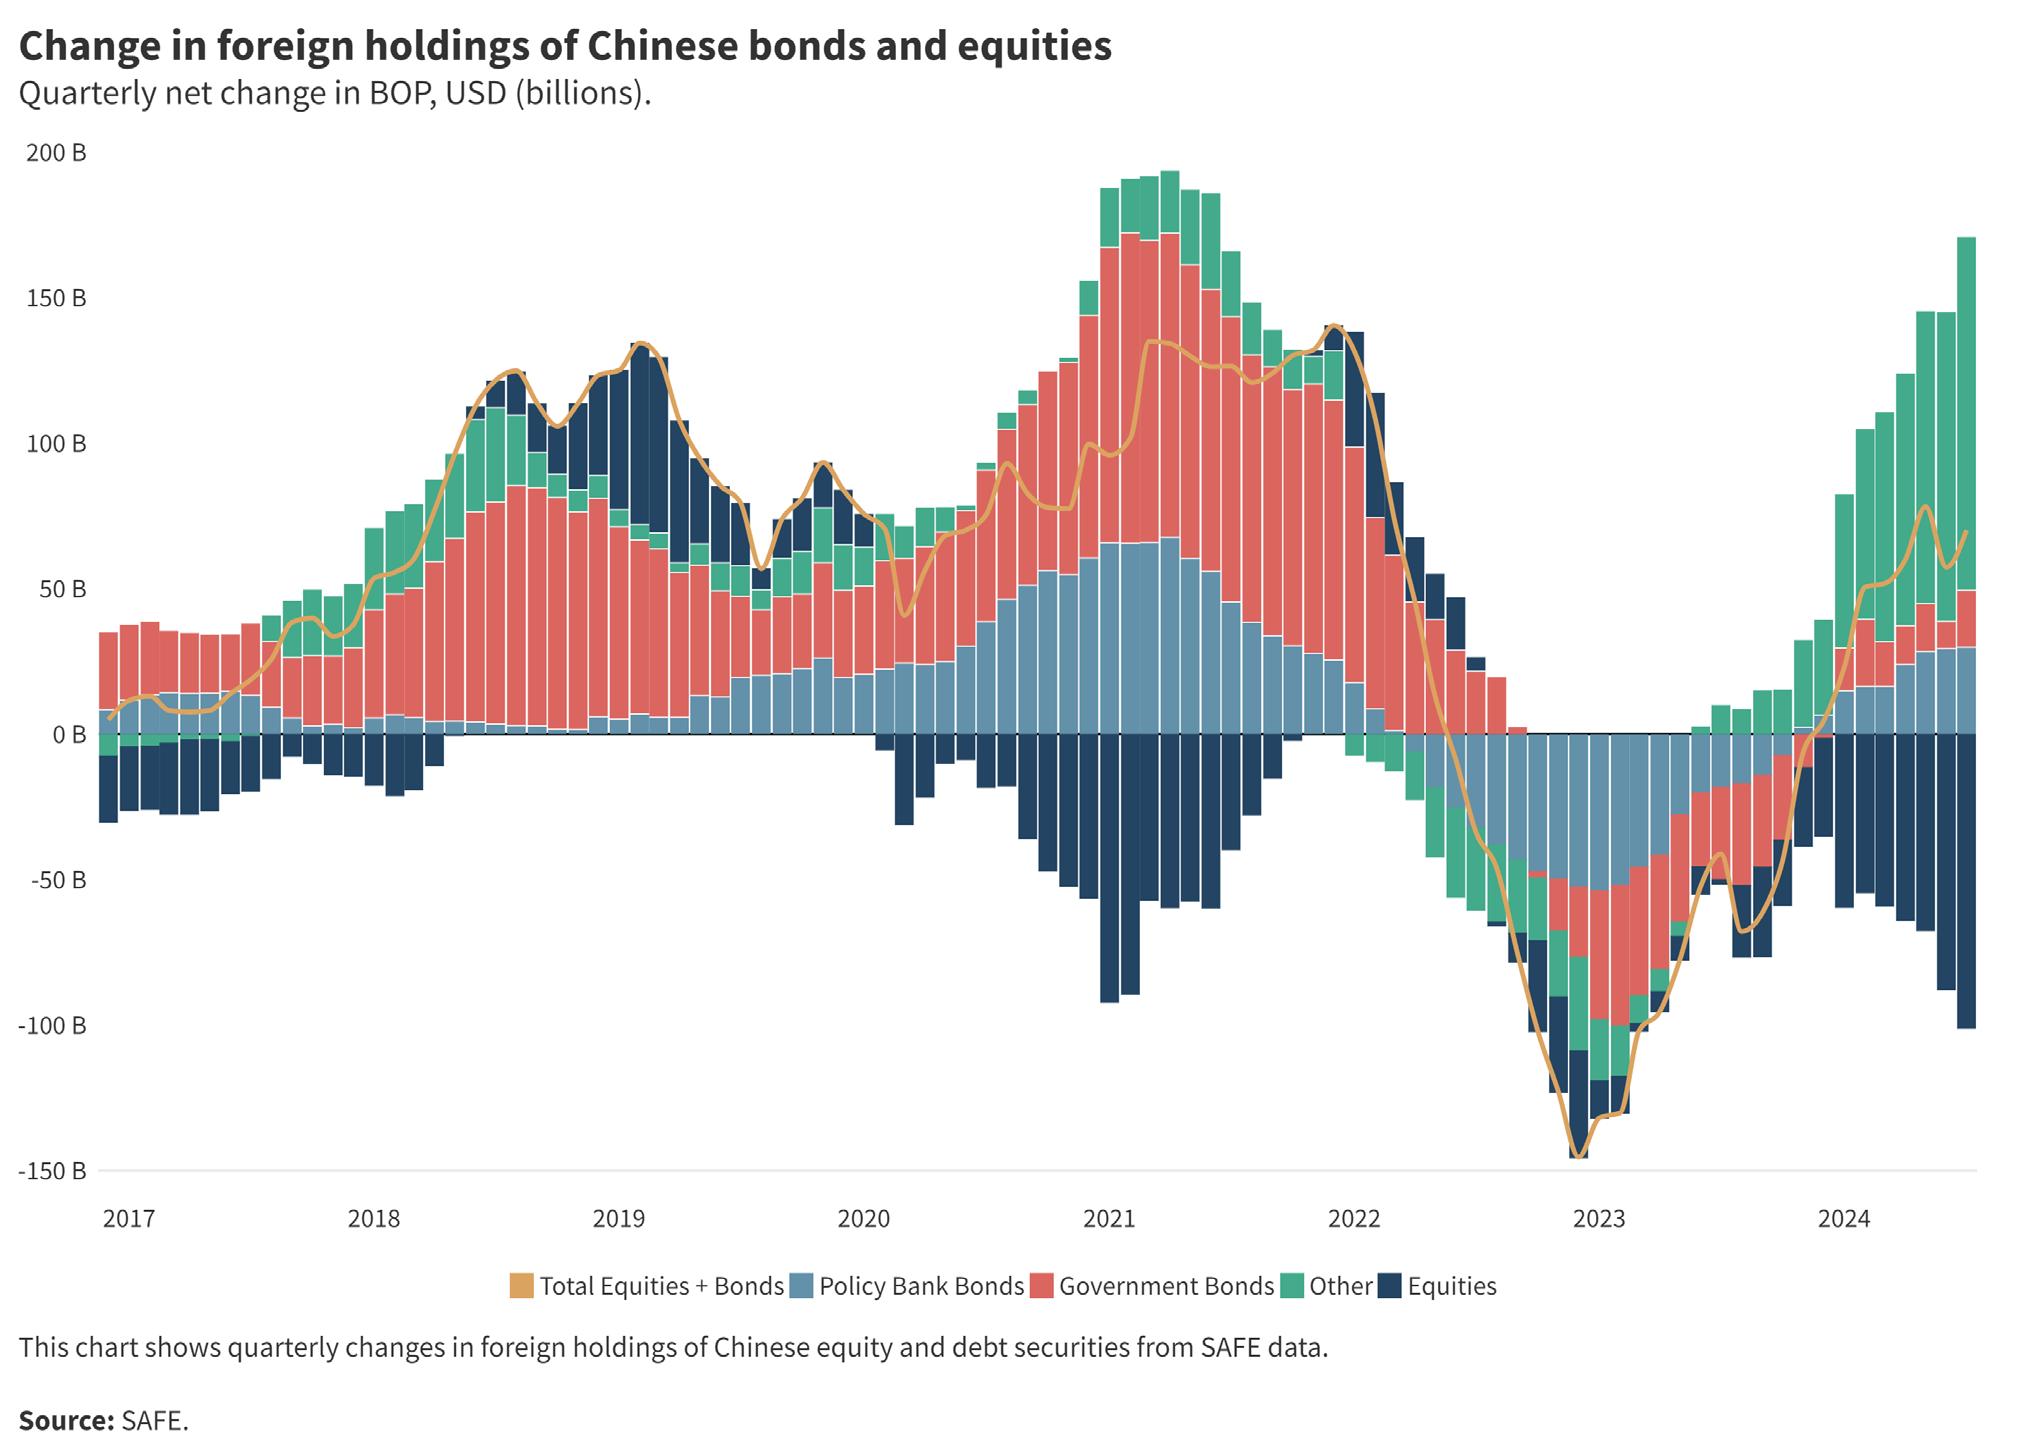
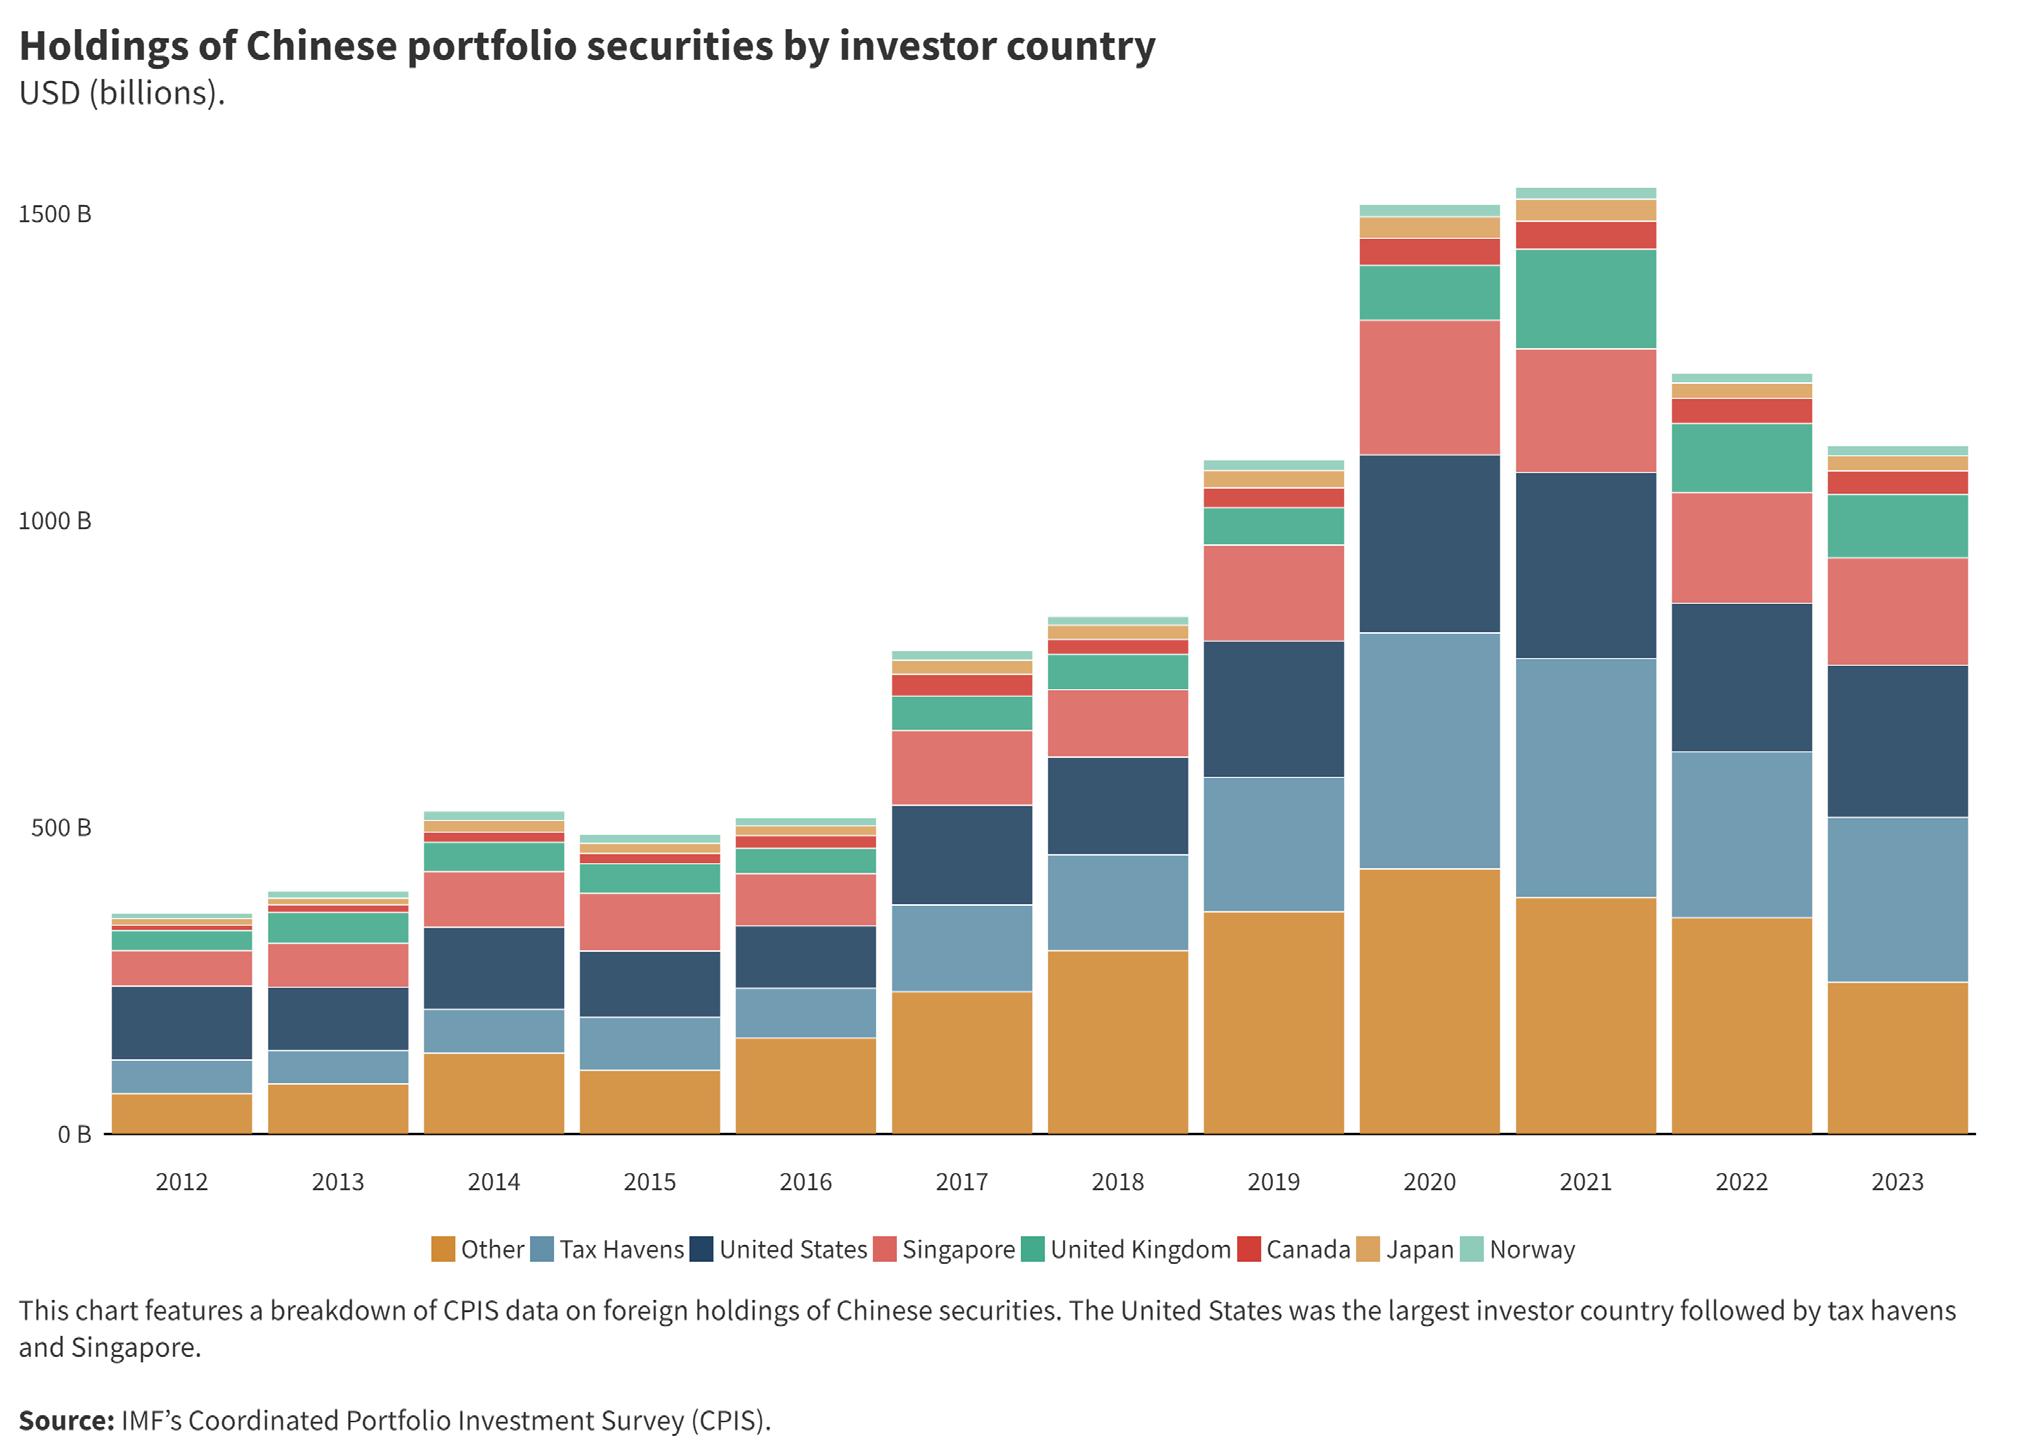
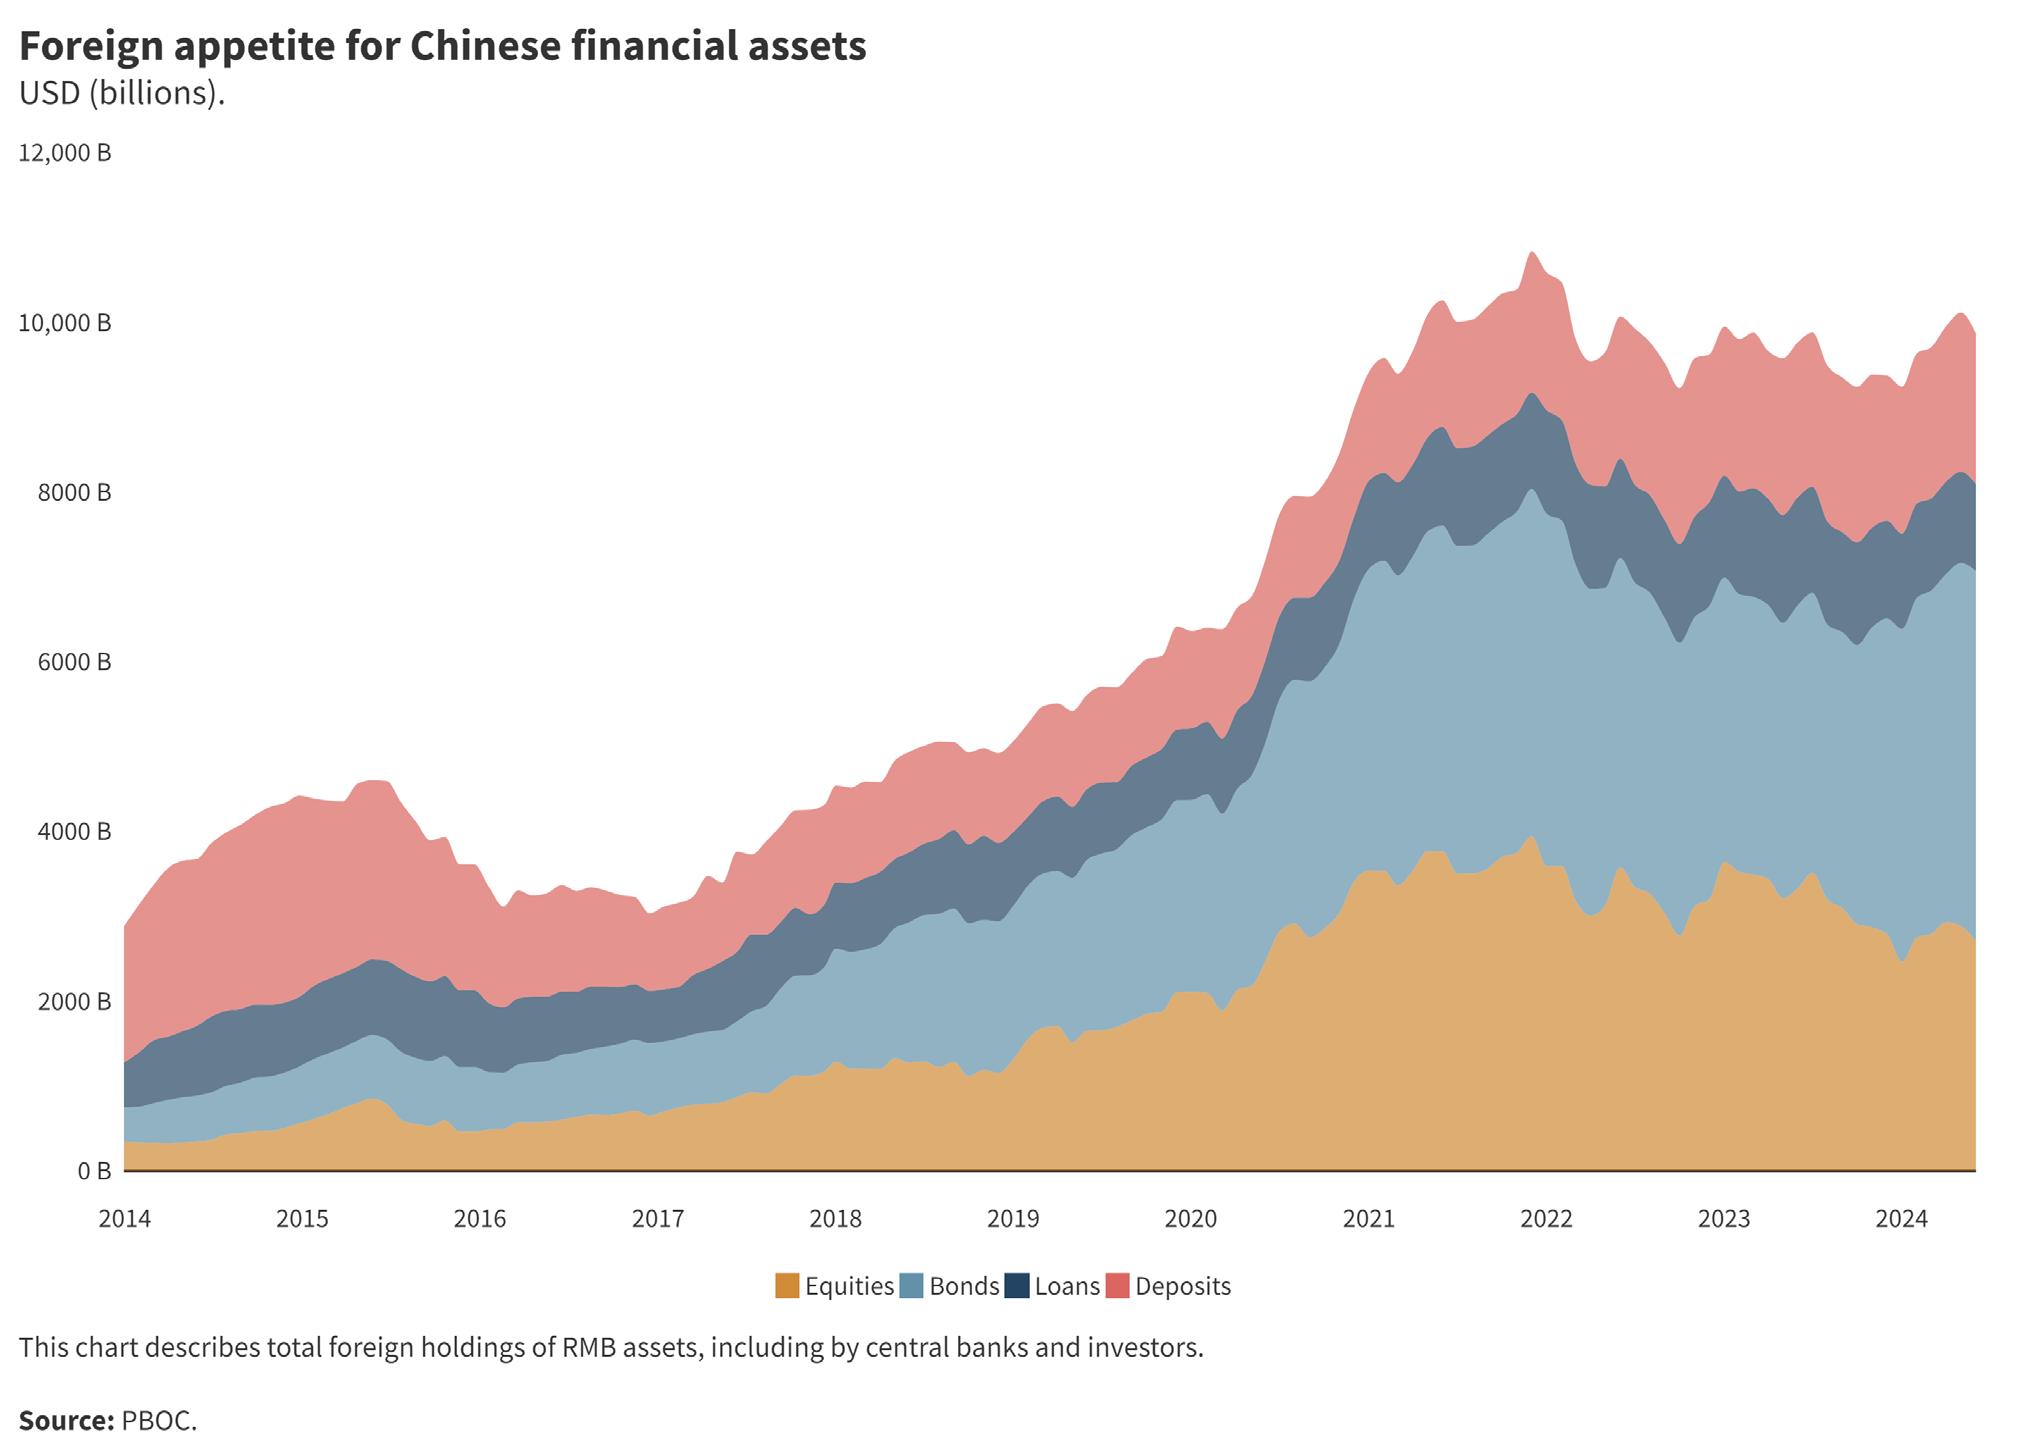

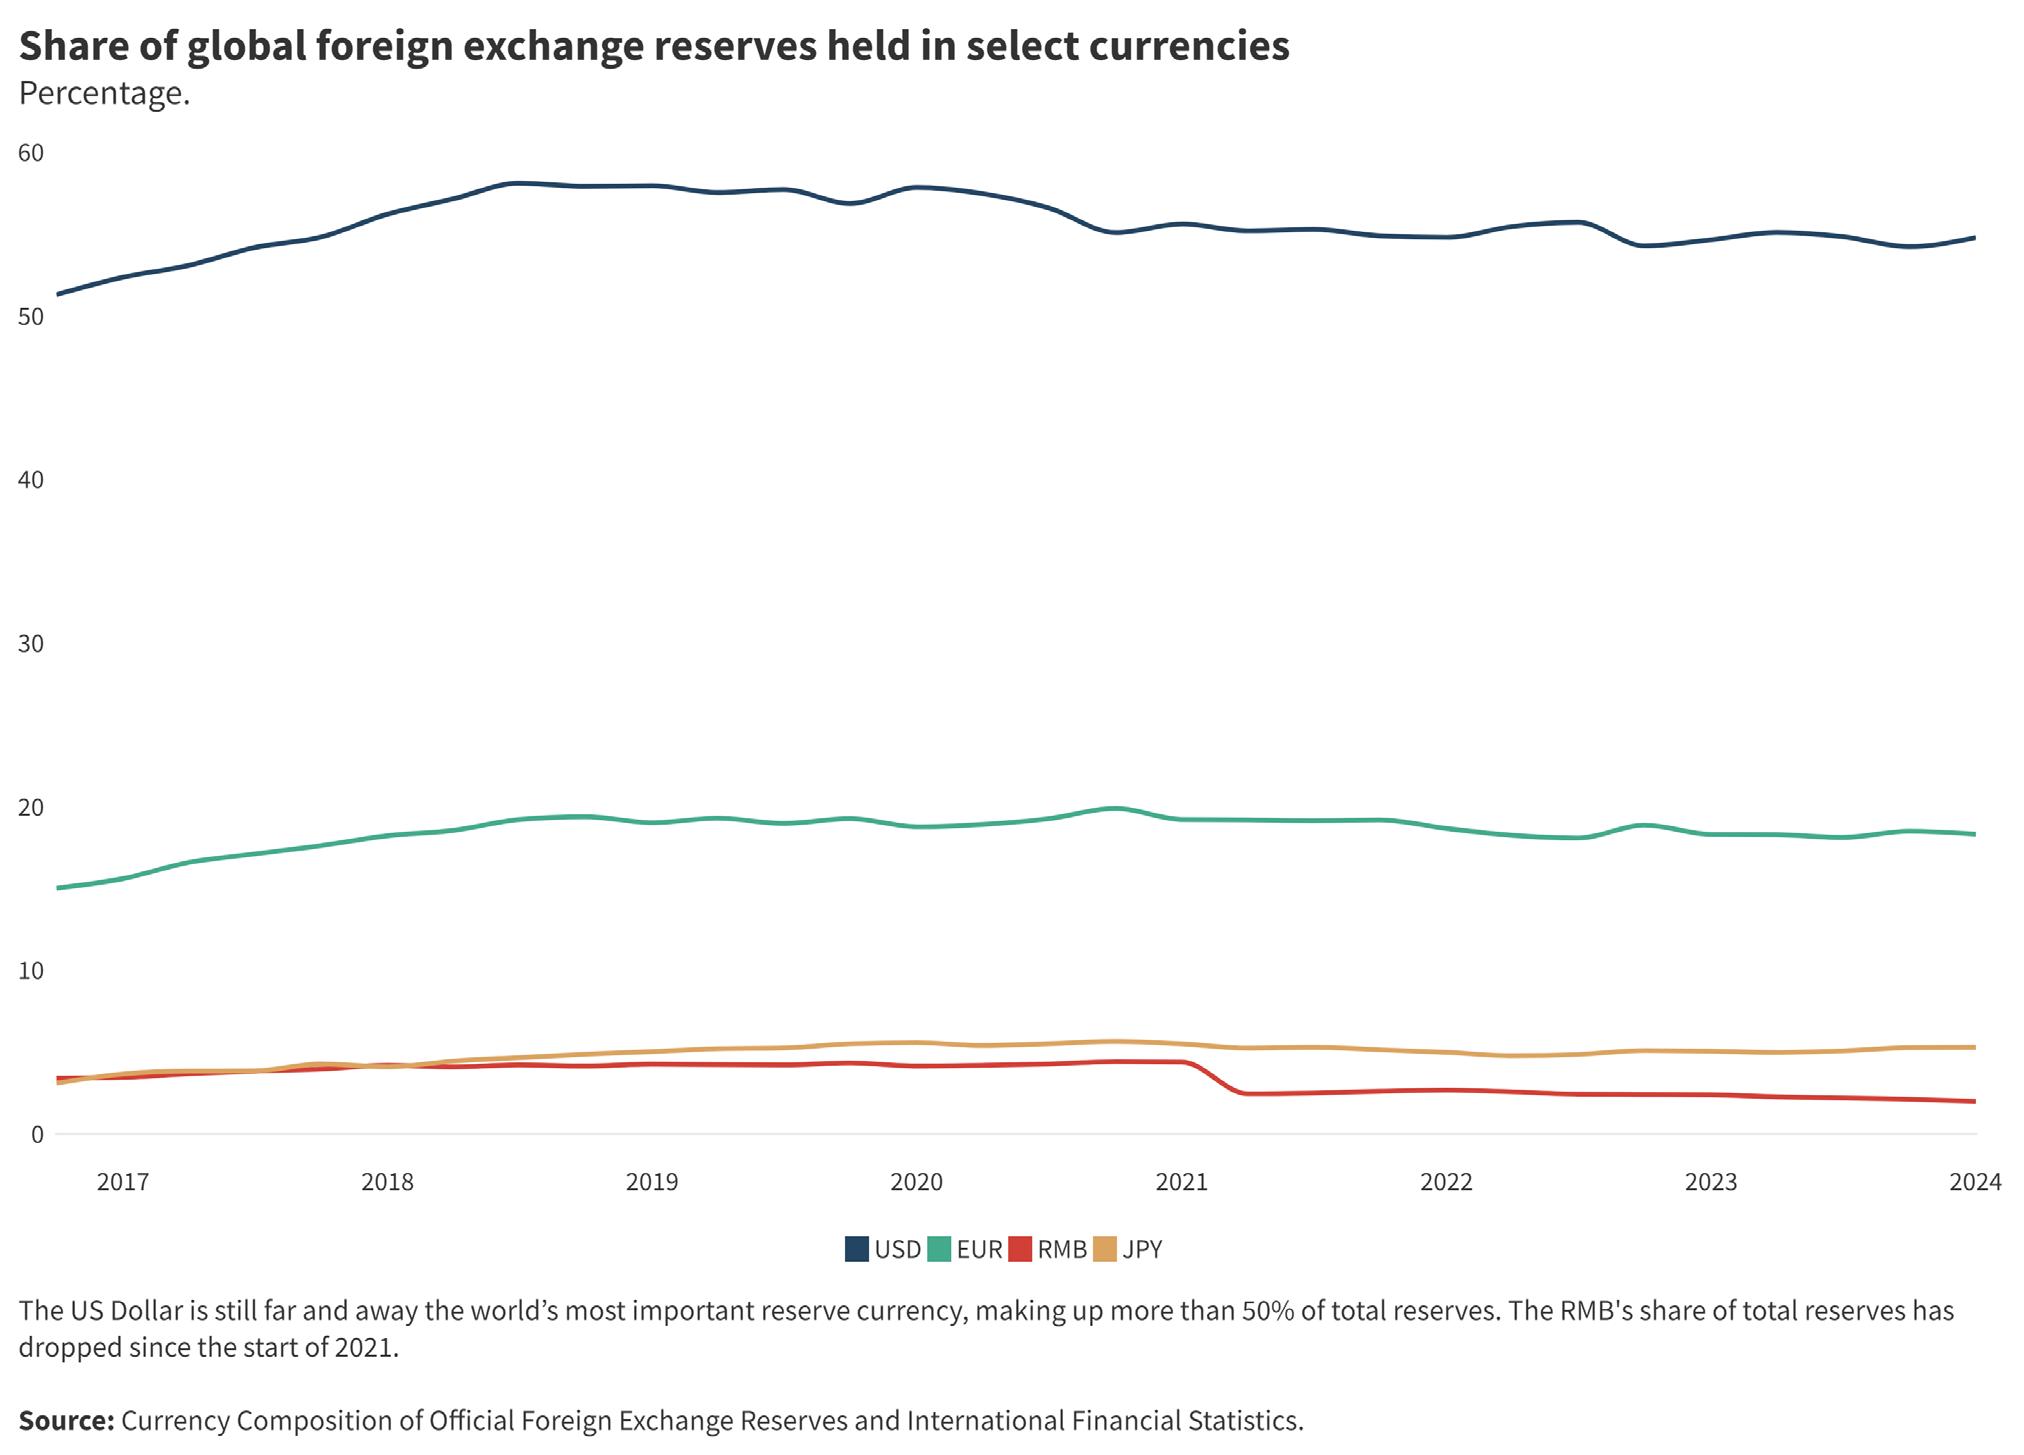
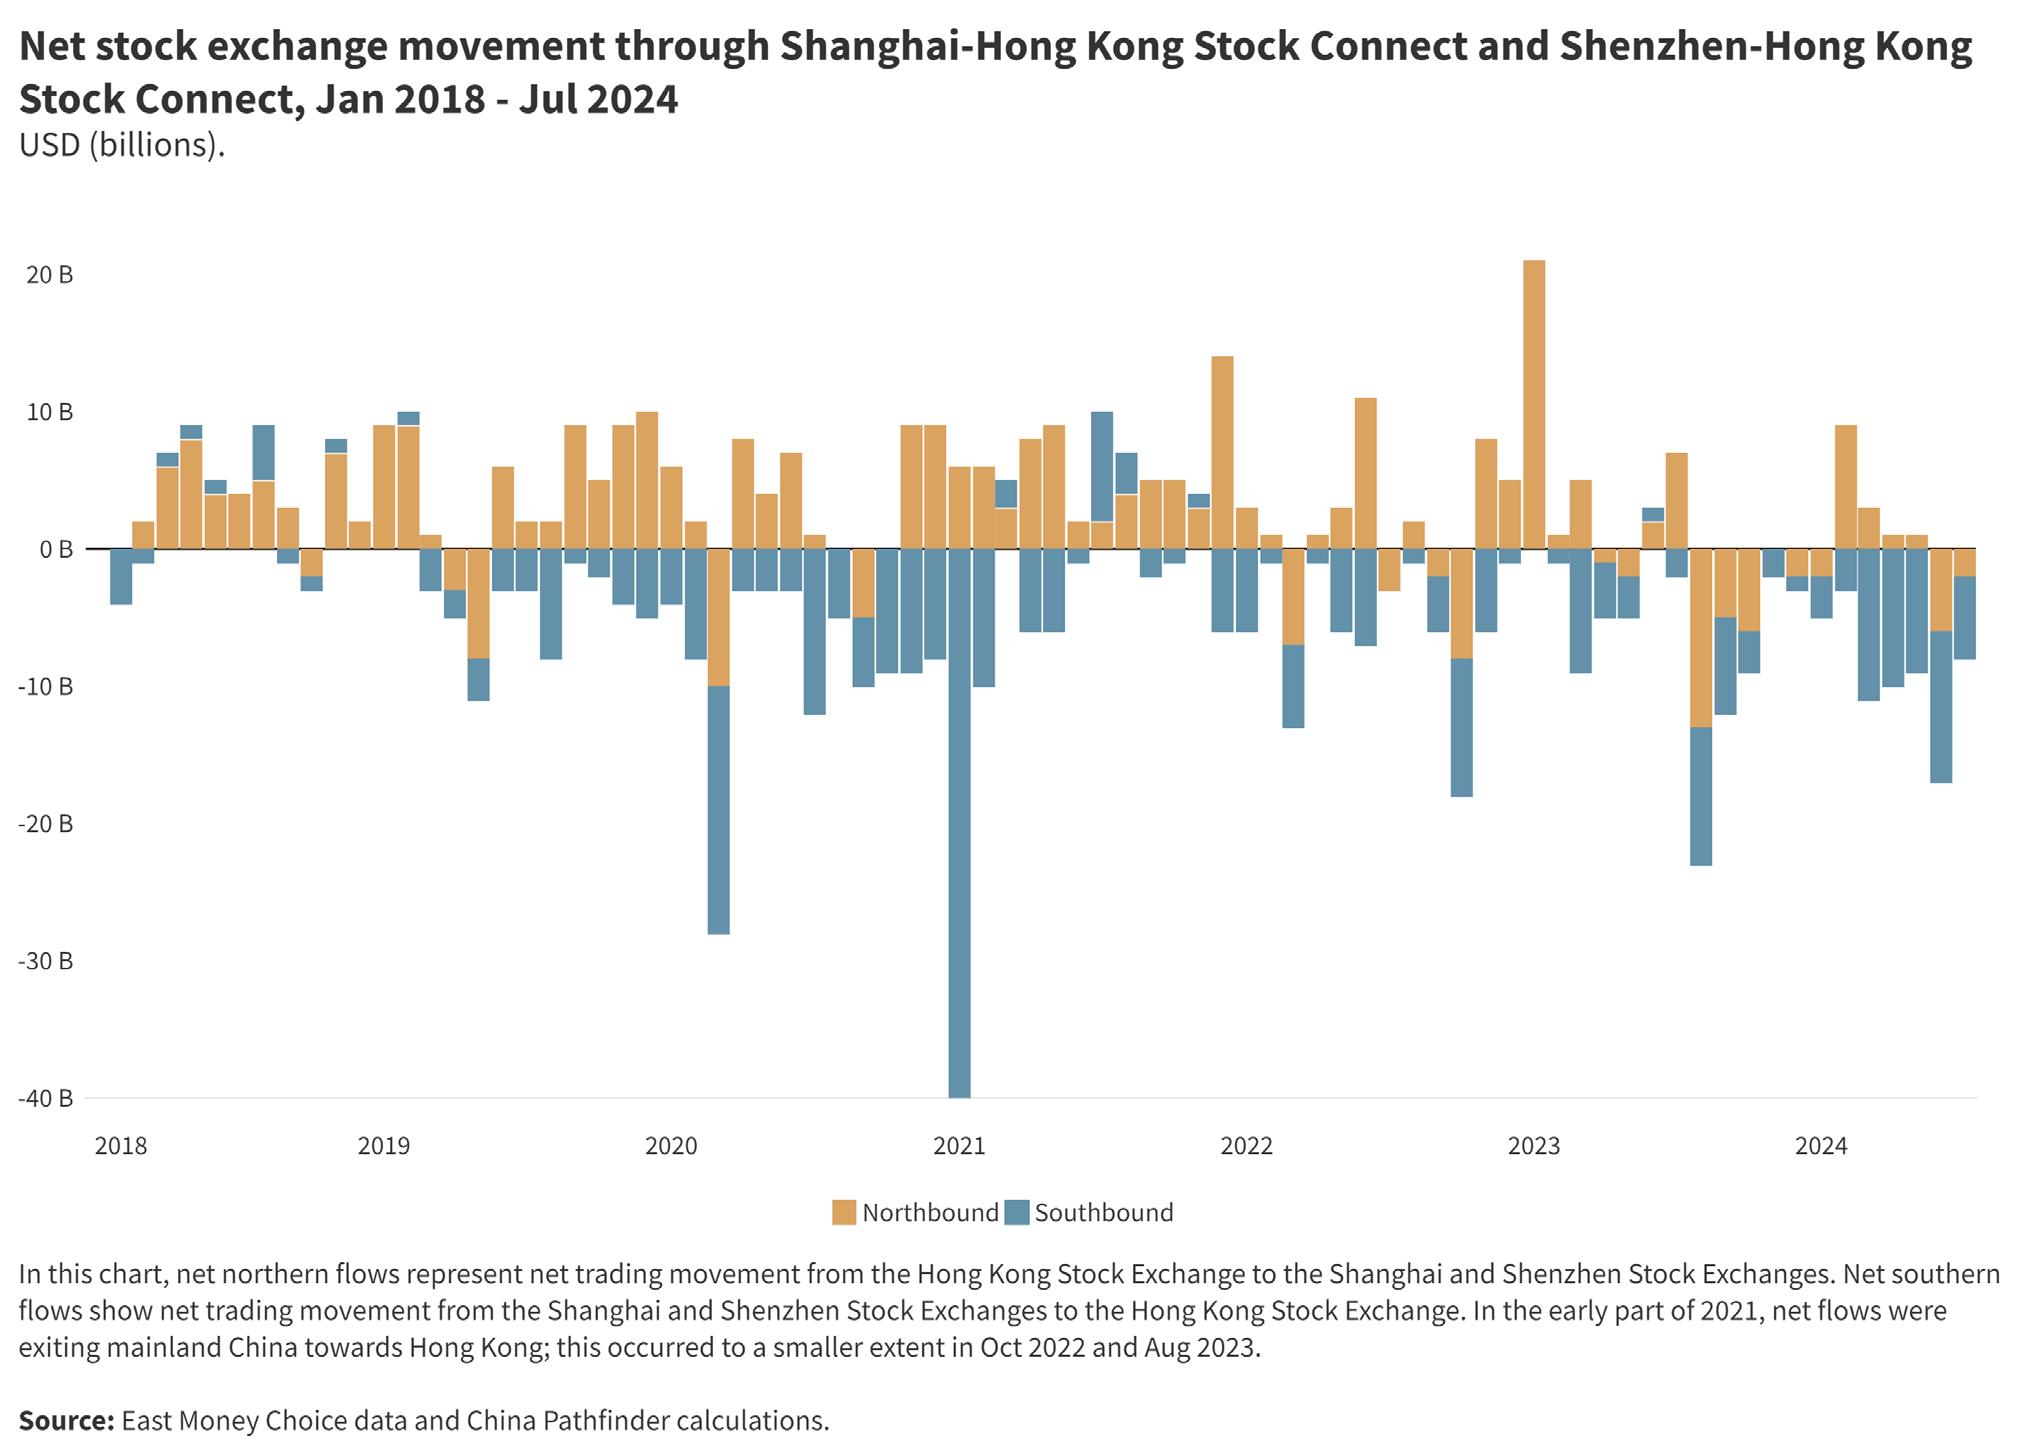
The challenge to reform in China has always been its real and perceived costs. China’s policymakers and economic experts have long understood the need for economic reforms; the key question has been whether policymakers and leaders would accept and incur the consequences of short-term growth, unproductive state-owned firms, and other interests. Whether in the marquee 2013 Third Plenum reform program, the supply side capacity reduction push in 2015–16, or the financial de-risking program that peaked in 2018,40 previous reform pushes aimed to alter economic principles in China. All involved facts of ceding economic leadership to the private sector, embracing foreign investment and competition, and resolving longstanding questions of fiscal capacity and domestic demand, accepting shortterm disruption for long-term viability. Instead, in 2023— as since 2013—policymakers retreated when faced with costs and constraints. Increasing geostrategic competition with the United States and Europe, increasing state direction of investment, and surging support for priority sectors instead took priority. These dynamics presaged what emerged in July 2024—in an overdue meeting from 2013—during the Third Plenum of the CCP.
Stalled reform, however, does not imply that China made no progress, whether in 2023 or since 2020 when the China Pathfinder Project was launched. But these small improvements come with major caveats, and the China Pathfinder results thus point to ongoing friction between the OECD and China in the coming years.
In 2023, China’s policy reforms stalled, while OECD scores came under pressure. On net and pulling together the findings from our detailed benchmark assessment of six clusters, we make the following observations.
Beijing continued to emphasize SOEs, even as it demanded more from the private sector to meet industrial policy goals: The dominance of state firms in China’s economy continued to grow in 2023. Given China’s ambitious technological goals and urgent fiscal crisis, analysts might have predicted policy to reduce SOEs’ throw weight and empower private sector innovation. Even some targeted asset privatization might have been reasonable, generating much-needed revenue at the cost of local protectionism. Instead, the weighted average of state ownership among top firms across sectors continued to grow, reaching 65 percent; it continues to surpass 2010 levels. State ownership in China’s top financial institutions also remained above
60 percent. Several policies increased state support for SOEs in 2023. Beijing granted new tranches of LGFV stimulus in 2023 and relaxed regulations on public offerings for listing SOEs. At the same time, there were few signs of action on promised private sector reform in 2023. High-level policy directives to stimulate domestic investment in innovation, manufacturing sectors, and industrial development are calling on the private sector to take on more funding responsibility. The private sector has responded; in 2023, its stated share of R&D spending in China reached its highest rate since 2020. But it is unclear what else the government can practically, and effectively, do to fund additional innovation. Government funding is constrained, and inbound VC and FDI are deteriorating. Increasing funding for SOEs without meaningful structural reform to address existing debt troubles will expand moral hazard and pose risks to capital productivity.
Surging goods trade numbers highlight overcapacity, while services trade suffers from the impact of geostrategic and security policies: China’s exports from certain sectors increased dramatically in 2023 as overcapacity industries offloaded products elsewhere to compensate for low domestic demand. These overcapacity issues are likely to get worse. But as concerning as overcapacity is for the OECD, security and geostrategic policies in 2023 had a more dramatic impact on China’s trade openness, especially in services.
China’s 2023 exports of commercial and transport services declined by $43 billion and $59 billion, respectively, and heightened regulatory barriers restricted market access. The drop reflects the extended crackdown on technology firms, as well as data and cybersecurity restrictions that worried foreign companies. Consequently, China’s digital services trade openness score dropped below its 2010 level. That Beijing chose to reinforce security over increased services trade highlights how economic policymakers were unable to convince high-level leaders of the need (and benefits of) services engagement. Lingering effects from COVID-19 lockdowns in 2023 explain some of the decline in China’s services trade, but Beijing’s focus on security—and unwillingness to accept tradeoffs between digital growth and digital control—resulted in intervention in other areas of the economy.
Innovation ratings declined in the OECD: In 2023, innovation scores across most of the OECD decreased, while China’s score showed little change from 2022. Both developments reflect financial constraints: all countries suffered from the global VC slowdown in
40 Logan Wright, Grasping Shadows: The Politics of China’s Deleveraging Campaign, Center for Strategic and International Studies, April 10, 2023, https://www.csis.org/analysis/grasping-shadows-politics-chinas-deleveraging-campaign.
2023, as seen in decreased indicator scores, and high interest rates hampered access to debt financing. Funding for innovation remained a top priority for the Chinese government in 2023, and government funding did attempt to spur development during the year. However, fiscal constraints in 2023 and increased spending on areas key to social stability threaten China’s ability to subsidize and finance innovative industries and strategic sectors. Local governments are tasked with greater funding responsibilities amid a lack of substantive financial system reform to improve debt positions. Yet China was not alone, and many OECD countries also saw declines in patent output and IP attractiveness. Rising barriers to investment and trade constrain access to critical inputs, market scale, and international research collaborations, which are necessary for both Chinese and OCED economies to grow or maintain a robust innovation ecosystem.
After four years of analysis, we can see that 2023 was not exceptional. While both China and OECD progress during the four-year period was mixed, China’s challenges during the China Pathfinder period were consistent, and structural, as certain reforms remained off the table. Based on this report and previous China Pathfinder editions, we make the following observations about China’s progress, and the challenges of interpreting data during the period.
China has shown improvement in several areas since 2020: China’s financial system reforms have expanded market depth and access along several dimensions, even as shortcomings remain. In 2022, China scored the lowest out of all sampled economies on the Financial System Development Composite Index indicator. In 2023, however, China stands ahead of Italy and Spain. Most of this movement is due to the Chinese government’s deleveraging policies in the wake of the property sector collapse, which have improved China’s credit efficiency. But significant problems remain. Despite government efforts to support stock exchange through the creation of bond and stock connect programs and the easing of restrictions on stock market access, China’s stock market continues to falter, incurring losses upwards of $6 trillion since 2021.41 State ownership in China’s financial system, and the absence of more significant structural reforms to improve local government debt, hold China back from closing the gap with our broader sample of OECD markets. China has also improved the prioritization of innovation funding and diversity of funding sources in its economy. Since 2020, China’s score for R&D spending as a share of GDP has risen to almost meet the OECD average, bolstered by strong prioritization of R&D for central and local government funding. Diverse government funding vehicles outside of traditional
grants and tax incentives provide alternative avenues to finance China’s innovation ecosystem. Private funding for innovation has also remained well above the OECD average since 2010, and China’s score has grown at a faster rate than the OECD’s through 2023. Reinvestment of profits is the largest source of R&D funding for commercial actors by value, and as China’s fiscal space becomes more constrained, commercial actors are being called on to take a greater role in R&D funding. These actors are subject to state influence as Beijing attempts to ensure that spending is directed toward government priorities. China’s performance on the Direct Investment Openness Composite Index has also shown slow but consistent improvement, though it still trails the OECD average. A gradual easing of China’s heavily restricted FDI inflows and outflows in certain sectors has improved China’s scores on FDI restrictiveness indicators.
But a lack of system-wide structural financial system reform constrains China’s ability and willingness to reform in other areas: China’s financial system has opened since 2010, and its composite benchmark score increased moderately in 2023 as credit allocation improved. Yet even China’s improved score is still lower than it was in 2020 and remains lower than all countries in our sample other than Italy and Spain. These subcomponents of China’s scores since 2020 tell the story. While their scores are higher than in 2010, financial market access and our direct financing ratio benchmarks have all decreased since 2020, reflecting deep-seated constraints on depth and efficiency of the financial system. This has impacts well beyond the financial system. A distorted financial system will continue to struggle to stimulate domestic consumption, and preferential credit will make it harder for private and foreign firms to compete. Despite its side effects, domestic credit will continue to power investment in China’s economy. Innovation goals will be more difficult to accomplish if R&D and start-up activity cannot be effectively financed. Portfolio and direct investment could fill some of this gap. But while our scoring of, for example, China’s portfolio investment openness has improved marginally since 2020, it remains far below that of all other countries in the sample (at 1.2 points compared to the next-lowest scorer, South Korea, at 5.9 points). China’s VC investment score (in the innovation cluster) did not improve significantly during the China Pathfinder study period. The absence of deep and liquid financial markets and constraints on government funding will be bottlenecks to funding a rich innovation ecosystem that allows Chinese firms to remain at the forefront of technological innovation.
The COVID-19 pandemic affected our benchmarking between 2020 and 2024 and continues to affect economic analysis today : The scores we track reflect the challenge of interpreting economic data in the wake
41 Abhishek Vishnoi and Charlotte Yang, “China’s $6.3 Trillion Stock Selloff Is Getting Uglier by the Day,” Bloomberg, January 19, 2024, https:// www.bloomberg.com/news/articles/2024-01-19/china-s-6-3-trillion-stock-selloff-is-getting-uglier-by-the-day?sref=E0nAM78N&embeddedcheckout=true.
of the COVID-19 pandemic. The first China Pathfinder report was launched in 2020, at the height of the pandemic, as markets and government policy scrambled to respond. While 2010 data provides a comparative baseline for our market sample, COVID-19 dynamics mean that the changes in scores we have observed since 2020 may be temporary adjustments enduring movements toward or away from market norms, making it harder to conclusively determine reform patterns in China and the OECD. One-off COVID effects have impacted several scores in these reports; for example, supply chain disruptions may have suppressed China’s FDI stock performance in 2021–22 and affected services trade in countries with large tourism and transport sectors. There are special challenges in disaggregating the impact of COVID-19 on China’s performance. In the years prior to the pandemic, China’s economic growth began to slow, the expansion of domestic credit began to cool, and China entered a trade war with the United States. Shortly after the onset of the pandemic, China’s property market downturn sent shockwaves through a destabilized system. Retrenchment toward familiar tools of state intervention in response to these sources of economic instability can thus be difficult to attribute to discrete pandemic effects. It may instead represent the strengthening of a persistent structural feature. However, policies such as zero-COVID are examples where China’s pandemic response may obscure longerterm trends in the prioritization of state versus market forces.
Geo-fragmentation and backsliding impact OECD scores: China isn’t the only economy backsliding on reform. OECD countries are also relapsing as trade barriers, nearshoring, and the securitization of economic interactions grow. The OECD average for both inbound and outbound investment restrictiveness has dropped below 2010 levels as of 2022, the most recent year surveyed, and digital services trade restrictiveness has remained below the 2010 benchmark for several years despite slow improvement. Restrictions on flows of investment and people, alongside supply chain fragility under geopolitical tensions, create challenges for international research exchange and access to inputs needed for cutting-edge science and technology development. In 2023, the OECD’s patent score dropped back to 2010 levels.
Beyond its quantitative results, the China Pathfinder Project has important implications for how analysts should approach China’s economy and system. In light of our past four years of work, three principles bear special mention:
First, as noted in Chapter 1, the way the world looks at China has changed radically since China Pathfinder began. Rather than assuming that China has joined
(or is soon to join) the club of developed markets, global investors in 2024 now analyze China with the same principles and caution they deploy for analyzing other emerging market countries. Between equity and property assets, China has lost $15 trillion in value since 2021; for global investors, such losses require them to question whether China is even baseline investable. Answering that question requires sufficient quantitative data, as does a broader analysis of China’s economic performance, like the China Pathfinder Project. The challenges we faced with data availability, reliability, and continuity illustrate the challenges faced by any analyst of China’s economy at the aggregate level. We are not alone in our quest for reliable metrics, whether from China—where data series have been retired, rebased, or arbitrarily suppressed—or from international organizations, which face publication delays and their own priority shifts that may orphan critical data streams without notice. International investors have many reasons to worry about China’s markets, including period crackdowns on private firms, increasing geopolitical tension, and reform promise fatigue. Data unreliability is yet another plausible justification for pulling back on investment in China. Just as some analysts have turned to anecdata or qualitative approaches, in the future, any attempt to quantitatively engage with China will require muddling through.
Second, statistical data access is not the only constraint on independent researchers conducting studies like this one. Since 2020, the ability to do firsthand research and meetings has been dampened by a perfect storm of factors, including pandemic travel restrictions, pressure on Chinese officials not to interact with foreigners, and a chilling effect on economists and due diligence professionals who might otherwise publicly criticize authorities. This has damaged the overall degree of transparency and free flow of information that serves as a critical input to our framework and hampers interpretation.
Third, the China Pathfinder Project takes a targeted— but potentially too narrow—view of economic outcomes. The framework evaluates a broad set of indicators covering many facets of market economic systems. However, it does not directly compare the outputs of these systems: growth outcomes and productivity. The latter includes the concept of total factor productivity (TFP), the proportion of potential economic output that cannot be accounted for by factors like a growing labor force or more capital investment. China’s productivity has been declining for several years,42 and our evidence of partial, stagnating reforms reinforces how policy is prolonging that slowdown. Our evidence would also predict a continued decline. If these dynamics persist in coming years, whatever China’s progress in specific metrics, a wider view of China’s system as compared
42 For further evidence supporting this, see: Logan Wright, “China’s Economy Has Peaked. Can Beijing Redefine its Goals?” China Leadership Monitor, September 2024. https://www.prcleader.org/post/china-s-economy-has-peaked-can-beijing-redefine-its-goals.
to other economies might need to integrate analysis of outcomes to fully address the effects of piecemeal reform.
These takeaways present a challenge for future research, but conditions are changing. For starters, despite the severe problems with the quantity and quality of Chinese data, we believe new analytic strategies can deliver answers. Alternative credit data, satellite imagery, and efforts to integrate (and rectify) mirror and partner country data offer creative researchers increasingly valuable tools. There remains a lot of value in quantitative analysis, even with a higher margin of error than we expected, and even if approaches must adapt to new data streams.
A larger takeaway, though, is that serious Chinese economists share these concerns about data, information, and productivity. As hopes of an easy post-COVID recovery have faded, these economists have become more pointed in their critique of current conditions. Academics like Zhang Bin, Huang Yiping, Yu Yongding, and others have correctly asserted the need for credible economic statistics and a clear-eyed assessment of China’s economic conditions. With time and facing as substantial an economic challenge as China currently confronts, there is some reason to hope that objective data from within China and frank discussion of that data will once again be possible in the coming years.
What does the future hold, based on what we have learned in the China Pathfinder Project? We conclude with a few conjectures about that for business and policymaking. We also offer a look ahead to our research team’s next-generation ambitions, with some lessons learned for analysts.
We predict that today’s observed structural slowdown will be persistent because it is clearly rooted in divergence from market-oriented policy reorientation. In theory, market systems are more efficient than politically controlled economies, enabling them to reach a higher production possibility frontier and potential growth rate. This is also what we observe in practice. China turned toward marketization, and its growth outperformed. It is now steering toward statism, and its growth is underperforming. This trend predates the COVID-19 pandemic and survived it.
Slower macro expansion means businesses will need to fight over market share rather than count on a fastgrowing pie to feed all firms. In theory, this should compel competitors to work harder to attract customers, which could drive innovation and productivity. If the government suppresses competition to avoid structural adjustment and instability, this will deplete productivity. The “lie flat” movement—a widespread disinclination to strive due to a sense of low probability of success— can be seen as a reflection of this tendency. Slower domestic growth also increases the marginal pressure
to export, invest abroad, and compete for customers overseas in higher-growth opportunity markets. This is a major theme presently and one our framework suggests will become even more salient.
Shifting business expectations for the quantity and quality of China’s macroeconomic growth will also impact the political economy of business-government relations in the West. Less concerned with shielding their China operations from home government policies, firms will shift their lobbying focus from moderating strategic and commercial de-risking to advocating for trade protection, relocation subsidies, innovation incentives, and other benefits.
Political and national security policymakers in market democracies will lift their ambitions in response to this change in business sector positioning. Economic security as a subfield of economic policymaking, including industrial policy, will continue its nascent rise in importance as a result of the competitive risks and opportunities of a bifurcating global supply chain landscape. Financial officials will be greatly concerned about the risks of crises and financial spillovers due to shifting economic flows, stranded assets, and changing assumptions about supply and demand.
This is just a rough initial sketch of some of the likely repercussions of an extended slowdown of China’s economy. Whether China’s “socialist market economy” model ceases to be emulated around the world is another huge question, as is whether the liberal market approach is the default to which attention returns. The seal has been broken on industrial policy in the West, and this is likely to persist.
Another policy-level question is at the international organization level. Institutions including the IMF, the WTO, the World Bank, and even the industrializeddemocracies-centered OECD largely accepted China’s variant of the economy and lauded it for its developmental achievements over the past two decades. Even today, these organizations are overcautious about critizing China’s official economic performance narrative. Institutionally, they view their remit as challenging member data, even if staff views often differ from leadership. How these organizations function in a world focused on bifurcation and derisking is unclear.
Our annual and quarterly China Pathfinder reports have been read worldwide: the website is most used by users from the United States, but the second-most users are from China itself, followed by Germany, France, and the UK. As discussed at length above, a methodology dependent on official Chinese data has grown harder to employ, but the demand for an integrated perspective on China’s economy has never been higher. Thus, we intend to continue our research partnership with modifications.
As of this writing, a variety of next-generation strategies are under discussion. The principles we will carry forward are clear, though: 1) policymakers and business decisionmakers are the primary audience; 2) readers find the most value in assessment of specific, real economy outcomes; 3) our decade of quantitative databasing is foundational; 4) we must maintain a systemic analysis which takes stock of political and security factors; and 5) our outputs should speak to the most pressing, current topics, rather than perennial debates. On what is topical, discussions about overcapacity, diversification, growth slowdown, and barriers to cross-border capital, information, and technology flows are illustrative.
We intend to focus less on cataloging China’s policy aspirations and more on performance outcomes. We intend to evaluate performance less with official data at the core and more based on alternative proxies that are less prone to delay and politicization. We intend to maintain objectivity and quantification while putting more weight on independent measures of economic activity at risk outside China as a function of nonmarket norms and interventions in China. Finally, we will continue to critique excessively protectionist policies unreasonably justified as necessary to respond to China.
The China Pathfinder Project illustrates China’s relative progress on reform: China’s economic system looks much different than it did in 2010, even as it continues to diverge from market norms. Despite China’s stagnation or backsliding in several of the areas China Pathfinder evaluates, there is still room—and need—for managed, constructive economic engagement between China and the rest of the world. While market economies seek to de-risk from China where necessary, trade and investment in other sectors still offer mutual benefits. The global commons also presents China and the OECD with challenges that we must manage together as effectively as possible. If nothing else, China Pathfinder shows the importance of economic and policy choices. China’s past reform choices do not prevent its leaders from making different ones that can further benefit China’s growth and its people. We encourage fellow researchers in China and elsewhere to take a broad, long-term view of economic reform and all readers of China Pathfinder to engage with us on how our work can be more valuable and impactful.
AI Artificial intelligence
AREAER IMF’s Annual Report on Exchange Arrangements and Exchange Restrictions
BIS Bank of International Settlements
BOP Balance of payments
CAC Cyberspace Administration of China
CCP Chinese Communist Party
CPIS IMF’s Coordinated Portfolio Investment Survey
CSRC China Securities Regulatory Commission
DSTRI OECD’s Digital Services Trade Restrictiveness Index
EMs Emerging markets
EPO European Patent Office
EU European Union
EV Electric vehicle
FDI Foreign direct investment
FIE Foreign-invested enterprise
FTZ Free trade zone
G7 Group of Seven
GDP Gross domestic product
IMF International Monetary Fund
IP Intellectual property
IPC International Patent Classification
IPO Initial public offering
IVA Industrial value-added
LGFV Local government financing vehicle
M&A Mergers and acquisitions
MFN Most favored nation
MOFCOM China’s Ministry of Commerce
NBS China’s National Bureau of Statistics
OECD Organisation for Economic Cooperation and Development
PBOC People’s Bank of China
QFII Qualified Foreign Institutional Investor Scheme
R&D Research and development
REER Real effective exchange rate
RMB Renminbi
ROA Return on assets
SAFE China’s State Administration of Foreign Exchange
SAMR State Administration for Market Regulation
SASAC State-owned Assets Supervision and Administration Commission of the State Council
SOE State-owned enterprise
STRI OECD’s Services Trade Restrictiveness Index
TFP Total factor productivity
VC Venture capital
WGI World Bank’s Worldwide Governance Indicators
WMP Wealth management platform
WTO World Trade Organization
The China Pathfinder Project is a collaboration between the Atlantic Council and Rhodium Group to track China’s convergence or divergence from open market economy norms. This project is nonpartisan and seeks to foster consensus about where China stands in relation to advanced market economies. With that goal in mind, our design balances accessibility for nontechnical readers with commitment to robust, transparent, and data-grounded methods.
The China Pathfinder Project evaluates the economic system of China and ten open market economies in six categories: financial system development, modern innovation system, market competition, trade openness, direct investment openness, and portfolio investment openness. The first three clusters represent the “domestic” dimension, and the latter three clusters represent the “external” openness dimension.
We rely on annual indicators that are formed into a composite score each year. Each of the six categories outlined above possesses a set of annual indicators and a final composite index. In addition, we select nuanced supplemental indicators and conduct quarterly policy tracking to keep up with fast-moving economic and policy developments in China.
This year’s China Pathfinder measures the 2023 performance of eleven countries using the same standardized metrics. It updates results from 2010, 2020, 2021, and 2022 to use as points of comparison. The selected country list is as follows: Australia, Canada, China, France, Germany, Italy, Japan, South Korea, Spain, the United Kingdom, and the United States. Aside from China, all other countries are members of the Organisation for Economic Co-operation and Development (OECD) and are considered market economies. These specific countries were chosen according to being in the top ten country list for highest gross domestic product.
Our inaugural China Pathfinder Scorecard incorporated China’s 2010 performance as a data point to benchmark China’s present-day progress since the last decade. This decision also provided data prior to the start of President Xi Jinping’s administration and offered an objective picture of how China’s economy has developed since. Starting with the 2022 report, we expanded our data sample to compare the 2010 performance of all countries in our list, not only China. This allows
us to analyze whether open market economies have improved or regressed since 2010 according to our metrics for market openness.
Our criteria for selecting annual indicators have two main components: data timeliness and ability to make international comparisons. These criteria inherently limit each other, as timely data often do not have extensive country coverage. This created obstacles in our data collection process, and the path we chose with our annual indicators reflects the ideal solution to these data availability problems.
The annual China Pathfinder report has a foundation of quantitative methods and sources. It mixes source types for data analysis. We make use of existing credible databases and literature, such as the OECD, the International Monetary Fund (IMF), and World Bank datasets and indices; platforms such as CEIC and Bloomberg for China-specific statistics and company financial data; and expert buy-in for our in-house production of proprietary datasets.
Along with compiling research from these data sources, China Pathfinder also incorporates indicators that were informed by study groups and expert interviews. Our team conducted review sessions with various outside experts on China and OECD economies, index creation, and the construction of cross-country economic evaluations. We have implemented feedback and new ideas gathered from these conversations to improve our annual indicator selection since 2020.
A composite indicator employs a defined model for selecting a group of individual indicators and transforming them into a single index. Composite indicators are common tools in policy analysis, particularly for maintaining objectivity in comparing country performance. China Pathfinder takes guidance from the OECD’s Handbook on Constructing Composite Indicators: Methodology and User Guide, which compiles various statistically sound methodologies for economists and policymakers to build composite indicators.43
To calculate composite scores, we use the Min-Max methodology. This is necessary to normalize countries’ scores from the individual indicators, which have different units and scales. The Min-Max normalization method was selected because it preserves country clustering and countries’ relative performance distance. Min-Max uses each dataset’s minimum and maximum
43 OECD and European Union and European Commission Joint Research Centre, Handbook on Constructing Composite Indicators: Methodology and User Guide (Paris: OECD, 2008), https://doi.org/10.1787/9789264043466-en.
data points to establish a “lower bound” and “upper bound.” Each country value X within a given indicator is taken in relation to these bounds. China Pathfinder subtracts the lower bound from the country value and then divides the outcome by the difference in the upper and lower bounds. This normalizes every indicator from zero to one. We use a scale of zero to ten for the composite scores, so the data points are multiplied by ten after completing the Min-Max process.
As with the 2023 annual report, the China Pathfinder methodology calculates the minimum and maximum for each indicator across countries and time to account for the evolution of indicators. The methodological change applied across all six economic areas and leads to varying effects on the data presentation. For details on that update, including relevant literature, see the 2023 annual report.44
Some indicators have opposite implications for large values and small values. For our purposes, we set the following standard for all indicators and composite score readings: smaller values (i.e., those closer to zero) indicate “low,” and larger values (i.e., those closer to ten) indicate “high” openness or development. Some indices that we adopt measure restrictiveness levels on foreign direct investment or capital flows, and larger values represent greater restrictions on openness. For indicators that follow this pattern, we reversed the values before initiating the Min-Max method for the composite. Value reversal involved setting the maximum bound for these indicators and using it to subtract each country data point.
China Pathfinder’s composite indices blend de jure and de facto indicators. De jure indicators measure a country’s institutions or legal framework characteristics, while de facto indicators are outcome oriented and seek to measure the actual effects of said institutions. While there is an argument to be made for using one or the other, we chose to integrate both into a blended composite score for each cluster. Selecting only de jure indicators opens the possibility that policies or institutions in place do not necessarily evenly result in the same expected outcomes or reflect the true situation for some countries. Using de facto indicators solely is particularly challenging with external factors, such as the COVID-19 pandemic, that greatly skew real outcomes temporarily. This approach also fails to afford credit to countries that have implemented institutional reforms when the resulting progress has a lag.
We assign equal weighting to de jure and de facto indicators in the composite index calculation when the indicators have comparable importance to defining our cluster evaluation. Otherwise, each individual indicator receives the same weight regardless of de jure or de facto designation.
Chosen indicators within each area are intended to proxy for the broader picture but do not encompass all aspects of an economy. Therefore, narrower factors that affect China’s performance evaluation are featured as “supplemental indicators.” Supplemental indicator data outcomes receive their own chart visualizations, but the data generally cannot be applied to all countries in our sample. For example, some poignant indicators lack data coverage for many countries in our sample besides China. This complexifies our process for comparing China with the top open market economies on the same standards. For this reason, supplemental indicator data do not contribute to a country’s final composite score.
Numerous data compilation methods are used in building our supplemental indicators. Some indicators are reflections of standard metrics, and others are modified in-house to illuminate certain aspects of metrics that already exist. Finally, China Pathfinder applies a handful of existing proprietary indicators developed by Rhodium Group.
China Pathfinder supplements its yearly quantitative assessment with quarterly policy tracking. After compiling all relevant major policy developments in China during a specific quarter for each of our six clusters, we systematically evaluate each development. The evaluation process contains four possible signals for China’s policy momentum: movement toward, movement away, mixed movement, or no change in relation to open-economy standards. After aggregating all positive, negative, mixed, and stagnant developments in China’s policy atmosphere, China Pathfinder presents a heatmap within its quarterly report that shows the outcome.
In examining policy changes, our team specifically looks for policies that connect back to the benchmark signals that we outlined in our inaugural report’s Section 2 on “Looking Forward: Market-Oriented Policy and Data Signals.”45 This provides some continuity between our annual report’s quantitative-driven outcomes and the policy considerations elaborated upon in quarterly reports.
44 Atlantic Council GeoEconomics Center and Rhodium Group, Running out of road: China Pathfinder 2023 annual scorecard (Washington, DC: Atlantic Council GeoEconomics Center and Rhodium Group, October 2023), https://chinapathfinder.org/wp-content/uploads/sites/4/2023/10/ ChinaPathfinder_Annual_2023.pdf.
45 Atlantic Council GeoEconomics Center and Rhodium Group, China Pathfinder: Annual Scorecard (Washington, DC: Atlantic Council GeoEconomics Center and Rhodium Group, October 2021), https://chinapathfinder.org/china-pathfinder-annual-scorecard/.
While China Pathfinder is intended to be a quantitative resource for policymakers, economists, and business leaders to benchmark the Chinese economy and stay informed about China’s policy developments, it is not a comprehensive assessment of every aspect of China’s economy. Our research design is deliberately narrow, focusing on just enough to permit a clear picture of China’s compatibility with market economies without hindering reader accessibility.
The choice to track China’s system versus open market economies, rather than a broader set of emerging and developing economies, was deliberate. We fully acknowledge that China does not intend to become a democratic open market economy. However, we postulate that OECD policymakers can only maintain open and engaging economic policies with China if there is movement in a similar direction.
Our project concept raises the question of whether China should be expected to converge with advanced OECD nations, instead of the opposite. Aiming for fairness in the China Pathfinder evaluation, we compare China not on areas in which our sample of market economies is already structurally perfect, but on agreed-upon norms integral to an open economic system.
We choose to focus on economic policies and outcomes where increased openness is perceived as a positive direction. However, China and the OECD countries we analyze may show signs of convergence in areas where the latter nations have adopted targeted industrial policies. While national security concerns may indirectly impact the outcomes of China Pathfinder, our data scope primarily focuses on economic policy and outcomes; the primary goal is to evaluate economic effects instead of political or strategic motivations.
Our research design and indicator selection are not perfect, but they represent what we believe is the best available solution within existing constraints. Main caveats include the following:
● There are some areas of great importance to market economies that we do not cover. These include the presence of a robust social safety net, comprehensive labor protection laws, environmental protections, and policies to mitigate inequality. We acknowledge that these areas are critical aspects of any market economy but believe that the indicators we have chosen serve to address the project’s core focus of how OECD nations should choose to view China’s system in the context of future engagement.
● Our selection of annual indicators faces structural limitations. In some areas, we have good coverage; in other areas, comprehensive, comparable, and timely data are not available, and, therefore, we face major gaps in what we would have considered ideal coverage (e.g., subsidies). For the 2023 annual report, the China Pathfinder team removed an indicator of R&D expenditure. For the 2024 annual report, changes; include:
• In the financial system cluster, the replacement of IMF financial depth index and financial market access indices with China Pathfinder-generated indices using alternative data sources, as discussed in Chapter 2.
● Our data approach cannot fully account for the unlimited reach of the state and the role of the Chinese Communist Party (CCP) in influencing prices, competition, and outcomes in the Chinese economy. While we assess measurable elements such as the proportion of top ten financial institutions by market capitalization that are stateowned, these measures certainly understate the role of politics in the economy—as 2022’s requirement that Chinese subsidiaries of foreignowned fund managers and foreign Chinese joint ventures create CCP cells (one of many examples) demonstrates.
The China Pathfinder Project provides visualizations for indicators in six areas that will be updated with new data annually. It preserves 2010 as a benchmark year for China’s performance, a data point that will live through future iterations of composite scoring and individual indicator analysis.
To add nuance and include higher-frequency data on the Chinese economy, quarterly reports incorporate relevant supplemental indicator data and timely chartwork on the most critical developments of the quarter. In the face of unexpected large-scale developments or data availability issues, the supplemental indicator list will be modified to ensure maximum utility for the user.
Data visualizations are created by Seven Mile Media, Jerico Aragon, Jeremy Graston, and Youyou Zhou and range from interactive data features on the website and graphical representations throughout annual and quarterly reports. More details on China Pathfinder’s interactive data visualizations, publication archive, and structure behind this project are available on the China Pathfinder website (www.chinapathfinder.org).

CHAIRMAN
EXECUTIVE CHAIRMAN EMERITUS
PRESIDENT AND CEO
EXECUTIVE VICE CHAIRS
VICE CHAIRS
TREASURER
DIRECTORS
*Executive Committee Members
List as of January 1, 2024
Atlantic Council
GEOECONOMICS CENTER