CHINA PATHFINDER ANNUAL SCORECARD


A PATHFINDER: 2022 ANNUAL SCORECARD
OCTOBER 2022


Chapter 1: China in 2021: External Pressures and Internal Shocks
1.1 MAIN INTERNAL AND EXTERNAL DEVELOPMENTS THAT SHAPED THE DATA
1.2 UPDATES TO RESEARCH DESIGN AND METHODOLOGY
Chapter 2: Historical Baseline and 2021 Stocktaking
2.1 FINANCIAL SYSTEM DEVELOPMENT
Definition and Relevance
2021 Stocktaking: How Does China Stack Up?
Efficient Pricing of Credit Direct Financing State Ownership in Top Ten Financial Institutions Financial Institutions Depth Financial Markets Access Composite Score
A Year in Review: China’s 2021 Financial System Policies and Developments
2.2 MARKET COMPETITION
Definition and Relevance
2021 Stocktaking: How Does China Stack Up? Market Concentration
SOE Presence in the Top Ten Firms Foreign Direct Investment Restrictiveness Rule of Law Composite Score
A Year in Review: China’s 2021 Market Competition Policies and Developments
2.3 MODERN INNOVATION SYSTEM
Definition and Relevance
2021 Stocktaking: How Does China Stack Up?
National Spending on Research and Development Venture Capital Attractiveness
Private versus State-Funded Innovation
Triadic Patent Families Filed
International Attractiveness of a Nation’s Intellectual Property Strength of IP Protection Regime Composite Score
A Year in Review: China’s 2021 Innovation Policies and Developments
2.4 TRADE OPENNESS
Definition and Relevance
2021 Stocktaking: How Does China Stack Up? Goods and Services Trade Intensity Trade Barriers: Tariff Rates
Restrictions on Services Trade Restrictions on Digital Services Trade Composite Score
A Year in Review: China’s 2021 Trade Policies and Developments
2.5 DIRECT INVESTMENT OPENNESS
Definition and Relevance
2021 Stocktaking: How Does China Stack Up? FDI Intensity
Direct Investment Restrictiveness Composite Score
A Year in Review: China’s 2021 Direct Investment Policies and Developments
Definition and Relevance
2021 Stocktaking: How Does China Stack Up?
Internationalization of Debt and Equity Markets
Portfolio Investment Restrictiveness Composite Score
A Year in Review: China’s 2021 Portfolio Investment Policies and Developments
China Pathfinder is a joint initiative from the Atlantic Council GeoEconomics Center and Rhodium Group that measures China’s economic system relative to advanced market economy systems. Few people, even within the circle of China experts, seem to agree about the country’s economic system, where it is headed, or what that means for the world. The goal of this initiative is to shed light on whether the Chinese economic system is converging with, or diverging from, open market economies. Over the course of two short decades, China has risen from the world’s sixth-largest econ omy, with a gross domestic product (GDP) of $1.2 trillion in 2000, to the second largest, boasting a GDP of $17.7 trillion in 2021. China now intersects with the interests of all nations, businesses, and individuals. With China’s past and future systemic choices impact ing the world in both positive and negative ways, it is essential to understand its global footprint. The hope is that China Pathfinder’s approach and findings can fill in some of the missing puzzle pieces in this ongoing debate—and, in turn, inform policymakers and busi ness leaders seeking to understand China.
The Atlantic Council is a nonpartisan organization that galvanizes US leadership and engagement in the world, in partnership with allies and partners, to shape solutions to global challenges. The Atlantic Council provides an essential forum for navigating the eco nomic and political changes defining the twenty-first century by informing its network of global leaders. Through the papers it pub lishes and the ideas it generates, the Atlantic Council shapes policy choices and strategies to create a more free, secure, and prosper ous world.
Rhodium Group is a leading independent research provider. Rhodium has one of the largest China research teams in the pri vate sector, with a consistent track record of producing insightful and path-breaking analysis. Rhodium China provides research, data, and analytics to the private and public sectors that help cli ents understand and anticipate changes in China’s macroeconomy, politics, financial and investment environment, and international interactions.
This report was produced by Rhodium Group’s China team in col laboration with the Atlantic Council GeoEconomics Center. The prin cipal contributors on Rhodium’s team were Daniel H. Rosen, Nargiza Salidjanova, Rachel Lietzow, Ryan Featherston, and Boyuan Chen. The principal contributors from the Atlantic Council GeoEconomics Center were Josh Lipsky and Niels Graham.
The authors wish to acknowledge a superb set of colleagues and fellow analysts who helped us strengthen the study in group review sessions and individual consultations. These individuals took the time, in their private capacity, to critique the indicators and analy sis in draft form; offer suggestions, warnings, and advice; and help us to ensure that this initiative makes a meaningful contribution to public debate. Our gratitude goes to Bert Hofman, Scott Johnson, Jacob Kirkegaard, Wendy Leutert, Jeremy Mark, Barry Naughton, Tom Orlik, Dexter Roberts, Scott Rozelle, Stephanie Segal, Hung Tran, Yang Yao, and Pepe Zhang.
The authors also wish to acknowledge the members of the China Pathfinder Advisory Council: Steven Denning, Gary Rieschel, and Jack Wadsworth, whose partnership has made this project possible.
This report is written and published in accordance with the Atlantic Council’s intellectual independence policy. The authors are solely responsible for its analysis and recommendations. The Atlantic Council, Rhodium Group, and its donors do not determine, nor do they necessarily endorse or advocate for, any of this report’s con clusions. This report is published in conjunction with an interactive data visualization toolkit, at http://chinapathfinder.org/. Future quar terly and annual updates to the China Pathfinder Project will be pub lished on the website listed.
When the Atlantic Council and Rhodium Group first embarked on the China Pathfinder Project, we believed that policymakers, in both the East and West, would benefit from creating a shared language on China’s economy. What we did not foresee was how urgently that language would be needed.
In the one year since we published the inaugural China Pathfinder scorecard, the ground beneath Xi Jinping’s feet has shifted. The Chinese property sector, so fundamental to the growth of the world’s second-largest economy, is teetering. The Party’s zeroCOVID policy is straining the economic, political, and social fab ric of the country. Foreign companies, as well as governments, are increasingly skeptical about their investments in the Chinese mar ket. A year ago, the question we asked in this report was whether sustained 6 percent growth was no longer realistic. Now, the ques tion we are asking is whether China’s economy might be heading for a hard landing.
What a difference a year can make.
That is true for China, as well as the rest of the world. We designed China Pathfinder as a multi-year project to track the progression—or regression—of the Chinese economy over time and compare it to the world’s largest open market economies. While it is true that the study of the other largest economies was never the primary objec tive of this work, our research can pinpoint when they start moving away from open-market norms.
Inside these pages you will find new data and analysis which con founds conventional wisdom—both about China’s economy and the other largest economies in the world. This data can help make
sense of a tumultuous year. From the War in Ukraine to the ongo ing pandemic there are forces weighing on China’s economy which the leadership can only partly influence. It can be difficult to parse out which dynamics are cyclical and which are a product of crisis response. But we believe this report helps deliver an answer: The damage done to the Chinese economy over the past year cannot be undone quickly. The framework of China Pathfinder enables us to see how systemic the problems are.
Policymakers should recognize a new reality: This is not the Chinese economy of the past decade. While China remains a heavyweight, it is undeniably weaker and more fragile than before the pandemic. This shift presents challenges and enormous risks for Beijing, Washington, London, Brussels, Tokyo and beyond. It also presents an opportunity to move past the failed policy decisions of previous years and approach economies as they stand—not as we imagine them.
That is why the mission of creating a shared language on China’s economy—and developing a clear way to understand China’s eco nomic system—is more important than ever. We thank the dedicated teams from the Atlantic Council and Rhodium Group that have led this research and we thank each of you for your engagement in this critical work.
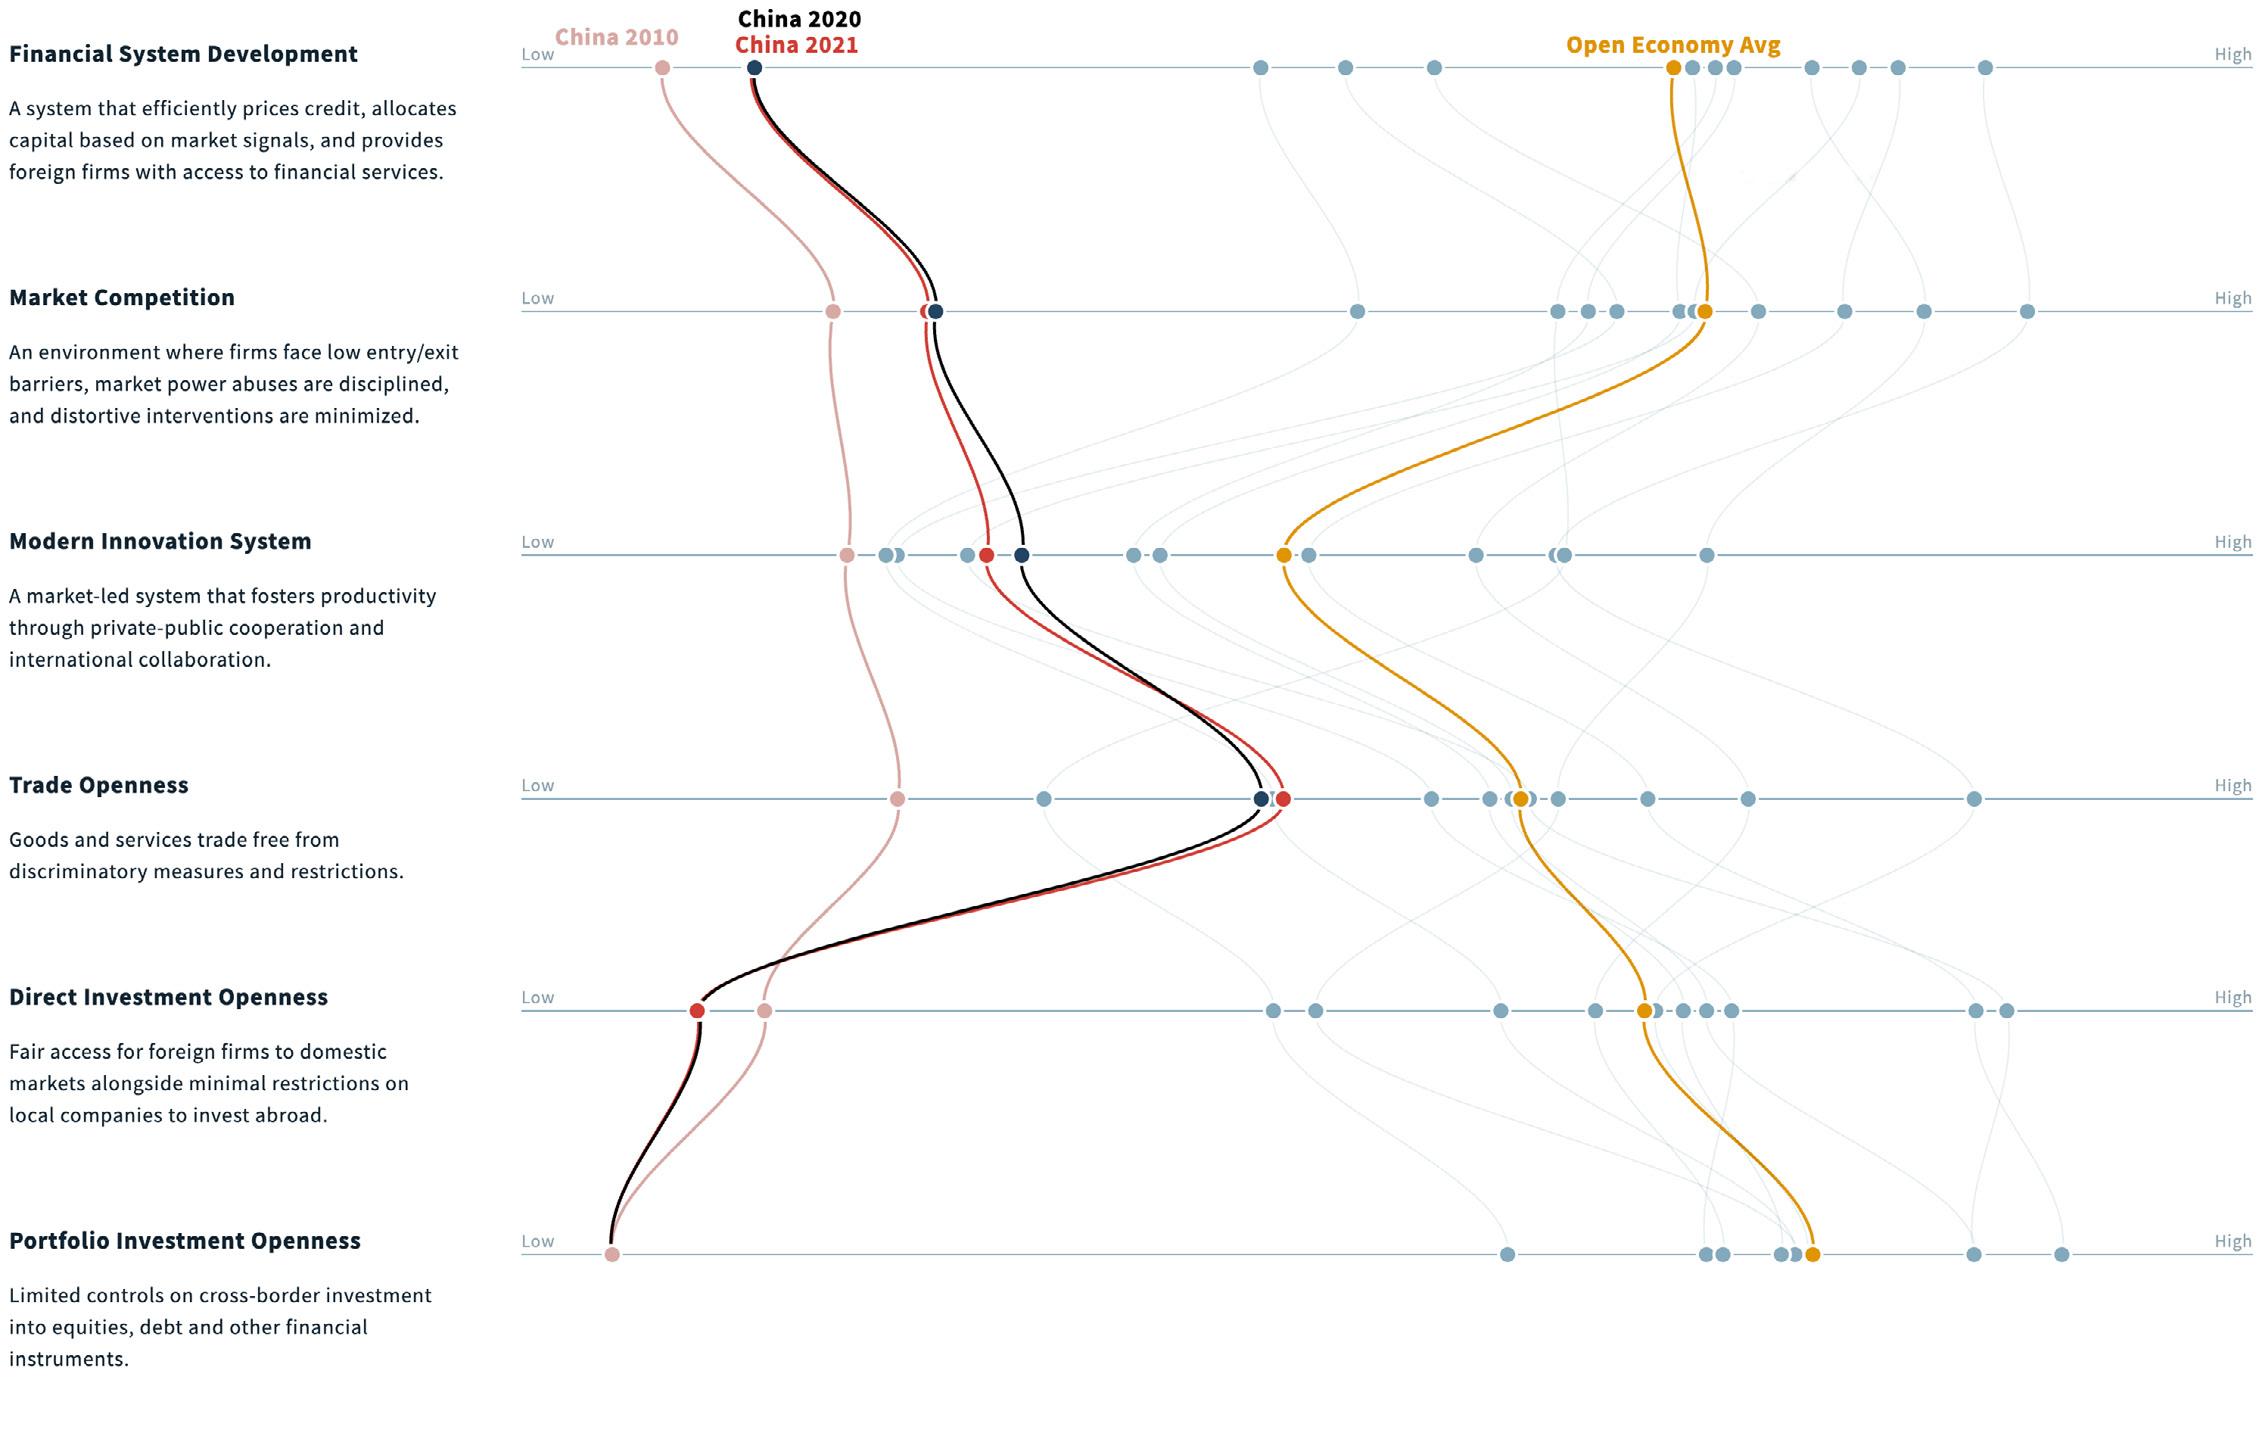
Josh Lipsky Senior Director, Atlantic Council GeoEconomics CenterChina Pathfinder compares China’s economic system to those of market economies. This juxtaposition is important at a time when questions are mounting about Beijing’s economic trajectory, and both policymakers and businesses around the world are assessing how to respond and position themselves. This report looks at six components of the market model: financial system development, competition, innovation system, trade openness, direct investment openness, and portfolio investment openness. Our annual score card situates China in relation to ten leading market economies to establish a data-centered benchmark for discussion and analysis. We supplement the annual report with quarterly updates that zero in on the most important policy developments in China. This approach is designed to encourage a more constructive discussion of policy shifts taking place in Beijing, from the recent crackdown on technol ogy companies, to the “dual circulation” strategy, and debate over “common prosperity.”
• China’s progress toward market economy norms slowed in most areas in 2021, though not enough to undermine the market opening efforts that took place since 2010. On our innova tion system and trade metrics, China saw real progress in 2021 compared to its 2010 benchmarks, scoring higher than several OECD economies. In trade, China even improved on its 2020 performance. China’s financial system development, market competitiveness, and openness to investment, however, have stagnated; in these areas, the gap between China and market economies remains the largest. In upcoming reports, we hope to shed light on whether China’s economic performance is just temporarily reflecting the government’s aggressive steps to con tain the COVID-19 pandemic, or if Beijing is diverging from mar ket thinking in a more structural way.
• Most of the OECD economies we track show a slight divergence from open market norms since 2010. For instance, Australia, Italy, and Spain saw some backsliding in their finan cial system development and market competitiveness, while German and South Korean markets saw a lapse in openness to foreign direct investment. Portfolio investment openness was the only bright spot, where all economies (except the UK) deep ened portfolio markets or reduced cross-border restrictions compared to 2010. Intervention by governments in response to the pandemic played a role in the recent drift away from market openness. While most advanced economies are now moving on from the pandemic, ongoing geopolitical tensions in 2022, such as the war in Ukraine, could complicate their post-pandemic recovery.
• In innovation, China had a higher composite score than Canada, Italy, and Spain. It also surpassed the open econ omy average in venture capital investment intensity. However, this progress comes with caveats. The role of the state in
determining where innovation takes place—via government guidance funds and subsidies—and Beijing’s crackdown on technology companies risk undermining the innovation gains that China has made in recent years. Looking ahead, there is a risk that weakening foreign investment in China could chip away at the country’s innovative potential.
• China’s composite score in trade comes closest to those of market economies, exceeding South Korea and Italy’s scores. But, here too, there are caveats. First, China’s remarkable com petitiveness in goods trade is counteracted by its high barriers in digital services trade, where its score has declined in recent years. Second, non-tariff barriers cloud China’s trade landscape, benefiting domestic champions and hurting foreign players. Third, the US-China trade war continues to undermine confi dence in deepening two-way trade for the long run. Thus, we saw China’s MFN tariff rate increase since 2020 (though it is still lower than it was in 2010), and while the US and the EU countries lowered their MFN rates, their tariffs on Chinese exports have not decreased. Finally, China’s economic growth continues to rely on exports; this is increasingly problematic given the domes tic COVID-related disruptions and the relatively rapid recovery in China’s trading partners, which will drive a decline in demand for Chinese goods.
• China’s investment openness has decreased since 2020, with a small slump in cross-border equity and bond volumes, as well as a drop-off in outbound FDI volumes. Though China’s restrictions on direct investment and portfolio investment have not changed, other factors such as the crackdown on technol ogy firms and zero-COVID lockdowns have discouraged invest ment. As China’s scores in both areas of investment openness have been the furthest from market economy norms since 2010, the latest signs don’t do much to alter the dim picture.
• President Xi Jinping will be confronted with important policy choices at the conclusion of the 20th Party Congress. Xi is widely expected to earn a third term as leader at the congress, freeing his hand to take bolder action in the face of formidable economic challenges. This could provide an opening for 2013era market reform promises to reappear on the agenda. But while unfinished policy reform work is plain to see, few analysts in or outside of China can point to evidence of impending market reform acceleration.
• China’s reform intentions are more important than ever Concern about China’s economic course is deepening due to zero-COVID policies, property sector distress and rising tensions over Taiwan. We are at a crucial moment when foreign firms are reassessing their presence in China and making decisions that
will affect economic relations for years to come. Questions are being raised about whether China is “investible.”
• A course correction if it occurs will take time. Even if China recommits to market reform, fixing the misallocation of resources and dealing with vested interests will take China’s leaders years, and will mean weaker growth in the short to medium term as structural adjustment takes place. For foreign policymakers, an understanding of how market economies are changing visà-vis open market norms is needed for the effort to hold China accountable. This would require foreign governments to be strategic in their responses to Chinese practices, but avoid sac rificing liberal market norms, or emulating China’s non-market playbook.
• Government and business stance towards China is best based on a balanced assessment. Many foreign policymak ers—and some firms—are competing to show who’s toughest on China. That’s problematic in two ways. First, it risks intensify ing frictions with China, without a basis of data-driven analysis
and benchmarking. Second, it wastes limited resources on mat ters that may have less severe economic consequences, while issues of concern go potentially under-resourced or unad dressed. Where Chinese divergence from open-economy norms harms market economy interests, policymakers should respond. Where it doesn’t, they should hold their fire.
• As the traditional divide between trade, technology, and security challenges melts away, policy and business decision making will become more complicated. With policymakers scruti nizing China’s tech policies or its human rights record, foreign companies doing business in China or with China will find it increasingly difficult to reconcile competing demands from their home governments and China. Rising restrictions in data flows, for example, and tighter investment screening reflected in the 2021 China Pathfinder scoring, are just a few examples of this trend. This will have important implications for supply chains across a range of goods, and for companies’ long-term planning such as making investments or retaining talent.
When our inaugural China Pathfinder Annual Scorecard was com pleted in October 2021, China was growing at an annualized rate of 8 percent and its leaders expected the economy to continue to expand at a rate of nearly 6 percent going forward. A sharp slow down was dismissed as far-fetched, imaginable only in the worstcase scenarios of the People’s Bank of China. And yet, one year later, the World Bank is forecasting that China’s economy will expand by just 2.8 percent in 2022. Major investment banks have lowered their forecasts to 3 percent. In the second quarter of 2022, China reported that gross domestic product (GDP) rose by just 0.4 percent compared to the same period last year. The 2022 out come will certainly land outside the range leaders preferred, and that alone has drawn attention from observers (inside and outside of China) accustomed to seeing official goals inevitably achieved.
China’s slowdown is unfolding ahead of an important, twice-a-de cade Party congress (October). If available tools could have been used to improve this year’s economic performance, they likely would have been. In some areas, including the regulation of tech nology firms, leaders have tried to comfort anxious investors and entrepreneurs, but the signals have not been full throated support for market mechanisms. Could a deepening economic downturn force China to pivot back to reform and opening? Many analysts are skeptical that it would, but the possibility cannot be ruled out.
Officially, Beijing attributes the slowdown in growth to its restric tive zero-COVID policy that it deems necessary to safeguard pub lic health. But the bigger structural shock—and the reason why the usual stimulus tools are not working—is a reckoning in the real estate sector that has been building for years. China’s leaders tol erated real estate bubbles over the past decade in order to turbo charge growth. Now defaults are causing property construction and sales to plunge. Since China has come to rely on the sector to drive roughly a quarter of its growth, the property reckoning is sending tremors across the financial system and the broader econ omy. Consumers, investors and parts of the Chinese leadership have been taken by surprise—despite persistent warnings about the country’s debt-fueled property expansion.
In 2014, the precursor study to China Pathfinder, Avoiding the Blind Alley, 1 argued that if Beijing did not persist with market-oriented reforms, China would hit a dead end (the title of the report draws on language that Chinese President Xi Jinping himself was using at the time). We defined that outcome as potential growth below 2 percent. Another Rhodium Group study, Credit and Credibility, 2 predicted in 2018 that the stability of China’s financial system would begin to show cracks by mid-2021 if remedial steps were not taken.
We could not foresee the added shock of COVID-19 at the time, but the sharp slowdown in growth that concerned us then is now unfolding before everyone’s eyes.
Market reforms are not a miracle cure for all of China’s economic ills. And on their own, they cannot deliver high GDP growth or the “high quality growth” that Beijing hopes to achieve. During the implemen tation phase, reforms typically lead to a period of lower-than-poten tial growth, as economic actors adjust to new realities. Considering China’s reform backlog and the risk of crisis now inherent in any effort to implement reform (given the extent of debt risks that have been allowed to build up), we expect anemic growth to be with us for a while, regardless of how the government responds in the months ahead. It is important to bear this in mind as the 20th Party Congress gets underway this month. Some analysts conjecture that once the congress is over, and Xi has secured a third five-year term (breaking the tenure limits which generations of Chinese leaders observed following the excesses of the Mao era), he will be free to take the steps necessary to put Chinese growth back on a stronger and more sustainable footing. It is important to understand, how ever, that party congresses have rarely been triggers for big shifts in economic policy. If a change of course were to emerge from the meeting, new policies would need to be developed and imple mented—and would likely take years to filter through to the real economy. Regardless of what happens at the 20th Party Congress, China faces a prolonged period of weaker growth.
While we wait to see whether the Party Congress leads to change, the suppression of any real public debate over the proper economic course has become a serious problem for China. Experts who criti cize the government’s current path or express opinions that diverge from the official line have seen their social media accounts frozen. In some cases, they have lost their jobs. Access to some economic data has been restricted and doubts about the quality of official sta tistics are on the rise. By squelching talk of economic risks, Chinese authorities may be hoping to prevent a loss of business and con sumer confidence, but the lack of transparency has only deepened the uncertainty about China’s trajectory. Dissent, after all, is difficult to conceal, even in the Chinese system. It can be seen in the pro tests against investment losses, in the boycotts against mortgage payments for homes that may never be delivered, and in social media posts from businesspeople worried about the darkening eco nomic outlook.
The question is whether China can avoid a hard landing, and if one occurs, will it push the Party leadership to recommit to reform and opening, or push them in the opposite direction—toward even
1 Daniel H. Rosen, “Avoiding the Blind Alley: China’s Economic Overhaul and Its Global Implications,” Asia Society Policy Institute and Rhodium Group, October 2014. https:// asiasociety.org/files/pdf/AvoidingtheBlindAlley_FullReport.pdf
2 Logan Wright and Daniel H. Rosen, “Credit and Credibility: Risks to China’s Economic Resilience,” Center for Strategic & International Studies, October 2018. https://www.csis. org/analysis/credit-and-credibility-risks-chinas-economic-resilience
greater political control. There is nothing preordained about China’s choice, or inevitable about the economic outlook that will result from it. China has chosen a more market-friendly path before—even if it has repeatedly backtracked when the going got tough. The challenge is to discern China’s direction in the face of flawed eco nomic data, an increasingly strained diplomatic conversation (what EU top diplomat Josep Borrell has called a “dialogue of the deaf”), and disinformation campaigns that undermine trust. The goal of China Pathfinder is to support policy and business decision-mak ing, with an objective framework that tries to make sense of China’s economic system and where it is headed.
The outline of this report is as follows: Chapter 1 provides essential background on our goal of benchmarking China’s economic trajec tory, introduces our research design, and relates economic devel opments in 2021 and 2022 to the Pathfinder framework. Chapter 2 takes stock of China’s proximity to open market economies in 2021 for each of our six clusters, as well as a historical comparison to 2010. Chapter 3 summarizes the key findings and discusses impli cations for policymakers and business leaders, with a focus on advanced economies.
This chapter looks at major developments that shaped our analysis of China’s trajectory in 2021. Though extraordinary pandemic con ditions prompted many governments to intervene just to keep the economic engines running, it was hard to deny a greater author itarian turn by China. From the draconian zero-COVID policy to the extraordinary economic retaliation against Lithuania, Beijing’s choices in 2021 showed a government willing to pursue politi cal objectives at the expense of economic outcomes. At the Sixth Plenum in November 2021, the Chinese Communist Party (CCP) said the country had entered a “new era” under Xi Jinping, emphasizing the CCP’s leading role in steering long-term strategy. For domestic and foreign observers, this sent a clear signal that market-oriented policy reform is taking a back seat to ideological imperatives.
The China Pathfinder framework analyzes China in comparison to advanced economies in our sample across six dimensions that reflect an economy’s market orientation, with three clusters focus ing on the domestic economic system (financial system develop ment, market competition, and a modern innovation system) and three clusters covering the external openness dimension (trade openness, direct investment openness, and portfolio investment openness). For China in 2021, there were three major develop ments—the real estate downturn, tech crackdown, and impact of zero-COVID—that cut across all six of these dimensions, underscor ing the seriousness of the challenges that its economy faces.
Though China’s official GDP growth rate for 2021 came in at 8.1 per cent year-on-year (showing a recovery from a low base in 2020), the high number belies significant weakness. Already straining under COVID-19, the economy saw its real estate sector slide into debt dis tress. At the same time, the government broadened its crackdown on technology giants, delivering another hit to investor sentiment.
These disruptions were not the result of policies launched in 2021; rather, they reflect the consequences of decisions by the Chinese government stretching back years. The government helped create a dangerous bubble in the real estate sector by repeatedly choos ing investment-driven growth over a more sustainable course, built on consumer spending and fiscal reform, that would have involved painful but ultimately beneficial adjustment. Meanwhile, the eco nomic and social costs of zero-COVID controls continued to mount. The crackdown in the tech sector, epitomized by the forced delisting of ride-hailing giant Didi from the New York Stock Exchange, sent a warning to private companies in data-heavy industries that the gov ernment, not the market, will shape the outcomes. Add geopolitical
tensions to the mix, and it’s not hard to see why many observers are worried about China’s trajectory.
At the heart of China’s economic troubles is its real estate sector, which has contributed up to a quarter of the country’s GDP in recent years. A pillar of China’s growth for decades, the sector entered into a slump in the summer of 2021 after the government imposed restrictions on the amount of leverage developers could take on in late 2020. That decision continues to reverberate across the econ omy. Because local governments rely on land sales as a revenue source, the current situation is impacting their spending and invest ment, and could exacerbate their debt problems. The downturn has also delivered a major blow to the confidence of Chinese house holds, whose wealth and economic wellbeing are closely tied to the investments they have made in property. A distressed property sector, in other words, has much broader implications: it is a sys temic problem that risks destabilizing the entire economy. Nothing can replace the importance of real estate for growth in the short term. In the long term, getting the economy back on track requires a renewed commitment to structural reforms.
Beijing’s adherence to its zero-COVID policy exemplifies the tradeoff between economic and political priorities. Household consumption in China has stagnated and foreign companies have begun to reconsider their future in the country. China’s previously vibrant private services sector, a key source of employment, has also come under profound pressure. Private firms ended opera tions at an unprecedented clip in 2021, with one estimate showing that 4.37 million firms shut down in the first 11 months of 2021, three times the level in 2020.3
China’s zero-COVID policy is also undermining the confidence of foreign firms operating in China, leading some to reassess their strategies. Their concerns extend beyond narrow worries about staff travel and quality of life. China’s COVID suppression mea sures have rattled global supply chains: Chinese ports, including the global shipping powerhouses Shenzhen and Ningbo, were shut down for weeks at a time. Industrial output is another concern. After plant shutdowns in several provinces, Toyota and Volkswagen were forced to halt Chinese production—and they were not alone.
While surveys of foreign businesses in China still indicate a strong commitment to the Chinese market, levels of foreign greenfield investment have fallen over the past two years. In 2020, they stood at just 32.5 percent of 2010 levels, according to data from the United Nations Conference on Trade and Development (UNCTAD). It is not surprising that our Pathfinder indicator for China’s inward foreign direct investment (FDI) intensity shows a decline in 2021, continuing a downward trend recorded in 2020.
3 Ji Siqi, “China’s Smallest Firms Failing at Historic Pace as 4.37 Million Close Up Shop and Registrations Plummet,” South China Morning Post, December 30, 2021. https://www.scmp.com/economy/china-economy/article/3161554/chinas-smallest-firms-failing-historic-pace-437-million-close
Meanwhile, the government’s regulatory crackdown intensified. By the end of 2021, a broad swath of data-heavy, platform economy companies, including food delivery, gaming, finance, and entertain ment, had been targeted by the government. One industry, private education and tutoring, was forced to become not-for-profit.
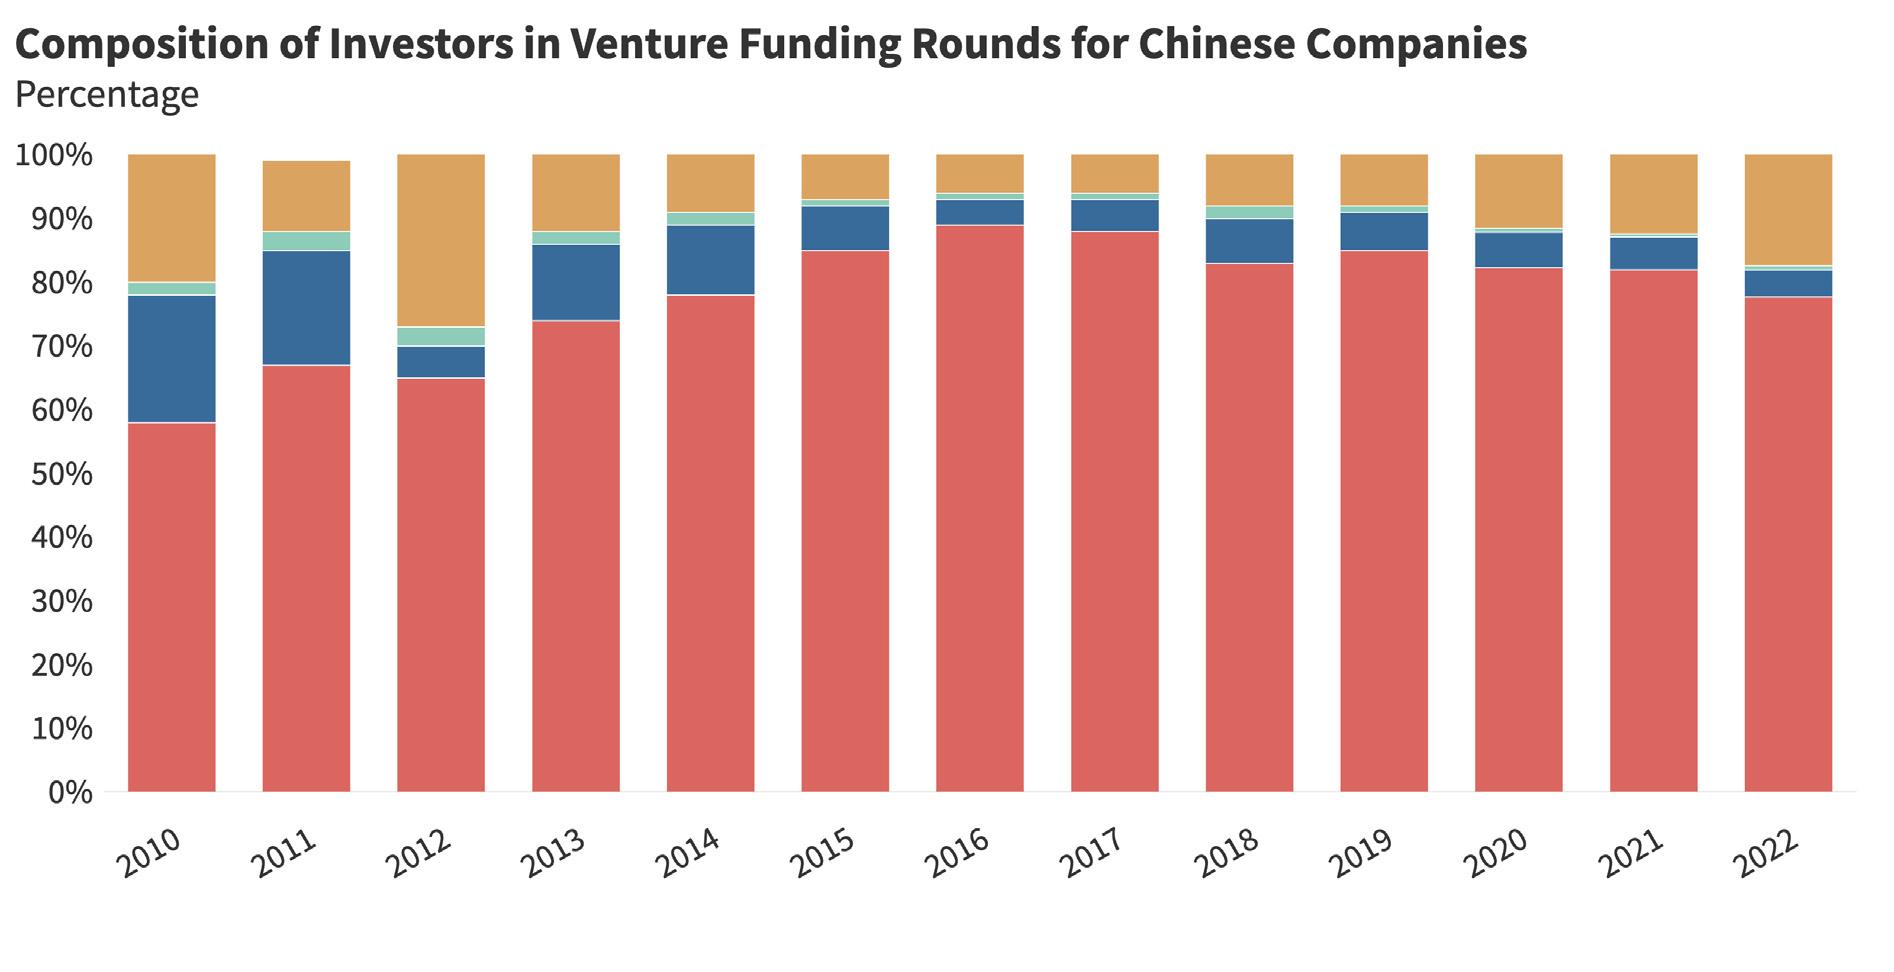
Governments around the world are taking a closer look at how tech companies collect information and distort the competitive land scape (witness Meta’s travails in the US and the EU). To be sure, China’s regulators have imposed record fines and blocked pro posed mergers, but they have also summoned tech CEOs demand ing they pledge loyalty to Beijing’s ideological guidance and promote socialist core values.4 Chinese private companies in con sumer-facing technology sectors have learned their lesson: toe the Party line or face consequences. Foreign investors are learning their lesson too. While venture capital flows to China’s tech startups continued in 2021, US venture capitalists focused on sectors like pharma and biotech that were seen as safe from China’s ongoing regulatory crackdown. Because the tech sector has been an import ant employer for China’s graduates, the effects of the crackdown are felt society-wide: Chinese youth unemployment hit record levels by the second half of 2022.
External factors offered important qualitative context to the China Pathfinder assessment in 2021. While US-China tensions over tech nology, industrial policy, Taiwan, Hong Kong, and Xinjiang (to name just a few) are long-standing, skepticism is rising within the EU and G7 nations about China’s willingness to play by the rules and its long-term interoperability with open market economies.
The deterioration of EU-China ties over the course of 2021 illus trates this trend. In March of that year, the EU-China investment deal, known as the Comprehensive Agreement on Investment (CAI), was effectively put on ice after Beijing sanctioned European parliamen tarians and researchers in retaliation for the EU’s sanctioning of Chinese officials tied to camps in Xinjiang. By the close of the year, Beijing’s decision to impose a de facto trade embargo on Lithuania in response to its embrace of closer ties with Taiwan had deepened concerns in Europe about economic coercion. As 2022 comes to a close, China’s strategic partnership with Russia and ongoing repres sion in Xinjiang are continuing to erode China’s image.
Confidence in Beijing’s ability to steer the economy back to calmer waters, while ensuring a welcoming environment for foreign firms, is faltering. Business associations are speaking out about the ris ing risks their members face in China. Some policymakers, mean while, are talking openly about the need to reduce dependencies on China and invest in other markets. As China’s leaders prepare for the 20th Party Congress in October 2022—where Xi is expected
term as
presi
adjust
role on the
For the China Pathfinder framework, 2021 presented unique chal lenges. With the pandemic still having an impact on the global econ omy, separating systemic shifts from macroeconomic conditions on the ground is an art as much as it is a science. When a government steps in to rescue a floundering industry, is that short-term firefight ing or a deeper, structural change? When capital flows out of the economy, what are the triggers and what is the impact?
The China Pathfinder analytical framework is quantitative in nature: In addition to the annual benchmark indicators, which span our six clusters (Table 1), we also use supplemental indicators, which zero-in on unique aspects of China’s economy that are not compa rable across countries. Numbers alone are not sufficient to capture the complexity of a country’s economic system or how the domes tic dimensions of economic policy interact with the external dimen sions. Therefore, we supplement our quantitative analysis with qualitative assessments. In Chapter 2, the analysis of each cluster discusses composite scores, but also unpacks the developments that shaped policies—and outcomes—in 2021.
To broaden our research framework and minimize the noise intro duced by pandemic-related disruptions, we decided to take a lon ger view in this annual report and made several important updates to our methodology. First, we added the 2010 baseline for all open economies in our sample. Though the focus of our project remains tracing China’s trajectory, tracking the evolution of Organisation for Economic Co-operation and Development (OECD) economies over the same period can teach us valuable lessons about the overall trendlines in the global economy. Market concentration, for exam ple, has been on the rise around the world, provoking intense debates about fair competition and access. Second, we conducted a complete audit of the indicators we use for our composite scores and retired several which were discontinued or were not updated in time for inclusion in our analysis. Finally, to ensure data remain compatible between the years for which we conducted the stock taking, we recalculated indicator and composite scores any time we replaced or retired an indicator. The latest methodology and infor mation can be found at https://www.chinapathfinder.org/ and in the Appendix.
Financial System Development
A system that efficiently prices credit, allocates capital, and provides private and foreign firms access to financial services.
• Difference between Corporate Interest Rate and Potential Real GDP Growth Rate
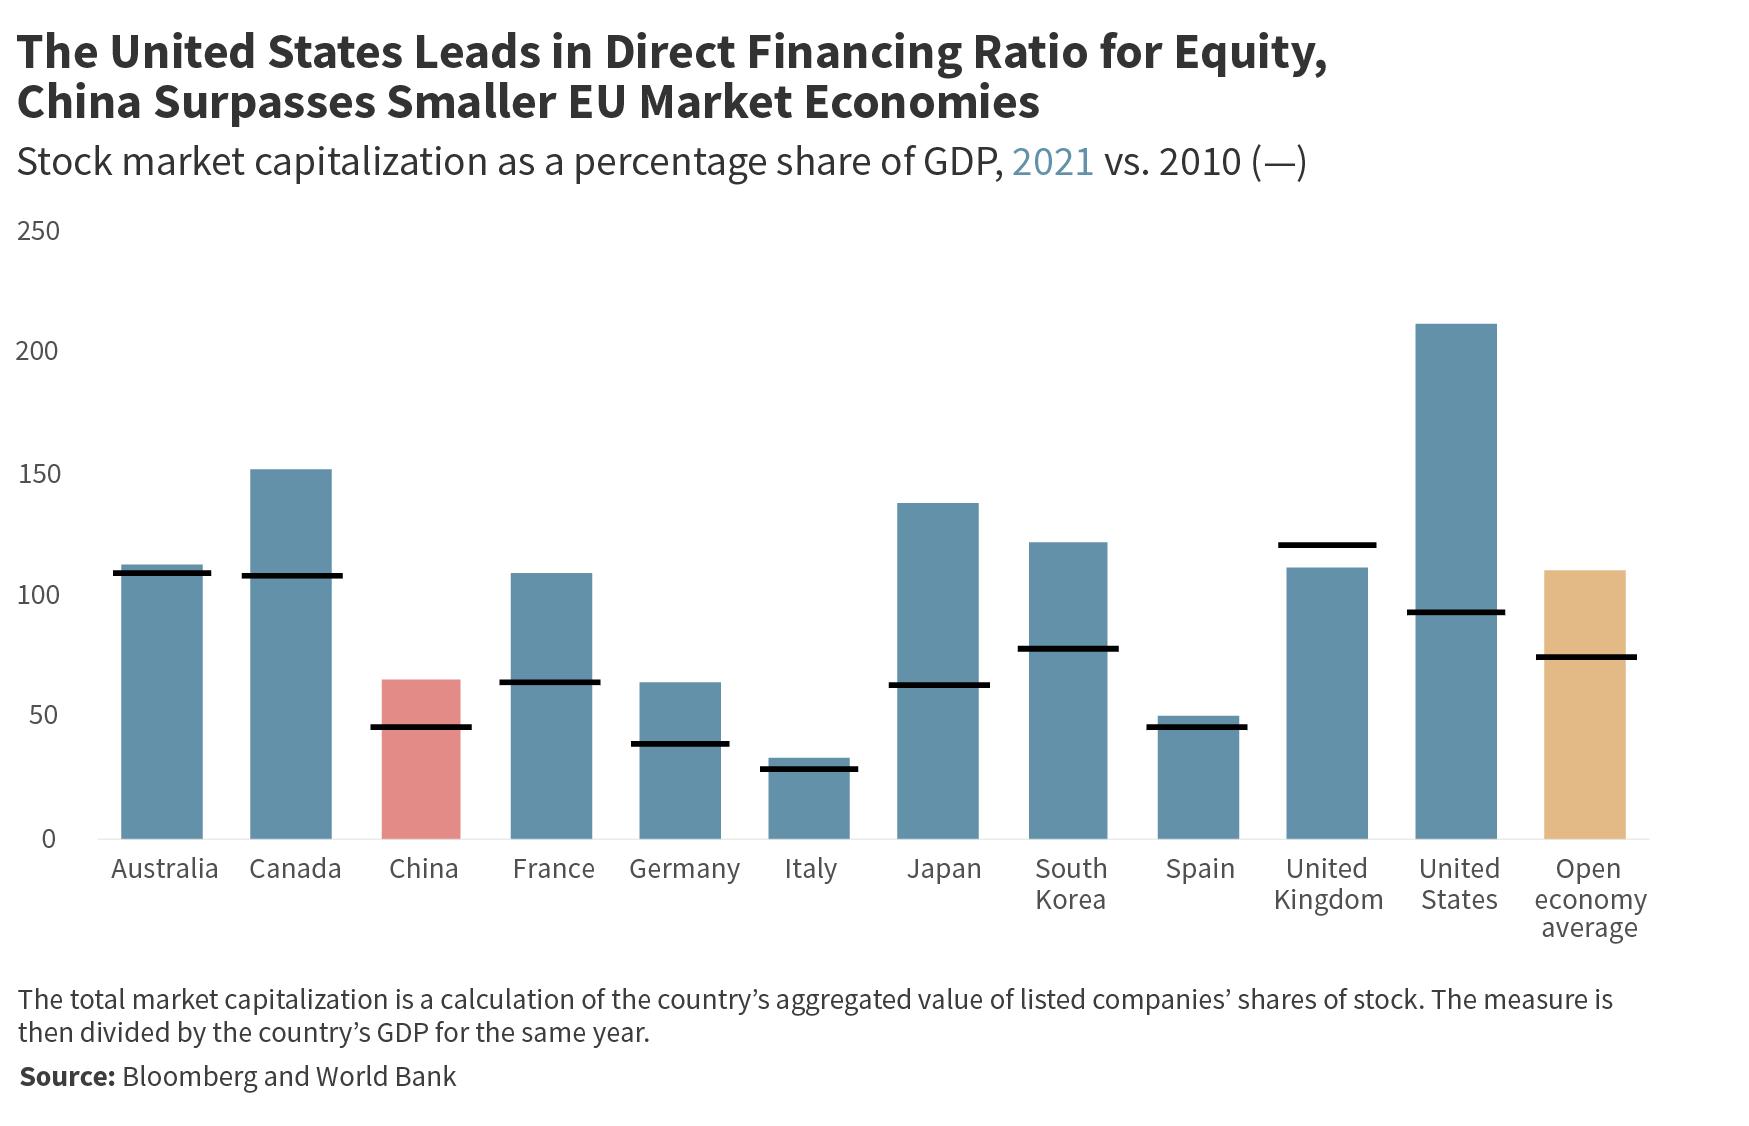
• Direct Financing Ratio: Debt
• Direct Financing Ratio: Equity
• State vs. Private Ownership of Financial Institutions
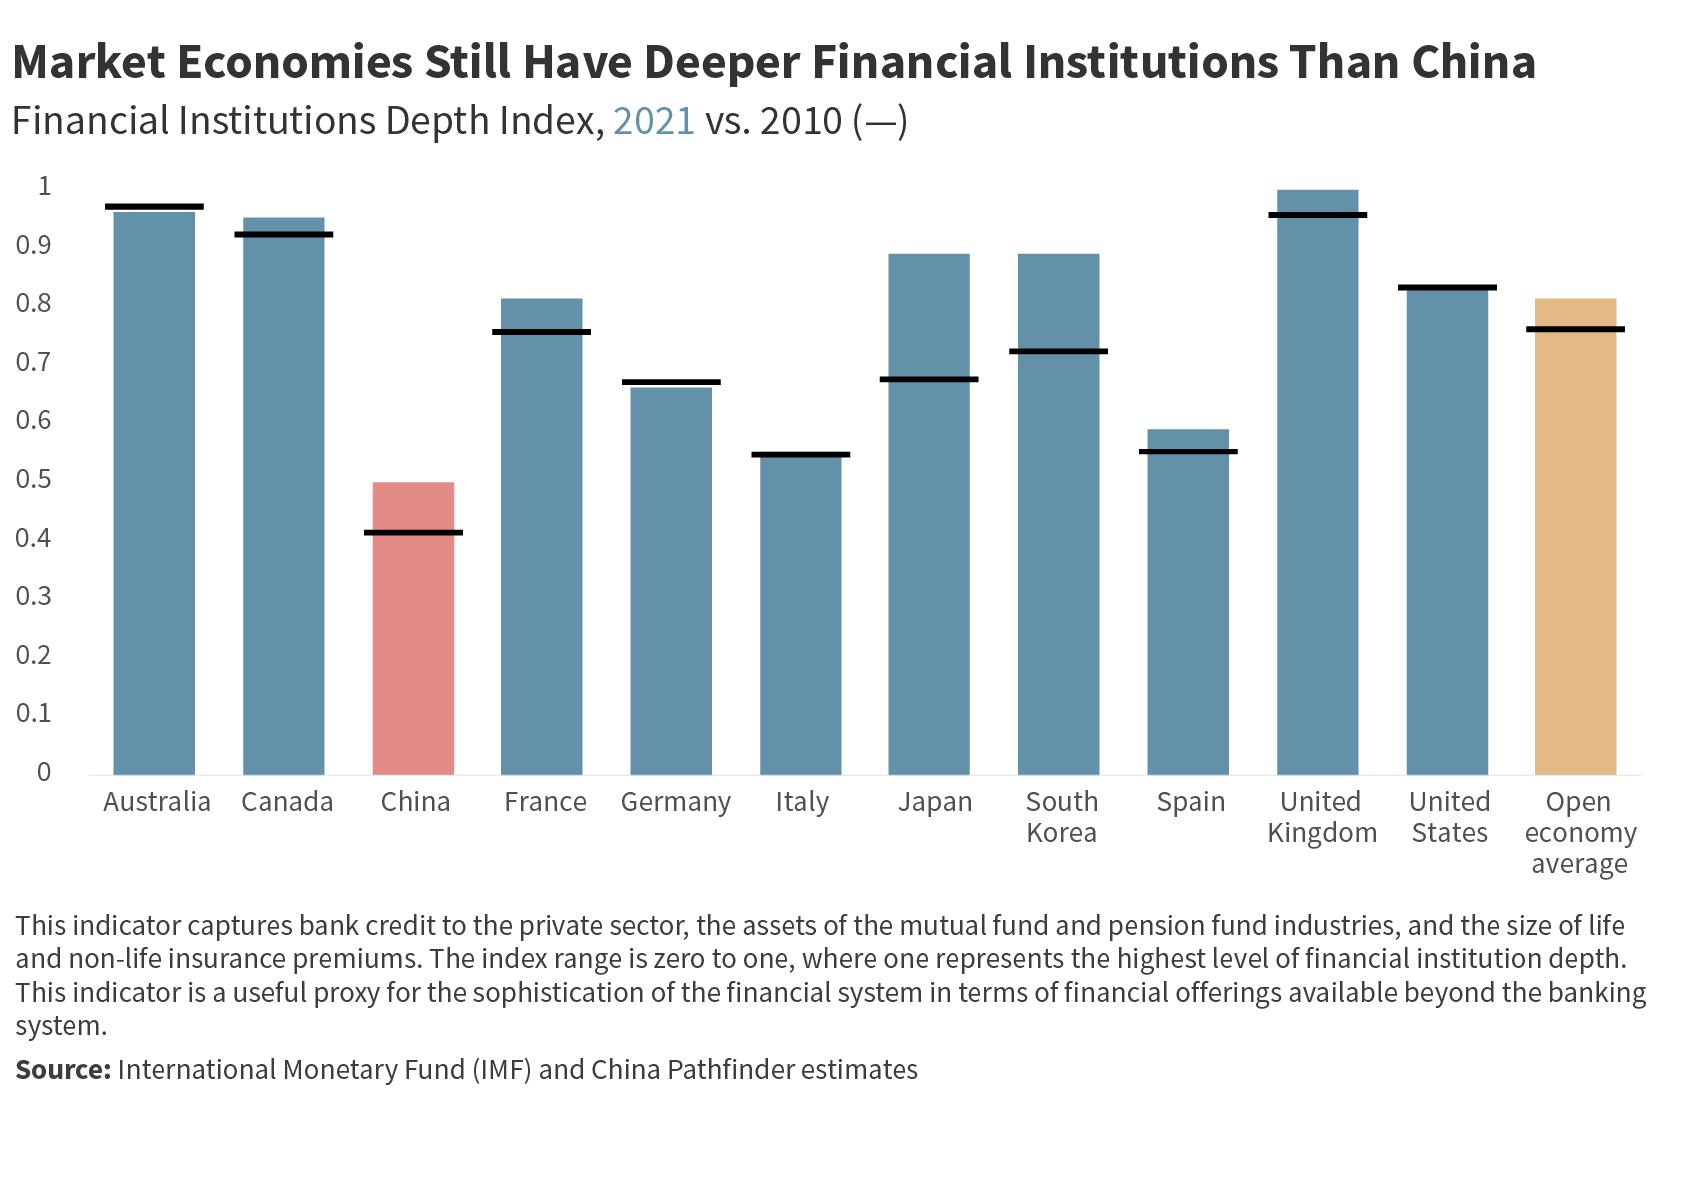
• Financial Institutions Depth Index
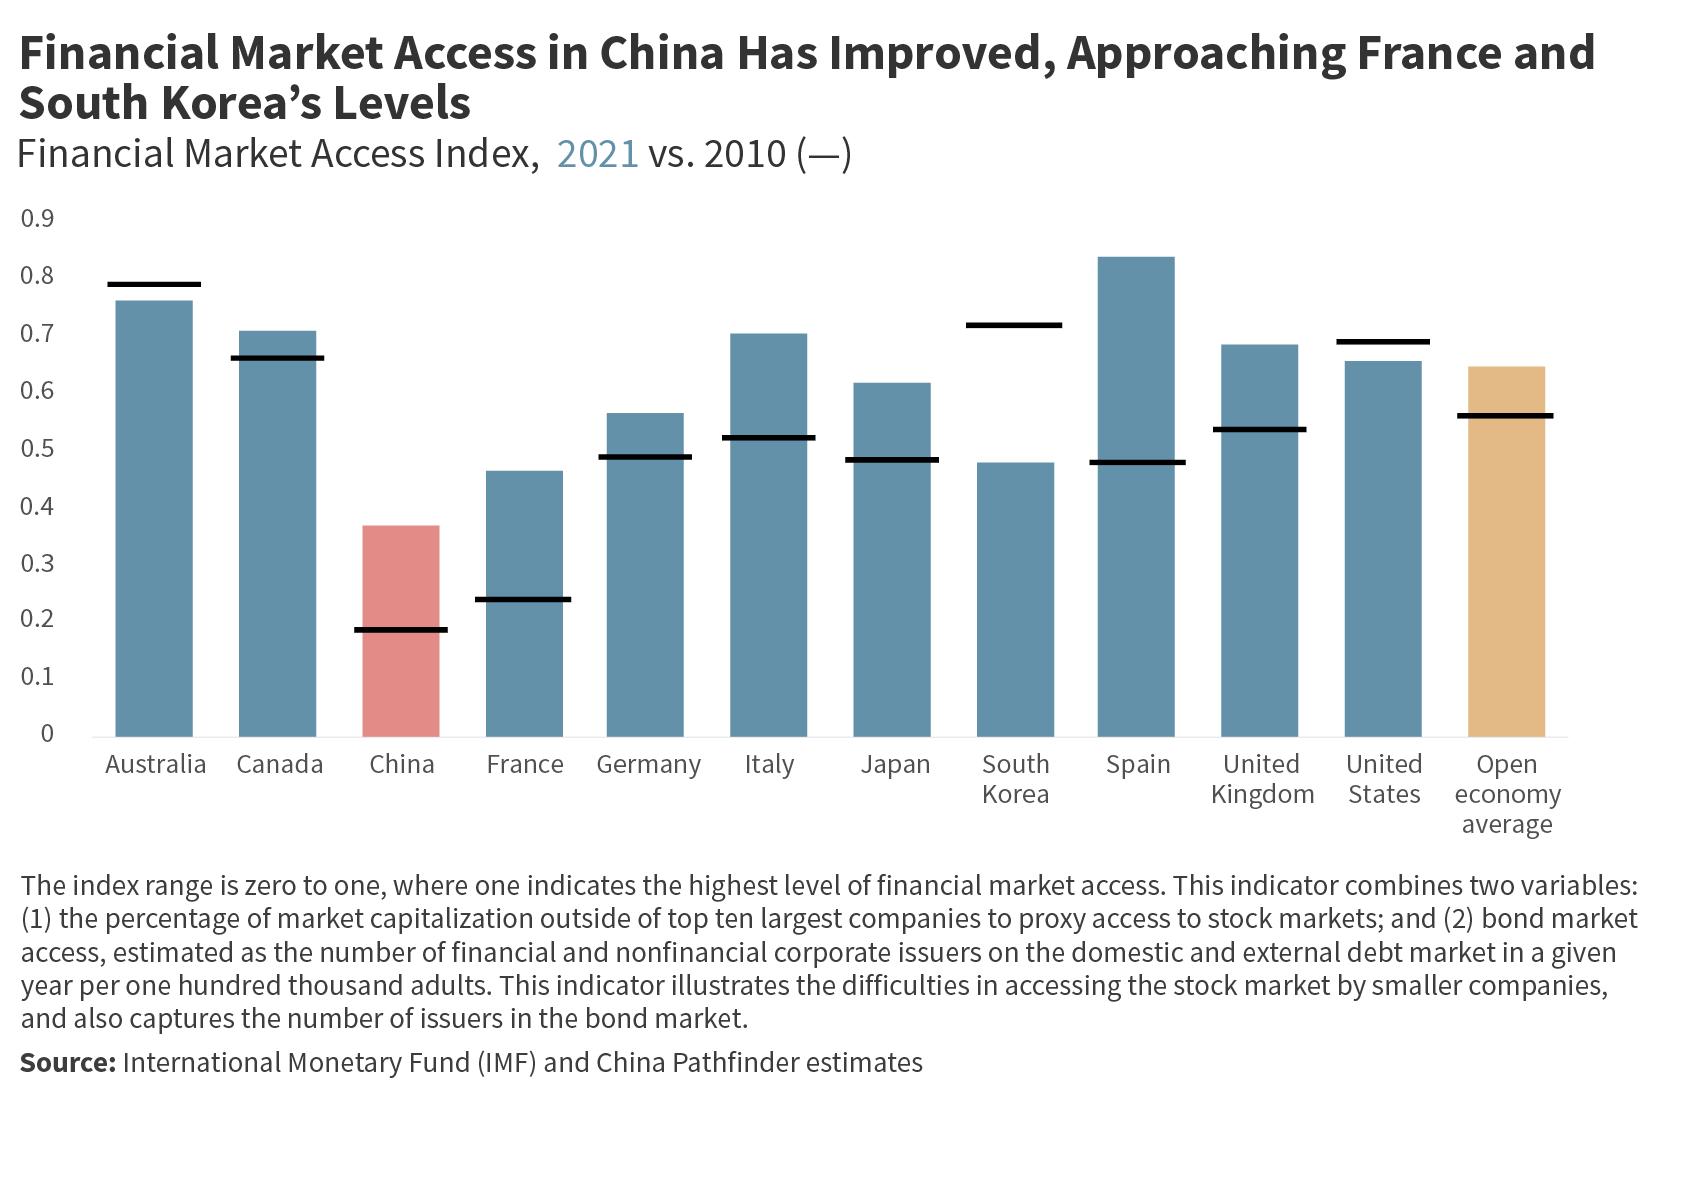
• Financial Market Access Index
Market Competition
An economy where businesses face low entry barriers, market power abuses are disciplined, and distortive interventions are minimized.
Modern Innovation System
A market led system that fosters productivity through private public cooperation and international collaboration.
• Market Concentration: Top 5 Firms’ Share of Sector Revenue, Across All Industries
• Foreign Competition: FDI Openness Index
• Unbiased Enforcement of Market Rules: Rule of Law Index
• State vs. Private Ownership of Top 10 Firms in All Industries
• National Spending on Innovation
• Venture Capital Attractiveness
• Private vs. State Funded Innovation
• International Attractiveness of a Nation’s Intellectual Property
• Quality Innovation Output: Total Triadic Patent Families Filed
• Strength of Intellectual Property Protection Measures
Trade Openness
A cross border flow of goods and services free from discriminatory measures and restrictions.
Direct Investment Openness
Fair access for foreign firms to domestic markets alongside minimal restrictions on local companies to invest abroad.
• Trade Intensity of the Economy: Goods Trade
• Trade Intensity of the Economy: Services Trade
• Trade Barriers: Tariff Rates
• Trade Barriers: Services Trade Restrictiveness
• Trade Barriers: Digital Services Trade Restrictiveness
• Inward FDI Intensity of the Economy
• Outward FDI Intensity of the Economy
• Inbound Direct Investment Restrictiveness Index
• Outbound Direct Investment Restrictiveness Index
Portfolio Investment Openness
Limited controls on cross border investment into equities, debt and other financial instruments.
• Portfolio Investment Volumes: Debt
• Portfolio Investment Volumes: Equity
• Inward Portfolio Investment Restrictiveness Index
• Outward Portfolio Investment Restrictiveness Index
Source: China PathfinderRHODIUM GROUP
In this chapter, we review each of our six clusters in detail. For each of the six economic pillars, we begin with a discussion of how to define the cluster and its relevance to a market-oriented econ omy. This provides a framework for how we selected indicators and why they are a fair proxy of that particular area of economic perfor mance. The next section outlines each indicator and its correspond ing methodology, followed by an analysis of the 2021 data findings
for China and open-market economies. The individual indicator stocktaking leads to our overall composite score results, where we assess countries’ relative performance and interesting trends for 2010, 2020, and 2021. The six sections of this chapter each con clude with a review of the major policies and other relevant devel opments that were enacted or occurred in China in 2021.
Measure of financial system development from 0 (low) to 10 (high). Source: China Pathfinder.
Open market economies rely on modern financial systems for the efficient pricing of risk and allocation of capital.5 Key pillars of mod ern financial systems are generally market-driven credit pricing, availability of a broad range of financial instruments, the absence of distortive administrative controls on credit price and quantity, and access for foreign firms to financial services and foreign exchange markets.
We chose the following annual indicators to benchmark China’s financial system development against that of open market economies.
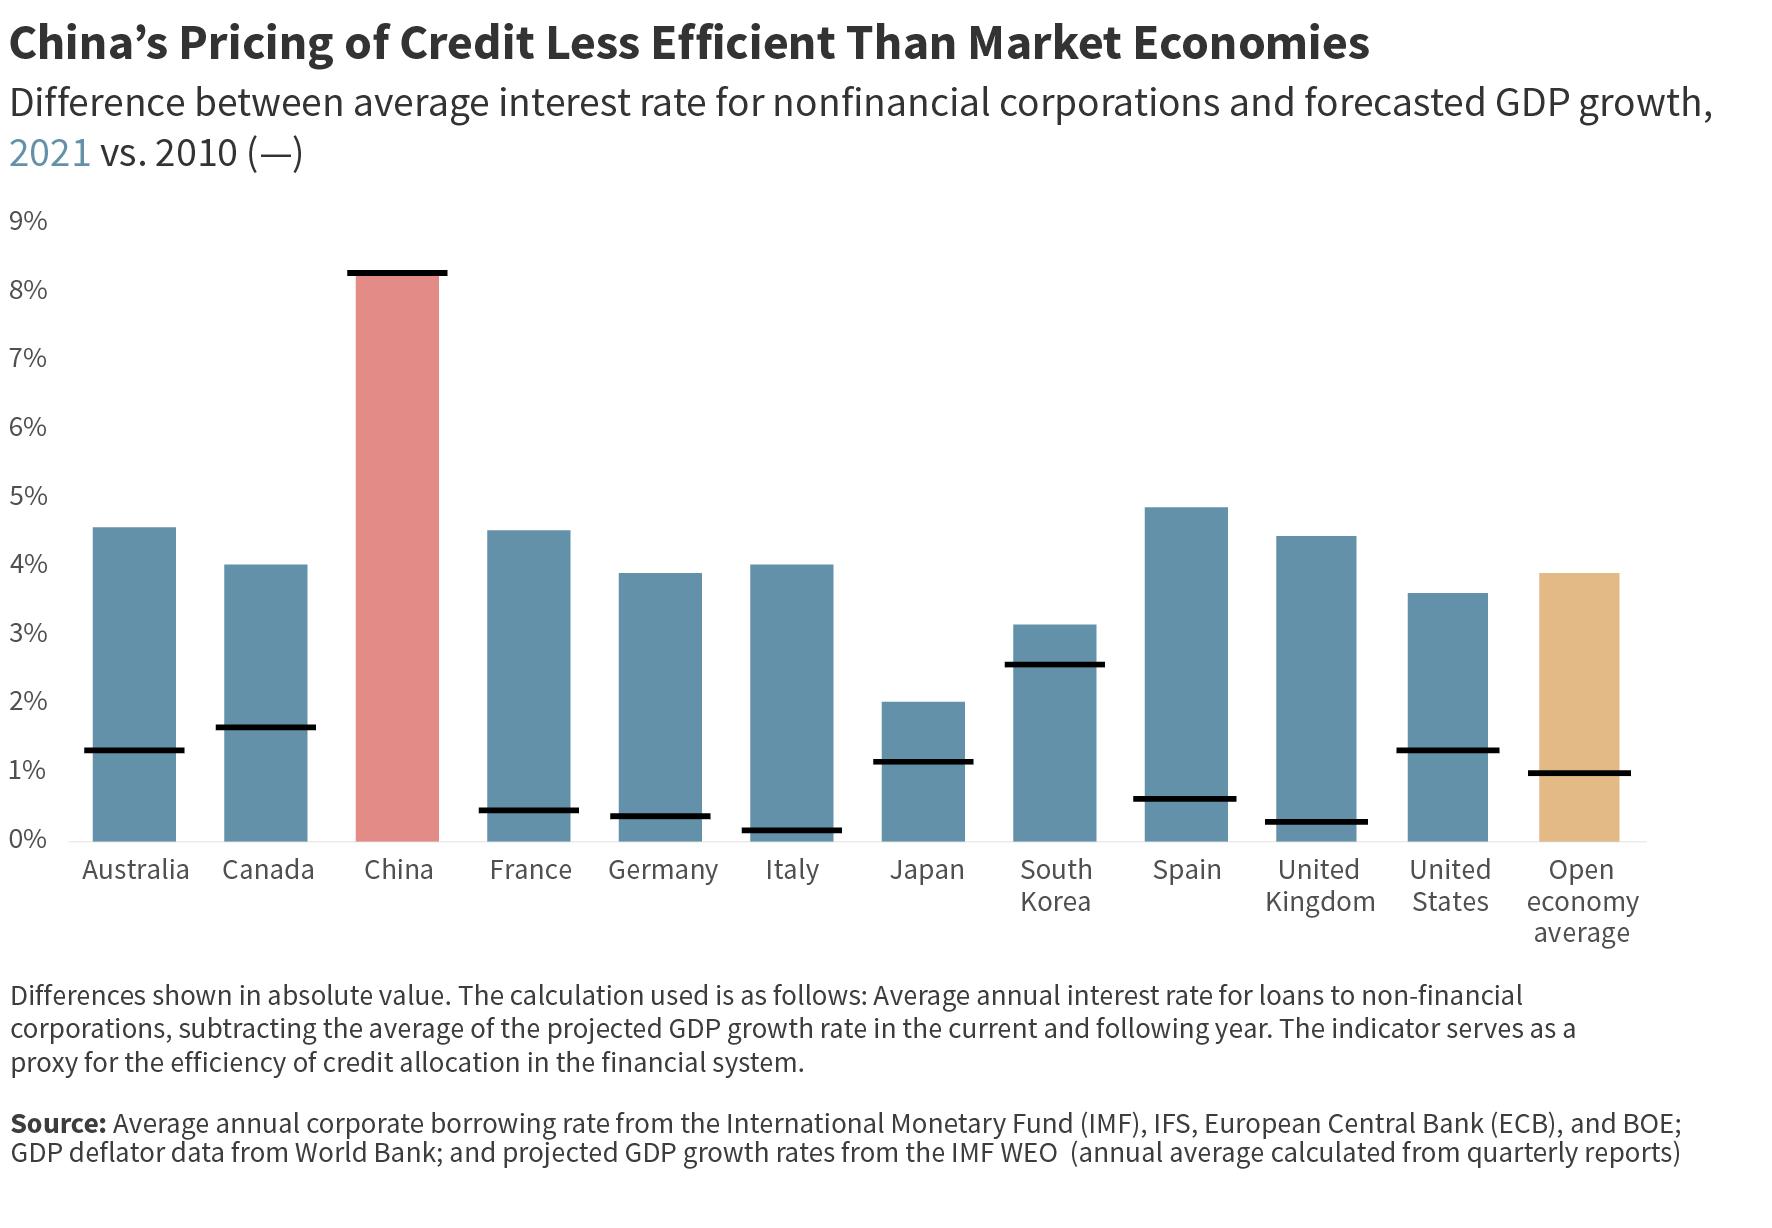
As a proxy for efficient pricing of credit we use the absolute value difference between the average borrowing rates for non-financial corporations and projected GDP growth. In an efficient financial sys tem, the cost of capital (the average interest rate) should roughly mirror the expected return (for which we use the projected GDP growth rate). Countries with efficient pricing of credit will be close to zero in our chart.
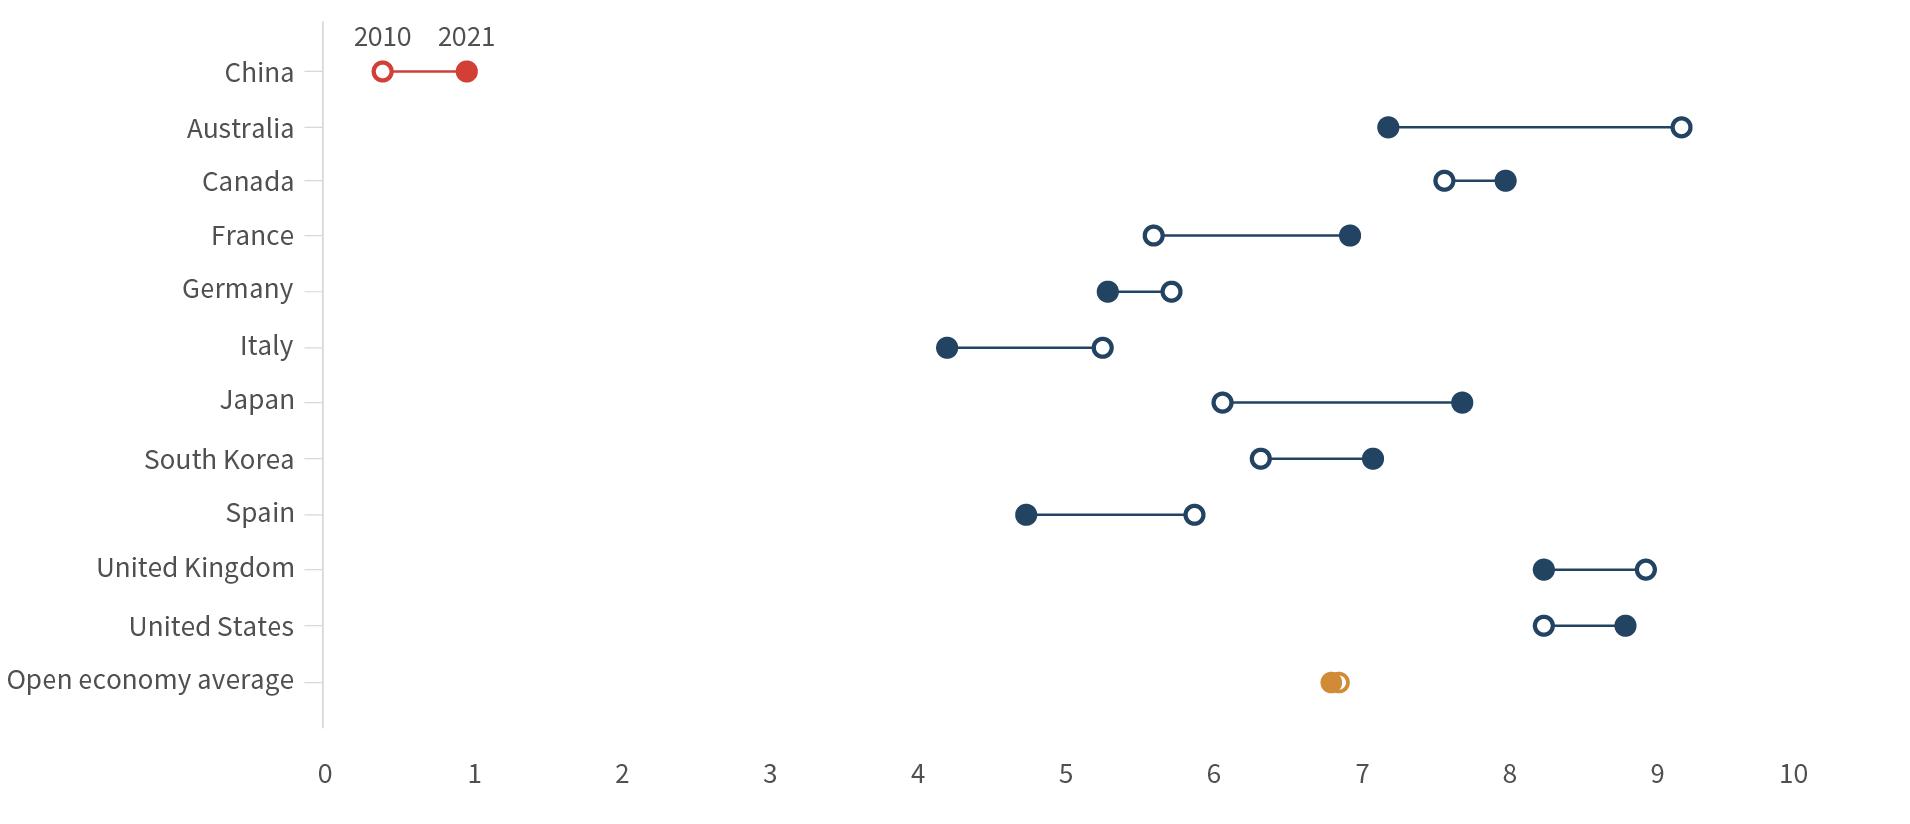
In 2010, China’s projected growth rate far exceeded the real inter est rate for corporate borrowers, effectively subsidizing producers and punishing savers. By 2020, China’s interest rate was closer to the country’s expected growth rate due to rising real interest rates and slowing GDP growth. However, in 2021, China’s score returned to 2010 levels. This is more the result of overall macro trends, given
5 William Hynes, Patrick Love, and Angela Stuart, eds., The Financial System (Paris: Organisation for Economic Co-operation and Development, 2020), https://doi.org/10.1787/d45f979e-en.
high bounce-back growth rates associated with the pandemic recovery. This increase in the overall distribution of scores can also be seen clearly in the open economies, which had markedly higher scores in 2021 than in 2010 or 2020. However, China’s score was still significantly higher than that of the open-economy average indi cating some level of inefficiency within its provision of capital.
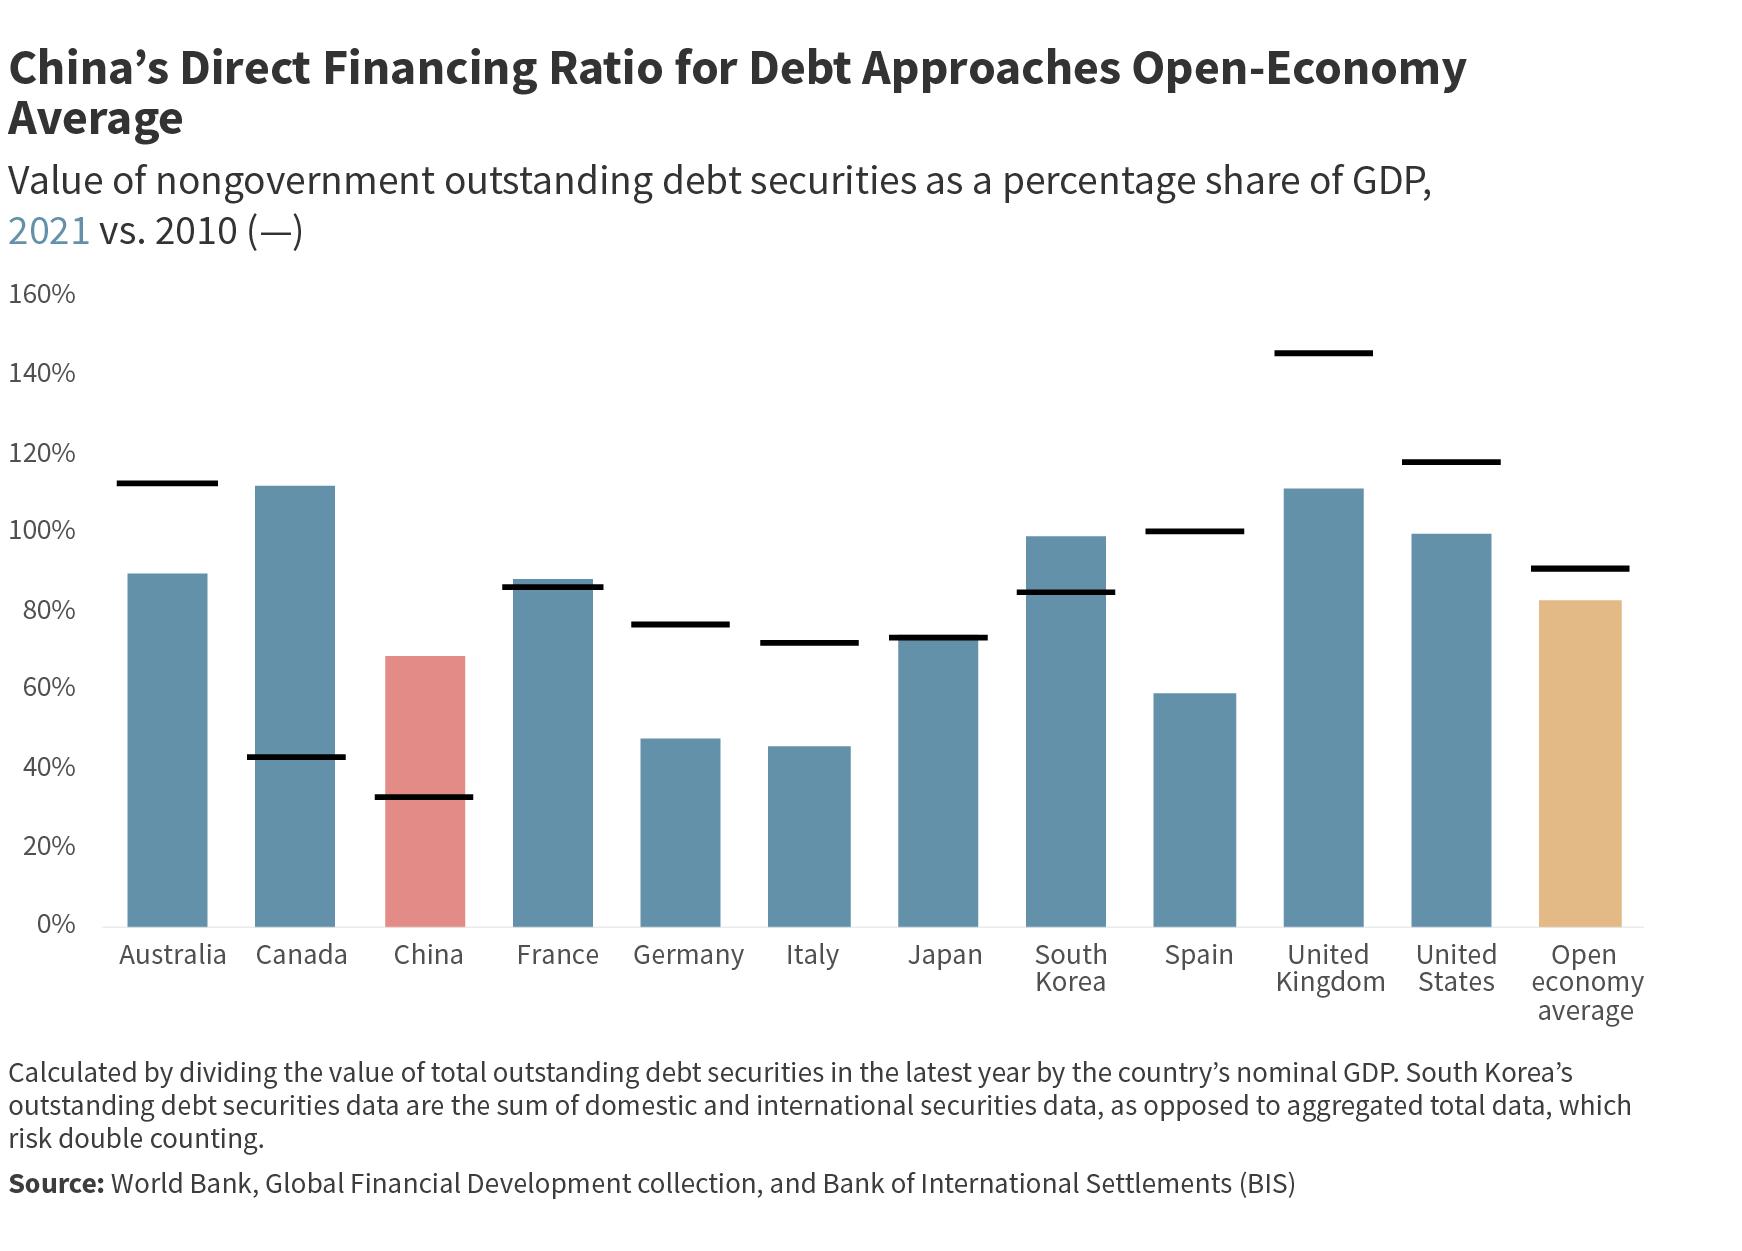
The extent of direct financing in an economy reflects the ability of firms to borrow directly from the market instead of going through banks and other intermediaries. We include two measures of direct financing: stock market capitalization as a share of GDP and out standing nongovernment debt securities as a share of GDP. Both measures show that China has a significantly lower share of direct financing than do other major economies, except for Germany, which also has a very bank-dominated financial system.
In previous years we relied on survey data from the World Bank’s Bank Regulation and Supervision Survey (BRSS) for information on state ownership in the financial sector. However, these surveys are not frequently updated, and were missing data for some of our sam ple countries. For this reason, we created our own indicator that captures the influence of the state in this area. Our indicator mea sures the degree of state ownership in the country’s top ten finan cial institutions by market capitalization. For each country, we look at the proportion of each institution’s public stock owned by the gov ernment. We then weight the results according to each institution’s market capitalization. For this measure we relied on market capital ization and government ownership data provided by Bloomberg.
We see a high degree of polarization within the results for this indi cator, with a weighted average government ownership proportion of 39.01 percent for China in 2021 compared to the open-economy average of 3.36 percent. Scores for China dropped from 46.95 percent in 2010 but rose slightly from 36.81 percent in 2020. This degree of state involvement in finance has been, and remains, one of the core systemic differences between China’s system and that of open economies.
The financial institutions depth indicator captures bank credit to the private sector, the assets of the mutual fund and pension fund industries, and the size of life and non-life insurance premiums. This indicator is a useful proxy for the sophistication of the financial sys tem in terms of financial offerings available beyond the banking system. China has the lowest score of around 0.46 in the sample but is close to the open economies of Italy and Spain (both 0.53). However, it is still well behind the open-economy average of 0.81. All scores have remained relatively stable since 2010.
The financial markets access indicator illustrates the difficulties in accessing the stock market faced by smaller companies and cap tures the number of issuers in the bond market. It combines two vari ables: (1) the percentage of market capitalization outside of top ten largest companies to proxy access to stock markets; and (2) bond market access, estimated as the number of financial and nonfinan cial corporate issuers on the domestic and external debt market in a given year per 100,000 adults.
China is far behind the market economy average in this area and has improved marginally in the last decade. That said, China’s score has increased markedly from 2019 to 2020, reflecting pos itive changes in terms of access to finance for smaller firms. The open-economy average has remained steady, though for some countries such as the United States, Australia, and South Korea, scores have fallen in the last decade. The most pronounced shift was for South Korea, whose score dropped from 0.71 in 2010 to 0.48 in 2020, possibly as a result of increasing market concentration among large conglomerates.
Blending our annual indicators, our Financial System Development Composite Index puts China at 0.88 in 2021, against an average of 6.7 within our sample of the ten largest open market econ omies (Figure 3). This is largely in line with China’s score of 0.9 in 2020. Both scores represent a step forward from a reading of 0.32 in 2010, reflecting progress toward more depth and diver sity in China’s financial system, as well as successful deleveraging efforts. However, China still has the lowest composite score among the countries in our sample for 2010, 2020, and 2021. For both de jure and de facto indicators, China remains well behind open econ omies. This is not necessarily surprising. China’s financial system is still largely driven by state-owned banks and has only recently moved towards more advanced forms of financing characteristic of market economies. While there has been some progress in ensur ing that financing is available to a broader and more representative group of firms within the economy, the overall state-driven character of the country’s financial system remains unchanged.
Our indicator set has good coverage of the institutional dimen sions and other input variables of financial system development. However, our indicator selection cannot correct for certain intrinsic factors that positively impact Anglo-American financial systems’ per formance. For instance, the United Kingdom’s performance across some of our metrics is inevitably impacted by London’s status as an international financial center. Moreover, the global pandemic and unconventional global monetary policy have put constraints on the use of certain variables measuring financial system efficiency and other output dimensions in 2021. We include some of these mea sures in the set of supplemental indicators.
We update the abovementioned benchmark indicators yearly to track the pace and direction of change. On a quarterly basis, we take the pulse of various developments that would move China either closer or further from the average of market economies in terms of its financial system. From this exercise, we have selected a few of the most significant events that took place in 2021.
The year of 2021 was a tumultuous one for China’s financial system. At the start of the year, the government was already dealing with the beleaguered asset management firm Huarong. Originally created to absorb bad debt, the company had itself overextended, prompt ing the government to bail out Huarong amid its own de-risking campaign.
However, one development stands above all the rest in terms of its impact: the downturn in the property market. For decades, the property sector has been an important source of growth for the economy and a key source of financing for local governments, many of which depend on land sales to meet fiscal shortfalls. Additionally, due to the sector’s size, the fate of many financial institutions is inti mately tied to the property market. The property market distress was triggered by a series of regulations put in place by Chinese authorities intended to limit debt levels in the highly leveraged prop erty sector. These regulations, known as the “three red lines,” were issued in late 2020, and consisted of the following rules:
• Liabilities should not exceed 70 percent of assets, excluding advance proceeds from projects sold on contract, a common practice in the Chinese property market.
• Net debt should not be greater than 100 percent of equity.
• Money reserves should, at a minimum, be equal to 100 percent of short-term debt.
The first company to experience significant distress after the unveil ing of these rules was Evergrande. The company had accumulated more than $300 billion in liabilities as a result of a massive credit expansion and loose rules around lending, particularly in the prop erty sector. Chinese authorities have been reluctant to offer a fullscale bailout to the firm, unlike in the case of Huarong. Evergrande’s woes have created contagion that has spread to the broader real estate sector, with an estimated 30 defaults by companies with more than $1 trillion in debt since the introduction of the three red lines.6 Overall, the distressed sector has endangered a key source of economic growth while demonstrating the degree to which China has created a financial system rife with moral hazard. The govern ment’s current refusal to shield firms from the consequence of risky investment cannot undo the decades in which firms made such investments with perceived support from the state. The impact of the downturn continues to unfold in 2022, as many households have stopped paying their mortgages since the prospects of their homes being built by failing developers seem slim. Before censors tightened control of the issue on domestic social media, more than 300 mortgage boycotts were catalogued.7
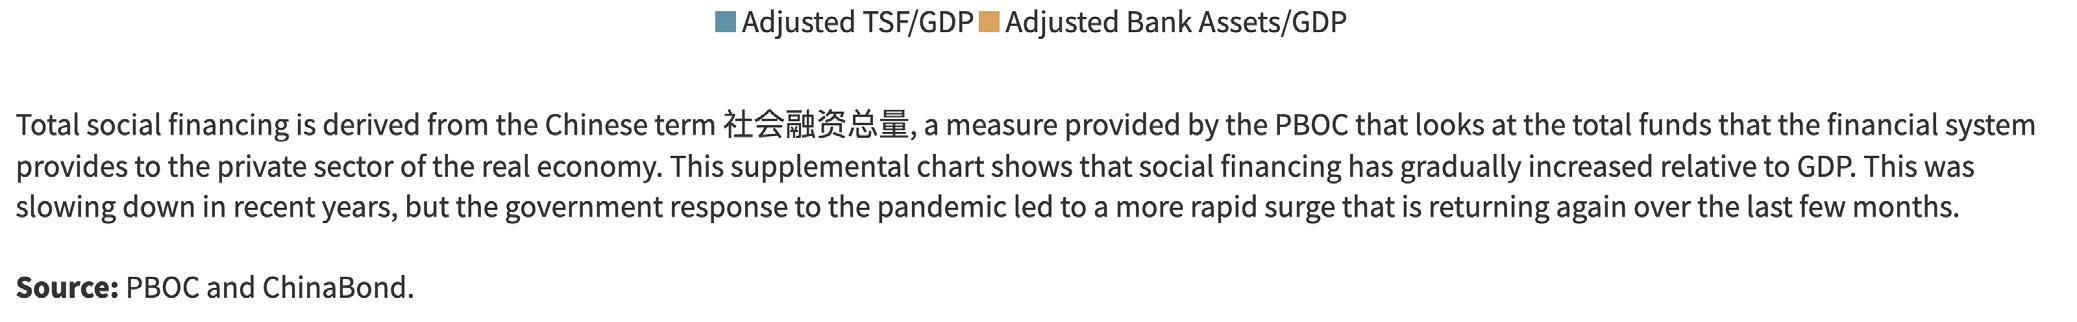
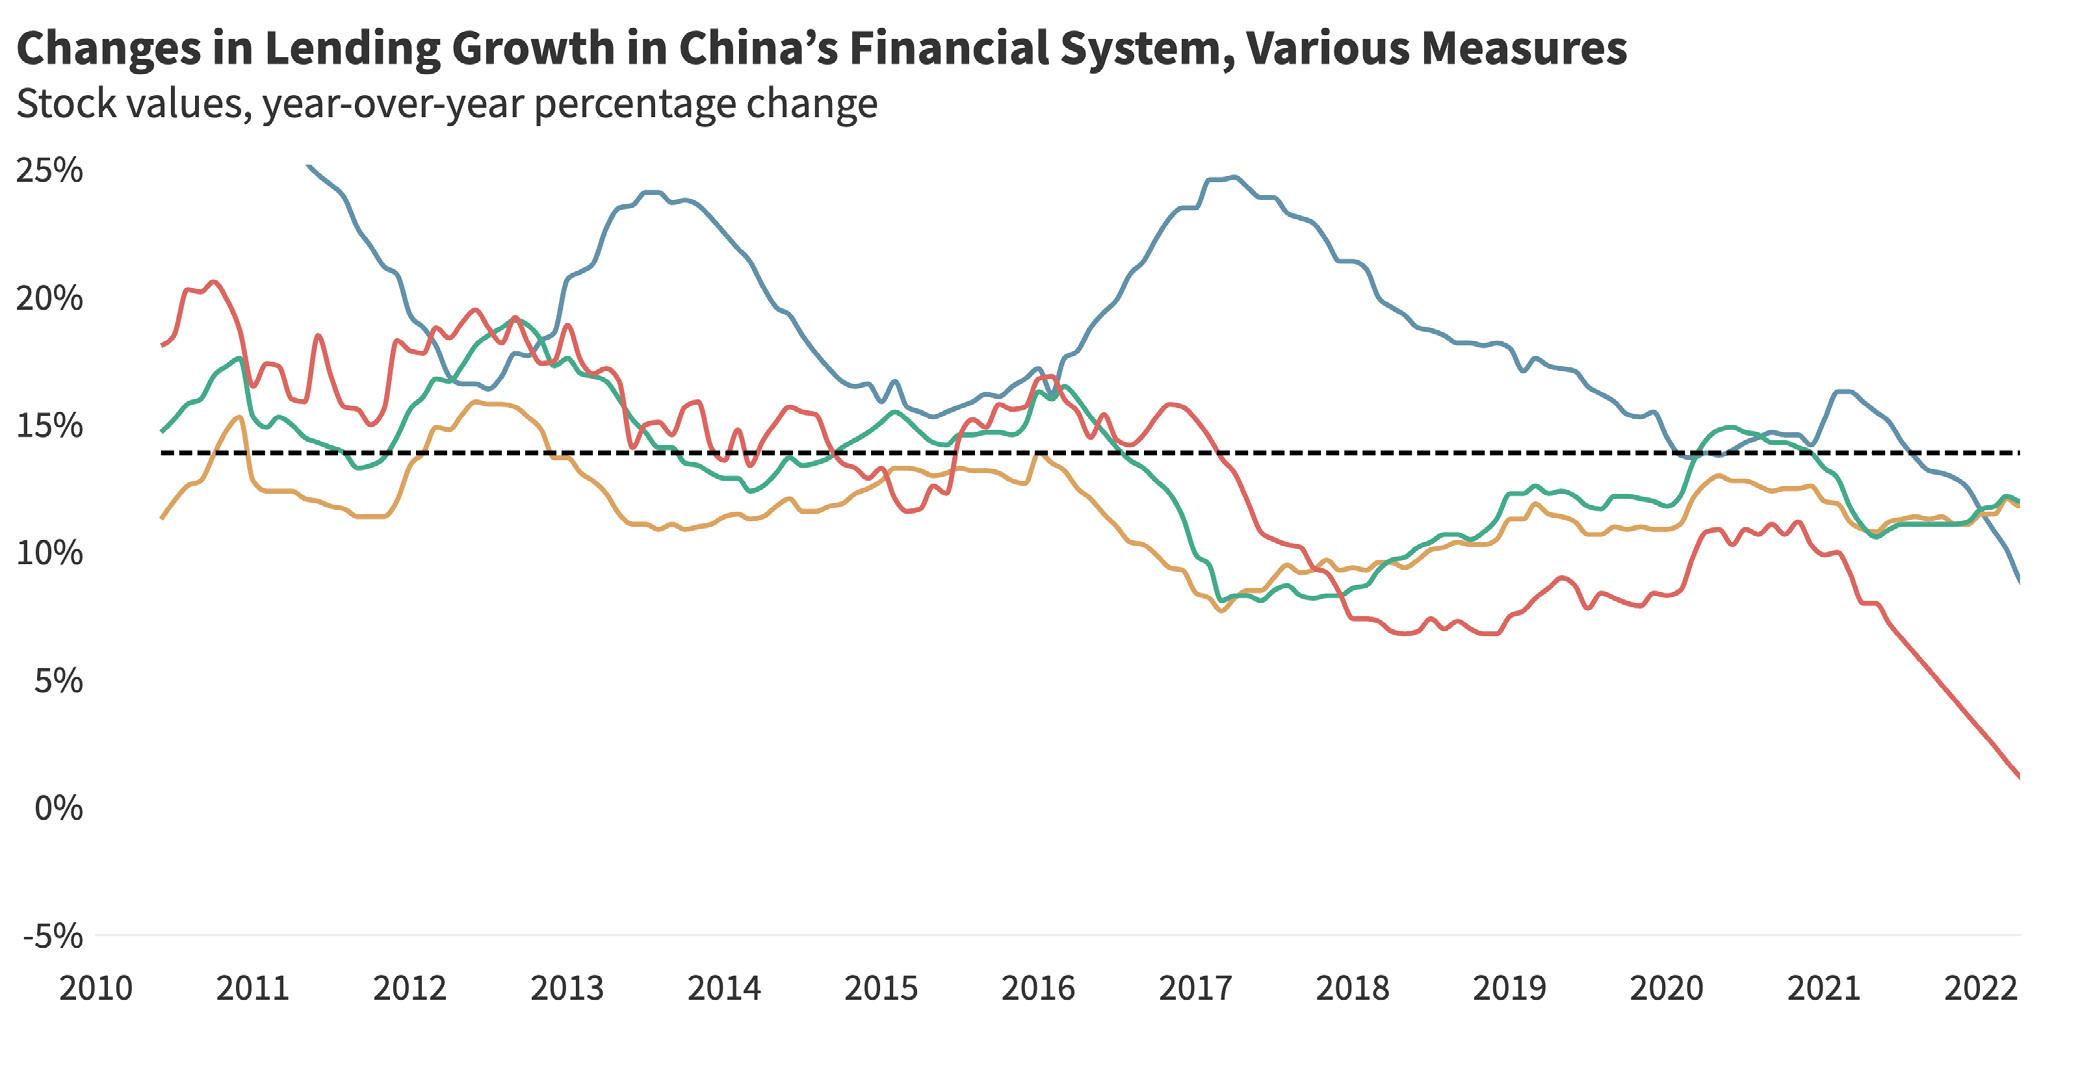
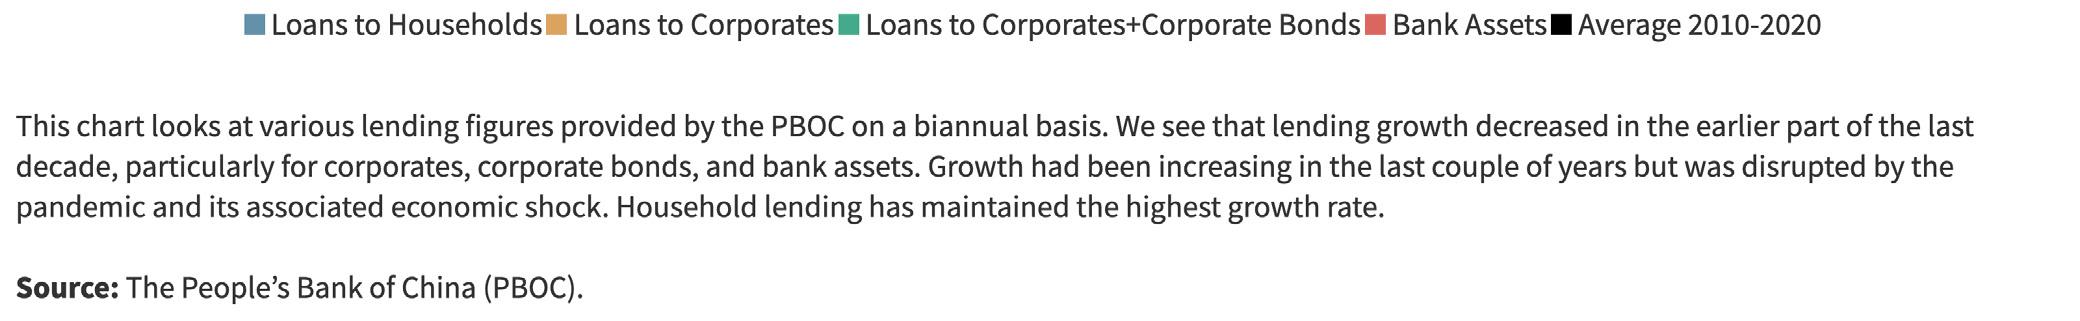
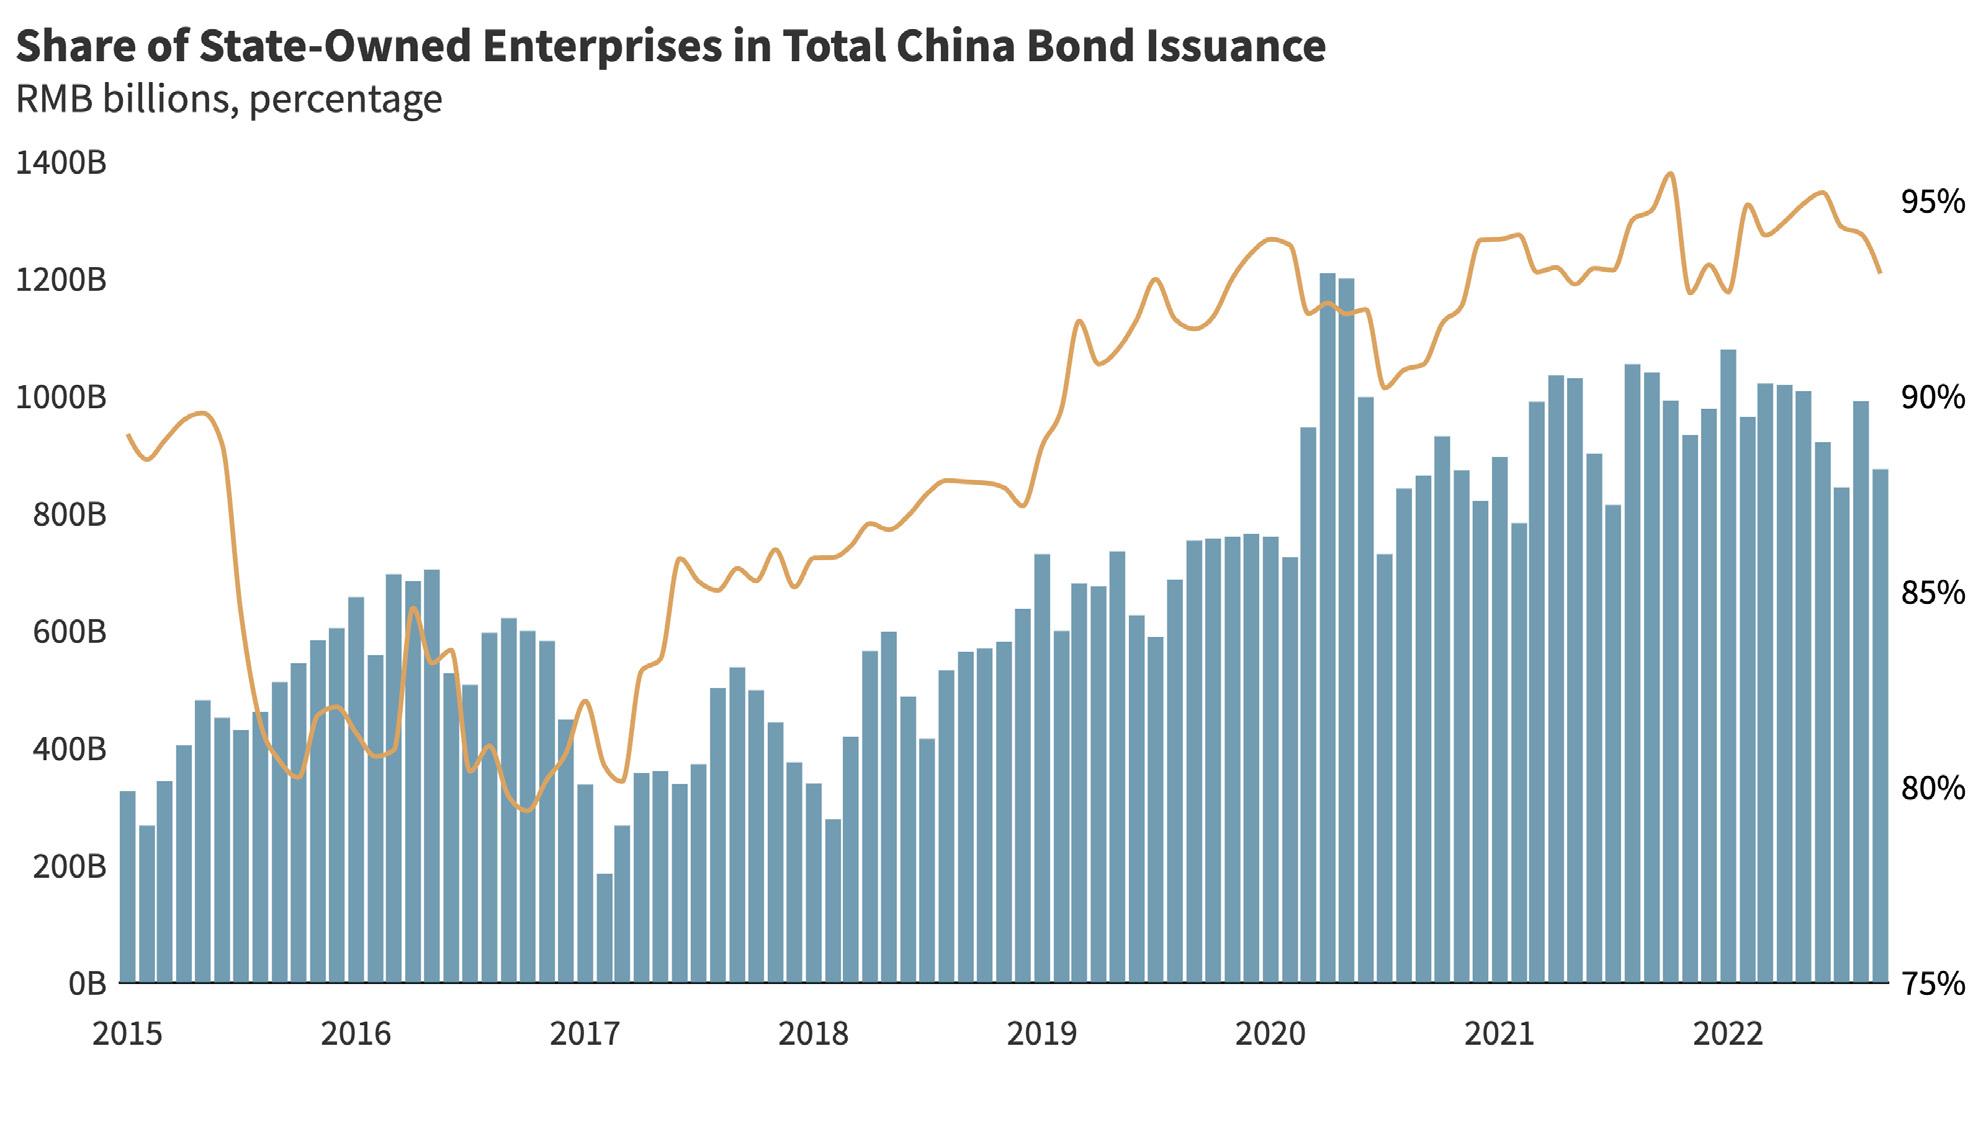
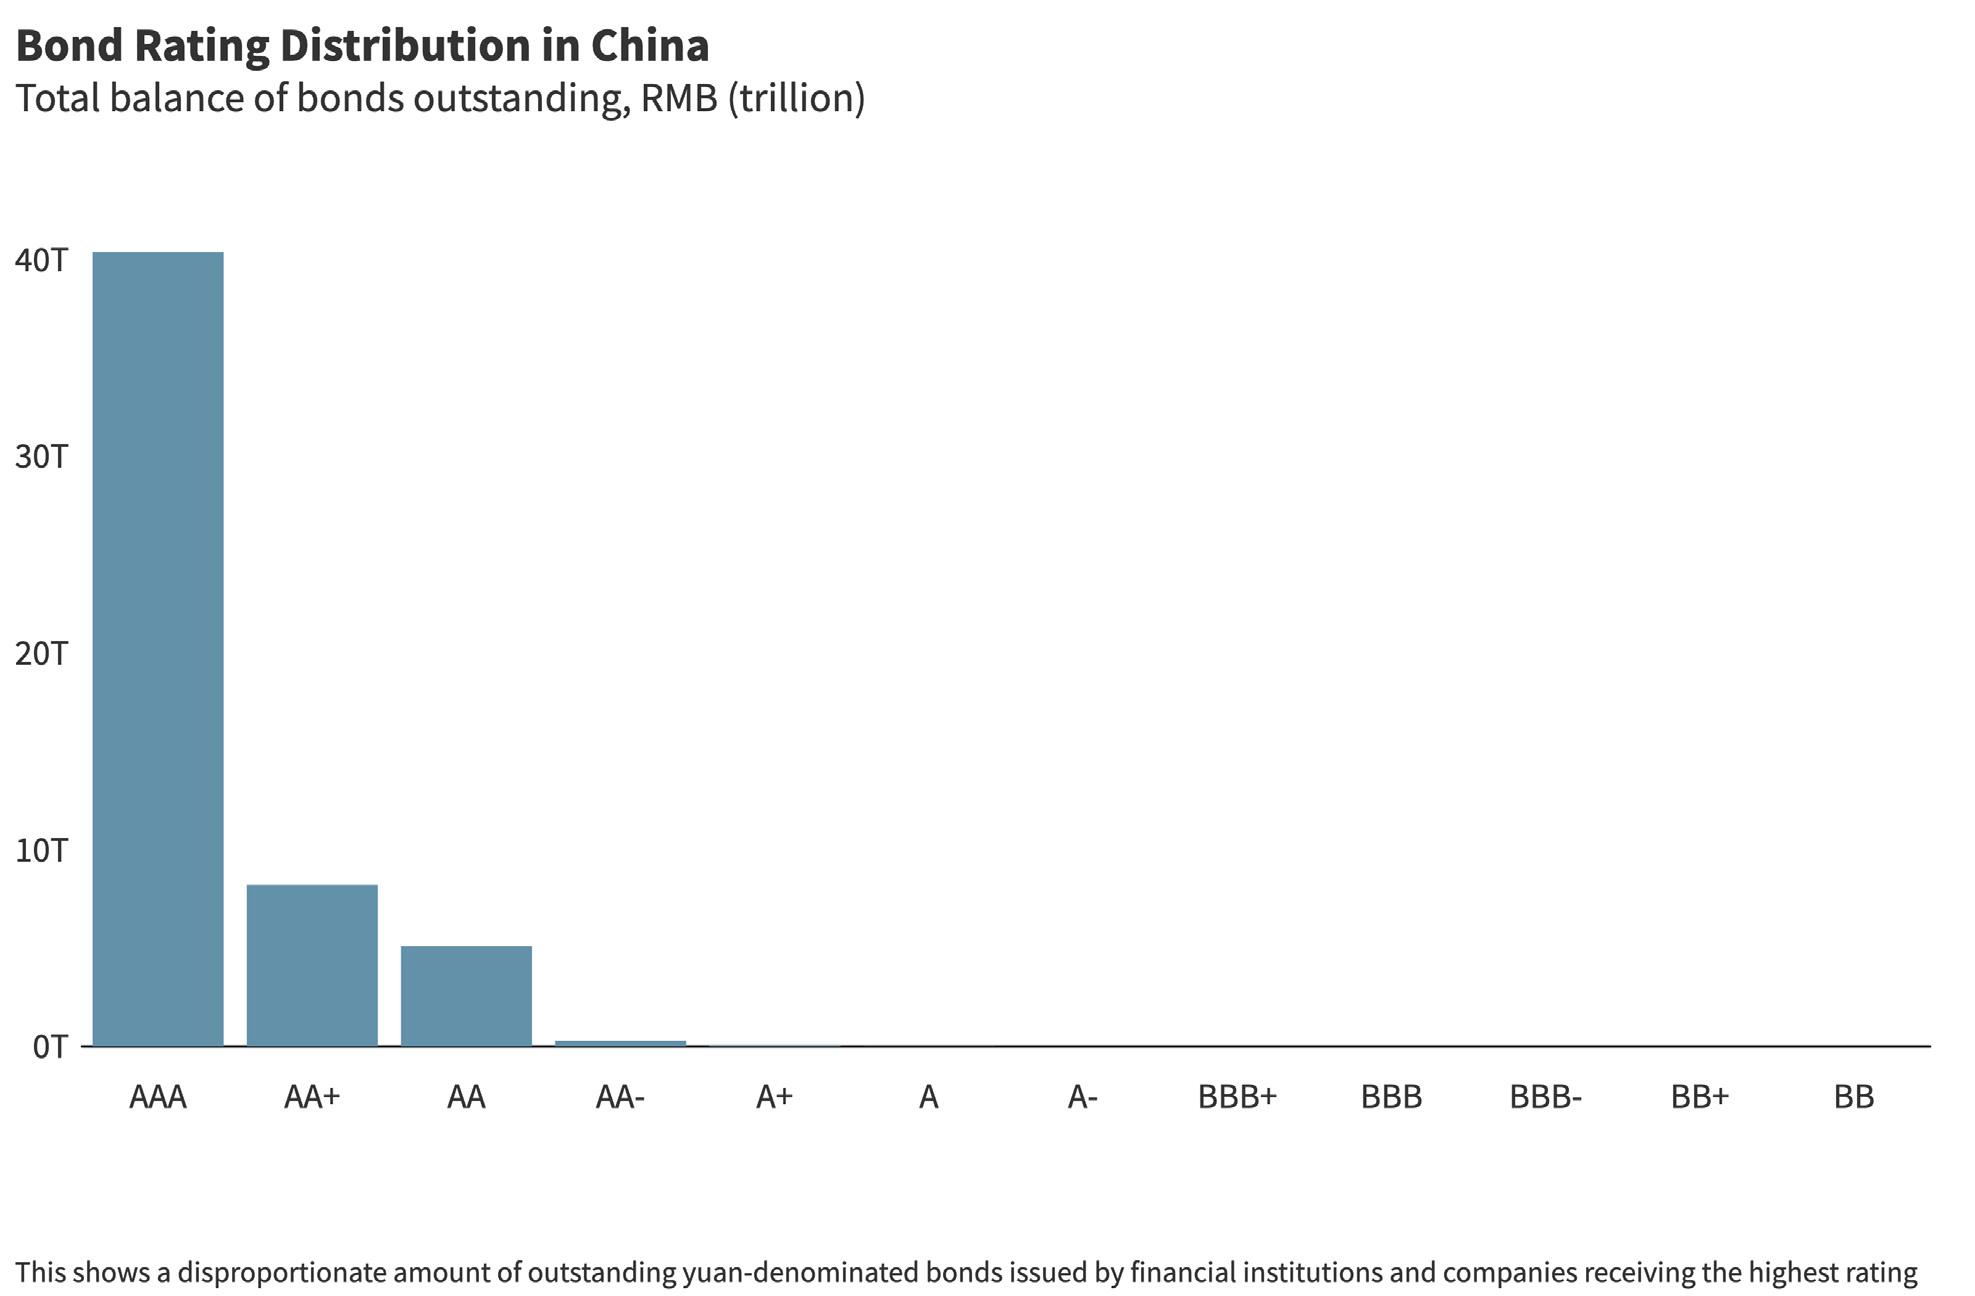
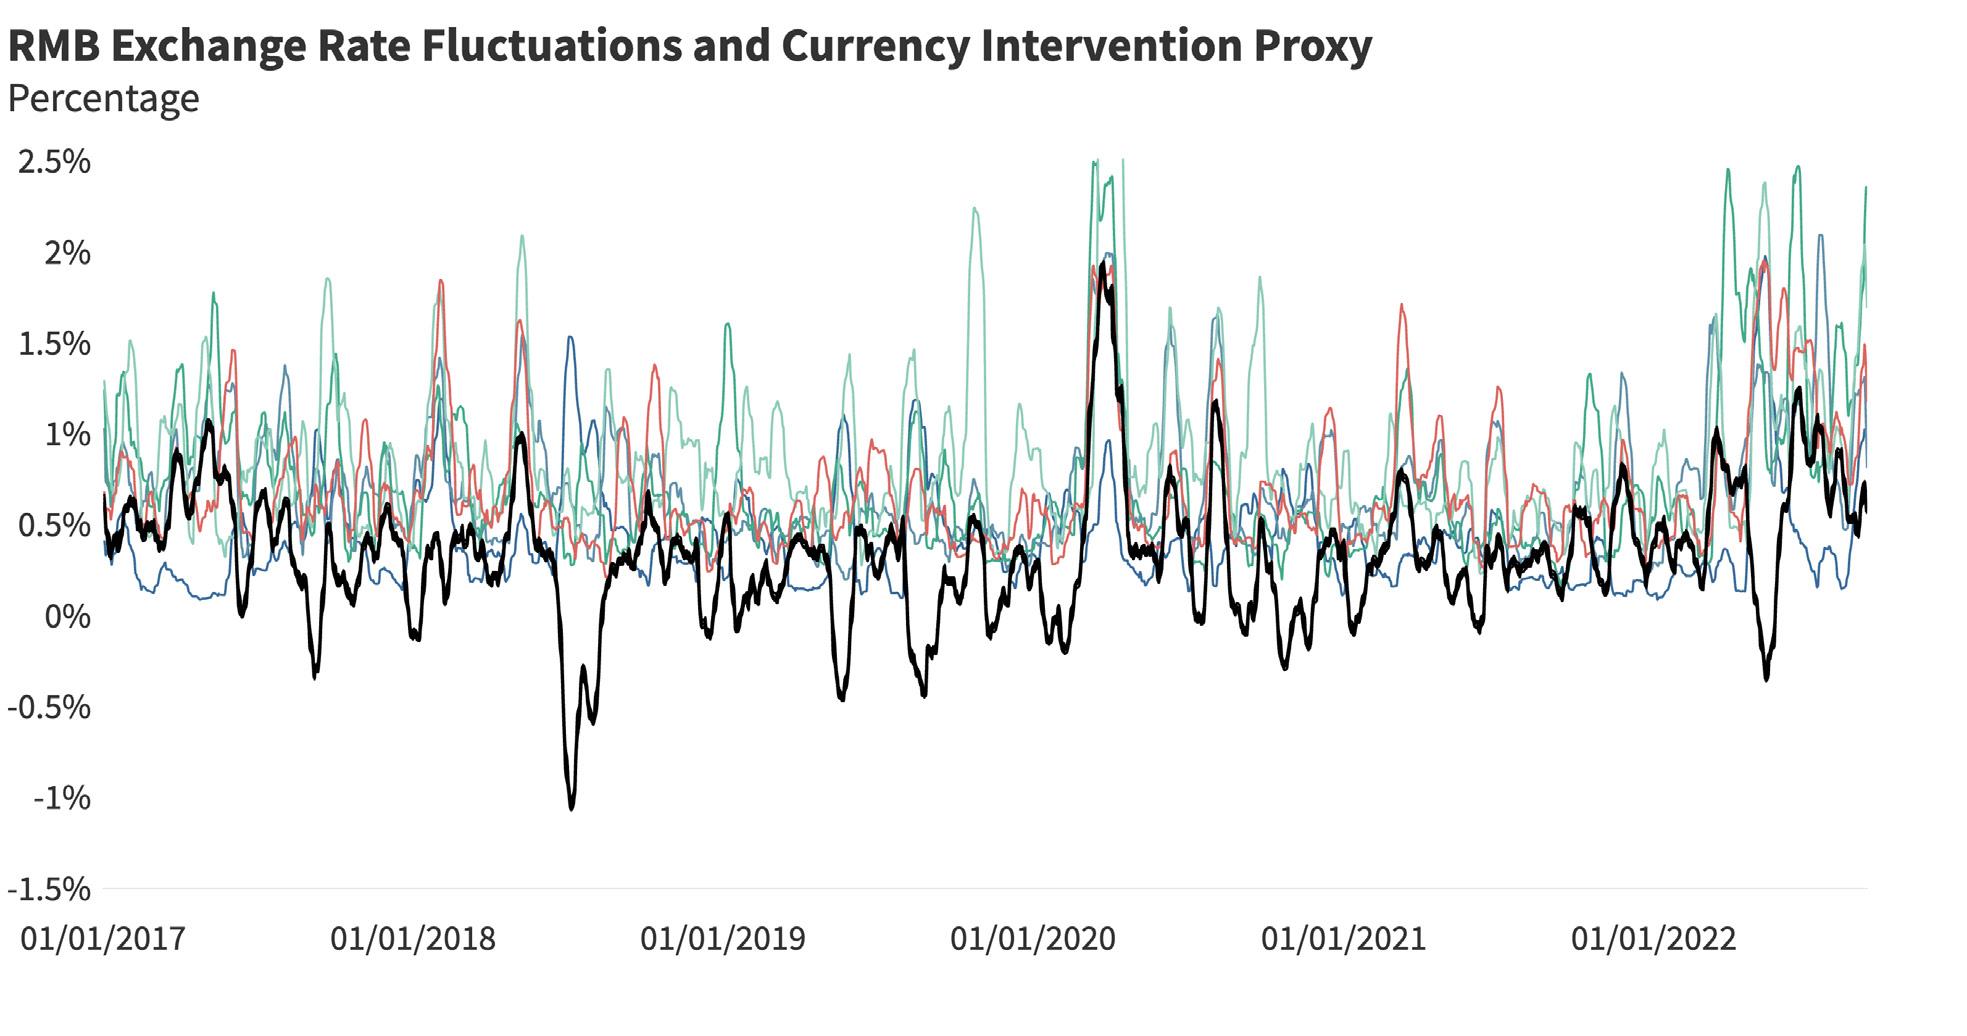
In addition to tracking policy signals in these areas, we are also mon itoring several higher-frequency and often China-specific indicators to gauge progress on market-oriented, liberal economic reforms. Figure 3.2 includes a selected number of these supplemental charts, including the pace of credit growth in the Chinese economy; the distribution of credit to consumers, the private sector, and stateowned enterprises (SOEs); the distribution of Chinese bond ratings; interest rates for savers; and exchange rate dynamics.
6 Bartholomeusz, Stephen. “China’s Response to Bank Protest Hints at a Wider Problem.” The Sydney Morning Herald, https://www.smh.com.au/business/banking-and-finance/ china-s-response-to-bank-protests-hints-at-a-wider-problem-20220712-p5b0wa.html
7 Mia Ping-Chieh Chen and Gao Feng, “Chinese Mortgage Boycotts over Unfinished Buildings Spread to Hundreds of Locations,” Radio Free Asia, https://www.rfa.org/english/ news/china/mortgage-boycott-08192022141013.html.


Measure of market competition from 0 (low) to 10 (high). Source: China Pathfinder.
Market economies rely on a pro-competitive environment where firms face low entry and exit barriers, market power abuses are dis ciplined, consumer interests are prioritized, and government partic ipation in the marketplace is limited and governed by clear princi ples. Competitive markets are important to the overall development of an economy because firms with competitors have greater incen tive to innovate and improve productivity. This adds diversity to the market and higher quality growth.
We chose the following annual indicators to benchmark China’s market competition against open market economies.
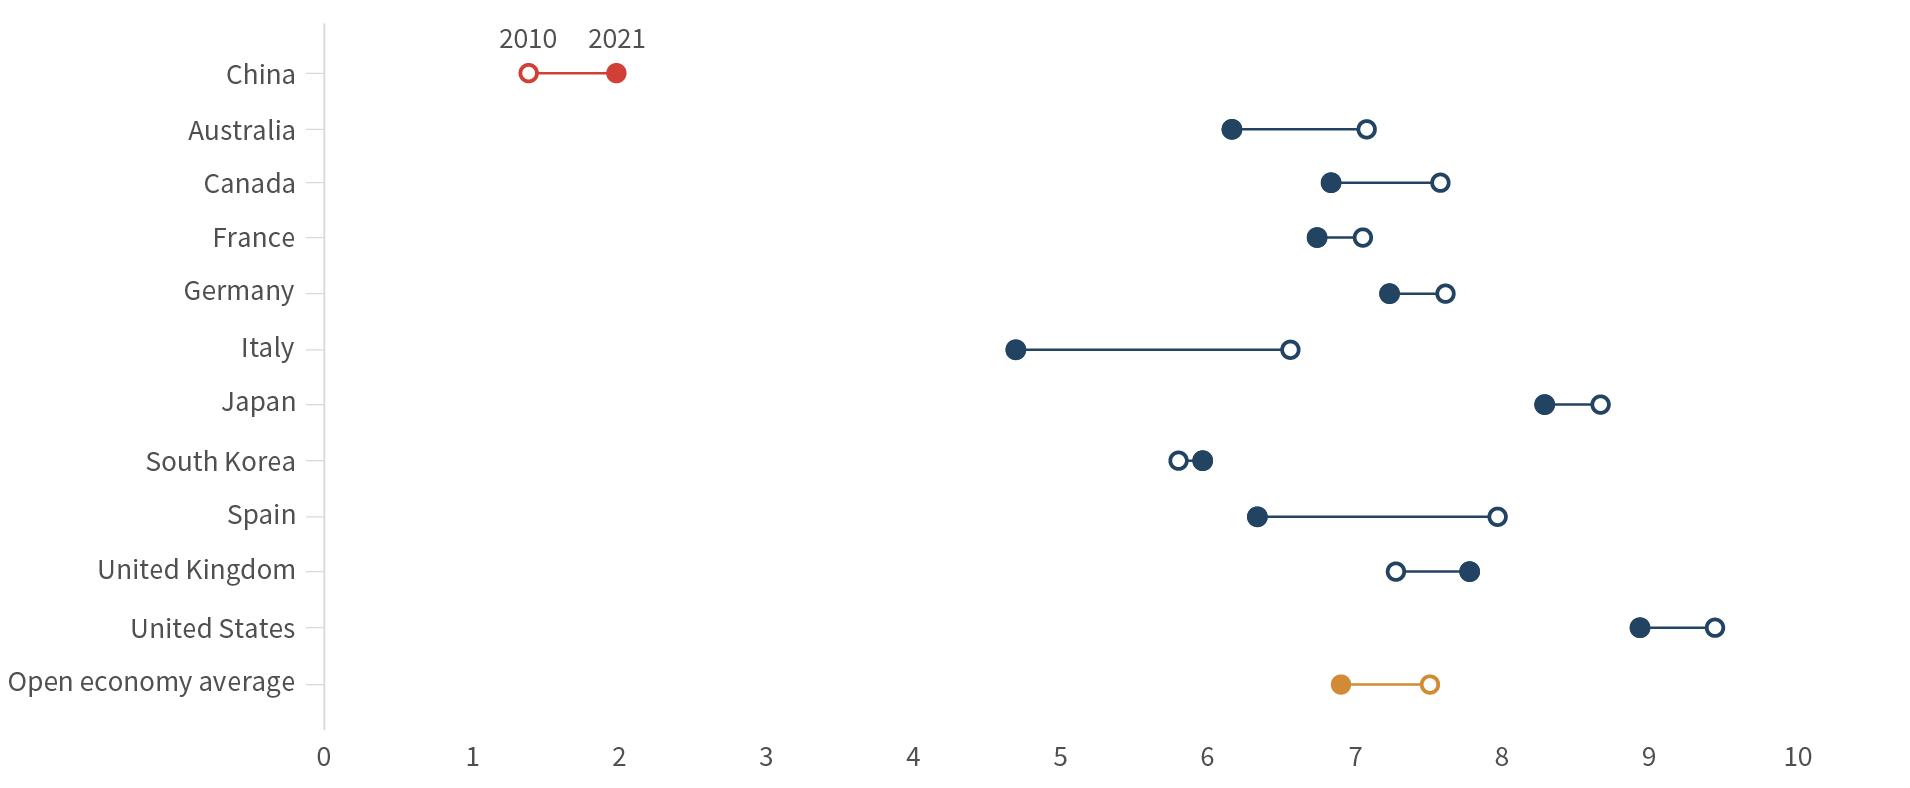
We measure overall market concentration across all industries using the top five listed companies’ revenue as a share of total industry revenue. The higher the proportion of total revenue that the five firms make up, the more concentrated the industry. The indicator is a simple average of the calculated proportions from 11 industries: communications, consumer discretionary, consumer sta ples, energy, financials, healthcare, industrials, materials, real estate,
technology, and utilities. The industry categorization is consistent across all countries in the sample. For countries with industries com prising less than 50 listed companies, we use the top 10 percent of the total firms in the industry instead of the top five. The indicator was constructed in-house, based on manual data collection from Bloomberg, to replace the Herfindahl-Hirschman Index that does not publish new data at a high enough frequency for this project.8
This measure shows that China’s markets are less concentrated than most major open economies in 2021. China, South Korea, and the UK’s markets were considerably more concentrated in 2010 and have seen rising competitiveness since. China’s size and large num ber of provinces likely contribute to its lower market concentration, as provincial monopolies competing with each other can produce an overall less-concentrated market. Economies of scale, which lead to lower production costs for larger companies, contribute to increas ing market concentration for both capitalist and state-led systems. This aggregate measure does not provide a fully nuanced perspec tive on the discrepancy between highly competitive sectors (mostly in manufacturing) and oligopolistic sectors with heavy state domi nance in China (transportation and energy, among others). In some sectors, low market concentration scores indicate too much compe tition or, in other words, fragmentation. In instances where there are too many competing companies, inadequate capital discipline and other market exit impediments lead to overcapacity that requires firms to cut corners on necessary investments or export aggres sively to use idle capital assets.9
8 “Methodologies to Measure Market Competition,” Organisation for Economic Co-operation and Development, June 11, 2021, https://oe.cd/mmmc.
9 Caroline Freund and Dario Sidhu, “WP 17-3 Global Competition and the Rise of China,” Peterson Institute for International Economics, February 2017, https://www.piie.com/sites/ default/files/documents/wp17-3.pdf
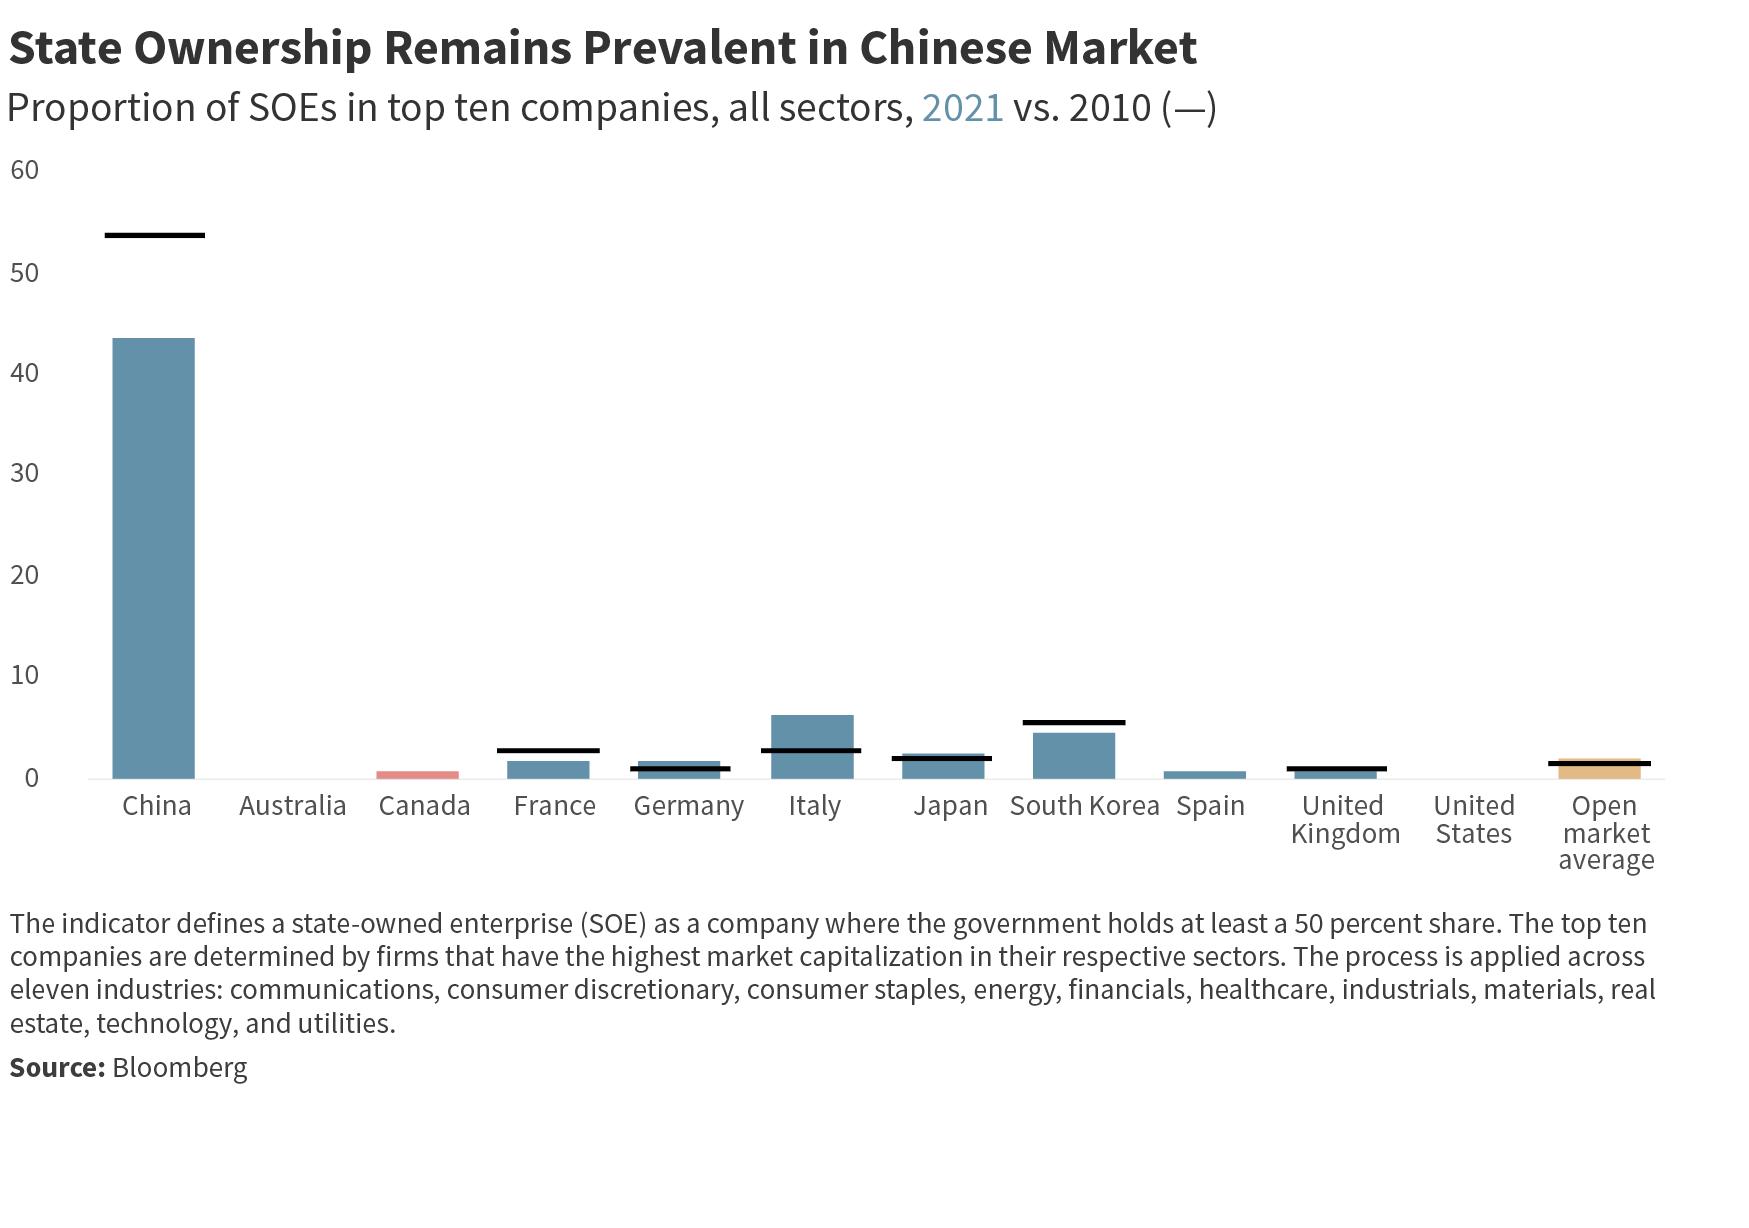
One important determinant of market competition is the role of SOEs in the economy. To replace the now-discontinued “Scope of State-Owned Enterprises Index” compiled by the OECD, we calcu late the presence of SOEs in the top ten companies of each indus try. The top ten firms are determined based on market capitalization as a share of the industry’s total market capitalization. The outcomes for each company are then weighted according to its respective market capitalization. This remedies the previous indicator’s inabil ity to reflect the massive assets held by Chinese SOEs as compared to their counterparts in OECD economies. The process is repeated for each of 11 industries listed in the market concentration indicator description.
Bloomberg data on government ownership share for companies in market economies accurately captured the extent of state own ership. For these countries, a company was considered an SOE if the government owned 50 percent or more of its shares. However, many Chinese SOEs’ largest shareholders are not clear-cut gov ernment entities such as the State-owned Assets Supervision and Administration Commission (SASAC) of the State Council or Ministry of Finance. The team used Chinese sources to conduct outside research on Chinese companies, determining whether compa nies had key shareholders that were other SOEs, the Central Huijin Investment Co. (a state-owned investment company), or Hong Kong Securities Clearing Company (of which the Hong Kong government is the largest shareholder). This supplemented the results that the Bloomberg ticker offered.
For China, 43.6 percent of its top ten companies were SOEs. This is, unsurprisingly, considerably above the open-economy average of 2 percent. SOEs’ role in China’s economy is one of the key differences between the Chinese system and market economies. Compared to 2010, Chinese SOEs make up a significantly lower proportion of the top ten companies in 2021, with a difference of 10 percentage points. However, from 2020 to 2021, the share of SOEs in the top ten increased by 3.6 percentage points. This may suggest a shift toward more state presence in Chinese markets beginning in the last couple of years. For most of the market economies, state own ership in top firms slightly increased since 2010. Italy was the most notable example of this, where only 2.73 percent of its top ten firms were SOEs in 2010, increasing to 6.36 percent in 2021. For South Korea, the share of SOEs increased by nearly 1 percentage point between 2020 and 2021, though the current proportion still has not exceeded 2010’s levels. By comparison, the US has maintained no state ownership in the top ten firms across its industries from 2010 to 2021, and the UK’s low proportion of 0.9 percent has not changed over the same duration.
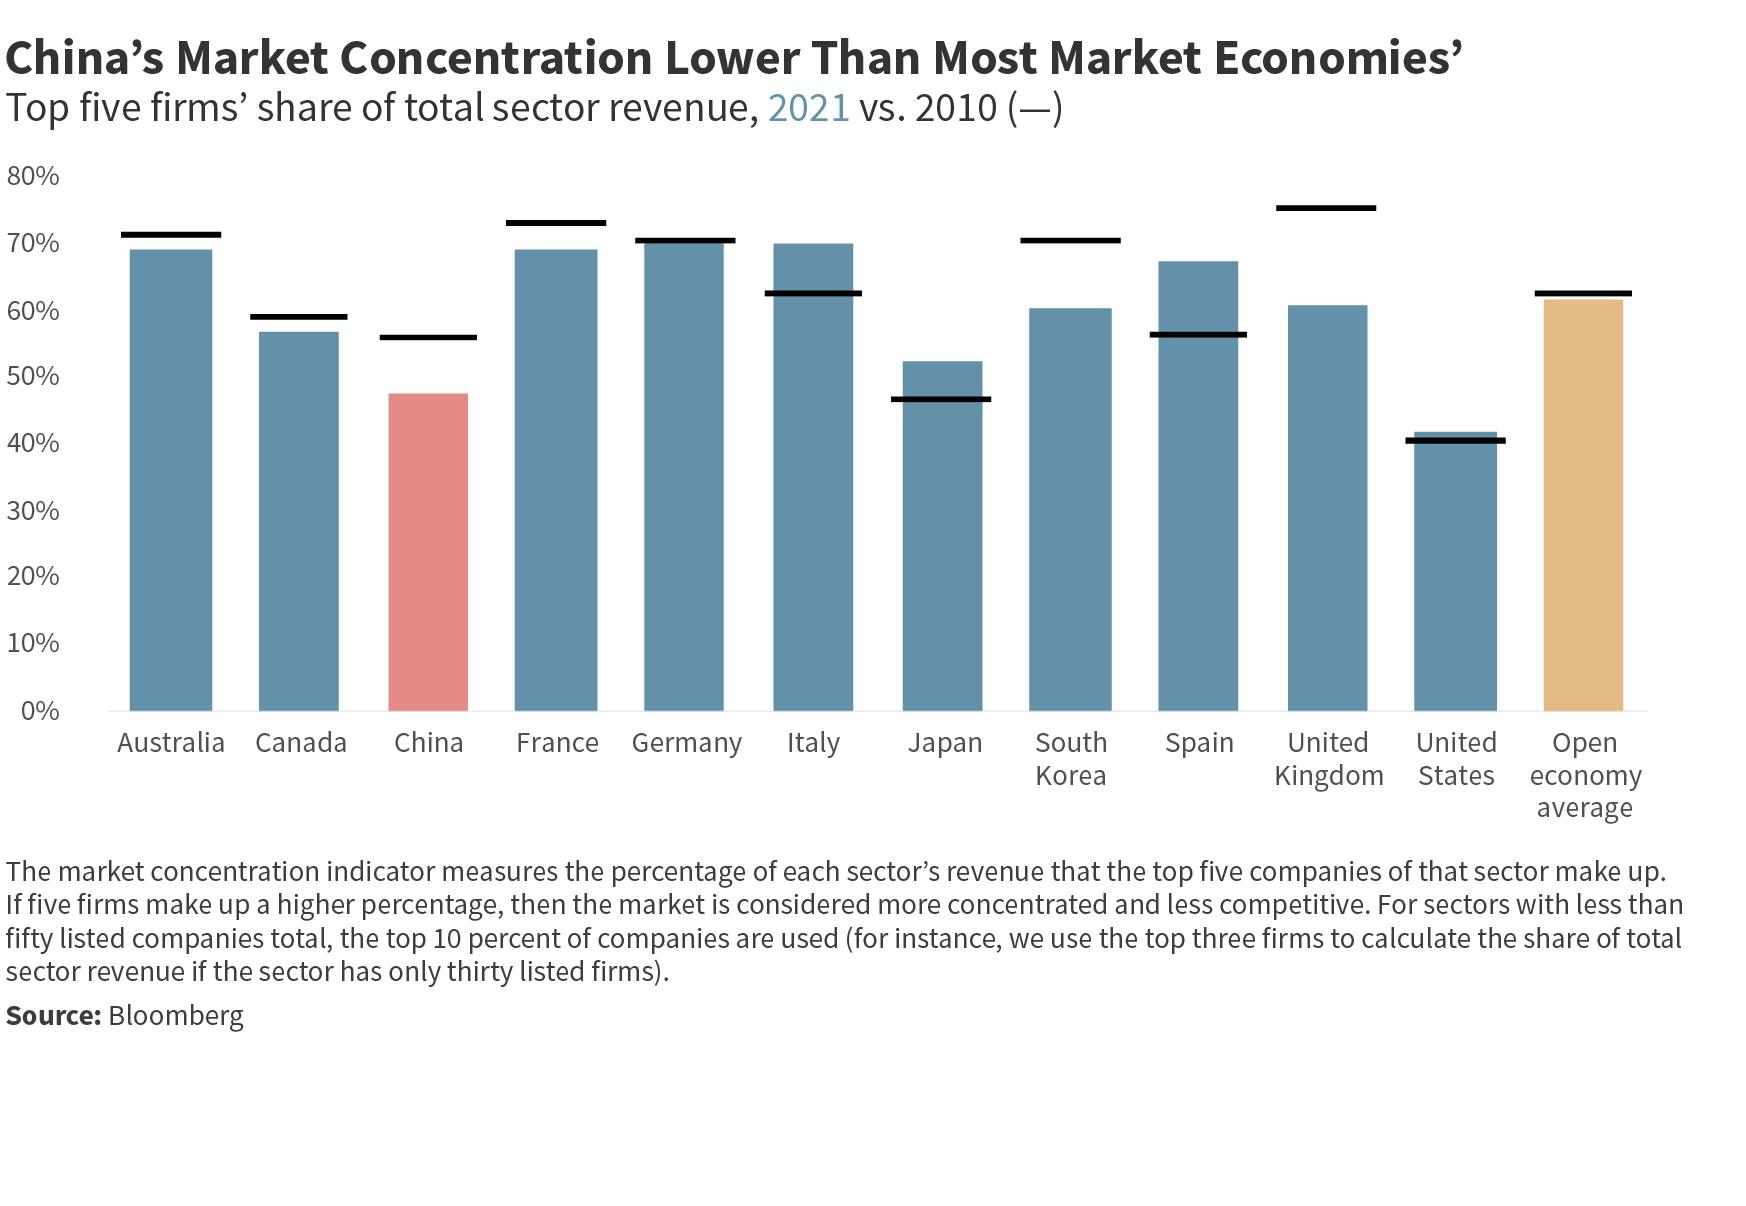
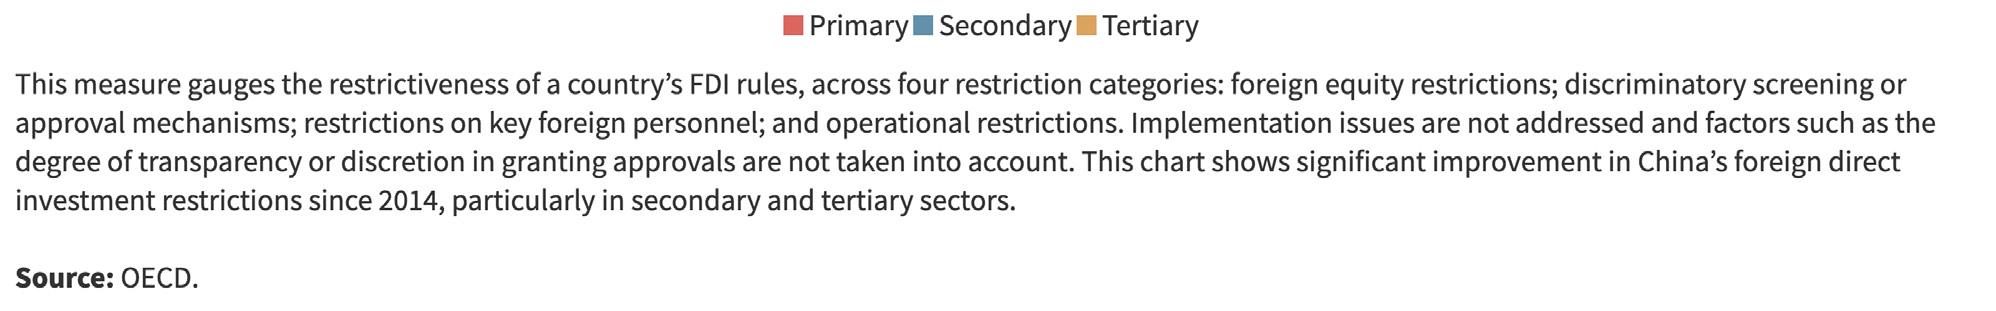
Openness to competition from foreign companies is a charac teristic of open market economies. The OECD’s FDI Regulatory Restrictiveness Index is an established indicator to measure the permissiveness of an economy to foreign competition.10 China scores 0.73 on an inverted scale from 0 (most restrictive) to 1 (least restrictive), which is below the open market-economy average of 0.92. China has improved from its 2010 benchmark score of 0.53, demonstrating significant movement in this area, although this prog ress is industry by industry and not general; an extensive negative list approach is still maintained. China’s FDI restrictions have wors ened marginally since 2020. Market economies’ FDI restrictions have stayed largely the same since 2010. Compared to 2010 FDI restrictions levels, only Australia has increased restrictions in 2020 and then once again in 2021.
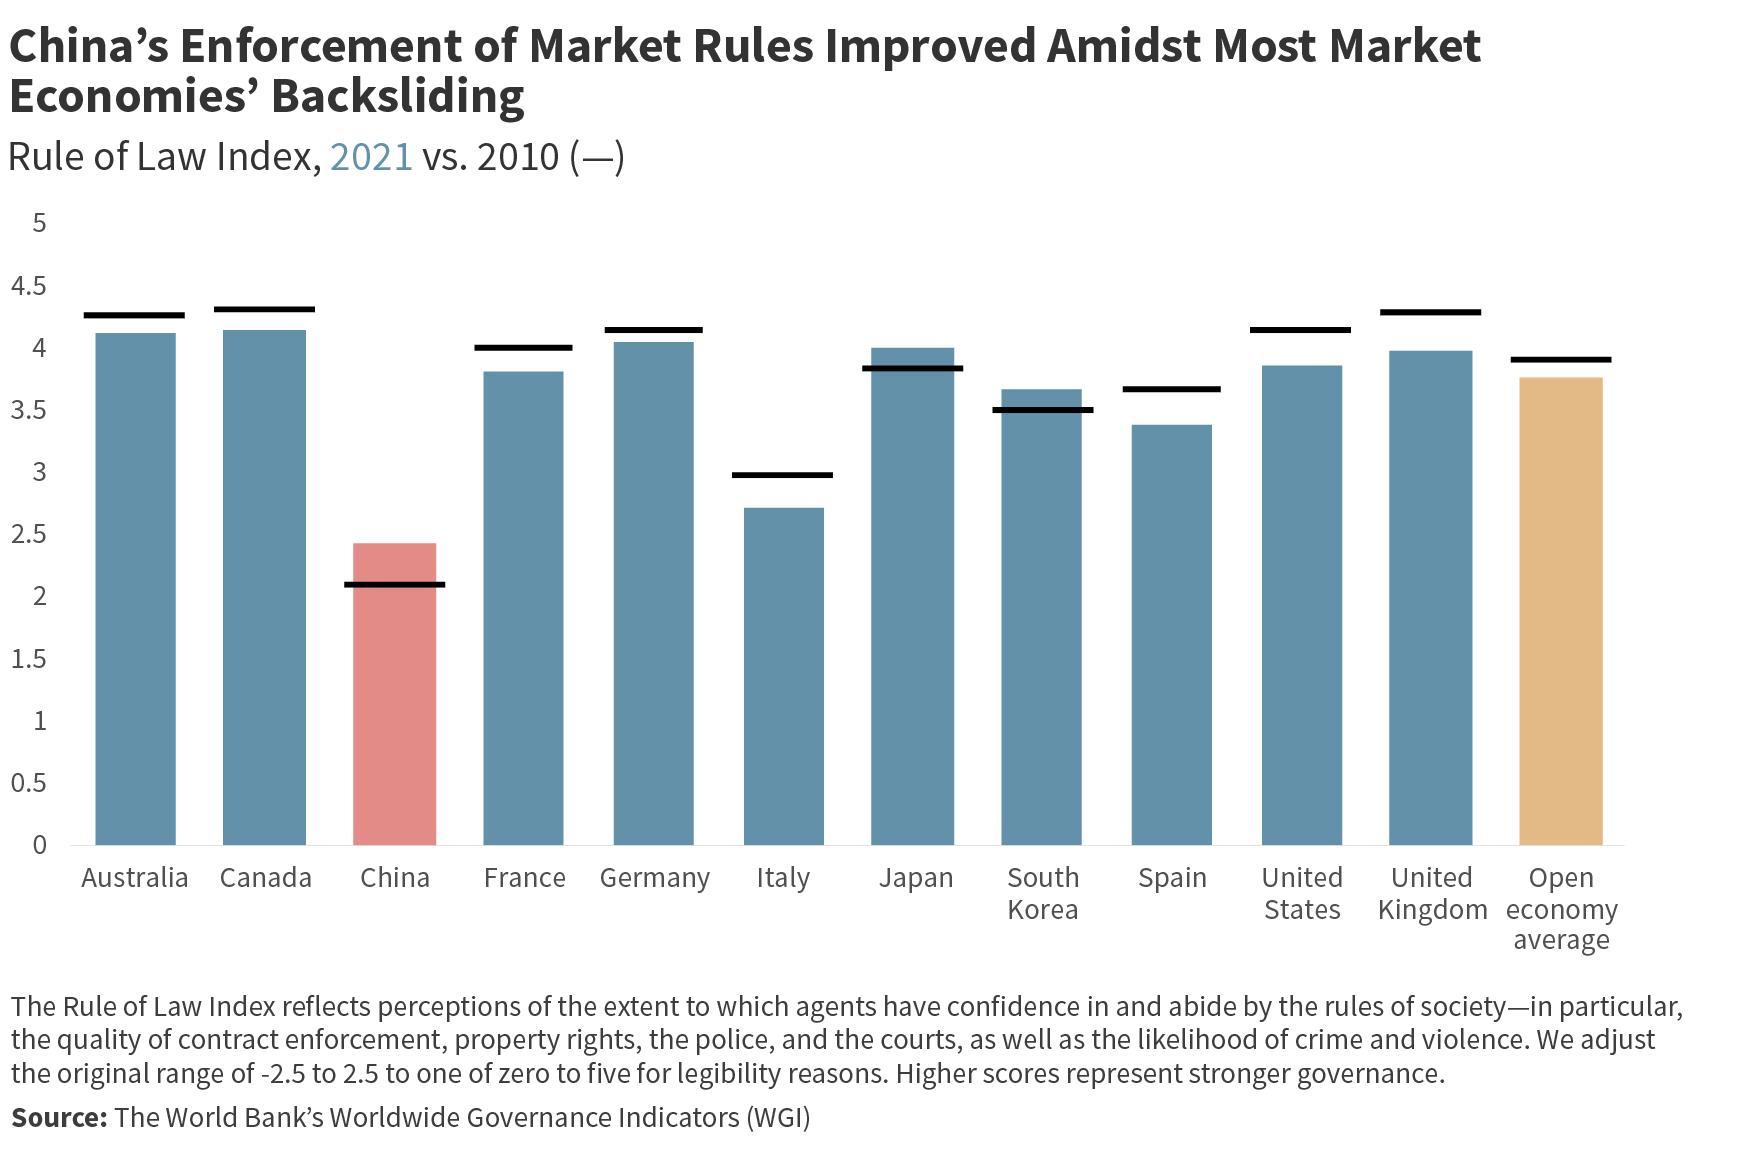
Another key ingredient for a competitive marketplace is fair and impartial enforcement of rules. The World Bank’s Rule of Law Index captures the extent to which agents have confidence in the rules of society, including elements such as the quality of contract enforce ment, property rights, and the courts. Our adjusted index ranges from 0 to 5, with lower values representing less maturation of ruleof-law-based governance. Here China is behind all market econo mies, with a score of 2.44 compared to the open economy average of 3.79. There has been relatively little improvement for China since 2010 compared to other indicators. Interestingly, the data for most of the OECD economies have shown backsliding since 2010. With China slowly moving in the direction of open-market norms and OECD economies slowly regressing from these norms, this indica tor shows both sides contributing to a shrinking gap.
Our Market Competition Composite Index, which represents a nor malized average of these annual indicators, puts China at 2 in 2021, against an open-economy average of 6.92 (Figure 4). This is only a small decrease from its 2020 score of 2.05. While the 2021 evalua tion of China’s market competitiveness shows sizable distance from the other countries in our sample, China has progressed from its 2010 score of 1.4. China has competitive markets in many industries and oligopoly dominance in others, including via state ownership. Contestability of markets and fairness are diminished through lim itations on rule of law. The goal of “competitive neutrality” in regu lation of private and public-sector firms competing in the same seg ments—a crucial outcome at the heart of China’s 2001 World Trade Organization (WTO) accession commitments—is still a distant one.
The composite scores meanwhile show that market competitive ness of top OECD economies is not a constant measure. Almost all these economies received the highest scores for their 2010 market competitiveness and have seen a decline in scores since. Regression on the market competition metrics from 2010 to 2021 was most severe for Italy and Spain, followed by Australia and Canada. Another common trend was marginal decreases in market competitiveness between 2020 and 2021, which occurred for all market economies except for Australia, Germany, and the UK.
While we include a significant share of relevant variables, our data coverage has some weaknesses. One of the most important defi ciencies is the unavailability of internationally comparable robust data quantifying subsidies in China and other economies. We also cannot accurately measure informal barriers to market competi tion—for example, informal discrimination against foreign and pri vate companies, industrial policies, or the presence of Communist Party committees.
We update the abovementioned benchmark indicators yearly to track the pace and direction of change. On a quarterly basis, we take the pulse of various policy reforms that would move China either closer or further from the average of market economies in terms of its competition policy. From this exercise, we have selected the three most significant developments that took place in 2021:
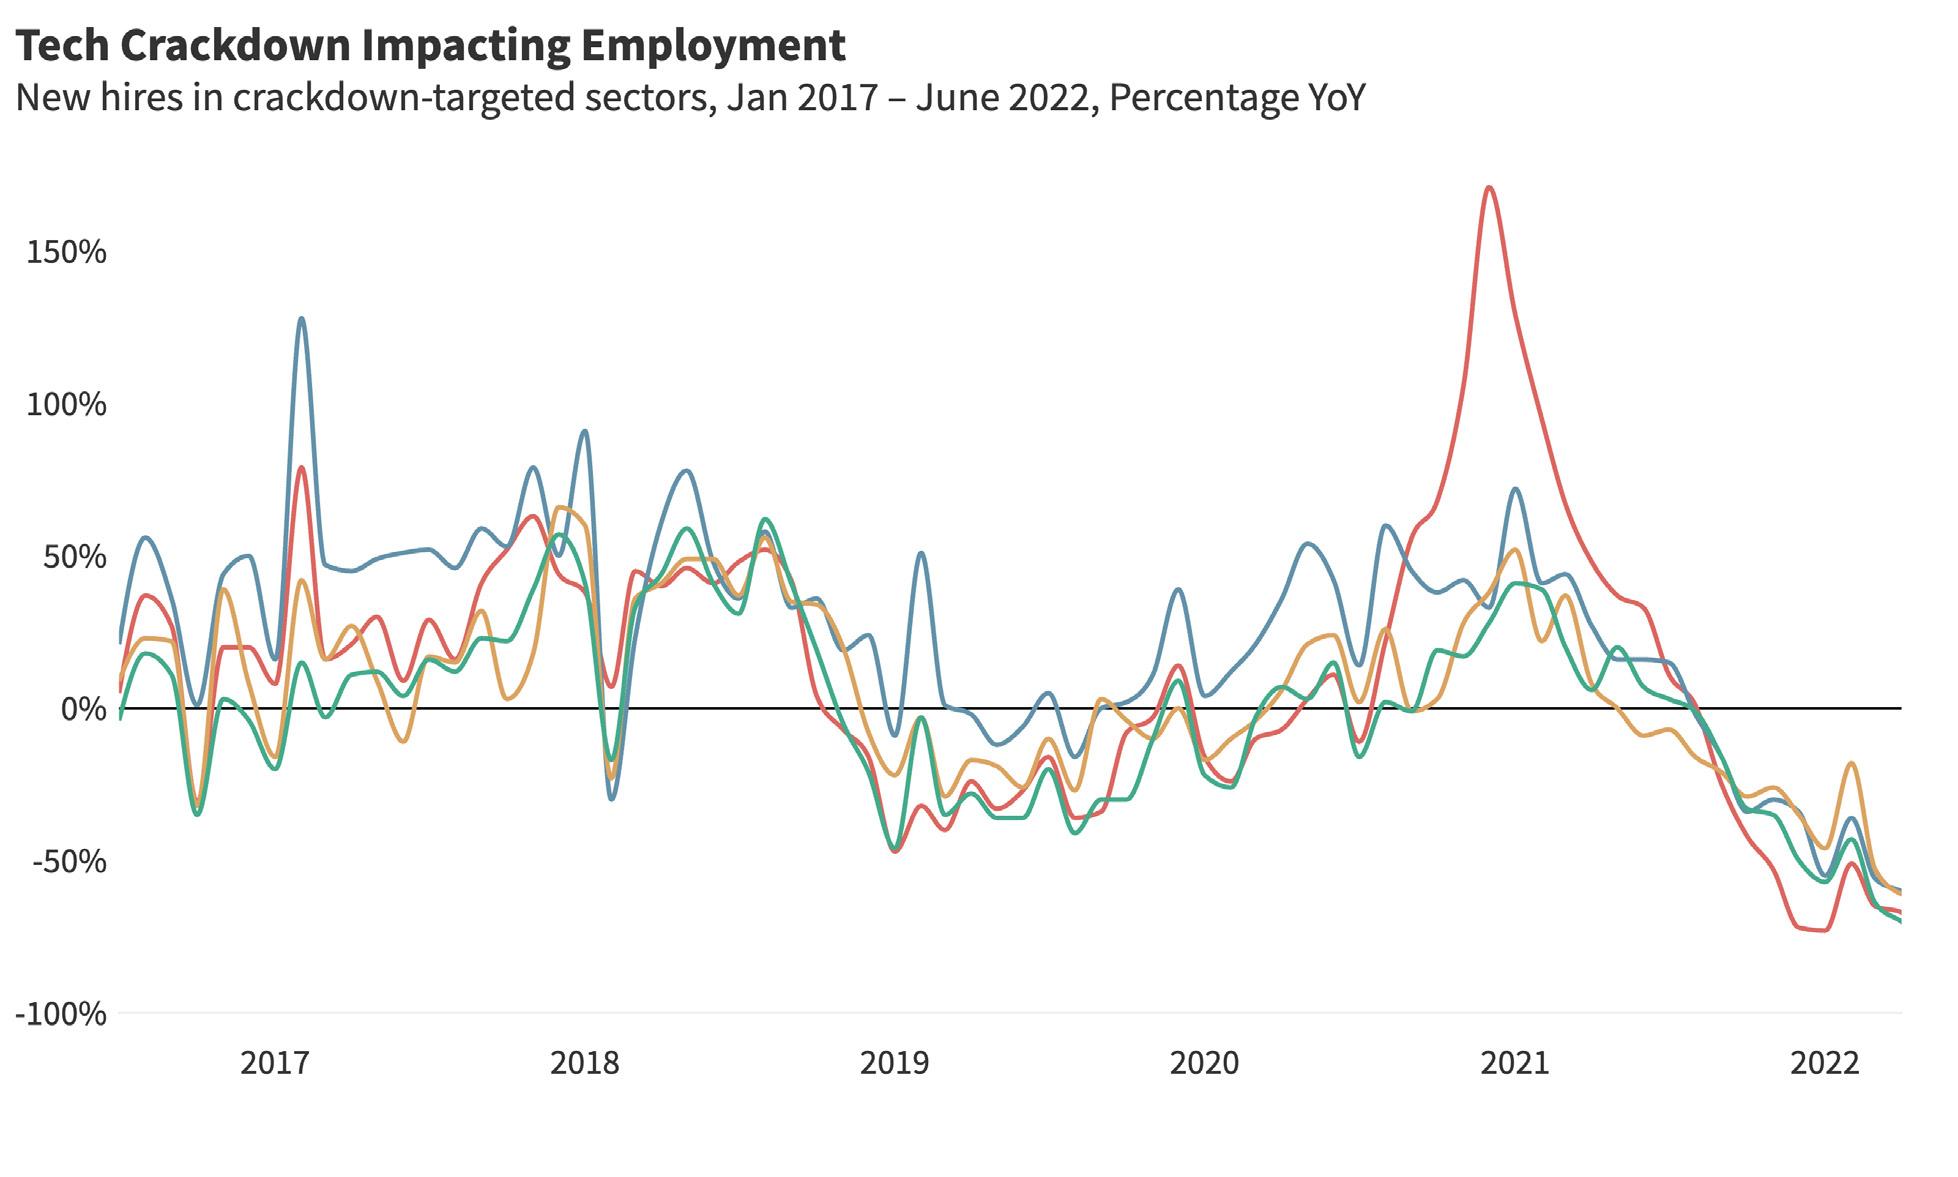
The Chinese government’s systematic crackdown on big tech led to a sell-off that shaved $1.5 trillion or more off the value of technol ogy stocks in 2021. Government actions have included new regula tions; the summoning of executives from the largest firms to instruct them on corporate social responsibility and patriotism; inspections; hefty fines and more. In some instances, enforcement appeared arbitrary, or the degree of implementation created uncertainty in the
market. The effects of the tech crackdown are already showing up in the data: new hiring has fallen sharply in targeted sectors, accom panied by sweeping layoffs. And employment in sectors favored by the government, such as hard-tech, is not compensating for these declines. The micromanaging of certain industries will undermine their dynamism and China’s ability to meet its growth objectives.
With the “double reduction” policy, China’s State Council forced all after-school tutoring companies to become non-profits, devastat ing a sector that was valued at $100 billion in one fell swoop. While some of the private tutoring giants have restructured and are now pursuing other revenue streams, their market capitalizations have not recovered. Many smaller companies have been obliterated. According to data from the Ministry of Education released in early 2022, the number of offline and online private tutoring institutions has been cut by 87 to 92 percent. When an entire sector is wiped away because it fell out of favor with the Chinese government, it gives investors and entrepreneurs in other sectors pause.
Last year, China’s government published a draft amendment to the Anti-Monopoly Law (AML), which could lead to more intervention in the market. The amendment specifically targets the digital econ omy, increases penalties on individuals and businesses that violate the law, and extends the authority of the State Administration for Market Regulation (SAMR) to conduct merger reviews. The change to the AML may lead to a crackdown on problematic practices at Chinese internet giants. But it also gives the Chinese government more leeway to intervene in sectors based on CCP priorities.
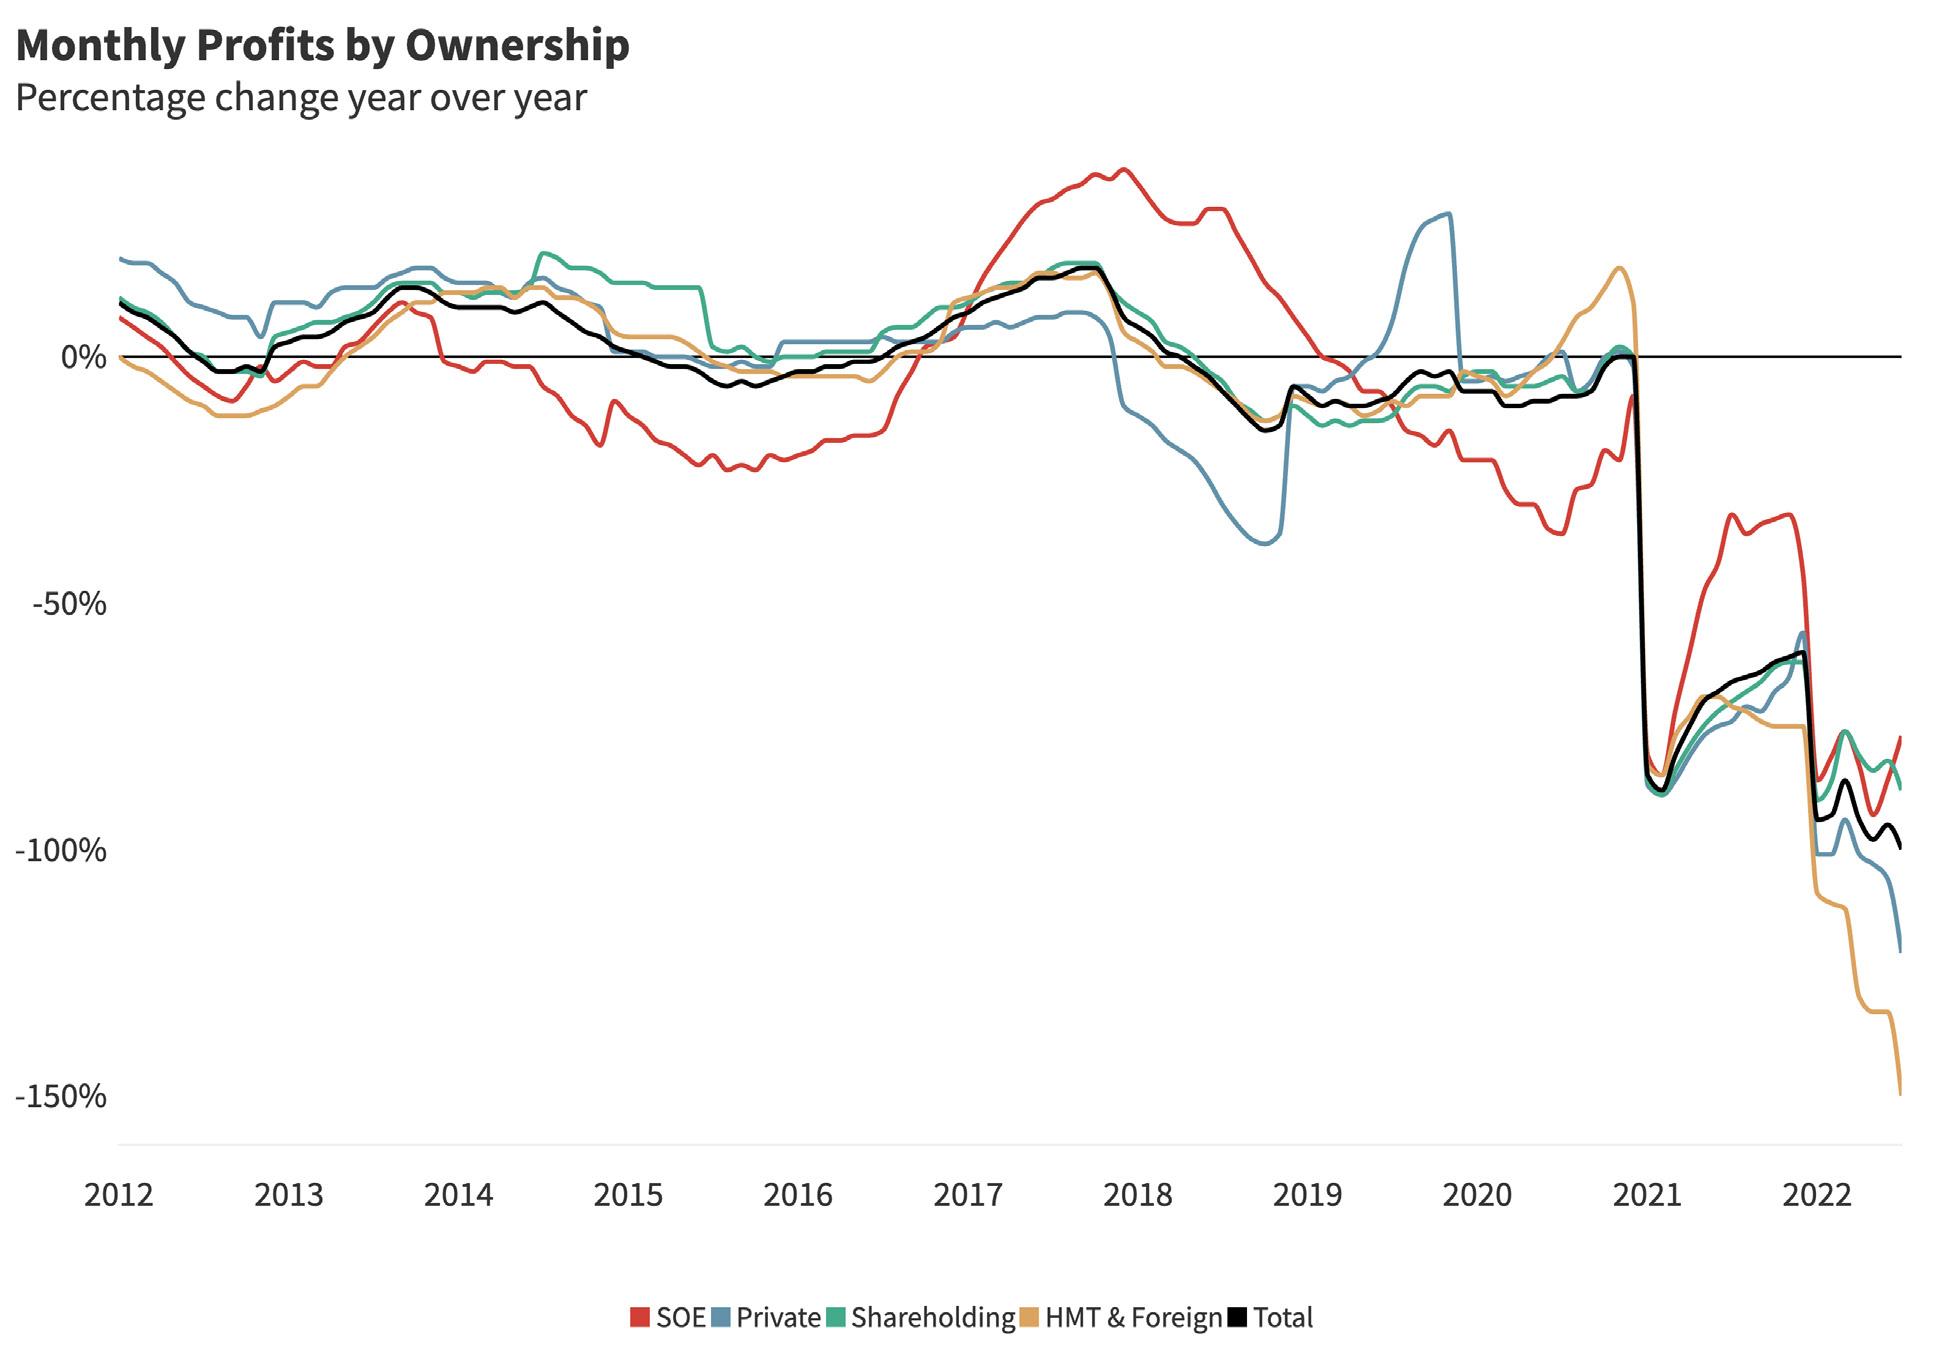
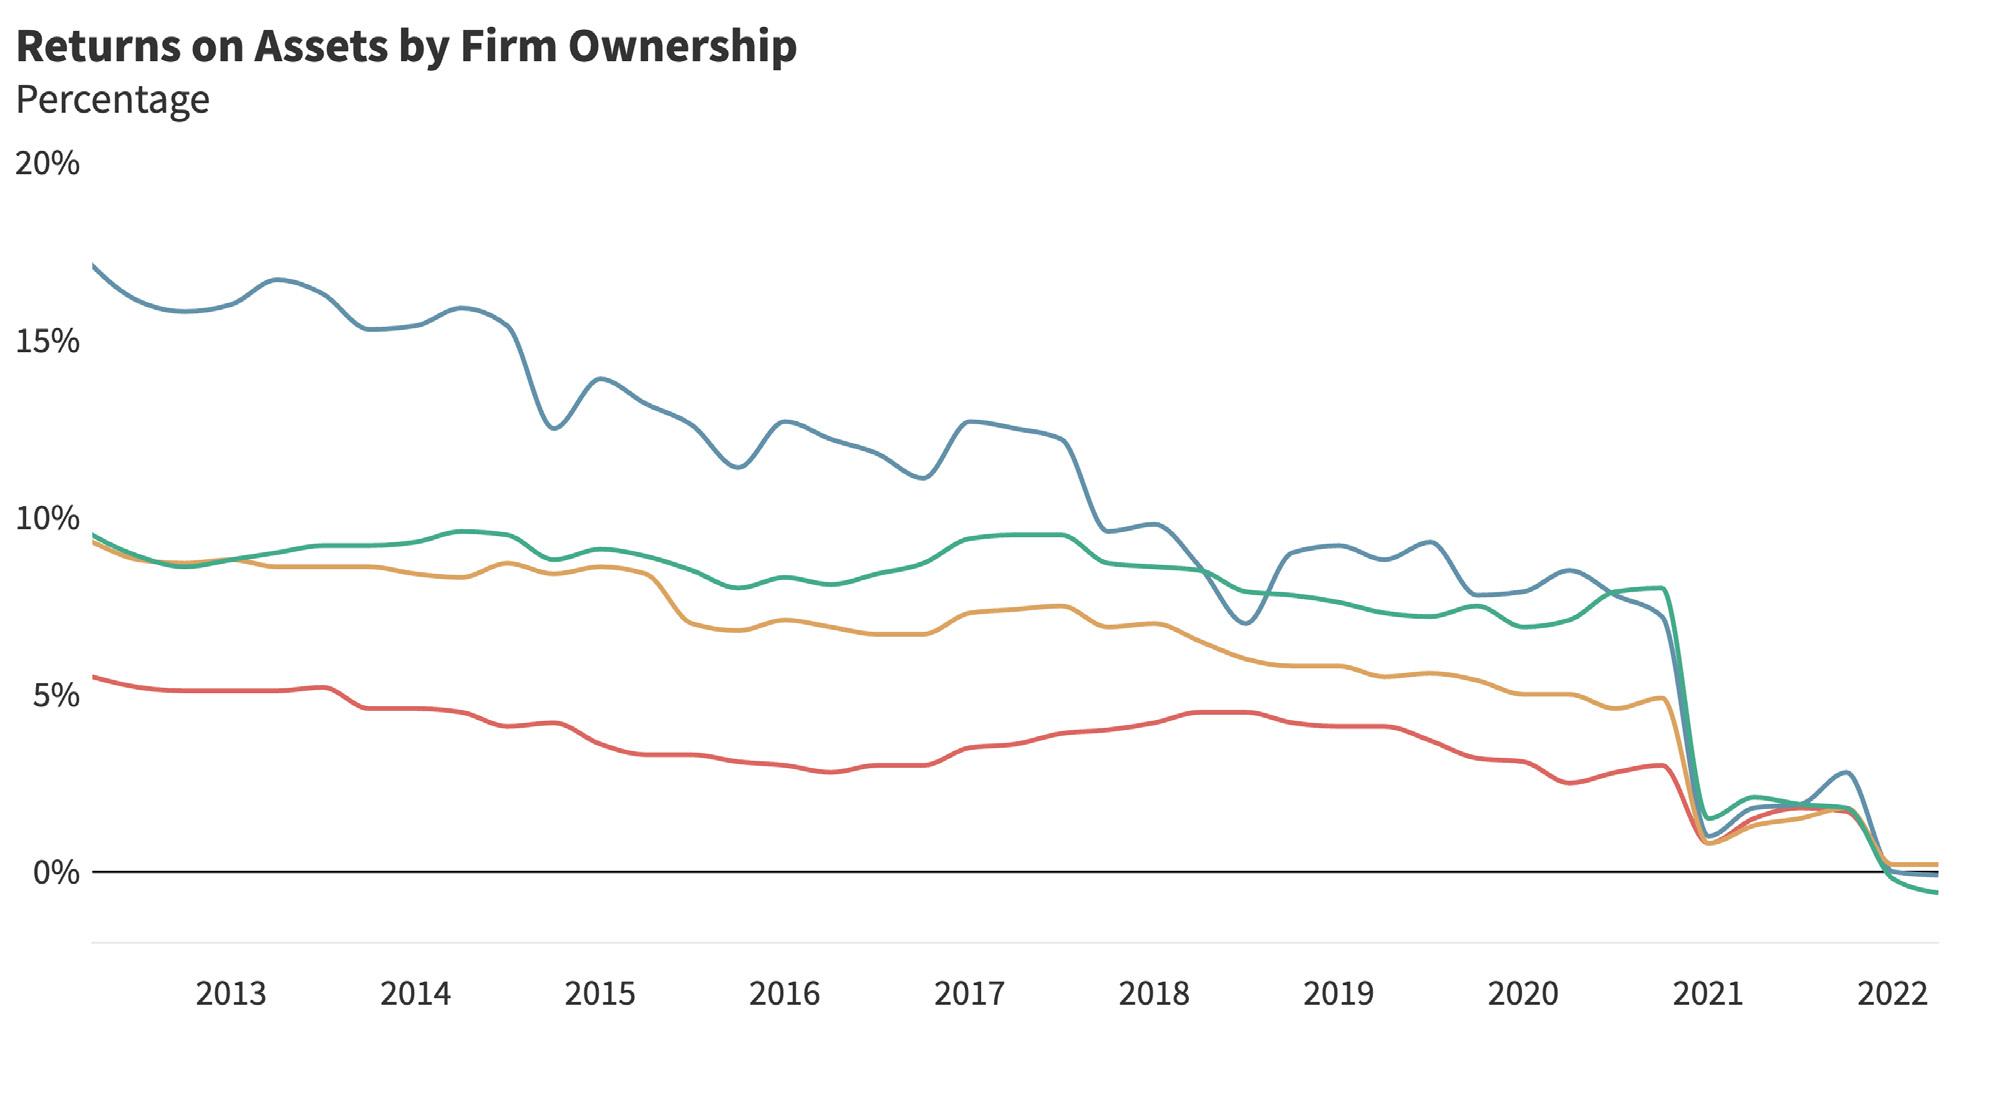
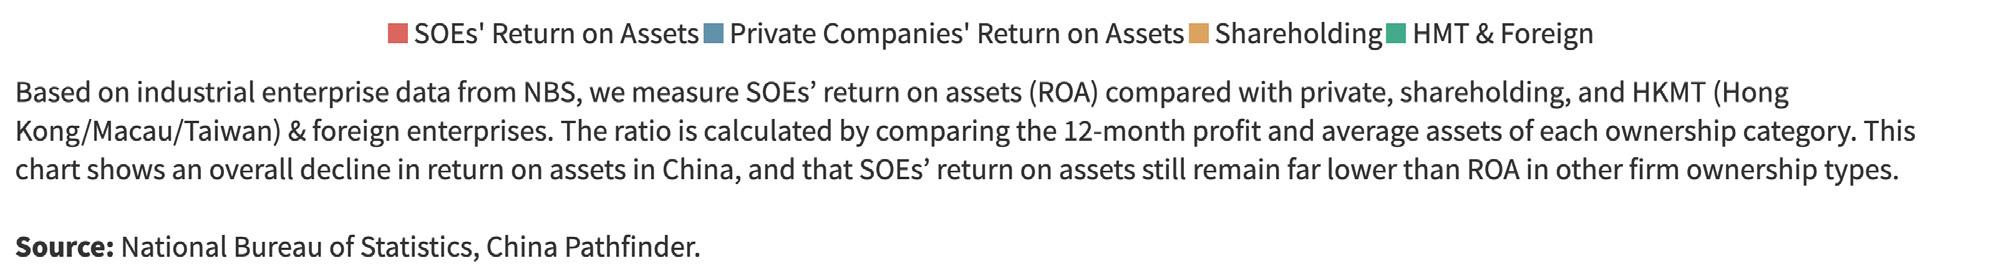
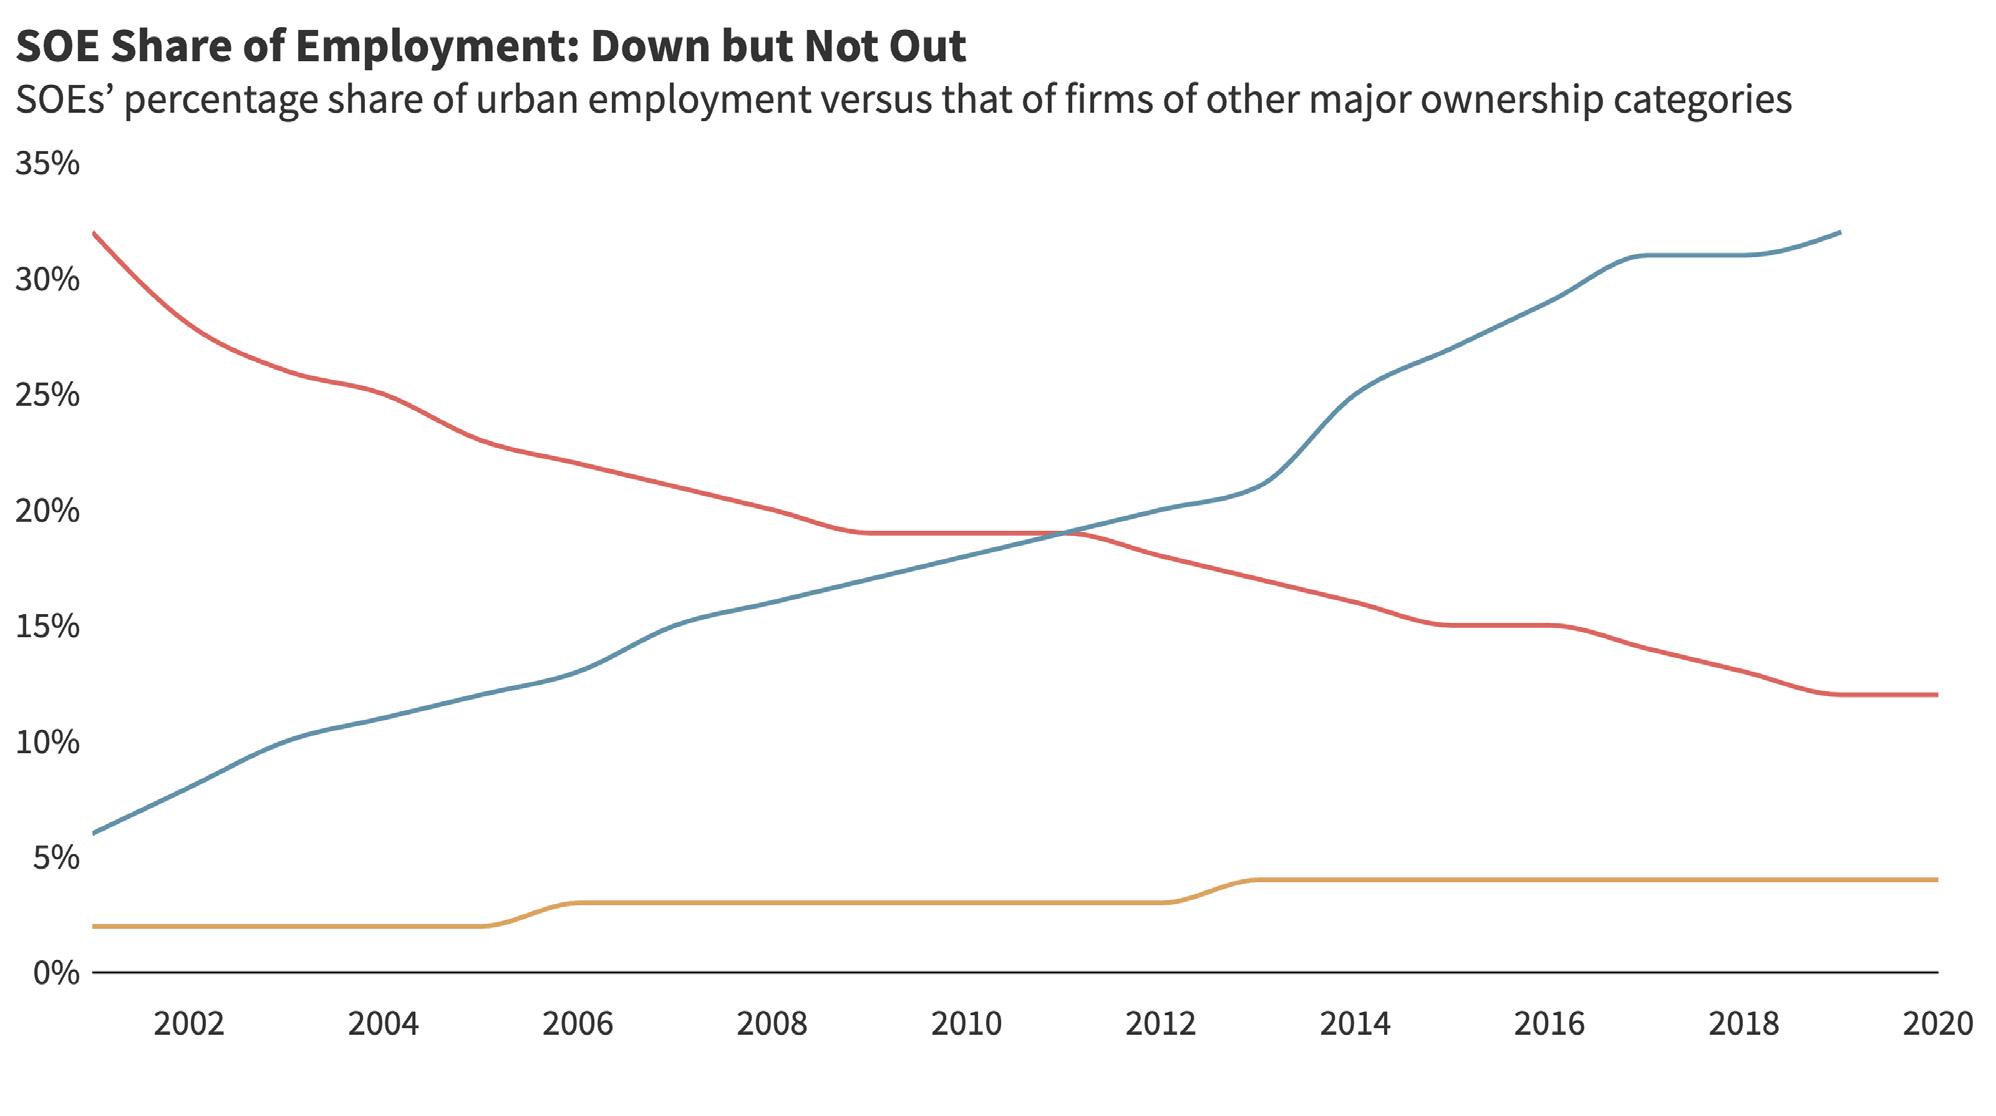
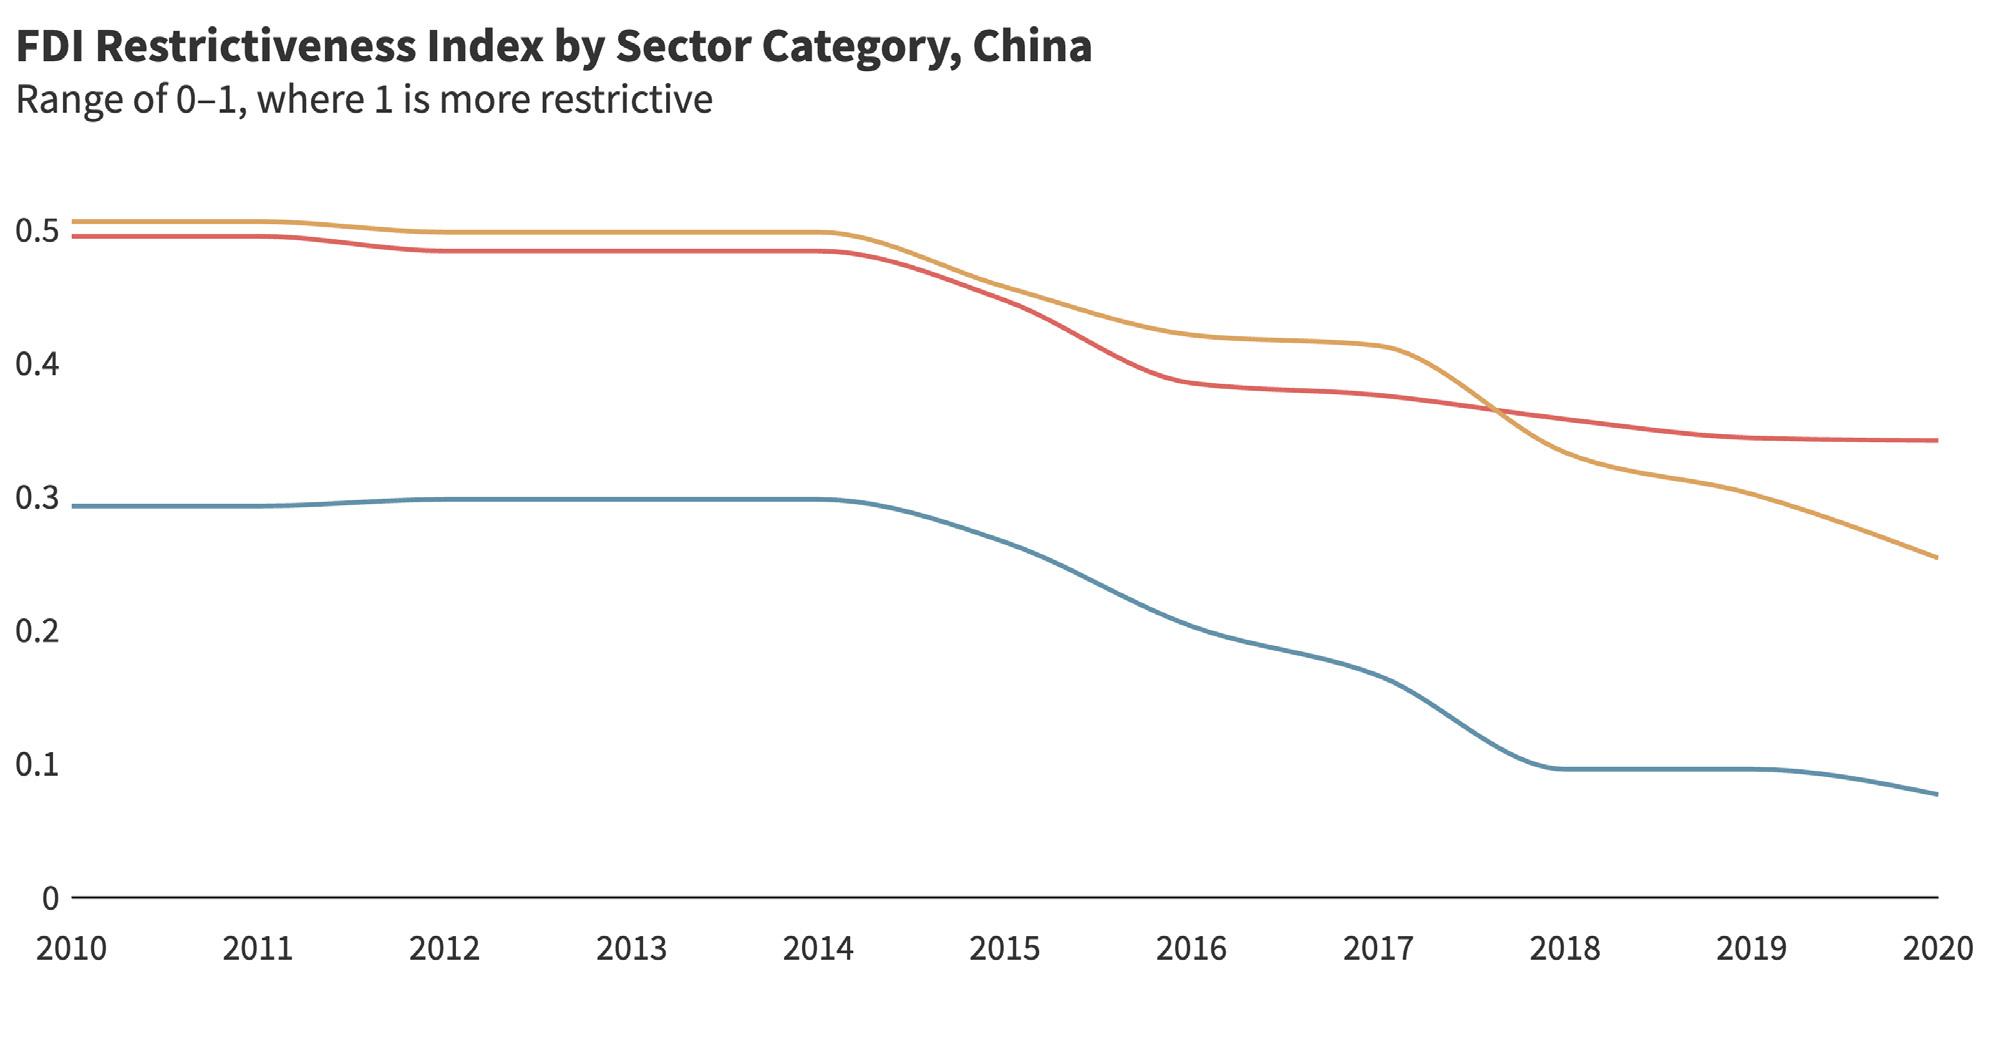
In addition to tracking policy developments, we are also watching higher-frequency, and often China-specific, indicators to gauge realtime progress on market-oriented and liberal economic reforms. These include more granular measures of state ownership in the Chinese economy (such as monthly profits and employment by ownership type and SOE return on assets), and FDI restrictions by sector (Figure 4.2).11
Measure of Innovation Openness
Market economies rely on innovation to drive competition, increase productivity, and create wealth. Innovation system designs vary across countries, but market economies generally employ systems that rely on government funding for basic research but emphasize private sector investment; encourage the commercial application of knowledge through the strong protection of intellectual property rights; and encourage collaboration with and participation of foreign firms and researchers, except in defense-relevant technologies.
We chose the following annual indicators to benchmark China’s track record against open market economies in terms of a modern innovation system.
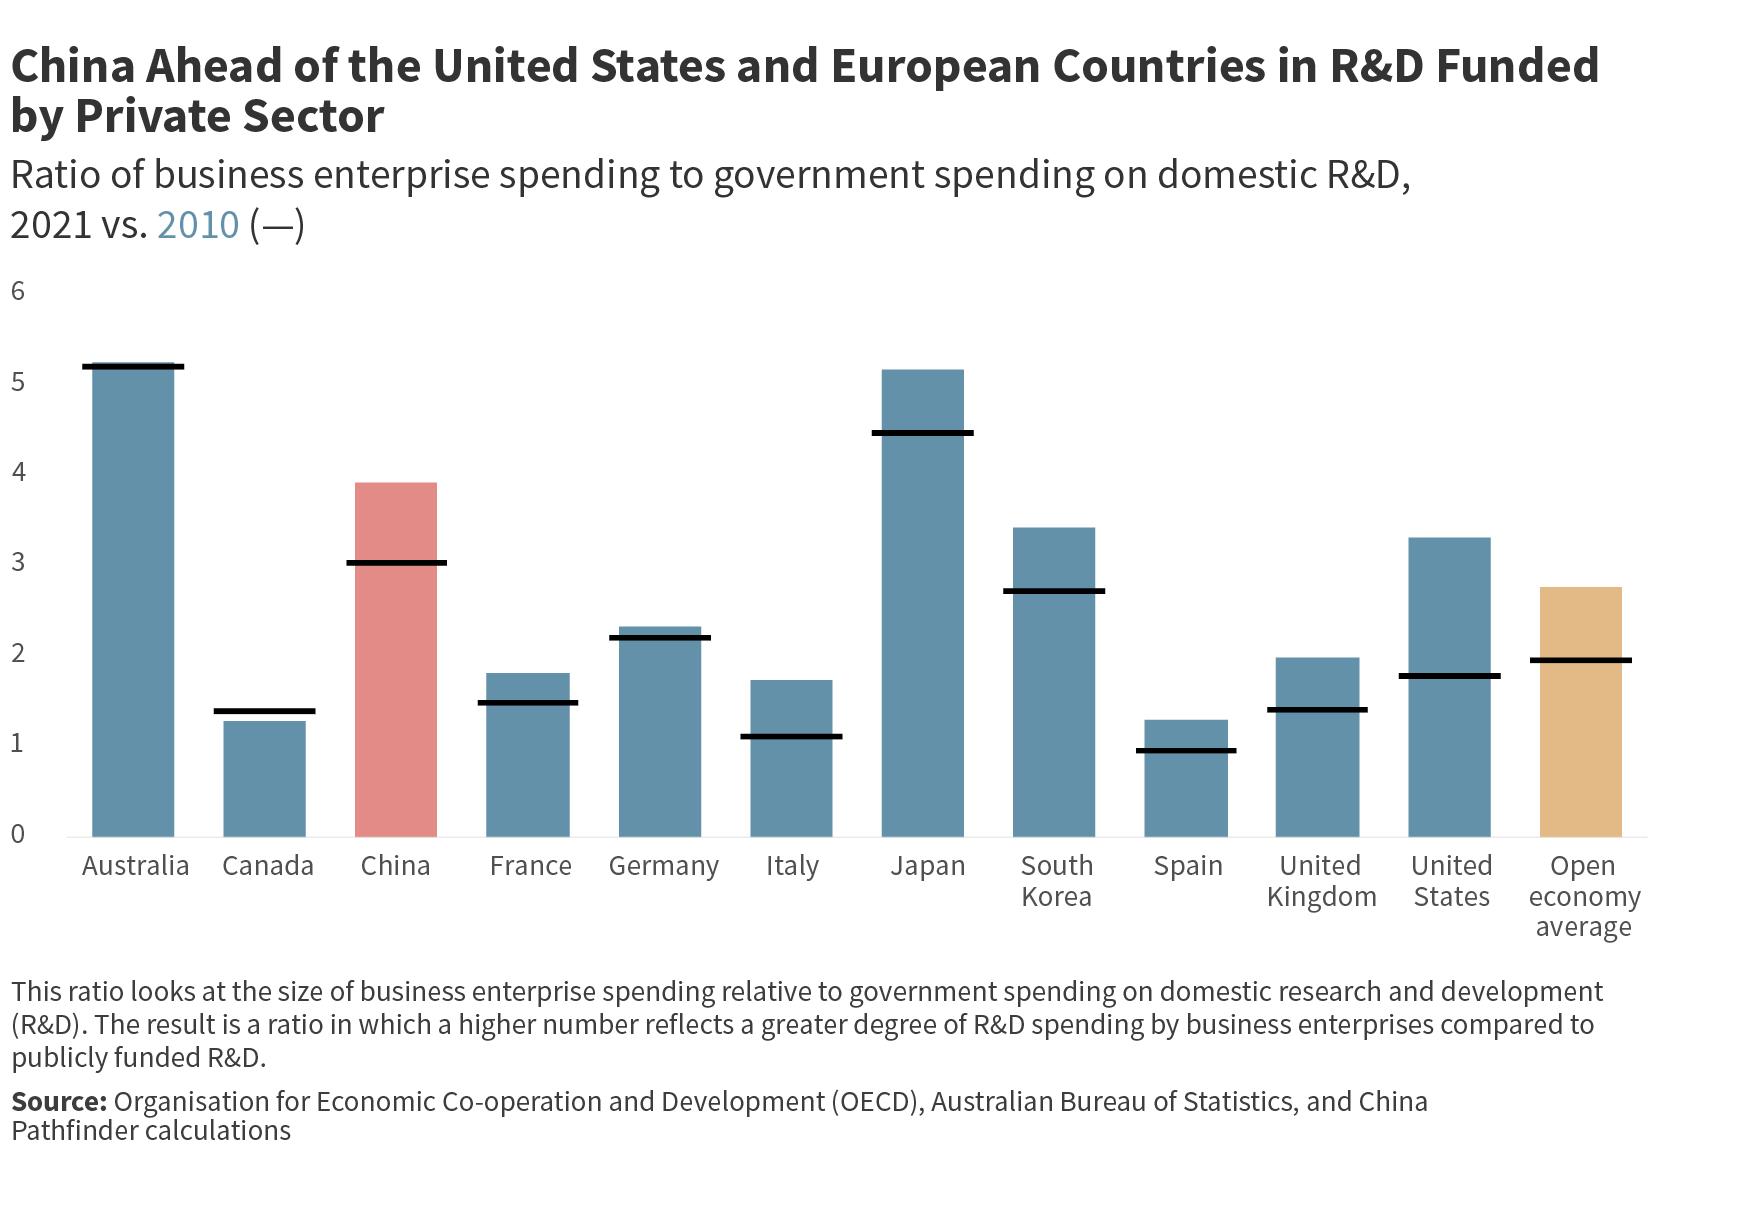
R&D expenditures as a percentage share of GDP is an indicator to measure R&D spending relative to comprehensive economic activ ity across the economies in our sample. Our data show that China modestly increased its relative R&D spending from 1.7 percent in 2010 to 2.4 percent in 2021, but remains below the open-econ omy average and significantly below high-tech powerhouses such as South Korea, Japan and the United States. Notably, these mar ket economies also experienced the highest increases in R&D
spending as a share of their GDPs since 2010. For instance, in 2021 South Korea’s R&D spending had increased 45 percent from its 2010 levels. However, high levels of R&D spending alone do not always signal a productive use of capital in generating more innova tion. China is a cardinal example of this, with some industries, such as commercial aviation, exhausting extensive resources over twenty years—with little innovative development.
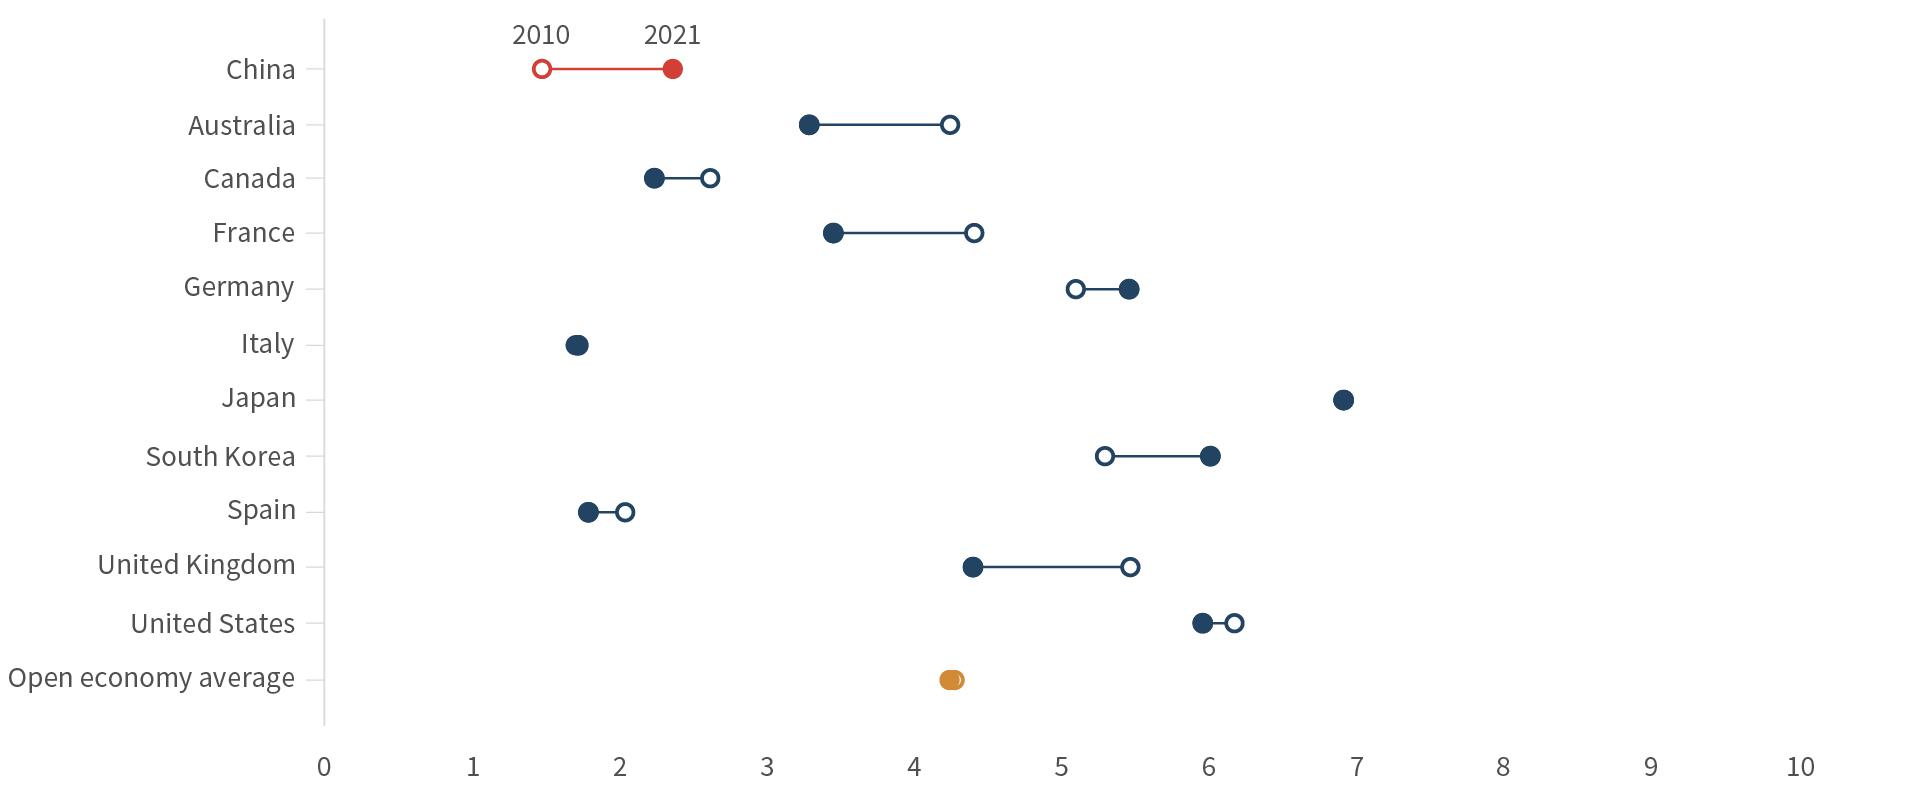
Acknowledging the caveat in using R&D expenditures to approxi mate innovation, we also look at venture capital investment as a share of GDP. Venture capital plays a key role in innovation-driven entrepreneurship and shows the confidence of private sector inves tors in an economy’s ability to catalyze disruptive new technolo gies.12 The United States has long dominated global venture capital, but data show the United Kingdom and South Korea beginning to catch up in recent years. One of the most important new recipients of global venture financing was China, which is evident in the big leap from 2010 to 2021. However, state investment remains a major driver of venture capital in China (through government guidance funds and similar vehicles) and the recent crackdown on technology firms and overseas IPOs may further reduce enthusiasm of private and foreign investors for Chinese technology startups. Pressure from the US related to semiconductors and other national securi ty-linked industries is also contributing to the waning enthusiasm.
12 Tristan L. Botelho, Daniel Fehder, and Yael Hochberg, “Innovation-Driven Entrepreneurship,”
Working Paper 28990, National Bureau of Economic Research, 2021, https://www. nber.org/system/files/working_papers/w28990/w28990.pdf.
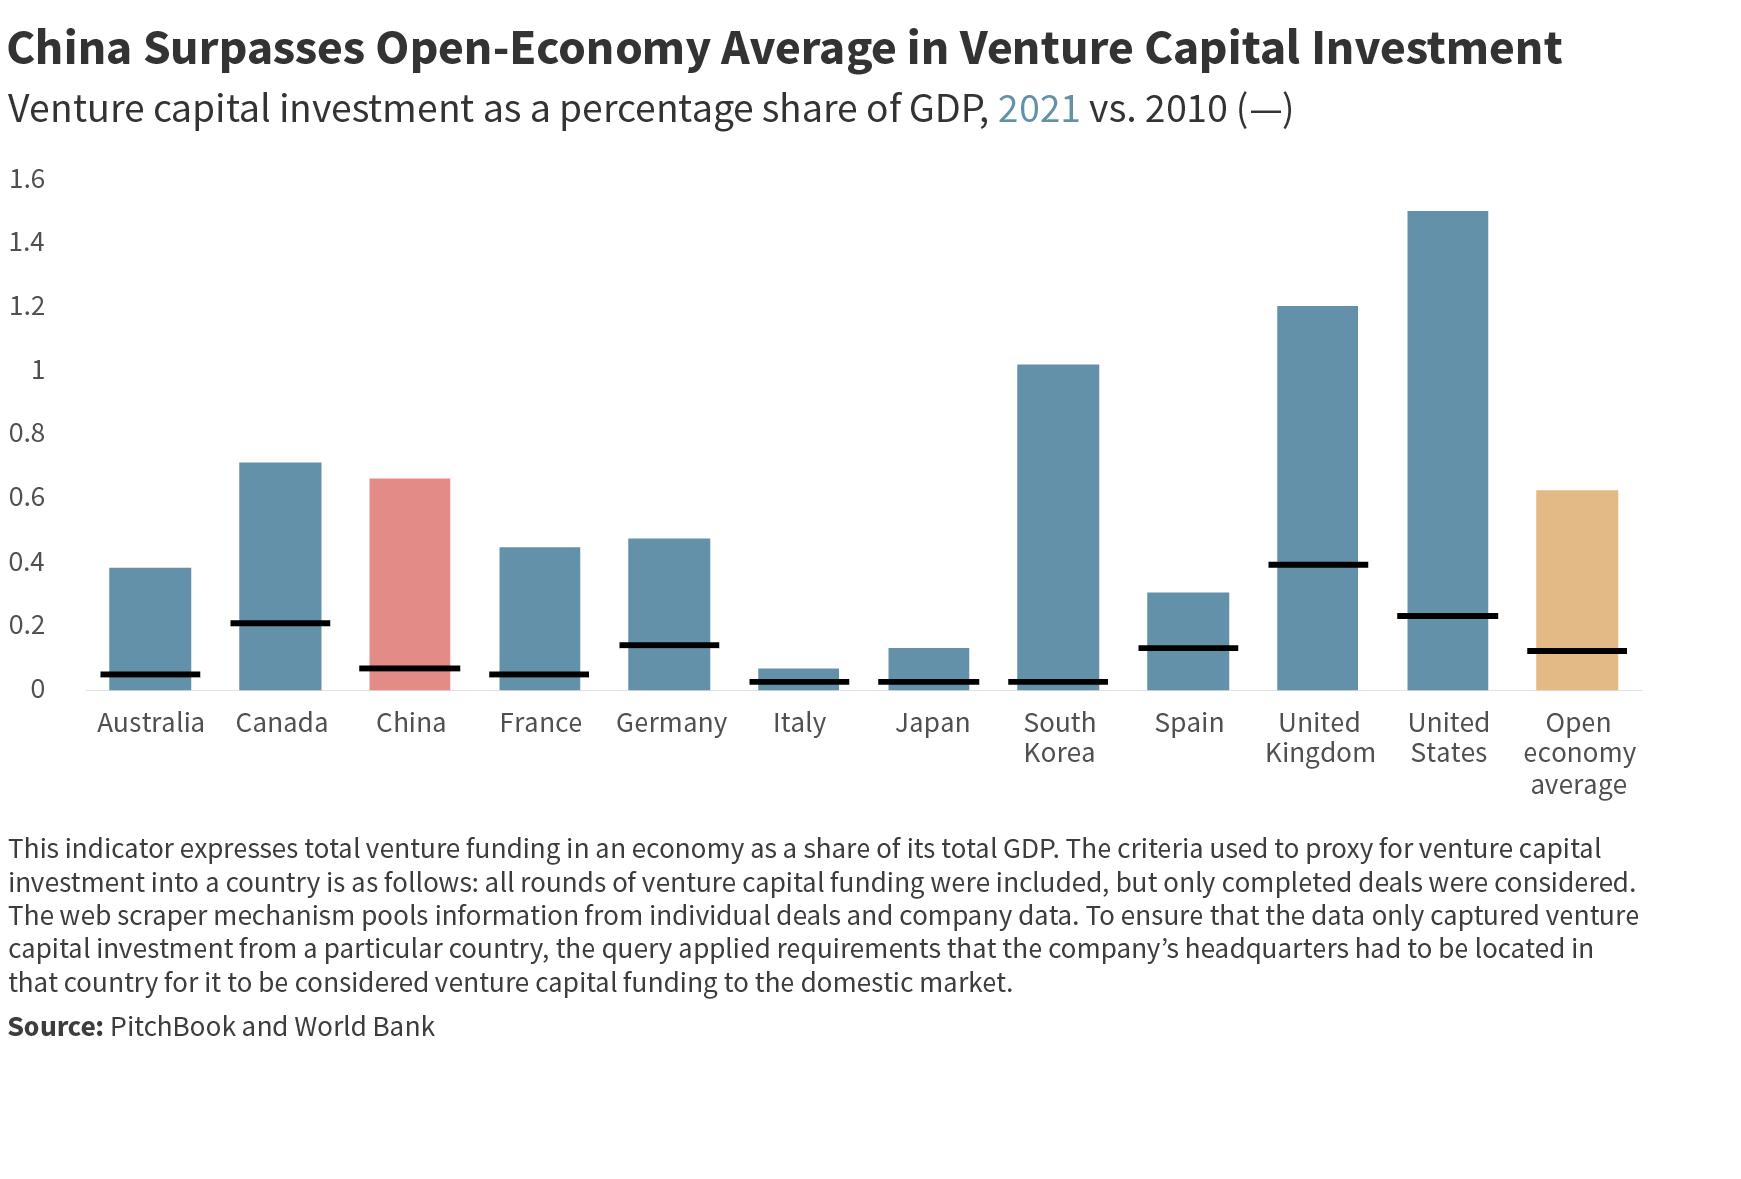
The ratio of business enterprise spending to government spending on domestic R&D captures the role of private enterprises relative to the state in innovation. China has improved dramatically since 2010 and scores higher than the open-economy average. Most mar ket economies have increased private spending relative to state spending since 2010, though France, Italy, Spain, and Canada still trail far behind China when using this indicator data. China’s ratio further improved from 2020 to 2021. However, this indicator only accounts for direct government expenditures for innovation, does not measure subsidies and other financial flows into innovation (such as government guidance funds), and undercounts the level of total government spending on innovation in China.
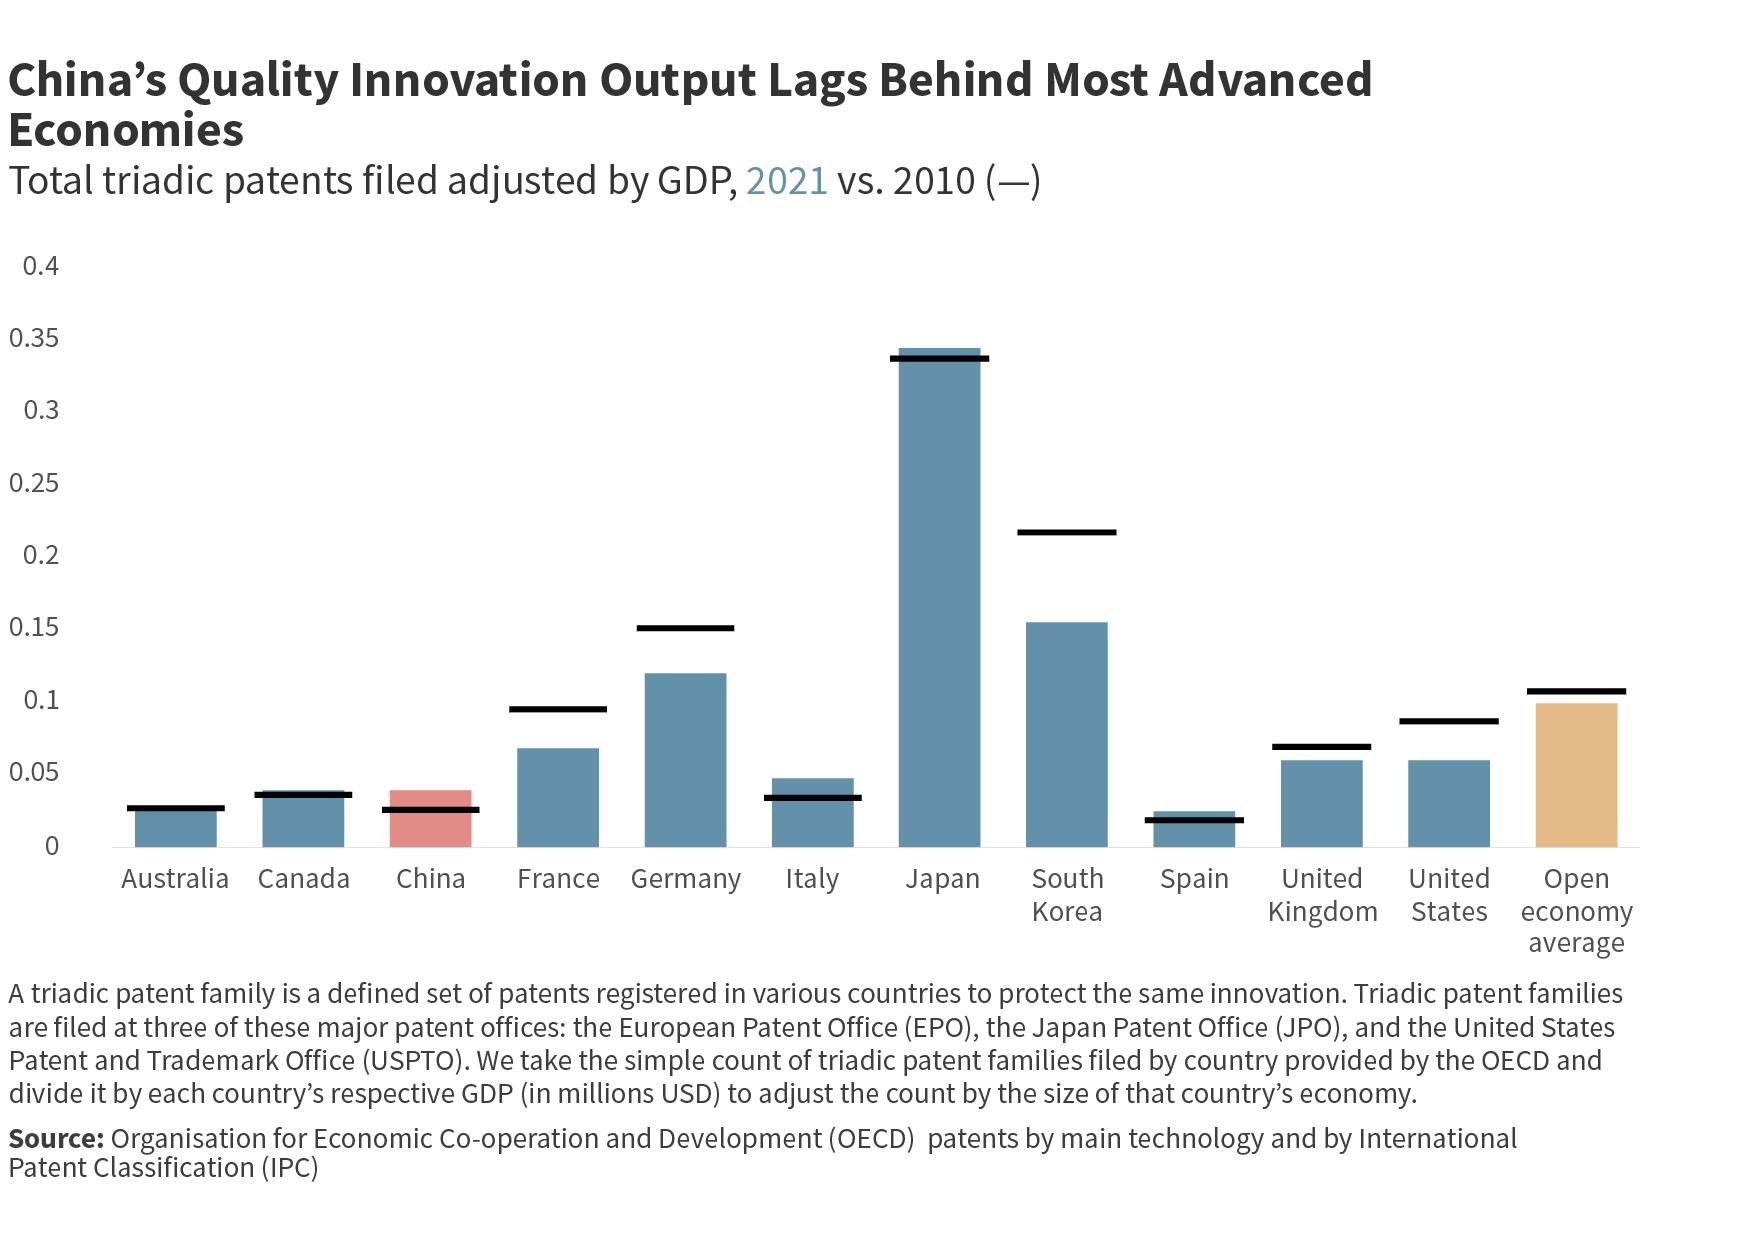
As an indicator for the quality of innovation output, we use the number of triadic patent families filed, controlled for GDP. Triadic patent families are corresponding patents filed at the European Patent Office, the United States Patent and Trademark Office, and the Japan Patent Office. They are generally considered higher qual ity patents and, thus, offer a better perspective than purely looking at the number of patents. China has filed more triadic patent fami lies in 2021 compared to 2010, but the progress is only incremen tal. China’s innovative quality, as measured by this indicator, falls far below the open-economy average, which contrasts sharply with China’s top global position in the count of overall patents filed.
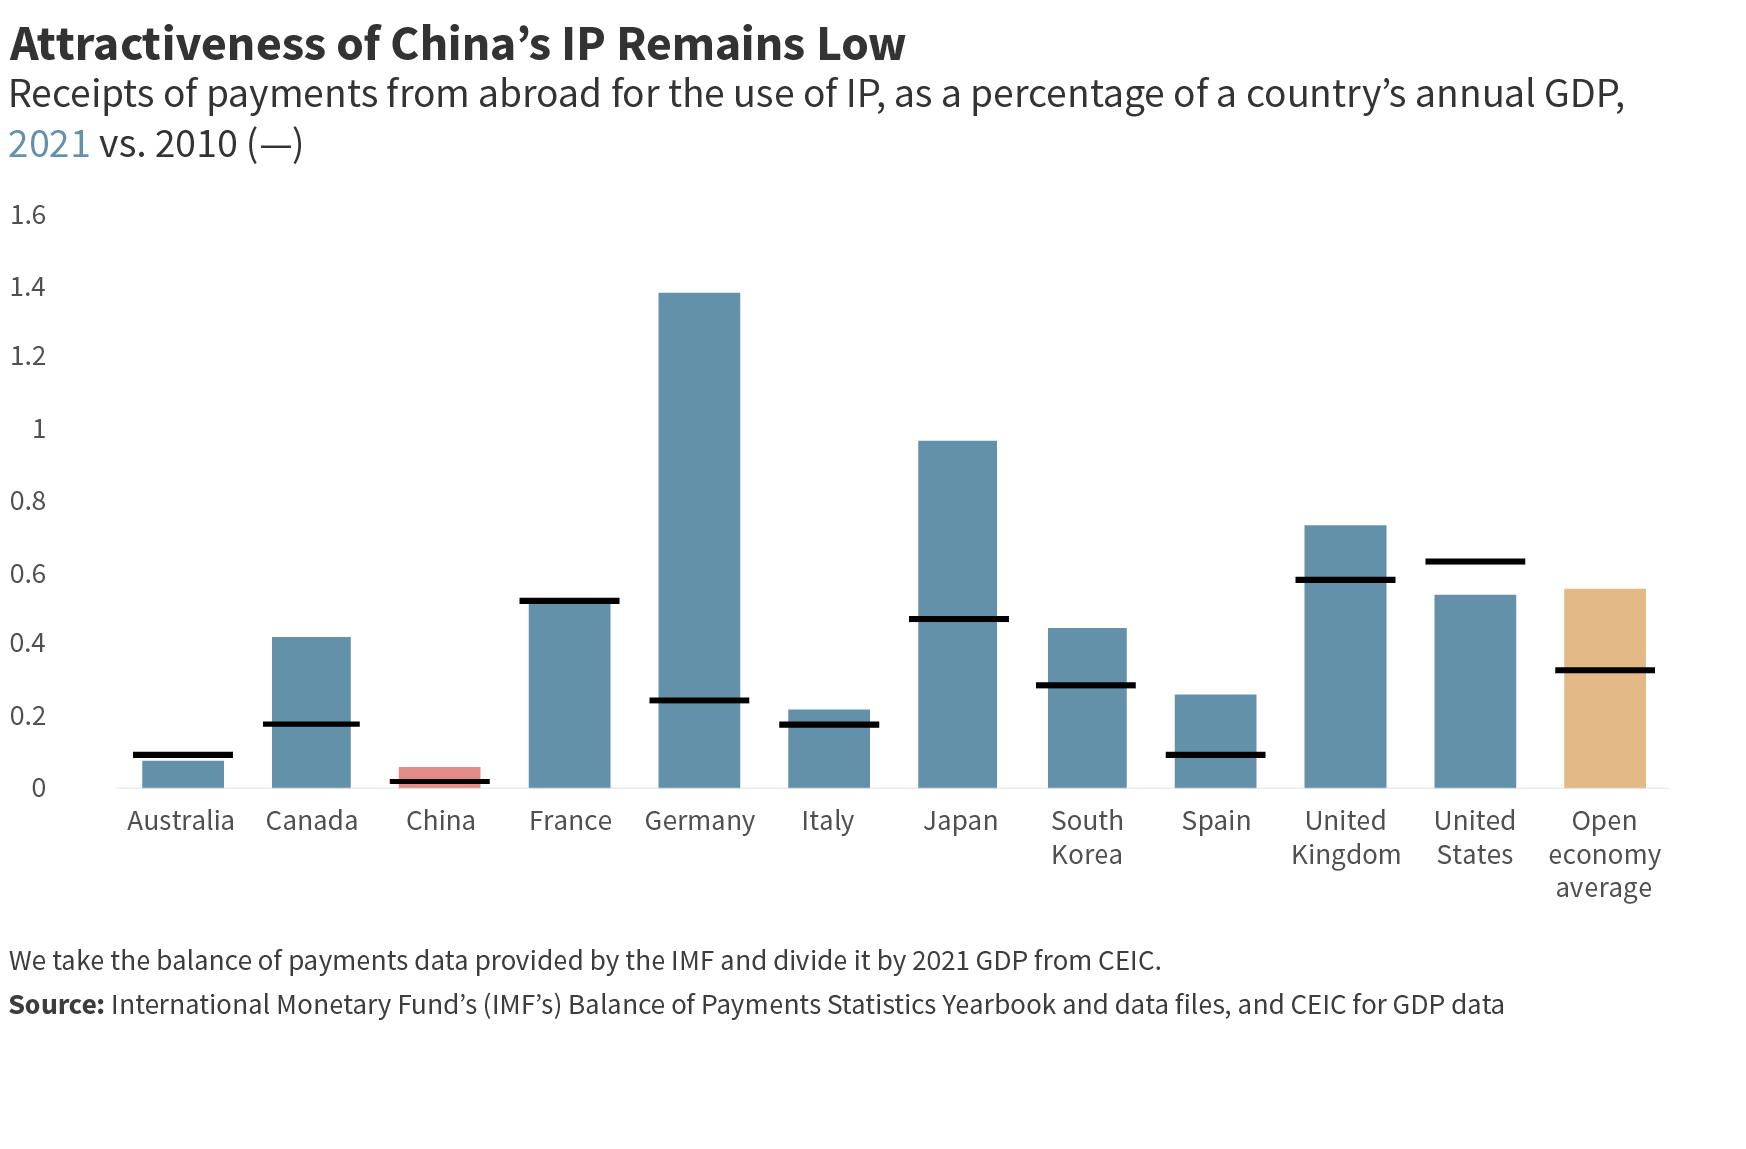
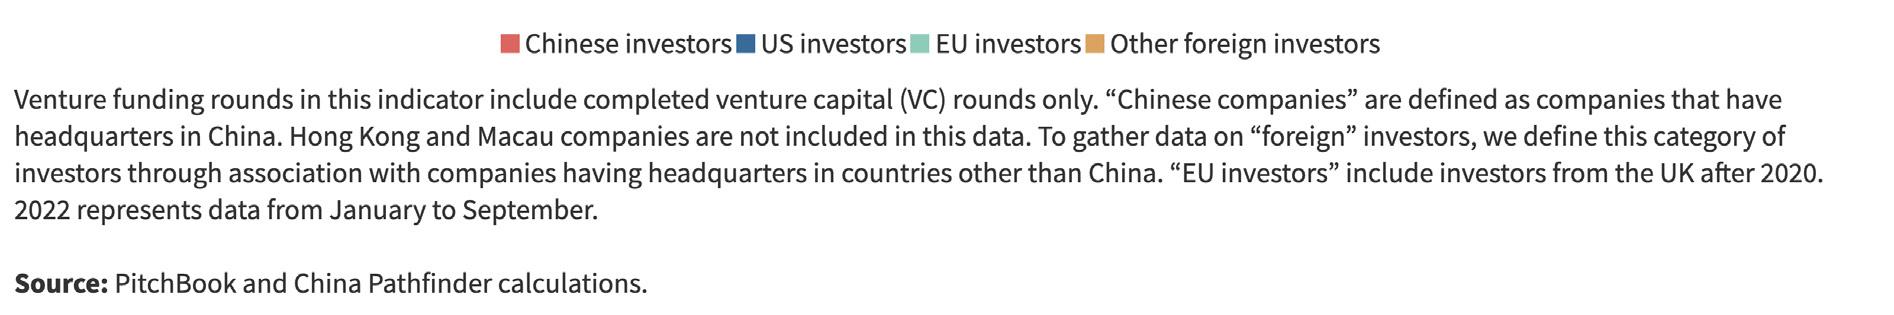
Another proxy for a country’s innovation output quality and global relevance is receipts for payments from abroad for the use of intellectual property (IP). Controlled for GDP, this indicator offers perspective on the relative attractiveness of national IP to other nations. China ranked last in this indicator for 2010, 2020, and 2021, illustrating that rapid growth of patents in China has, thus far, failed to generate internationally attractive IP. One caveat for this indica tor is that some of the input data may be subject to distortions from international tax optimization practices and balance-of-payments data quality problems. OECD countries such as Germany, Japan, and Canada have seen sizable increases in receipts for IP as a share of GDP since 2010, while the US has seen nearly a 15 percent decrease in 2021 compared to 2010.
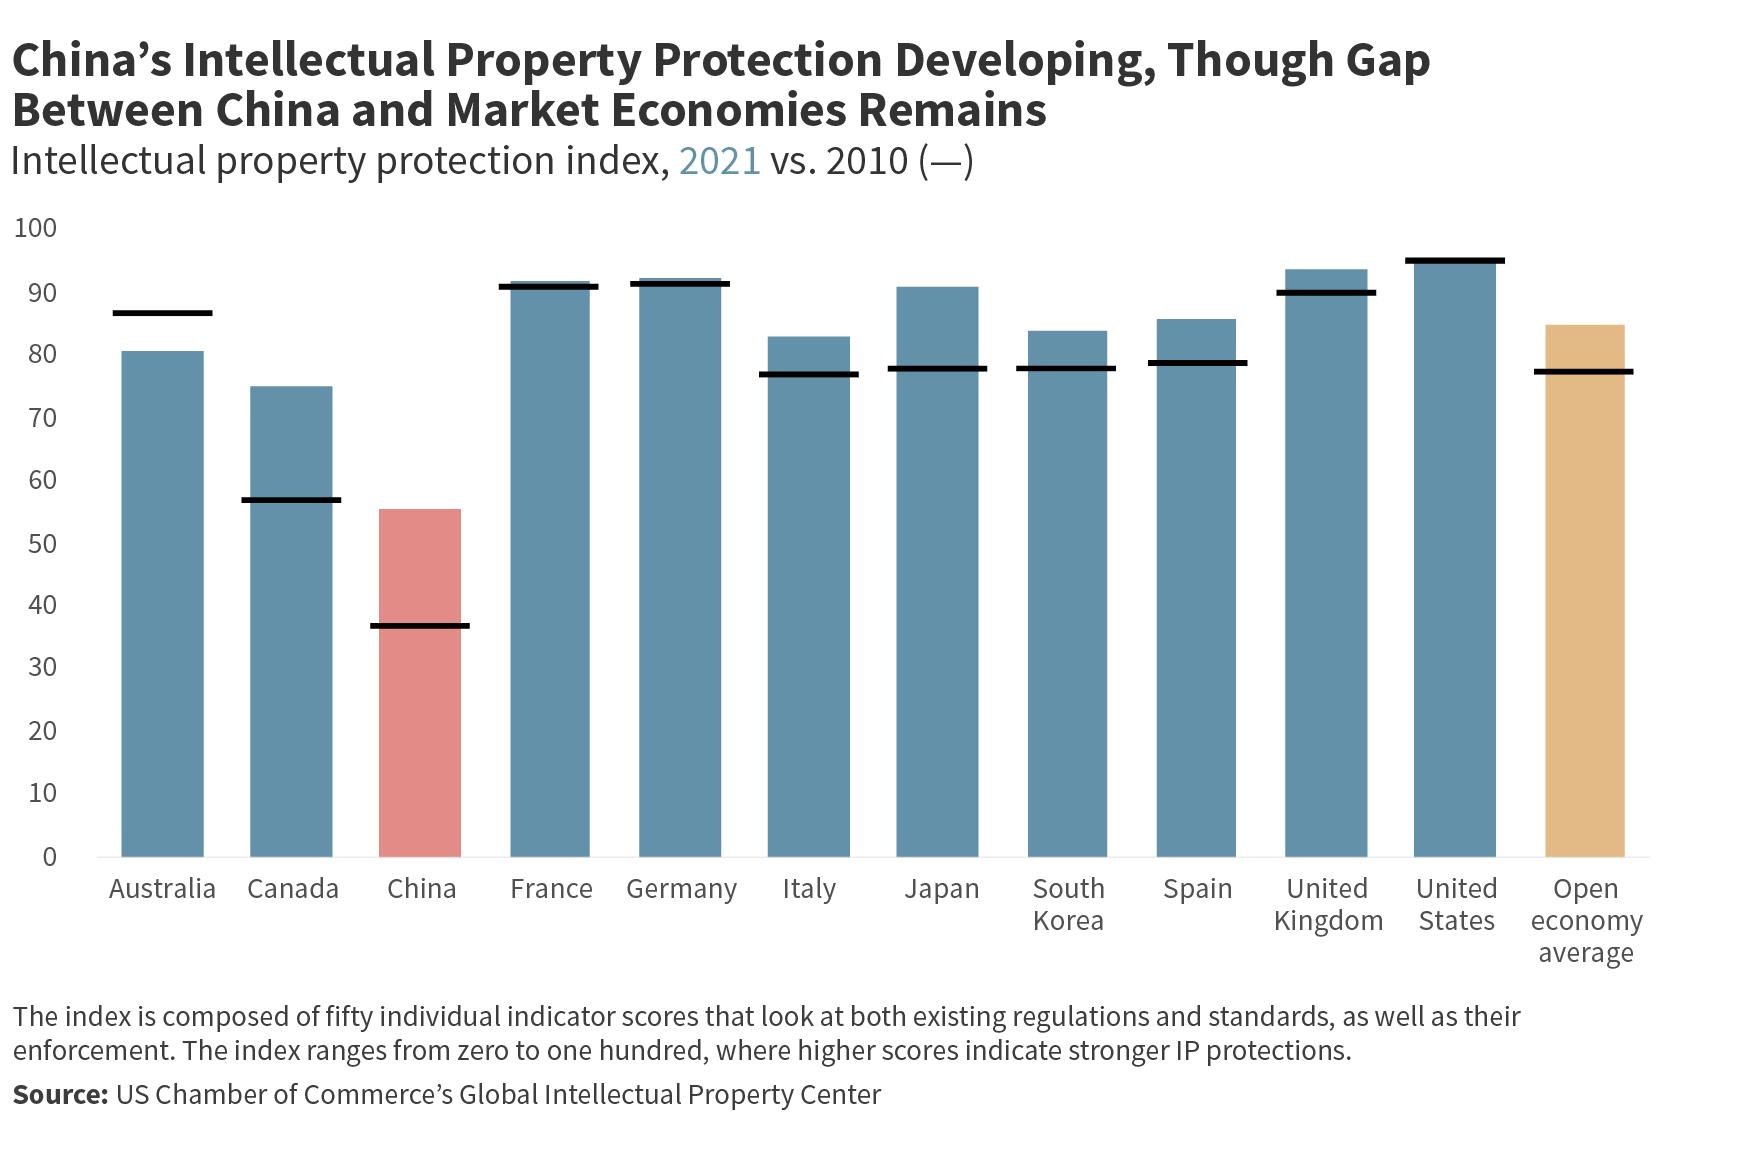
To measure the protection of intellectual property, we use the International Intellectual Property Index provided by the US Chamber of Commerce’s Global Innovation Policy Center. The index is composed of fifty individual indicator scores that look at both existing regulations and standards, as well as their enforcement. Because the index was not launched until 2012, we apply 2012 data as a proxy for our 2010 baseline. China has a score of around 56 in
2021, only a 1-point improvement since 2020, and well below the open-economy average of 87.5. However, China has shown consid erable improvement from its 2012 baseline, when it had a score of 37. This long-run improvement reflects China’s efforts to strengthen de jure protections and establish more reliable legal enforcement mechanisms. Besides Australia, which has experienced a notable decline in the strength of IP protection, all other market economies have shown at least marginal improvement in scores since 2010.
Combining the above indicators, our Modern Innovation System Composite Index puts China at 2.4 in 2021, against an average of 4.3 within our sample of the ten largest open market economies (Figure 5). China has made progress toward a modern innovation system since 2010, when it scored 1.5, but it still suffers from sub stantial institutional shortcomings (from heavy state intervention to lagging IP protection) and shows a substantial gap in innovation quality. China’s 2021 composite score also declined from the 2.6 that it received in 2020. On average, market economies have main tained the same scores in our comprehensive measure of a mod ern and open innovation system from 2010 to 2021. However, a few economies such as the United Kingdom, France, and Australia, have experienced considerable step-by-step declines in scores from 2010 to 2020, to 2021. The pandemic’s effects on innovation may contribute to this phenomenon.
In terms of coverage gaps and caveats, we do not account for some of China’s nonmarket features, such as the presence of SOEs in top companies, that are relevant for innovation but already covered in other clusters. We also face limits on the availability of national and international data on specific elements of China’s innovation system (such as subsidies or government guidance funds).
We update these benchmark indicators yearly to track the pace and direction of change. On a quarterly basis, we take the pulse of var ious policy reforms that would move China either closer or further from the average of market economies in terms of its innovation system. From this exercise, we have selected the most significant developments that took place in 2021, all of which are steps to reg ulate or centralize data:
After designating data as a “factor of production,” alongside land, labor, capital, and technology, in 2020, the Chinese government took steps in 2021 which clarified its vision of data’s role in the econ omy. The Personal Information Protection Law (PIPL) and Data Security Law (DSL), for example, restricted the use of data by pri vate corporations and flows of data beyond China’s borders.
The PIPL creates a centralized framework to protect the personal data of Chinese consumers, while also restricting cross-border data transfers. The law has only been in force for about a year, making it difficult to assess its true impact. But one consequence is that it
increases the risk for foreign companies in China to inadvertently violate the PIPL when sharing data with foreign regulators to comply with investigations.
The DSL increases the Chinese government’s control of domestic data by requiring foreign authorities to obtain approval from the rel evant Chinese regulatory authorities before accessing it.
In 2021, the government’s steps to control data included the publi cation of a number of additional data-related draft measures and regulations 13 Overall, these policies promise to close China off fur ther from foreign data exchange. This increases the challenges of doing business in China, including by stifling data-driven innova tion. The government’s far-reaching access to the data of private Chinese citizens is also at odds with the “open innovation system” that characterizes market economies.
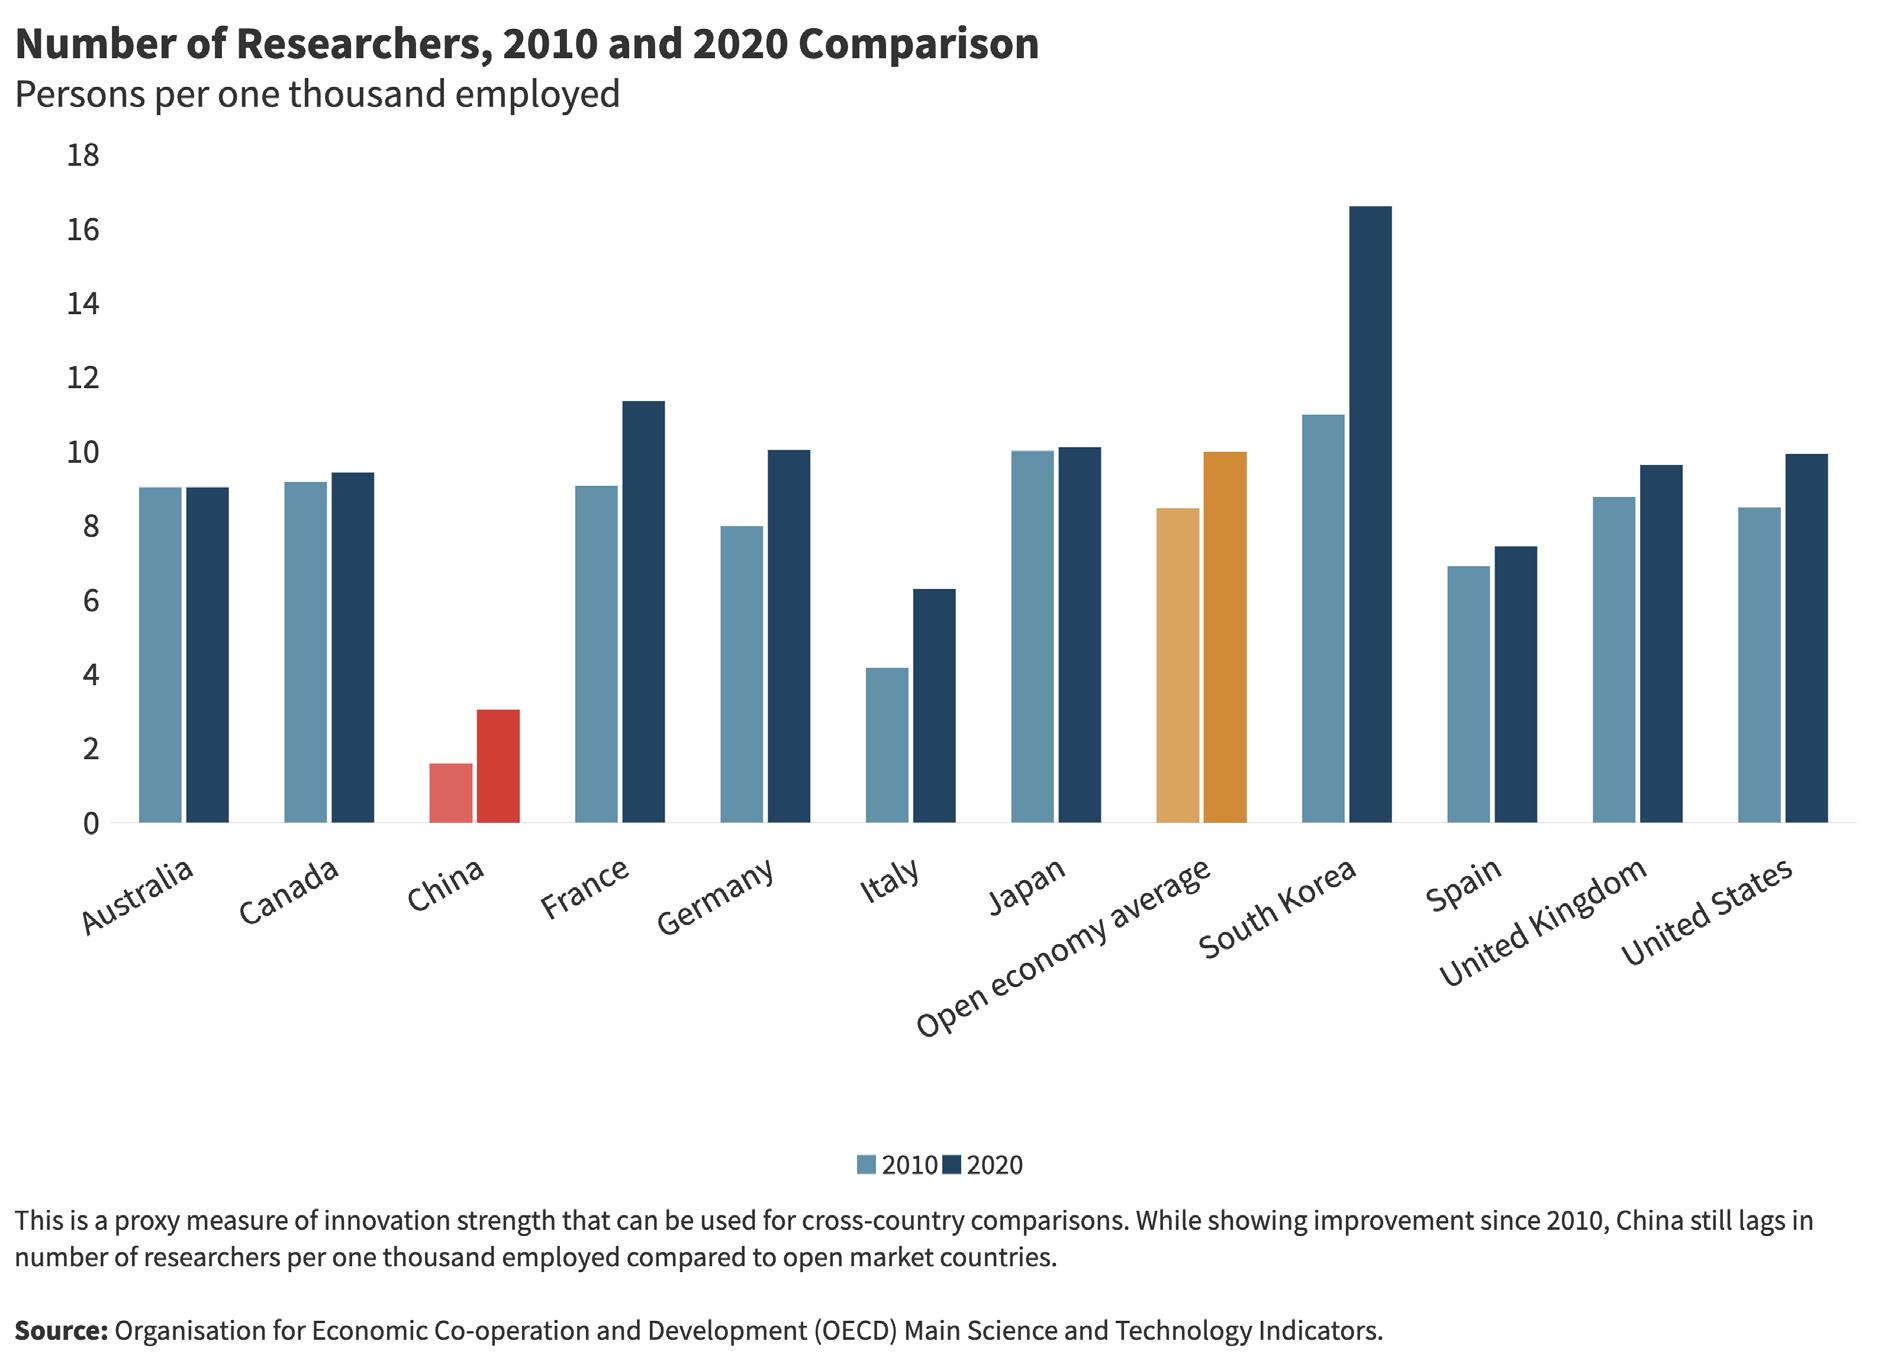
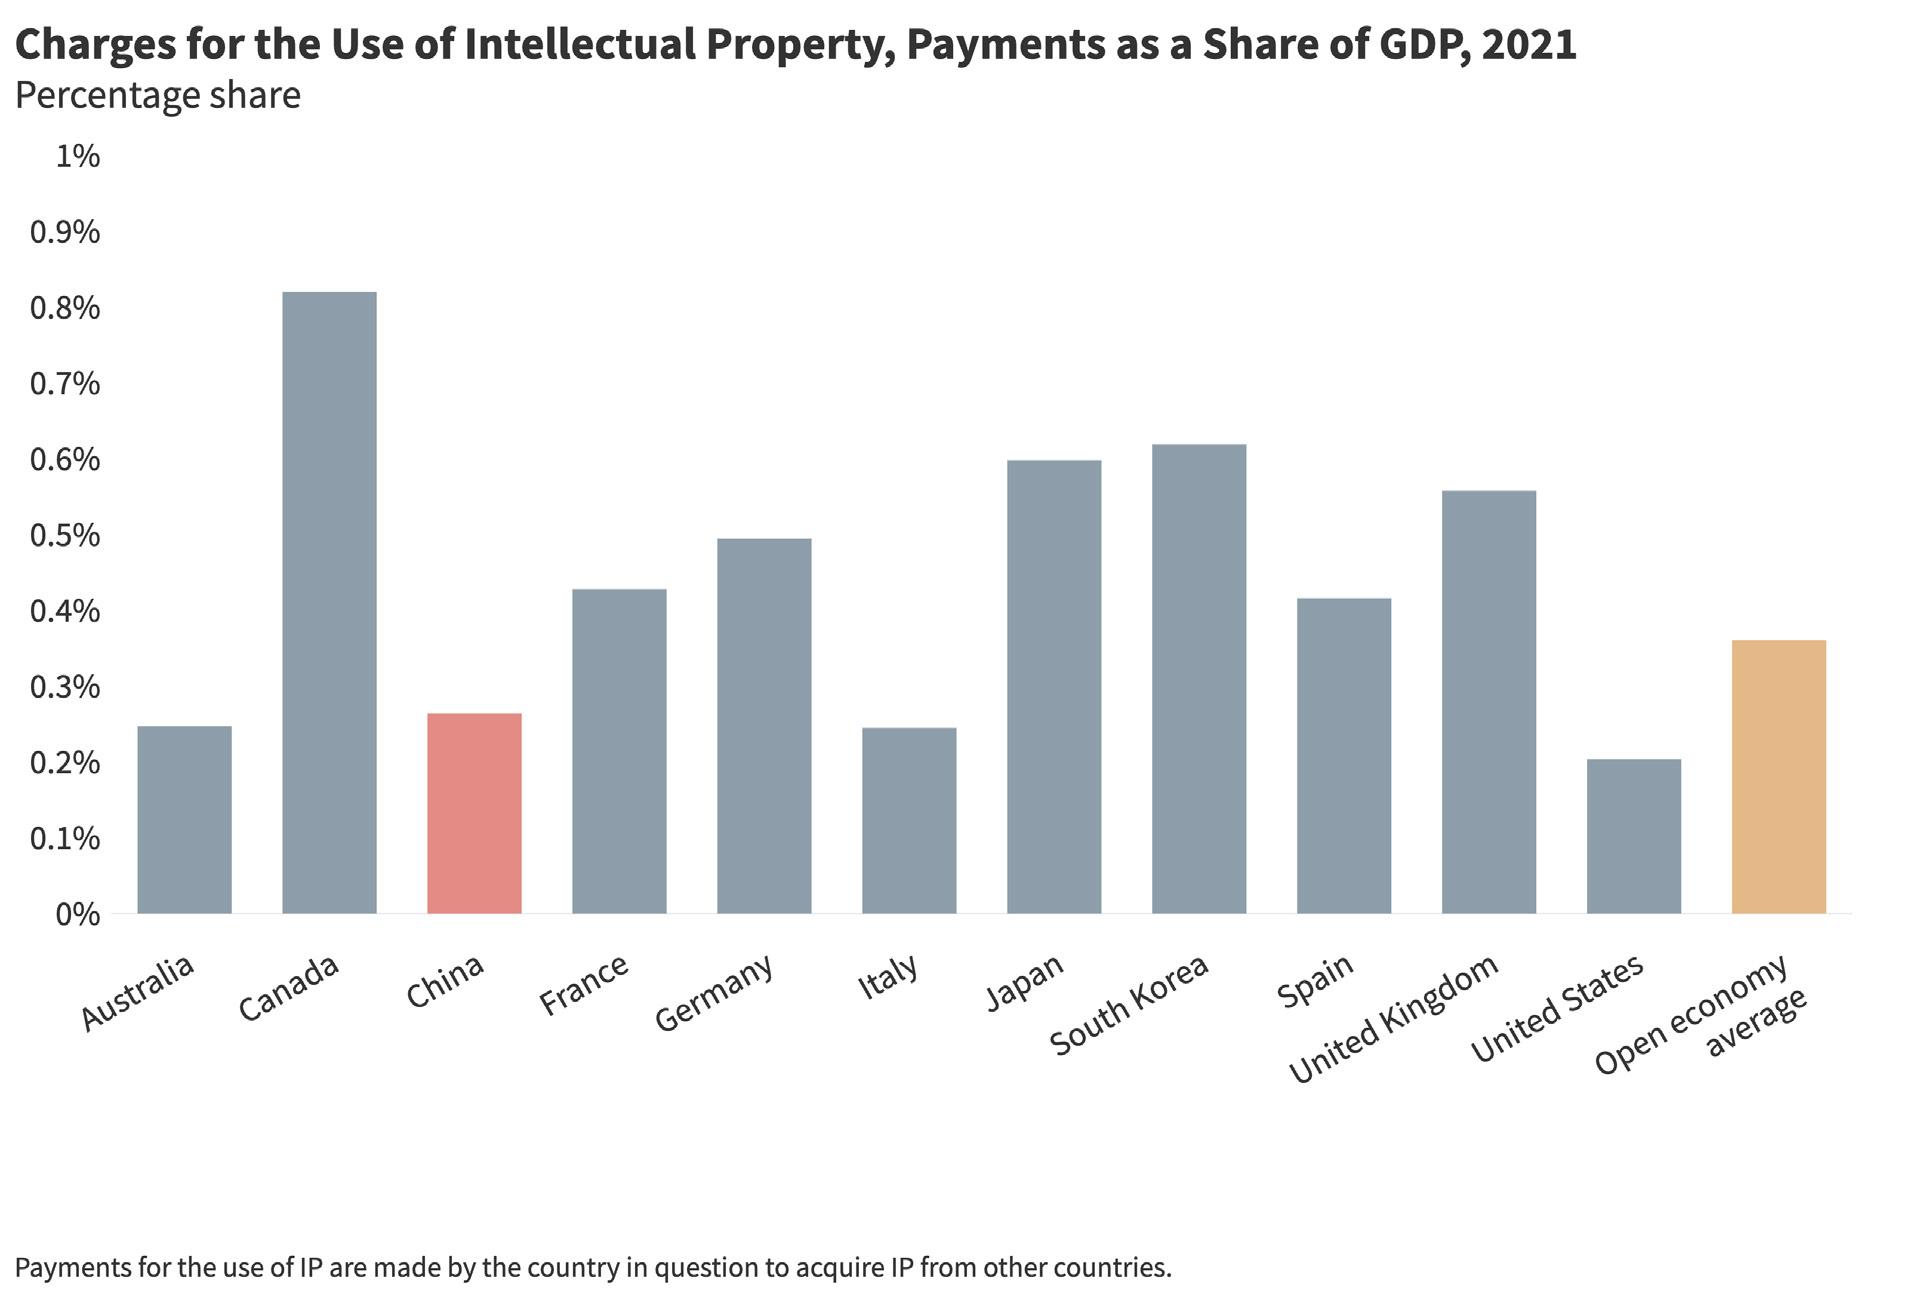
In addition to tracking policy developments, we are also watching several higher-frequency, and often China-specific, indicators to gauge progress on market-oriented and liberal economic reforms. Figure 5.2 shows a selection of these indicators including the num ber of researchers per one thousand people employed, the share of foreign investors in venture funding rounds for Chinese compa nies, payments for the use of intellectual property, and the innova tive industry share in industrial value added.

Measure
Free trade is a key feature of open market economies to facilitate specialization based on comparative advantage. We define trade openness as cross-border flow of market-priced goods and ser vices free from discriminatory, excessively burdensome, or restric tive measures.14
We apply the following annual indicators to benchmark China against open market economies in terms of trade openness.
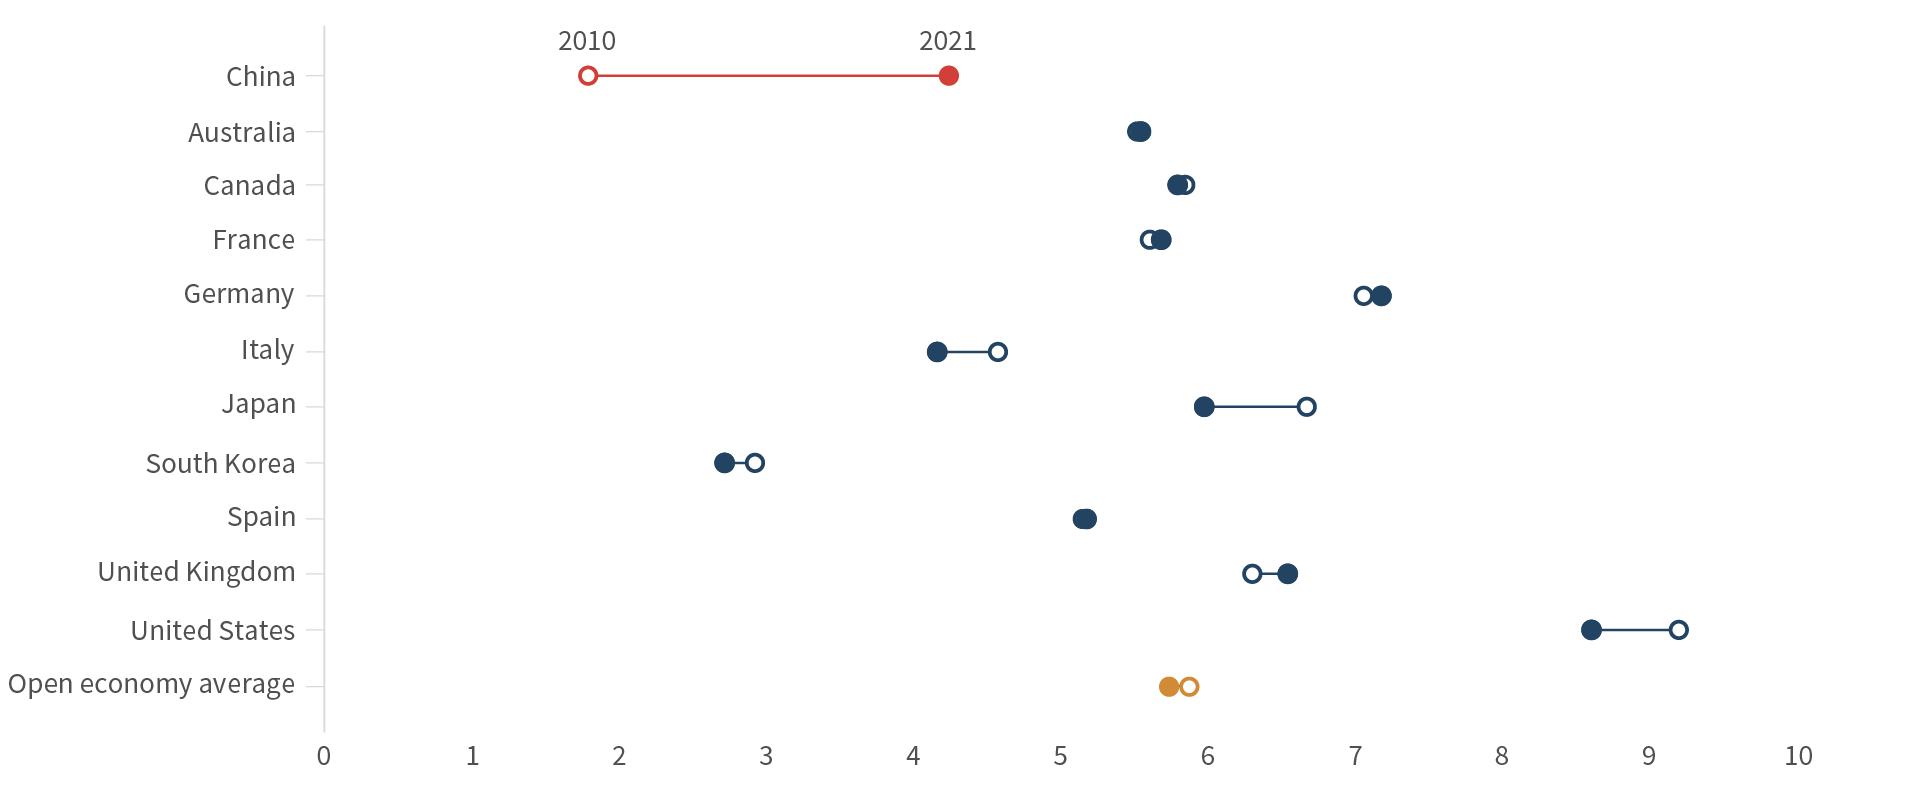
Our primary de facto trade openness indicators are gross twoway goods trade as a share of global two-way goods trade and gross two-way services trade as a share of global two-way ser vices trade. This metric is often referred to as the trade openness ratio, although a low ratio doesn’t necessarily imply restrictive poli cies (it can also derive from the size of a country’s economy or a nontrade-friendly geographic location). Both indicators show that China is an economy heavily integrated in global trade flows. China has the highest ratio when it comes to goods trade and a ratio above the open-economy average when it comes to services trade. China’s 2021 goods trade intensity has increased significantly since 2010,
while market economies’ goods trade intensities have all halved since 2010. The changes in goods trade intensity were minimal for all countries between 2020 and 2021.
For services trade, the US still holds the largest share of global twoway trade, even though its 2021 share is 1.63 percentage points lower than its 2010 level. In 2021, China surpassed Germany in ser vices trade intensity, now holding the second-largest share. Most market economies’ shares of global services trade have decreased since 2010, but by a lesser degree than for goods trade. From 2020 to 2021, services trade ratios also show only marginal changes for the sampled countries.
On the de jure side, the standard metric for assessing a coun try’s trade openness is tariff rates. We chose the simple mean of most favored nation (MFN) tariff rates across all product cate gories. We use a simple mean instead of an average that applies weight by the product import shares corresponding to each part ner country. The simple mean can diminish the common issue of weighted MFN tariff rates being skewed downward, as goods sub jected to steep tariffs would likely see lower quantities imported and, thus, a lower weight in the calculation.15 For this metric, China is above the open-economy average with a tariff rate of 7.56 per cent, as compared to 5 percent. However, South Korea’s tariff rate still exceeds the other countries’, and is higher than it was in 2010.
14 Halit Yanikkaya, “Trade Openness and Economic Growth: A Cross-Country Empirical Investigation,” Journal of Development Economics 72 (1): 57–89, https://doi.org/10.1016/ s0304-3878(03)00068-3.
15 Chad P. Bown and Douglas A. Irwin, “What Might a Trump Withdrawal from the World Trade Organization Mean for US Tariffs?” Policy Briefs 18-23, Peterson Institute for International Economics, November 2018, https://www.piie.com/publications/policy-briefs/what-might-trump-withdrawal-world-trade-organization-mean-us-tariffs.
It is worth noting that tariff rates have been volatile in recent years. For example, the United States’ average tariff rate spiked in 2019, reaching 10.17 percent, due to the ongoing trade war with China. However, in 2021, US tariff rates have returned to hover around 3.5 percent, which is comparable to its 2010 rate. Between 2020 and 2021, Japan also lowered its tariff rate from 8.07 percent to 4.99 percent, which now is in the range of Japan’s 2010 rate.
For a de jure measure for services trade openness, we rely on the OECD’s Services Trade Restrictiveness Index (STRI), which mea sures policy restrictions on traded services across four major sec toral categories.16 These are logistics, physical, digital, and pro fessional services. Each sectoral category also contains several specific industry subindices. A lower score on the index indicates a less open policy to services trade, with scores ranging from 0 to 1. This index only started to provide data in 2014, so this is the earliest year for benchmark comparison. China’s score of 0.64 falls below the open-economy average of 0.79, indicating a more restrictive approach to services trade.17 China saw some improvement since 2014. OECD economies’ services trade restrictiveness has stayed constant since 2014.
China is an even greater outlier in digital services trade, a subcat egory of services trade that is increasingly important for the global economy. The OECD’s Digital Services Trade Restrictiveness Index measures barriers that affect trade in digitally enabled ser vices across fifty countries.18 This includes policy areas such as infrastructure and connectivity, electronic transactions, payment systems, and IP rights. The index ranges from 0 to 1, with lower scores indicating a greater degree of restrictiveness. This index only started to provide data in 2014, so this is the earliest year to conduct the benchmark comparison for all countries. Because dig ital services trade restrictions generally do not fluctuate much from year to year, this still provides an accurate snapshot of where market economies and China were compared to their performance now. With a 2021 score of 0.51, China is by far the most restrictive nation
in the sample, compared to the open-economy average of around 0.91. Moreover, its score has actually declined since 2014, indicating additional restrictions over the past eight years. Most of the market economies maintained the same levels of restrictiveness on digi tal services compared to 2014, with only Japan recording a notable increase in restrictiveness. From 2020 to 2021, though, Japan’s score showed marginal improvement.
Our Trade Openness Composite Index—which reflects a blended average of the above indicators—puts China at 4.25 in 2021, against an open-economy average of 5.75 within our sample of the ten larg est open market economies (Figure 6). This is a slight improvement from China’s score of 4.11 in 2020, though some de facto indica tors’ scores are reflective of broader surges in demand for Chinese goods during the pandemic rather than the country’s intentional movement toward market norms. The 2021 score is also a substan tial improvement compared to China’s score of 1.81 in 2010 and China’s best overall score in the six clusters we measure. China has reduced tariffs to a level nearly comparable with OECD economies (or, in some cases, below that) and has become the world’s largest trading nation in goods. It is making rapid progress in the area of services trade as well, becoming the world’s second-largest trading nation. However, restrictions on services trade—and especially digi tal services—remain higher than in open market economies. And, of course, China’s goods trade openness score comes with an aster isk: virtually all observers note that unreported behind-the-border nontariff barriers are giant drivers of China’s trade patterns.
Thus, while we have good access to basic trade-related data, our coverage faces several shortcomings. The measures of China’s trade intensity are a yardstick for fairness and openness. The ser vices trade data have flaws, including significant distortions through tourism spending and hot money flows. Also, measuring services trade, which includes tourism, during the pandemic years can pro duce skewed results. Finally, some of China’s most problematic practices—for example, nontariff barriers, informal discrimination, and exchange rate interventions—are difficult to capture through internationally comparable datasets.
16 “OECD Services Trade Restrictiveness Index: Policy Trends up to 2020,” Organisation for Economic Co-operation and Development, February 2021, https://www.oecd.org/ trade/topics/services-trade/documents/oecd-stri-policy-trends-2021.pdf.
17 “OECD Services Trade Restrictiveness Index (STRI): China – 2021,” Organisation for Economic Co-operation and Development, https://www.oecd.org/trade/topics/servicestrade/documents/oecd-stri-country-note-chn.pdf.
18 Janos Ferencz, “The OECD Digital Services Trade Restrictiveness Index,” OECD Trade Policy Papers No. 221, OECD Publishing, 2019, https://doi.org/10.1787/16ed2d78-en.
We update these benchmark indicators yearly to track the pace and direction of change. On a quarterly basis, we take the pulse of var ious policy reforms that would move China either closer or further from the average of market economies in terms of its trade open ness. From this exercise, we have selected the two most significant developments that took place in 2021:
China introduced a de facto trade embargo against Lithuania in December 2021, which included a ban on goods exported by EU and US companies to China which were made with Lithuanian inputs. The move was retaliation for Lithuania’s deci sion to allow Taiwan to open a representative office in the coun try. The bans appear to have been the first in which China blocked imports from companies not based in the country they were targeting. Beijing’s response triggered an EU com plaint at the WTO and raised concerns in Europe about China’s readiness to use economic coercion to achieve political aims. The Chinese government’s decision to maintain stringent zeroCOVID restrictions led to weeks-long shutdowns of major ports, hit ting global supply chains and contributing to a spike in freight rates. In one instance, a port was closed due to a single positive COVID19 case. It has now become clear that these draconian restrictions, including city-wide lockdowns in 2022—Chengdu and Shenzhen being the latest instances—are unlikely to end anytime soon.
In addition to tracking policy developments, we are also watching higher-frequency, often China-specific, indicators to gauge real-time progress on market-oriented and liberal economic reforms. Figure 6.2 shows these indicators, including China’s current account bal ance as a share of GDP, RMB exchange rates compared to major currencies, China’s trade balances, role in processing trade, and trade policy interventions.
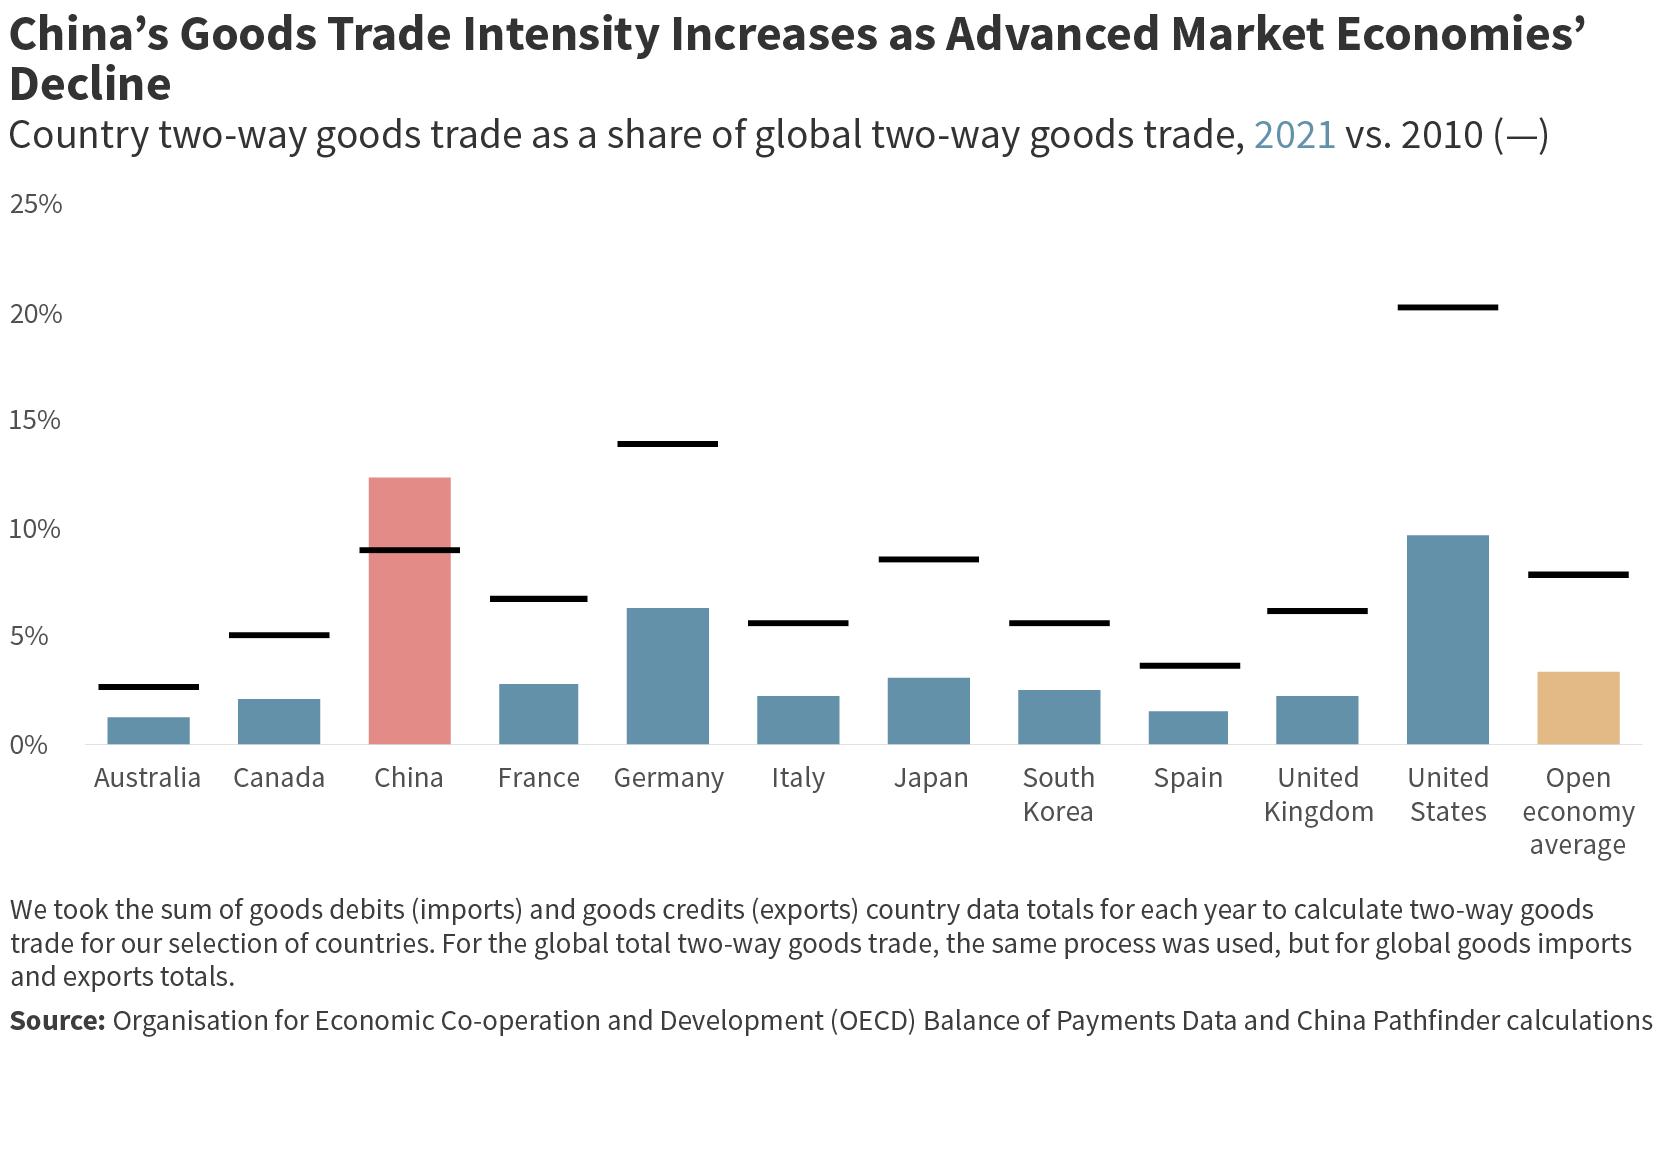
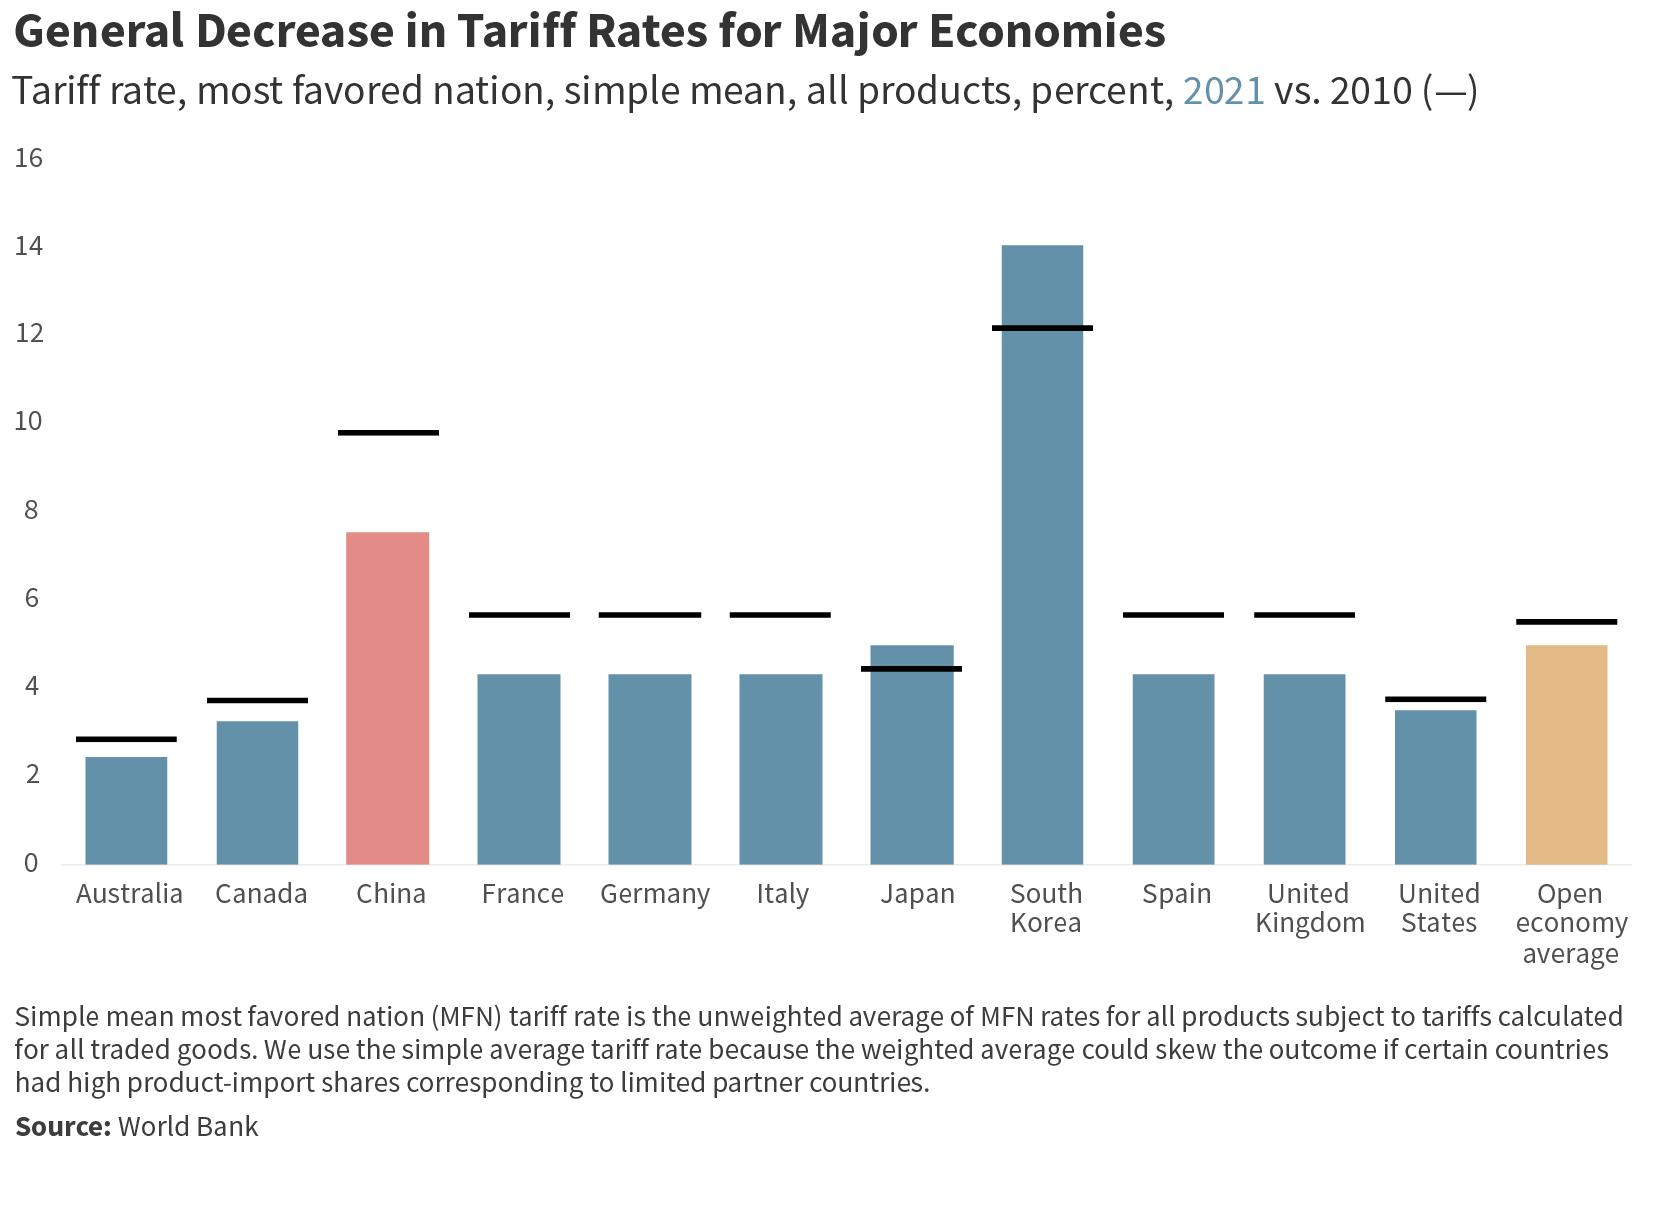
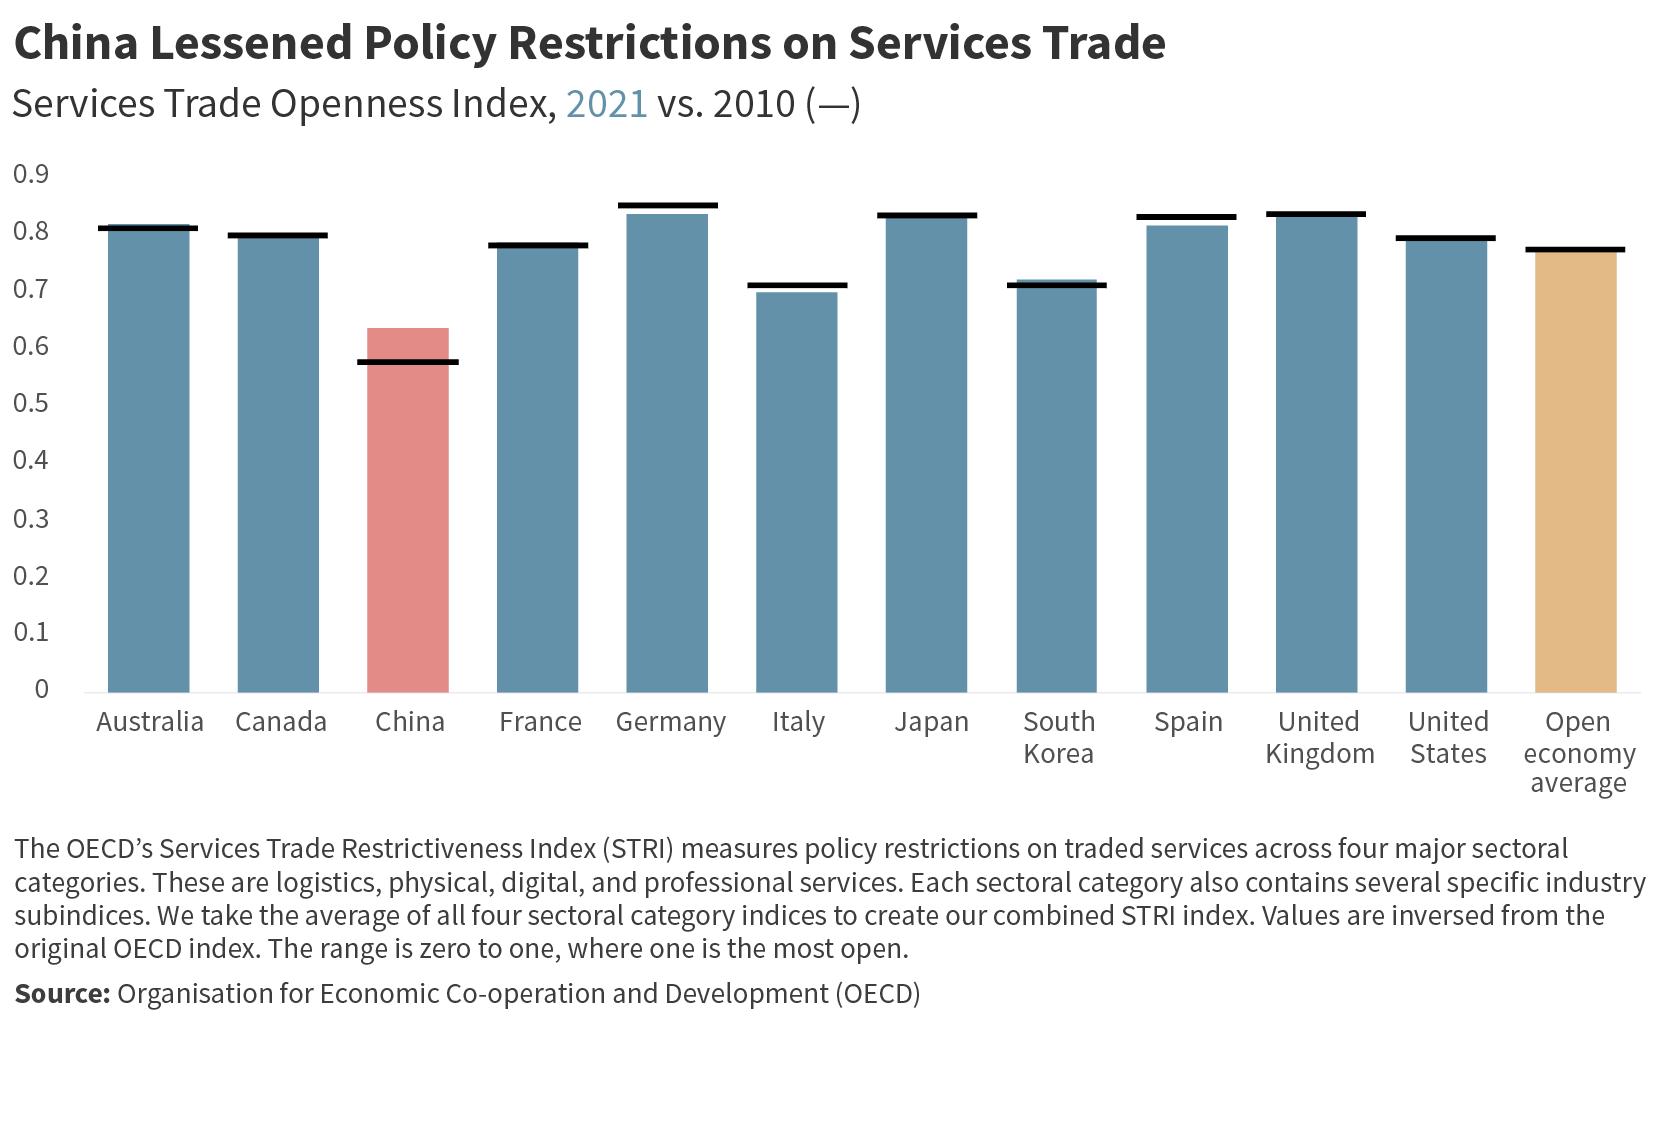

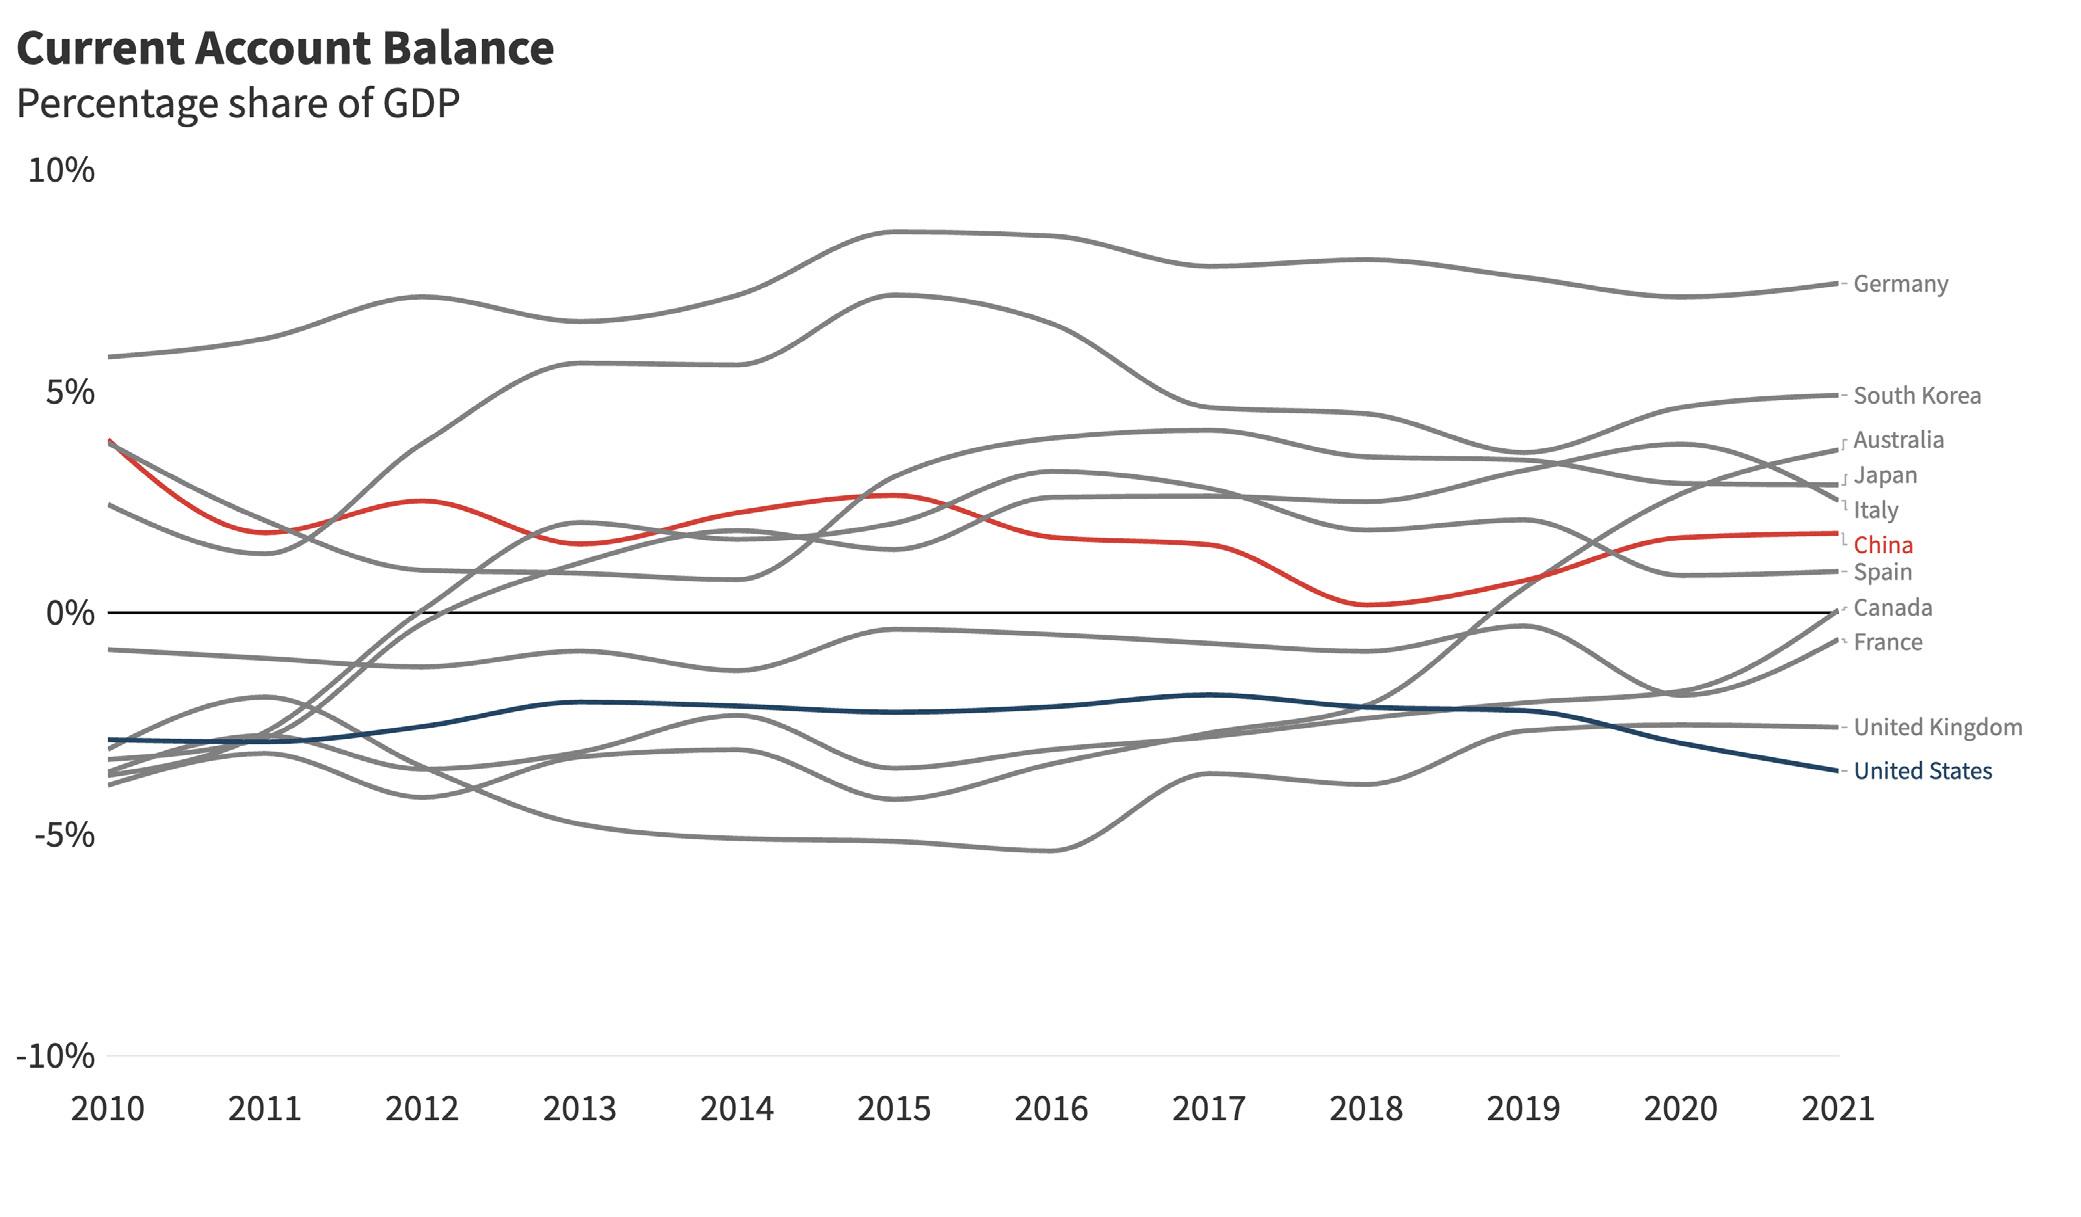
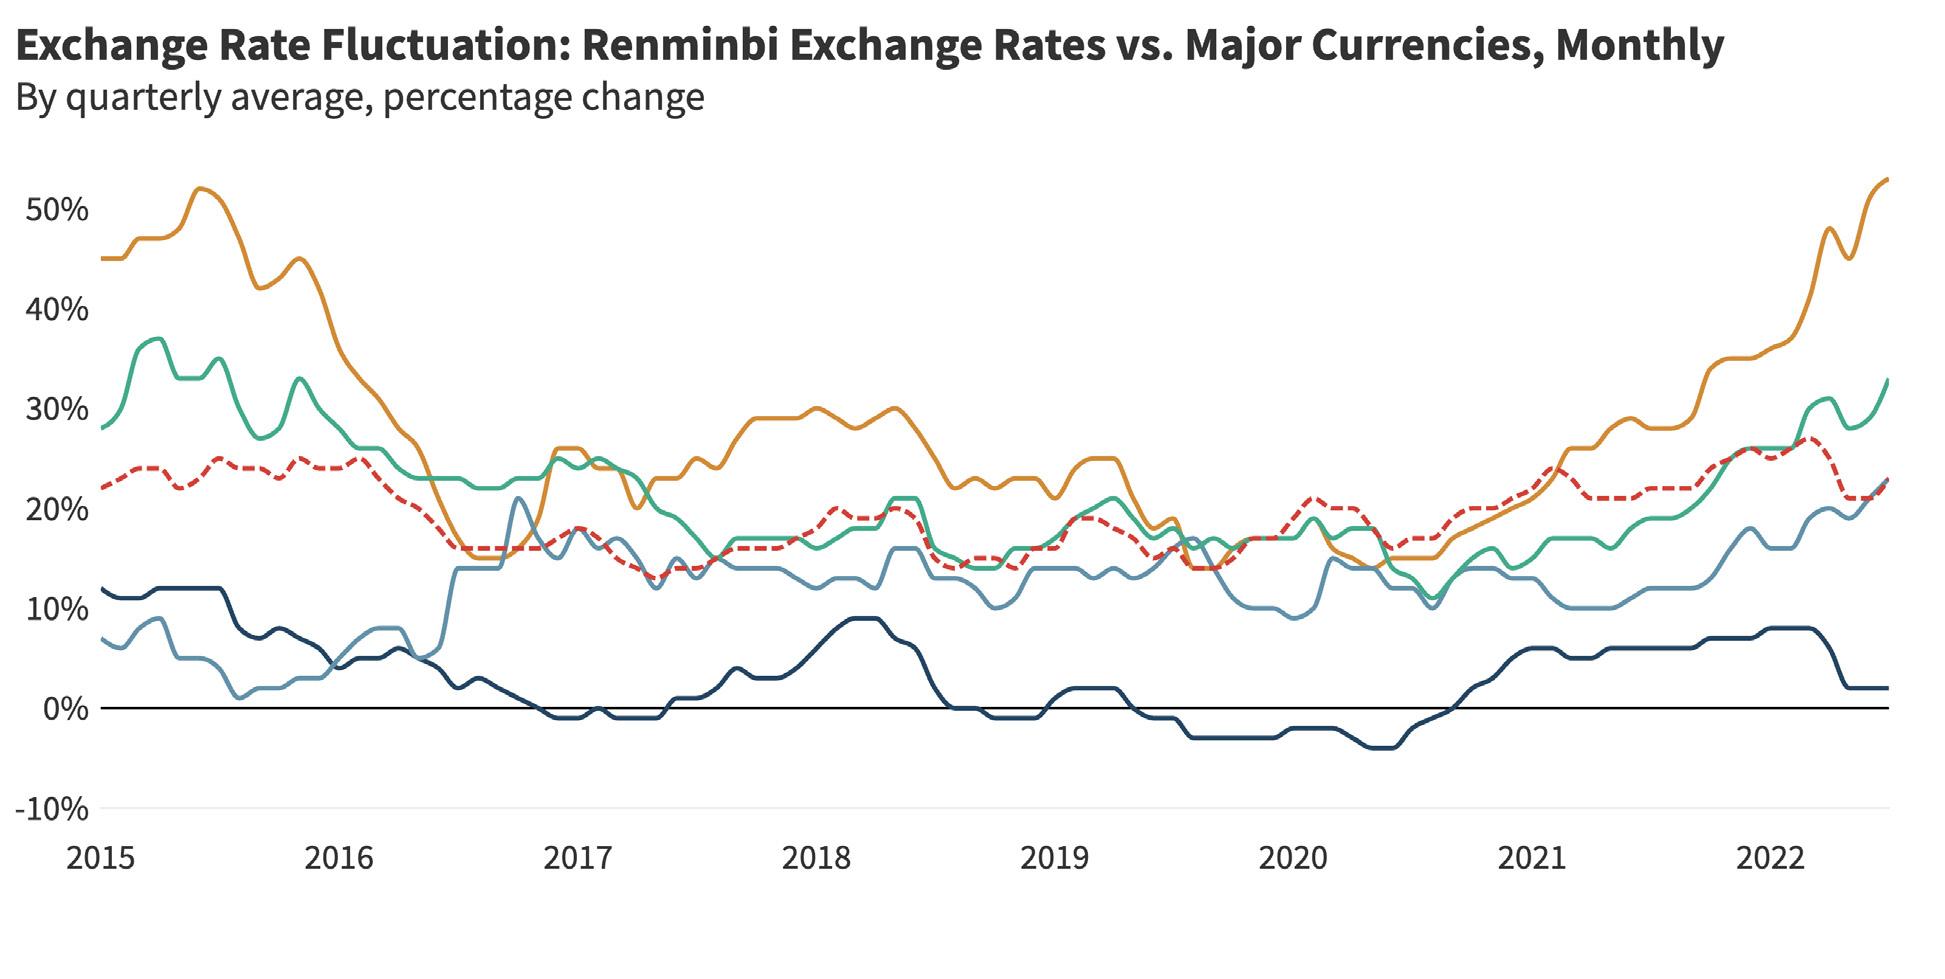
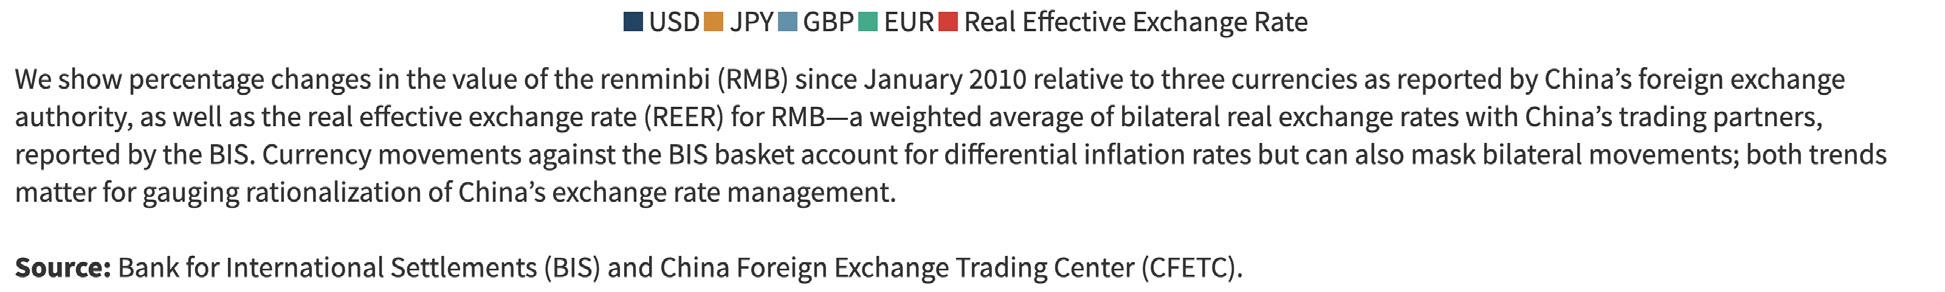
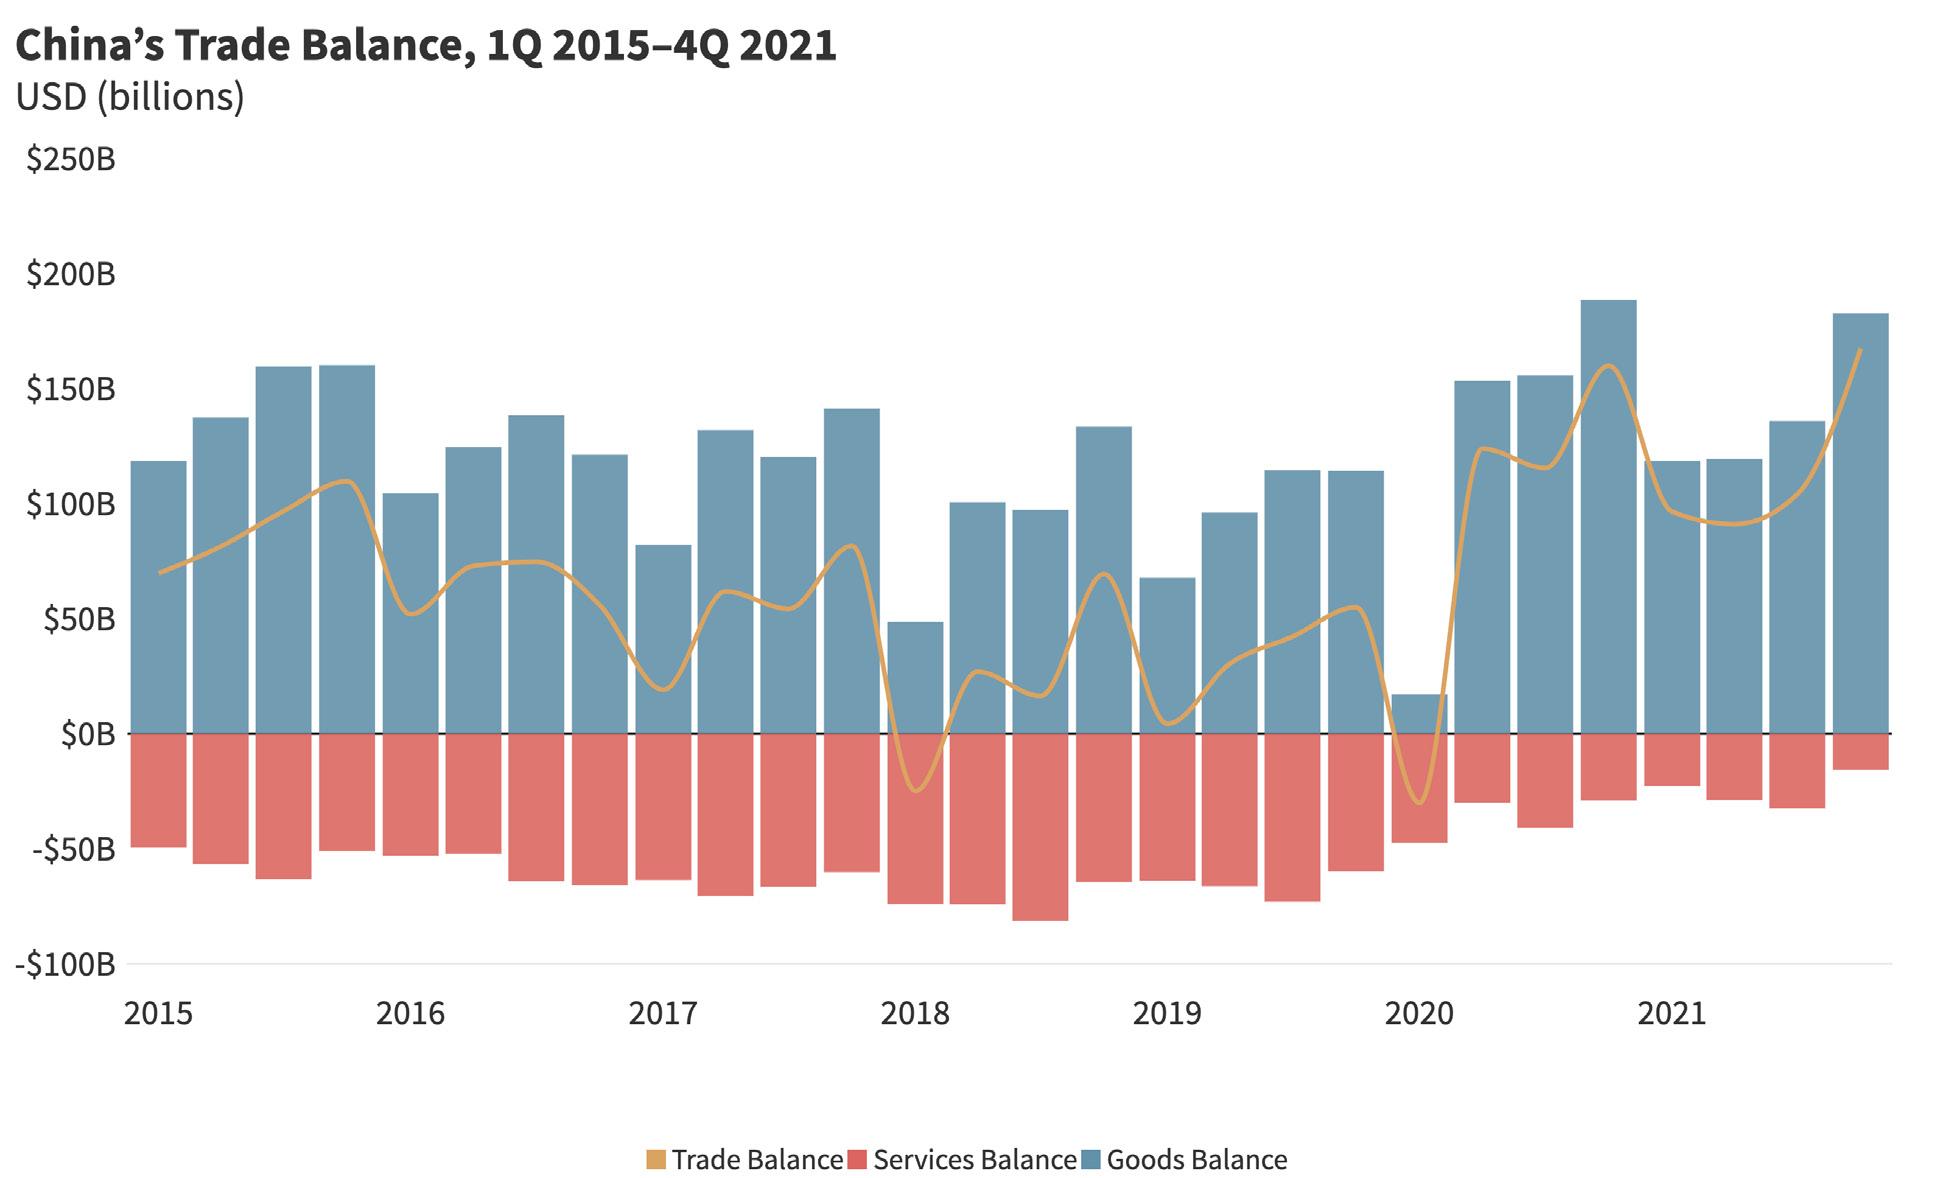
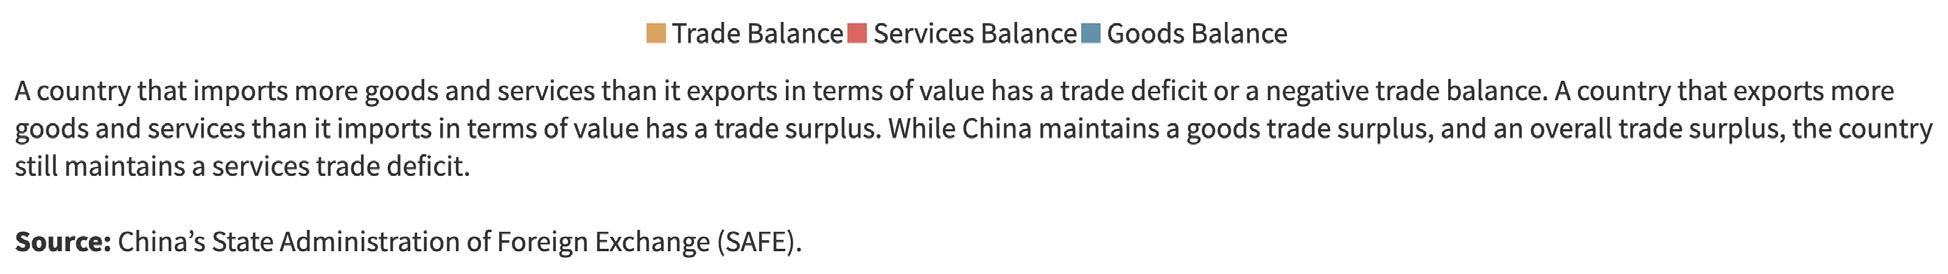
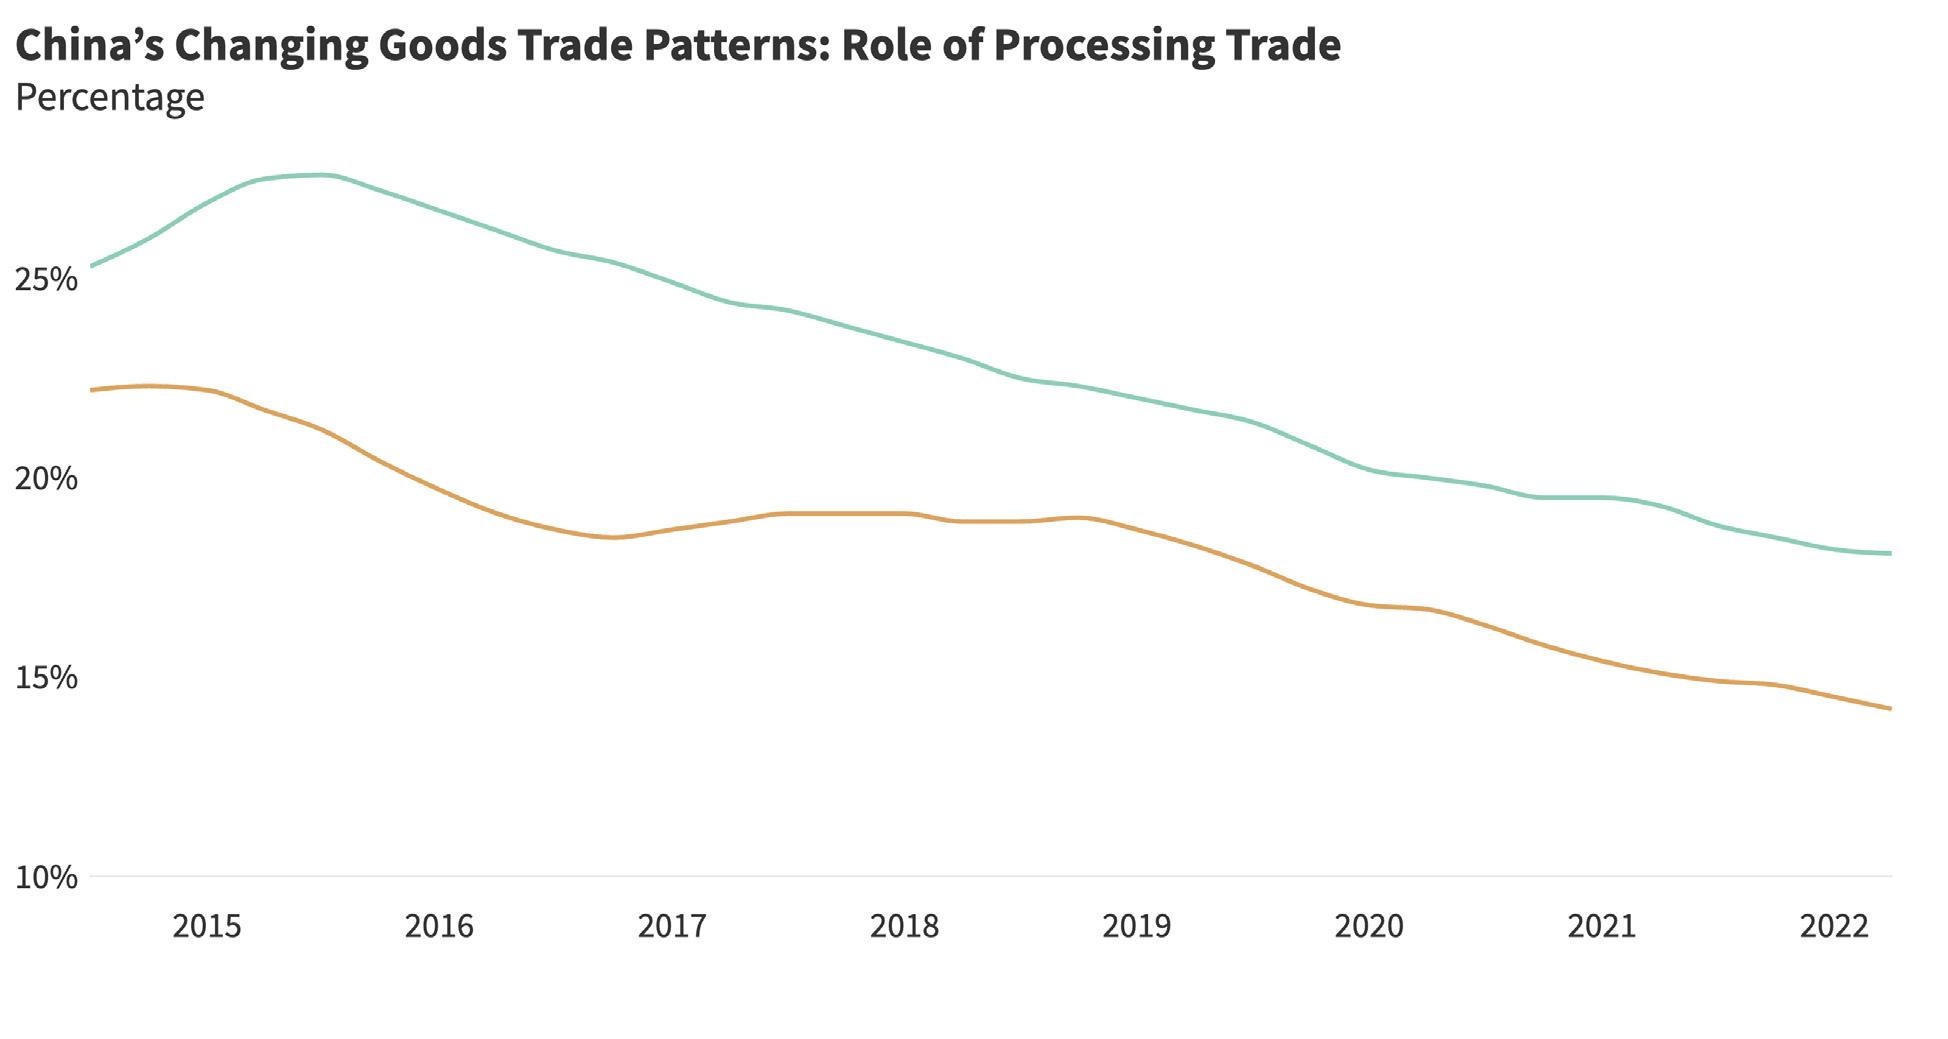
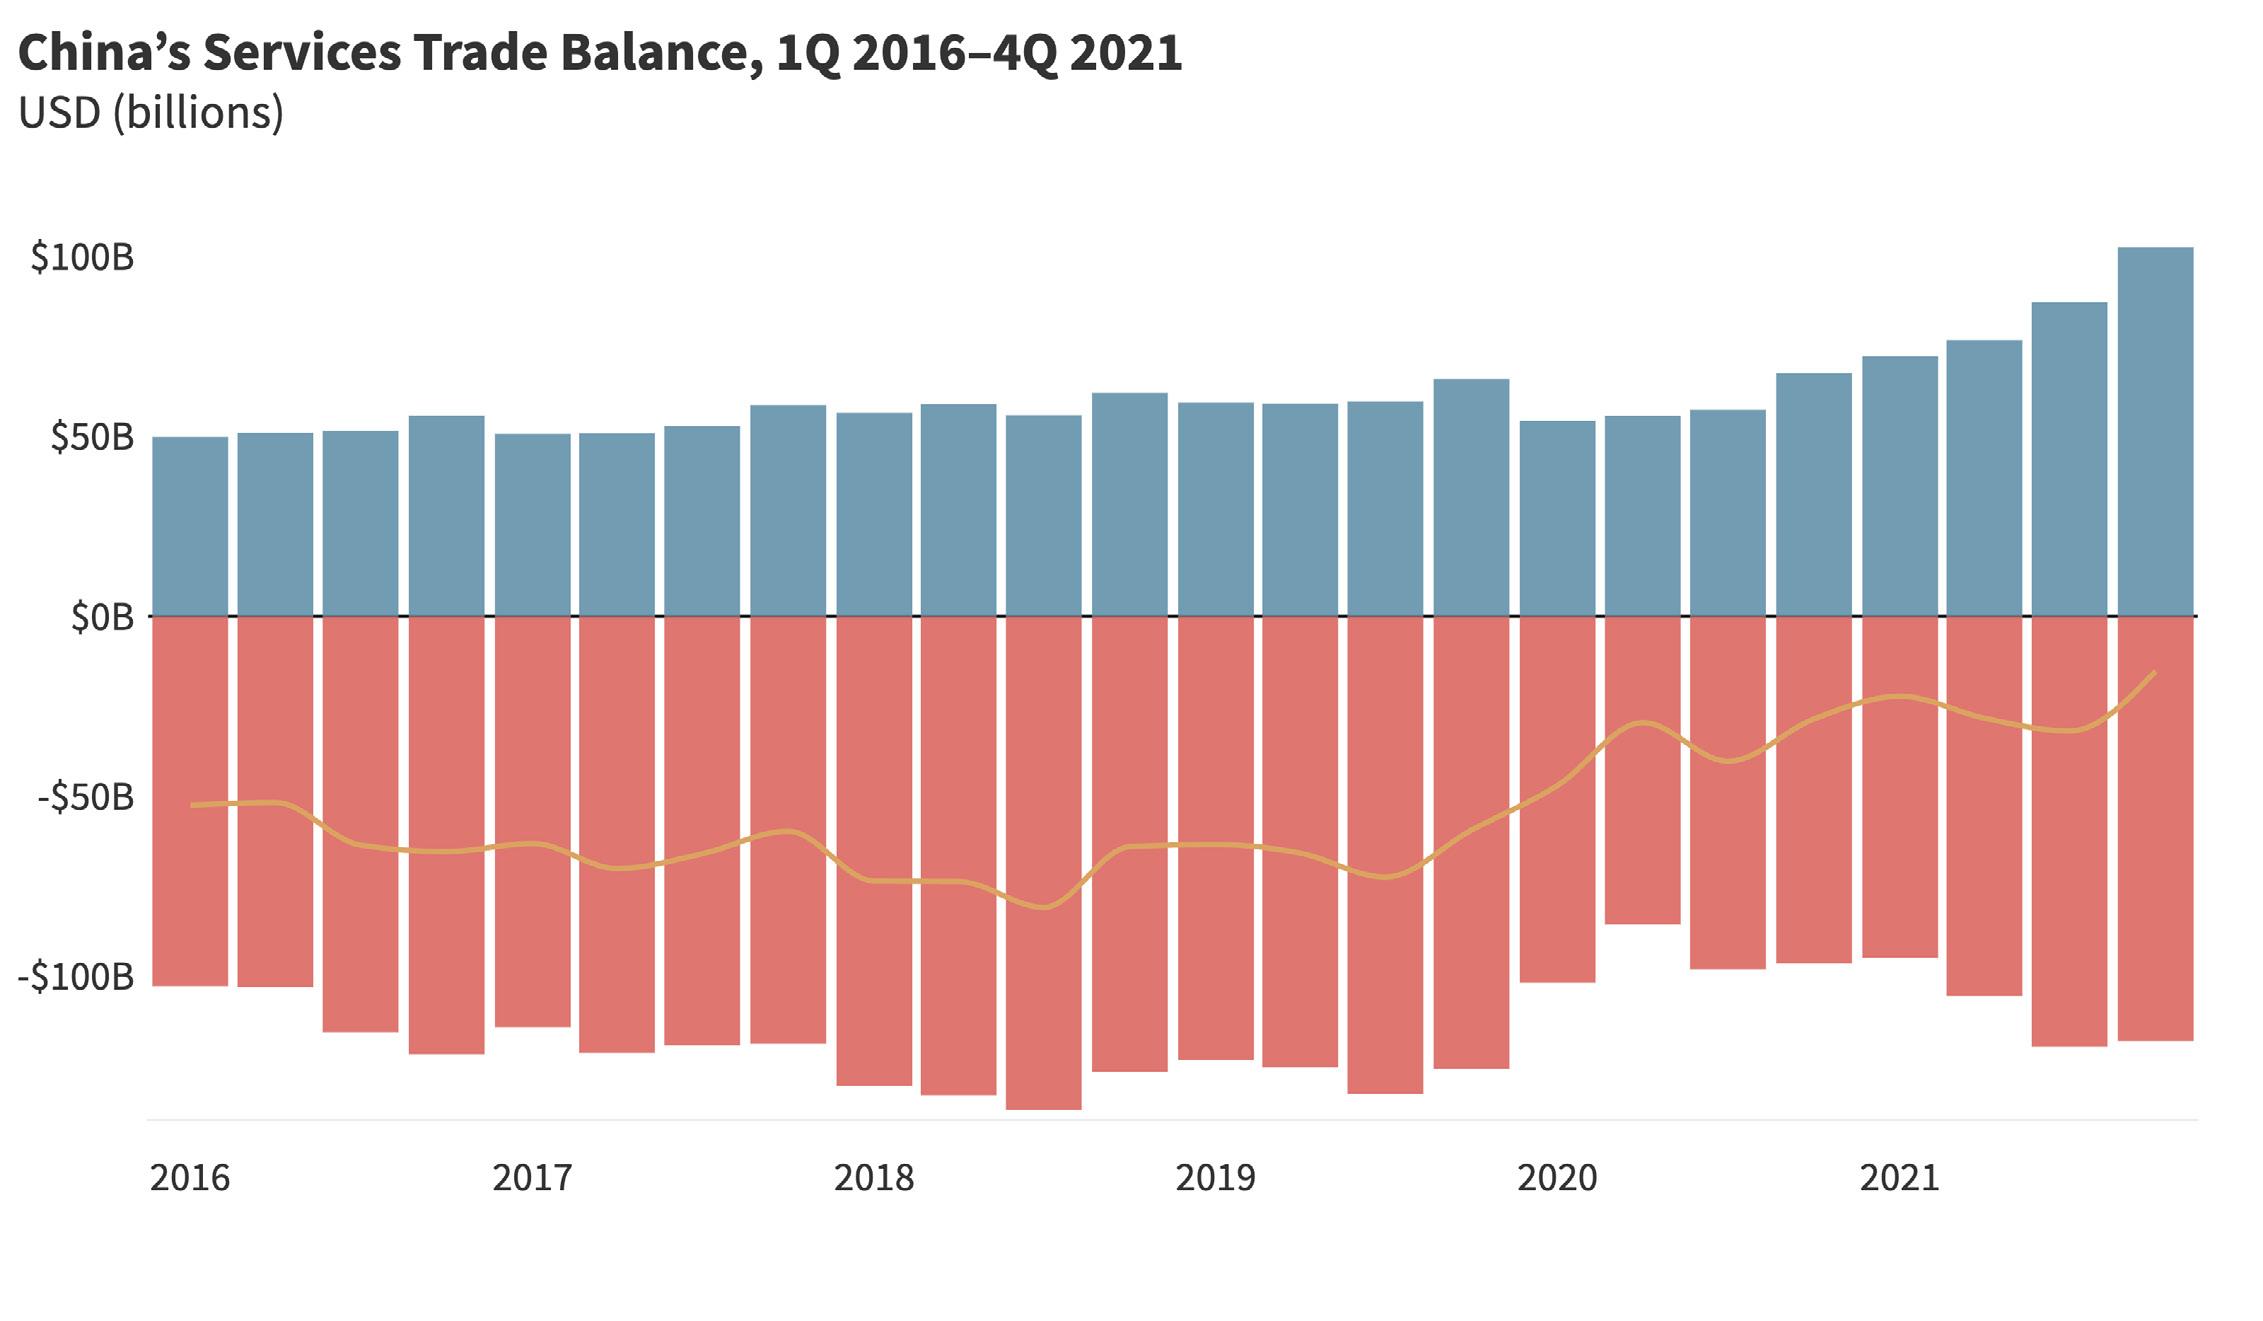
Measure of direct investment openness from 0 (low) to 10 (high). Source: China Pathfinder.
Direct investment openness refers to fair, nondiscriminatory access for foreign firms to domestic markets and freedom for local com panies to invest abroad without restrictions or political mandates. Direct investment openness is a key feature of open market econo mies that encourages competitive markets and facilitates the global division of labor based on comparative advantage.
We use the following annual indicators to benchmark China against open market economies in terms of direct investment openness.
Our main de facto indicator for inbound direct investment is the inbound FDI intensity of the economy, which is calculated by divid ing the total inbound FDI stock of an economy by its GDP. While China’s FDI intensity is high (liberal) relative to most developing countries, it remains relatively low compared to developed econo mies. China’s inbound stock in 2021 was 21.5 percent of GDP com pared to an open economy average of around 43.8 percent, but higher than both South Korea (13.3 percent) and Japan (4.7 percent). China’s inbound intensity has actually dropped since 2010, while it increased for most open market economies over the same duration.
The market economy average increased more than ten percentage points since 2010.
For outflows, we measure outbound FDI intensity, which is calcu lated by dividing outward FDI stock by GDP. China’s outbound FDI intensity has risen from a very low base in 2010 but, with a score of 15.31 percent, it remains lower than any other country in our sam ple and the open economy average of around 50 percent in 2021. It is worth noting that there is a wide distribution of scores among the open economies, with Canada having the highest score of 114.8 percent and Italy having the lowest score of around 25.27 percent. Open economies also saw notable increases in outbound FDI inten sity, with the open economy average increasing by around 13 per centage points in 2021 compared to 2010.
To measure de jure restrictiveness for FDI, we built our own indica tor for direct investment restrictiveness. While there is a solid body of academic work on the topic of cross-border capital controls, we found existing research not suitable for our purposes due to lack of a magnitude metric,19 coverage gaps, and significant time lags.20 Our indicator is compiled for outflows and inflows and covers three types of restrictions: national security reviews, sectoral and opera tional restrictions, and repatriation requirements and other foreign exchange restrictions. The scoring is based on a proprietary frame work derived from information contained in the IMF’s Annual Report
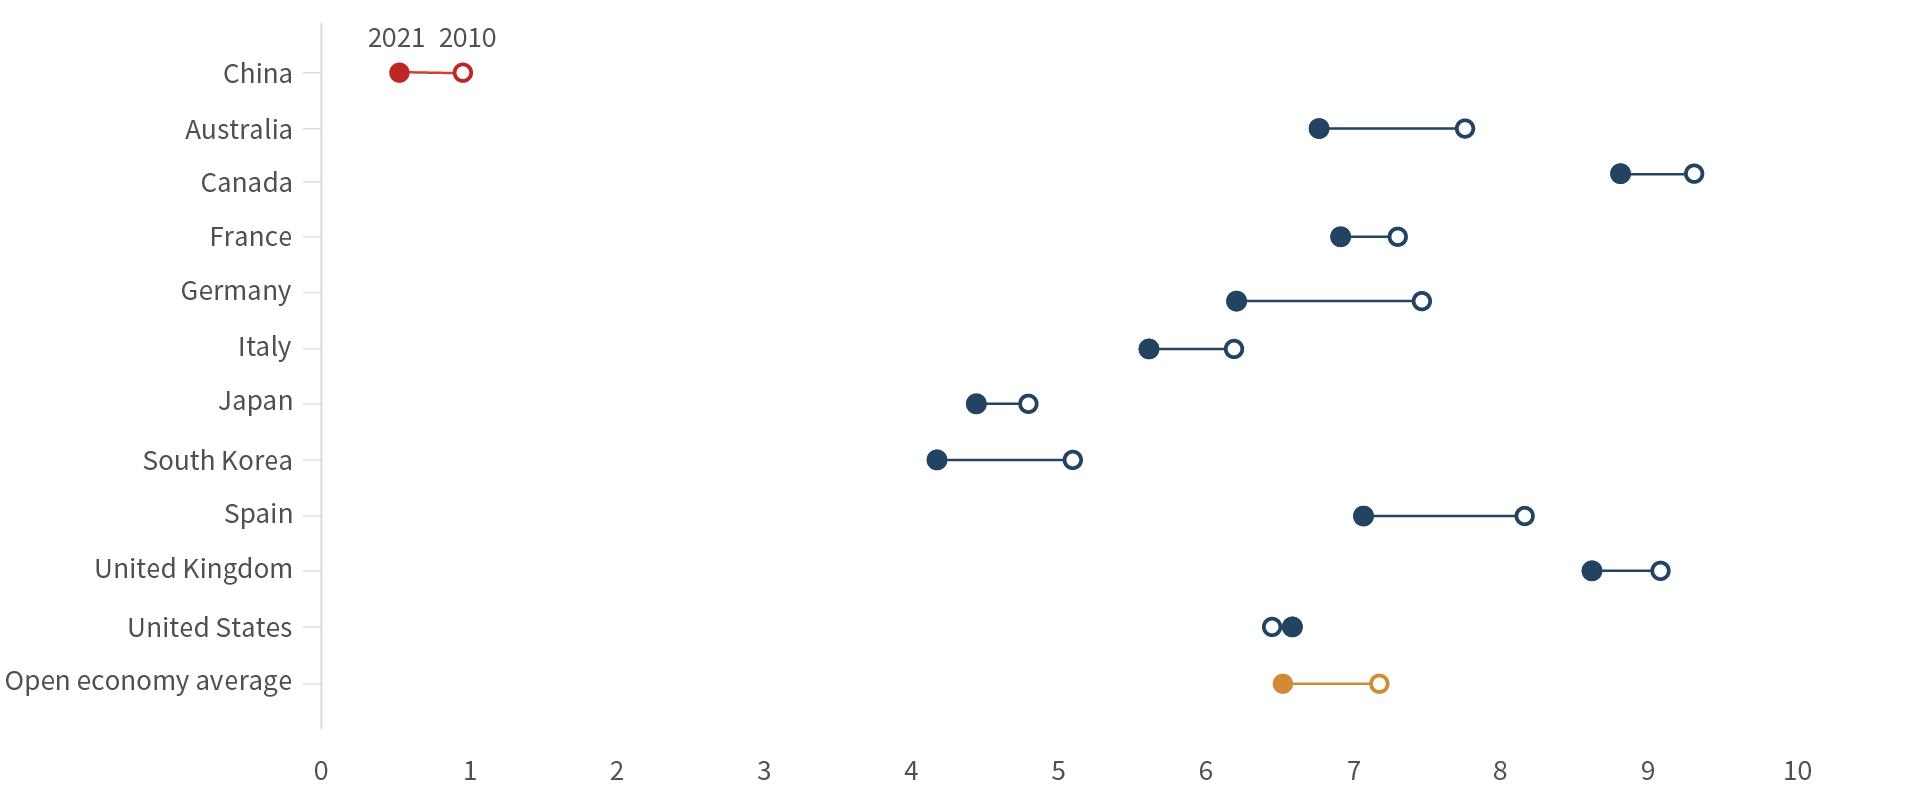
19 Andrés Fernández et al., “Capital Control Measures: A New Dataset,” IMF Economic Review 64 (2016): 548–574, https://doi.org/10.1057/imfer.2016.11.
20 Menzie D. Chinn and Hiro Ito, “What Matters for Financial Development? Capital Controls, Institutions, and Interactions,” Journal of Development Economics 81 (1): 163–192, https://doi.org/10.1016/j.jdeveco.2005.05.010.
on Exchange Arrangements and Exchange Restrictions (AREAER) as well as proprietary research on national security review mecha nisms and sectoral restrictions.21
China had a relatively low score on inward FDI restrictiveness in 2010 and has successfully implemented reforms to further reduce these barriers by 2021. However, China maintains not just national security reviews, but a negative list of restricted sectors as well as foreign exchange restrictions for foreign companies. Open econo mies have also become more restrictive when compared to 2010. This comes at a time when many open economies are strength ening their FDI review regimes for strategic and national security reasons.
China’s score on outward FDI restrictiveness was very high in 2010 reflecting a regime requiring approvals for every single outbound investment. Beijing made a significant push over the following decade to give firms more autonomy to invest abroad, especially in 2014 when China moved to a system that required firms to register their investments instead of obtaining approval. However, Beijing retracted these liberal policies in 2017 in light of large capital out flows. In 2021, China’s outbound FDI restrictiveness score was only slightly better than in 2010 and well short of that for open market economies. Scores for open economies have also remained mostly stable. While there are ongoing conversations about strengthening outbound investment review regimes in the United States for exam ple, these efforts have been prospective as of late, and therefore are not reflected in our scoring.
On aggregate, our Direct Investment Openness Composite Index puts China at around 0.53 in 2021, against an open-economy aver age of 6.53 within our sample of the ten largest open market econ omies (Figure 7). Based on the same criteria, China scored 0.55 in 2020, and 0.96 in 2010. China’s composite score reflects its low scores in both the de facto and de jure indicators—it came in last for all three measured years. China still maintains strict capital controls which limit its de jure scores; it also punches well below its weight when it comes to de facto measures of FDI intensity. This may come as a surprise to readers who often hear about the growing impact of China’s FDI flows abroad and who are maybe accustomed to think ing of China’s historical capacity to absorb FDI flows from abroad. However, while these flows are substantial in real terms, when viewed relative to the size of China’s economy they remain well below the levels associated with open economies.
As with other indicators, our de facto measures for direct invest ment openness are imperfect because they are influenced by a host of non-policy variables, such as market size, economic growth, and business cycles. Our measures for de jure restrictiveness reflect scoring judgments that are subject to a certain degree of subjectivity.
We update the abovementioned benchmark indicators yearly to track the pace and direction of change. On a quarterly basis, we take the pulse of various policy reforms that would move China either closer or further from the average of market economies in terms of its direct investment openness. From this exercise, we con clude that China’s policies toward FDI have not changed signifi cantly in the last year. We take note of de facto developments and incremental policy changes that took place in 2021 below:
According to official data, inbound FDI picked up in 2021, increas ing by 21 percent after a 6 percent increase in 2020. This investment was largely directed at the services industry and high-tech sectors, with FDI inflows increasing 16.7 percent and 17.1 percent, respec tively in the two sectors, according to China’s Ministry of Commerce (MOFCOM). China’s outbound FDI increased 9.2 percent over the course of the year. However, around 70 percent of inbound FDI flows come from Hong Kong. While much of this is genuine FDI orig inating from foreign subsidiaries based in Hong Kong, a consider able portion is likely the result of “round-tripping,” or the re-importa tion of exported earnings through Hong Kong-based entities.
In 2021, there were no substantial changes to China’s approach to FDI. China made minor adjustments to both its national and free trade zone negative lists at the end of 2021. Both negative lists saw a reduction in the number of industries subject to restric tions, though they also placed new restrictions on investment into the news media sector. Overall, the structure of China’s FDI regime remained intact.
In addition to tracking policy developments, we are also watching higher-frequency, often China-specific, indicators to gauge prog ress. Figure 7.2 presents these indicators, including measures of China’s outbound and inbound FDI flows; the inward and outward FDI stock for the top ten market economies; and China’s role in global M&A transactions.
21 Annual Report on Exchange Arrangements and Exchange Restrictions 2019, International Monetary Fund, August 10, 2019, https://www.imf.org/en/Publications/Annual-Reporton-Exchange-Arrangements-and-Exchange-Restrictions/Issues/2020/08/10/Annual-Report-on-Exchange-Arrangements-and-Exchange-Restrictions-2019-47102.
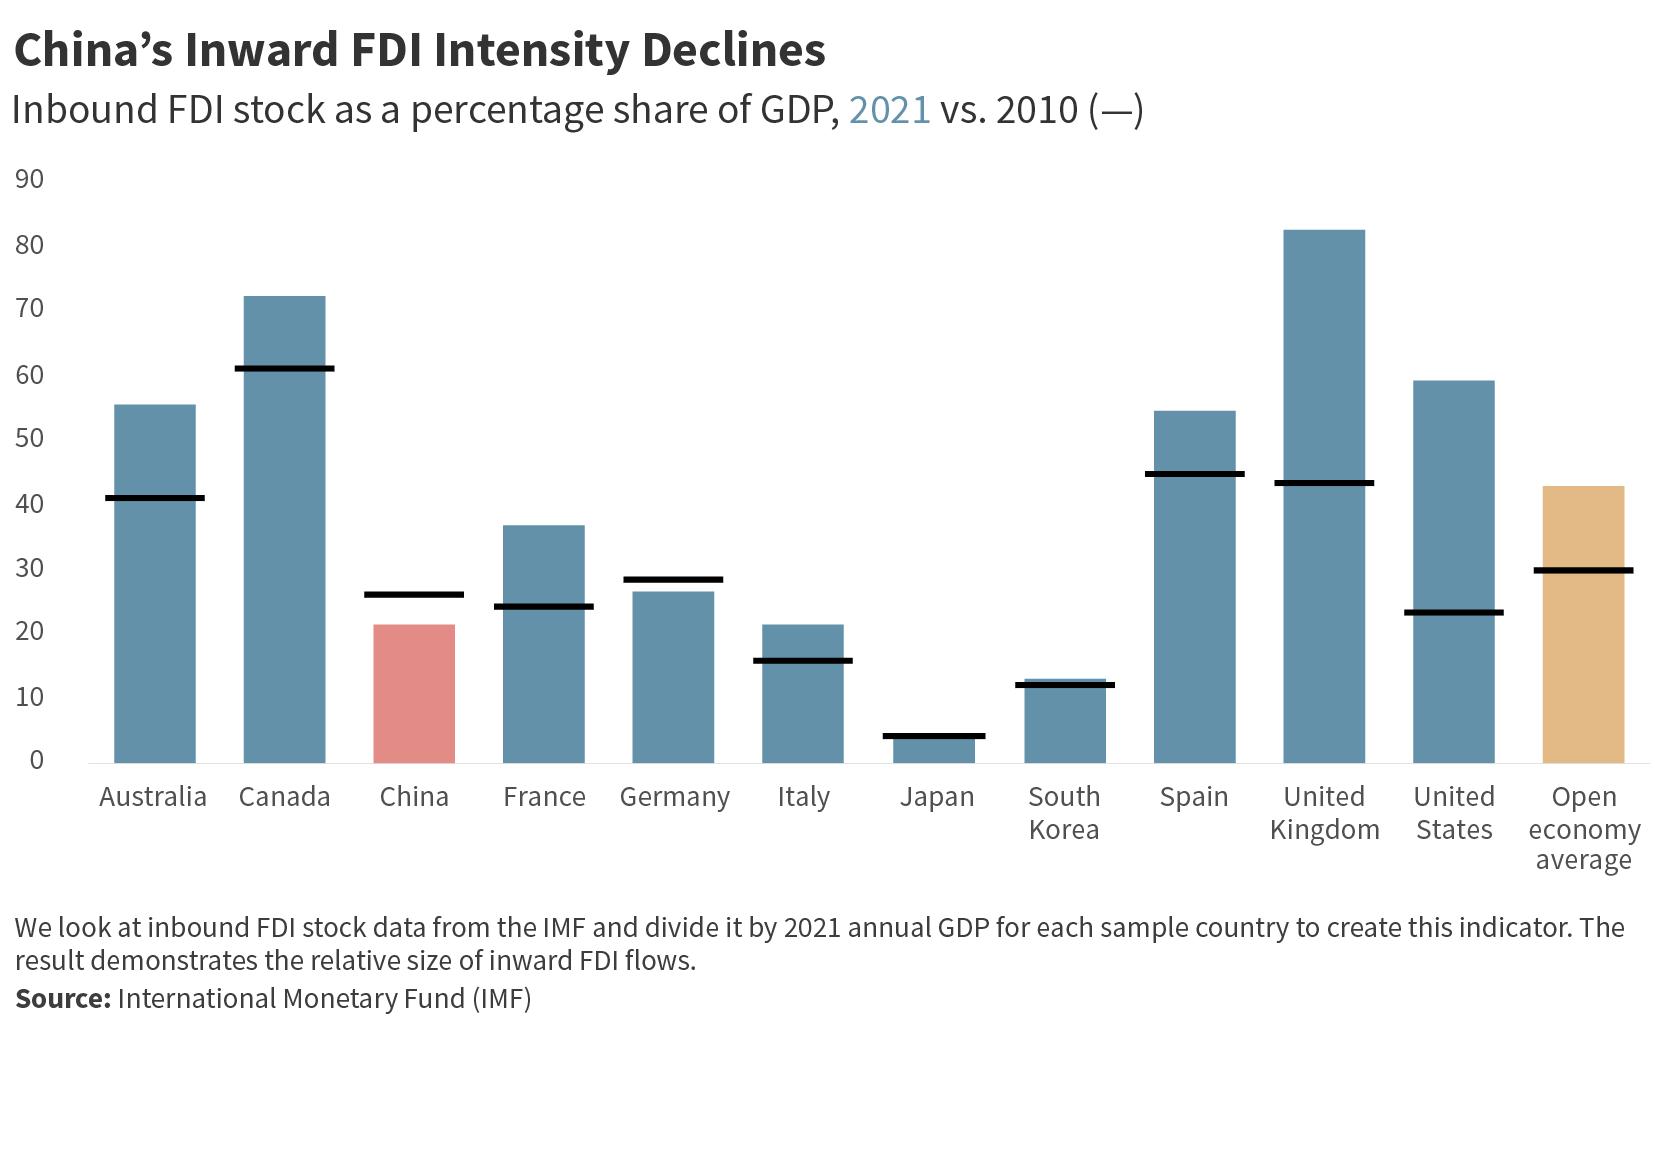
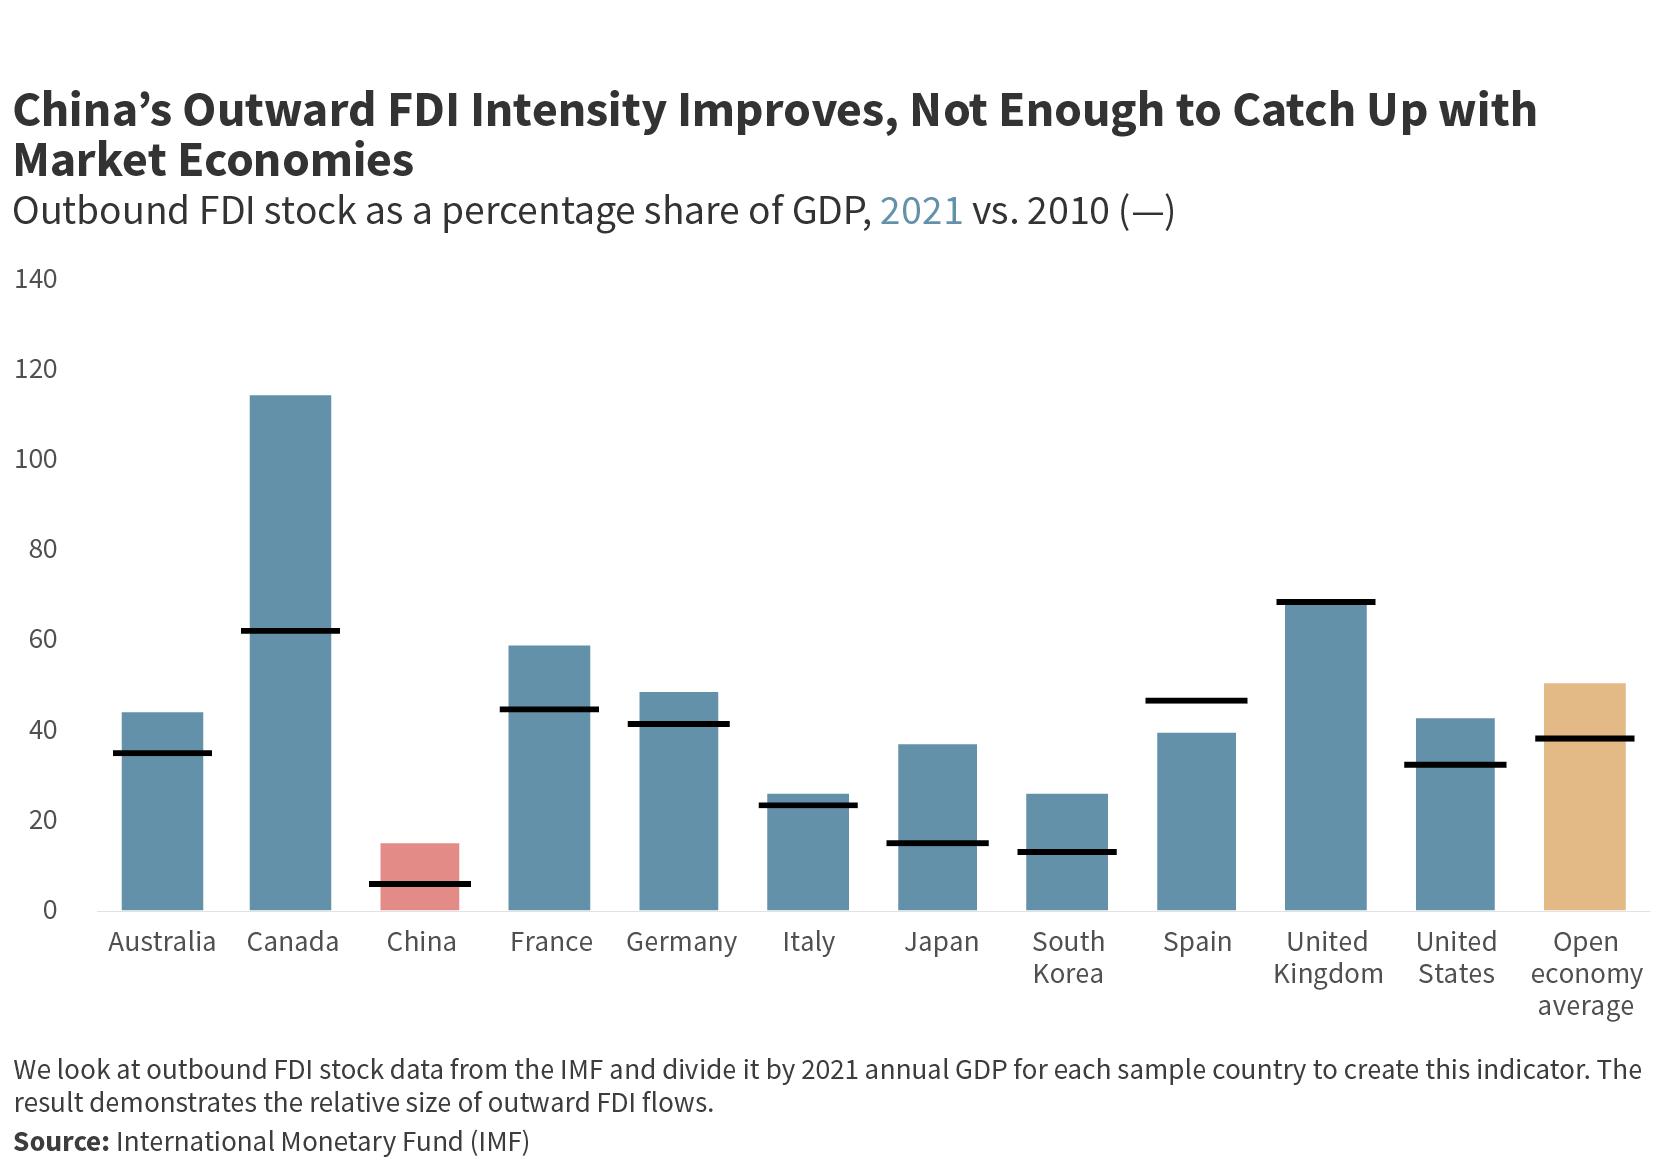
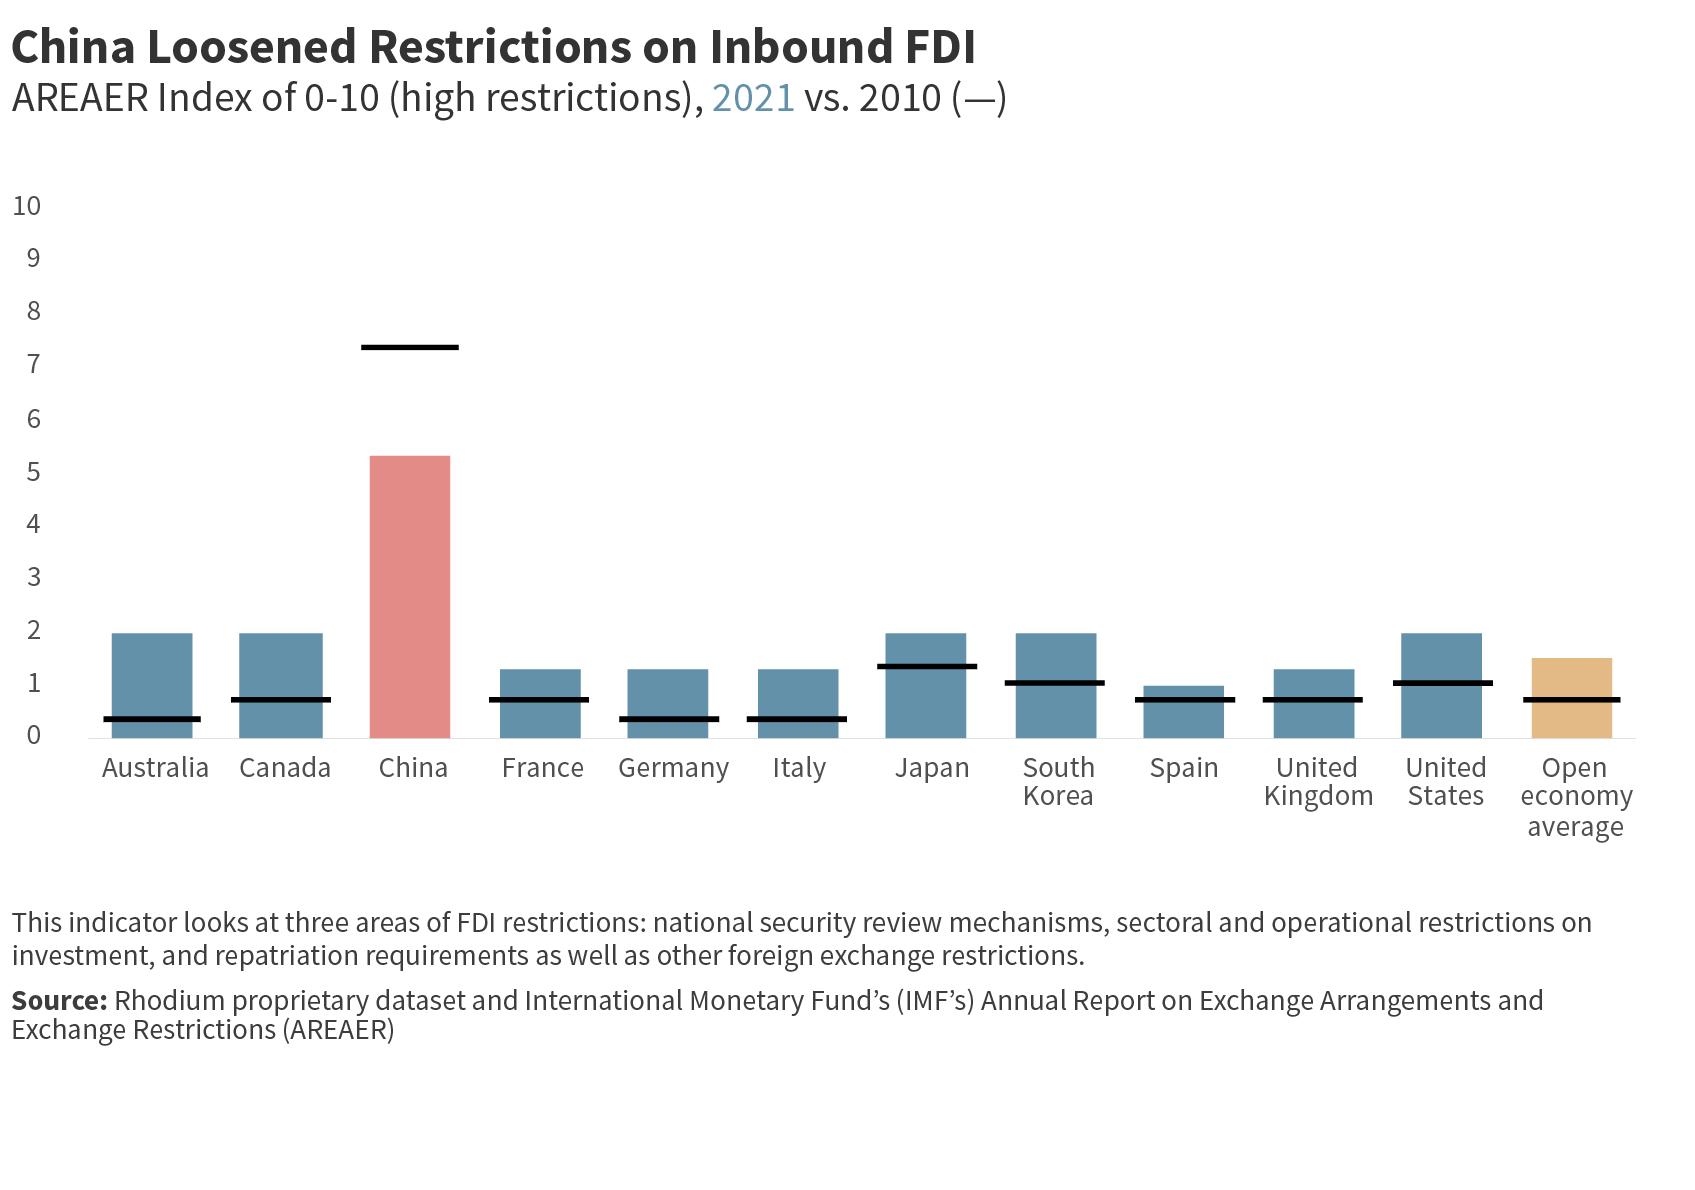
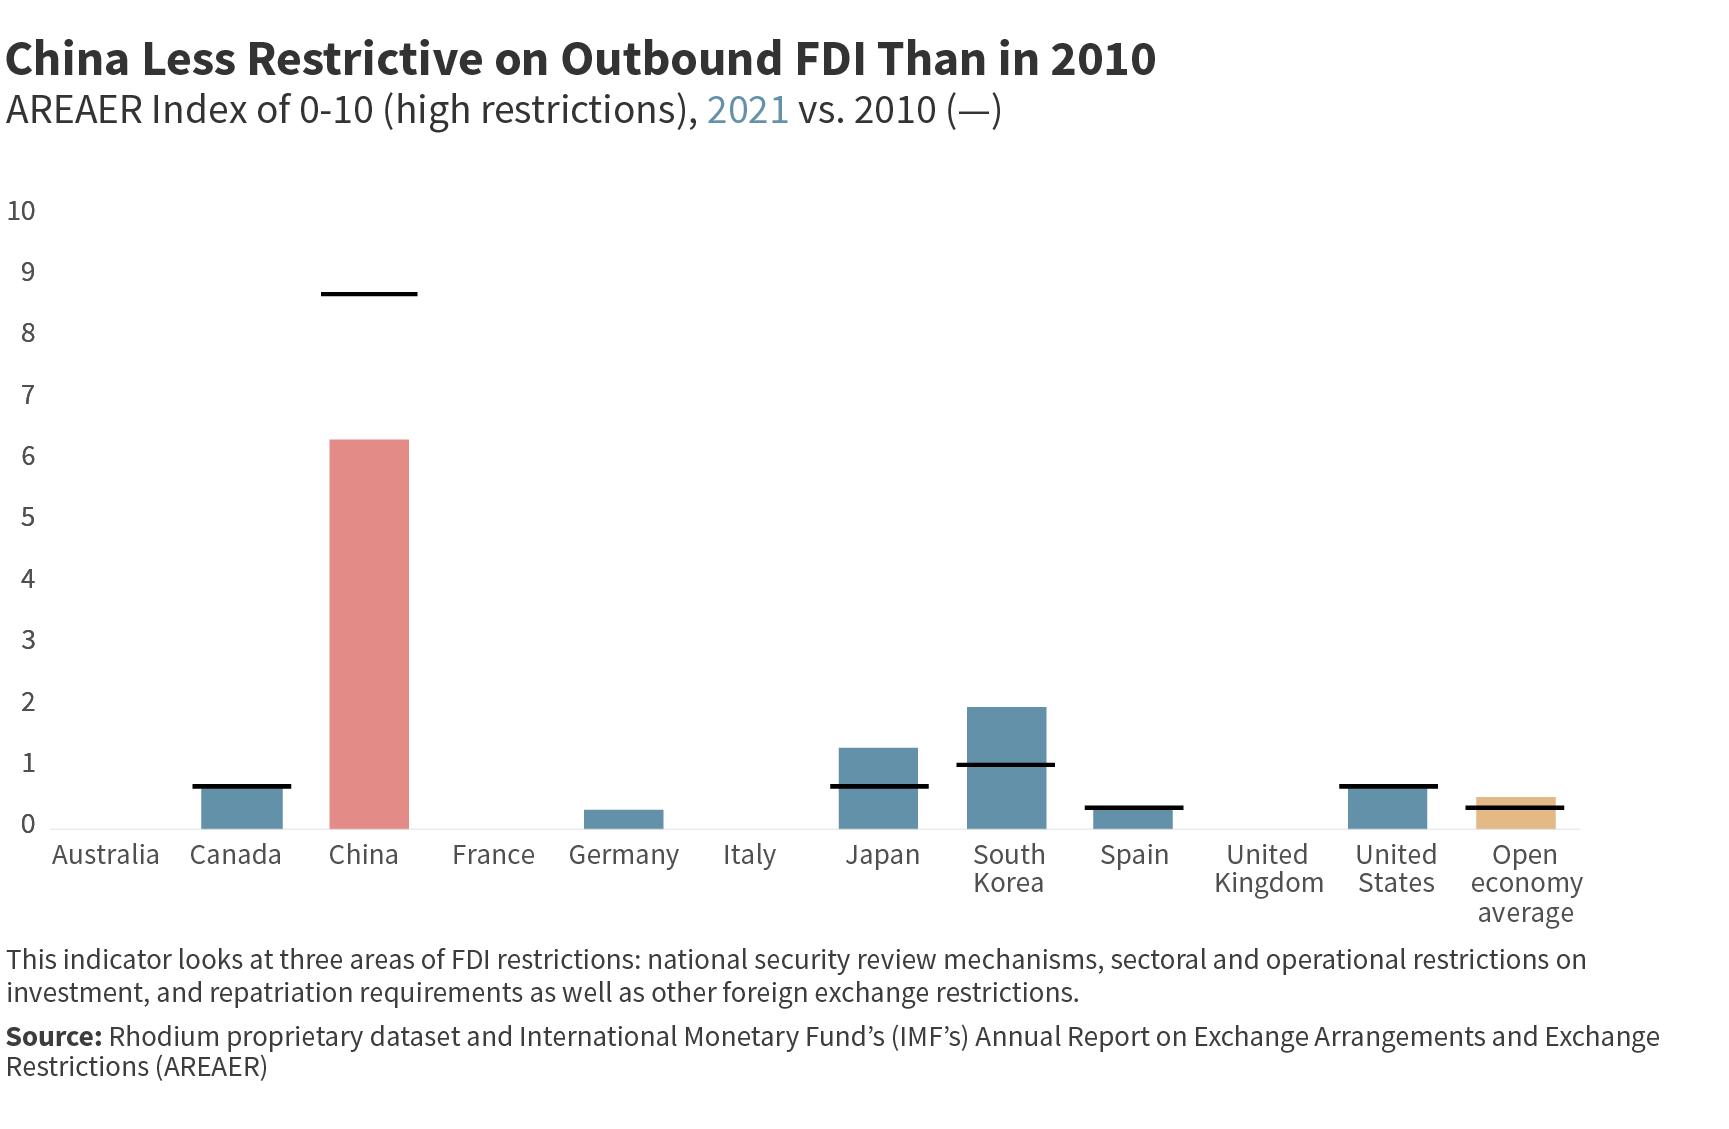
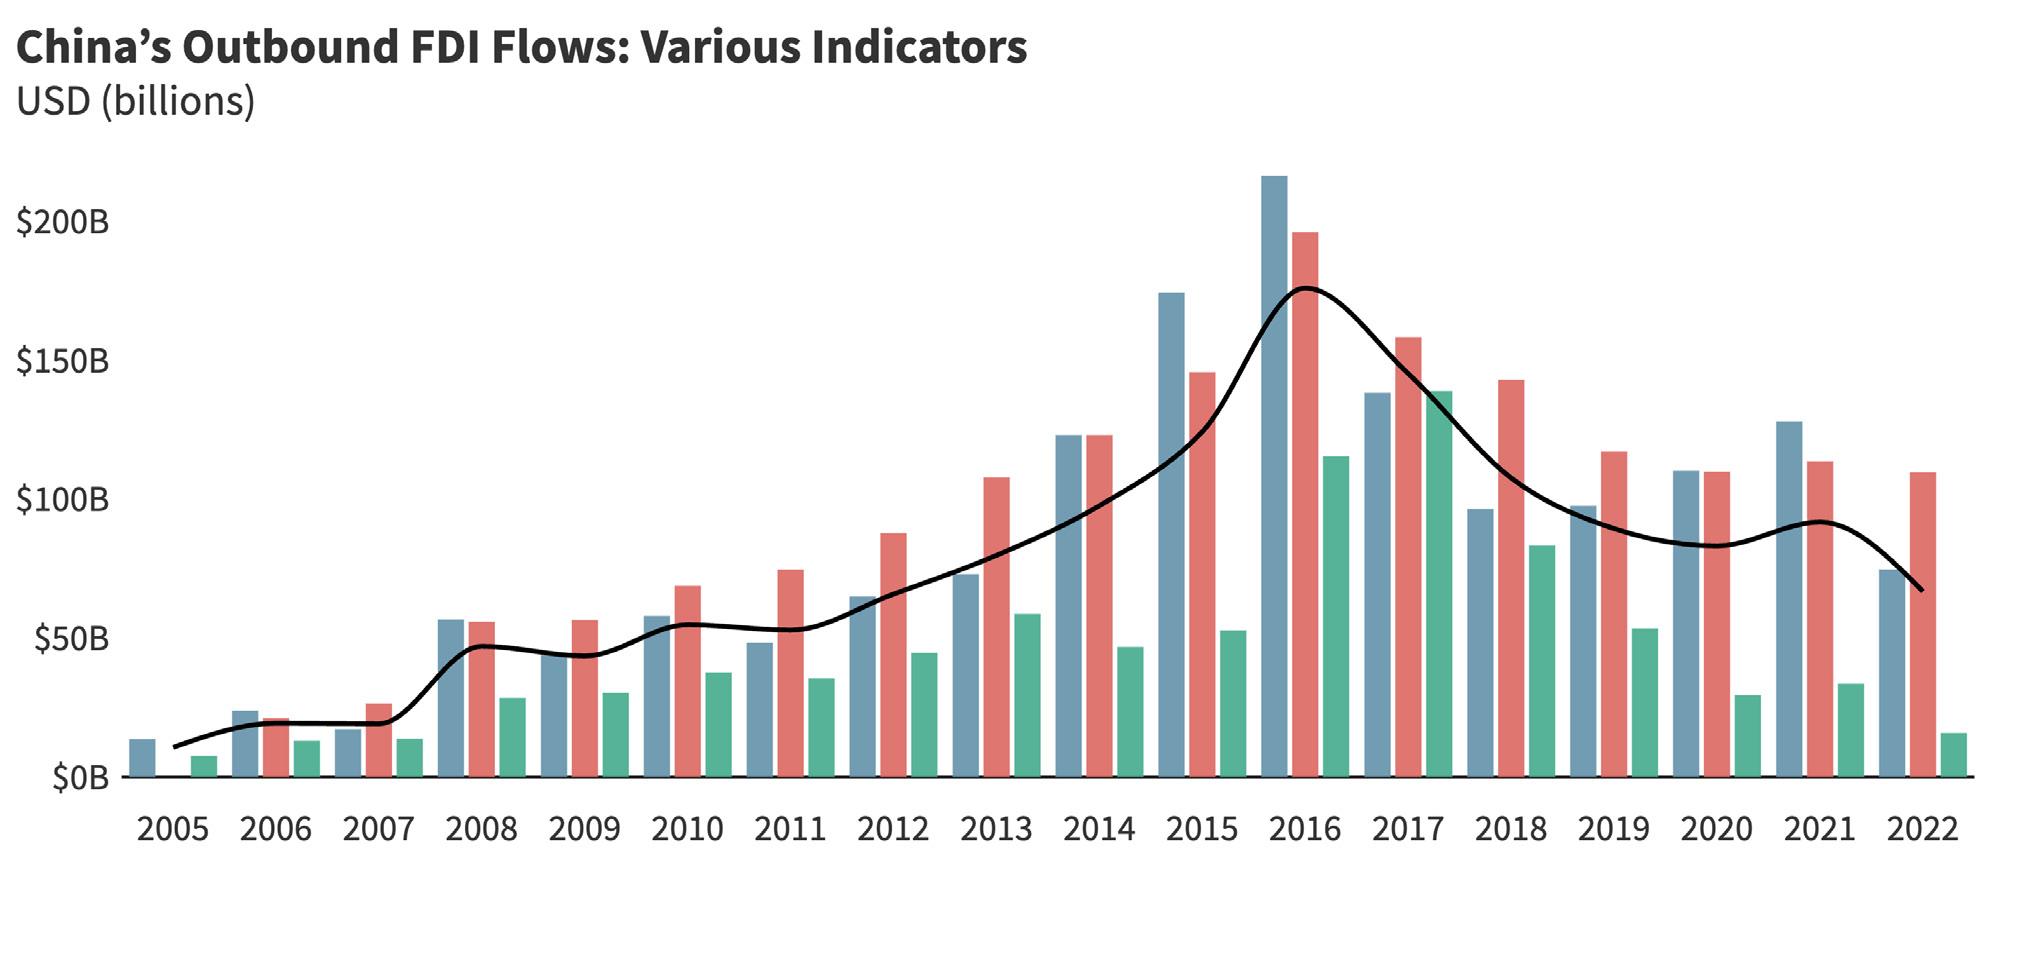
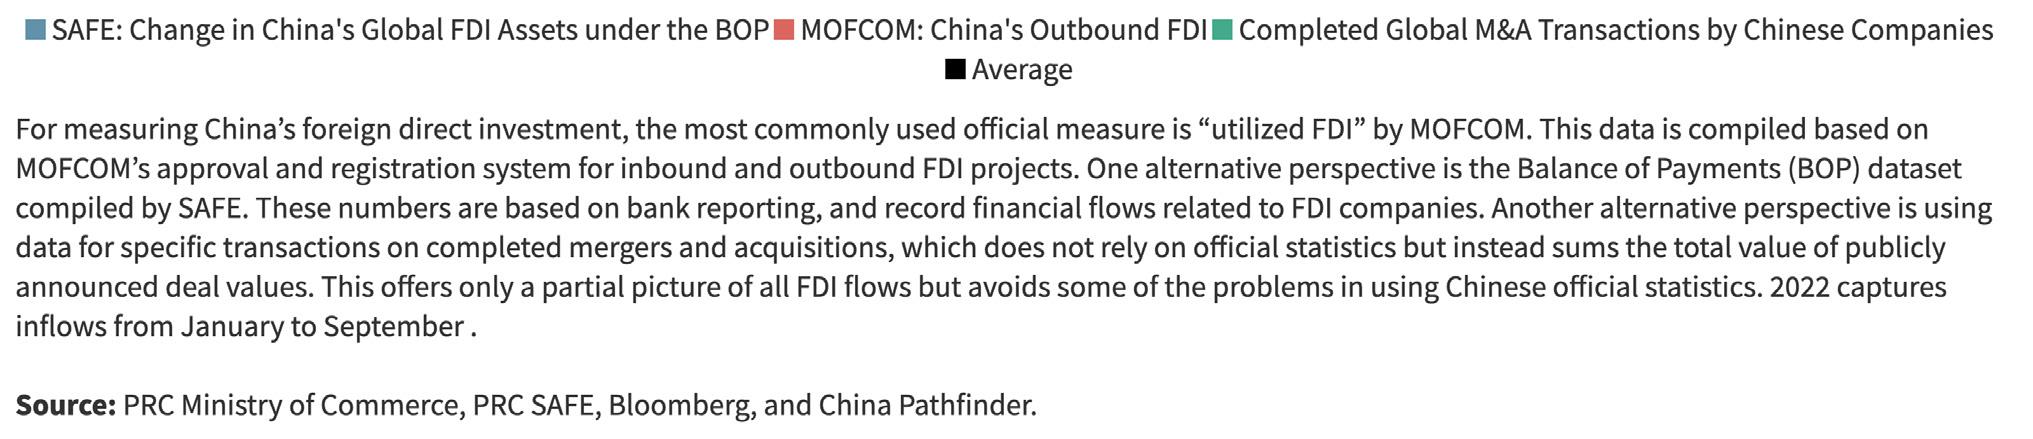
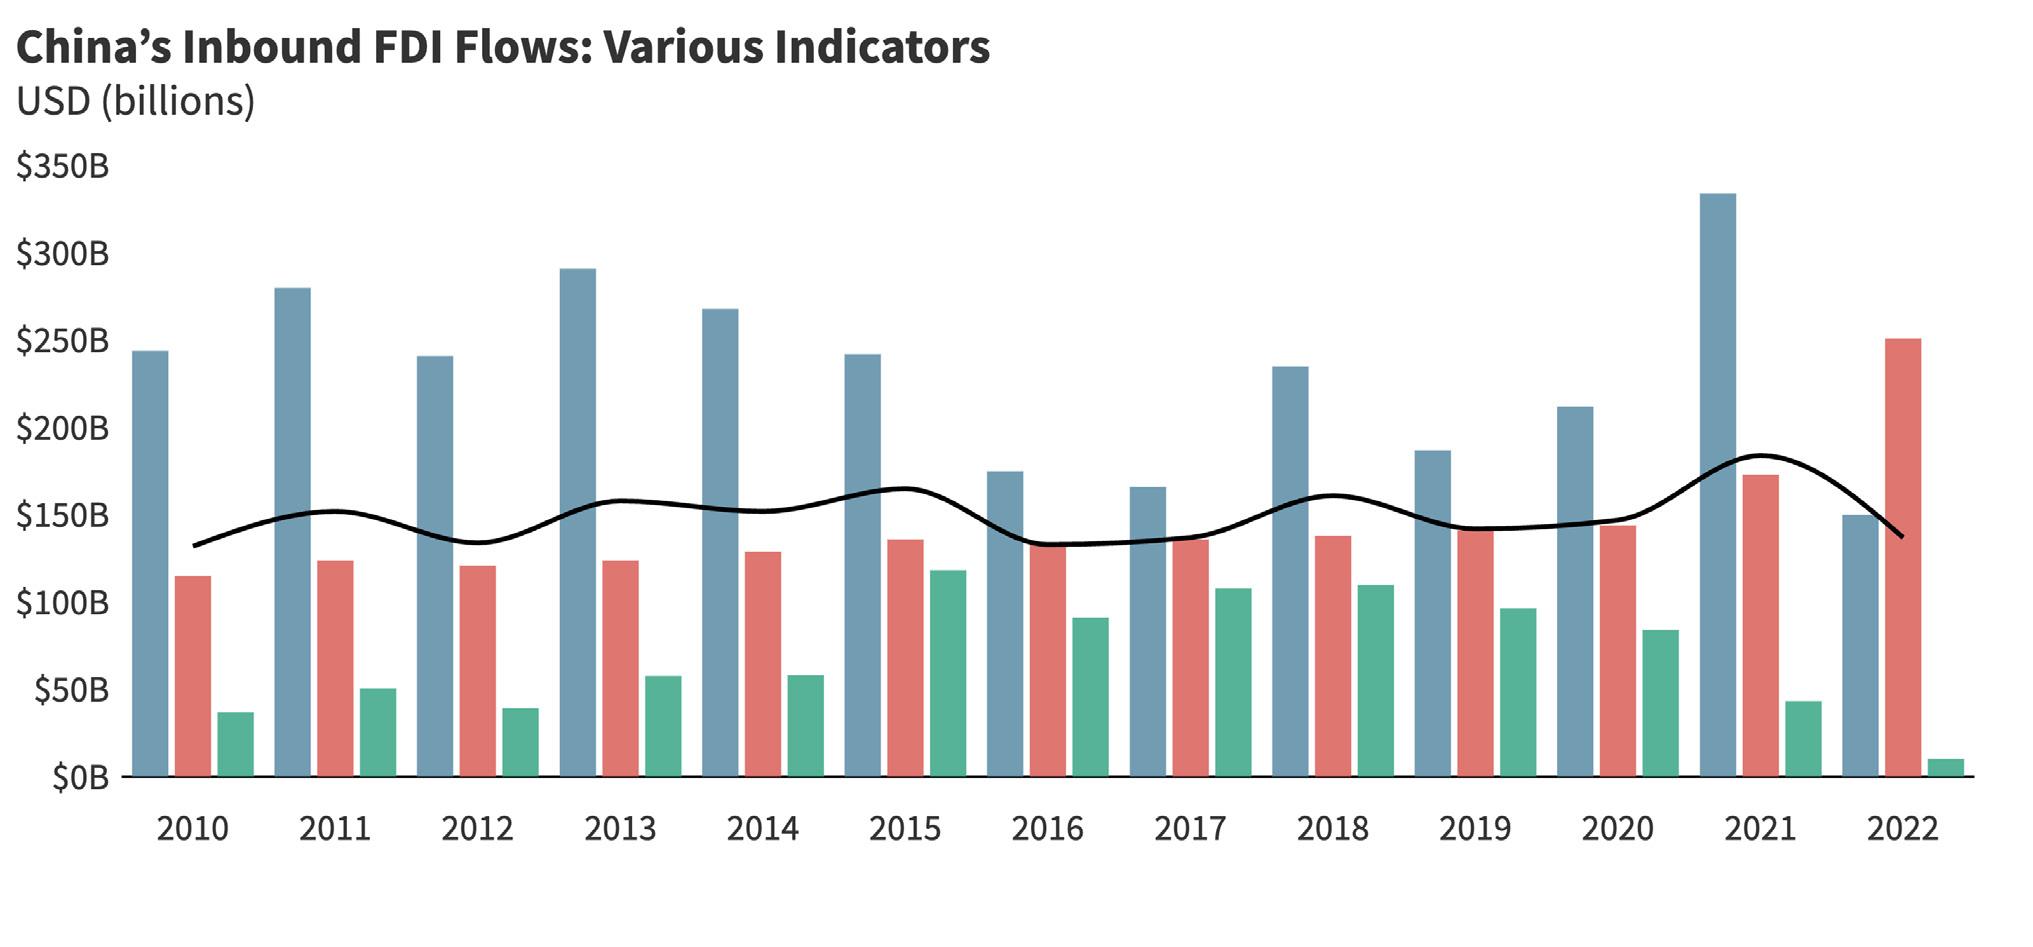
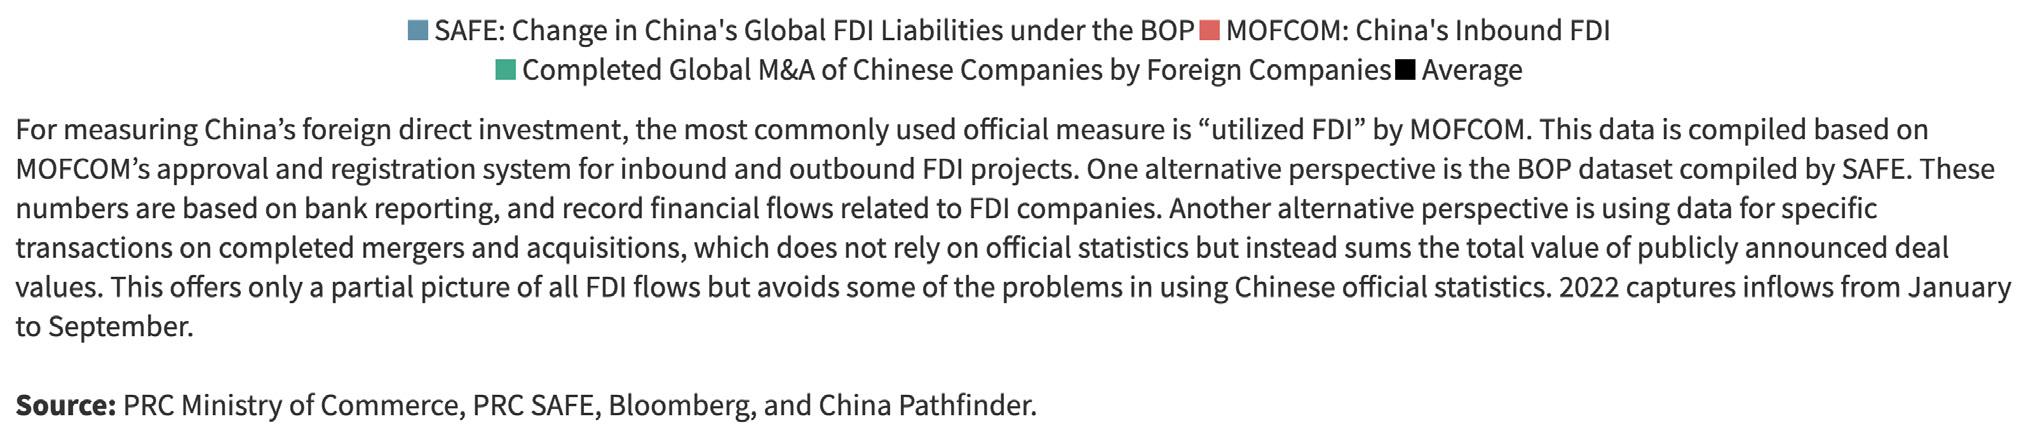
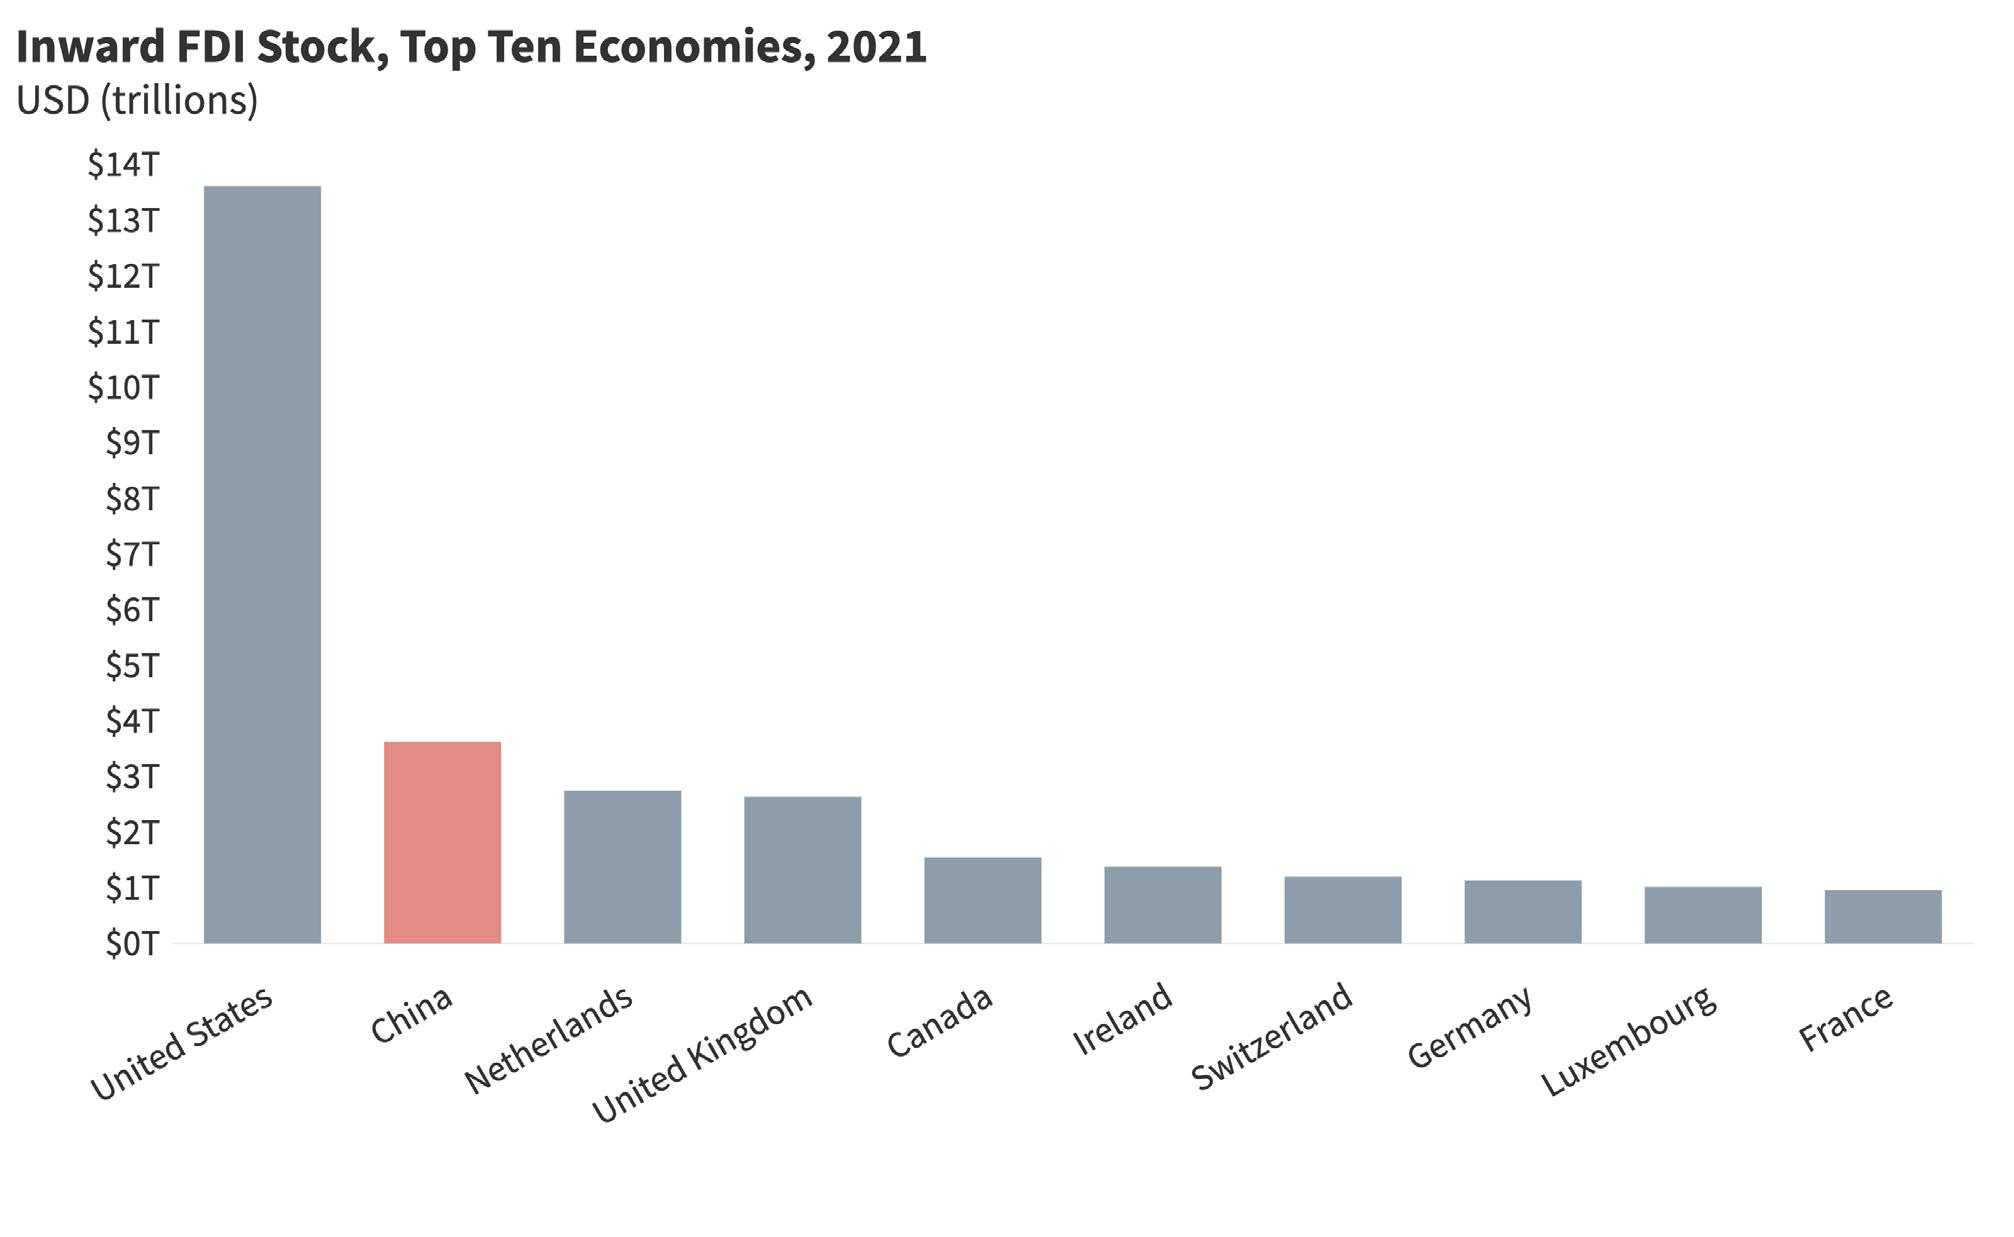
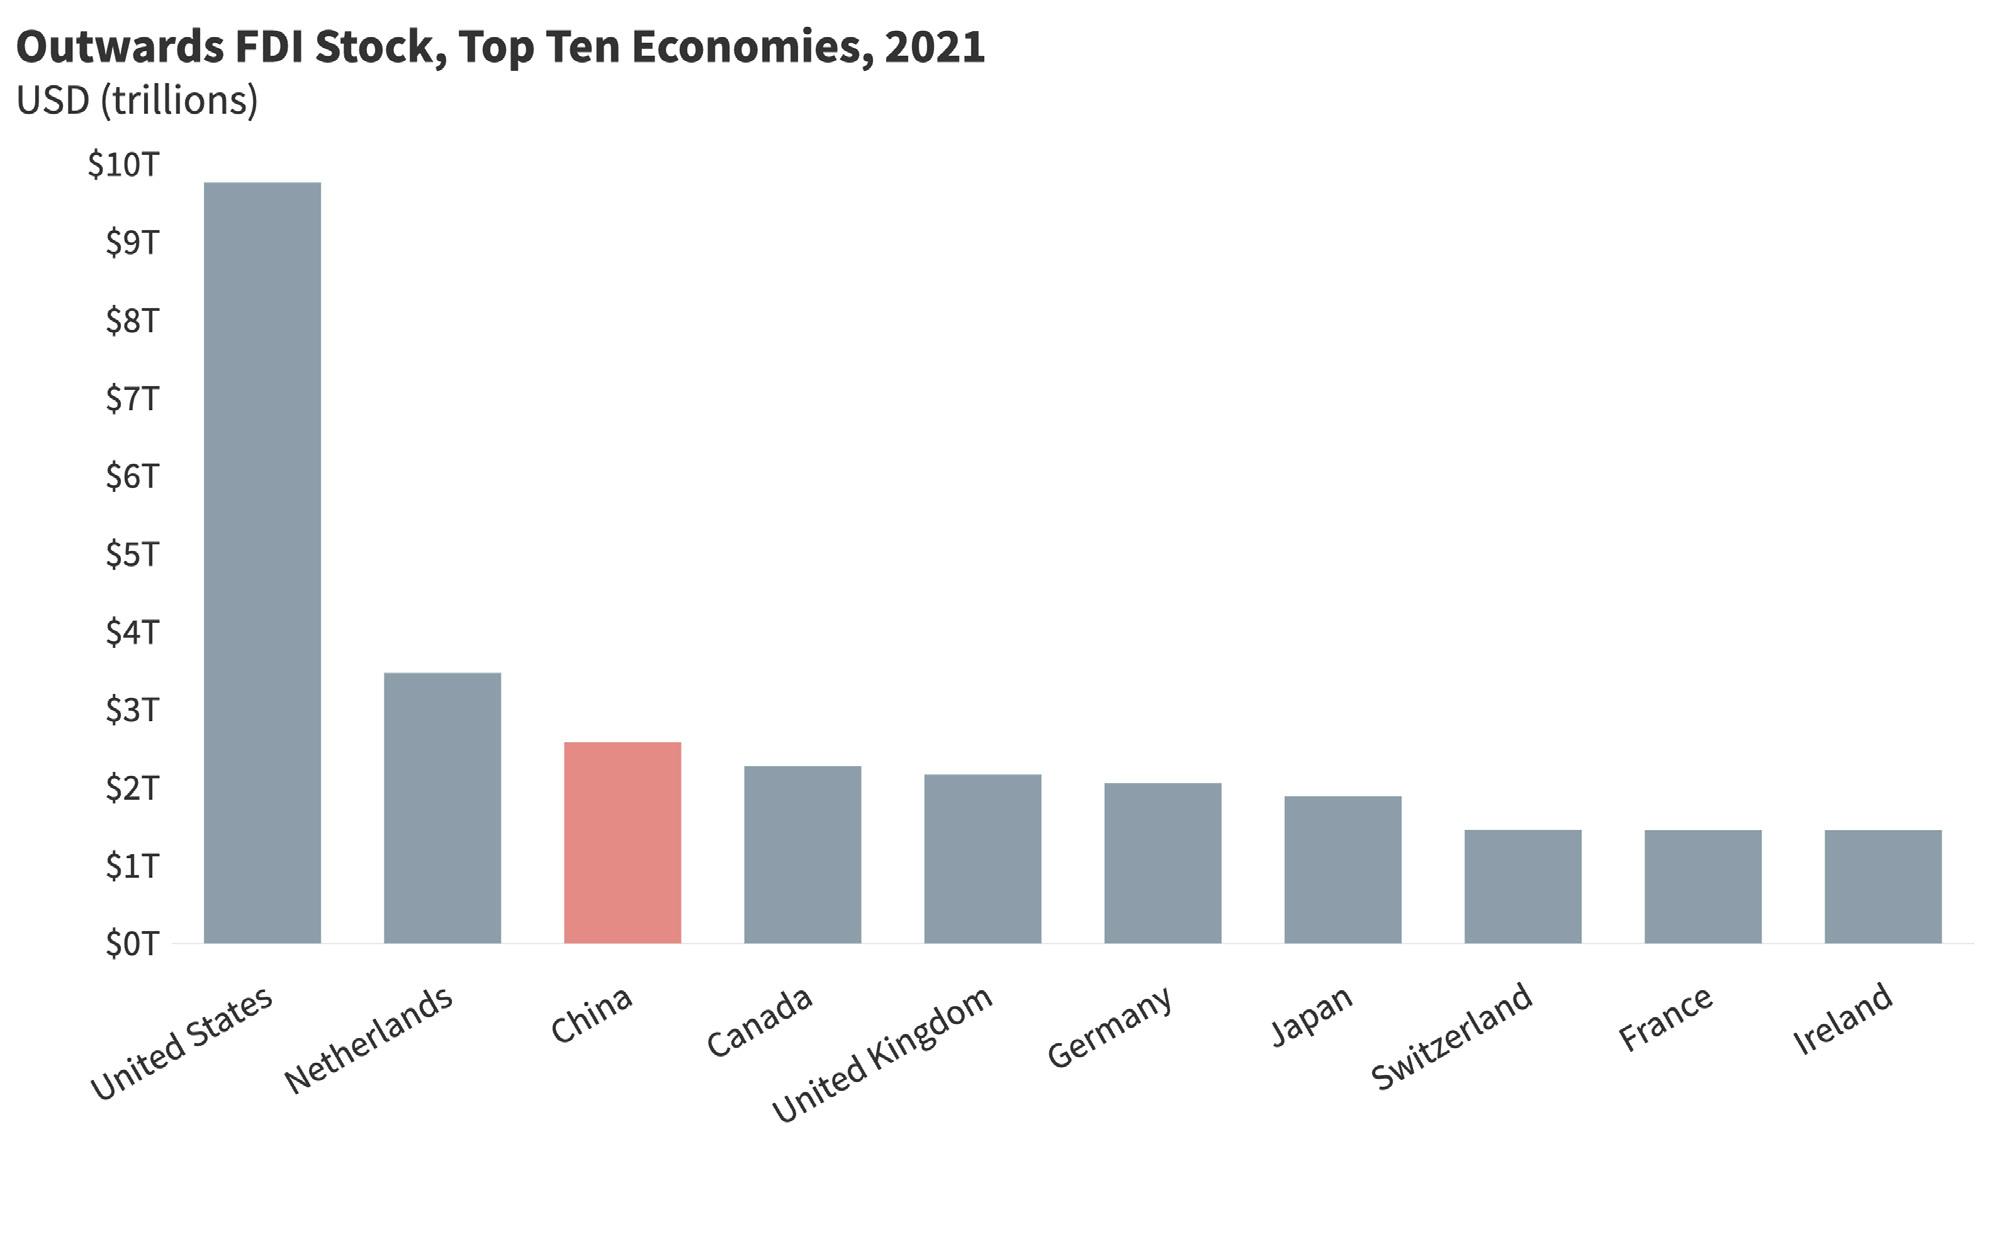
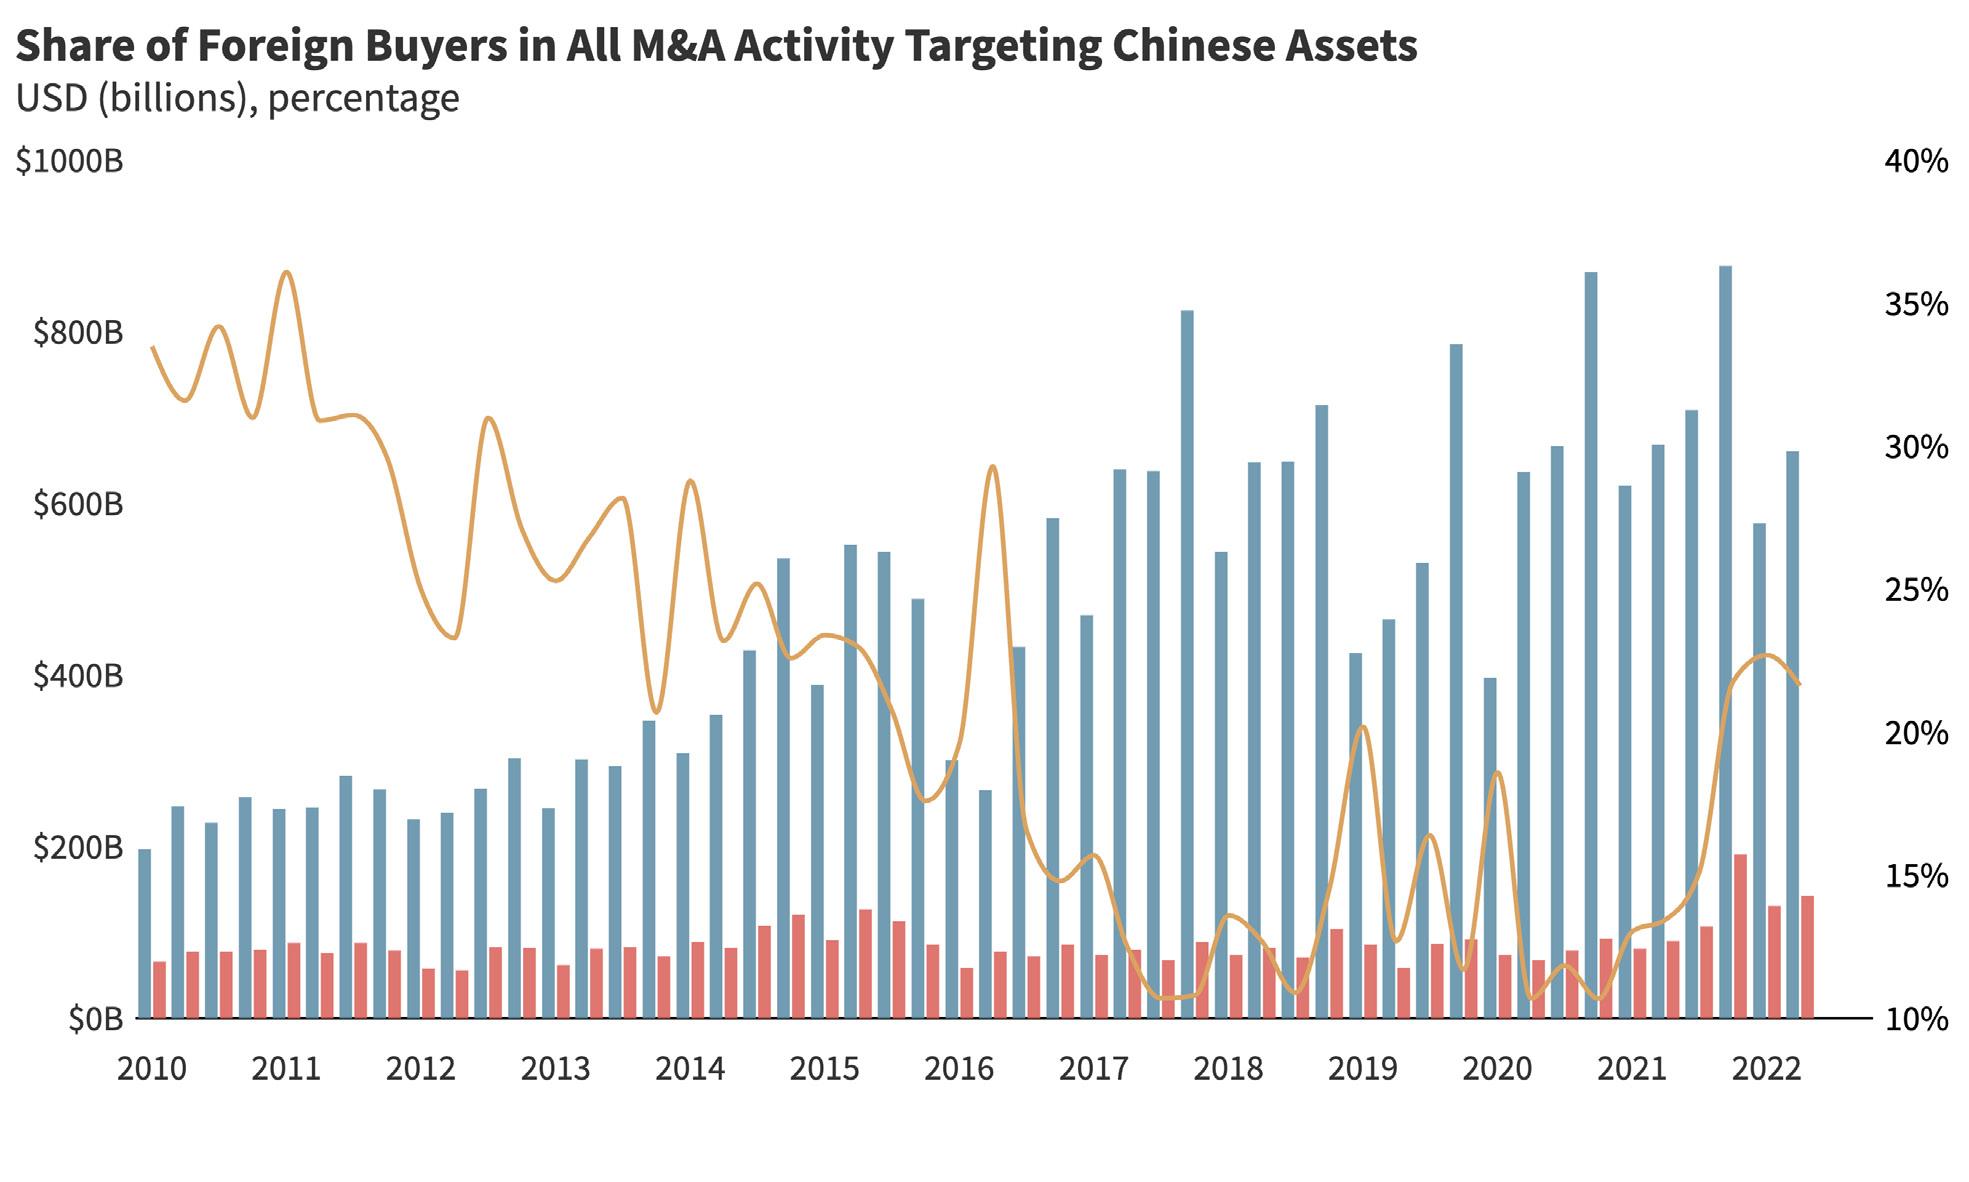
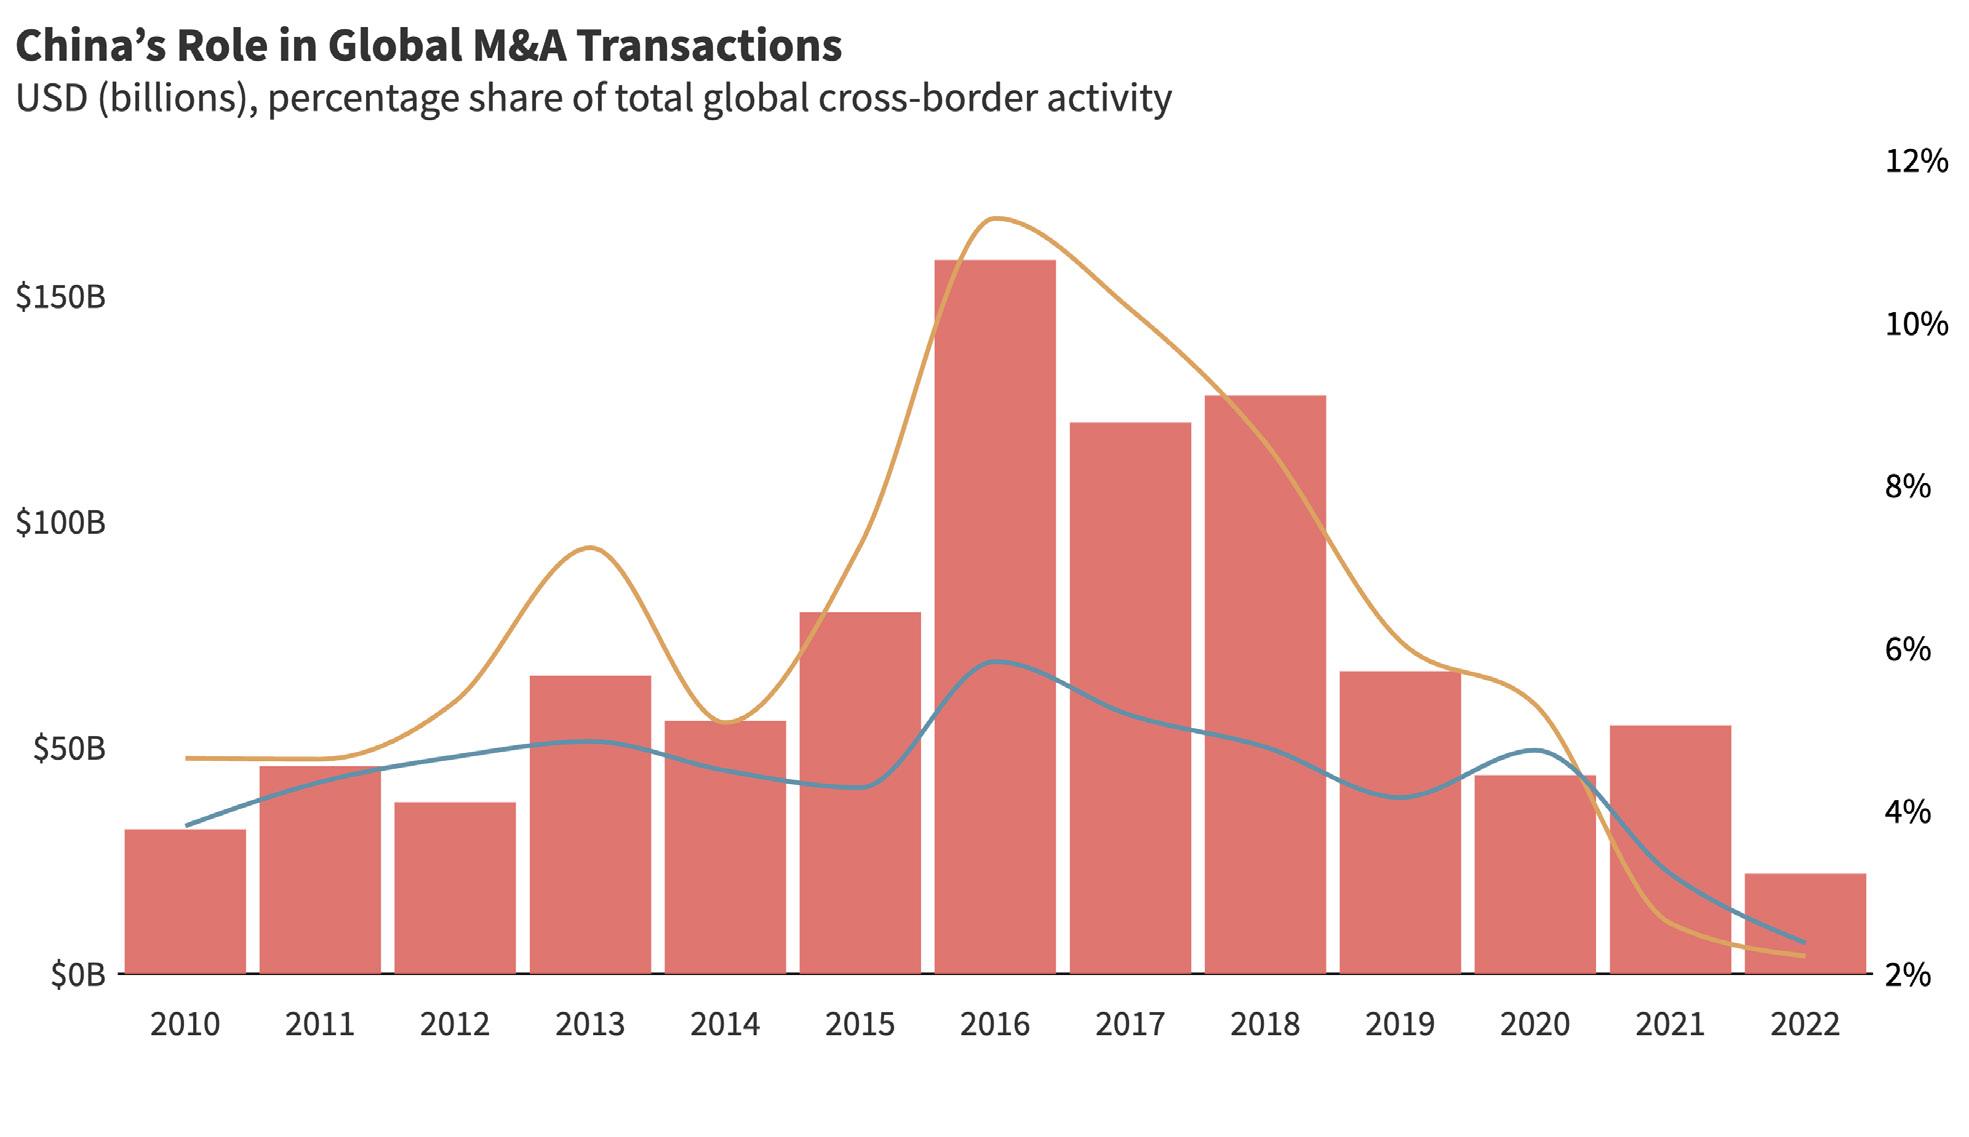
Measure of portfolio investment openness, from 0 (low) to 10 (high). Source: China Pathfinder.
Portfolio investment openness refers to limited controls on twoway cross-border investment into equities, debt, and other financial instruments. Portfolio investment openness is a key ingredient for financial market efficiency and market-driven exchange rate adjust ments in open market economies.
We apply the following annual indicators to benchmark China against open market economies in terms of portfolio investment openness.
To measure the de facto openness to portfolio investment, we cal culate the sum of cross-border debt assets and liabilities relative to the size of the economy as well as the sum of cross-border equity assets and liabilities relative to the size of the economy Assets are holdings of foreign securities by residents, and liabili ties represent foreign holdings of securities issued by residents. China falls well below the open-economy average for both debt securities (government and corporate bonds) and equity secu rities (stocks). Cross-border debt assets and liabilities as shares of GDP are around 6.5 percent, vastly below the open-economy
average of 103.3 percent. Cross-border equity assets and liabilities are only 11.2 percent of China’s GDP, which pales in comparison to the open-economy average of 98.7 percent. These results are rel atively similar to those of 2020, though scores for nearly all econo mies have dropped, likely as a result of increases in GDP associated with the pandemic recovery. When compared to 2010, China has improved markedly in 2021, with cross-border debt assets and lia bilities nearly doubling from 3.5 percent of GDP. On the equity side of the equation, improvement has been less swift, with cross-border equity assets and liabilities having increased under 3 percentage points from 7.9 percent in 2010.
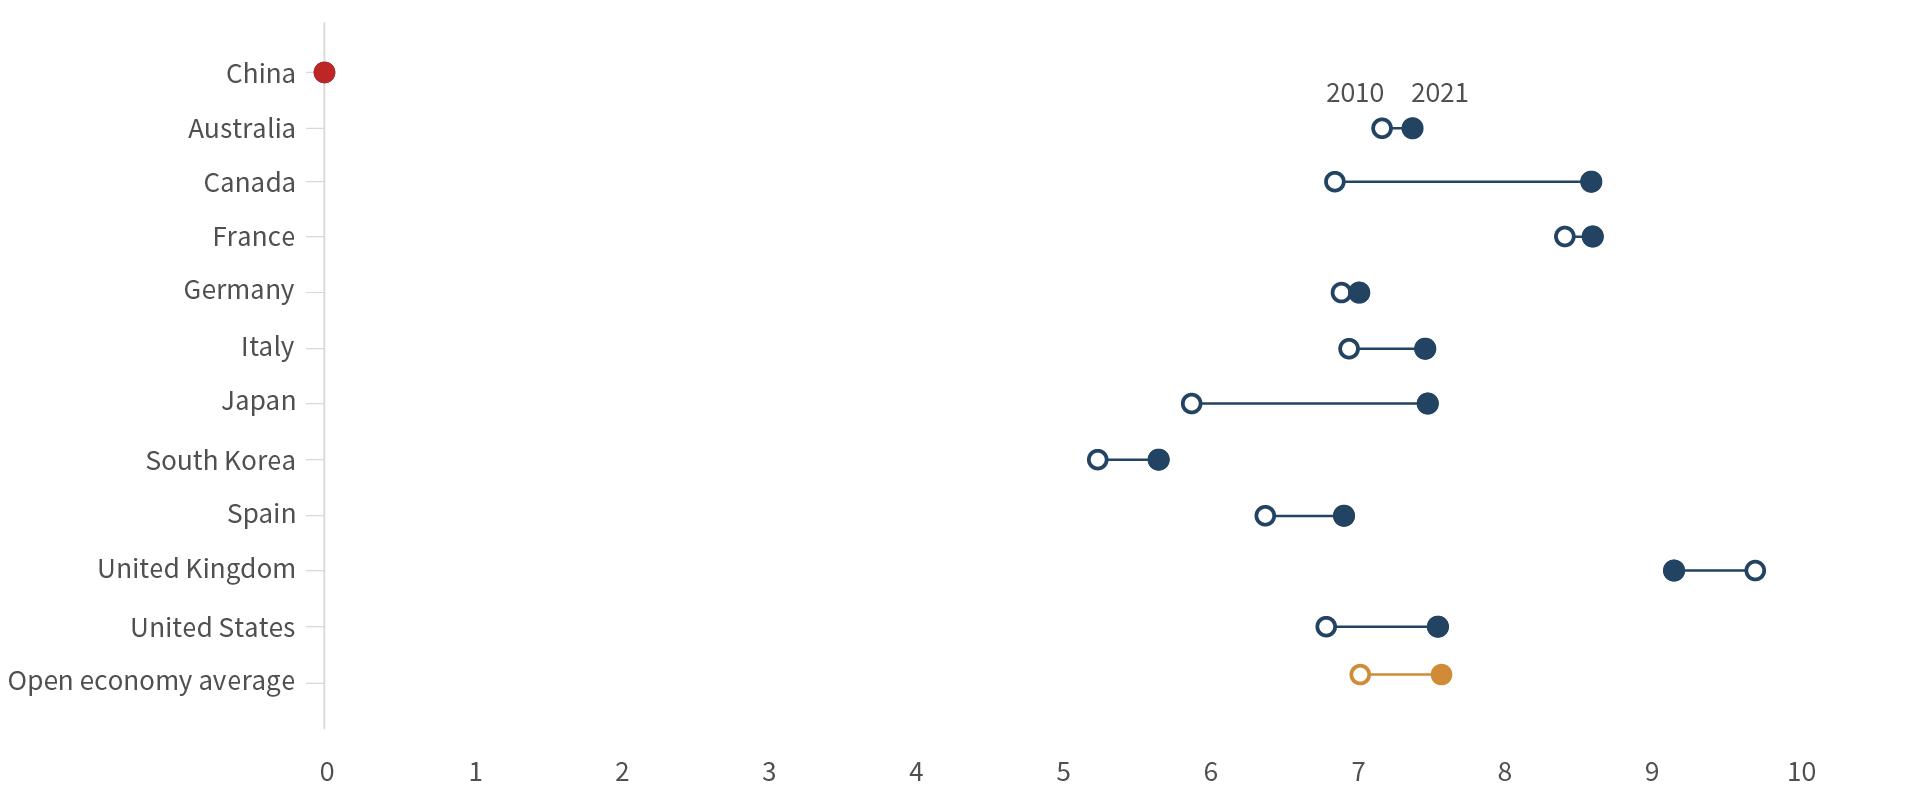
For a de jure perspective, we create our own Portfolio Investment Restrictiveness Indicator that captures regulatory restrictions on portfolio investment flows based on the IMF’s AREAER database and our own research. We calculate separate indices for portfolio outflow and inflow restrictiveness. The inward portfolio restrictive ness indicator captures restrictions on the purchase of bonds and equity securities locally by nonresidents as well as on the sale and issuance of bonds and equity securities abroad by residents. The outward portfolio restrictiveness indicator captures restrictions on the purchase of foreign securities by residents as well as restrictions on the sale and issuance of bonds and equity securities locally by nonresidents.
On inward portfolio restrictiveness, China has historically kept tight controls on the inflow of foreign short-term capital, with the excep tion of narrow programs such as the Qualified Foreign Institutional Investor (QFII) Scheme. Over the past decade China’s score has improved as Beijing has expanded access to the onshore securi ties through stock and bond connect schemes. However, foreign investors remain constrained by quotas and the lack of infrastruc ture for sophisticated cross-border settlements, which kept China’s score far below open market economies in 2021. No major reforms to China’s current portfolio investment regime were made in 2021, so scores for this indicator remain well below the open-economy average.
China’s score on outward portfolio restrictiveness was similarly low in 2010, and Beijing has remained even more cautious to liberal ize outbound portfolio channels due to concerns about large-scale capital outflows and implications for financial system and exchange rate stability. Compared with 2020, households remain generally unable to invest in overseas securities and institutional investors remain constrained to special programs and quotas, leaving China’s 2021 score far below the advanced economy average.
Our Portfolio Investment Openness Composite Index puts China at 0 in 2021, against an open-economy average of 7.6 within our sample of the ten largest open market economies (Figure 8). Portfolio openness is the only cluster for which China has a score of 0 for 2010, 2020, and 2021. This means that for all four indicators examined, China had the score associated with the lowest level of openness for every year in our sample. This score demonstrates that in terms of portfolio openness, China still remains far behind the open economy average. This result also shows a high degree of polarization between China and the OECD economies, which is not necessarily surprising given that China exercises a level of control over its capital account that is distinct from open market economies.
It is important to note that the composite scores are always rela tive to the scores of other countries. In other words, while China had improvements over the intervening years, it still ranked lowest compared to any of the market economies in every indicator across all three measured years, resulting in an average score of zero. Particularly in the de jure measures of portfolio openness we have seen large improvements in the ability of foreigners to access and participate in China’s markets relative to 2010.
Portfolio investment is highly mobile and volatile, so our de facto measures are susceptible to fluctuations caused by market senti ment, macroeconomic dynamics, and other factors. Portfolio invest ment data are also heavily impacted by tax optimization and finan cial system designs. Finally, our measures for de jure restrictiveness are based on human judgment and, thus, reflect a certain degree of subjectivity.
We update the abovementioned benchmark indicators yearly to track the pace and direction of change. On a quarterly basis, we take the pulse of various policy reforms that would move China either closer or further from the average of market economies in terms of its portfolio investment openness. From this exercise, we have selected two significant developments that took place in 2021:
2021 was a notable year for the regulatory regime that governs port folio investment in China. This was particularly true on the outbound side. For example, the Chinese government published several reg ulations restricting where firms that store large amounts of data can list and what kind of regulatory approvals they need in order to do so. One of the most dramatic consequences of this was Didi’s forced delisting from the New York Stock Exchange in December 2021 after pressure from the Cyberspace Administration of China as part of the broader tech crackdown, despite earlier approval by the China Securities Regulatory Commission (CSRC). Didi’s official del isting occurred later, in June of 2022.
A number of Chinese firms listed in the United States face the spec ter of delistings due to an ongoing dispute over access to audit work papers between the Public Company Accounting Oversight Board (PCAOB) in the US and the CSRC. While the dispute has been simmering for over a decade, the passage of the Holding Foreign Companies Accountable Act in 2020 and PCAOB’s 2021 determination that it was unable to properly investigate auditors based in China and Hong Kong has set in motion a timeline that would force US-listed Chinese firms that retain China-based audi tors to delist from US exchanges in 2024.22 Though US and Chinese regulators reached an agreement in August 2022, US officials cau tioned that this was only a first step and that full cooperation with PCAOB investigators would be necessary to bring China into com pliance with US law. The core of the conflict—China’s reluctance to allow the PCAOB access to working papers of auditors of Chinese companies listed in the US due to vague concerns about national security—remains unresolved.23 This points to the continued differ ences between China’s system and that of the open economies in which it is a major participant.
In addition to tracking policy developments, we are also watching higher-frequency, often China-specific, indicators to gauge prog ress. Figure 8.2 presents these indicators, including the change in foreign holdings of Chinese bonds and equities; foreign holdings of Chinese portfolio securities by investor country; total foreign hold ings of RMB assets; the share of China’s currency in international payments; and net movement through the Shanghai-Hong Kong and Shenzhen-Hong Kong Stock Connects.
22 Firms would face trading prohibitions once an issuer has been identified by the SEC for three consecutive years (2022, 2023, 2024).
23 For now, the deadline to avoid delisting is late 2023, but there has also been proposed legislation that could advance this process to as early as 2023.
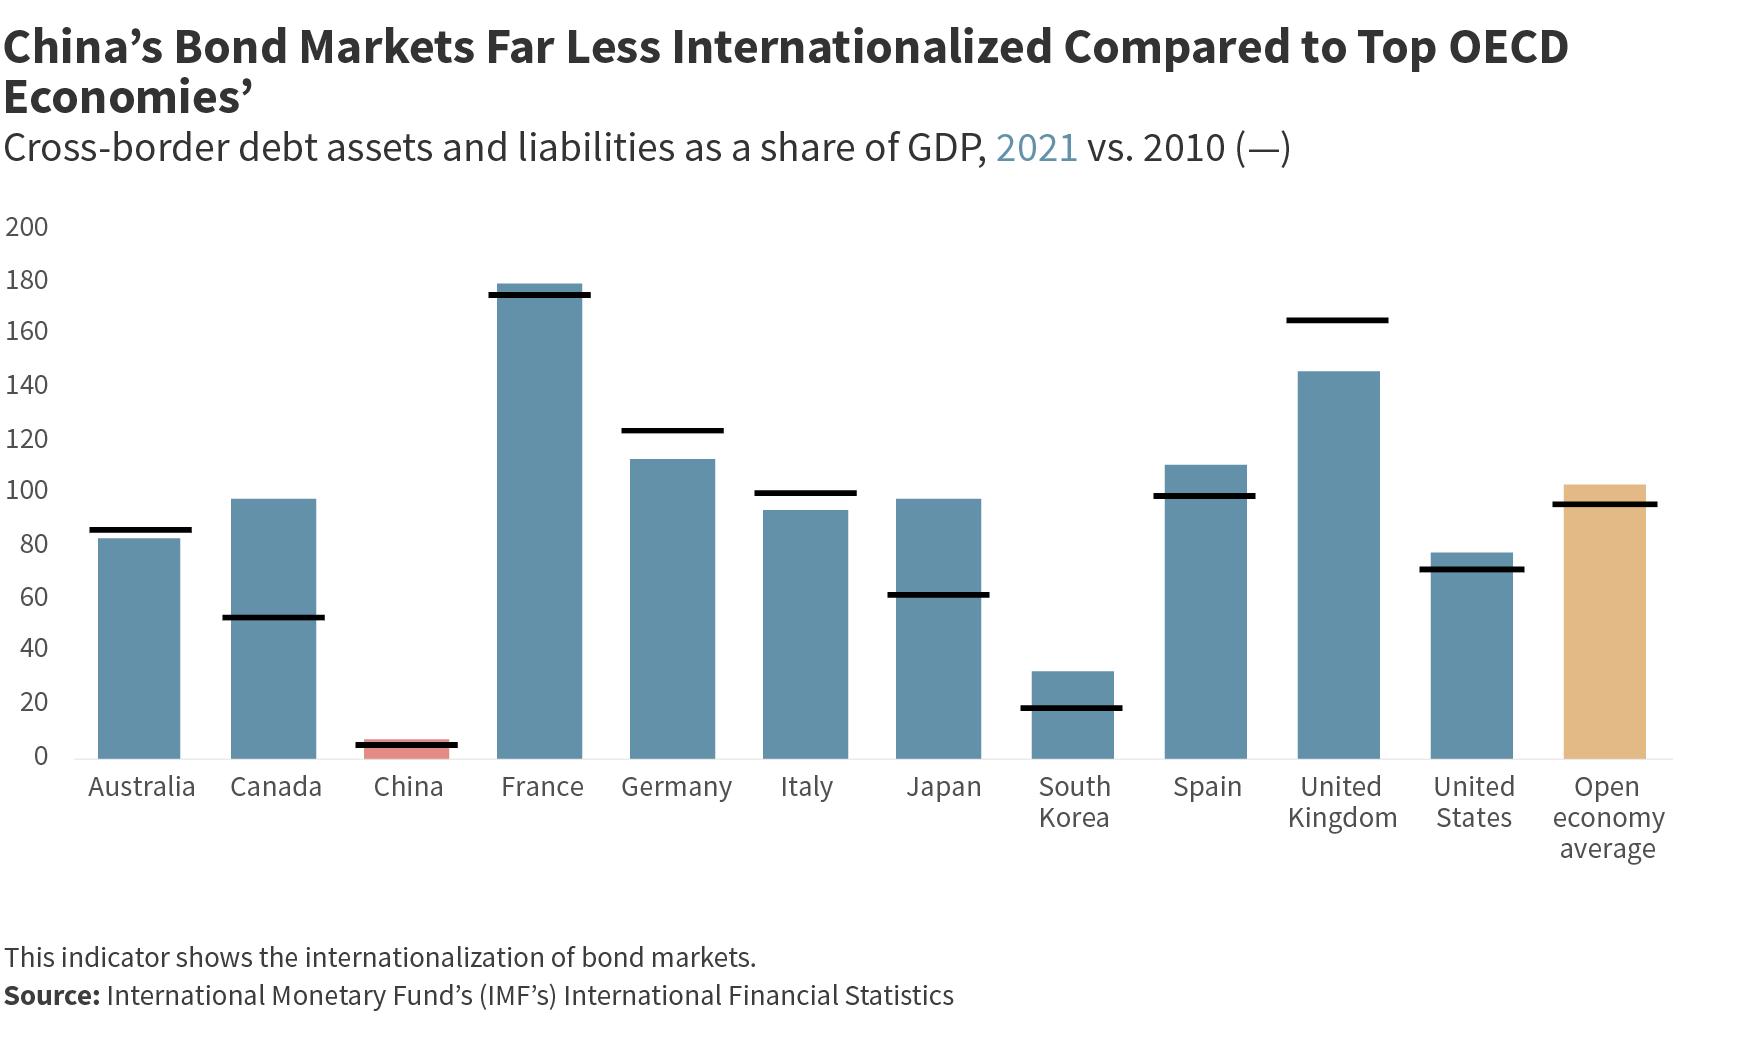
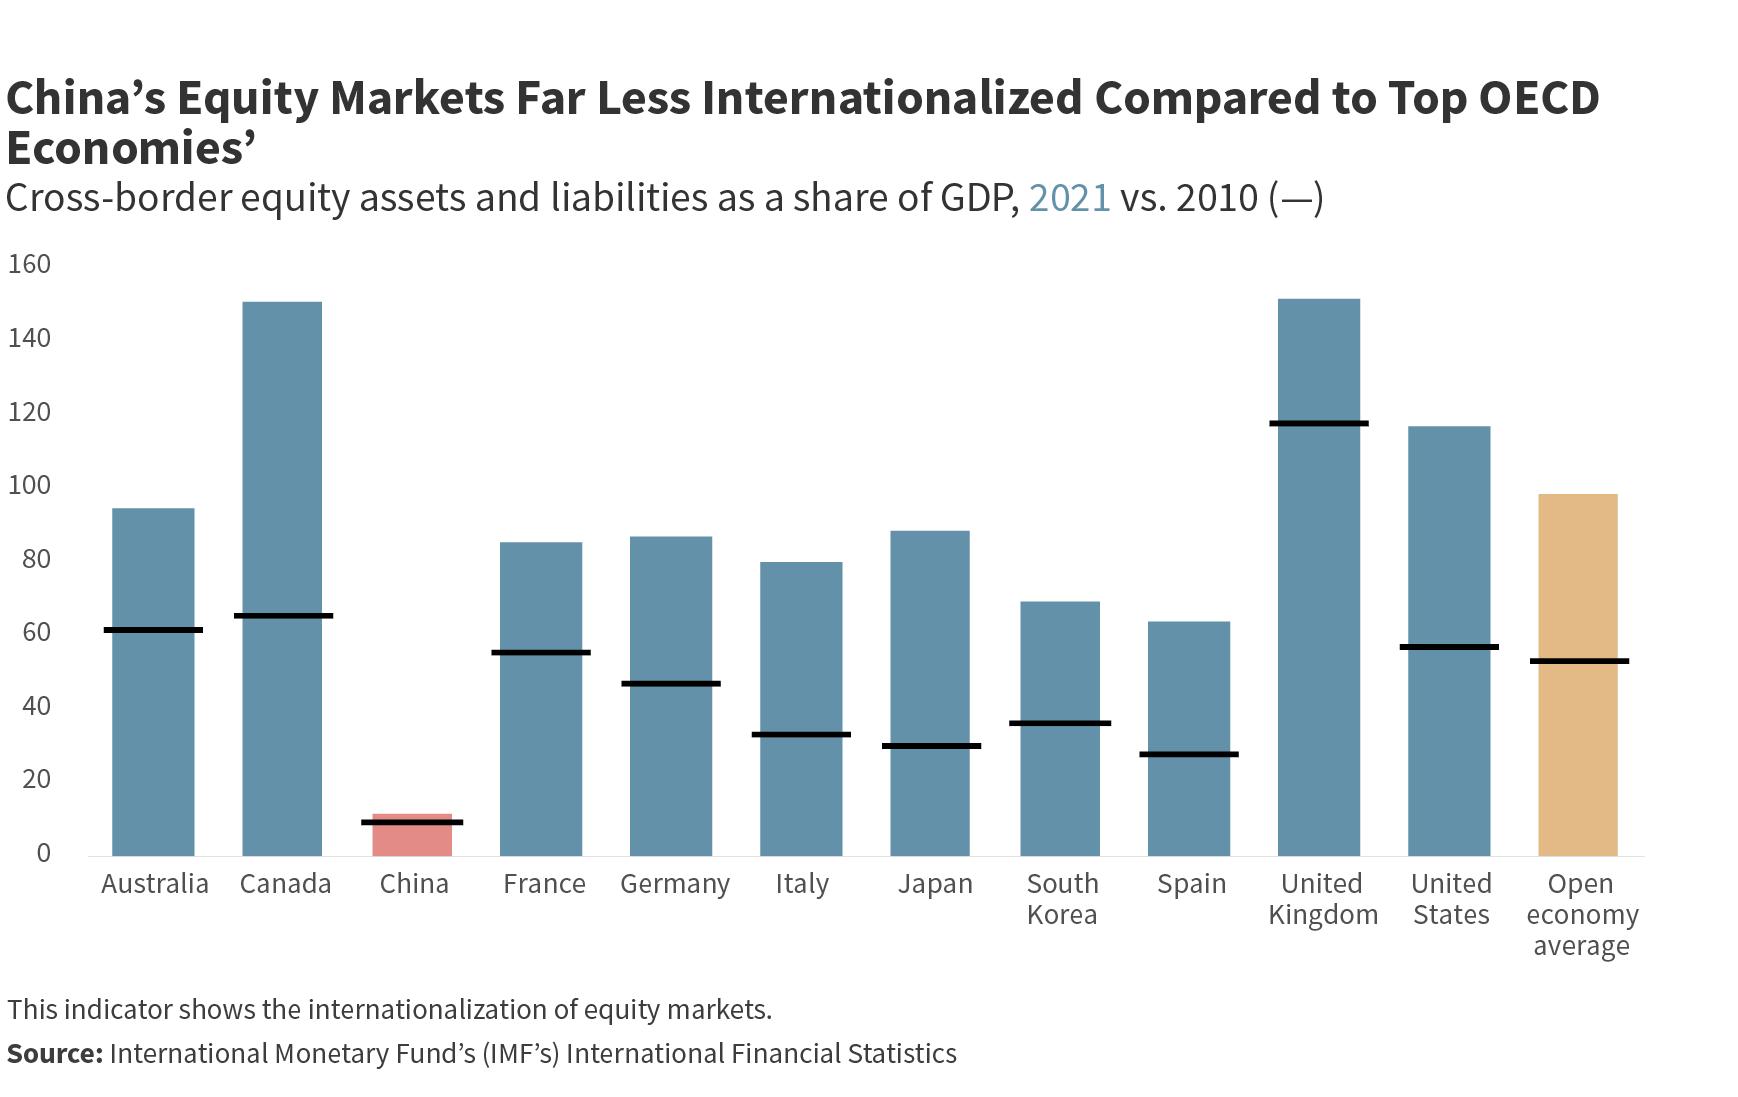
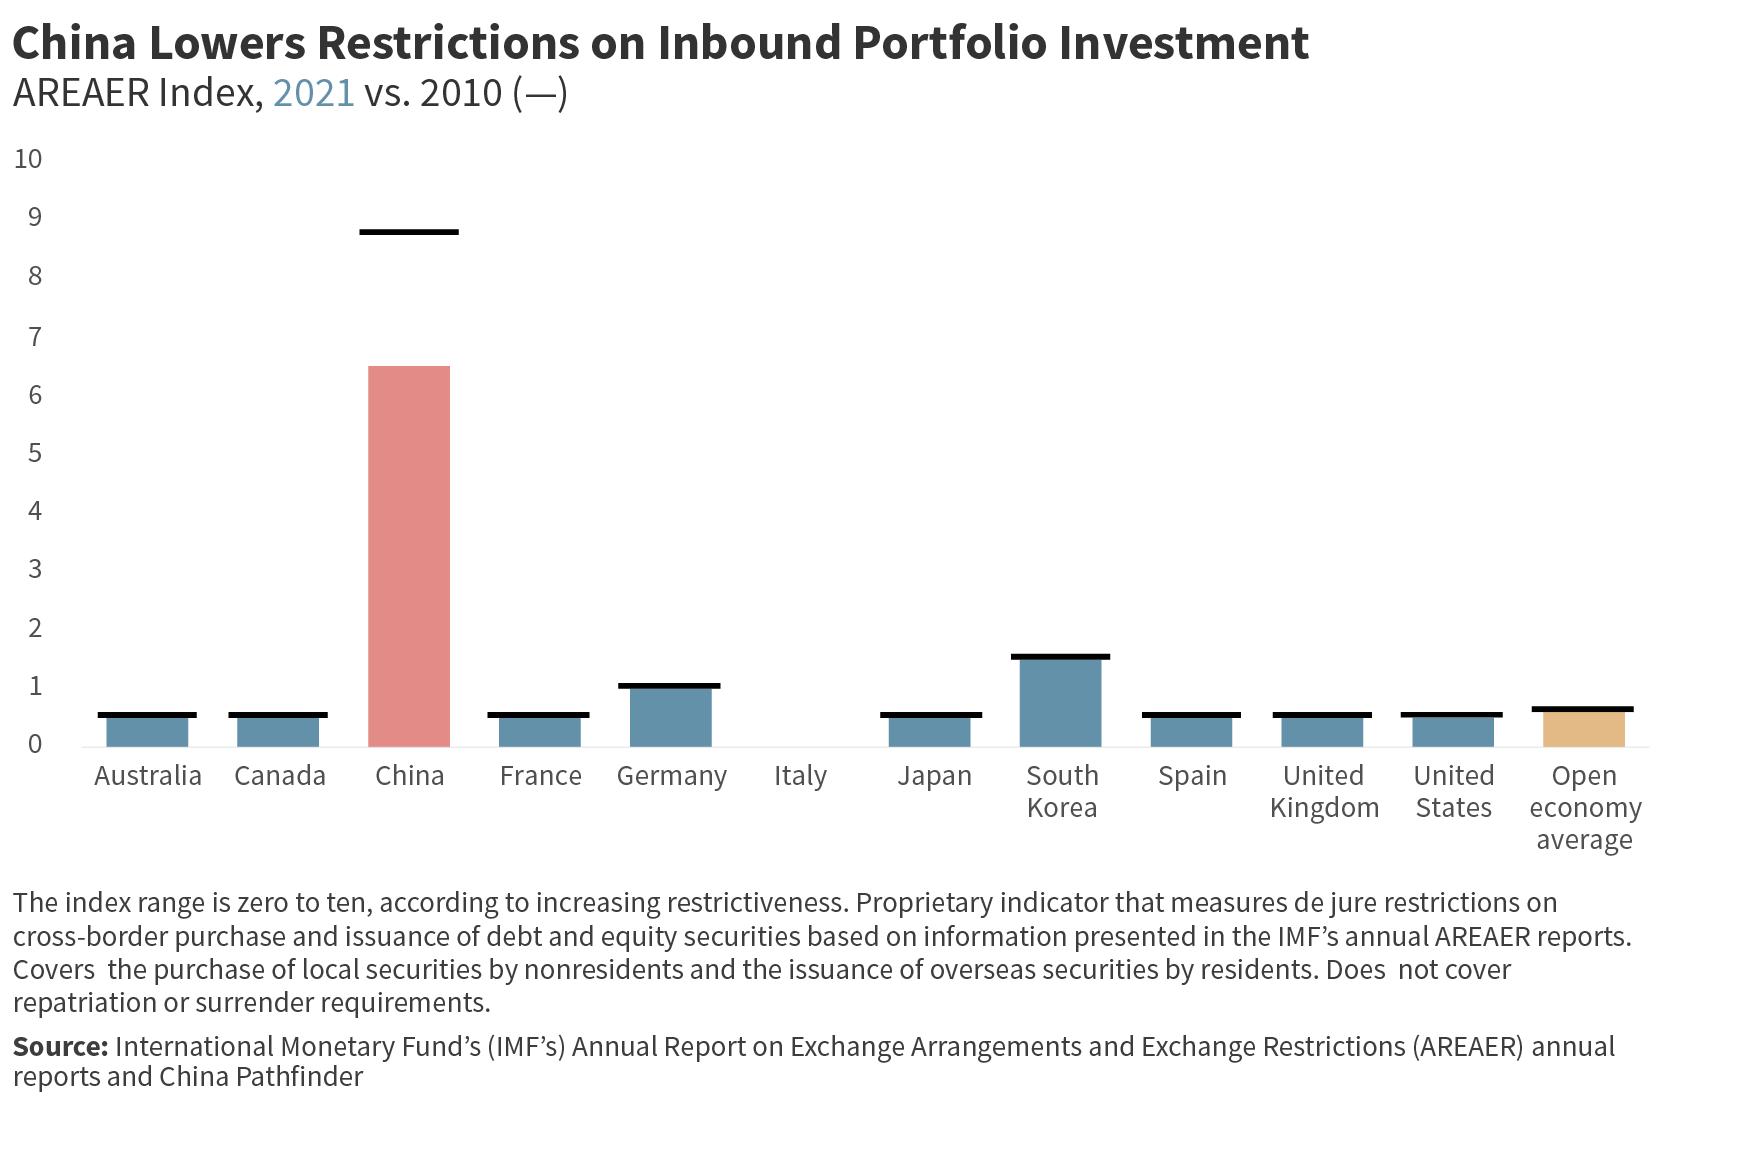
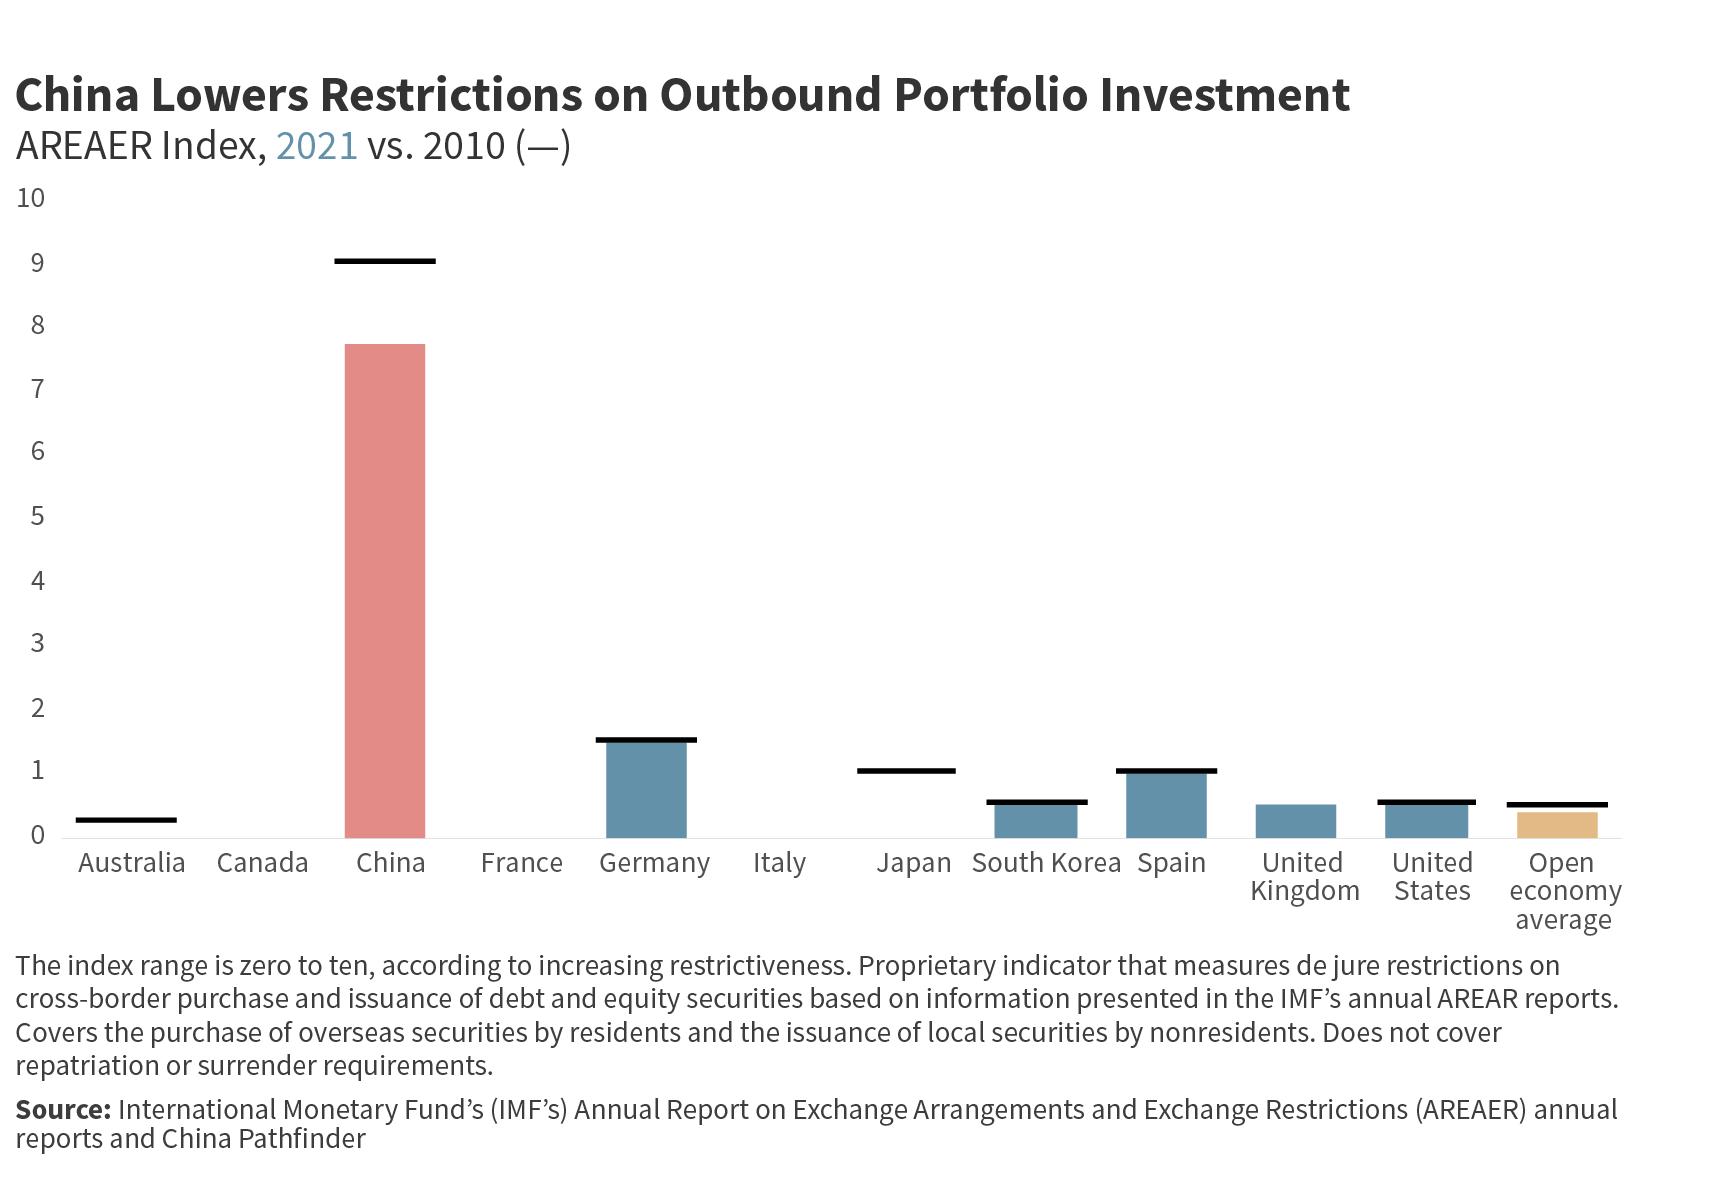
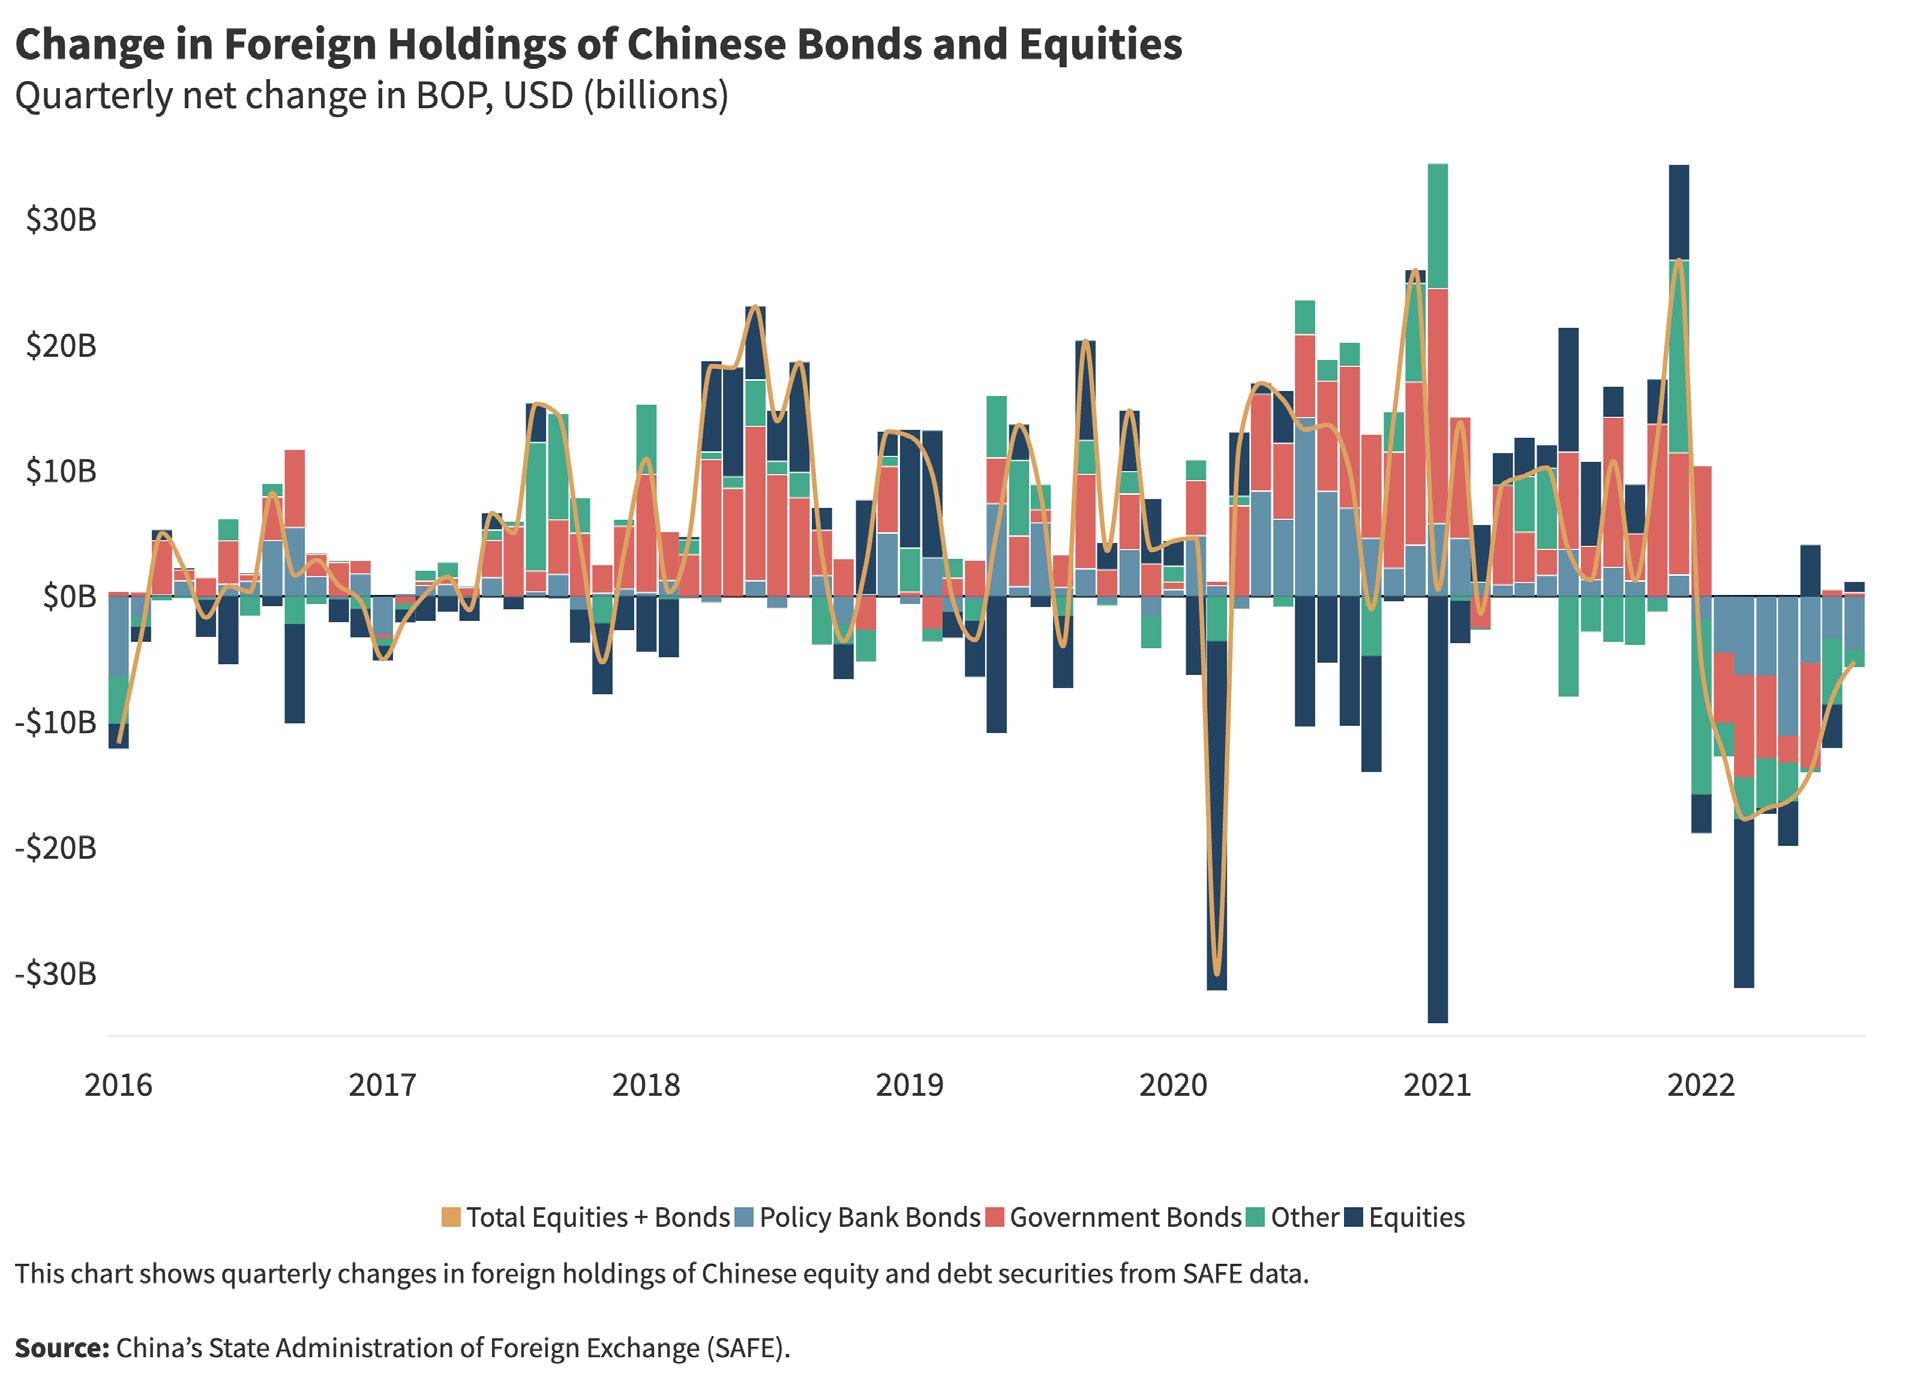
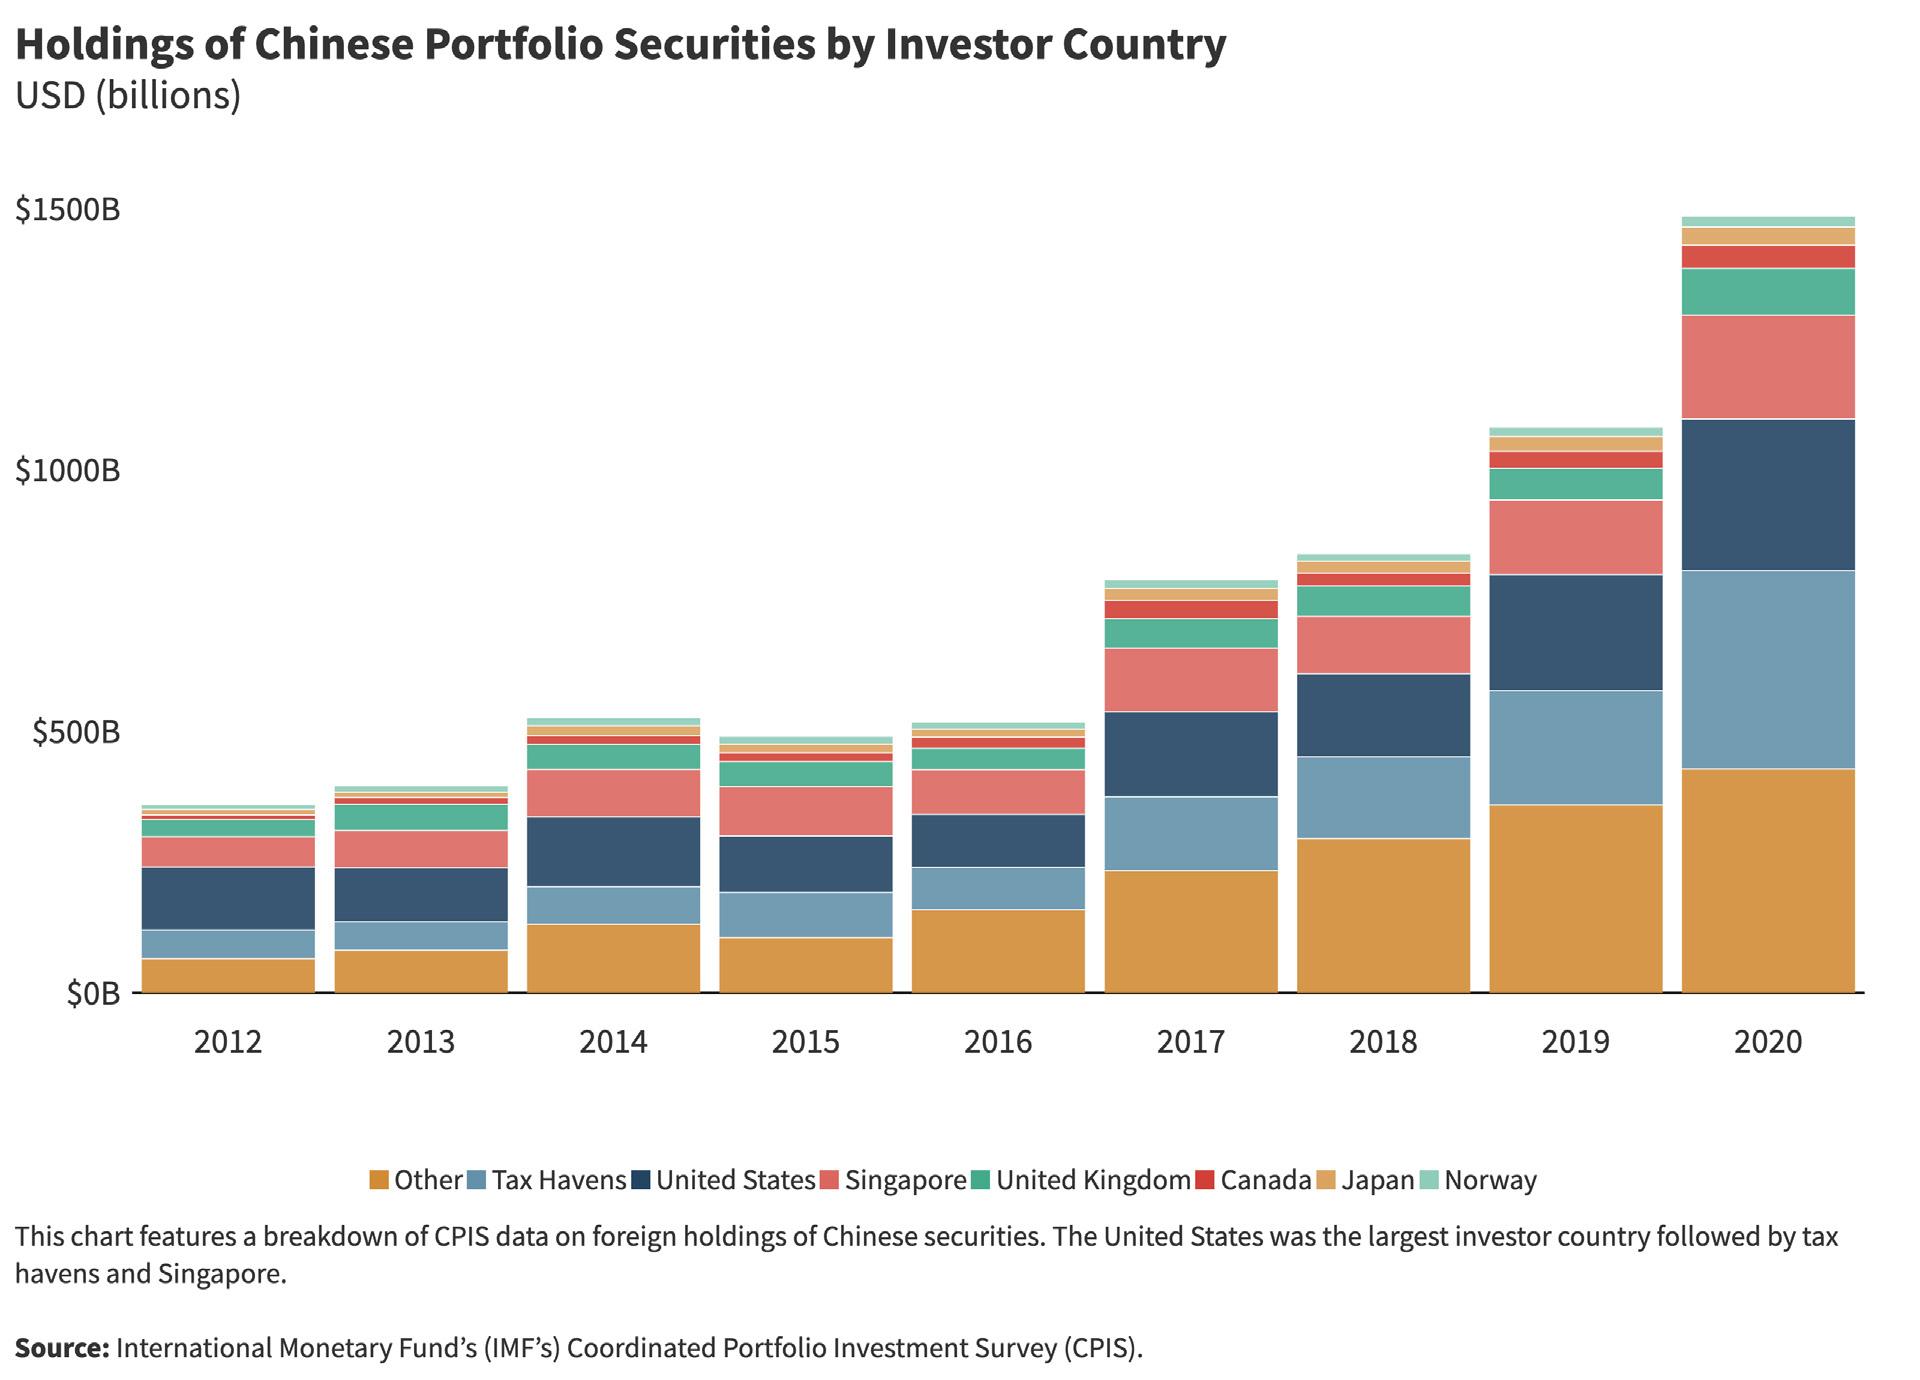
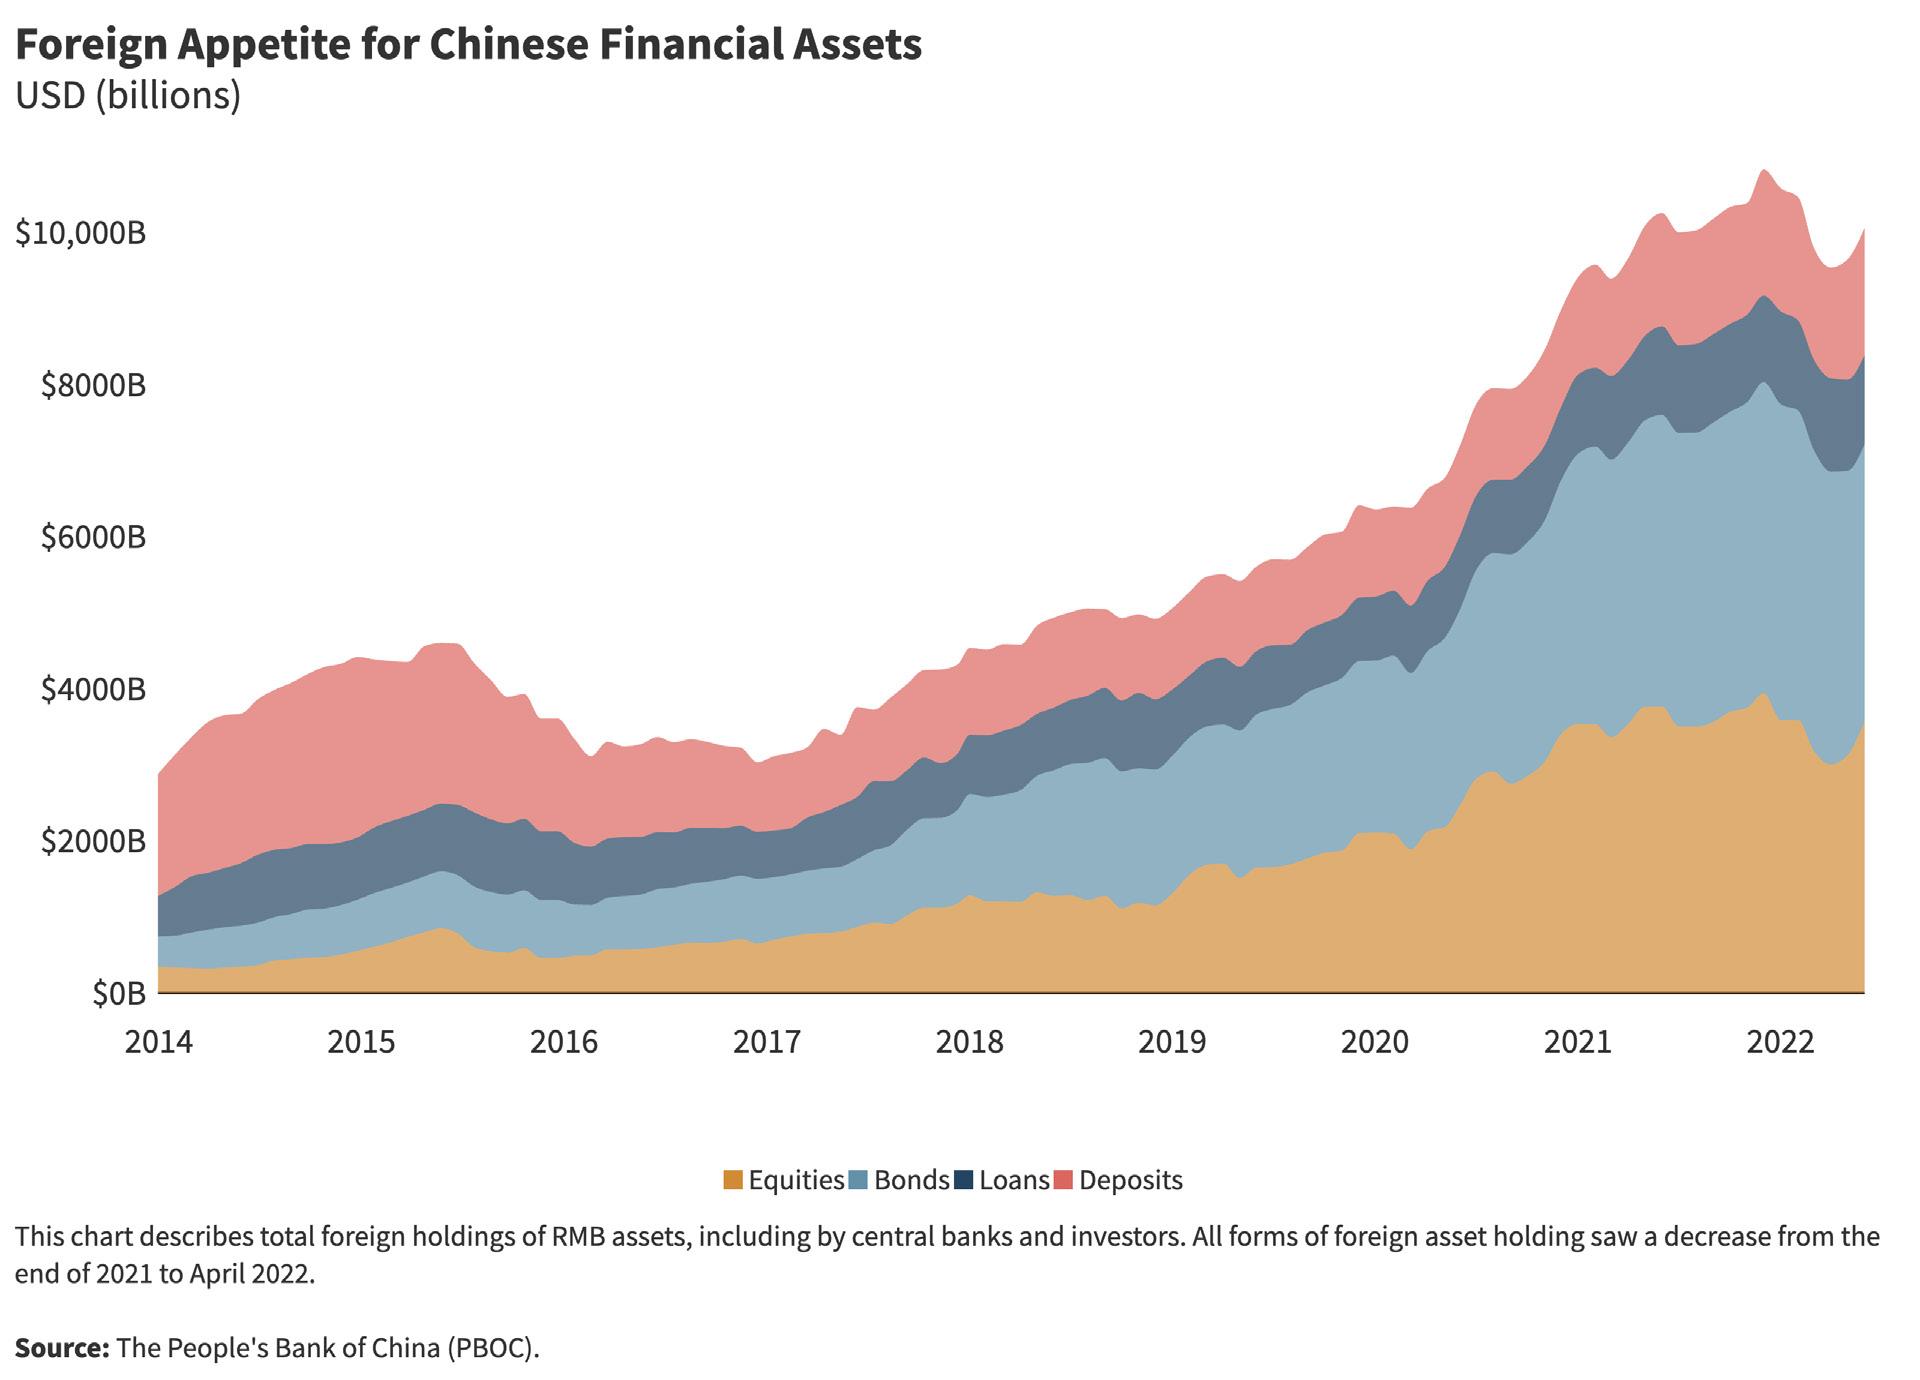
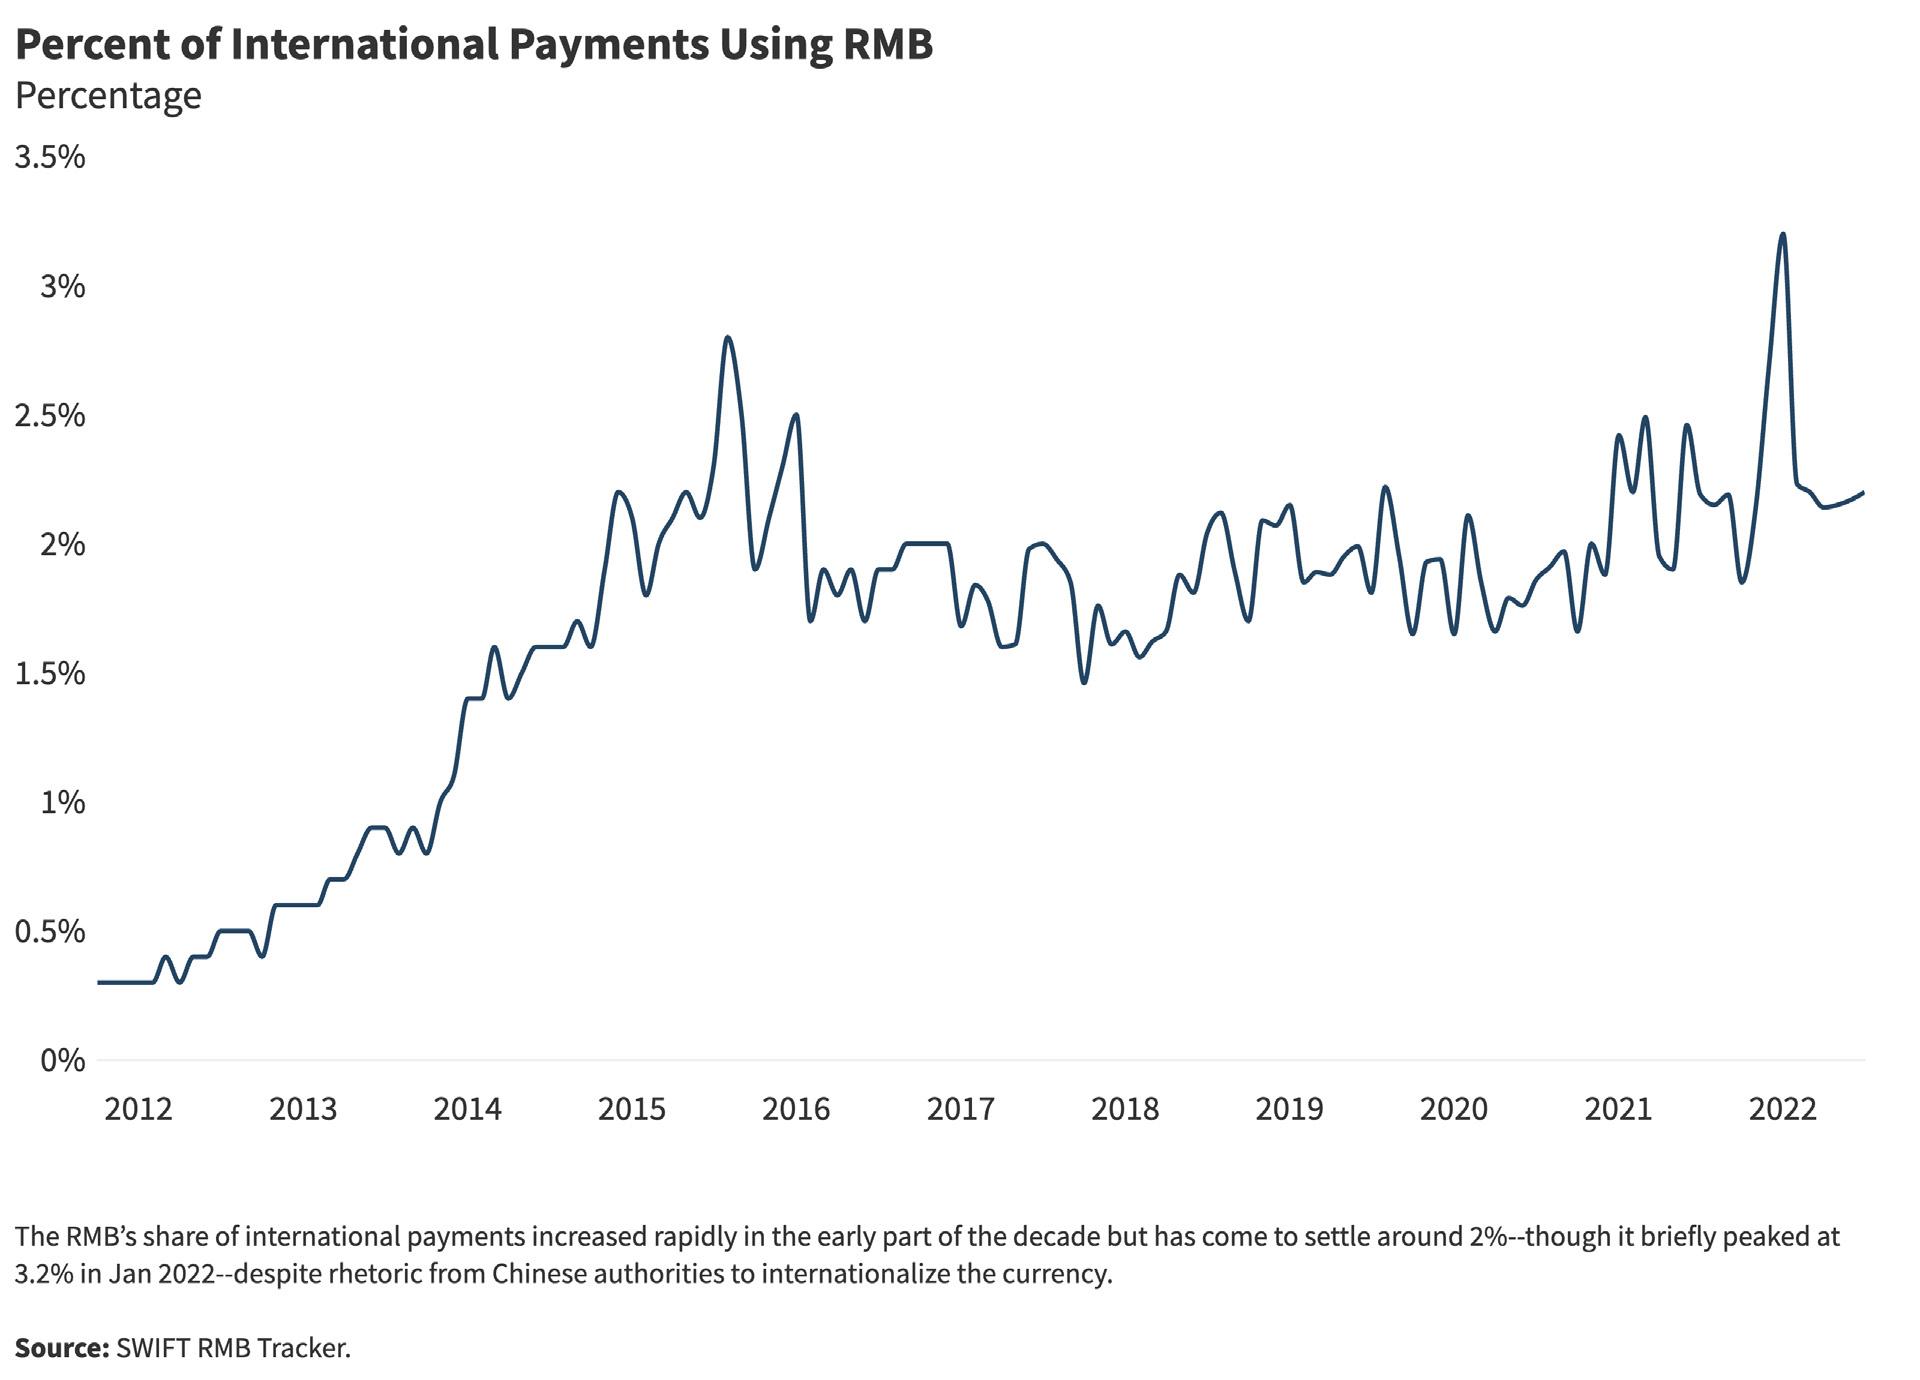
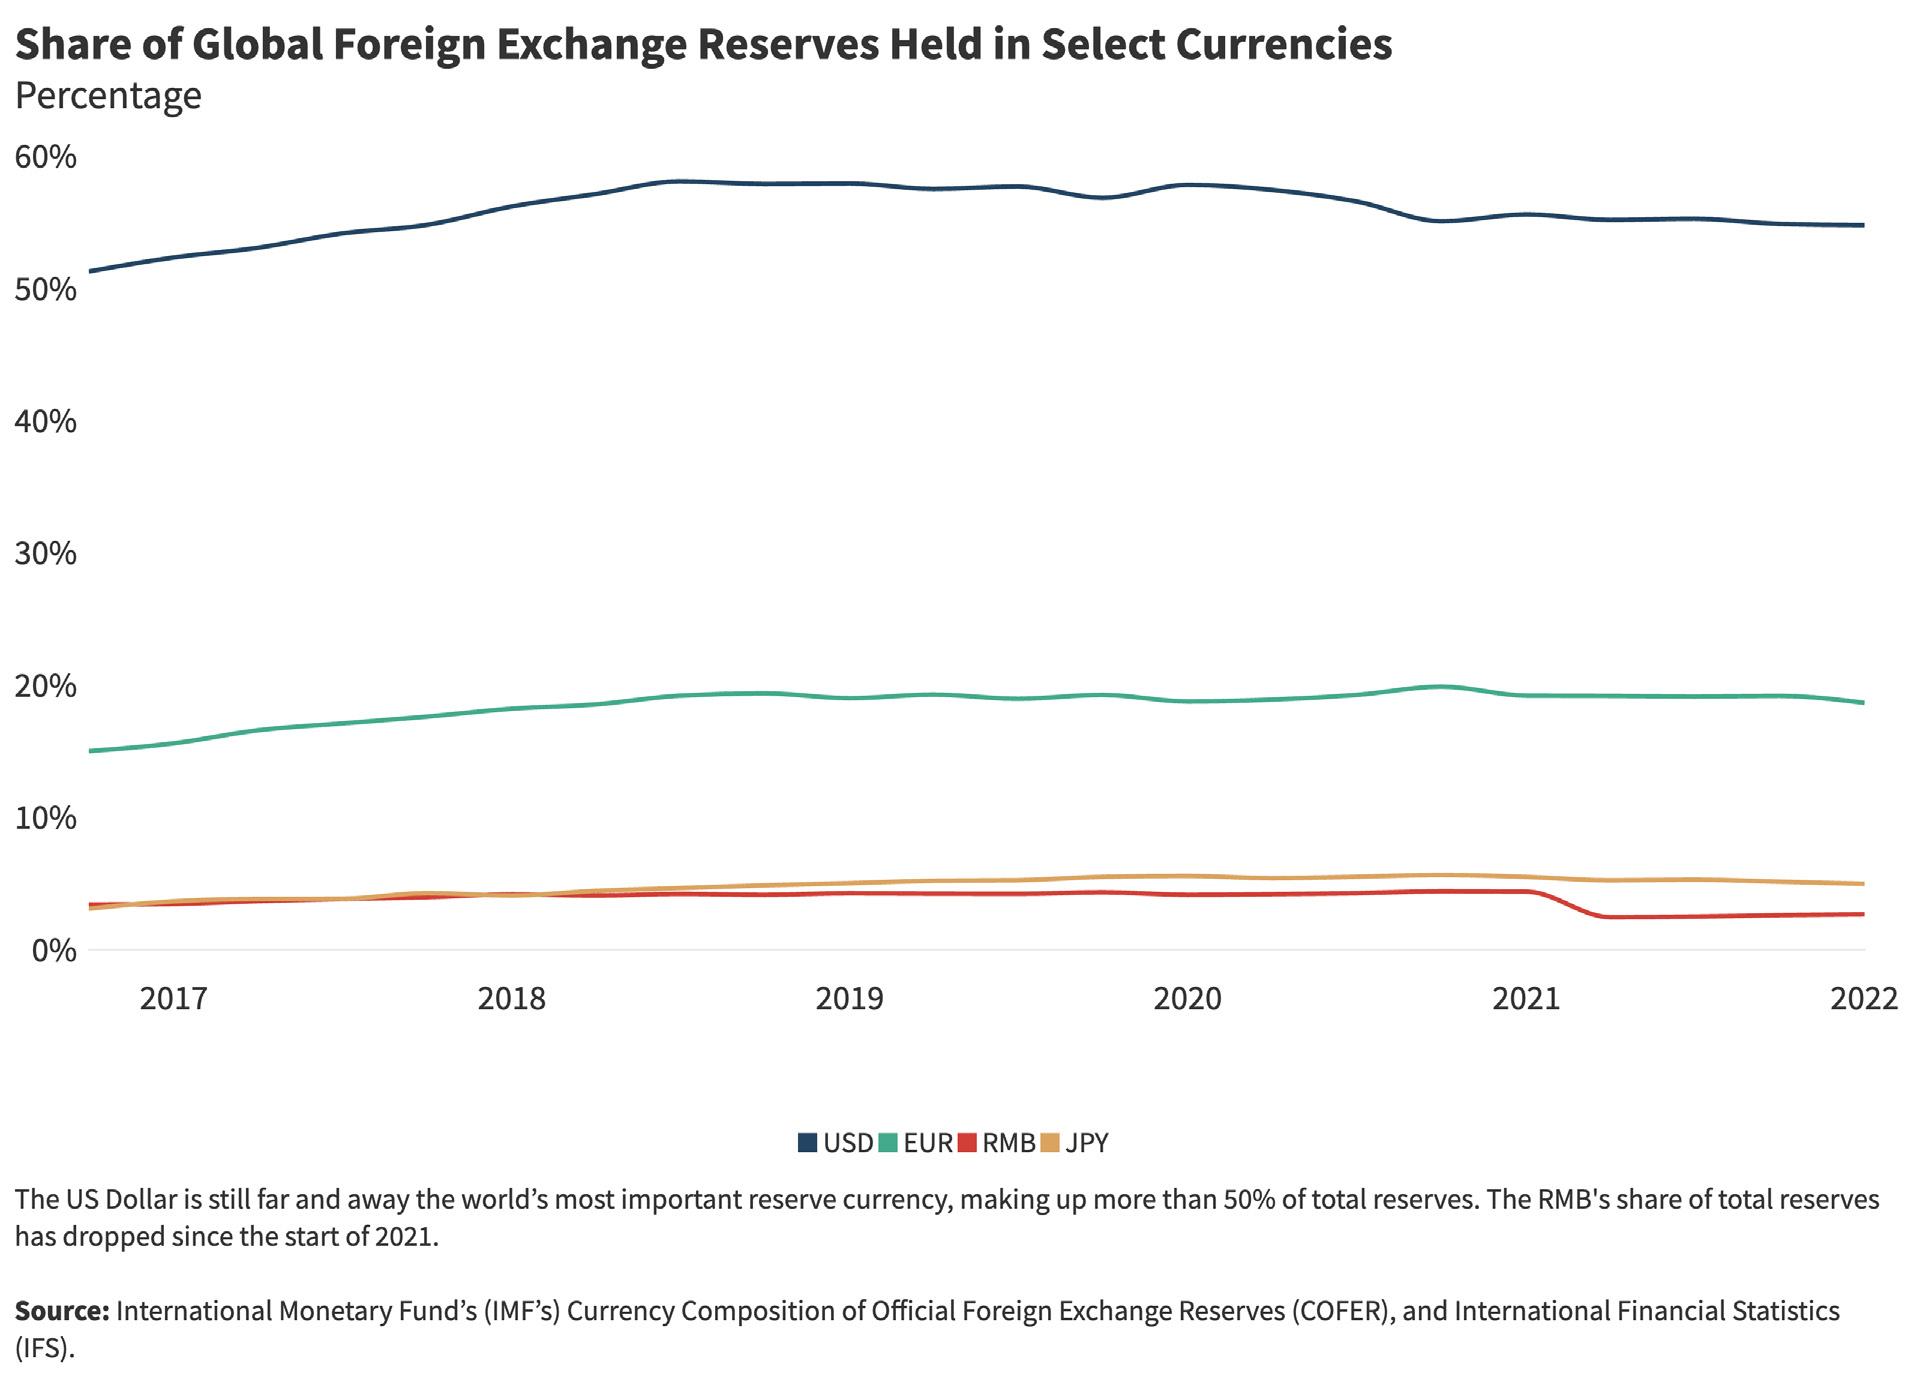
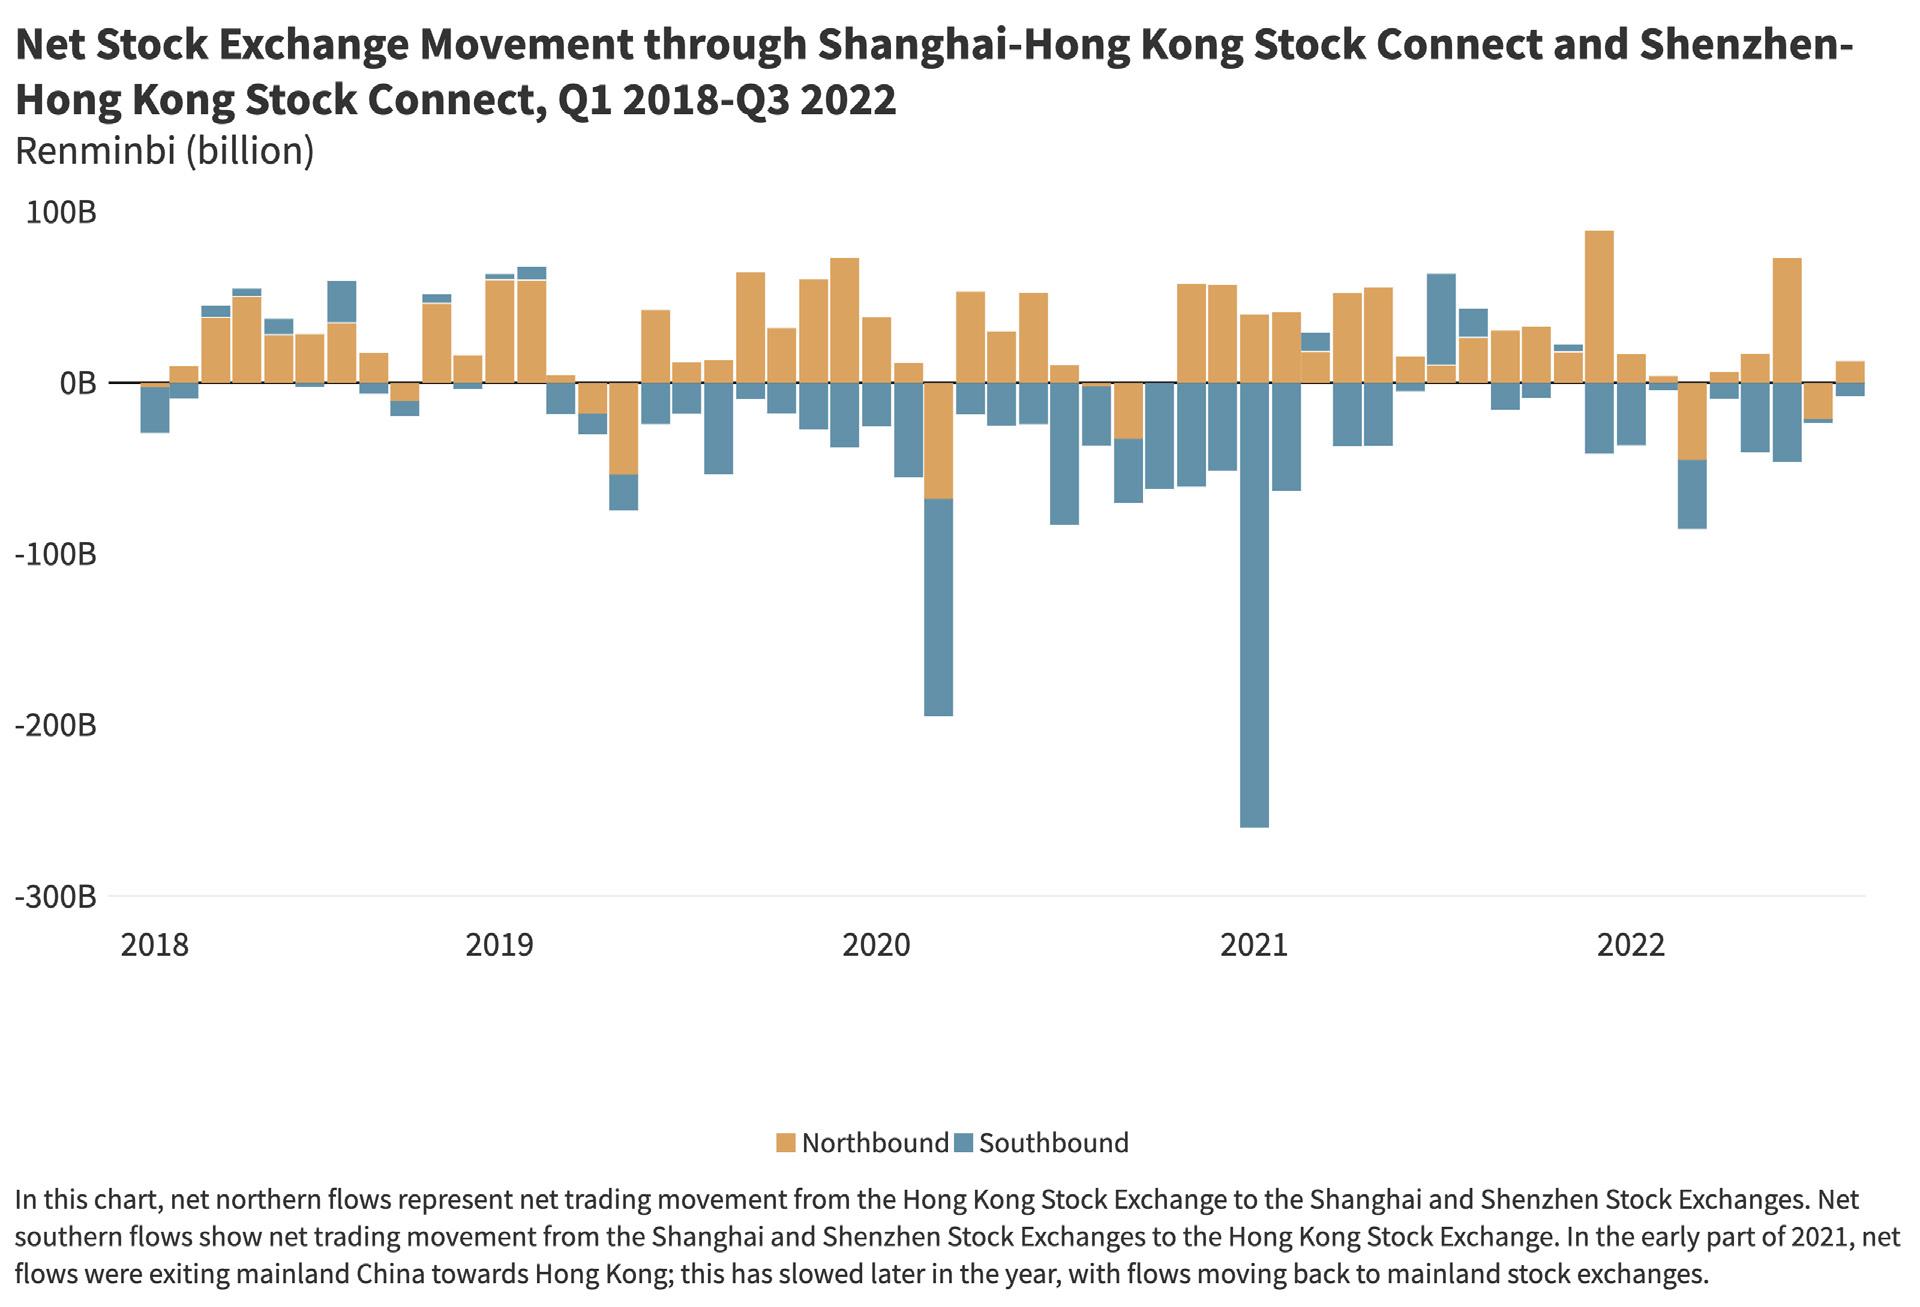
Pulling together the findings from our detailed benchmark assess ment of six clusters, we make the following observations.
• Though China remains behind open market economies in most of the indicators, its progress is undeniable. Between 2010 and 2021, China saw significant improvement in the areas of financial system, innovation, and trade. For innovation and trade, China’s score more than doubled. In innovation, China’s composite score is now higher than those of several open mar ket economies, and China has surpassed the open economy average in venture capital investment. However, this progress comes with some caveats. The state remains a major driver of innovation in China, using government guidance funds and sub sidies to boost domestic company. Trends in China and abroad may have also reduced the attractiveness of Chinese startups in the eyes of foreign investors. First, the tech crackdown has undermined investor confidence. Second, the US, EU, and other governments are imposing stricter controls on how Chinese companies can access foreign capital and technology. In the lon ger term, this could harm innovative Chinese companies.
• China’s composite score in trade comes closest to those of market economies but, here too, there are caveats First, China’s remarkable competitiveness in goods trade is tempered by high barriers in digital services trade. China’s score in digi tal services trade has declined since 2014, indicating additional restrictions over the past decade. Second, non-tariff barriers remain a hallmark of China’s trade policy, with various advan tages heaped on domestic champions to the detriment of for eign competitors. Third, the effects of the US-China trade war continue to reverberate. Thus, we saw China’s MFN tariff rate increase since 2020 (though it is still lower than it was in 2010), and while the US and the EU countries lowered their MFN rates, their tariffs on Chinese exports have not decreased.
• Where China lags, and where the risk of backsliding is most acute, is in the areas of the economy where the state main tains a high level of control. In its financial system, for exam ple, China is still far from the open economy average—a finding that’s not surprising when one remembers that China’s financial system is still largely driven by state-owned banks which pro vide SOEs with privileged access to capital. Also noteworthy is that China’s composite score for direct investment openness went down between 2010 and 2021, underscoring the untapped potential in China for more foreign investment. Similarly, for port folio investment openness, China had the lowest score in all of our four indicators across all countries measured. This finding should not diminish China’s progress, but it underscores how much work remains to be done to bring China into alignment with open economy standards.
• Composite scores for open market economies showed marginal declines between 2010 and 2021 and reveal interesting variations at the indicator level. For this edition of China Pathfinder, we put to the test how well open market economies held up over the same decade as our benchmark for China. Open market economies saw small changes from 2010 to 2021 for indicators that measured de jure factors such as finan cial institutions depth, rule of law index, or IP protection index. In other words, systemically, open market economies gener ally remained open with robust rule of law and market-driven resource allocation. Most de facto indicators, however, reveal either dramatic progress since 2010 (e.g., in VC investment, inbound FDI stock, and cross-border equity) or decreases from 2010, such as goods trade intensities falling by half. In some instances, countries’ changing policy towards China is reflected in their scores. For example, on inbound FDI, open econo mies have become more restrictive when compared to 2010. Though most FDI screening mechanisms take a country-neutral approach, concerns over Chinese investment have often precip itated the change.
• External factors also shaped China’s 2021 outcomes under the Pathfinder framework. For example, China’s exports went into overdrive in 2021 as global demand for Chinese-made elec tronics and personal protective equipment (PPE) surged, lead ing to record trade surpluses. Thus, China’s goods trade inten sity has remained relatively steady since 2020, while the US and several other economies saw a decline. Lockdowns at home, however, suppressed Chinese household consumption, under mining even further China’s efforts to transition to a more sus tainable, consumption-driven growth model. As 2022 got under way, the US, Europe, and other countries that trade actively with China saw consumption and economic activity returning to nor mal following mass vaccination with mRNA vaccines. China’s households, meanwhile, saw no relief from the zero-COVID pol icy. Beijing’s continued resistance to foreign mRNA vaccines, and insistence on the correctness of its COVID-suppression pol icies, are doing real damage to the country’s producers and con sumers, with corresponding impacts on global consumption pat terns and supply chains.
• The pandemic created unusual fluctuations in individual indi cators and composite scores. Measuring economic perfor mance in times of extreme volatility is not for the faint of heart. Our benchmarking for China Pathfinder over the 2021 period was complicated by the COVID-19 pandemic and the need to distinguish temporary effects from underlying systemic forces. For example, as GDP growth rates fell and rose through the year, reflecting different COVID-19 recovery paths, some 2021 indicator scores for certain countries reverted to 2010 aver ages or increased over 2020 results. Our assessment next year will demonstrate how well these results hold up given that most countries in our sample are on track for recovery from the pandemic.
• China’s reform intentions are more important than ever. Concern about China’s economic course is deepening due to zero-COVID policies, property sector distress and rising tensions over Taiwan. We are at a crucial moment when foreign firms are reassessing their presence in China and making decisions that will affect economic relations for years to come. Questions are being raised about whether China is “investible.”
• A course correction if it occurs will take time. Even if China recommits to market reform, fixing the misallocation of resources and dealing with vested interests will take China’s leaders years, and will mean weaker growth in the short to medium term as structural adjustment takes place. For foreign policymakers, an understanding of how market economies are changing visà-vis open market norms is needed for the effort to hold China accountable. This would require foreign governments to be strategic in their responses to Chinese practices, but avoid sac rificing liberal market norms, or emulating China’s non-market playbook.
• Government and business stance towards China is best based on a balanced assessment. Many foreign policymakers—and some firms—are competing to show who’s toughest on China. That’s problematic in two ways. First, it risks intensifying frictions with China, without a basis of data-driven analysis and bench marking. Second, it wastes limited resources on matters that may have less severe economic consequences, while issues of concern go potentially under-resourced or unaddressed. Where Chinese divergence from open-economy norms harms mar ket economy interests, policymakers should respond. Where it doesn’t, they should hold their fire.
• As the traditional divide between trade, technology, and secu rity challenges melts away, policy and business decision mak ing will become more complicated. With policymakers scruti nizing China’s tech policies or its human rights record, foreign companies doing business in China or with China will find it increasingly difficult to reconcile competing demands from their home governments and China. Rising restrictions in data flows, for example, and tighter investment screening reflected in the 2021 China Pathfinder scoring, are just a few examples of this trend. This will have important implications for supply chains across a range of goods, and for companies’ long-term planning such as making investments or retaining talent.
As this report goes to press, the world’s attention is on the 20 th Chinese Communist Party Congress getting underway in Beijing. Many observers are hoping that, having witnessed the damage wrought on the economy by zero-COVID, China’s leaders start to revise their approach. If so, relaxing COVID suppression measures, with the attendant risks, will be the easy part. The greater chal lenge—perhaps the defining challenge for China in the medium to long term—is the path that Xi, installed for a third term as president, sets for the country. The leadership may conclude that returning to economic reform and market opening is a necessity, however pain ful the adjustment. With the outlook for China’s GDP growth in 2023 and 2024 grim, the case for a clear statement of reform intentions has never been more compelling. The fear—and the danger—is that instead China’s leaders will fall back on statist solutions, so promi nent in recent policy pronouncements. Doing so would only post pone the economic reckoning, and ultimately lead to a China that is poorer at home and less welcome abroad.
China’s leaders often talk about seizing this period of strategic opportunity to advance China’s domestic development and inter ests abroad. External events will have a major bearing on how China’s story unfolds. Beijing will have to pull off a careful balanc ing act, not just on economic matters, but also on a broad range of issues that straddle geopolitics and geoeconomics. Foreign com panies doing business in China or with China will find it increasingly difficult to reconcile competing demands—in the form of regulatory and political pressure—from their home governments and China. Friction over human rights will remain and could grow, following the recent UN report on conditions in Xinjiang which found evidence of “serious human rights violations” that it said could constitute “crimes against humanity.”24 Beyond the impact on its diplomatic relations, China’s conduct in Xinjiang will have important implications for sup ply chains across a range of goods, including solar panels.
As the lines between economic and national security matters become increasingly blurred, the pushback from G7 countries and their democratic allies against China’s policies and behavior grows. Political events in Washington and capitals across Europe and Asia will influence China’s actions as well. In November 2022, the US will hold midterm elections, which could usher in a US Congress that is even more hawkish towards China. Germany, the most important player on China policy in the EU, is looking at measures to encour age its companies to diversify away from China as part of a new China strategy to be unveiled in early 2023. Meanwhile, tensions between the US and China over Taiwan seem likely to build in the run-up to presidential elections on the island in 2024.
24 United Nations, “UN Human Rights Office Issues Assessment of Human Rights Concerns in Xinjiang, China,” August 31, 2022. https://www.ohchr.org/en/pressreleases/2022/08/un-human-rights-office-issues-assessment-human-rights-concerns-xinjiang
For the China Pathfinder Project, the year ahead brings another opportunity to stress test our methodology and refine our approach. The pandemic-related disruptions of 2021 required us to account for major macroeconomic fluctuations that were not precipitated by systemic shifts. Supplementing the annual benchmarking exercise, our quarterly reports offer fellow China analysts, policymakers, and business leaders a qualitative assessment of China’s reform trajec tory. Outside of the Party Congress held every five years, China’s political calendar is punctuated by plenary sessions, or plenums. At the third plenum of the 19th Party Congress, China unveiled an ambi tious—and ultimately unrealized—reform agenda. The next third plenum is expected in the fall of 2023, marking another important opportunity for China’s leaders to signal a policy shift. We undertake this analysis from a value neutral approach: While we will call out any backsliding by Beijing, we will equally remark on and celebrate any positive movement. The challenge of grappling with the complexity of China’s evolution is formidable, but we undertake it gladly.
AML China’s Anti-Monopoly Law
AREAER
IMF’s Annual Report on Exchange Arrangements and Exchange Restrictions
BIS Bank of International Settlements
BoE Bank of England
BOP Balance of Payments
CAI Comprehensive Agreement on Investment
CCP Chinese Communist Party
CFETC China Foreign Exchange Trading Center
CSRC China Securities Regulatory Commission
DSL China’s Data Security Law
DSTRI OECD’s Digital Services Trade Restrictiveness Index
ECB European Central Bank
EPO European Patent Office
EU European Union
FDI foreign direct investment
G7 Group of Seven
GDP gross domestic product
IMF International Monetary Fund
IP intellectual property
IPC International Patent Classification
IPO initial public offering
IVA industrial value-added
M&A mergers and acquisitions
MFN most favored nation
MOFCOM China’s Ministry of Commerce
NBS China’s National Bureau of Statistics
OECD Organisation for Economic Co-operation and Development
PBOC People’s Bank of China
PCAOB Public Company Accounting Oversight Board
PIPL China’s Personal Information Protection Law
PPE personal protective equipment
QFII Qualified Foreign Institutional Investor Scheme
R&D research and development
REER real effective exchange rate
RMB renminbi
ROA return on assets
SAFE China’s State Administration of Foreign Exchange
SAMR State Administration for Market Regulation
SASAC State-owned Assets Supervision and Administration Commission of the State Council
SOE state-owned enterprise
STRI OECD’s Services Trade Restrictiveness Index
UNCTAD United Nations Conference on Trade and Development
WGI World Bank’s Worldwide Governance Indicators
WTO World Trade Organization
The China Pathfinder Project is a collaboration between the Atlantic Council and Rhodium Group to track China’s convergence or diver gence from open market economy norms. This project is nonpar tisan, and seeks to foster consensus about where China stands in relation to advanced market economies. With that goal in mind, our design balances accessibility for nontechnical readers with commit ment to robust, transparent, data-grounded methods.
The China Pathfinder Project evaluates the economic system of China and ten open market economies in six categories: financial system development, modern innovation system, market compe tition, trade openness, direct investment openness, and portfolio investment openness. The first three clusters represent the “domes tic” dimension, and the latter three clusters represent the “external” openness dimension.
We rely on annual indicators that are formed into a composite score each year. Each of the six categories outlined above possesses a set of annual indicators and a final composite index. In addition, we select nuanced supplemental indicators and conduct quarterly pol icy tracking to keep up with fast-moving economic and policy devel opments in China.
This year’s China Pathfinder measures the 2010 and 2021 perfor mance of eleven countries using the same standardized metrics. The selected country list is as follows: Australia, Canada, China, France, Germany, Italy, Japan, South Korea, Spain, the United Kingdom, and the United States. Aside from China, all other coun tries are members of the OECD and are considered market econo mies. These specific countries were chosen according to being in the top-ten country list for highest gross domestic product (GDP).
Our inaugural China Pathfinder Scorecard incorporated China’s 2010 performance as a datapoint to benchmark China’s present-day progress since the last decade. This decision also provided data prior to the start of President Xi Jinping’s administration and offered an objective picture of how China’s economy has developed since. Starting with this report, we have expanded our data sample to com pare the 2010 performance of all countries in our list, not only China. This allows us to analyze whether open-market economies have improved or regressed since 2010 according to our metrics for mar ket openness.
Our criteria for selecting annual indicators have two main compo nents: data timeliness and ability to make international comparisons. These criteria inherently limit each other, as timely data often do not have extensive country coverage. This created obstacles in our data collection process, and the path we chose with our annual indica tors reflects the ideal solution to these data availability problems.
The annual China Pathfinder report has a foundation of quantita tive methods and sources. It mixes source types for data analysis. We make use of existing credible databases and literature, such as the OECD, International Monetary Fund (IMF), and World Bank data sets and indices; platforms such as CEIC and Bloomberg for Chinaspecific statistics and company financial data; and expert buy-in for our in-house production of proprietary datasets.
Along with compiling research from these data sources, China Pathfinder also incorporates indicators that were informed by study groups and expert interviews. Our team conducted review sessions with various outside experts on China and OECD economies, index creation, and construction of cross-country economic evaluations. We have implemented feedback and new ideas gathered from these conversations to improve our annual indicator selection.
A composite indicator employs a defined model for selecting a group of individual indicators and transforming them into a single index. Composite indicators are common tools in policy analysis, particularly for maintaining objectivity in comparing country perfor mance. China Pathfinder takes guidance from the OECD Handbook on Constructing Composite Indicators: Methodology and User Guide, which compiles various statistically sound methodologies for economists and policymakers to build composite indicators.
To calculate composite scores, we use the Min-Max methodology. This is necessary to normalize countries’ scores from the individ ual indicators, which have different units and scales. The Min-Max normalization method was selected because it preserves country clustering and countries’ relative performance distance. Min-Max uses each dataset’s minimum and maximum datapoints to establish a “lower bound” and “upper bound.” Each country value X within a given indicator is taken in relation to these bounds. China Pathfinder subtracts the lower bound from the country value and then divides the outcome by the difference in the upper and lower bounds. This
normalizes every indicator from zero to one. We use a scale of 0 to 10 for the composite scores, so the datapoints are multiplied by ten after completing the Min-Max process.
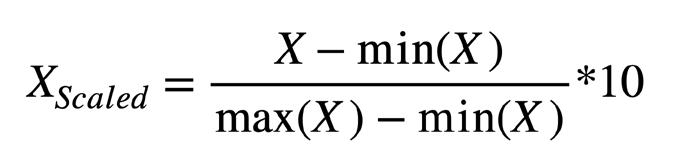
Numerous data compilation methods are used in building our supplemental indicators. Some indicators are reflections of stan dard metrics, and others are modified in-house to illuminate cer tain aspects of metrics that already exist. Finally, China Pathfinder applies a handful of existing proprietary indicators developed by Rhodium Group.
Some indicators have opposite implications for large values and small values. For our purposes, we set the following standard for all indicators and composite score readings: smaller values (i.e., those closer to zero) indicate “low” and larger values (i.e., those closer to ten) indicate “high” openness or development. Some indices that we adopt measure restrictiveness levels on foreign direct invest ment (FDI) or capital flows, and larger values represent greater restrictions on openness. For indicators that follow this pattern, we reversed the values before initiating the Min-Max method for the composite. Value reversal involved setting the maximum bound for these indicators and using it to subtract each country datapoint.
China Pathfinder’s composite indices blend de jure and de facto indicators. De jure indicators measure a country’s institutions or legal framework characteristics, while de facto indicators are out come oriented and seek to measure the actual effects of said insti tutions. While there is an argument to be made for using one or the other, we chose to integrate both into a blended composite score for each cluster. Selecting only de jure indicators opens the possi bility that policies or institutions in place do not necessarily evenly result in the same expected outcomes, or reflect the true situation for some countries. Using de facto indicators solely is particularly challenging with external factors, such as the COVID-19 pandemic, that greatly skew real outcomes temporarily. This approach also fails to afford credit to countries that have implemented institutional reforms when resulting progress has a lag.
We assign equal weighting to de jure and de facto indicators in the composite index calculation when the indicators have comparable importance to defining our cluster evaluation. Otherwise, each indi vidual indicator receives the same weight regardless of de jure or de facto designation.
Chosen indicators within each area are intended to proxy for the broader picture, but do not encompass all aspects of an economy. Therefore, narrower factors that affect China’s performance evalu ation are featured as “supplemental indicators.” Supplemental indi cator data outcomes receive their own chart visualizations, but the data generally cannot be applied to all countries in our sample. For example, some poignant indicators lack data coverage for many countries in our sample, besides China. This complexifies our pro cess for comparing China with the top open market economies on the same standards. For this reason, supplemental indicator data do not contribute to a country’s final composite score.
China Pathfinder supplements its yearly quantitative assessment with quarterly policy tracking. After compiling all relevant major pol icy developments in China during a specific quarter for each of our six clusters, we systematically evaluate each development. The evaluation process contains four possible signals for China’s policy momentum: movement toward, movement away, mixed movement, or no change in relation to open-economy standards. After aggre gating all positive, negative, mixed, and stagnant developments in China’s policy atmosphere, China Pathfinder presents a heatmap within its quarterly report that shows the outcome.
In examining policy changes, our team specifically looks for policies that connect back to the benchmark signals that we outlined in our inaugural report’s Section 2 on “Looking Forward: Market-Oriented Policy and Data Signals.” This provides some continuity between our annual report’s quantitative-driven outcomes and the policy considerations elaborated upon in quarterly reports.
While China Pathfinder is intended to be a quantitative resource for policymakers, economists, and business leaders to benchmark the Chinese economy and stay informed about China’s policy devel opments, it is not a comprehensive assessment of every aspect of China’s economy. Our research design is deliberately narrow, focus ing on just enough to permit a clear picture of China’s compatibility with market economies without hindering reader accessibility.
The choice to track China’s system versus open market economies, rather than a broader set of emerging and developing economies, was a deliberate one. We fully acknowledge that China does not have any intention to become a democratic open market economy. However, we postulate that OECD policymakers can only maintain open and engaging economic policies with China if there is move ment in a similar direction.
Our project concept opens the question of whether China should be expected to converge with advanced OECD nations, instead of the opposite. Aiming for fairness in the China Pathfinder evalu ation, we compare China not on areas in which our sample of mar ket economies are already structurally perfect, but on agreed-upon norms integral to an open economic system.
We choose to focus on economic policies and outcomes, where increased openness is perceived as a positive direction. However, China and the OECD countries we analyze may show signs of con vergence in areas where the latter nations have adopted targeted industrial policies. While national security concerns may indirectly impact the outcomes of China Pathfinder, our data scope primar ily focuses on economic policy and outcomes; the primary goal is to evaluate economic effects instead of political or strategic motivations.
Our research design and indicator selection are not perfect, but rep resent what we believe is the best available solution within existing constraints. Main caveats include the following:
• There are some areas of great importance to market economies that we do not cover. These include the presence of a robust social safety net, comprehensive labor protection laws, envi ronmental protections, and policies to mitigate inequality. We acknowledge that these areas are critical aspects of any mar ket economy, but believe that the indicators we have chosen serve to address the project’s core focus of how OECD nations should choose to view China’s system in the context of future engagement.
• Our selection of annual indicators faces structural limitations. In some areas, we have good coverage; in other areas com prehensive, comparable and timely data are not available and, therefore, we face major gaps in what we would have consid ered ideal coverage (for example, subsidies). The following sum marizes the changes to our annual indicator list from 2020 to 2021 due to datasets being discontinued or too lagged to retain going forward:
• Banking Assets Controlled by Private Firms, a financial sys tem indicator from the Bank Regulation and Supervision Survey (BRSS), has been replaced with State Ownership in the Top 10 Financial Institutions, collected in-house using Bloomberg data. Both indicators measure the role of the state in the financial system.
• Foreign Competition in the Banking Sector, a financial sys tem indicator from the BRSS, will no longer be featured in the annual scorecard.
• Overall Market Concentration Across All Industries, a mar ket competition indicator better known as the Herfindahl Hirschman Index (HHI) from the World Integrated Trade Solution (WITS), has been replaced with Proportion of Sector Market Capitalization Held by Top 5 Firms, collected in-house using Bloomberg data. Both indicators proxy for market con centration and aggregate results across all sectors of an economy.
• Scope of SOEs Index, a market competition indicator from the OECD Product Market Regulation series, has been replaced with Ownership of Top 10 Firms across 11 sectors. Both indicators capture the presence of the state in a range of industries.
• Direct Control over Enterprises Index, a market competition indicator from the OECD Product Market Regulation series, will no longer be featured in the annual scorecard.
• Openness to Foreign Innovation Collaboration, an innova tion system indicator from the World Bank, will no longer be featured in the annual scorecard. Data reflecting foreign col laboration were too volatile to be meaningful due to COVID19 pandemic impacts.
• Our data approach cannot fully account for the unlimited reach of the state and the role of the Communist Party in influencing prices, competition, and outcomes in the Chinese economy. While we assess measurable elements such as the proportion of top 10 financial institutions by market capitalization that are stateowned, these measures certainly understate the role of politics in the economy—as 2021’s extralegal changes to the role of pri vate ownership in the education-services sector (one of many examples) demonstrate.
The China Pathfinder Project provides visualizations for indicators in six areas that will be updated with new data annually. It preserves 2010 as a benchmark year for China’s performance, a data point that will live through future iterations of composite scoring and individual indicator analysis.
To add nuance and include higher frequency data on the Chinese economy, quarterly reports incorporate relevant supplemental indi cator data and timely chartwork on the most critical developments of the quarter. In the face of unexpected large-scale developments or data availability issues, the supplemental indicator list will be modified to ensure maximum utility for the user.
Data visualizations are created by Seven Mile Media, Jerico Aragon, and Youyou Zhou, and range from interactive data features on the website and graphical representations throughout annual and quar terly reports. More details on China Pathfinder’s interactive data visualizations, publication archive, and structure behind this proj ect are available on the China Pathfinder website (www.chinapath finder.org).
*John F.W. Rogers
*James L. Jones
PRESIDENT AND CEO
*Frederick Kempe
*Adrienne Arsht
*Stephen J. Hadley
*Robert J. Abernethy
*C. Boyden Gray
*Alexander V. Mirtchev

*George Lund
DIRECTORS
Todd Achilles
Timothy D. Adams
*Michael Andersson David D. Aufhauser Barbara Barrett Colleen Bell
Stephen Biegun
Linden P. Blue Adam Boehler
John Bonsell
Philip M. Breedlove Myron Brilliant
*Esther Brimmer Richard R. Burt
*Teresa Carlson
*James E. Cartwright John E. Chapoton
Ahmed Charai
Melanie Chen Michael Chertoff
*George Chopivsky Wesley K. Clark
*Helima Croft
*Ankit N. Desai Dario Deste
*Paula J. Dobriansky Joseph F. Dunford, Jr. Richard Edelman
Thomas J. Egan, Jr. Stuart E. Eizenstat Mark T. Esper
*Michael Fisch
*Alan H. Fleischmann Jendayi E. Frazer
Meg Gentle
Thomas H. Glocer
John B. Goodman
*Sherri W. Goodman
Jarosław Grzesiak
Murathan Günal
Frank Haun
Michael V. Hayden
Tim Holt
*Karl V. Hopkins Kay Bailey Hutchison Ian Ihnatowycz
Mark Isakowitz
Wolfgang F. Ischinger
Deborah Lee James
*Joia M. Johnson
*Safi Kalo
Andre Kelleners
Brian L. Kelly
Henry A. Kissinger John E. Klein
*C. Jeffrey Knittel Joseph Konzelmann Franklin D. Kramer Laura Lane
Almar Latour
Yann Le Pallec
Jan M. Lodal Douglas Lute Jane Holl Lute William J. Lynn Mark Machin
Umer Mansha Marco Margheri Michael Margolis
Chris Marlin William Marron Christian Marrone Gerardo Mato
Timothy McBride Erin McGrain John M. McHugh
*Judith A. Miller Dariusz Mioduski
Michael J. Morell
*Richard Morningstar Georgette Mosbacher Majida Mourad Dambisa F. Moyo Virginia A. Mulberger Mary Claire Murphy Edward J. Newberry Franco Nuschese Joseph S. Nye Ahmet M. Ören Sally A. Painter Ana I. Palacio
*Kostas Pantazopoulos
Alan Pellegrini
David H. Petraeus
*Lisa Pollina
Daniel B. Poneman
*Dina H. Powell
dddMcCormick
Michael Punke
Ashraf Qazi Thomas J. Ridge Gary Rieschel
Lawrence Di Rita Michael J. Rogers Charles O. Rossotti
Harry Sachinis C. Michael Scaparrotti Ivan A. Schlager Rajiv Shah
Gregg Sherrill Jeff Shockey Ali Jehangir Siddiqui Kris Singh Walter Slocombe Christopher Smith Clifford M. Sobel James G. Stavridis Michael S. Steele Richard J.A. Steele Mary Streett
*Gil Tenzer
*Frances M. Townsend Clyde C. Tuggle Melanne Verveer Charles F. Wald Michael F. Walsh Ronald Weiser
*Al Williams Maciej Witucki Neal S. Wolin
*Jenny Wood Guang Yang Mary C. Yates Dov S. Zakheim
James A. Baker, III
Ashton B. Carter
Robert M. Gates
James N. Mattis
Michael G. Mullen
Leon E. Panetta
William J. Perry
Condoleezza Rice
Horst Teltschik
William H. Webster
*Executive Committee Members
List as of September 12, 2022