MARKET MONITOR

Your bi-annual look at the industrial market performance 2ND HALF 2022
INDUSTRIAL
Industrial Occupier Demand Runs Strong 2 Sydney 3 Melbourne 9 Brisbane 14 Adelaide 19 Perth 25 Canberra 30 Hobart 33 Darwin 36 LJ Hooker Commercial Offices 40
CONTENTS
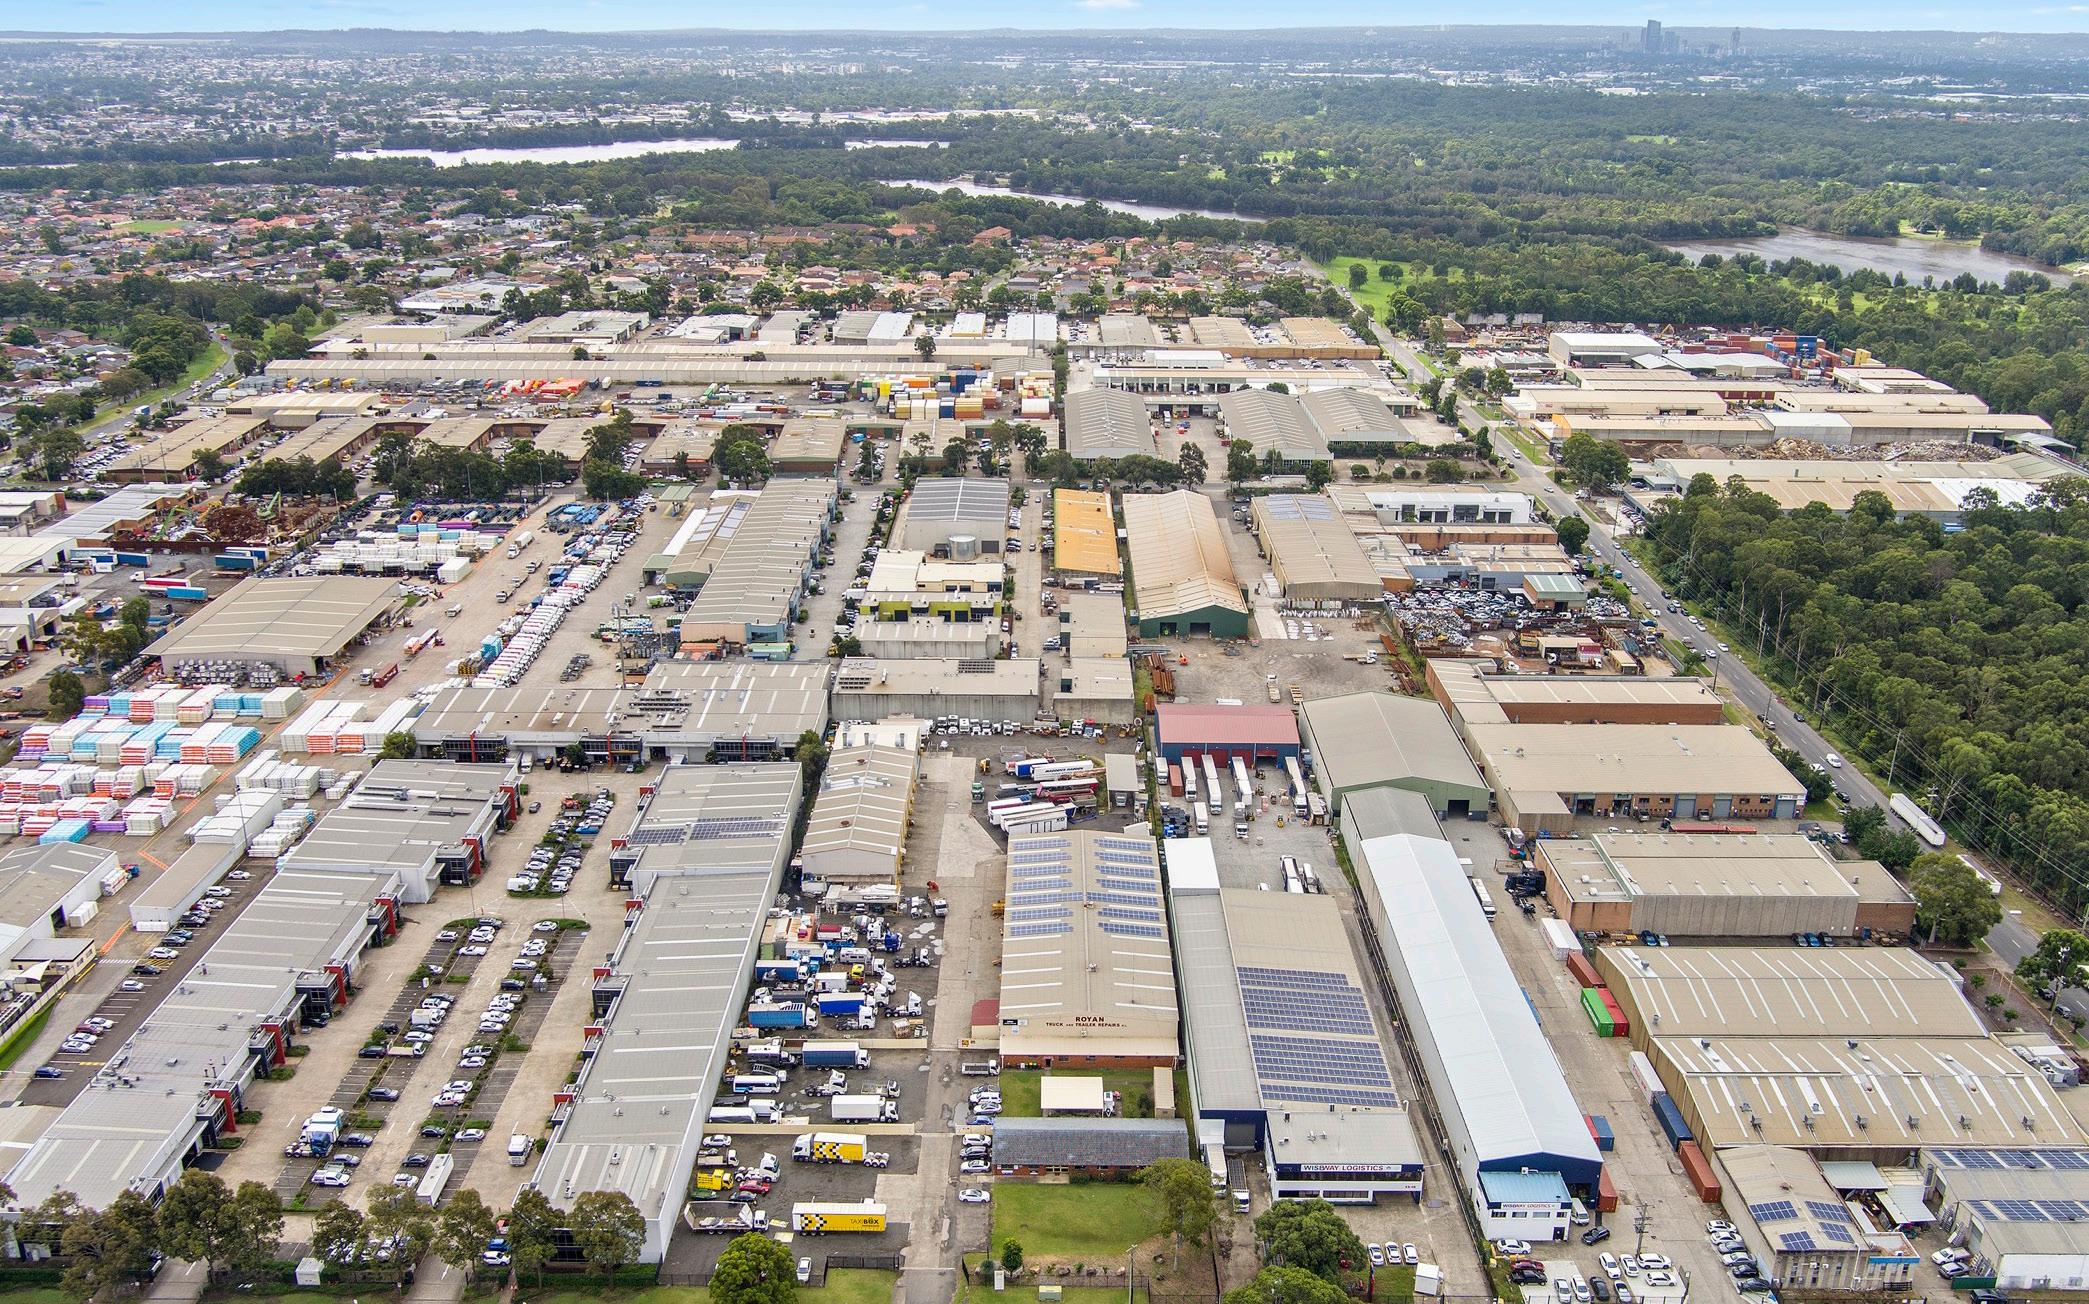
17-23 Alfred Road, Chipping Norton NSW 2170
Cover Image: 89 Priestdale Road, Eight Mile Plains QLD 4113
Industrial Occupier Demand Runs Strong
Occupier demand for industrial property, across all capital city markets, picked up strongly through the 2022 financial year with take-up running well above long run averages or close to record levels.
Common themes are evident across most industrial regions. The strength of demand was driven by strong state economic rebounds from pandemic related disruptions, as well as pandemic boosted trends including rapid online sales growth and businesses taking extra inventory storage space to counter supply chain disruptions.
On the supply side, completions are running well above average in Sydney, Melbourne, Brisbane and are picking up in Perth and Hobart, but are well below average in Adelaide, Canberra and Darwin. The delivery of projects in all markets are suffering to varying degrees from labour and material shortages, which are pushing construction costs higher.
The strength of occupier demand has outpaced completions in Sydney, Melbourne, Brisbane, Adelaide, Perth, Hobart and Canberra, pushing vacancy rates to very low levels. This has driven a strong rental response and winding down of leasing incentives, which in a number of markets are close to zero. Cost pressures flowing through from higher land values and construction costs are pushing up pre-lease rents adding further upward pressure to market rents.
The weight of funds chasing industrial property drove yields down to historically low levels over the 2022 financial year, underpinning exceptional property price gains in most markets. However, the rising cost of debt, flowing through from higher bond rates caused investors to pause more broadly in during the second quarter of 2022, however, we are yet to see concrete evidence of yields softening.
We expect occupier demand for industrial property to remain strong in most markets over the next 12-months before pandemic related drivers start to ease. On our forecasts, the rate of online spending growth will slow as spending on goods tilts back towards services and we do not think the shift towards storing higher local inventories will be enduring, once supply chain disruptions ease.
Beyond the next 12 to 18 months, our forecasts are for vacancy rates to drift higher across the eastern seaboard markets as supply takes time to adjust to demand. We expect economic growth in South Australia, the Northern Territory, the Australian Capital Territory, Western Australia and Tasmania to all slow to varying degrees in the short-tomedium term, pointing to moderating industrial occupier demand.
Near term rental growth prospects are positive across all markets, reflecting tight vacancies but also rising costs flowing through from the prelease market, that were previously absorbed using firming yields. The duration of strong rental growth depends, market by market, on how long rising construction levels take to surpass slowing occupier demand and push vacancies higher.
Industrial property yields are expected to soften across most capital city industrial property markets from the end of 2022, as the impact of higher bond rates flows through. This will end an extraordinary period of yield firming. However, rising rents will continue to drive solid capital value gains over the short to medium term.
Head
2
Industrial Market Monitor | 2nd Half 2022
Mathew Tiller
of Research, LJ Hooker Group
The NSW economy managed to weather the challenges posed by the Omicron variant in the first quarter of 2022, with the recovery from 2021’s lockdowns continuing.
We anticipate a continuation of robust rebound in economic growth over the remainder of 2022 and into 2023 as the state’s strategy of living with COVID becomes further entrenched. This will flow through to stronger than typical demand for industrial property space.

Sydney
South North Central West Outer Net face rent ($ sqm) $260 $235 $170 $140 Incentive (%) 7.0 11.0 8.0 8.0 Yield (%) 3.5 3.9 3.7 3.6 Capital value ($ sqm) $7,453 $6,040 $4,597 $3,908 3
Sydney prime industrial market indicators
Industrial Market Monitor | 2nd Half 2022
36-48 Ashford Avenue, Milperra NSW 2214
Leasing market
Demand for industrial property in Sydney has been extremely strong over the last 18 months, driven by a robust economic rebound across NSW from last year’s lockdowns as well as factors heightened by the pandemic.

Overall, gross take-up of industrial space exceeded 1.1 million square metres last year, reaching as high as 1.8 million square metres. Momentum slowed during the first half of 2022, with take-up only constrained by very tight vacancy amongst existing buildings. Most of the take-up in recent times has focused on the Outer West, followed by the South West and Central West.
The strength in occupier demand is being driven by transport & logistics users, retailers (pure play, e-commerce, food and cold storage), manufactures, and pharmaceuticals. The trend of occupiers taking more space for higher domestic inventories to counter supply chain disruptions is still evident. Supply chain disruptions and delays in securing stock has driven a shift by occupiers from storing sufficient inventories to satisfy immediate customer requirements (known as ‘just in time’) to higher stock levels and storage requirements (referred to as ‘just in case’ or ‘onshoring’).
We estimate metro net absorption reached a record high 1.2 million square metres (in buildings greater than 5,000 square metres) in 2021 and around 900,000 square metres for the 2022 financial year, close to double the long run average. There are many examples of larger footprints being negotiated in pre-lease deals, including a doubling of size by Cameron Group (6,200 square metres in Marsden Park), Kumho Tyres (11,300 square metres also at Marsden Park) and Allied Express (20,000 square metres at Bankstown Airport).
Business confidence surveys around the middle of this year show the ongoing pandemic is expected to have minimal impact on industrial property occupiers in NSW and that confidence is positive in the state. Indeed, the strong take-up of above average completions levels and speculatively commenced projects (reflected in very low vacancy rates) shows businesses are broadly confident about their prospects.
Based on our assessment, the vacancy rate for buildings greater than 5,000 square metres tightened at a rapid pace through 2021, as record net absorption outpaced above-average completions. At December, the total vacancy rate fell to an estimated 0.5 per cent (the lowest rate in over 15 years) from 3.0 per cent at the start of 2021. Since then, the vacancy rate has remained very low, ticking down to around 0.4 per cent at June 2022. Available evidence suggests vacancy rates are very low across all the regions, although there does appear to be more options available in the North, particularly for smaller occupiers.
The combination of strong demand and very low vacancies underpinned a sharp increase in prime net stated rents. Overall leasing incentives amongst existing buildings have fallen this year. We estimate average prime leasing incentives ended the 2022 financial year at 7 per cent in the South, 8 per cent in the Central West and Outer West, and 11 per cent in the North.
4
Industrial Market Monitor | 2nd Half 2022
20 Investigator Drive, Unanderra NSW 2526
Leasing outlook
Over the next 12 to 18 months, a handful of key drivers (that were significantly shaped by the pandemic) will remain dominant drivers of industrial property demand in Sydney.
Growth in online retail spending will continue to have a strong influence on industrial property demand in Sydney and will continue to encourage ongoing investment from industrial occupiers in more efficient warehousing and delivery services to satisfy their customers.
We do not anticipate that the build-up of domestic inventory seen during the pandemic will be enduring once supply chains normalise, as this inventory management strategy carries a higher cost to businesses. It is hard to say with confidence when higher stock-to-sales ratios will unwind, but our forecasts allow for supply chain pressure to ease by next year. Even so, we do not expect a return to pre-pandemic ‘just in time’ inventory practices.
Combining the drivers of demand, indicatively, we forecast net absorption to remain above 700,000 square metres this calendar and next financial year, sustained by the release of pent-up demand as completions ramp up. Thereafter, as pandemic related drivers ease, we forecast net absorption to moderate to a still healthy 500,000 square metres in the 2024 financial year.
Strong demand, lower vacancy and rising pre-lease rents are set to drive elevated rental growth in the near term. We forecast annual growth rates of 12 per cent to 17 per cent across the Central West and Outer West in the 2023 and 2024 financial years, whilst the Northern and Southern regions are anticipated to experience moderately higher rental growth.
Contained vacancies in the South and Central West are also supportive of 10 per cent to 18 per cent annual growth rates in the secondary market. Recent rises in long bond rates means that we no longer believe yields will continue to firm, removing a key suppresser of pre-lease rents (and in turn market rents). Hence, rising land values, construction costs and a forecast phase of yield softening all point to higher rents needed to make new builds feasible. Leasing incentives are also forecast to fall a little further by the end of this year, reflecting very tight market conditions, and driving exceptionally strong growth in effective rents.

5 3
Industrial Market Monitor | 2nd Half 2022
Sydney outer western industrial rents and capital values
The Sydney industrial property investment market was very strong, with a record $5 billion in sales transacted in 2021 and $3.5 billion in the first half of 2022, underpinned by a number of major portfolio sales. The market started this year with notable momentum, but the volume of sales dropped during the second quarter 2022 as rising interest (long bond) rates caused investors to pause.
Recent sales include:
• Logos acquired a circa 27-hectare parcel of land on Archbold Road, Eastern Creek for $180 million with plans to develop an industrial property estate;
• Centuria sold a 6,000 square metres warehouse at 30 Clay Place Eastern Creek property to an undisclosed foreign investor for around $35 million; and
• A local developer bought an 8,000 square metres site at 101-103 Fairford Road, Padstow from Chess Engineering for almost $19 million.

Investment outlook
In Australia, and across the globe, 10-year bond rates have risen sharply this year, reaching 3.6 per cent at June 2022. On our forecasts, bond rates will remain around current rates between now and 2024 before tapering back to a longer-term trend rate around 2.9 per cent, taking its lead from the United States.
Combined with rising short rates both in Australia and in the United States, this suggests the phase of yield firming in Sydney industrial property is drawing to a close. We are starting to see an increasing stand-off between potential buyers, who are pricing in offers on higher yields, and sellers unwilling to accept lower values. As such, little market evidence has emerged of softening yields. The combination of forecast rental growth and softer yields will see a slowdown in the extraordinary rate of capital value growth.
There still appears to be a notable volume of funds assessing an entry into the industrial property market across Australia’s eastern seaboard, with large mandates from GPT, Logos and Gateway Capital just to name a few. However, investors have become more cautious and less urgent when assessing opportunities.
Driven by the weight of funds chasing assets prime yields firmed 50 to 60 basis points during the 2022 financial year to a low of 3.5 per cent in the South, 3.6 per cent in the Outer West, 3.7 per cent in the Central West and 3.9 per cent in the North.
Secondary yields in the South are assessed at 4.5per cent and 4.8 per cent in the Central West, representing a firming of 50 basis points for the 2022 financial year. The strength of yield firming underpinned strong growth in capital values in 2021, ranging from 37 per cent to 51 per cent across the regions, representing record breaking growth. In the 2022 financial year, growth rates were almost as impressive at an estimated 29 per cent to 42 per cent. Secondary capital value growth in the South and Central West was also exceptionally strong.
We expect strong rental growth to drive solid price gains until the 2024 financial year, before a prolonged phase of more modest growth.
Prime values in the Southern, Northern, Central Western and Outer Western regions are forecast to rise by 16 per cent to 23 per cent over the three years to the 2025 financial year. Secondary prices in the Southern and Central Western regions are forecast to rise 16 per cent to 17 per cent over the same period.
6
Investment
market
Industrial Market Monitor | 2nd Half 2022
7138 The Bucketts Way, Taree South NSW 2430
Sydney is currently in the midst of a significant supply cycle, with completions well above the long run average. Completions (greater than 5,000 square metres) reached around 590,000 square metres in 2021, tracking towards 725,000 square metres for this year across 35 projects.

Project delays caused by material and labour shortages as well as weather disruptions are having a notable impact on delivery timetables, with several developments due for completion last year, pushed into this year as well as others due in 2022 delayed to 2023. The ultimate impact will see a smoothing out and prolonging of the current supply cycle. The Outer region dominates activity, accounting for 80 per cent of metropolitan completions this year – 587,000 square metres across 28 projects. This is followed by the Central West with 107,000 square metres (6 projects and a 15 per cent share).
The majority of completions due this year and next have been underpinned by pre-leases or have secured tenants during construction. Major developers continue to compete hard for large pre-commitments, keeping pre-lease rents competitive with (or below) existing prime rents, although both are rising notably. Pre-lease deals also typically include higher leasing incentives. However, our understanding is that there is also a significant proportion of speculative development occurring, with developers looking to benefit from low vacancies and strong demand from occupiers who can’t wait for a pre-lease.
Cost escalations coming from labour and material disruptions have not yet reached a point of derailing the current phase of completions yet. Our assessment is that construction costs alone increased 30 per cent to 35 per cent on average in Sydney in the 2022 financial year. As a result, rents required for new builds are notably rising.
7
Supply 14 Mildon Road, Tuggerah NSW 2259 Industrial Market Monitor | 2nd Half 2022
Supply outlook
Based on projects under way and a sustained period of low vacancies driving rents higher, we expect completions to ramp up in 2023 and remain historically high in 2024 at around 880,000 square metres per annum. We already know of around 30 projects, for a collective 970,000 square metres and are confident more will emerge.
Material shortages and construction cost pressures are likely to continue for the next 12 to 18 months, challenging, but not derailing project delivery. We expect the recent mixture of pre-leases and spec construction to continue as the major developers look to capture user requirements with both longer and shorter turnaround times.
Beyond the 2024 financial year, we forecast industrial property completions will gradually fall back closer to the long run average, crimped by moderating demand and moderately higher vacancies.
There are sufficient stocks of serviced vacant land to accommodate our near-term supply forecasts. More serviced land will be needed to allow for the bulk of post-2023 completions. The Mamre Road precinct will allow more projects as land is serviced. Further out, some of the precinct plans for the Aerotropolis have just been released, but contributions are yet to be finalised. It is likely that industrial development here will coincide with the 2026 Airport opening.
Sydney industrial demand and new supply

8
Industrial Market Monitor | 2nd Half 2022
Victoria’s economy was hit especially hard by the pandemic, however, momentum picked up as the state moved beyond the use of lockdown restrictions. This impetus has held into 2022 as catch-up growth persists to help drive the state’s economy.
In the long run, we still expect the state to outperform the national average, but by less than was expected pre-COVID. Leading into the pandemic, Victoria’s strong performance was partially driven by rapid expansions in higher education and tourism, and there will be permanent losses in these areas.

Melbourne South-East North West City Fringe Net face rent ($ sqm) $110 $96 $96 $180 Incentive (%) 14.0 20.0 20.0 8.0 Yield (%) 3.9 3.9 3.9 3.8 Capital value ($ sqm) $2,826 $2,460 $2,460 $4,764
Melbourne prime industrial market indicators
9 Industrial Market Monitor | 2nd Half 2022
Demand for industrial property has been extremely strong in Melbourne over the last 12 to 18 months, fuelled by a strong economic rebound from COVID triggered lockdowns and drivers heightened by the pandemic.

We are seeing very high enquiry and demand from a range of tenants and owner occupiers in the West, North and City Fringe and healthy demand in the South-East. Indeed, the lack of available options is pushing would be owner occupiers into the pool of tenants, with gross absorption exceeded 2m square metres during 2021. The strength of demand is underpinned by retailers (both pure play and omnichannel), transport & logistics operators and manufacturers
In net absorption terms, we estimate around 1.4 million square metres was taken up across metro Melbourne (in buildings greater than 5,000 square metres), and 1.2 million square metres for the 2022 financial year. Low vacancies amongst existing buildings are starting to impair business’ ability to take more space. Even so, net absorption is running at close to three times the long run average.
The vacancy rate tightened at a surprising pace in 2021, with record net absorption outpacing record completions. At December 2021, the total vacancy rate had halved from the beginning of the year to a very low 1.4 per cent. Given the strength of demand, we estimate the vacancy rate tightened even further over the second half of the 2022 financial year to around 1.0 per cent. We are seeing very low vacancy rates across the regions, indicating all regions have a shortage of vacant buildings.
We estimate net stated prime rents rose 20 per cent to $110 per square metre in the 2022 financial
year in the South-East, 16 per cent to $96 per square metre in the West and 20 per cent in the City Fringe to $180 per square metre. Rents in the North are comparable to those in the West. The growth pattern in secondary rents in the South-East reflected low vacancies in the region, increasing by around 21 per cent over the 2022 financial year to $85 per square metre.
Despite strong competition to secure tenants for new projects, rising costs means there is still little difference between pre-lease rentals and rents on existing buildings or spec-built warehouses, which are all climbing higher. The main difference between the three is that incentives offered on pre-lease options are typically higher and the tenant must wait for the pre-lease building to be completed.
Recent movements in leasing incentives reflect the rapid market tightening. In the South-East, we estimate prime incentives fell modestly in the second half of 2021 to an average of 19 per cent, but have fallen more steeply since, to 14 per cent by June 2022. In the West, incentives finished last year at an average 22 per cent but were closer to 20 per cent at June. In the City Fringe, average incentives are lower, moving from about 10 per cent at the end of 2021 to 8 per cent in the second quarter of 2022. Secondary incentives in the South-East have also reacted to low vacancies falling over the 2022 financial year an average 10 per cent.
Leasing market 10 Industrial Market Monitor | 2nd Half 2022
Leasing outlook
Medium-to-long term, we expect the connection between growth in the economy (as measured by SFD) and demand for industrial property to re-establish itself. Over the next 12 to 18 months however, a handful of key drivers (that were significantly shaped by the pandemic) will remain dominant drivers of industrial property demand in Melbourne.
First is growth in online retail spending. After growing at over 35 per cent in the 2021 financial year, we estimate national domestic online retail sales growth increased by 15 per cent in the 2022 financial year and then should normalise at closer to 10 per cent in the 2023 financial year. Victoria will capture a share of this growth, encouraging ongoing investment from industrial property occupants in more efficient warehousing and delivery services to satisfy their customers. The easing back in online spending will be shaped by consumers rebalancing their pandemic influenced spending back from goods to services.

Second is investment decisions triggered by the surge in food retailing in 2020 (driving demand for cold and room temperature storage). We estimate food retailing in Victoria rose by over 5 per cent in 2020 but eased back to circa 3 per cent in the 2022 financial year. Looking forward, we expect growth to normalise as population growth resumes.
Thirdly, we forecast a strong rebound in economic growth in Victoria this year and next as the state reopens, flowing through to stronger than normal demand for industrial property space.
Finally, we do not expect the build-up of domestic inventory will be enduring once supply chains normalise, because of the higher cost to businesses. It is hard to say with confidence when higher stock-to-sales ratios will unwind, but our forecasts allow for supply chain pressure to ease by next year. Even so, we do not expect a return to pre-pandemic ‘just in time’ inventory practices. Combining the drivers of demand, indicatively, we forecast net absorption to remain above 1 million square metres this year, before easing back to 830,000 square metres for the 2023 financial year and then an average of 600,000 square metres pa in the 2024 financial year.
Given a strong profile for demand, low vacancy rates and rising pre-lease rents, we expect that prime rents will grow circa 13 to 14 per cent pa across the regions in the 2023 financial year and the 2024 financial year. Recent sharp rises in long term bond rates means that we no longer believe yields will continue to firm, removing a key suppresser of pre-lease rents (and in turn market rents). As a result, rising land values, construction costs and a forecast phase of yield softening all point to much higher rents needed to make new builds feasible. Leasing incentives are also forecast to fall at a steady pace to mid-2023, reflecting very tight market conditions, and driving exceptionally strong growth in effective rents.
11
Industrial Market Monitor | 2nd Half 2022
Melbourne South East Industrial rents and capital values
The investment market for industrial property in Melbourne has been running hot in the last few years. Last year around $7 billion in sales occurred, spurred along by a number of major portfolio sales, notably Blackstone acquiring a large stake in the Dexus Australian Logistics Trust (focused on Melbourne and Sydney) for over $2 billion. During the first half of 2022, more than $2.3 billion of sales have transacted, indicating a normalisation of investor activity.
The value of deals has been fuelled by a strong flow of funds into industrial property at a national level, with widespread reports of considerable capital assessing opportunities in industrial property in Melbourne and across the east coast. However, like Sydney, investors have become more cautious and less urgent when assessing opportunities.
Notable sales of greater than $25 million in recent months include:
• Monash University purchased a 3.6-hectare site at 611-625 Blackburn Road, Notting Hill for $66 million from Toyota; and
• Frasers Logistics & Commercial Trust purchased a portfolio of three warehouses in Melbourne’s West for $6 million on a yield of 3.7 per cent.
Driven by the weight of funds chasing assets, average prime yields firmed considerably during 2021 to a low of 3.8 per cent in the City Fringe and 3.9 per cent in the South-East and West. During the first half of 2022, yields stabilised as investors assessed the impact of rising bond rates. Secondary yields in the South-East are assessed at 5.0 per cent, representing a firming of 110 basis points in 2021, before stabilising in the first half of 2022.
The strength of yield firming underpinned strong growth in capital values in 2021, ranging from 36 per cent to 43 per cent across the regions, representing near record breaking growth. The 2022 financial year growth rates were almost as impressive at an estimated 30 per cent to 36 per cent. Average prime prices at the second quarter of 2022 reached $2,460 per square metre in the West, $2,830 per square metre in the South-East and $4,760 per square metre in the City Fringe. Secondary South-East capital value growth mirrored the above rates to reach prices close to $1,700 per square metre.
Rising bond rates suggests the phase of yield firming in Melbourne industrial property is drawing to a close. On our forecasts, (notwithstanding short-term volatility) 10-year bond rates will remain around current rates between now and 2024 before tapering back to a longer-term trend rate around 2.9 per cent, taking its lead from the United States.
As a result, yield spreads to prime Melbourne industrial property have fallen to a sharp 20 to 30 basis points, well below the long-term average 400 basis points. We expect this will unsettle many investors, sparking a slow phase of yield softening from the end of this year. By 2025, we forecast prime yields to soften by 60 basis points, taking them back to 4.4 per cent to 4.5 per cent across the regions.
The speed of the yield softening will be slowed by strong rental growth for at least part of this period. Yields on secondary properties are forecast to take their lead from prime grade assets but with a greater softening (80 basis points) to 2025.
The combination of rent and yield forecasts will see a slowdown in the extraordinary rate of capital value growth. We expect strong rental growth will drive solid price gains until the 2024 financial year, before a prolonged phase of more modest growth. Average prime values are forecast to rise by 17 per cent to 18 per cent over the two years to June 2024, with slightly lower growth forecast for South-East secondary.
12
Investment market
Industrial Market Monitor | 2nd Half 2022
Investment outlook
Supply
Melbourne is currently in the midst of a major phase of industrial property supply. Completions (greater than 5,000 square metres) reached a record 1.1 million square metres last year are on track to reach 970,000 square metres across 46 projects for 2022.

Around two thirds of completions due this year are in the West (across 29 projects), one quarter in the South-East (11 projects) and 10 per cent in the North (6 projects).
The majority of completions due this year have been underpinned by pre-commitments or have secured tenants during construction. The largest examples include vidaXL, Myer, Early Settler and PF Logistics.
Supply outlook
Based on projects under way and a sustained period of low vacancies driving rents higher, we expect completions to remain historically high at around 970,000 square metres per annum until the end of calendar 2024. We already know of 54 committed projects for 1.15 million square metres and are confident that more will emerge.
Material shortages and construction cost pressures are likely to continue for the next 12 to 18 months, challenging, but not derailing project delivery.
Major developers continue to compete hard for pre-leases, keeping pre-lease rents competitive with existing building prime rents, although both are rising notably. It is common to see speculative projects built in tandem with a pre-commitment being secured. Around 25 per cent of the projects due this year started on a speculative basis, although much of this space has already been leased.
In time, these pressures should ease as supply chain disruptions eventually normalise. We expect the recent mix of pre-lease and spec building to continue as developers look to capture both longer and shorter turnaround needs. Speculative development also allows developers to pass through cost increases whilst the market stays tight.
13
Industrial Market Monitor | 2nd Half 2022
Melbourne industrial demand and new supply
Queensland’s economic outperformance over the past two years has been partly driven by a rise in interstate migration, which has provided both additional demand for goods and services and additional supply of workers.
We expect the upswing in net interstate migration has further to run, which underpins our positive outlook for strong economic growth for 2022 and 2023.

Brisbane South North Trade Coast Yatala Net face rent ($ sqm) $122 $130 $140 $110 Incentive (%) 16 12 13 15 Yield (%) 4.3 4.3 4.2 4.4 Capital value ($ sqm) $2,837 $3,023 $3,333 $2,500
Brisbane prime industrial market indicators
14 Industrial Market Monitor | 2nd Half 2022
27 Pentex Street, Salisbury QLD 4107
Leasing market
Occupier demand for industrial property across Brisbane picked up very strongly during the 2022 financial year. By our estimates, net absorption reached around 715,000 square metres during this period, which is around two-to-three times the long run average. Buoyed by Queensland’s relatively strong economic performance in recent times, businesses are making leasing decisions to enable them to service rising demand from their customers.

Enquiry has been very strong across the South, South East, South West, North and the Trade Coast. Rising interest rates are pushing some would be owner occupiers into the tenant pool, as is the limited options for owner occupiers to purchase.
Demand continues to come from a broad range of sectors as businesses invest in supply chains. However, the most active groups in the market looking for space during the 2022 financial year were transport and logistics, retailers (including e-commerce) and manufacturers. Many businesses are now holding more inventory to guard against supply chain disruptions and would like to take additional storage space if it were available. This is a common theme, not unique to Brisbane.
The surge in net absorption during the 2022 financial year easily outpaced rising new completions, lowering the metropolitan vacancy rate to an estimated 1.6 per cent at June, the lowest vacancy since the tail end of the last resources boom 10-years ago. Vacancy rates are extremely low in the Trade Coast and North regions but are so low as to be constraining net absorption across the metropolitan area as a whole.
Reflecting the rapid market tightening over the last 12-months, net stated prime rents rose strongly across the regions to sit between an average $110 per square metre at Yatala up to $140 per square metre on the Trade Coast at June 2022, all up by around 10 per cent per annum.
Average prime incentives started to fall notably during the 2022 financial year, ranging from 12 per cent in the Trade Coast to 16 per cent in the South. Incentives on pre-lease deals can be higher, depending on the developer. Average secondary stated rents demonstrated solid to strong growth as well, rising by 6 per cent to 12 per cent across the regions.
15 5/14 Freemantle Street, Burleigh Heads QLD 4420 Industrial Market Monitor | 2nd Half 2022
Leasing outlook
The impact of rising COVID cases on the state’s economy proved to be transitory, with Queensland experiencing a relatively benign experience with COVID over recent months.
Key drivers come from rising interstate migration (and associated demand for goods), positive prospects for mining investment and the shortterm construction boost from government stimulus measures. Travel flows are continuing to normalise, and Queensland is set to be a major beneficiary of this with tourism exports picking up sharply in the most recent data point. Given this, we expect growth will remain robust in the near term, positioning the Queensland economy as a top performer nationally.
Demand for industrial space will also continue to be supported by the structural shift to servicing e-commerce. However, the extraordinary pace of growth that was heightened by pandemic related restrictions has already slowed and is likely to slow further as people balance spending on goods back towards services. Even so, we still expect online spending in Queensland to grow at close to double-digit pace until the middle of the decade.
Like the rest of the eastern seaboard, the food retail spend increased at a rapid pace in Queensland over the 18 months to mid-2021, driving demand for industrial space.
The pace of expansion has since slowed and we expect growth in food retailing moderate further, more in line with population growth.
The pattern of the drivers outlined above suggest the take-up of industrial property over the next 12 to 18 months will remain robust. We forecast net absorption remain at or above 580,000 square metres pa until the end of 2023, before falling back to around 460,000 square metres towards the middle of the decade as pandemic related drivers dissipate.
We expect that vacancy rates will remain around current low rates until the end of next year, before rising to around 2.4 per cent in 2025 as an increasing supply response outpaces normalising demand.
The outlook for prime stated rents is for strong growth to be sustained over the next two years, at an indicative circa 10 per cent pa before slowing in the 2025 financial year, with owners winding back incentives. We anticipate rising rents will be underpinned by tight market conditions and rising pre-lease rents (driven by higher land values and construction costs impacting feasibilities) filtering through to market rents.

16
Industrial Market Monitor | 2nd Half 2022
Southern Brisbane industrial rents and capital values
The Brisbane industrial property investment market was very strong last year, with sales surpassing $1.3 billion. The market started this year with momentum, but the volume and value of sales dropped during the first half of 2022 as rising interest (long bond) rates caused investors to pause.
Major recent sales of Brisbane assets included:
• Sims Ltd buying a 26,000 square metre building at 69 Tingara Street, Pinkenba for almost $90 million;
• Hines paid $211 million for a portfolio of four properties including 55 Brownlee Street, Pinkenba, reflecting an overall yield close to 3.5 per cent;
• RF Corval bought 52 and 60 Formation Street, Wacol with a combined building area of circa 7,700 square metres for almost $16 million; and

• Centennial Property Group acquired 29 Parker Street, Pinkenba for almost $16 million.
Investment market Investment outlook
In line with the Sydney and Melbourne markets, we expect yields for Brisbane industrial properties will come under pressure to start softening over the second half of 2022 as higher bond rates ratchet up investor’s cost of debt. Since 2020, 10-year bond rates have increased by 270 basis points, narrowing the spread to prime Brisbane industrial property yields to well below the long run average.
Evidence suggests many investors are already factoring in higher yields on offers. But there is not a dearth of deals confirming a softening in yields yet. On our forecasts, prime yields in the benchmark South will soften by 70 basis points by mid-2025 lifting them up to an average 5.0 per cent. When combined with strongly growing rents, this suggests capital values will experience reasonable growth the next two years before stalling.
Overall, we assess the weight of money chasing industrial property in Brisbane pushed yields down by an average 80 to 90 basis points in the 2022 financial year, with firming seen across both prime and secondary grades and all regions. Most of the firming occurred in the first quarter of 2022, with yields stabilising in the second quarter of as the impact of higher interest rates caused a pause.
At June 2022, we estimate average prime yields stood between 4.2 per cent and 4.3 per cent across the Trade Coast, South, and North. Yields on secondary assets followed a similar pattern. Yields on secondary asset sat between 5.3 per cent and 5.4 per cent across the three major industrial regions at June 2022.
Reflecting the combination of strong stated rental growth and stable yields, average prime capital values showed rapid growth through the 2022 financial year.
17
Industrial Market Monitor | 2nd Half 2022
16-20 Project Street , Warwick QLD 4370
We estimate an above average 440,000 square metres of new supply was completed across the Brisbane metropolitan area during the 2022 financial year, across circa 29 projects (greater than 3,000 square metres in size). Of the projects completed over the last financial year, the Southern and Western Corridors continued to dominate activity. The volume of completions represented a substantial step up from the 320,000 square metres completed in calendar 2021.
Supply outlook
Based on projects under construction and approvals data, around 600,000 square metres of new builds are due for completion metro wide by the end of calendar 2022. The 2023 calendar year is expected to be another very strong year for supply, surpassing the mark set this year.
Activity will be supported by large pre-committed spaces including Winning Appliance (circa 46,000 square metres at Wacol), Bapcor Limited (45,000 square metres at Redbank), a 25,000 square metres facility partially committed to Daikin at Murrarrie and a 23,000 square metres warehouse for Burndy Cable Support at Acacia Ridge. As elsewhere, there is the potential for project completions to slip due to capacity constraints across the construction industry.
Most of the developments completed in the 2022 financial year were underpinned by tenant precommitment. However, a notable proportion commenced on a speculative basis. Major developers including GPT, Goodman, and ESR rolled out speculative developments and on the whole were successful in securing tenant requirements that could not wait for a pre-lease to be delivered.
Approvals data over financial year 2022 showed circa $1.16 billion of industrial projects was approved, heavily skewed towards warehouses. This represents a 48 per cent increase on the figure for the 2021 financial year. Around 33 per cent of warehouse approvals over the 12 months to June 2022 are in Ipswich, with 35 per cent captured in Brisbane’s southern regions.
We expect a mixture of pre-leases and spec construction to continue as the major developers look to capture requirements with both longer and shorter turnaround times. Without servicing and rezoning delays, there is plenty of planned industrial land to meet our supply forecasts.

Supply
18
demand and new supply Industrial Market Monitor | 2nd Half 2022
Brisbane industrial
South Australia’s economy has proven relatively insulated from the impacts of the pandemic. We estimate, Gross State Product (GSP) grew more than 5.0 per cent in the 2022 financial year, with the recent change of state government presenting upside for public demand growth.
The government remains a significant consumer, with defence programs based in Adelaide supporting growth in the medium term. The state has a large exposure to manufacturing, with the onshoring of supply chains and an increasing focus on technology supporting the outlook.

Adelaide Inner West Inner North Outer North Inner South Outer South Net face rent ($ sqm) $127 $112 $91 $114 $81 Incentive (%) 7.0 7.0 11.0 7.0 12.0 Yield (%) 4.8 4.9 5.8 4.9 6.4 Capital value ($ sqm) $2,646 $2,286 $1,569 $2,327 $1,266
Adelaide prime industrial market indicators
19 Industrial Market Monitor | 2nd Half 2022
Leasing market
The industrial leasing market remains solid. As with many locations, demand for industrial space received a boost in Adelaide as a result of the pandemic. It has been further helped by recent improved population growth in South Australia (and associated demand for goods). The strength of occupier demand has reduced vacancy rates in Adelaide to low levels, in turn underpinning strong rental and land value growth.
Manufacturing and logistics have been key contributors to occupier demand, bolstered further by the growth in mining and e-commerce. Recent examples include Wine Storage & Logistics leasing 17,890 square metres of space in Edinburgh in the first half of 2022, while Mine Tech Engineering leased a further 17,078 square metres in Edinburgh. M3 Logistics, UCI Manufacturing and Baiada Poultry also secured leases in the first half of 2022, contributing to around 60,000 square metres of take-up in this period, most of which was concentrated in the Outer North.

Adelaide experienced very strong rental growth across most precincts and grades of industrial property space through the first half of 2022. Leasing incentives remained largely unchanged despite vacancies falling below 1 per cent. Average prime rents ranged from $81 square metres in the Outer South up to $127 square metres in the Inner West at June 2022. Secondary rents also rose
slightly over the six months to June to reach an average of $77 per square metres. The growth in the secondary rental market was due to increased interest in the Inner North, Outer North and Outer South precincts, with greater availability of product,and a lower rental base for the latter two. Land values have trended up over the last couple of years, and this pattern continued in the first half of 2022.
The relatively affordable Outer North and Outer South, together with the much more expensive Inner North have recorded the strongest growth recently. The completion of the further sections of the North-South Corridor (motorway) as well as demand from owner-occupiers buying sites for new purpose-built premises have been key drivers.
The extent of increased demand for land has not only pushed up prices but also greatly reduced land availability. Prices range from about $150 per square metres in the Outer North and Outer South to around $620 (for lots under 5,000 square metres) in the site-constrained Inner South and Inner West.
20 Industrial Market Monitor | 2nd Half 2022
Leasing outlook
Near term occupier demand is likely to be stronger than the underlying economic conditions with some companies actively looking for additional storage space, to allow them to store higher inventory levels to manage supply chain disruptions.
Public sector investment in road projects is expected to continue over the short term. This has indirect benefits through changes in the accessibility of different industrial areas and could boost gross leasing demand. Following the completion of the Regency Road to Pym Street section, work on the North-South Corridor project continues with preparations for the final stage – the 10.5 km Torrens to Darlington Project –underway. This section, which provides a bypass to twenty-one intersections, is set to further enhance transport links. Construction is likely to be delivered in stages, with final completion expected in 2030.
As companies relocate to take advantage of road improvements – particularly in the logistics sector – they will leave behind secondary space in the more established and centrally located areas. In some cases, sites may be lost to industrial use, being withdrawn for residential redevelopment, but in other cases premises left behind could add to vacancies.
As with other locations, we expect upgrader demand in Adelaide to continue over time as business move to newer, more efficient premises, incorporating technological advancements.
In addition, private sector spending is occurring in the energy and the transport and logistics industries. Solar and battery storage investment is being undertaken to ensure the state’s energy supply remains stable. Increases in online spending have driven demand for additional (largely prime) warehouses for fulfilment centre conversions, not a trend unique to Adelaide.

21 Industrial Market Monitor | 2nd Half 2022
Investment market
Investor interest in the industrial property sector is strong in Adelaide, as it is across the nation. Transaction activity is strong across the board. As anticipated, 2021 reached even higher heights than the peak in 2019, with approximately $750 million transacting across the year.
Momentum has continued into 2022, with around $150 million selling across the first half of the year, limited only by tightly held assets. Transactions across all price cohorts remain buoyant, supported by expectations of strong rental growth despite a changing interest rate environment.
Yields continue to firm, but at a slower pace than the last few years in the face of higher bond rates and interest rates amidst strong inflationary pressure. However, ongoing investor interest, solid occupier demand and low vacancies have seen Adelaide’s average prime industrial yield tighten by a further 15 basis points through the first half of 2022 to settle just below 5 per cent, with some transactions even reporting yields of below 4 per cent.
Investment outlook
We believe a slow phase of yield softening will commence around the end of this year, spreading across the markets, including Adelaide. On our forecasts (notwithstanding short-term volatility) 10-year bond rates will remain around current rates over the next 12 to 18 months before tapering back to a longer-term trend rate, taking its lead from the United States.
This will ultimately push up investors’ cost of capital, forcing many to adjust their required return on investment. We think the narrow yield spread on Adelaide industrial properties will unsettle many investors, sparking a slow phase of yield softening from the end of 2022.
Recent notable sales include:
• Fife Capital’s $121 million purchase of the 45,000 square metres Treasury Wine Estates warehouse and distribution facility from AM Alpha, a year after AM Alpha paid $98 million for the asset;
• MA Financial sold 5 Talisman Avenue in Edwardstown, with a WALE of 6.6 years, for $20 million on a yield of 4.6 per cent;
• Centuria acquired a distribution facility and office warehouses at 27-30 Sharp Court in Cavan with a WALE of 5.3 years from MRS Property for just over $23 million, reflecting a yield of 4.2 per cent; and
• ICAM paid $12 million for IKEA’s South Australian distribution centre on Transport Avenue in Netley.
However, as with other markets, we are yet to see clear evidence in Adelaide of an asset repricing. Strong near term rental growth is likely to offset much of the near-term yield softening which means capital values are not expected to suffer a significant setback.
The investor profile in Adelaide is unlikely to change in the near term. AREITs and other institutional investors are likely candidates if a large, newly developed asset with a long lease in place comes onto the market, while the smaller end of the market will remain dominated by private investors and owner-occupiers.
22
Industrial Market Monitor | 2nd Half 2022
Following a record-breaking 2020 for new completions, 2021 was more muted at an estimated 115,000 square metres across Adelaide. New supply is expected to remain around similar levels in 2022, with around 110,000 square metres likely to be completed, with another 68,000 square metres proposed. Close to 50,000 square metres was complete in the first half of the year. The majority of projects finished so far this year were relatively small in scale, such as a 7,700
Supply outlook
The value of approvals for factory and warehouse construction has risen well above the lows of 2020, with $410 million approved over the 2022 financial year. Consequently, we expect this to flow into completions in the near term. Warehouses dominate total approvals, contributing roughly 75 per cent, with the Adelaide West region accounting for the vast majority.
Major projects due for completion over the next 12 months, include the Osborne North future submarine construction yard, alongside the 10,000 square metres La Casa Del Formaggio cheese production facility in Edinburgh Parks and the 9,000 square metres Mainfreight freight facility in Regency Park.
Traditionally, most of the development pipeline floorspace represents pre-committed facilities or those purpose-built for an owner-occupier, with little speculative space. That appears likely to continue.
square metres design and construction warehouse for Joyce Foam Products in Edinburgh North and a new 15,000 square metres fertiliser dispatch facility for Wengfu Australia in Port Adelaide.
The Outer North remains a focus for supply, responsible for around half of the completions last year, and is expected to continue this share of new supply in 2022. However, as with elsewhere, the speed at which new construction can be delivered is likely to be slowed by material and labour shortages.
Over the medium term, there are numerous major industrial sites available to cater to future demand, but opportunities are limited in the most in-demand precincts. Construction is underway at CEP Energy’s large-scale storage battery at the former Holden site in Elizabeth, now Lionsgate Business Park. In addition, there are another 220 hectares of the 400-hectare former multi-function polis site (although some may be set aside for residential construction).
Adelaide also has lost industrial land to other uses, as noted earlier, with several sites rezoned to residential or mixed-use development following the closure of industrial plants. More of this can be expected, especially in inner areas with higher land values as occupiers upgrade to sites serviced by the new transport infrastructure.
23
Supply
Industrial Market Monitor | 2nd Half 2022


24 Adelaide demand and industrial building approvals Industrial Market Monitor | 2nd Half 2022
Higher commodity prices have supported the WA economy and boosted government revenue and corporate profits. Moreover, the increase in mining revenues contributed to a very strong pickup in machinery & equipment investment as miners look to maximise current capacity.
Our near term outlook is for momentum to remain strong in the WA economy, underpinned by smaller-than-usual migration flows out of the state and robust resources investment.

Perth 25
prime industrial market indicators Perth Eastern Net face rent ($ sqm) $120 Incentive (%) 2.5 Yield (%) 5.0 Capital value ($ sqm) $2,400
Perth
Industrial Market Monitor | 2nd Half 2022
140 Stirling Highway, North Fremantle WA 6159
Leasing market
Leasing demand in Perth maintained strong momentum through the first half of 2022 and was particularly strong the in the South, all fuelled by the relatively robust growth in the Western Australian economy. Leasing volumes during the 2022 financial year were significantly higher than in the 2021 financial year and above or well above the long run average.
The demand for industrial space in Perth is coming from a broad range of occupiers, most notably transport and logistics, manufacturers, companies servicing the mining sector as well as retailers servicing consumption growth (Marley Spoon’s commitment to a new 14,000 square metres warehouse at Jandakot is a prime example).

We understand that many businesses want to occupy more space in Perth to store additional stock to combat supply chain disruptions, as well as to cater for growth, but are unable to do so due to very low vacancies across all the North, East and South regions.
Vacancy rates across the Perth metropolitan area have dropped to less than 1 per cent by June 2022, with the strength of demand outstripping low completions.
Reflecting the rapid tightening in the market this year, average prime stated rents rose rapidly across the regions during the first half of 2022. In the benchmark East, average net stated prime rents increased by 25 per cent over the 2022 financial year to $120 per square metre.
Leasing incentives fell at a rapid pace during the 2022 financial year as the swift recovery in the leasing market flowed through. At June 2022, prime incentives in the benchmark East were 0 to 5 per cent, at an average 2.5 per cent. We understand that some institutional owners are offering incentives up to 10 per cent for new builds but are pushing face rents higher than the market average. Overall, effective rents rose appreciably through the 2022 financial year.
26 35 Furnace Road, Welshpool WA 6106 Industrial Market Monitor | 2nd Half 2022
Leasing outlook
Over the next two years, we expect the Western Australian economy to perform well relative to the national economy, underpinned by a solid pipeline of (particularly resource-related) investment. We forecast an upswing in engineering construction in Western Australia, from $21 billion in the 2022 financial year to $26 billion by June 2024.
The recent strength in commodity prices have provided a boost to the Western Australian economy. The process of budget repair is coming through faster than expected which, combined with funding for the Perth City deal, is set to see public investment pick up. Major infrastructure projects including the staged Metronet (already under construction) will also provide further support.
The strength of the Western Australian economy will continue to encourage businesses to invest in additional capacity over time, boosting demand for industrial property.
Investment market
After rising to volumes well above average in 2021, activity in the Perth industrial property investment market has slowed through 2022. Although, the value of deals has held up due to some large transactions. Recent major sales include:
• Charter Hall recently acquired the partially developed 72-hectare Roe Highway Logistics Park for a reported $300 million;
• Charter Hall bought 919 Abernethy Road, High Wycombe for around $26 million on a 4.7 per cent yield;
• Centuria bought a 4,900 square metres industrial property at 431 Victoria Road, Malaga for almost $11 million, reflecting a yield of 5.0 per cent;
• Centuria also acquired 204-208 Bannister Road, Canningvale for just over $10 million, with plans to redevelop the 2.5 ha site; and
We also expect transport and logistics operators in Perth to partake in the broader supply chain efficiency drive underway Australia-wide to cater to structural changes in consumer spending, most notably the continued growth of online retail and firming up local supply chain capacity to service local consumer demands.
We forecast industrial demand to be broadly positive through the 2023 financial year before easing a little to still robust growth in the 2024 and 2025 financial years. The strength of demand for industrial property should help keep vacancies contained. In response, we expect further rises in industrial property rents to flow through.
• Redhill Partners buying a 14,300 square metres industrial property at 15 Beach Street, Kwinana Beach on a sale and leaseback from AusGroup for around $16 million.
Investor interest remains strong in Perth, particularly for offerings that present the potential to reset passing rents at higher market rents. Even so, prospective investors are reassessing property values to reflect the flow through from higher interest rates. However, like other markets, there is a lack of sales evidence to confirm any downward price revision or softening in yields.
At the second quarter of 2022 prime industrial yields in the benchmark East sat an average 5.0 per cent, unchanged from six months earlier. Prime average yields in the South and North sat close to levels in the East. Average yields for secondary properties typically sat around 100 basis points above prime yields.
27
Industrial Market Monitor | 2nd Half 2022
Investment outlook
We expect yields for Perth industrial properties will start to soften from around the end of 2022, and the rising cost of debt via higher bond rates flows through. However, much of this impact should be offset by the strength of rental growth over the near term.
The higher yields in Perth relative to those in the eastern seaboard will continue to provide an incentive for purchasers to invest in the region. The combination of softening yields countered by rising rents points to some positive capital value growth prospects over the medium term.

28
6163 Industrial Market Monitor | 2nd Half 2022
1 Railway Parade, Bibra Lake WA
The quantum of industrial property completions across the Perth industrial market during 2021 was below long-run averages, with circa 100,000 square metres finished, or about the same as 2020.

Rapid escalations in construction costs in recent times (due to labour and materials shortages) and land value gains, mean rents required for development feasibilities have shot up.
Supply outlook
Based on projects under construction, industrial completions are slowly increasing across Perth, but remain below average, with just over 100,000 square metres due for completion this year. The largest projects recently completed, under construction or at site works include:
• A 25,000 square metres distribution centre, precommitted to Australia Post at 112 Pilbara Road, Welshpool;
• A 20,000 square metres warehouse at 111-121 McDonell Street, Welshpool, committed to an undisclosed tenant;
• A 18,000 square metres warehouse on Centurion Place, Jandakot Airport;
• A 14,000 square metres warehouse on Sparton Street, Jandakot Airport, pre-committed to Marley Spoon;
But so have market rents, pushed higher by extremely low vacancy rates.
As a result, some developers are pushing ahead with speculative projects to capture demand from tenants who cannot wait from pre-lease space to be delivered.
• Two warehouses for a combined 16,500 square metres at the Roe Highway Logistics Park, Kenwick; and
• A circa 6,400 square metres warehouse under construction at Lodge Drive East, Rockingham.
The latest warehouse and factory approvals data to June 2022 shows that activity is picking up, with the combined value reaching $420 million, but this is still well below previous peak levels. However, the recent uplift is taking time to flow through to commencements. Furthermore, labour and material shortages are likely to lead to some delays in the construction of new industrial properties. Though, we understand that project delays for developments that are underway are not as severe as in other parts of the country.
Perth demand and industrial building approvals
Supply
29
Industrial Market Monitor | 2nd Half 2022
There are close ties between demand for industrial space and the performance of the Australian Capital Territory’s economy. Home to the vast majority of the Australian Public Service, the economy is based around service delivery and public administration.
The territory was relatively immune to lockdowns through the first wave of the pandemic, charting a steady, albeit unspectacular recovery. Along the way, the territory did suffer from a temporary setback from a hard lockdown in the third quarter of 2021. Even so, the federal election provided a boost that has returned economic growth back to positive territory this year.
Leasing market
Demand for industrial property was very strong through the first half of 2022, from both owner occupiers and tenants looking for space both greater and less than 1,000 square metres in size. Construction groups servicing major projects (including the Canberra Light Rail stages, the expansion of Canberra Hospital and a couple of major office buildings) have been the most prominent.
A number of construction companies are attempting to take extra space to store higher inventory levels to counter supply chain disruptions faced elsewhere around the country, but efforts are being hampered by low vacancy rates.
Building vacancies are reportedly very low across Canberra’s four main industrial precincts, in both prime and secondary quality buildings. On the back of low vacancies, prime rents continued to rise across the precincts in Canberra over the first half of 2022, reaching an average of circa $200 per square metre. This average sits within a range across the precincts of $190 to $210 per square metre for leases on space greater than 500 square metres in size.
In line with a tight leasing market, incentives are very low in Canberra, sitting between 0-2 per cent, reflecting a 1 per cent average.

Canberra Canberra prime industrial market indicators Canberra Net face rent ($ sqm) $200 Incentive (%) 1.0 Yield (%) 5.8 Capital value ($ sqm) $3,448
30 Industrial Market Monitor | 2nd Half 2022
Leasing outlook
Momentum surrounding the federal election and commencement of the new Federal government’s first term in office provided a positive stimulus for the Australian Capital Territory’s economy this year. The labour market is also in good shape with a low unemployment rate supportive of consumption growth in the near term.
Continued spending on major infrastructure, health and non-residential projects mentioned above along with a number of $100m+ road upgrades will help prop up activity and support demand for warehouse space from tradespeople and building construction firms.
Additionally, the territory government is pressing ahead with their emissions reduction plan, with further funding allocated to the Big Canberra Battery project in the 2022-23 territory budget. This project will build on current works to develop a large-scale battery in Beard, with Fyshwick and Gungahlin identified as locations for Stream 2 of the Big Canberra Battery.
Investment market
Activity in the Canberra industrial investment market was constrained during the first half of 2022 by the lack of quality institutional grade assets offered to the market. Most of the sales activity in the first half of 2022 was focused on properties in priced below $5 million, with only a couple of sales exceeding this value.
In the long run, the territory should experience a relatively robust recovery as migration flows normalise and population growth resumes although, momentum will be dampened after the 2023 financial year by the inevitable fall back in government activity as the pandemic is controlled and related activity is unwound and the focus turns to budget repair.
Overall, we forecast solid economic growth for the 2023 financial year, before easing back through the 2024 financial year and the 2025 financial year, ultimately taking some of the momentum out of the leasing market.
Hume and, to a lesser extent, Beard are expected to see the bulk of the new demand for larger industrial property. This is because both precincts offer land for businesses to expand. Mitchell will be constrained by the shortage of available vacant buildings and Fyshwick is effectively built out and can only accommodate occupant churn or redevelopment of existing premises.
The largest recent reported sale occurred earlier this year, with a 4,300 square metres warehouse at 11 Sheppard Street in Hume selling for close to $9 million, reflecting a yield of 6 per cent.
Indicative yields on prime assets were little changed in the first half of 2022 averaging around 5.8 per cent across the precincts. However, given the lack of benchmark sales, it is hard to confirm precisely where yields sit.
31
Industrial Market Monitor | 2nd Half 2022
Investment outlook
In the near term, the investment market is expected to continue recent trends. Few owners appear willing to sell in a market where rents are rising. Potential buyers are also likely to push for higher yields, repricing properties lower, to compensate for higher interest rates flowing through to a higher cost of capital.
Industrial property in Canberra will continue to be traded at a discount to comparable assets in the major eastern seaboard markets due to its relatively small size, shallow occupier demand and
Supply
Canberra experienced a quiet year for new industrial property supply last year with only a handful of new developments completed. During the 2022 financial year, the largest completion was circa 6,600 square metres on Couranga Crescent in Hume.
Amongst the few projects currently underway is work on approximately 1,700 square metres of space on Dacre Street, Mitchell. Material and labour shortages are causing substantial delivery delays for the few developers who are proceeding with projects.
Annual factory and warehouse approvals data to June 2022 showed a reduction from the previous year to $27 million which is below the long-run average.
isolation from competition from institutional investors.
However, over the medium term, we expect the pattern of yields to follow the larger eastern seaboard, softening moderately over the next couple of years before stabilising. It remains to be seen if rental growth will be strong enough to offset likely softer yields, particularly as occupier demand starts to moderate.

The relatively low value of approvals heavily favoured warehouses over factories. Approvals data suggests new supply will be minimal in the near term, which will work to keep vacancy rates low.
We understand that circa 200,000 square metres of new industrial construction is planned within the Endeavor Industrial Park in Hume, with lots at this estate sold out to a mixture of owner occupiers and developers. However, delays in delivering the next round of supply and rising construction costs will continue to drive up rents required to make development feasible. As a result, we expect the market tightness will take some time to alleviate, which means the upswing in rents has further to run.
32
Industrial Market Monitor | 2nd Half 2022
Canberra demand and industrial building approvals
Tasmania’s economy has struggled somewhat through the first half of 2022 after strong gains in the second half of 2021. Supply chain disruptions, high transport costs, falling dwelling and business investment as well as delays in the normalisation of tourism flow have all combined this year to dent growth. Even so, conditions in the labour market remain solid.
Leasing market
Patterns in the economy have played out in industrial property activity, with a lag. Enquiry levels were very strong across most of the precincts (including Derwent Park, Kingston, Cambridge and Mornington) at the start of 2022, up until the federal election in May. Since then, business caution has increased and decisions are taking longer in the face of rising inflation, increasing interest rates and slowing economic growth.
Indeed, the rising cost of debt has seen a change in the mix of occupiers looking for space, from one dominated by owner occupiers, to now tilting back towards tenants. Amongst those looking for space, the greater demand is for properties less than 500 square metres in size, with trades and builders serving the local population the most active.
Low vacancies pushed average rents higher over the six months to June 2022, for both prime and secondary space. Higher quality space is leasing at an average $200 per square metre, up from $150 per square metre a year earlier. Secondary space is leasing within a band of $160 to $180 per square metre, reflecting an average $170 per square metre (significantly higher than 6 to 12 months ago). Leasing incentives do not play a significant role in Hobart’s industrial property market due to the high proportion of private owners. Some owners are securing leases incorporating no incentives, with 5 per cent reported as the ceiling.

Hobart prime industrial market indicators Hobart Net face rent ($ sqm) $200 Incentive (%) 2.5 Yield (%) 5.8 Capital value ($ sqm) $3,448
Hobart
33 Industrial Market Monitor | 2nd Half 2022
Investment market
Hobart’s industrial property investment market was characterised by strong investor interest in 2021, which continued into 2022, but rising interest rates have taken the heat out of the market with no major investment sale reported during the first half of 2022.
Supply
In response to the tightness in the occupier market, some new industrial property supply is underway. Over the year to June 2022, total approvals across Hobart reached an elevated level of $6 million. This represents a near doubling from the 2021 financial year. Activity was split roughly evenly between warehouses and factories, with warehouses taking up a slightly larger slice. However, not all projects are pushing ahead as rising construction costs cause many developers to pause.
Sentiment suggests industrial property yields will soften, but there is no transactional evidence as yet to support this. As such, it is difficult to be confident about where yields sit in Hobart. We surmise prime industrial yields remained unchanged during the first half of 2022 at an average 5.8 per cent.
Based on projects currently underway, we are only aware of a distribution centre pre-leased to Sigma Healthcare on Greenbanks Road, Bridgewater and around 5,000 square metres of industrial space currently under construction across three projects in Cambridge.
Leasing and investment market outlook
Our view is that the recent upswing in Tasmania’s economy has started to run out of steam and will lose momentum over the over the next two to three years. Tasmania’s post-COVID recovery has relied heavily on government support; the eventual withdrawal of very easy fiscal settings will be a significant headwind to growth. In addition, disruptions to tourism flows will continue to hinder economic growth. Further, demand for the island’s high value produce is being challenged by trade tensions with China (a major export market), although the majority of exporters have managed to find alternative markets.
On the positive side, funding from the Hobart City Deal will go some way to placing a floor under the pull back in government spending. Meanwhile, public investment in road and bridge upgrades is set to be relatively strong in the near-to-medium term. Several major projects are expected or currently underway, including the New Bridgewater bridge and the Hobart to Sorrell Corridor upgrade. In addition, the Macquarie Wharf redevelopment will be a positive for the economy by improving access for freight and cruise ships. However, overall Tasmania’s economy is likely to only grow at a modest pace for some time, which will flow through to weaker demand for industrial property.
Approvals data points to higher levels of new industrial property construction activity in the near term. Sigma Healthcare’s distribution centre, mentioned above is due for completion in Q3 2022. Many projects face near term delays due to nationwide material shortages and high construction costs. However, a moderate pick-up in activity is likely over time as capacity constraints ease, based on planned (but not yet approved land releases and associated developments) in Cambridge.
Over the medium term, we expect the current undersupply of industrial property will ease as rising supply meets weakening demand as the economy slows. Overall, there is sufficient industrial zoned land in the pipeline (particularly around the Brighton Transport Hub and on future releases planned at Cambridge) to meet any likely level of demand. This will help moderate rental growth and property prices in Hobart’s key industrial precincts over the medium term. As in other markets, we expect yields to soften in the short to medium term as the rising cost of debt flows through to a repricing of assets. That means the likelihood of a moderate setback to capital values unless rental growth offsets higher yields.
34
Industrial Market Monitor | 2nd Half 2022


35 Hobart demand and industrial building approvals Industrial Market Monitor | 2nd Half 2022
The Northern Territory economy (as measured by State Final Demand – SFD) started this year in a positive manner after a long period of lacklustre growth following the winding down of the massive $37 Ichthys LNG project.
The territory has navigated the impacts of the pandemic waves well, with relatively mild impacts compared to most other states. This year, public demand has made a sizeable contribution to growth in the territory, more than offsetting other drags.
Darwin prime industrial market indicators
Leasing market
The economic improvement is yet to flow through to demand for larger industrial property, particularly buildings greater than 1,000 square metres. Indeed, there are a limited number of occupants (as owner-occupiers or tenants) actively looking for industrial property space in Darwin. Amongst those who are, small scale trades businesses are the most prominent and some transport groups, with a focus on servicing the local population more generally.
There is no shortage of vacant properties for occupants to choose from, with options available above and below 1,000 square metres. However, the bulk of options are tilted towards lower quality properties with relatively few prime buildings vacant.
There was no change in prime industrial rents over the six months to June 2022, although a shortage of market evidence means that indicators are estimates only. Average prime industrial face rents averaged around $110 per square metre.
There has also been no change in net rents for secondary buildings, averaging around $80 per square metre as owners with vacant buildings look to attract tenants. Leasing incentives also remained stable the first half of 2022, within a range of 10 per cent to 15 per cent, varying depending on the length of the lease.

Darwin
Darwin Net face rent ($ sqm) $110 Incentive (%) 12.5 Yield (%) 7.5 Capital value ($ sqm) $1,467 36
Industrial Market Monitor | 2nd Half 2022
Leasing outlook
The outlook for the industrial market in Darwin is linked to the prospects for the Northern Territory economy. On our forecasts, the Territories SFD will end this year with a solid 5 per cent before moderating to 2.0 per cent to 3.3 per cent over the next three years.
The moderating outlook is tied into the outlook for mining and government defence spending. The outlook for mining investment has become more uncertain. Shifts in policy and concerns about climate change are clouding the outlook, with this headwind not expected to abate quickly. Many projects have been put on pause, and we expect investment will be significantly lower in the medium term. Nevertheless, some large-scale projects are underway and have further to run, including Santos’ $5 billion Barossa LNG project and Nolans $1 billion rare earths.
Investment market
There was no real improvement in the state of Darwin’s industrial investment market in the first half of 2022 from 2021. Darwin’s stock of industrial space features mostly smaller properties with no major sales above $5m completed in recent times. Amongst smaller prime properties, the average yield at June 2022 was estimated at 7.0 per cent to 8.0 per cent, which was little changed on 2021 rates. Capital values for prime properties also experienced no change in the first half of 2022. The main hindrance to more transactions occurring in the Darwin industrial market is the lack of properties offered for sale that have secure longterm leases at yields attractive to potential buyers (in an environment of rising interest rates). Broadly speaking, owners of securely leased assets are choosing not to sell.
Some offset will be provided by government spending, with the federal government currently undertaking several projects to expand the number of military installations in the region. Further expenditure is also planned around US Force Posture initiatives, with works on this program anticipated to run until 2026. In addition, the Darwin City Deal includes a new campus for Charles Darwin University (currently under construction) and the State Square Art Gallery & Community Hub.
Over the medium term, positive economic conditions and project specific requirements linked to the projects listed above should flow through to moderate demand for industrial properties, with a lag, allowing the substantial overhang of vacancies to be slowly absorbed.
There would appear to be more upside than downside for price growth in Darwin’s industrial property market over the next few years. The slow improvement in the leasing market should, in time, reduce the overhang of vacant space in the market, boosting the likelihood of rental growth. However, this process will take time.
The other key influence is the yield differential of Darwin to other industrial markets across Australia. As rising cost of debt flow through on higher interest rates, investors are likely to look more favourably on higher yielding markets like Darwin. However, Darwin’s relatively small market size and remoteness will limit the pool of investors willing to invest there.
37
Industrial Market Monitor | 2nd Half 2022
Supply
There is very little by way of new industrial property supply that is either under construction or recently completed in Darwin. Over the 18 months to June 2022, we only know of a handful of industrial buildings that were completed, including circa 1,450 square metres at 29 McCarthy Close, Wishart and around 1,750 square metres at 32 Dawson Street, East Arm. Approximately 1,900 square metres is currently under construction on Raphael Road in Winnelie.
The most recent ABS data release indicates the value of industrial approvals lifted in the 2022 financial year to $27 million, with this result predominantly made up of warehouse approvals.


There are no major pre-lease or design and construct requirements currently active in Darwin that will underpin new supply. The largest requirement is for hard stand linked to an LNG project. As a result, the near-term outlook for new supply looks minimal.
If and when demand improves on positive economic growth, there is a plentiful supply of land to accommodate it. In particular, there is ample available land to build on in Berrimah, Tivendale, East Arm and Wishart.
38
Industrial Market Monitor | 2nd Half 2022
Darwin demand and industrial building approvals
More people, more places
PARTNER WITH AUSTRALIA’S MOST TRUSTED REAL ESTATE BRAND
Connect with us ljhcommercial.com.au LJ Hooker Commercial does not give any warranty in relation to the accuracy of the information contained in this report. If you intend to rely upon the information contained herein, you must take note that the information, figures and projections have been provided by various sources and have not been verified by us. We have no belief one way or the other in relation to the accuracy of such information, figures and projections. LJ Hooker Commercial will not be liable for any loss or damage resulting from any statement, figure, calculation or any other information that you rely upon that is contained in the material. © LJ Hooker Commercial 2022
LJ Hooker Commercial NSW Bankstown Ph: 02 9790 1111 Central Coast Ph: 02 4353 7700 Coffs Harbour Ph: 02 6651 6711 Forster Ph: 02 6591 6400 Macarthur Ph: 02 4620 6111 Newport Ph: 02 9979 1111 Penrith Ph: 02 4731 3399 Sydney City Fringe Ph: 02 8595 1899 Tamworth Ph: 02 6767 1710 Taree Ph: 02 6552 1133 Terrigal Ph: 02 4385 8444 Wollongong Ph: 02 4229 8600 LJ Hooker Commercial ACT Canberra Ph: 02 6248 7411 LJ Hooker Commercial NT Darwin Ph: 08 8924 0977 LJ Hooker Commercial QLD Brisbane Ph: 07 3115 7128 Broadbeach Ph: 07 5531 6688 Bundaberg Ph: 07 4131 8000 Burleigh Heads Ph: 07 5593 8377 Coolangatta | Tweed Ph: 07 5536 5577 Gold Coast Ph: 07 5592 0555 Mackay Ph: 07 4962 3535 Palm Beach Ph: 07 5534 4033 Solutions Ph: 07 5585 7888 Toowoomba Ph: 07 4688 2266 LJ Hooker Commercial SA Adelaide Ph: 08 8232 8844 LJ Hooker Commercial WA Perth Ph: 08 9220 2200

