

journalhomepage:www.elsevier.com/locate/totert
Ecologicaldynamics,resilienceandsustainability
WilliamGrace
AustralianUrbanDesignResearchCentre,1002HayStreet,Perth,WesternAustralia6000,Australia
ARTICLEINFO
Keywords: Model Equilibrium Ecosystem Collapse Predator Prey Resilience Sustainability

1.Introduction
ABSTRACT
Thisarticledescribesasimplegenericsystemdynamicsmodelofresourcedependencyinecosystemstoexplore thepotentialrangeofbehavioursthatcanarisepurelyduetosystemstructure.Themodelproducesasmall numberofbehavioursthatreplicatetheobservedreal‐worldbehaviourofecosystemsbutdoesnotproduce thelessplausibleoutcomesproducedinsimplerpredator–preymodels(e.g.LotkaVolterra)suchasexponential growthorexplodingoscillations.Themorelimitedrangeofbehavioursisattributedtotheinclusioninthe modelofspeciesdependenceonabioticresource flows.Thesimulationsexploretheresponseofsystemsin equilibriumtovarioustypesof ‘shock’ andtheoutcomesareusedtoreflectontheconceptsofresilience andsustainability.Theresultschallengethenormativeunderstandingofthesetermsandtheirrelationship toeachother.Theresultsalsoreinforcethenotionthatshockstotheabioticsystem flowsatthefoundation ofallecosystemspresentthegreatestthreatto ‘resilience’ astheyaffectalltrophiclevels.
Theconceptsofsustainabilityandresilienceshareacommonfocus ‐ theybothinvolvestudyofthedependencyofagentsonresourcesof onetypeoranotherwithinasystem,includingintwoofthewell‐knownsystemsarchetypes:limitstogrowthandtragedyofthecommons(Braun,2002).Resourceconstraintsarethereason ‘nothing growsforever’.Allanimals,includinghumans,aredependentona widerangeofbioticandabioticresources.Predatorsdependonprey, plantsrequireair,water,minerals,andsunlighttogrow.
Theterm ‘sustainability’ hasinsomecasesbeenusedinterchangeablywith ‘resilience’,atermcreditedtoC.S.Hollingfromhisseminal article ResilienceandStabilityofEcologicalSystems (C.S. Holling,1973). AlthoughHolling’searlyworkwasassociatedwithunderstandingthe persistenceofspeciesinnature,theterm ‘resilience’ hasbeen expandedbyhimandotherssincetoincludeconceptssuchas ‘trans formability’ and ‘adaptability’ insocio‐ecologicalsystems(C. Holling,Walker,Carpenter,&Kinzig,2004;Carletal.,2010).Several articleshavesoughttodrawconnectionsbetweentheterms ‘sustainability’ and ‘resilience’ (Berkes&Folke,1998;Fiksel,2006;Ludwig, Walker,&Holling,1997;Redman,2014),butnoneofferasatisfactory explanationofthemeaningofeachtermortheirrelationshiptoeach otherintermsofsystembehaviour.
Thelackofclarityaboutwhatismeantbythesetermshasledto thembeingdescribedas ‘boundaryobjects’,definedbysomeauthors as ‘atheoreticalperspectiveexplainingtheroleofobjectsininterandtransdisciplinaryresearch’ (Lundgren,2020).Whileitisacceptedthatthere
https://doi.org/10.1016/j.totert.2022.100011 Received20May2022;Revised30August2022;Accepted30August2022
maybevalueininformingresearch,thevaguenessofthetermsis unhelpfulinpromotingageneralunderstandingofwhatissustainable and/orresilientandwhatisnot.Inordertoanswerthisquestion,itis necessarytohaveamodelthatreflectstheobserveddynamicbehaviourofecosystemsinnature.
Thebiologicalresourcedependencyliteraturemostoftencited relatestotheinteractionsbetweenpredatorsandprey.AGoogleScholarsearchfor ‘Predatorpreymodels’ returns900,000results.Mostof thesearemathematicaltreatmentsofthespeciesinteractionsusingdifferentialequations,thegenesisofwhichisthewidelycitedLotka‐Volterraequationswhicharebasedonworkoriginallypublishedin 1910(Lotka,1910).
Swart(1990) reportsontheinsightgainedfromusingsystem dynamicsmodellingtoexploresystembehaviourarisingfromthe LotkaVolterraequations.Swart’smodelisconfiguredasshownin Fig.1
Modelsofthistypeproducearangeofbehaviours.Terminology varies,butinthisarticlethevarioustermshavethefollowing meaning.
Equilibriumaconditioninwhichstock(e.g.population)levels areconstantovertime.
Oscillationperiodicvariationinstocklevelswhichmayormay notvaryinamplitudeand/orfrequency. Periodicaformofoscillationinwhichtheamplitudeand (continuedonnextpage)
2772-8099/©2022TheAuthor(s).PublishedbyElsevierB.V. ThisisanopenaccessarticleundertheCCBYlicense(http://creativecommons.org/licenses/by/4.0/).
orbitperiodisregularandrepetitive. Limitcycleaformofperiodicorbitthatisclosed(i.e. “thata pointmovingalongthecyclewillreturntoits startingpositionat fixedtimeintervalsandthus executeperiodicmotion” Edelstein‐Keshet(1988)
Eachoftheseconditionsmaybestable(i.e.thesystemhasatendency tothatconditionindependentofinitialconditionsandperturbations), orunstable.
AsreportedbySwart,theLotkaVolterrastructurecanproducea widerangeofbehavioursdependingonitsparameterisation.These includeexponentialgrowthofbothspecies,extinctionofthepredators,dampedoscillationstowardstableequilibrium,explosiveoscillations,andnon‐isolatedclosedorbits.AlthoughtheLotka‐Volterra equationsareknownfortheirabilitytoproduceclosedorbits,these occuronlywithaspecificsetofparameters.AsSwartnotes: ‘IntheneutrallystableLotka‐Volterramodel,bothpopulationsundergoconstantoscillationswhoseamplitudesbearnorelationtothebiologyofthespeciesbut onlytotheinitialvalues ’ Asidentifiedbymanyotherauthors(Toro& Aracil,1988),theequationsareinsufficienttocharacteriseanyreal worldexamplesoflimitcyclebehaviour,asthecyclescreatedbythe equationsareinherentlyunstable.
Theexistenceofexponentialgrowthofpredatorsandpreyisclearly indicativeofmissingstructureintheLotkaVolterramodel.Asnothing cangrowforever,theagentsinquestionwouldbelimitedbybalancing feedbackswhicharesimplynotrepresentedinthemodelstructure. Similarly,explodingoscillationsarerarely,ifeverobserved,again probablybecausetherearebalancingfeedbacksmissingfromthe modelthatwoulddampsuchbehaviour.
Manyothershaveproducedmathematicalmodelsthatmodifyand expandtheLotka‐Volterraequations.Themostwellknownvariation onLotkaVolterraistheRosenzweig‐Macarthurmodel(Rosenzweig &MacArthur,1963).AversionofthatmodelafterTurchin(1997)is setoutbelowinequationform.
NandParethepopulationsofpreyandpredatorrespectively r0 isthepreygrowthrate, Kisthepreycarryingcapacity, cisthepredatorconsumptionrate disaconstantregulatingequilibrium(satiation)levels
δ isthepredatordeathrate
χ isthepredator–preyconversionrate
Thisconfigurationincorporatestheso‐called “HollingType‐IIFunctionalResponse” whichcharacteriseshowthepredationrateresponds topreydensity.
Thismodeleliminatesmostoftheobviousdeficienciesinthepure Lotka‐Volterramodelandcanproducearangeofplausiblebehaviours including:stableequilibriumpopulationsofpredatorsandprey, dampedoscillationsleadingtoequilibrium,predatorextinctionand limitcycles.Infact,themodelproducestwoformsofstablelimitcycle, oneinwhichpopulationsoscillateinanellipticalmannersimilarto theunstableLotka‐Volterraorbits(Fig.2a)andoneinwhichlimit cycles ‘emerge’ withpopulationlevelsthatfalltoalmostzero(see Fig.2b).ThisbehaviouroccursatelevatedvaluesofK – thepreycarryingcapacity,andisknownasthe ‘paradoxofenrichment’ (Rosenzweig,1971).
Apparentlystable,limitcyclebehaviourisobservedinpredator –preyinteractionsinnature.Probablythemostfamousexampleofthis derivesfromfurrecordsoflynx(predator)andsnowhares(rey)in Canadaanalysedby EltonandNicholson(1942) basedondatacompiledby MacLulich(1937).Thedataisillustratedin Fig.3 andillustratesapproximatelytenyearcycles.
Otherexamplesarereportedintheliteratureincluding(Gilg, Hanski,&Sittler,2003)inrespectofthecollaredlemmingintheArctictundra,andseveralothersby Begon(2009) p.298.Replicatingthis behaviourinthelaboratoryhasbeenlargelyunsuccessfulbutrecent workby Blasiusetal(2020) hasproducedlimitcyclesfrominteractionsbetweentheaquaticinvertebrateBrachionuscalyciflorus(predator)anditsprey,thegreenalgalspeciesMonoraphidiumminutum (prey).Theevidenceindicatesthatalthoughstablelimitcyclesare observedinnature,theycannotbereproducedbythesimpleLotka‐Volterratwo‐speciespredator–preymodel.Asnotedabove,stablelimit cyclescanbeproducedfromtheRosenzweig‐Macarthurtypemodels. CharlesKrebsfromtheDepartmentofZoologyattheUniversityof BritishColumbiahaspublishedseveralpapersonthelynx‐hareinteractionsinconjunctionwithotherauthors.In(Stenseth,Falck,

Fig.1. Predator – preymodelstructure(Swart1990)Thissimplifiedstockand flowdiagramillustratespopulationsas ‘stocks’ andinflows/outflowsfromthe stocksas ‘ratesofchange’ inthestocks.


Bjørnstad,&Krebs,1997),theauthorsreportthatasimplepredator–preyinteractionisinsufficienttoexplaintheobservedbehaviour.
“Wehavefurthermorefoundanasymmetryinthewaythelynxandthe harearepositionedwithintheecosystem:Thesnowshoehareappearsto beregulatedfrombelowandabove(byavarietyofPredatorsincluding thelynx).Thelynx,incontrast,seemstoberegulatedonlyfrombelow, andprimarilybythehare.Thus,fromthehare’spointofview,thefood chainisavegetation–hare–Predatorchain,whereasfromthelynxpoint ofview,thehare–lynxinteractiondominates.”
Thissuggeststhatanymodelthatcontainsonlypredator–prey interactionswithoutprey‐foodinteractionsmaybeinadequateto reproduceallfacetsofspeciesbehaviour.Snowhares’ foodresources includealargevarietyofplanttypeswhicharealsobioticresources whichinturnrelyonphotosynthesis,aprocessfuelledbyabiotic resources:air,water,sunlight,andnutrients(minerals).Theavailabilityofairandsunlightcanbeconsideredasvariable flows(atleastat temporalscalesrelevanttohumans).Waterandmineralscyclecontinuouslyandsoabioticresourcescanbeconceptuallyrepresentedas
flowsinanecosystemmodel.IntheRosenzweig‐Macarthurmodel, preyareregulatedfrombelowbytheKvalue(seeEquation1)which representsalllowertrophiclevelsundertheterm ‘carryingcapacity’ . Modelscommonlyincludethedynamicimpactofsucheffectsas “resourcesubsidies” (Leroux&Loreau,2008;Nevai&VanGorder, 2012)whichmayincludeallochthonousresources(e.g.carcassesthat seasonally floatacrossthesystemboundary)orautochthonous resources(e.g.dissolvedorganicmatterinlakes(Lau,Sundh,Vrede, Pickova,&Goedkoop,2014)).
Theterm ‘resilience’,atleastinrespectofecologicalsystems,was coinedbyC.S.(Buzz)Hollinginhisseminal(1973)article ‘Resilience andStabilityofEcologicalSystems’.Hollingwasinterestedinthedifferentformsofdynamicbehaviourobservableintheinteractions betweenspeciesandtheirenvironment.Inhisterms, ‘stability’ refers toecologicalsystemsthatareinarelativelystabledynamicequilibrium,meaningareturntoequilibrium ‘afteratemporarydisturbance’ By ‘resilience’ hemeant ‘thepersistenceofsystemsandoftheirability toabsorbchangeanddisturbanceandstillmaintainthesamerelationships betweenpopulationsorstatevariables’ .

Theemergenceofresiliencetheoryhasledtoasignificantresearch communityassociatedwiththeResilienceAlliance,1 spawningstudies spanningecology,socialandeconomicsystems;andadedicatedjournal ‐ Ecology&Society.Variousmodellingstudies(Kar,Pal,&Ghosh,2019; Pal,Kar,Yamauchi,&Ghosh,2020;Tromeur&Loeuille,2017)have consideredtheeffectonresiliencefromhumanharvestingofresources, mostnotablyinmarineecosystems,whereconventionalmanagement policiespursueMaximumSustainableYield(MSY)ofthetargetspecies ratherthanresilienceofthemultiplespeciesmakingupthatecosystem.
Theobjectiveoftheworkdescribedhereistwofold, firstlytocreate asimpleyetplausiblegenericmodelofecosystemsthatexplains observedbehaviour;andsecondlytousethismodeltounpackthe meaningsof,andrelationshipbetween,sustainabilityandresilience.
2.Methods
HereIdescribeasimplehierarchicalsystemdynamicsmodel (Randers,1997)ofafoodchainbuiltsequentiallyinseveralphasesto exploretheessentialdynamicsofbioticdependenceonresources, includingthefundamentaldependencyofalllifeonabioticresources. Themodelisdeliberatelysimplifiedinordertoprovideinsightsinto thegenericbehaviourofecosystemsbasedontheinherentstructureof dependency.Themodelhasnotbeenparameterisedtoreflectrealworld behaviourofanyspecificspeciesinteractions,rathertoexplorethe rangeofpossiblesystembehavioursarisingfromthatgenericstructure. Themodelseekstoreflecttheendogenousbehaviourofsuchsystemsbut doesn’tincludeallochthonousresourcesorattempttoincorporatethe variousautochthonousresourcesthatexistinrealsystems.
ThemodelwasconstructedusingtheVensimProfessionalsoftware (Version9.2.2usingaverysmalltimestep(0.03125)andR4KAuto integrationtypetoensuremodelstabilityoverawiderangeofparameterisation.Themodelstructureissetoutbelowwithfurtherexplanationoftheparameterisationofthemodel,inparticularthestock controlfunctions,containedinAppendixA.TheequationsforthecompletemodelareincludedinAppendixB.
2.1.Biotichierarchymodelling
2.1.1.Modelconstruction
Inordertoapproximatelyreplicatethenotionalsequentialintroductionofbioticresourcesinalandscape(i.e.plantsfollowedbyherbivoresfollowedbypredators),themodelwasconstructedindiscrete steps.
Theinitialstagemodelsimulatesplantdependencyonsoilmoisture,andparameterswerevaried(includingwithextremevalues)to testsystembehaviour,namely:therelativegrowthratesofplants andsoilmoisture,theunitconsumptionrateofmoisturebytheplants andthegraphicalfunctionsthatregulatetheinflowsandoutflowsto thestocks.Theparameterswerethen finally fixedattheparameter setthatproducedasmoothdynamictransitiontoequilibrium.The modelwasthenextendedtoaddherbivoresatatimeafterequilibrium hadbeenestablishedbetweenplantsandsoilmoisture.Parameters relatingtothebehaviourofherbivoreswerethenvariedtotestsystem behaviourpatterns,asinthepreviousstep.Onceagain,parameters werethen finally fixedatthevaluesthatproducedasmoothtransition toequilibriumacrosstheexpandedsystem.Thereafter,predatorswere addedandtheprocessrepeated.Specificdetailsofeachsteparesetout inthefollowingsections,andtheequilibriumparametervaluesare includedinAppendixB.
2.1.1.PlantdependencyonSoilMoisture
Considerabarren fieldthatiscolonisedbyasingleplantspecies(a bioticresource)thatisdependent(interalia)onSoilMoisture(anabioticresource).
Fig.4 depictsthedynamicsofthistwo‐levelsystem,whichcanbe readasfollows:
LoopB1ThestockofSoilMoisture(SM)is(onaverage) constantovertimepriortoplantcolonisation,i.e.there iszeroinflow.As SM isconsumedbyplantsitis replenishedbyinflowsregulatedbyfunction fSR (SM) uptoamaximumrate(RSM).
LoopB2 SM isdepletedbymoisturetranspiredbythePlant Mass(PM)ataratecontrolledbyitsmaximum transpirationrate(CSM),regulatedbyfunction fSC(SM). LoopB3ThePlantMass(PM)regenerationrateisafunction fPR(SM)ofSoilMoistureuptoamaximumregeneration fraction (RPM)andregulatedbyLoopR1.
LoopR1Theproductoftheregenerationrateandthestock valueof PM
where.
RSM,CSM,RPM arenon‐zeroconstants
fSR isadecreasingfunctionwithdomain{0 ≤ SM/SMi ≤ 1}and range{0 ≤ fSR ≤ 1}
fSC isanincreasinglinearfunctionwithdomain{0 ≤ SM/SMi ≤ 1} andrange{0 ≤ fSC ≤ 1}
fPR isanincreasinglinearfunctionwithdomain{0 ≤ SM/SMi ≤ 1} andrange{‐1 ≤ fPR ≤ 1}
ImagesofthefunctionsareincludedinAppendixA,andexplained furtherinthefollowing.
fSR regulatestheinflowtoSoilMoistureinresponsetoitsstock level.Att=0soilissaturated,andtherefore fSR =0,meaningthere isnoinflow,thusthesystemstartsinequilibrium.AsSoilMoistureis depletedbyplantsthroughevapotranspiration,SoilMoistureisreplenishedand fSR >0,meaningthereisanon‐zeroinflowwheneverSoil Moisturefallsbelowitsinitialvalue.
fSC regulatestheoutflowfromSoilMoisture.Initiallythereisno restrictiontooutflow(i.e. fSC =1)butasSoilMoistureisdepleted, theoutflowfromthestockdiminishes.ShouldSoilMoisturebecompletelydepleted, fSC =0,theoutflowiszero(whichensuresthatSoil Moisturestockcannotfallbelowzero).
fPR regulatestheinflowtothePlantMassstockinresponsetothe SoilMoisturelevel.Thisinflowrepresentsthenetregenerationrate ofPlantMassandthereforemusthaveapositiveandnegativerange (sethereto 1to+1)inorderforthestockofPlantMasstoboth increaseanddecrease.Theinflowmustbezeroatequilibrium(i.e. when fPR =0).Asconfiguredhere,thisoccurswhenSoilMoisture reachesaquarterofitsinitialvalue.
Atequilibrium:
InthisconfigurationtheequationforPlantmassismodifiedas showninEquation (6) andtheequationforHerbivoresisadded(Equation (7)).
Atequilibrium. H ¼ PM RPM f PR SM ðÞ C PM f PC SM ðÞ
Theadditionalfunctions fPC (thatregulatesPlantMassoutflowin responsetoconsumptionbyHerbivores)and fHR (thatregulatesHerbivoreinflowinresponsetoPlantMass)areillustratedgraphicallyin AppendixA. fPC isidenticalto fSC and fHR isstructuredsimilarlyto fPR. CPM and RH areconstants.
2.1.3.PredatordependencyonHerbivores
Considernowafurtherresourcedependentagent,aPredator, enteringthesystem(Fig.6)afterequilibriumhasbeenreached betweenHerbivores,PlantsandSoil.
Theequationsforthissystemfollow.
Andatequilibrium.
2.1.2.Herbivoredependencyonplants
Considernowthesituationwhereplantshavebeenestablishedand thesystemisinequilibrium,whenasmallnumberofHerbivoresenter thearea.Thisexpandsthemodelstructureasillustratedin Fig.5

Theadditionalfunctions fHC (thatregulatesHerbivoreoutflowin responsetopredation)and fPr (thatregulatesPredatorinflowin responsetoHerbivorestocks)areillustratedgraphicallyinAppendix A. fHC isidenticalto fSC and fPC, and fPr isstructuredsimilarlyto fPR andfHR.CPr and RPR areconstants. Fig.5. Simplifiedstockand flowdiagramof3levelsystem.

2.2.Resiliencetesting-post-equilibriumdisturbances
Toexploretheconceptofresiliencerequiresmodellingofthesystemresponsetodisturbancesorshock.Thiswastestedbyintroducing changesafterequilibriumhasbeenachievedinthehierarchydepicted in Fig.6
3.Results
3.1.PlantandSoilMoistureinteraction
Thetwostockmodeldescribedin Fig.4 startsinequilibriumwith zeronetinflowandoutflowofsoilmoisture(i.e.thesoilissaturated). Plantmassisintroducedattimezerowithaninitialsmallstock.This commencesthedynamicresponsesofPlantmassandSoilmoisture. Sensitivitytestingidentifiesthatthebehaviourofthissystemconfigurationislimitedtoasmallnumberofoutcomes.
WhenunconstrainedbylimitationsinSoilMoisturethePlantMass expandsatitsmaximumgrowthrate(RPM).Eventuallythegrowthrate ofthePlantMassbecomesconstrainedbylimitationsinSoilMoisture, i.e.thePlantMassregenerationratedropstozero.AtthisstagePlant MassandSoilMoistureareinequilibrium,meaningtheratesofinflow andoutflowofSoilMoistureareequal.Allofthisassumestheonly impactonthestockofPlantMassisSoilMoisture.
Thesystem’seventualequilibriumisreachedwhen fPR =0(Equation (4)).Asparameterised,atthatpoint fSC =0.25and fSR =1which meansthatSoilMoisture(SM)isaquarterofitsinitialvalueand inflowandoutflowareidenticalattherateof RSM.Accordingly,the productofPlantMass(PM), fSC and CSM isequalto RSM. Increasing ordecreasing RSM changestheequilibriumvalueofthePlantMass (PM)butotherwisehasnoeffect.
Thedynamicbehaviourofthesystemiscontrolledbytherelative magnitudesof RPM (thegrowthfractionofPlantMass)and RSM (Soil Moistureinflowrate) ‐see Fig.7.Belowacertainratioofthoseparameters(RPM /RSM)thesystemexhibitsasmoothtransitiontoequilibrium,irrespectiveofothersystemparameters.However,abovethat thresholdthesystemexhibitsdampedoscillationspriortoequilibrium becomingestablishedatthesamestockvalues.
Atveryhighratiosof RPM to RSM,theamplitudeoftheoscillations becomessoextremethatPlantMassisdiminishedalmosttozero,i.e. overshootandcollapsebehaviourisapparent(Fig.8).However,as notedabove,SoilMoisturecannotbeindefinitelydepleted,andsothis apparentbehaviourismisleading.Ifthetimeframeofthemodelis extended,itcanbeseenthatwhatappearstobeovershootandcollapsein Fig.8 isactuallyverylongperioddampedoscillationsleading eventuallytoequilibriumatthesamestocklevelsofPlantMass.2 ExaminationofEquation (3) illustratesthatanequilibriumlevelofPlant Mass(PM)cannotfalltozeroindefinitely.AsPlantMassgrows,Soil Moistureisdepletedbutiscontinuallyreplenished,evenifthestock levelreducestozero.Thisistheoutcomethatresultsfromtheinflow toSoilMoisturebeinga ‘rate’ ratherthanafractionofthestocklevel.
Insummary,thePlantMass ‐ SoilMoisturesysteminevitablytrends toauniqueequilibrium,albeitwithdampedoscillatorybehaviourevidentwithsomecombinationsofvariables.Extremevaluetestingofthe modelparametersconfirmsthatothermodesofbehavioursuchas exponentialgrowth,limitcyclesorexplodingoscillationscannotbe producedwiththismodelstructure.
Thisbehaviourisreflectiveofthedependentresourcebeinganabioticratherthanbioticresource.Theinflow(growthrate)ofabiotic resourceissomefractionofthestocklevel(i.e.thehigherthestock levelthefasterthegrowthrateandviceversa)whichcreatesreinforcingfeedback.IfthePlantMasswastofalltozero(e.g.throughacatastrophic fire)thePlantMasswouldbecomelocallyextinct.Incontrast, theinflowtoanabioticresourcereduceswiththestocklevel(i.e.the higherthestockofSoilMoisturetheslowertherateofinflow)creating balancingfeedback.IftheSoilMoistureweretofalltozero(e.g.years ofdrought)itwouldrecoverassoonasrainfallreturned.Thissimple modelexemplifiesthedependenceofallphotosyntheticorganisms ontheabioticresourcesofsunlight,nutrientsandwater.
2 OfcourseintherealworldthislevelofdepletionmayleadtoextinctionofPlantmass, theatto‐Foxproblem.

Fig.7. 2levelsystem-dynamicbehaviourarisingfromvariationof RPM to RSM.

Fig.8. 2levelsystem-overshootandcollapsearisingfromextremeratioof RPM to RSM.
3.2.Herbivore,PlantandSoilMoistureinteraction
Herbivoresareintroducedtothemodelattime50(thethreestock systemdescribedin Fig.5)withthePlantmassandSoilmoisture parameterssetatthevaluesthatproducedasmoothtransitiontoequilibriuminthepreviousstage(see Fig.7).
ThebehaviourofisdominatedbytheresponseofHerbivorestothe availabilityofPlantMass.ThisisregulatedbytheHerbivoreregenerationfraction(RH.fHR),ormorespecificallythelevelofPlantMassthat cansustainapositiveHerbivoregrowthrate.IfthePlantMassisinsufficienttocreateapositivegrowthrate(birthsminusdeaths)theHerbivoresimmediatelydeclinetoextinction(zeropopulation).Above thatthresholdvalue,thesystemcomestoequilibriumsmoothly (Fig.9)orviadampedoscillations,dependingontherelativevalues of RH and RPM (Fig.10).Thehigherthisratio,themorethesystem overshootsasitseeksequilibrium.Nevertheless,theoscillationsare damped.
However,ifthelevelofPlantMassthatcansustainapositiveHerbivoregrowthrateislowerthanthethresholdlevel,thesystem reachesabifurcationpointandexhibitsovershootandcollapsebeha-

3levelsystem – smoothtranstiontoequilibrium.

Fig.10. 3levelsystem – oscillationsarisingfromincreasingratioof RH to RPM.
viourastheplantresourceisexhausted(Fig.11).Theseoutcomes resultfromtheparameterisationofthegraphicalfunction fHR,more specificallythePlantMasslevelthattriggersanegativeHerbivore growthrate(i.e.populationdecline).ThedifferenceinHerbivore responsetoPlantmassscarcitybetweenthesethreesituations,i.e. immediatedecline,equilibriumorovershootandcollapse,isdepicted inthefunction fHR foreachcase(Fig.12).
Ifa(relatively)fastHerbivoregrowthrateiscombinedwitha ‘slow’ responsetoresourcescarcitythenovershootandcollapsebehaviourtransitionstoverylongperiodanddeepstablelimitcycles (Figs.13aandb).Theselimitcyclesareoftheformevidentinthe phaseplotshownin Fig.2b).
Thisbehaviour(Fig.13)occursatthehigher(relative)Herbivore growthratesbecausethecollapsehappenssoquicklythattheHerbivorestockdeclinessufficientlytobenegligiblebeforethePlantMass iscompletelyexhausted,leadingtoaslowrecoveryofPlantMass andconcomitant(eventual)recoveryofHerbivores.Intheovershoot andcollapsecase(Fig.11),thePlantMassisexhausted first,condemningHerbivorestoextinction.
Extremevaluetestingofthemodelparametersillustratesthatthis structuredoesnotproduceexponentialgrowthorexplodingoscilla-


Fig.13a. 3levelsystem – limitcyclesarisingfromextremeratiosof RH to RPM combinedwith fHR(PM) =0atlowerlevelsof PM.
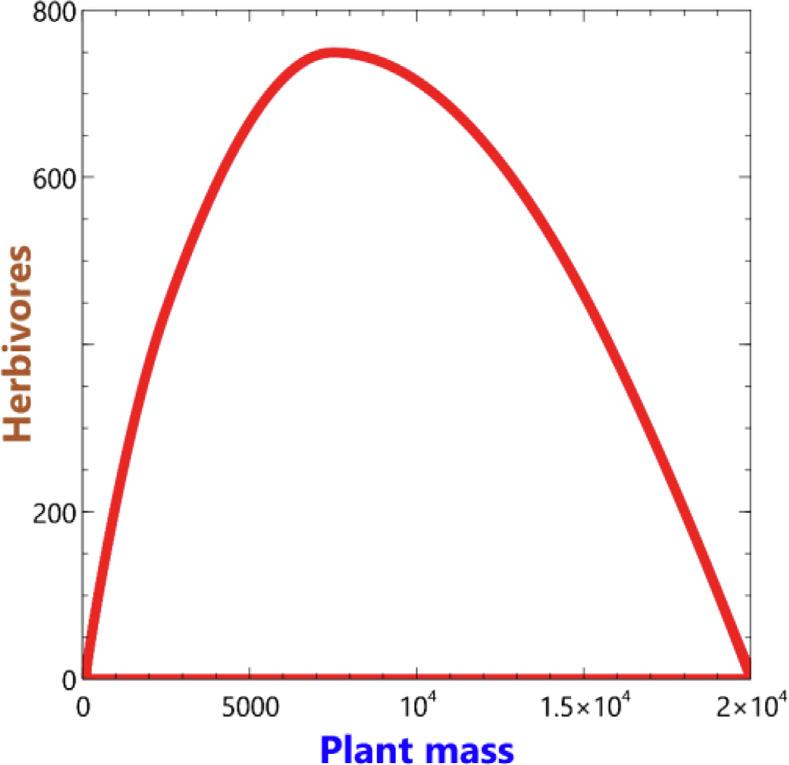
Fig.13b. 3levelsystem – phaseplotassociatedwith Fig.13a).
tions,norstablelimitcyclesoftheRosenzweig‐Macarthurmodeltype illustratedin Fig.2a).
3.2.Predator,Herbivore,plantandSoilMoistureinteraction Predatorsareintroducedtothemodel(thefourstocksystem depictedin Fig.6)attime200withthePlantmass,Soilmoisture andHerbivoreparameterssetatthevaluesthatproducedasmooth transitiontoequilibriuminthepreviousstage(see Fig.9).
ThebehaviourmirrorstheearlierintroductionofHerbivores,i.e.it isdominatedbytheresponseofPredatorstoscarcityofHerbivores. Abovethethresholdthatleadstoequilibrium,thesystemeitherdoes sosmoothly(Fig.14)orwithdampedoscillations(Fig.15).Asforthe previousHerbivore/Plantmasscase,belowthatthreshold,thesystem exhibitseither:overshootandcollapse(Fig.16)ofbothPredatorsand Herbivores;orverylongperioddeeplimitcycles(Fig.17).Again, extremevaluetestingconfirmsthatneitherexponentialgrowthor explodingoscillationsareevidentwiththisparameterisationofthe model,norstableellipticallimitcycles.Asforthepreviouscaseonly verylongperiodanddeepstablelimitcyclesareproducedbythe model.

Fig.14. 4levelsystem – smoothtransitiontoequilibrium.
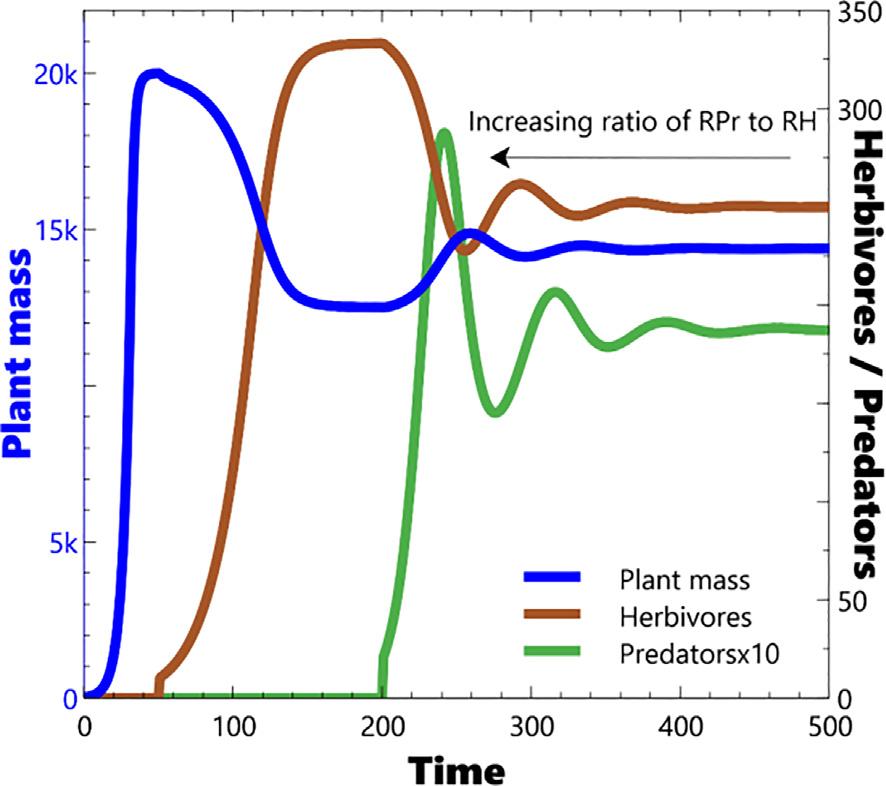
Fig.15. 4levelsystem – oscillationsarisingfromincreasingratioof RPr to RH.
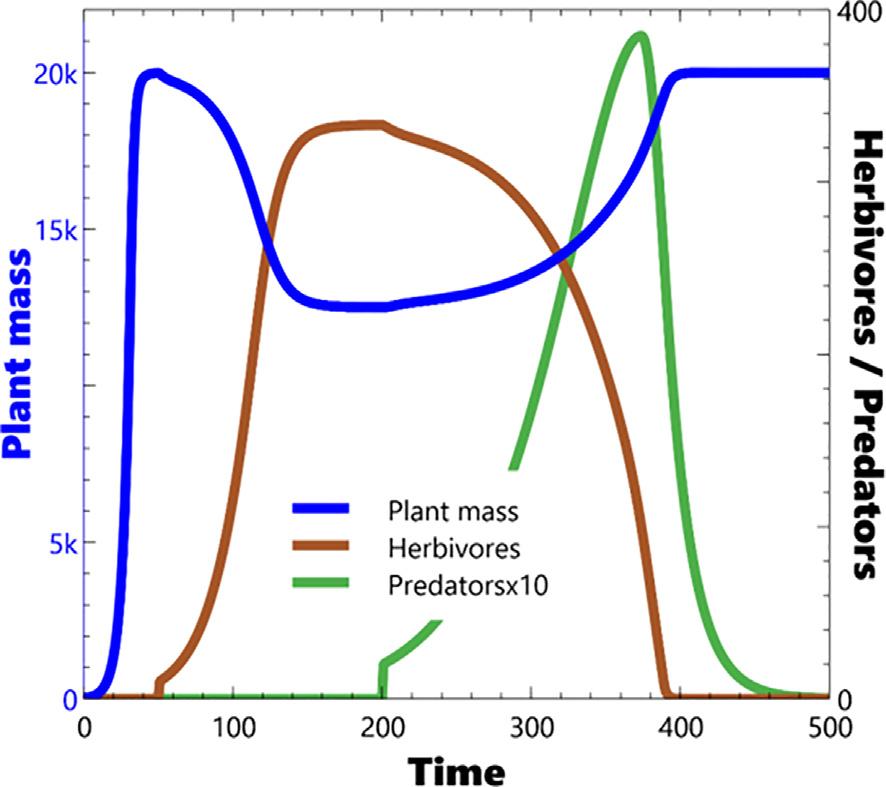
Fig.16. 4levelsystem – overshootandcollapsearisingfromextremeratiosof RPr to RH.

Fig.17. 4levelsystem – limitcyclesarisingfromextremeratiosof RPr to RH combinedwith fPr(H) =0atlowerlevelsof H.
3.3.Resiliencetesting
Persistenceofthesysteminstableequilibrium(asshownin Fig.14) wastestedbyintroducinga ‘spike’ ineachstockofaround20%ofits equilibriumlevelattime600.Thislevelofdisturbancehasnolong
termimpactonthesystem,whetherornotthespikeisanincrease ordecrease.Ineachcasestocklevelsreturntotheirinitialequilibrium levelswithminordampedoscillation. Fig.18 representsasudden increaseinHerbivorenumbers,whichinitiallytriggersincreasesin PredatorsanddecreaseofPlantMass.Thisconfirmsthattheequilibriumthatisestablishedisstable.
Thenexttestofstabilityistheresponseofthesystemtoslower changesinabiotic flows.Thiscasewastestedbyslowlyincreasing anddecreasing(throughramping)the flowsthatregulateSoilMoisture,followingtheestablishmentofequilibrium.Decreasingtheinflow ofSoilMoisturehasthepredictableeffectofreducingPlantMassand thereforebothPredatorandHerbivorenumbers,withPredatorsatthe topofthetrophicscalebeingmostimpacted(Fig.19).AtlargerreductionsofSoilMoisture flows,Predatorsbecomeextinct(Fig.20)andat evenlargerreductionssodoHerbivores.Thisbegsthequestionabout whetherresilienceisapropertyofthesystemorthespecies.Thelandscapehasreturnedtoitsoriginalform,butanimalshavevanished.
4.Discussion
Thesimulationsdemonstratethatsystembehaviourisdetermined by:
• Therelativemaximum(i.e.unconstrained)populationgrowthrates ofthedependentagentanditsresource,incombinationwith:
• thedependentagent’sresponsetoextremeresourcescarcity,i.e. theresourcelevelatwhichtheagent’spopulationgrowthrate becomesnegativethroughincreasedmortalityand/orreducedfertility – referredtohereas ‘growthratezero’ .
Therearedistinctcategoriesofagentbehaviourobservedinthe simulations(see Fig.12 and Table1).
Thedeeplimitcyclesevidentintheexperimentswhereagentand resourcepopulationsdeclinetonearzero,occurnearthe ‘growthrate zero’ boundarybetweenatransitiontoequilibriumandovershootand collapse,andareinfluencedbytheunconstrainedgrowthrateofthe dependentagent.
Forsystemsexhibitingimmediatedeclineoratransitiontoequilibrium,theunconstrainedgrowthratesofthedependentagentaffectthe

Fig.18. PostequilibriumHerbivoreinjection.

Fig.19. GradualsmallreductioninSoilMoisture.

Fig.20. GraduallargerreductioninSoilMoisture.
ratesofpopulationgrowth/declineandoscillatorybehaviour(which occursathigherrelativegrowthrates)butnottheequilibriummagnitudeofthestocks.
Ihavereferredtotheobservedlimitcyclesas ‘deep’ astheyarenot (stable)Rosenzweig‐Macarthurtypeellipticalcyclesinwhichpopulationlevelsremainwellabovezero(Fig.21),oroscillationsthatarise
Table1 Summaryofsimulationresults.

Fig.21. Phaseplotofstableellipticalcycles(modelled).
duetocyclicalvariationinresourceavailability.Inthesedeepcycles, agentsandresourcestocksdeclinetonearzero(Fig.22).
Continuousmodels(suchasthatdescribedhere)thatcanproduce verysmallpopulationlevelsaresometimesreferredtoashavingthe “atto‐foxproblem”,atermthatderivesfromcriticismby Mollison (1991) ofamodelby MurrayandSeward(1992) offoxrabiesinwhich foxesdeclineto10 18 (atto‐)foxespersquarekilometre.Inthereal worldsuchdeepcycleswillinmanycaseslikelyleadtoextinction. Nevertheless,thesedeeplimitcyclesseemtobeconsistentwiththe cyclesidentifiedintheHare‐lynxdata(see Fig.23),theBlasius (2020)data(see Fig.24)andthosedescribedbyHollinginthespruce budwormexample.
Theseoccurwhenthedeclineofthedependentagentinresponseto criticalresourcescarcityissofastthatpopulationlevelsapproachzero beforetheresourcestockiscompletelydepleted(compare Figs.11and 13a).Accordingly,bothstockseventuallyrecoverandthecycleis repeated.Thesecyclesarealsoreferredtoas ‘relaxationoscillations’ thatoccurwhenthegrowthratesofthedependentagentandresource varysignificantlyinsocalledslow‐fastsystems(Saha,Pal,&Banerjee, 2021).Incontrast,whentheresponsetoscarcityis ‘slower’,the resourcestocksdeclinetozero first,leadingtoovershootandcollapse, ensuringtheextinctionofbothspecies(see Figs.11and16). Rosenzweig‐Macarthurtypemodelscanproduceasimilartypeoflimit cyclebutinthatcaseitisassociatedwiththeresourcesavailableto preyathighlevelsofcarryingcapacity(“nutrientenrichments”)rather thantheirresponsetopredation.
GrowthratezeroRelativeunconstrained populationgrowthrates SystembehaviourDescriptor
If ‘growthratezero’ occursabovearesourcelevelwhichisinsufficientto supportapositivegrowthratefromtheoutsetoftheagent’semergence
Influencesrateofdecline only Exponentialdecayofinitialdependentagent populationtozero Immediate decline If ‘growthratezero’ occursbelowaresourcelevelatwhichcontinuingagent populationgrowthleadstoseveredepletionoftheresourcestock.
If ‘growthratezero’ occursataresourcelevelbetweentheupperthresholdand alowerthreshold.
LowDependentagentandresourcepopulations declinetozero Overshoot andcollapse HighDependentagentandresourcedeclinetonearzeroandslowlyrecover Deeplimit cycles
LowSmoothtransitiontoastableequilibriumfor dependentagentandresourcepopulations Transitionto Equilibrium HighDampedoscillationstoastableequilibriumfor dependentagentandresourcespopulations


Asnotedabove,theempiricaldataseemstosupporttheexistence ofdeeplimitcycles(relaxationoscillations)butitisinterestingto questionwhetherthereisempiricalevidenceofstableellipticallimit cyclessuchasthoseproducedbyRosenzweig‐Macarthurtypemodels. Themodelpresentedheredoesnotproduceoscillationsofthatkind, norhavetheybeenidentifiedintheliteraturereviewedforthisstudy.
Allreal‐worldsystemsmimictheessentialhierarchicalresource dependencydescribedinthesesimpleexperiments,althoughwith muchmorecomplexity,includingcompetitionbetweenspeciesateach level,omnivoresoperatingatboththeHerbivoreandPredatorlevel, andwithfungi,bacteria,insectsandbirdsaffectingalllevelstogether withirregularallochthonousorautochthonousresourcesubsidies.
Despitethesimplifications,theexperimentsreplicatethereal‐world behaviourobservedinnatureincluding:smoothtransitionstoequilibrium,dampedoscillations,overshootandcollapse,anddeeplimit cyclesand(Begon,2009;C.S. Holling,1973;Klein,1968).Exploding

oscillationsorunconstrainedexponentialgrowthwhicharefoundin theoriginalLotkaVolteramodelareneitherevidentinnatureorin theseexperiments.Othermoresophisticatedmodelsderivedfrom LotkaVolterraeliminatethoseproblemsbutretainsomebehaviours thatarenotreproducedinthecompletehierarchicalmodelpresented here(e.g.stableellipticallimitcycles).
Itispositedherethatthereasonforplausiblebehaviouristhe inclusionofabiotic flows(inthiscasewater)atthebaseofallecosystems.Thismeanstheregenerationofthisabioticresourceisregulated byabalancingfeedbackloop,whereasinmostpredator–preymodels, regenerationofthepreyistheproductofthestockitselfanditsgrowth fraction,whichisareinforcingfeedbackloop.Thissuggeststhatthe modellingofbioticsystemswithouttheirunderlyingdependencyon abioticresourcessuchasair,water,nutrients(minerals)andsolarradiationmaybeinsufficienttoexplainobservablebehaviourinthe field. Thisisnottosaythatothermodelscouldnotbeconfiguredinaway thatgivesrisetosimilaroutcomes.
Studiesonresiliencesuchasthoseconductedin fisheriesmanagement(Paletal.,2020)mightbenefitfromamoreexplicitinclusionof specieshierarchysuchasinthemodelpresentedhere.
5.Modelvalidation
Theprocessofmodelvalidationistobuildconfidenceinitsability toachieveitsparticularpurpose(SchwaningerandGroesser,2020; Senge&Forrester,1980).Themodelpresentedherecanbethought ofasin ‘insight’ model,ora ‘causal‐descriptive’ model(Barlas, 1996).Unlikemanysystemdynamicsmodelsitisnotaimedatidentifyingthe “effectivenessofalternativepolicies”;itspurposeisto explorethesetofbehavioursthatemergefromaplausiblegeneric modelstructure.Itdoesnotseektoreplicatetheexactdynamicbehaviourofaspecifichierarchicalfoodchain,rathertodepicttheconditionsthatgiverisetothepersistenceorotherwiseofeachlevelinthe chain.Accordingly,ithasnotbeencalibratedagainstempiricaldata foranyparticularsetofspecies,norcontainsadditionalstructureto representthemyriadofinterdependenciesthatexistinrealecological systems,mostobviouslycompetitionateachtrophiclevel.However, thegeneralbehaviourproducedbythemodelcanbetestedagainst
theempiricalevidence,includinginrespectofpredator‐ preydynamicsandtheexistenceoflimitcycles.Establishingitsconsistencywith thatevidenceistheprimepurposeofthestudy,andcitationstotherelevantliteratureareincludedinthetextofthearticletosupportits achievementofthataim.Becausethemodeldoesnotseektosimulate specificreal‐worldspeciesinteractions,questionsofboundaryadequacy(i.e.doesthemodelcontainsufficientstructuretosatisfyitspurpose)areprimarilysatisfiedbyproducingplausiblebehaviours,i.e. thoseobservableinnature.
Thekeytothemodelbehaviouristheparameterisationofthe inflowsandoutflowstothestocks,structuredasconstantsmodified dynamicallythroughgraphicalfunctions.Withthesequentialaddition ofeachlevelofthehierarchy,theparametersandgraphicalfunctions wereiterativelyvariedtoevaluatethe “window” withinwhichthe dependentagentcouldestablish,andextremevaluetestingusedto explorethefullrangeofsystembehavioursfollowingestablishment – effectivelyrepresentingbehavioursensitivitytestingateachstage ofmodeldevelopment.Themodeldoesnotpurporttoreplicatethe actualgrowthratesoftheindividualstocks,ratheritestablishesthe relativeratesbetweeneachagentthatgovernpersistenceorotherwise. Thus,thedevelopmentofthemodelincorporatedbothparameterverificationandextremevaluetesting,whilebeingdimensionally consistent.
6.Conclusions
Asimplemodelofafour‐levelecosystemprovidesinsightsinto plausiblesystembehaviour(i.e.thatwhichisobservableinthereal world).Itisarguedherethatthisisduetothefoundingofthebiotic resourcesonanabiotic flow,inthiscasewater,whichcreatesabalancingfeedbackloopatthelowestsystemlevelandlimitsthebehaviour ofhighertrophiclevelstoasmallnumberofoutcomes,namelyequilibriumachievedinasmoothtransitionorwithtightlydampedoscillations,overshootbehaviourleadingtocollapse,ordeeplimitcycles. Asalllifeonearthisfoundedonsuch flows,thissuggeststhatany ecosystemmodelsthatneglectsuch flowsmayinsomecasesproduce unrealisticsystembehaviour.
Second,thatstablelimitcyclebehaviourcanbeproducedbysystemstructurealone,inthecircumstanceswhereovershootdoesnot quitecreatecollapse,butratherleadstoverysmallstocklevels andslowrecovery.Thesecyclesmayinitiallyexpandinamplitude butinevitablysettleintostablelimitcycles.Holling’soriginal1973 papersuggestedthatthebudworm/balsam firinteractionswere anexampleof ‘ adistinctdomainofattractiondeterminedbytheinteractionbetweenbudwormanditsassociatednaturalenemies,whichisperiodicallyexceededthroughthechanceconsequenceofclimaticconditions’ . Whilethatinterpretationisnotdisprovenbytheseexperiments,they doillustratethatthisbehaviourcanbecreatedbythesamesystem structurethatproducesotherobservablebehaviourpatternswithout randomvariations.
Dynamicequilibriumconditionsareobservableinnature,andso arethedampedoscillationsthatoccurinresponsetonaturalvariationanddisturbances.Aresuchsystemstherefore ‘sustainable’?It ismorehelpfultoconsiderwhethertheoutflowsfromdependent stocksaresustainable,i.e.whethernetconsumptionofthedependent agent’sresourcecanbesustainedovertime.Thisdependsbothon thenetdepletionrateoftheresource(i.e.populationlevelsandconsumptionratesofdependentagents),andthestabilityoftheinflows (regenerationrates)toalltheresourcesatlowertrophiclevels, includingtheabioticresourcesthatsupportalllifeonearth.Accordingly,sustainabilityisatimelimitedconcept.Nothingstaysthesame forever,climateconditionschange,systemsre‐configureonthe appearanceofnewagents,speciesbecomeextinctthroughdisease, andsoon.
Hollingdefinedresilienceas ‘..thepersistenceofsystemsandoftheir abilitytoabsorbchangeanddisturbanceandstillmaintainthesamerelationshipsbetweenpopulationsorstatevariables’ .
Thisdefinitionimpliesasystemindynamicequilibriumpriortoa disturbance;inthecaseofthebudworm ‘thechanceconsequenceofclimaticconditions’.However,astheseexperimentsshow,theabilityof aspecieswithinanecosystemto ‘persist’ ismerelyafunctionofthe scaleandnatureofthedisturbance.Ifthedisturbanceistothefundamentalabiotic flowsorlowertrophiclevels,theimpactonthe higherlevelsislarger.Suchdisturbancesmayleadtotheextinction ofoneormorespeciesinanecosystemwhileleavingothersinplace, albeitinareconfiguredequilibrium.Suchachangewouldnotmeet Holling’sresiliencetestasthe ‘samerelationshipsbetweenpopulations’ wouldnolongerexist.However,laterpapersbyresiliencetheorists haveproposedadifferencebetween ‘specificresilience’ and ‘general resilience’.InsomewhatofasummaryofresilienceandrelatedconceptsFolkeetal(2010)describetheformeras ‘resilienceofsomeparticularpartofasystem,relatedtoaparticularcontrolvariable,tooneor moreidentifiedkindsofshocks’ andthelatteras ‘theresilienceofany andallpartsofasystemtoallkindsofshocks,includingnovelones.’ This representssomewhatofaqualificationoftheoriginalHolling definition.
Theresultspresentedherealsoquestionwhetherresilienceisa propertyofa ‘system’ oraspecificspecieswithinasystem.Itcould besaidthat(forexample)plantsareresilienttovirtuallyanyshock (priortotheappearanceofHerbivores)iftheyareunderpinnedbya constant flowofSoilMoisture.However,theresilienceoftheanimals atahighertrophiclevelismorelimited.
Thefocusoftheresiliencecommunityisonhumanintervention intendedtoretainthepersistenceofagivensystem(includingso calledsocio‐ecologicalsystems3).Basedonthe findingssetouthere, interveninginsystemssubjecttosomespecificshock(i.e.specificresilience)wouldseemtobethemorefruitfulendeavour.Asnotedelsewhere (Willliam Grace&Pope,2015)nosystemislikelytowithstandadirect asteroidhitorcatastrophicclimatechange.Therefore,whatisreferred toasgeneralresilienceisreallyjustspecificresiliencetoawiderange ofplausibledisturbances.
ItisoverthirtyyearssincetheBrundtlandreport “OurCommon Future” (WorldCommissiononEnvironmentandDevelopment, 1987)producedtheoft‐quotedexplanationofsustainabledevelopment: 'developmentthatmeetstheneedsofthepresentwithoutcompromisingtheabilityoffuturegenerationstomeettheirownneeds'.Ifour primeinterestisthe ‘persistence’ ofhumanitywithanaspirationto meettheBrundtlandobjective(i.e.theachievementofadecentstandardoflivingforall),thentheglobalsocio‐ecologicalsystemmust firstachieveastabledynamicequilibrium.Exponentialincreasesin populationandtheincreasinglyunsustainabledepletionofrenewable andnon‐renewableresourcesindicatesthathumanityisnowhere nearsuchanequilibrium,asillustratedbytheLimitstoGrowthstudies firstpublishedin1972(Meadows,Meadows,Randers,&Behrens, 1972)andisnowinastateofovershootasmorerecentwork explains(William Grace,2015; Meadows,Meadows,&Randers, 2004).Sustainabilitycanbethoughtofasaquestforsuchanequilibrium.Resilienceofthehuman(orany)speciescanbethought ofastheabilitytorecoverfromshocksanddisturbancesonceequilibriumhasbeenachieved.
Shocksanddisturbancestothelowertrophiclevelswillhavemore impactonhumans(e.g.thelossofpollinationservices(Kevan&Viana, 2003)),thanthosetohighertrophiclevels.However,shockstothe abioticresourcesthatunderpinlifeonearthwillhaveevenmore impact,astheythreatentheentiredependentbioticsystem.Changing
3 Thisdescriptorisopentotheaccusationoftautologyashumansareobviouslypartof ecologicalsystems.
theradiationbalanceintheearth’satmosphereisjustsuchadisturbance,makingclimatechangeourmosturgentchallenge,albeitnot theonlyone.
DeclarationofCompetingInterest
Theauthorsdeclarethattheyhavenoknowncompeting financial interestsorpersonalrelationshipsthatcouldhaveappearedtoinfluencetheworkreportedinthispaper.
AppendixA.-modelparameterisation
Graphicalfunctions.
fSR =GF1(SM/SMi)
Withconsistentrainfallandwithoutplants,SoilMoisturewill varythroughtheyearbutreachanequilibriumstateonan averageannualbasis.Itisassumedinthismodelforsimplicity thatthisissaturation(fSR =0)sothemodelcommencesin equilibrium.AsSoilMoisturedeclinesbelowathreshold,inflow increasestoamaximumvalueof RSM. Modelledasalinear functionbuttestingwithnon‐linearityshowminorimpacton behaviour
fSC =GF2(SM/SMi)
Conventionalstockcontrol.Soilmoistureoutflowislinearly constrainedasstocklevelfalls.Non‐linearityaffectsthe equilibriumlevelofPlantMass.ThisisbecauseconcaveGF2 constrainsSoilMoistureloss – keepingSoilMoisturestock higher,andhenceplantregenhigherforlonger.ConvexGF2 causestheopposite.Essentialmodelbehaviouristhough unchanged.
fPR =GF3(SM/SMi)
Plantmassregenerationrateisconstrainedonce SM/SMi falls below0.5.Equilibriumobtainedwhen fSR =0at SM/ SMi =0.25.Regenerationratebecomesnegativeatlowerlevels of SM/SMi. Effectofnon‐linearity:convexGF3slowsthe transitiontoequilibriumasrestrictionon PM inflowoccurs earlier.Concaveistheopposite.Essentialmodelbehaviouris thoughunchanged.
fPC =GF4(PM/PMi)
AsforGF2
fHR =GF5(PM/PMi)Thedomaindeterminestheenvelopeof persistenceofHerbivores.IfthereisinsufficientPlantMassto supportapositiveHerbivoregenerationratethentheHerbivore influximmediatelydeclinestozero.Attheotherextreme,ifthe transitionfrompositivetonegativeregenerationratesoccursat alowerboundthreshold,overshootandcollapse occurs.AsforGF3,non‐linearityhasnosignificantimpacton essentialbehaviour(assumingzeropointismaintained)
fHC =GF6(H/Hi)
AsforGF2andGF4
FPr =GF7(H/Hi)AsforGF5.Ifthetransitionfrompositiveto negativeregenerationratesoccursatalowerboundthreshold, overshootandcollapse occurs.AsforGF3and5,non‐linearityhasnosignificantimpact onessentialbehaviour(assumingzeropointismaintained)
AppendixB.Modelequations
Themodelbehaviourisdependentonthegraphicalfunctionsand constants,whichweresettoensurethebioticagents(PlantMass,HerbivoresandPredators)couldreachastableequilibriumaftertheir sequentialappearanceinthemodel.
Thekeyvariablesthataffectbehaviouraretheconstantsthatcontrolstockinflow(regeneration)rates,i.e. RSM,RPM,RH,andRPR.Amultiplierforeachoftheseconstantswasincludedinthemodelto facilitatesensitivityandextremevaluetestingofthemodel.The resultsofthesetestsaredescribedinthearticletext.
Thefollowingsetsouttheequationsforthefull4levelmodel.This shouldbereadinconjunctionofthe figuresandequationsinthetext. Equationsaresetoutintheorderthatthemodelwasconstructed,i.e.
• Plantmassandsoilmoistureinteractions
• AdditionalinteractionsfollowingintroductionofHerbivores
• AdditionalinteractionsfollowingintroductionofPredators
ThefullVensimmodelisavailableonrequest.
Modelsettings
INITIALTIME=0
Units:Year
Theinitialtimeforthesimulation.
FINALTIME=200
Units:Year
The finaltimeforthesimulation.
TIMESTEP=0.03125
Units:Year[0,?]
Thetimestepforthesimulation.
Soilmoistureequations
Soilmoisture=INTEG(SMinflow‐SMoutflow,Initialsoil moisture)
Units:SMperc
Initialsoilmoisture=200000
Units:SMperc
SMinflow= “MaxSMinflow(Rsm)”*”fSR(SM)”*SMMultiplier
Units:SMperc/Year
“MaxSMinflow(Rsm)”=50,000
Units:SMperc/Year
SMMultiplier=1
Units:Dmnl
[NotethisvariablewasusedtovaryRsmforsensitivitytesting ofmodel]
“fSR(SM)” =
“GF1SM‐inflow”(Soilmoisture/Initialsoilmoisture)
Units:Dmnl
“GF1SM‐inflow”([(0,0)‐(1,1)],(0,1),(0.5,1),(1,0))
Units:Dmnl
SMoutflow=max(Plantmass,0)*”Pcons(Csm)”*”fSC(SM)”
Units:SMperc/Year
(continuedonnextpage)
Soilmoistureequations (continued)
Soilmoisture=INTEG(SMinflow‐SMoutflow,Initialsoil moisture)
Units:SMperc
“Pcons(Csm)”=10
Units:SMperc/(Year*PMtonnes)
“fSC(SM)” = “GF2SM‐outflow”(Soilmoisture/Initialsoil moisture)
Units:Dmnl
“GF2SM‐outflow”([(0,0)‐(1,1)],(0,0),(1,1))
Units:Dmnl
Plantmassequations
Plantmass=INTEG(PMinflow‐PMoutflow,Initialplantmass)
Units:PMtonnes
Initialplantmass=25
Units:PMtonnes
PMinflow=Plantmass*“PM‐regen‐fr(Rpm)”*“fPR(SM)”*PM
Multiplier
Units:PMtonnes/Year
“PM‐regen‐fr(Rpm)”=0.2
Units:1/Year
PMMultiplier=1
Units:Dmnl
[NotethisvariablewasusedtovaryRpmforsensitivitytesting ofmodel]
“fPR(SM)” = ”GF3PM‐inflow”(Soilmoisture/Initialsoil moisture)
Units:Dmnl
“GF3PM‐inflow”([(0,‐1)‐(1,1)],(0,‐1),(0.5,1),(1,1))
Units:Dmnl
PMoutflow=Herbivores*“Hcons(Cpm)”*“fPC(PM)”
Units:PMtonnes/Year
“Hcons(Cpm)”=4.5
Units:PMtonnes/Herbivores/Year
“fPC(PM)” = “GF4PM‐outflow”(zidz(Plantmass,Initialplant mass))
Units:Dmnl
“GF4PM‐outflow”([(0,0)‐(1,1)],(0,0),(1,1),(1000,1))
Units:Dmnl
Herbivoreequations
Herbivores=INTEG(Hinflow+InitialH Houtflow,0)
Units:Herbivores
InitialH=0+STEP(“H‐injection”/“1year”,50)‐STEP(“H‐inje ction”/“1year”,51)+STEP(“H‐spike” /“1year”,300)‐STEP(“ H‐spike” /“1year”,301)
Units:Herbivores/Year [NotethisequationwasusedtointroduceHerbivorestothe modelandt50andthentointroduceaspikeforresilience testingatt300]
“H‐injection”=10
Units:Herbivores
“H‐spike”=10
Units:Herbivores
Hinflow=max(Herbivores,0)*“H‐regen‐fr(Rh)”*“fHR(PM)”*H
Herbivoreequations (continued)
Herbivores=INTEG(Hinflow+InitialH Houtflow,0)
Units:Herbivores
Multiplier
Units:Herbivores/Year
“H‐regen‐fr(Rh)”=0.075
Units:1/Year
HMultiplier=1
Units:1
[NotethisvariablewasusedtovaryRhforsensitivitytesting ofmodel]
“fHR(PM)” = “GF5H‐inflow ‐ smooth”(zidz(Plantmass,Initial plantmass))
Units:Dmnl
“GF5H‐inflow ‐ O&C”( [(0,‐2)‐(2000,1)],(0,‐2),(100,‐0.85),(300,0),(630,0.55),(870,0. 8),(1600,1))
Units:Dmnl
[Notethisversionofthefunctionproducestheherbivore overshootandcollapsemodeofthemodel]
“GF5H‐inflow ‐ smooth”([(0,‐2)‐(3200,1)],(0,‐2),(500,0),(750,1 ),(1600,1))
Units:Dmnl
[Notethisversionofthefunctionproducestheherbivore smoothordampedoscillatorymodeofthemodel]
Houtflow= “Prcons(Ch)”*“fHC(H)”*Predators
Units:Herbivores/Year
“Prcons(Ch)”=0.25
Units:Herbivores/Predators/Year
“fHC(H)”=GF6Houtflow(zidz(Herbivores,“H‐injection”))
Units:Dmnl
GF6Houtflow([(0,0)‐(1,1)],(0,0),(1,1),(100,1))
Units:Dmnl
Predatorequations
Predators=INTEG(InitialPr+Prinflow ‐ Proutflow,0)
Units:Predators
InitialPr=0+STEP(“Pr‐injection”/“1year”,200)‐STEP(“Pr‐injection”/“1year”,201)
Units:Predators/Year
[NotethisequationwasusedtointroducePredatorstothe modelatt200]
“1year”=1
Units:Year
“Pr‐injection”=10
Units:Predators
Prinflow=Predators*“Pr‐regen‐fr(Rpr)”*“fPrR(H)”*Pr
multiplier
Units:Predators/Year
“Pr‐regen‐fr(Rpr)”=0.03
Units:1/Year
Prmultiplier=1{6}
Units:Dmnl
[NotethisvariablewasusedtovaryRprforsensitivitytesting ofmodel]
“fPrR(H)” = “GF7Pr‐inflow‐smooth”(zidz(Herbivores,“H‐injec tion”))
Units:Dmnl
“GF7Pr‐inflowO&C”([(0,‐2)‐(100,1)],(0,‐2),(15,0),(40,1),(100,
Predatorequations (continued)
Predators=INTEG(InitialPr+Prinflow ‐ Proutflow,0)
Units:Predators 1))
Units:Dmnl
[Notethisversionofthefunctionproducesthepredator overshootandcollapsemodeofthemodel]
“GF7Pr‐inflow‐smooth”([(0,‐2)‐(100,1)],(0,‐2),(25,0),(40,1),(10 0,1))
Units:Dmnl
[Notethisversionofthefunctionproducesthepredator smoothordampedoscillatorymodeofthemodel]
Proutflow=0
Units:Predators/Year
References
Barlas,Y.,1996.Formalaspectsofmodelvalidityandvalidationinsystemdynamics. SystemDynamicsReview.J.Syst.Dynam.Soc.12(3),183–210 Begon,M.,2009.EcologyFromIndividualstoEcosystems.Wiley Berkes,F.,&Folke,C.(1998).Linkingsocialandecologicalsystemsforresilienceand sustainability. Linkingsocialandecologicalsystems:managementpracticesandsocial mechanismsforbuildingresilience,1(4)..
Blasius,B.,Rudolf,L.,Weithoff,G.,Gaedke,U.,Fussmann,G.F.,2020.Long-termcyclic persistenceinanexperimentalpredator–preysystem.Nature(London)577(7789), 226–230. https://doi.org/10.1038/s41586-019-1857-0 . Braun,W.(2002).Thesystemarchetypes. TheSystemsModelingWorkbook (Vol.2002, pp.27)..
Carl,F.,Stephen,R.C.,Brian,W.,Marten,S.,Terry,C.,Johan,R.,2010.Resilience Thinking:IntegratingResilience,AdaptabilityandTransformability.Ecol.Soc.15 (4),20. https://doi.org/10.5751/es-03610-150420
Edelstein-Keshet,L.,1988.Mathematicalmodelsinbiology.RandomHouse,NewYork Elton,C.,Nicholson,M.,1942.Theten-yearcycleinnumbersofthelynxinCanada.J. AnimalEcol.11(2),215
Fiksel,J.,2006.Sustainabilityandresilience:towardasystemsapproach.Sustainab.: Sci.,Pract.Policy2(2)
Gilg,O.,Hanski,I.,Sittler,B.,2003.Cyclicdynamicsinasimplevertebratepredatorpreycommunity.Science302(5646),866–868
Grace,W.,&Pope,J.(2015).Asystemsapproachtosustainabilityassessment.In Morrison-SaundersA,PopeJ,&B.A(Eds.), HandbookofSustainabilityAssessment: EdwardElgar..
Grace,W.(2015).Simulatingsustainability:aresourcesperspective.J.Nat.Resour.Pol. Res.,191-220.10.1080/19390459.2015.1050202.
Holling,C.S.,1973.ResilienceandStabilityofEcologicalSystems.Annu.Rev.Ecol.Syst. 4(1),1–23
Holling,C.,Walker,B.,Carpenter,S.,Kinzig,A.,2004.Resilience,adaptabilityand transformabilityinsocial-ecologicalsystems.Ecol.Soc.9(2),n/a. https://doi.org/ 10.5751/es-00650-090205
Kar,T.K.,Pal,D.,Ghosh,B.,2019.Managingyieldandresilienceinaharvestedtritrophicfoodchainmodel.J.Theor.Biol.469,35–46. https://doi.org/10.1016/j. jtbi.2019.02.006
Kevan,P.G.,Viana,B.F.,2003.Theglobaldeclineofpollinationservices.Biodiversity (Nepean)4(4),3–8. https://doi.org/10.1080/14888386.2003.9712703
Klein,D.R.,1968.TheIntroduction,Increase,andCrashofReindeeronSt.Matthew Island.J.Wildl.Manag.32(2),350–367. https://doi.org/10.2307/3798981
Lau,D.C.P.,Sundh,I.,Vrede,T.,Pickova,J.,Goedkoop,W.,2014.Autochthonous resourcesarethemaindriverofconsumerproductionindystrophicboreallakes. Ecology(Durham)95(6),1506–1519. https://doi.org/10.1890/13-1141.1
Leroux,S.J.,Loreau,M.,2008.Subsidyhypothesisandstrengthoftrophiccascades acrossecosystems.Ecol.Lett.11(11),1147–1156. https://doi.org/10.1111/j.14610248.2008.01235.x
Lotka,A.J.,1910.Contributiontothetheoryofperiodicreactions.J.Phys.Chem.14 (3),271–274 Ludwig,D.,Walker,B.,&Holling,C.S.(1997).Sustainability,Stability,andResilience. Ecol.Soc., 1(1C7-7).10.5751/es-00012-010107.. Lundgren,J.,2020.TheGrandConceptsofEnvironmentalStudiesBoundaryobjects betweendisciplinesandpolicymakers.J.Environ.Stud.Sci.. https://doi.org/ 10.1007/s13412-020-00585-x
MacLulich,D.A.,1937.FluctuationsintheNumberoftheVaryingHare(Lepus americanus).UniversityofTorontoPress.
Meadows,D.H.,Meadows,D.L.,Randers,J.,Behrens,W.W.I.,1972.TheLimitsto Growth.UniverseBooks,NewYork Meadows,D.H.,Meadows,D.L.,&Randers,J.(2004). Limitstogrowththe30year update.WhiteRiverJunction,VT:ChelseaGreenPublishingCompany.. Mollison,D.,1991.Dependenceofepidemicandpopulationvelocitiesonbasic parameters.Math.Biosci.107(2),255–287. https://doi.org/10.1016/0025-5564 (91)90009-8
Murray,J.D.,Seward,W.L.,1992.Onthespatialspreadofrabiesamongfoxeswith immunity.J.Theor.Biol.156(3),327–348. https://doi.org/10.1016/S0022-5193 (05)80679-4
Nevai,A.L.,VanGorder,R.A.,2012.Effectofresourcesubsidiesonpredator-prey populationdynamics:amathematicalmodel.J.Biol.Dyn.6(2),891–922. https:// doi.org/10.1080/17513758.2012.677485
Pal,D.,Kar,T.K.,Yamauchi,A.,&Ghosh,B.(2020).Balancingmaximumsustainable yieldandecologicalresilienceinanexploitedtwo-predatorone-preysystem. BioSystems,187,104064-104064.10.1016/j.biosystems.2019.104064..
Randers,J.,1997.ElementsoftheSystemDynamicsMethod.J.Operat.Res.Soc.48 (11),1144–1145. https://doi.org/10.1057/palgrave.jors.2600456
Redman,C.,2014.Shouldsustainabilityandresiliencebecombinedorremaindistinct pursuits?.Ecol.Soc.19(2),1. https://doi.org/10.5751/ES-06390-190237
Rosenzweig,M.L.,1971.ParadoxofEnrichment:DestabilizationofExploitation EcosystemsinEcologicalTime.Sci.(Am.Associat.Adv.Sci.)171(3969), 385–387. https://doi.org/10.1126/science.171.3969.385
Rosenzweig,M.L.,MacArthur,R.H.,1963.GraphicalRepresentationandStability ConditionsofPredator-PreyInteractions.Am.Nat.97(895),209–223. https://doi. org/10.1086/282272
Saha,T.,Pal,P.J.,Banerjee,M.,2021.Relaxationoscillationandcanardexplosionina slow–fastpredator–preymodelwithBeddington–DeAngelisfunctionalresponse. NonlinearDyn.103(1),1195–1217. https://doi.org/10.1007/s11071-020-061401
Schwaninger,M.,&Grösser,S.(2020).Systemdynamicsmodeling:validationfor qualityassurance. SystemDynamics:TheoryandApplications,119-138.. Senge,P.M.,&Forrester,J.W.(1980).Testsforbuildingconfidenceinsystemdynamics models. Systemdynamics,TIMSstudiesinmanagementsciences,14,209-228.. Stenseth,N.C.,Falck,W.,Bjørnstad,O.N.,Krebs,C.J.,1997.Populationregulationin snowshoehareandCanadianlynx:asymmetricfoodwebconfigurationsbetween hareandlynx.Proc.Natl.Acad.Sci.94(10),5147–5152
Swart,J.,1990.Asystemdynamicsapproachtopredator-preymodeling.System DynamicsRev.6(1),94–99 Toro,M.,Aracil,J.,1988.Qualitativeanalysisofsystemdynamicsecologicalmodels. SystemDynamicsRev.4(1–2),56–80 Tromeur,E.,Loeuille,N.,2017.Balancingyieldwithresilienceandconservation objectivesinharvestedpredator–preycommunities.Oikos126(12),1780–1789. https://doi.org/10.1111/oik.03985 WorldCommissiononEnvironmentandDevelopment.(1987). OurCommonFuture RetrievedfromOxfordUniversityPress..