inventing innovations undercover research on a mission projects collaborating platform learning experience
© Australian Urban Design Research Centre AUDRC 2015
Julian Bolleter
inventing innovations undercover research on a mission projects collaborating platform learning experience
© Australian Urban Design Research Centre AUDRC 2015
Julian BolleterAUDRC 1402
Australian Urban Design Research Centre AUDRC
Faculty of Architecture, Landscape and Visual Arts ALVA
University of Western Australia UWA
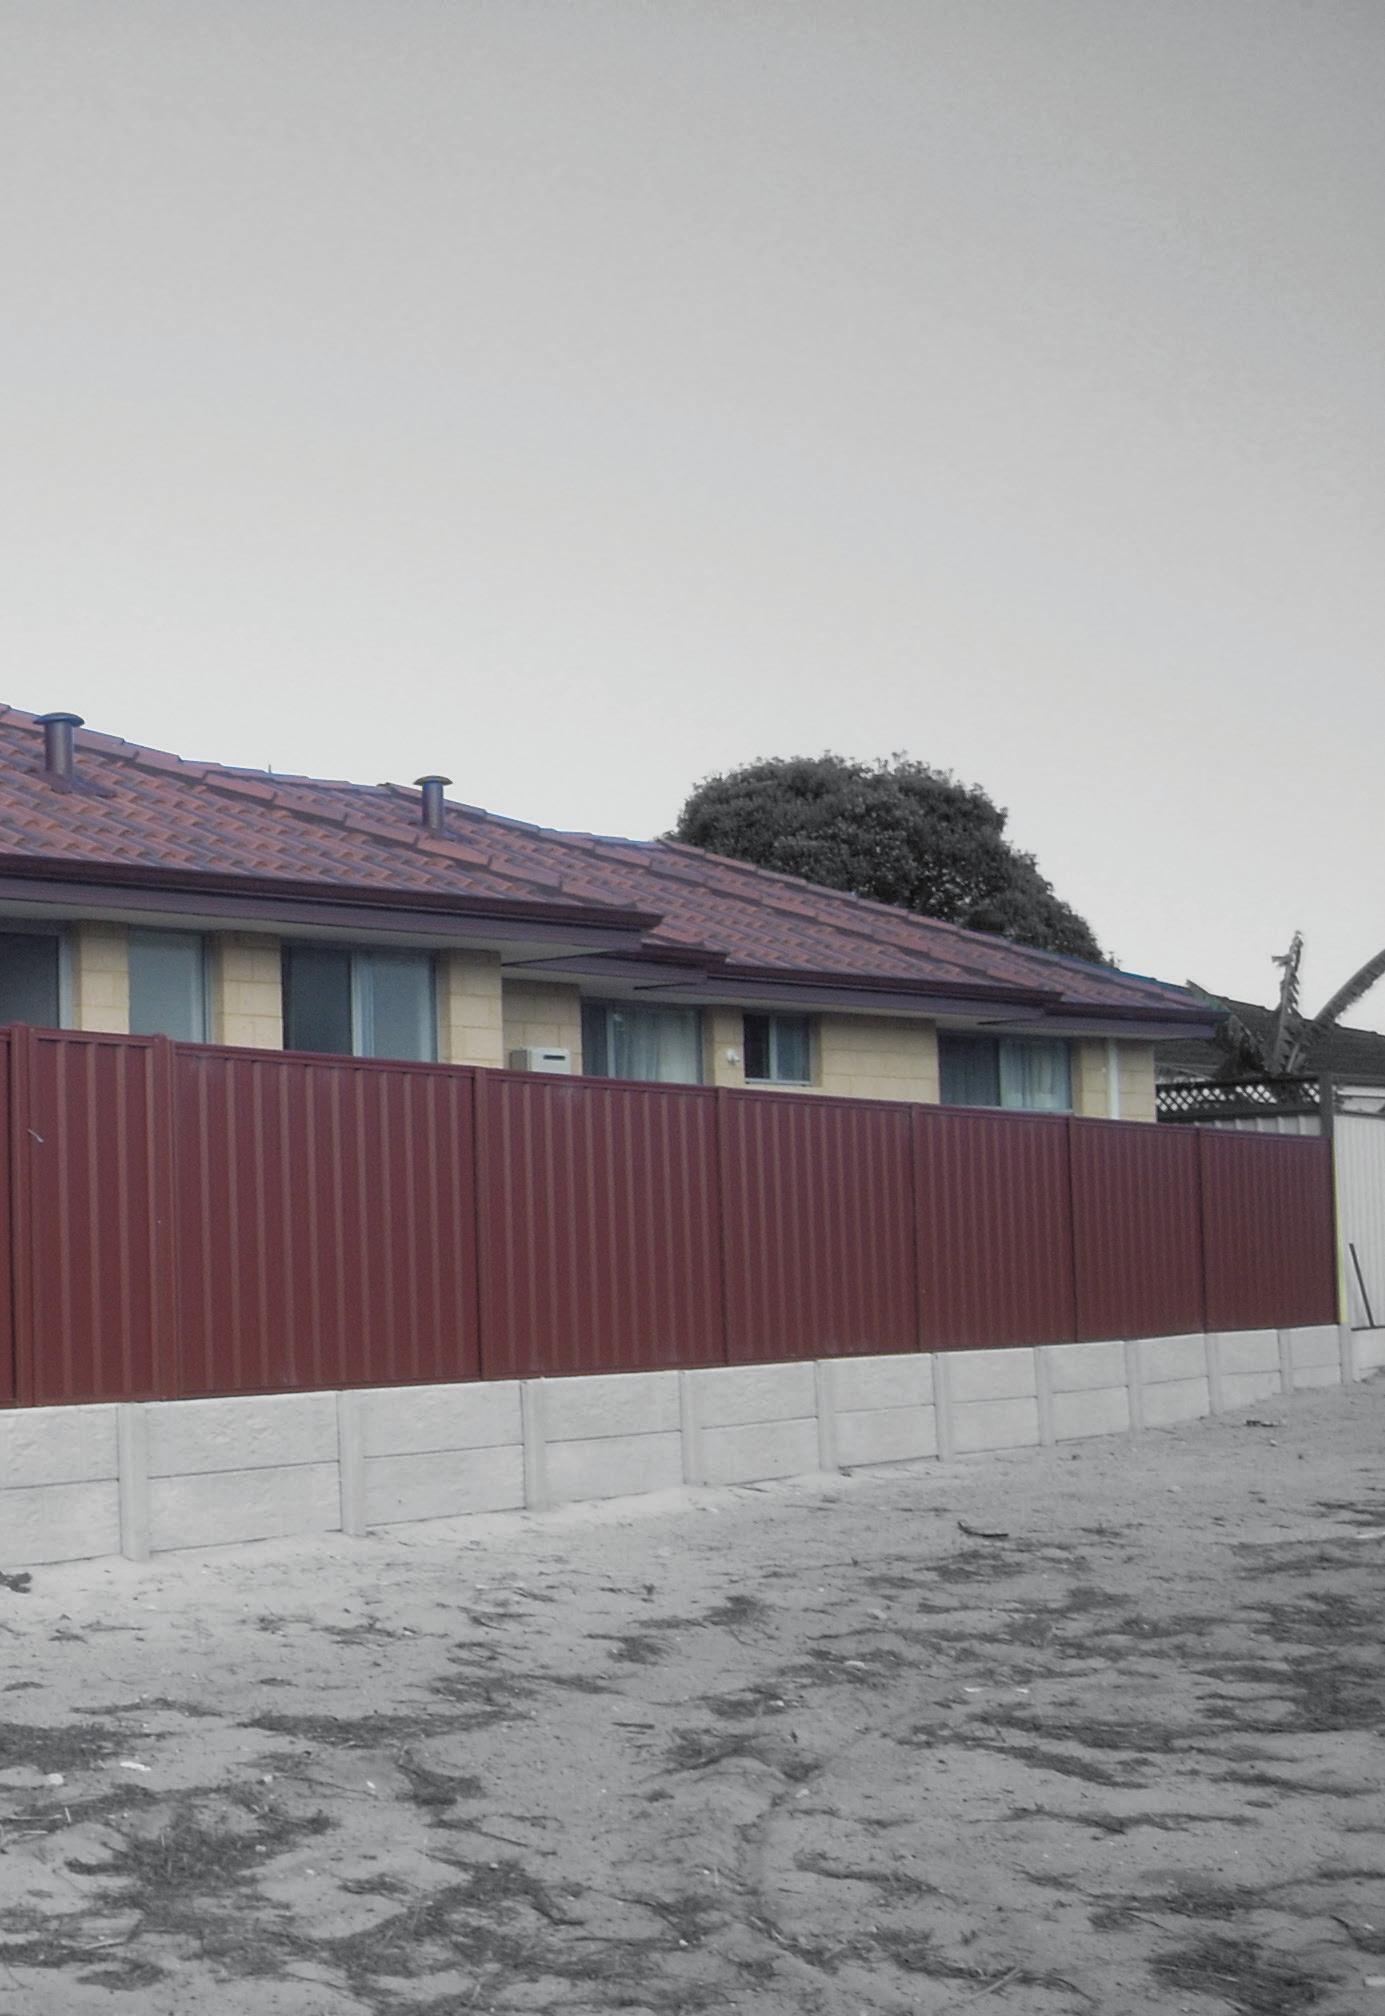
Despite the well-known issues of outer suburban growth, Perth has Australia’s most modest target for infill development – which it regularly fails to achieve.
In the early 20th century, the well regarded American planning campaigner Frederick Howe extolled the virtues of our suburban cities: ‘The great cities of Australia are spread out into the suburbs in a splendid way. For miles about are broad roads with small houses, gardens, and an opportunity for touch with the freer, sweeter life which the country offers.’1 In Howe’s way of thinking Perth’s suburbs have arguably served us well. Generous outdoor spaces have allowed suburban dwellers to live outdoors, in private, and to indulge in an assortment of hobbies, to keep pets, to park vehicles and store recreational equipment.2,3 They have historically enabled households to develop ‘independence and security’, particularly in relation to the production of food and ecosystem services.4 Despite these undoubted virtues it would appear Perth’s suburban model is ‘running out of steam’5 on a number of fronts.
The arguments against outer suburban growth
The generic arguments for curtailing further urban outer suburban growth6
1 In Brendan Gleeson, “Waking from the Dream: Towards Urban Resilience in the Face of Sudden Threat,” Griffith University Urban Research Program (2006): 30.
2 Patrick Troy, “Saving Our Cities with Suburbs,” in Griffith Review: Dreams of Land, ed. Julianne Schultz (Brisbane: Griffith University, 2004), 120..
3 Tone Wheeler, “Garden Cities of Tomorrow: Upside Down, inside out and Back to Front,” in Griffith Review 29: Prosper or Perish, ed. Julianne Schultz (Brisbane: Griffith University, 2010), 47.
4 Ecosystem services are those provided by nature including microclimatic amelioration and mitigation of climatic extremes, sequestration of air pollutants, flood mitigation, and storm water attenuation. Troy, “Saving Our Cities with Suburbs,” 118.
5 Gleeson, “Waking from the Dream: Towards Urban Resilience in the Face of Sudden Threat,” 20.
6 Otherwise known as ‘greenfield develop-
and redirecting population growth to existing urban areas are numerous and well worn. In brief, infill development7 is typically being sought to maintain and protect rural land on city fringes and reduce infrastructure costs (for both public transport and services), commuting times, carbon emissions and the concentration of economic and social vulnerabilities in far-flung suburbs.8,9 The debate about the problems, or indeed virtues, of suburban form can be emotive and is often based on a generic situation (i.e. the debate is not focussed by the issues of a particular city). This book is not intended to perpetuate this situation but rather focus specifically on the Western Australian city of Perth to see what the implications of perpetuating a model of outer suburban growth may be.
Perth is experiencing a number of particular issues that this form of development potentially exacerbates. First and foremost, Perth sits within the threatened Southwest Australia biodiversity hotspot, one of only thirtyfive such hotspots in the world.10 This hotspot is an exceptionally biodiverse area that has already lost ninety-three per cent of its original vegetation, and ment’ or pejoratively as ‘sprawl’.
7 Infill development refers to development within existing urban areas.
8 Jago Dodson and Neil Sipe, “Unsettling Suburbia: The New Landscape of Oil and Mortgage Vulnerabilty in Australian Cities,” (Brisbane: Griffith University, 2008), 37.
9 Committee for Perth, “Perth: Australia’s Most Prosperous City,” Committee for Perth, http://us7.campaign-archive1.com/?u=2d482b3fe059fe69ad22d7616&id=84c03b574d&e=[UNIQID].
10 By definition a biodiversity hotspot must contain at least 1,500 endemic species and has to have lost at least seventy percent of its endemic vegetation to clearing. Conservation International, “Hotspots,” Conservation International, http://www. conservation.org/How/Pages/Hotspots.aspx.
clearing of the remaining seven per cent continues daily.11 Evidence of the perilous state of the Southwest biodiversity hotspot is that the region now has more species of threatened plants (2,500) than any other Australian state and most countries of the world.12 In the Perth metropolitan region this clearing is primarily due to suburban development.13 Between 2001 and 2009 an annual average of 851 hectares of highly biodiverse land on the urban fringe was consumed by suburban growth,14 and the state government has referred development proposals for a further 689 ha of high conservation value bushland to the federal Department of the Environment for approval.15 While a model may yet emerge for how outer suburban development in Perth can be successfully interwoven with the biodiversity, it is generally recognised that a high-density, compact city model is more effective in protecting peri-urban land for biodiversity conservation.16
11 South west Australia Ecoregion Initiative, “The Southwest Australia Ecoregion: Jewel of the Australian Continent,” (Perth: South west Australia Ecoregion Initiative, 2006), 17.
12 Stephen Hopper and Paul Gioa, “The Southwest Australian Floristic Region: Evolution and Coservation of a Global Hotspot of Biodiversity,” Annual Review of Ecology, Evolution, and Systematics 35(2004): 604.
13 Cristina Ramalho et al., “Complex Effects of Fragmentation on Remnant Woodland Plant Communities of a Rapidly Urbanizing Biodiversity Hotspot,” Ecology 95(2014): 143.
14 WWF, “Perth Urban Sprawl,” WWF, http:// www.wwf.org.au/our_work/saving_the_natural_world/ australian_priority_places/southwest_australia/the_ perth_metropolitan_area/perth_urban_sprawl/.
15 The Greens, “Perth’s ‘Top Ten’ Places Too Precious to Lose- under Direct Threat,” The Greens, http://wa.greens.org.au/sites/greens.org.au/files/Appendix%20-%20Top%20ten%20places%20under%20 threat-1.pdf.
16 Karen C. Seto, Burak Guneralp, and Lucy Hutyra, “Global Forecasts of Urban Expansion to 2030 and Direct Impacts on Biodiversity and Carbon Pools,”
Secondly, attempts in Perth to interweave outer suburban development with remnant bushland will also increase the area of suburban/ rural interface and as such the vulnerability of suburban areas to bushfires17 – an event Perth will experience more frequently as climate change causes Terra Australis to become ‘Terror Australis, a blast furnace of drought, heat and capricious tempests.’18 The tragic Canberra fires of 2003 and the Black Friday fires of 2009 (which came perilously close to Melbourne’s suburban edge) serve as a warning in this respect.19
Thirdly, Perth is running out of the basic raw materials required to build conventional suburbs, including sand, limestone and clay. These shortages are exacerbated by the fact that many of the sites earmarked for future suburban development are waterlogged and a substantial amount of sandfill is required to lift houses above the water table.20 While infill development also consumes basic raw materials, such as sand, limestone and clay, it tends to require much less than outer suburban development. Take, for instance, sand. A new dwelling in an outer suburb requires on average 111 cubic metres of sand per person, while a new suburban
PNAS 109, no. 40 (2012): 16085.
17 Department of Planning and Western Australian Planning Commission, “Draft Perth and Peel @3.5 Million,” (Perth: Western Australian Planning Commission, 2015), 56..
18 Gleeson, “Waking from the Dream: Towards Urban Resilience in the Face of Sudden Threat,” 15..
19 Lifeboat Cities (Sydney: UNSW Press, 2010), 21.
20 ARUP and Curtin University Sustainability Policy Institute, “Reducing the Materials and Resource Intensity of the Built Form in the Perth and Peel Regions,” (Perth: Department of Sustainability, Environment, Water, Population and Communities, 2013).
infill dwelling requires 73 m3. 21 Ironically for Perth, a city built on sand dunes, sand will increasingly become a factor that limits outer suburban growth this century.
Also, research shows outer suburban residents require much more water (70 kilolitres per year) than those in infill dwellings closer to the city (42 KL per year).22 Such profligate use of water, mostly to irrigate gardens, will be difficult to sustain in the context of a drying climate, diminishing groundwater supplies23 and projected population growth – indeed at current rates it is predicted that the demand for scheme water will double in the next 40 years.24 The earlier water consumption figures are not used here to make the point that outer suburban residents are inherently more wasteful than those living in an infill situation – just that the urban form they reside in generally demands a greater usage of water. While Perth has been busily building desalination plants to shore up Perth’s water supply the social and economic implications of a capital city, such as Perth, running out of water are unthinkable. 25 Indeed Tim Flannery, environmental scientist and Australian of the Year in 2007, has gone as far as to warn that, on the basis of the declining availability of water, ‘Perth will be the 21st century’s first ghost metropolis.’26
21 Ibid., 21.
22 Ibid.
23 Ibid., 23.
24 Department of Planning and Western Australian Planning Commission, “Draft Perth and Peel @3.5 Million,” 58..
25 James Woodford, “Knocking on the Door,” in Griffith Review: Hot Air, How Nigh’s the End?, ed. Julianne Schultz (Brisbane: Griffith University, 2006), 64..
26 David Hedgecock, “Watering a Thirsty City: Planning for Perth’s Water Regime,” in Planning Perspectives from Western Australia: A Reader in
Fourthly, due to a relative dearth of public transport options, outer suburban residents can be forced into high rates of car ownership,27 which in turn makes them vulnerable to projected rises in fuel prices.28 While it is possible that in the near future we will be all zipping around in electric cars powered by household solar photovoltaic panels, due to their typically lower socio-economic status outer suburban households have relatively lower ability to pay for rapid ‘vehicular eco-modernisation’ – at least at current prices.29
Finally peri-urban regions produce a ‘disproportionately large share of total farm-gate value and are major sources of fresh produce.’30 In particular Perth’s peri-urban regions, incorporating Wanneroo, Kwinana, Swan, Armadale and Kalamunda, produce a significant fifty-eight percent of Western Australia’s total vegetable production.31 Given emerging issues regarding food security, and the need to reduce carbon emissions associated with the transportation of food, building over Theory and Practice, ed. I Alexander, S Greive, and D Hedgcock (Perth: Fremantle Press, 2010), 102.
27 High rates of car ownership are partly reflected in fuel consumption data. Outer suburban residents require much more fuel (50,000 Megajoules per year) than those in infill dwellings closer to the city (35,000 MJ per year). ARUP and Curtin University Sustainability Policy Institute, “Reducing the Materials and Resource Intensity of the Built Form in the Perth and Peel Regions,” 23.
28 Dodson and Sipe, “Unsettling Suburbia: The New Landscape of Oil and Mortgage Vulnerabilty in Australian Cities,” 37.
29 Jago Dodson, “In the Wrong Place at the Wrong Time? Assessing Some Planning, Transport and Housing Market Limits to Urban Consolidation Policies,” Urban Policy and Research 28, no. 4 (2010): 490.
30 Department of Infrastructure and Transport: Major Cities Unit, “State of Australian Cities,” (Canberra: Department of Infrastructure and Transport, 2012), 169..
31 Ibid..
Perth’s ‘salad bowl’ would be a reckless thing to do. Indeed a significant amount of urban and peri-urban agricultural land has been already lost. Over time, Perth’s urban growth has already displaced traditional market gardens in North Perth, Bayswater, Victoria Park and Bibra Lake, Spearwood and Osborne Park.32
As this brief summation points out, beneath Perth’s suburban form lie vulnerabilities – to bushfires, shortages of basic raw material, water and energy supplies and ecological collapse – that could be exposed by changing environmental or climatic conditions. While we tend to look at our cities (or suburbs) as stable, predictable entities, ‘history is littered with examples of fallen cities.’33 Is it possible the tipping point for Perth’s outer suburban growth may be closer than we think?
Perth’s failure to meet its infill targets
Partly to curtail the issues of a sprawling city, in 2010 the Western Australian Government set a target that forty-seven per cent of all new residential development in Perth be infill development (that is development within the existing city). Despite this being the most modest infill target of all Australian capital cities, and Perth already being Australia’s second-most spread city, it achieved only twenty-eight per cent infill development in 2012, even lower than its historical average of thirty-two per
32 Department of Planning and Western Australian Planning Commission, “Draft Perth and Peel @3.5 Million,” 50..
33 Peter Newman, Timothy Beatley, and Heather Boyer, Resilient Cities (Island Press, 2009), 37.
cent.34 If these development patterns continue, and if Perth reaches its 2061 population projection of 6.6 million people,35 its suburban area will balloon by an additional 1,486 square kilometres, something that if not handled with foresight could have calamitous societal and environmental effects. While such ‘datascapes’ tend to be bandied around it is important to remember that when we discuss ‘disembodied concepts like population growth… we are talking about real lives: about people and their needs, wants, capabilities and fears.’
36 In short, the planning Perth adopts in the next decades will dictate, in a myriad of ways, the fate of millions of ‘future’ Perth residents.
I propose a two-pronged approach to address this situation.
First, I will conduct a systematic audit, ‘an official verification of accounts’, of the non-urbanised landscapes of Perth’s suburban core,37 the region generally most suitable for infill development due to its proximity to public transport, jobs and cultural and natural amenities. This audit is intended to identify potential sites for infill development, the
34 Department of Planning and Western Australian Planning Commission, “Urban Growth Monitor: Perth Metropolitan, Peel and Greater Bunbury Regions,” (Perth: Western Australian Planning Commission, 2012), 6.
35 Australian Bureau of Statistics, “Population Projections, Australia, 2012 to 2101,” Australian Bureau of Statistics, http://www.abs.gov.au/ausstats/ abs@.nsf/Lookup/3222.0main+features52012%20 (base)%20to%202101.
36 Peter Mares, “Monday Morning in Mernda: A Land of Plenty, or Plenty in the Land?,” in Griffith Review 29: Prosper or Perish, ed. Julianne Schultz (Brisbane: Griffith University, 2010), 41..
37 The inner and middle suburbs otherwise known as the Central Sub Region.
(admittedly simplistic) presumption being that each dwelling built within the suburban core avoids one being built in new suburban developments on the fringe. Building on the concept of ‘greyfield audits’ developed in the United States,38 the landscape types that will be audited include household gardens, asphalt (roads and carparks), freeway and railway reserves, airports, infrastructural easements, industrial areas, parks, golf courses, universities, schools, river foreshores and bushland. The focus on such landscapes for their infill potential reflects Perth’s relative lack of decaying port or post- industrial areas, sites that have yielded large numbers of infill dwellings in Australia’s eastern state cities (reflected in projects such as Melbourne’s Docklands and Sydney’s Green Square). Of course densification will also occur in Perth’s existing urbanised areas, in particular the city centre, and in existing town centres; however, these have been excluded from this study because they are well covered in existing planning.39
In the spirit of an audit, the suburban core’s landscapes will be systematically analysed with respect to their spatial provision, then compared with planning standards and commensurate landscape types in other benchmark cities. The end result will be an assessment of whether the landscape is potentially oversupplied (or undersupplied) and could be partly rationalised for infill development. As a
38 Ellen Dunham-Jones, Retrofitting Urban Solutions for Redesigning Suburbs (New Jersey: Wiley, 2011), xv.
39 Western Australian Department of Planning, “Directions 2031 and Beyond: Metropolitan Planning Beyond the Horizon,” (Perth: Department of Planning, 2010).
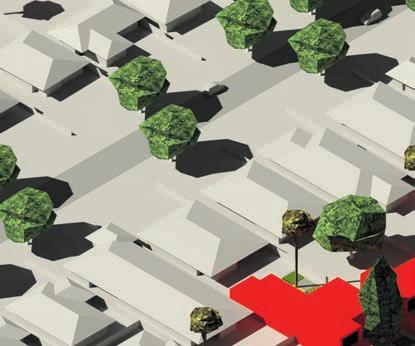
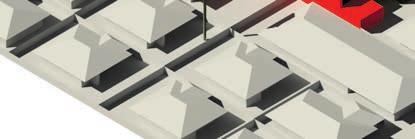
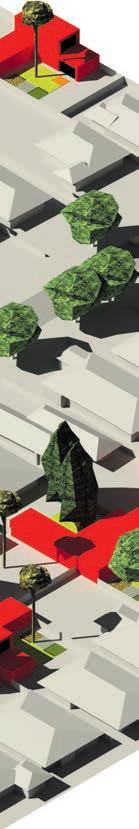
guide to the following chapters the landscape types are divided loosely into groups, starting with private gardens which is where the bulk of infill development is currently occurring, then transportation landscapes, infrastructural and industrial landscapes, recreation landscapes, educational landscapes and ‘natural’ landscapes. Accompanying (indicative) visualisations of how these landscapes could be colonised with infill development are aimed at the lacuna of ‘design vision that can capture the public imagination for more sustainable urban futures’ as identified by Melbourne urban design theorist Kim Dovey.40 In this sense they are to be understood as suggestions not prescriptions.
This process of open space rationalisation proposed in this book does not reflect an ideological bias against suburban open space and the important eco-system services it can provide. Rather it attempts to initiate an informed conversation about using Perth’s spaces more efficiently to further both ecological, productive (energy, food) and housing provision ends. Without an empirical base a related debate in Perth’s tends to oscillate between those who regard Perth’s openness as signifying Perth’s relaxed quality of life and those who regard Perth’s openness as vacuous and wasteful – a (sub)-urban form that demands densification and activation. This polarised debate is evident in the comments section of a recent online
40 Kim Dovey and Ian Woodcock, “Intensifying Melbourne: Trasit-Orientated Urban Design for Resilient Urban Futures,” (Melbourne: Melbourne School of Design, The University of Melbourne, 2014), 1..
Sunday Times article41 on the need for infill development in Perth. Prosecuting the case against infill, Mel makes the point:
When I visit those big cities (New York, London) I am happy to come home to our wide open spaces. Why do so many people want to live in Perth? Not for cramped concrete living conditions like those cities, it’s for the parks, the open space and being able to see the sky.
Prosecuting the case for infill Matt goes on the attack:
I think people living in the outer suburbs have a very warped view of inner city living that is completely incorrect. Also, a family of four (or less) does not need a four by two with a huge backyard. That is simply greedy and unnecessary, but it is the backwards mentality of many people in Perth unfortunately.
To which Ben replies:
You may like the idea of 1000 square kilometres of concrete, other people don’t. Thank God I live on acreage backing onto a State Forest…
And the debate reverberates back and forth, but is not productive. In order to address this situation this research project aims to provide an empirical base from which political leaders, planners, developers and the public can conduct an informed productive debate on the issue.
41 Peter Law, “Future Perth: 900,000 New Homes without Urban Sprawl,” Perth Now, http:// www.perthnow.com.au/news/special-features/futureperth-900000-new-homes-without-the-urban-sprawl/ story-fnknbeni-1227098457513.
Second, I will visualise trade-offs between infill development in the suburban core and the area of suburban development subsequently avoided on the city’s fringes. I contend that these trade-offs are not well understood by Perth’s populace. To illustrate these savings I use the Perth outer suburb of Ellenbrook as a unit of measure.42 Around Australia only eleven per cent of communities support infill development – a figure that reflects anxieties about population growth, but also a lack of understanding about the metropolitanscale implications of resistance to infill development at a local level.43 Given the magnitude of the issues faced in low density cities generally, a resident or community could be forgiven for thinking that they are powerless to effect any real positive change themselves; however, I argue that this is not the case. Discussion of metropolitan form can obscure the fact that such form is the result of the cumulative spatial decisions of millions of individuals. Indeed Perth’s metropolitan plan and related infill targets are merely trying to direct such 42 This is not meant to imply that Ellenbrook is ‘bad,’ rather that it has vulnerabilities typical of the outer suburbs described in this preface. In particular it is not connected to efficient public transport systems, provides minimal employment opportunities or healthcare services, requires high levels of water and fertiliser to maintain plantings and is poorly adapted to the sites endemic biodiversity. Paul Verity, “Ellenbrook Estate –Revisited,” Landscape Architecture Australia, no. 132 (2011).
43 J-F Kelly, P Breadon, and J Reichl, “Getting the Housing We Want,” (Melbourne: Grattan Institute, 2011); Productivity Commission, “Performance Benchmarking of Australian Business Regulation: Planning, Zoning and Development Assessments.,” (Canberra: Productivity Commission, 2011). Indeed, residents typically engage in the planning process only as a reaction to specific developments rather than to proposals on how the whole city, should change over time.
cumulative effects. Today, urban areas around the world are expanding on average twice as fast as their populations;44 if we can make spatial compromises on an individual basis the cumulative effects of these could be vast.To this end Scavenging the Suburbs sets out to initiate a conversation about such compromises Perth residents can make to achieve a compact city form.
Processes to increase urban densities vary. In Perth, planning correlates medium- to high-density infill development with public transport nodes (generally train stations) in what are referred to as Activity Centres, and along public transit routes/ arterial roads in what are referred to as Activity Corridors.
When considered at the metropolitan scale, the correlation of residential density and public transport found in Activity Centres makes a lot of sense, but on the ground it is not without its issues. These train stations often have heritage building stock, have fragmented land ownership, and are typically complex ‘knots’ of intersecting road and rail infrastructure (particularly where rail lines run in the middle of the freeway), and have expansive carparks so people can ‘park and ride’, which conflicts with the attempt to create urban walkable town centres. A number of Perth’s other Activity Centres are proposed around big box shopping malls, which are, in many respects, the antithesis of the 44 Seto, Guneralp, and Hutyra, “Global Forecasts of Urban Expansion to 2030 and Direct Impacts on Biodiversity and Carbon Pools,” 16083.
dense urban villages proposed in Activity Centre planning – the malls being car dominated, disconnected from the surrounding urban form and not attractive residential environments. Notwithstanding the challenges posed by such sites (and the fact that Activity Centres have been on the drawing board since 2004…) we can hope for significant provision of infill dwellings in Perth’s Activity Centres in years to come. In contrast to Activity Centres, Activity Corridors have seen much medium density residential development in recent times. Partly because such corridors are generally not held dear by local communities there is comparatively little resistance to their densification. There is a question about the suitability of these zones as a living environment however. While these corridors are public transit routes are generally also arterial roads which have noise and vehicular emissions issues that need to be mitigated by appropriate building types.
While Activity Centres and Corridors are the flagship of Western Australian Government infill strategy, a large amount of infill development is occurring through the ‘do it yourself’ subdivision of backyards. This typically ad hoc approach to densification is producing typically poor outcomes, often sacrificing what is good about suburban living (namely generous and green outdoor space)45 without providing many of the benefits of dense, urban cities (such as
45 Phil McManus, “Planning with and for Trees in Perth: Yesterday, Today and Tomorrow,” in Planning Perspectives from Western Australia: A Reader in Theory and Practice, ed. I Alexander, S Greive, and D Hedgcock (Perth: Fremantle Press, 2010).
walkability and cultural amenities). This issue is discussed in more detail in the first chapter.
Scavenging the Suburbs offers a complementary (not replacement) process for densifying suburban areas. In contrast to the necessarily ‘top down’ approach that characterises Activity Centre planning, this book explores opportunities for infill development that emerge upwards from an intimate understanding of ground conditions. This suggests a move away from the figure of the regional master planner towards the designer who scavenges the urban surface for infill opportunities.46 Instead of ad hoc subdivision of private lots, this book focuses generally on the potential of public land47 (which to our calculation amounts to over fifty per cent of the urban area) to also yield infill development opportunities. Much of this land hasn’t been considered for infill development because it is controversial (owing in part to its public ownership and association with ‘nature’) and/or complicated (it is the jurisdiction of government departments not concerned
46 Alan Berger, Drosscape: Wasting Land in Urban America (New York: Princeton Architectural Press, 2006), 241.
47 This book explores industrial zoned land for its infill development potential. While industrial lands are generally in private ownership they are as the Western Australian Planning Commission explains ‘a vital component of the economy of Western Australia and are essential for the quality of life that we enjoy’ and as such could be considered quasi-public. Western Australian Planning Commission, “Statement of Planning Policy No. 4.1: State Industrial Buffer Policy,” ed. Western Australian Planning Commission (Perth: Western Australian Government, 1997), 1..
with urban form issues).
Sensitivity to the development of public land in Perth can be traced right back to 1834 when John Septimus Roe, the colony’s first surveyor general, subdivided a generous foreshore park when its main proponent, James Stirling, was away on holiday. Perhaps as a result of such early transgressions people in Perth are fiercely protective of public land. Even if they are poorly used, public landscapes help to maintain a symbolic equilibrium between the age-old constructs of public and private and nature and culture. When these constructs are threatened community reactions can be severe. Transport planner David Igglesden describes the community reaction to a twin proposal to sell the fringes of a park to allow the development of granny flats,48 and to allow offices in suburban front gardens facing a shopping centre, saying:
There was a very vocal local group that ended up putting out notices to the whole community saying council wants to introduce factories and high density flats into our suburbs. We had 1500 people turn up to an initial public meeting, and a 1000 to a second. And they just roasted council. ‘You can’t ruin out suburbs, we have our lifestyle…’ they said. It was scary to experience…
Not to be deterred by such reactions, I believe that, given the problems of a low density city model, the fact that the
48 These granny flats would have been located on adjacent private lots and would have overlooked the park. As such they would have improved the surveillance and safety of the park which was, and is, bounded by solid fences which allow for minimal overlooking.
annual percentage of infill development in Perth is dropping49 and the perilous state of the Southwest biodiversity hotspot, such options for infill development should be on the table –this is a conversation we need to have. Furthermore given Perth is emerging out of a prolonged mining boom, public land may become increasingly important to stimulating infill development. Indeed the debt laden state government itself has recently created an unsolicited bid process whereby the private sector can identify public land holdingst, and propose ‘unique’ ways of bringing that land to market. As Lands Minister Terry Redman explains ‘If they can do that, and it meets government policy, and of course there’s a broader public good outcome we can identify, then they, through a Cabinet process, might get some sort of priority access to that.’50
Unfortunately the state government process does not include a more systematic evaluation of what public land could be rationalised, and in what manner – rather it would appear to be occurring in an ad hoc manner.
In the inaugural 1955 plan for Perth, planners Gordon Stephenson and Alistair Hepburn made a prescient statement about the city’s open space provision:
If it is found in the future that demands have been over-estimated, it is far simpler to free areas for development than to embark on the expensive and 49 This indicates that the easy-won opportunities for infill development on private land – ‘the low hanging fruit’ – have been depleted.
50 Andrew O’Connor, “Wa to Open Public Land Sales to Unsolicited Bids, Lands Minister Terry Redman Says,” Australian Broadcasting Corporation, http://www.abc.net.au/news/2015-06-24/wa-land-forsale-to-unsolicited-bids-says-terry-redman/6570782.
inadequate policies forced on communities where a narrow and meaner view had been taken.51
I contend that the ‘future’ Stephenson and Hepburn alluded to is here and that we should consider whether Perth’s non-urbanised landscapes have indeed been overestimated and could be partly rationalised to help meet infill targets. Perth’s development frontier was once considered the vast stretch of peri-urban land fringing the city – ‘the city’s other’.52 By virtue of the urgent need for urban infill development this book projects the focus inwards, a hypothetical development frontier now encircling spaces woven into Perth’s suburban form. It is into these landscapes that we will now venture.
51 G Stephenson and J A Hepburn, “Plan for the Metropolitan Region Perth and Fremantle 1955 Report,” (Perth: Government Printing Office 1955), 89.. 52 Berger, Drosscape: Wasting Land in Urban America, 27.
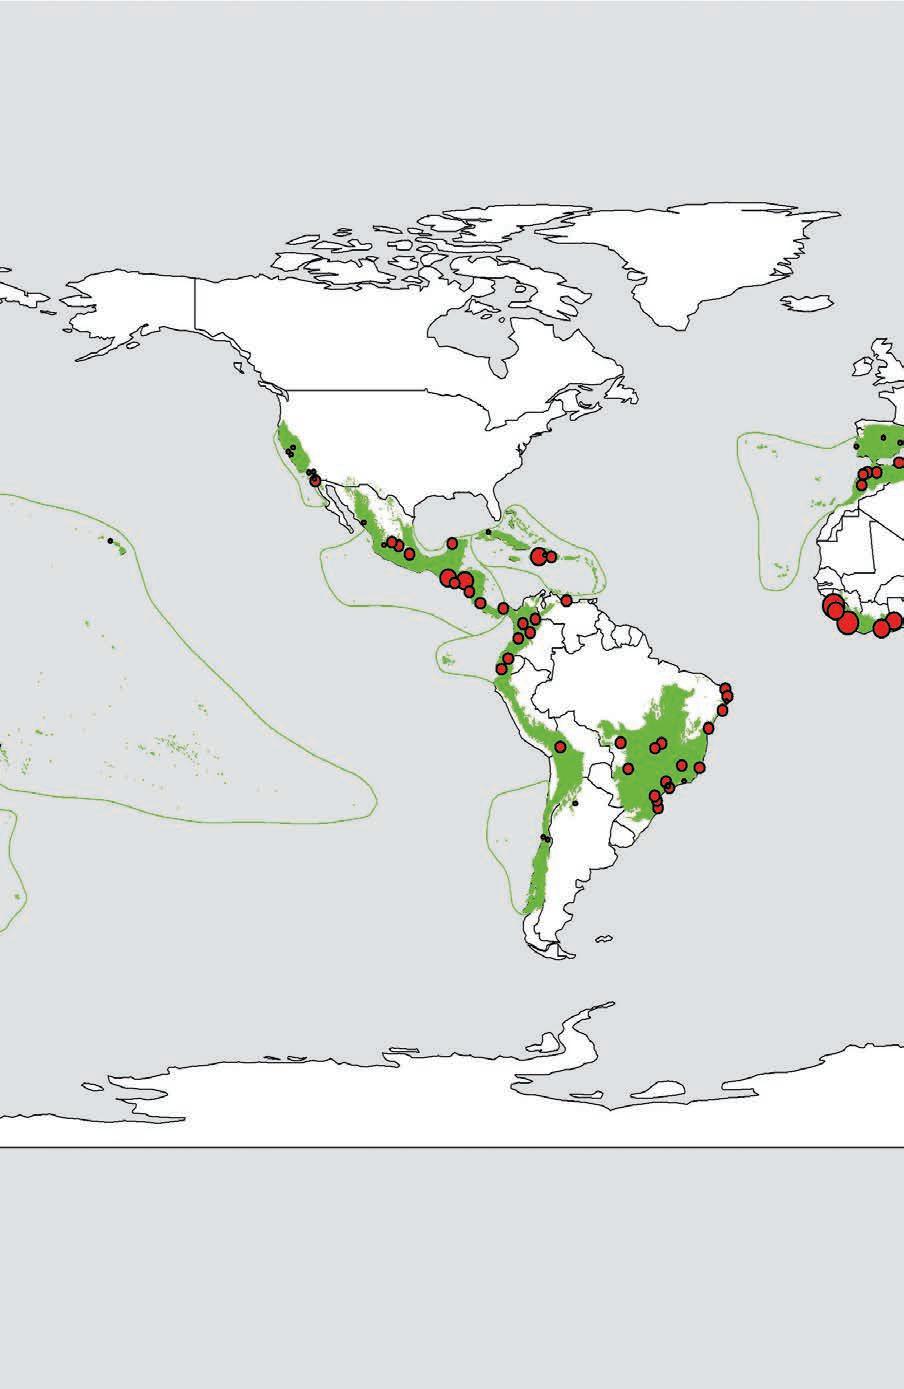
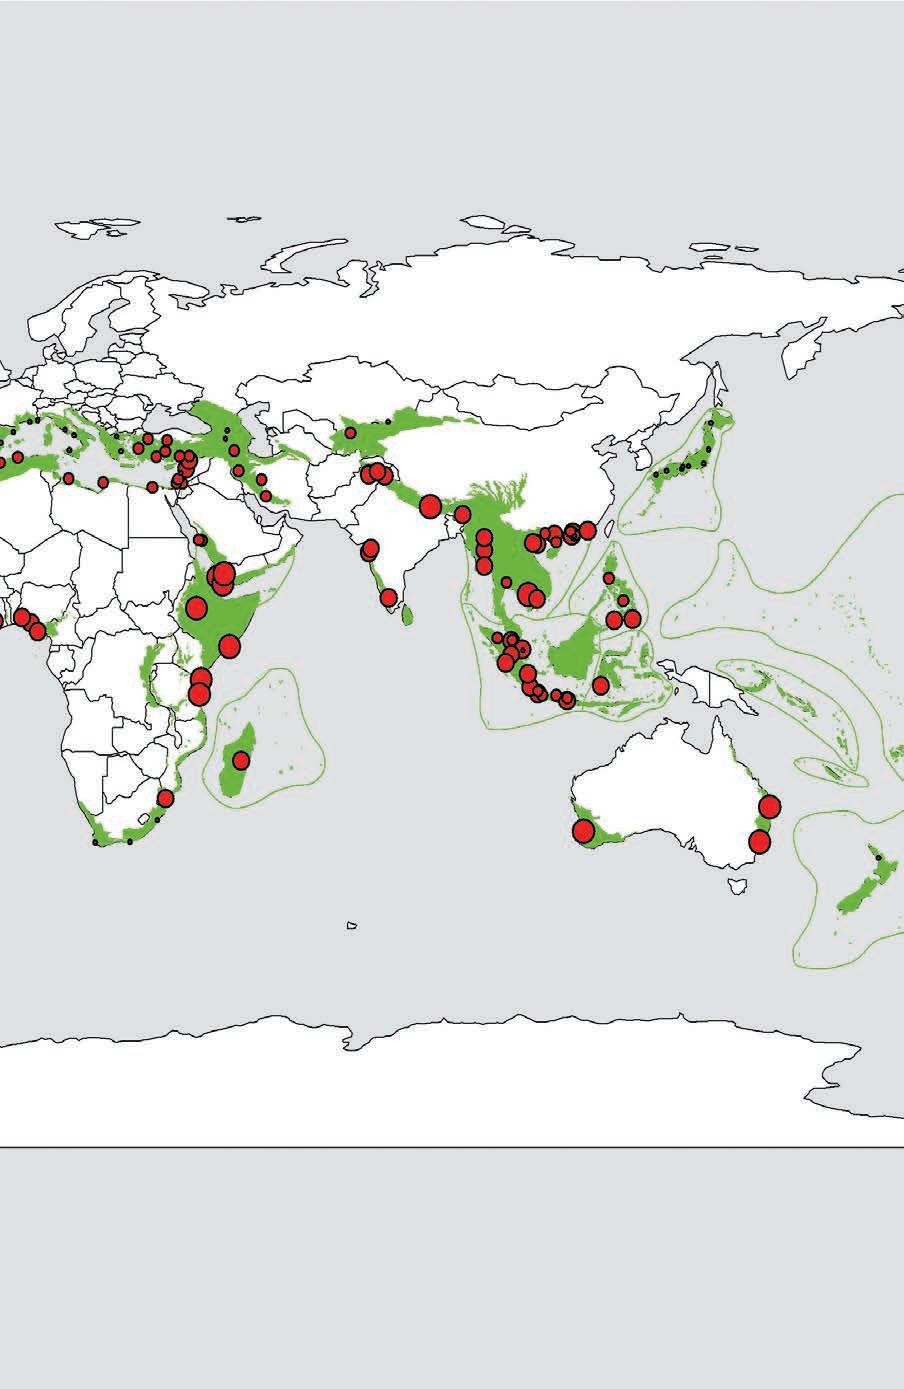
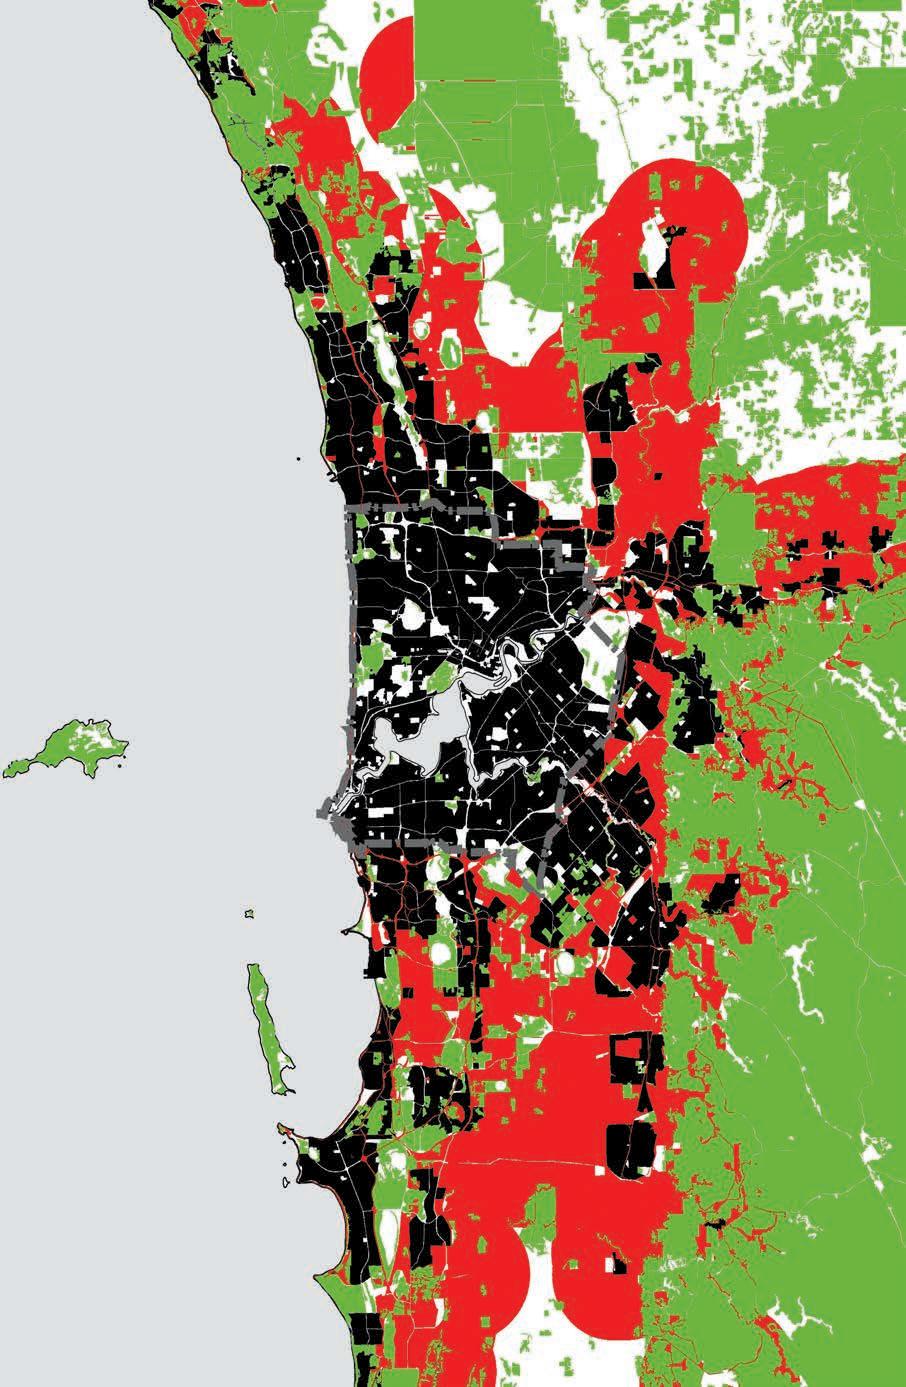
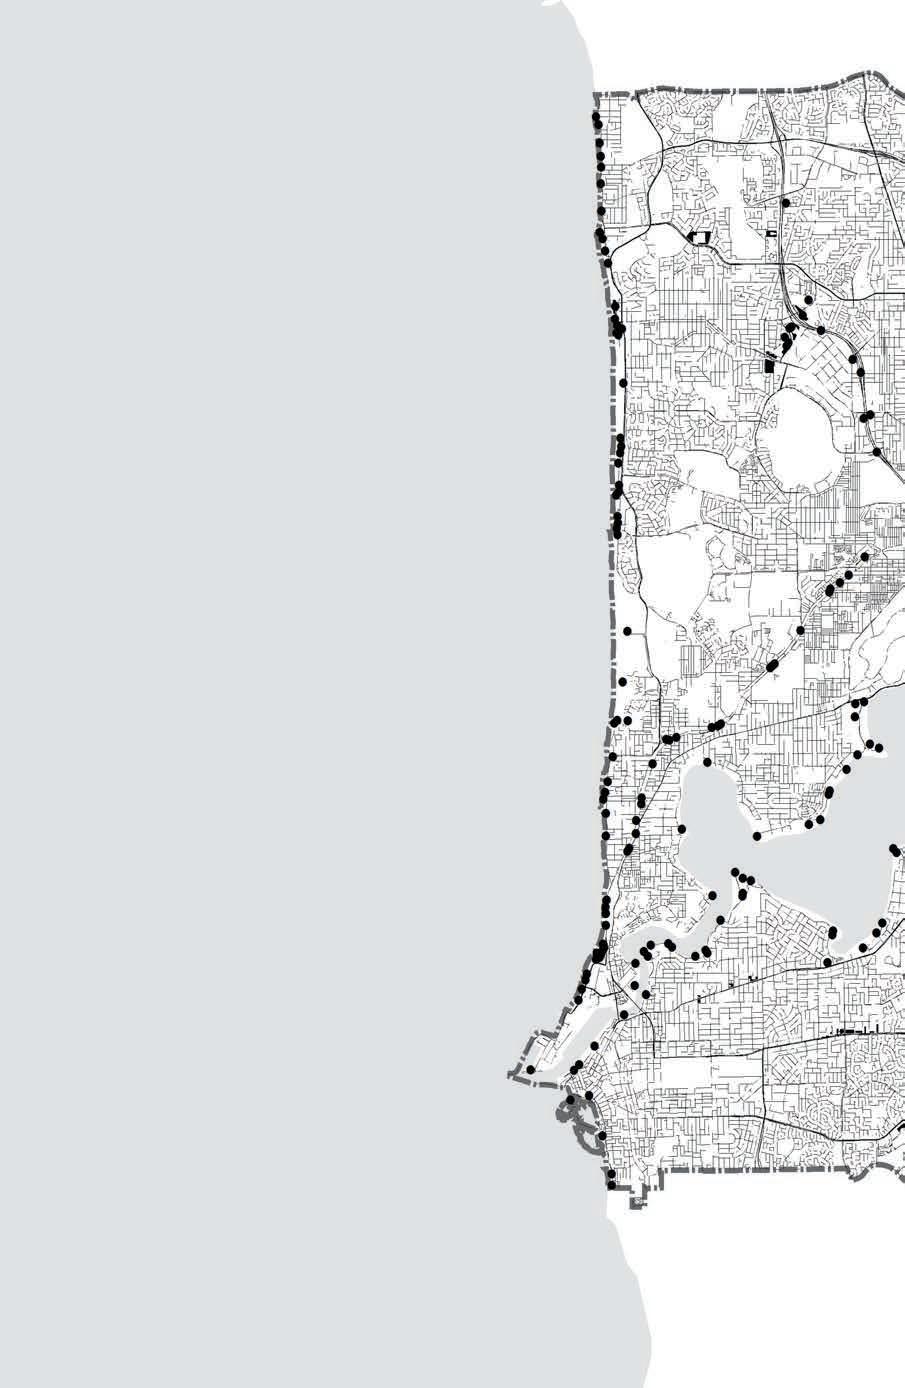
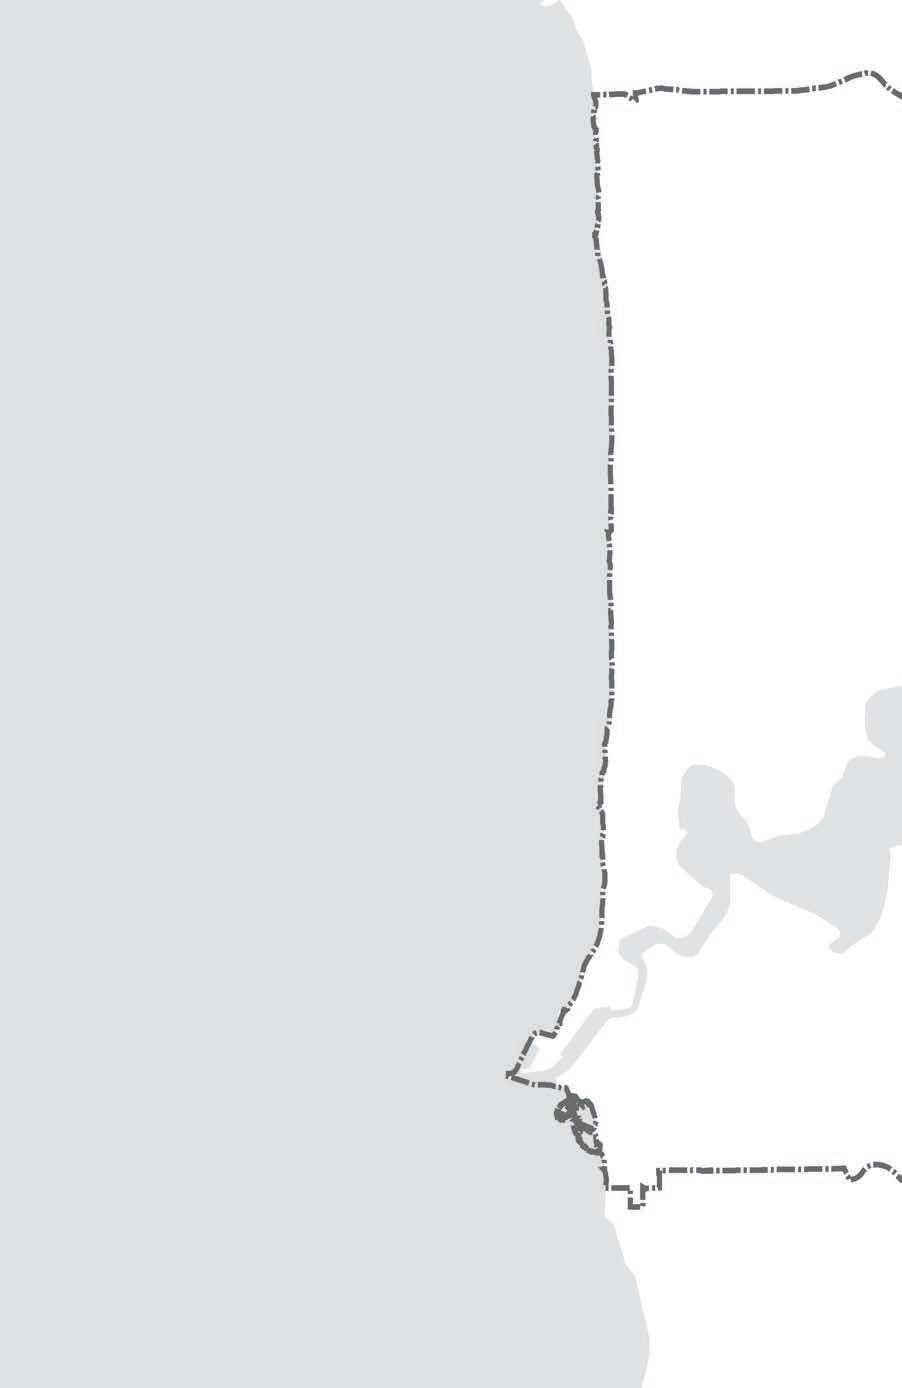
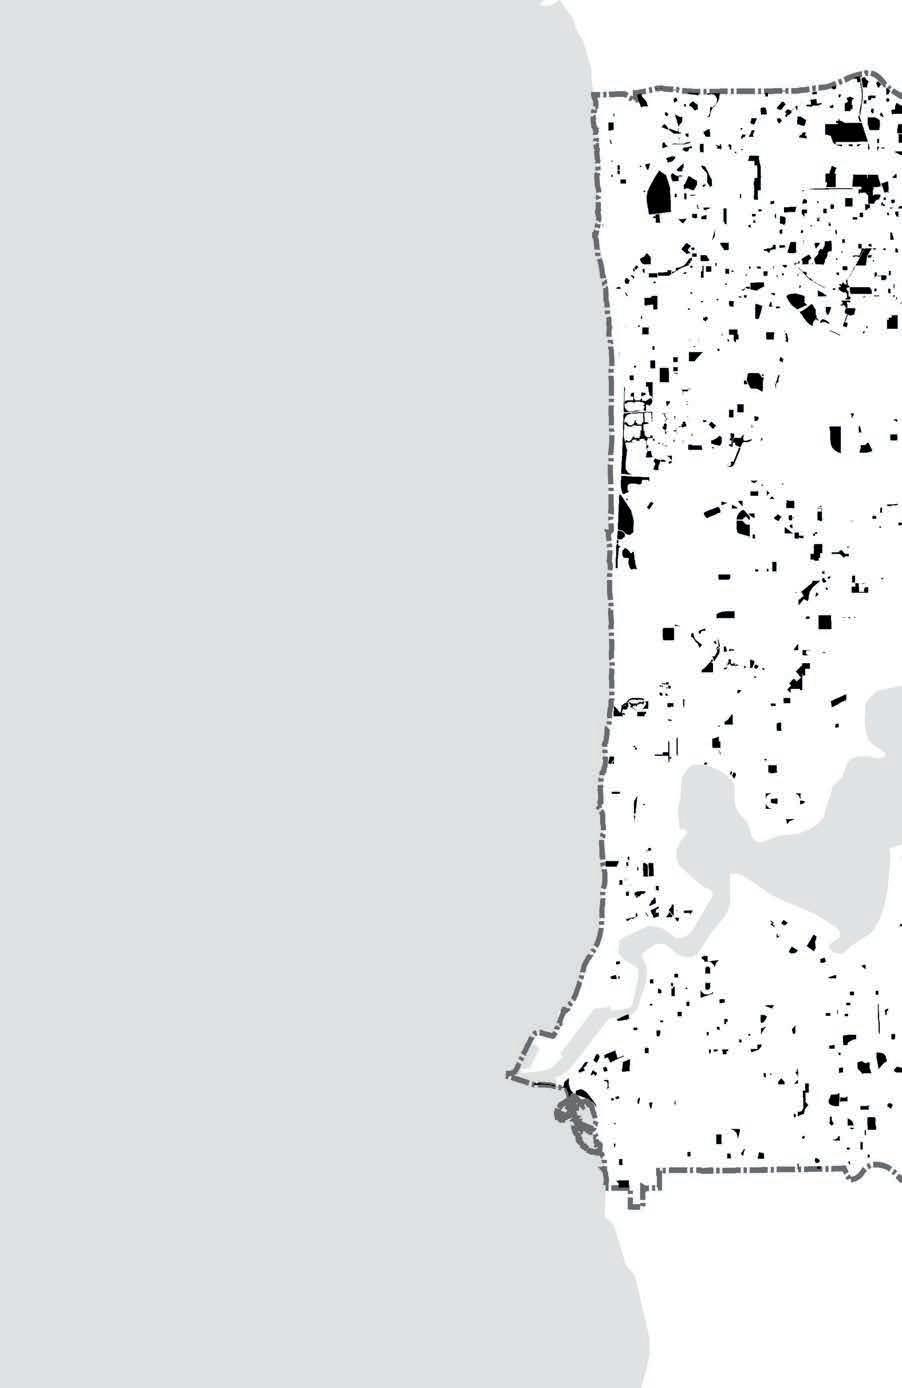
Perth sits within a biodiversity hotspot, one of only thirty-five in the world (shown in green).The red dots indicate cities larger than 750,000 people. The dot size is indicative of the city’s growth rate to 2050.
Source: Conservation International, 2015
SW Australia
Biodiversity Hotspot

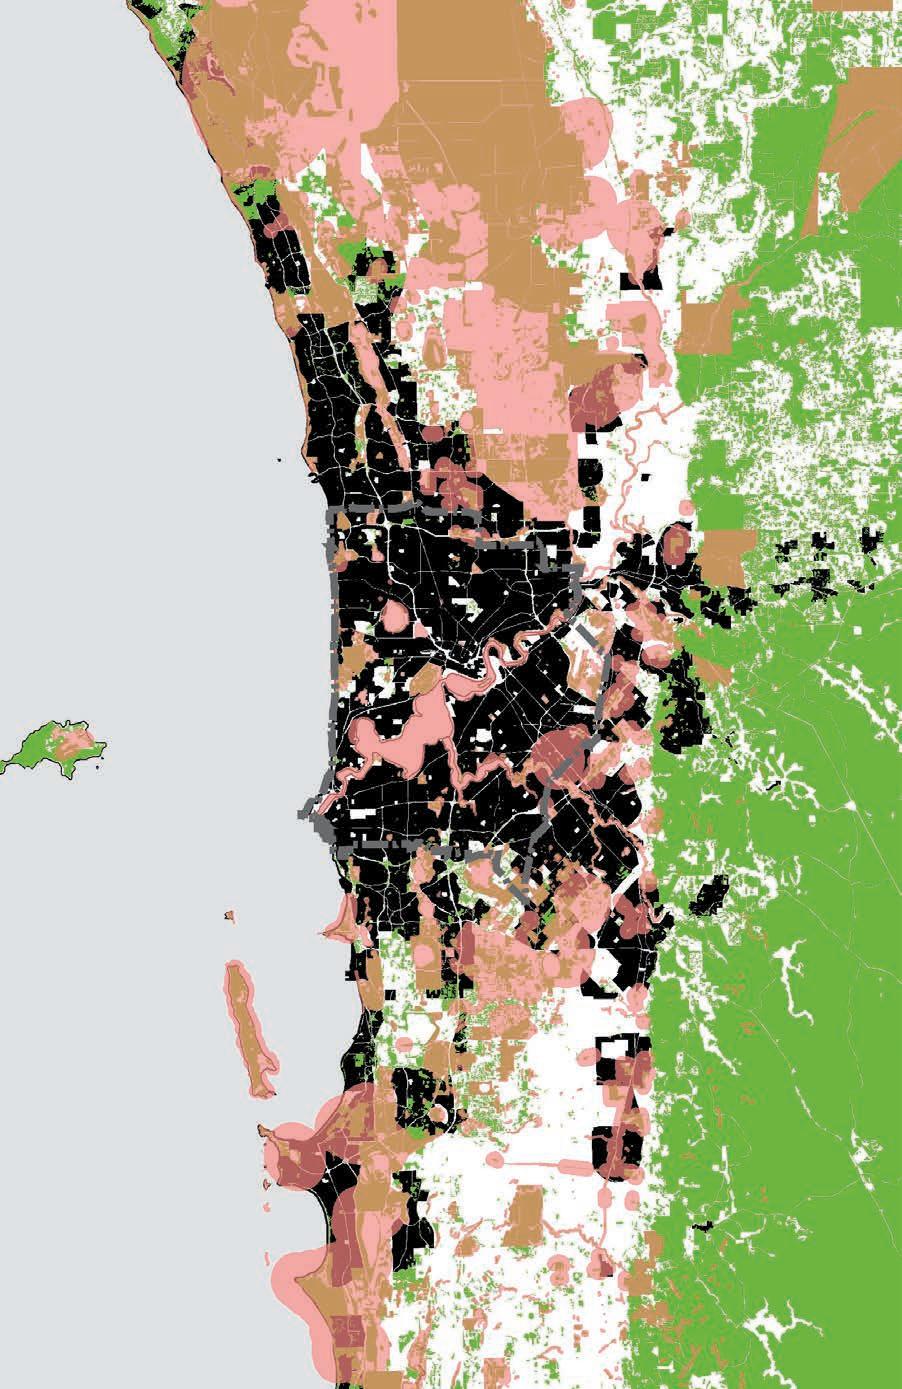
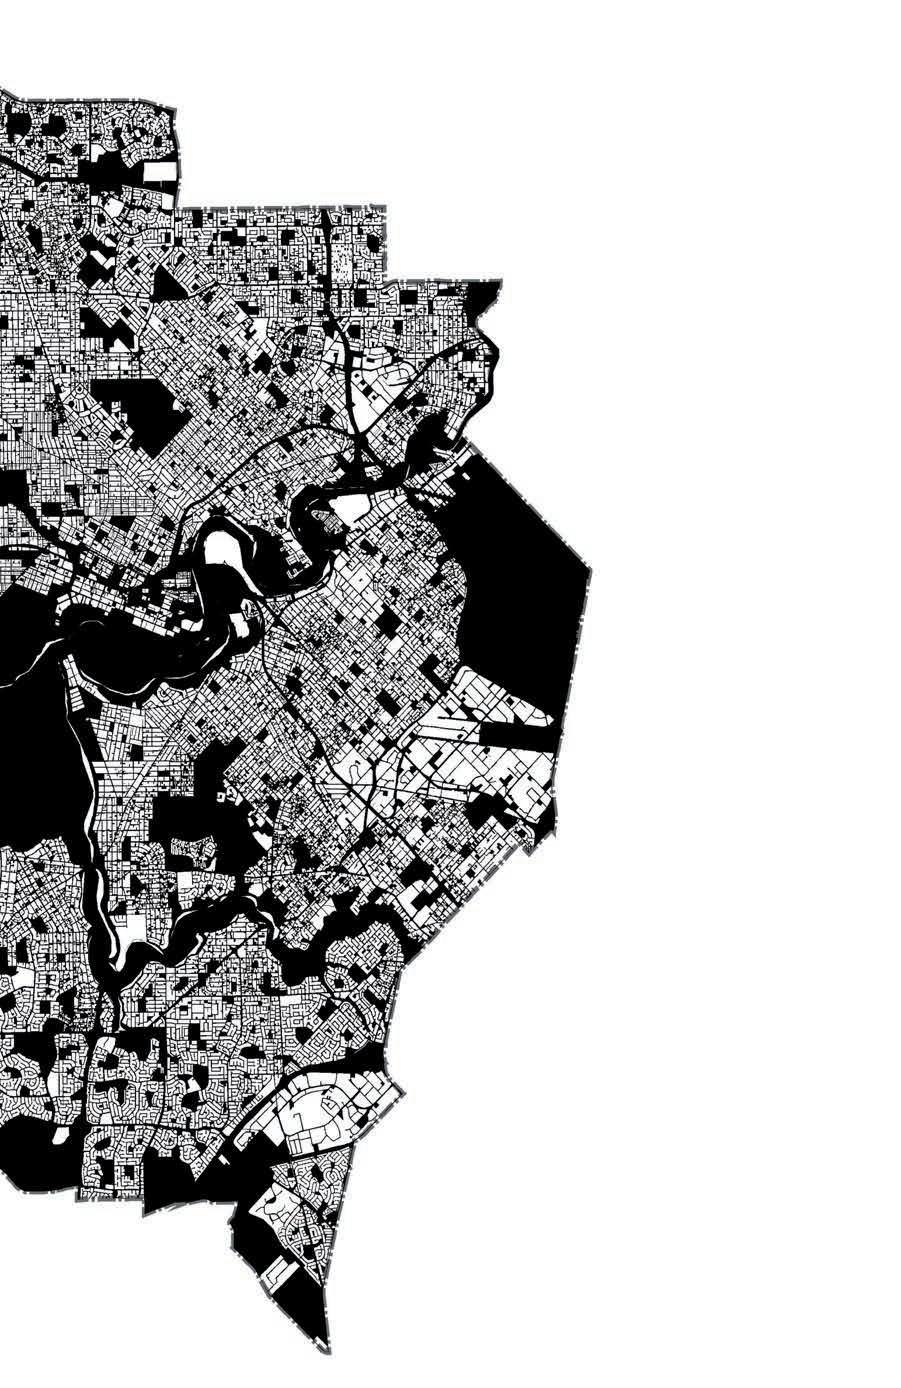
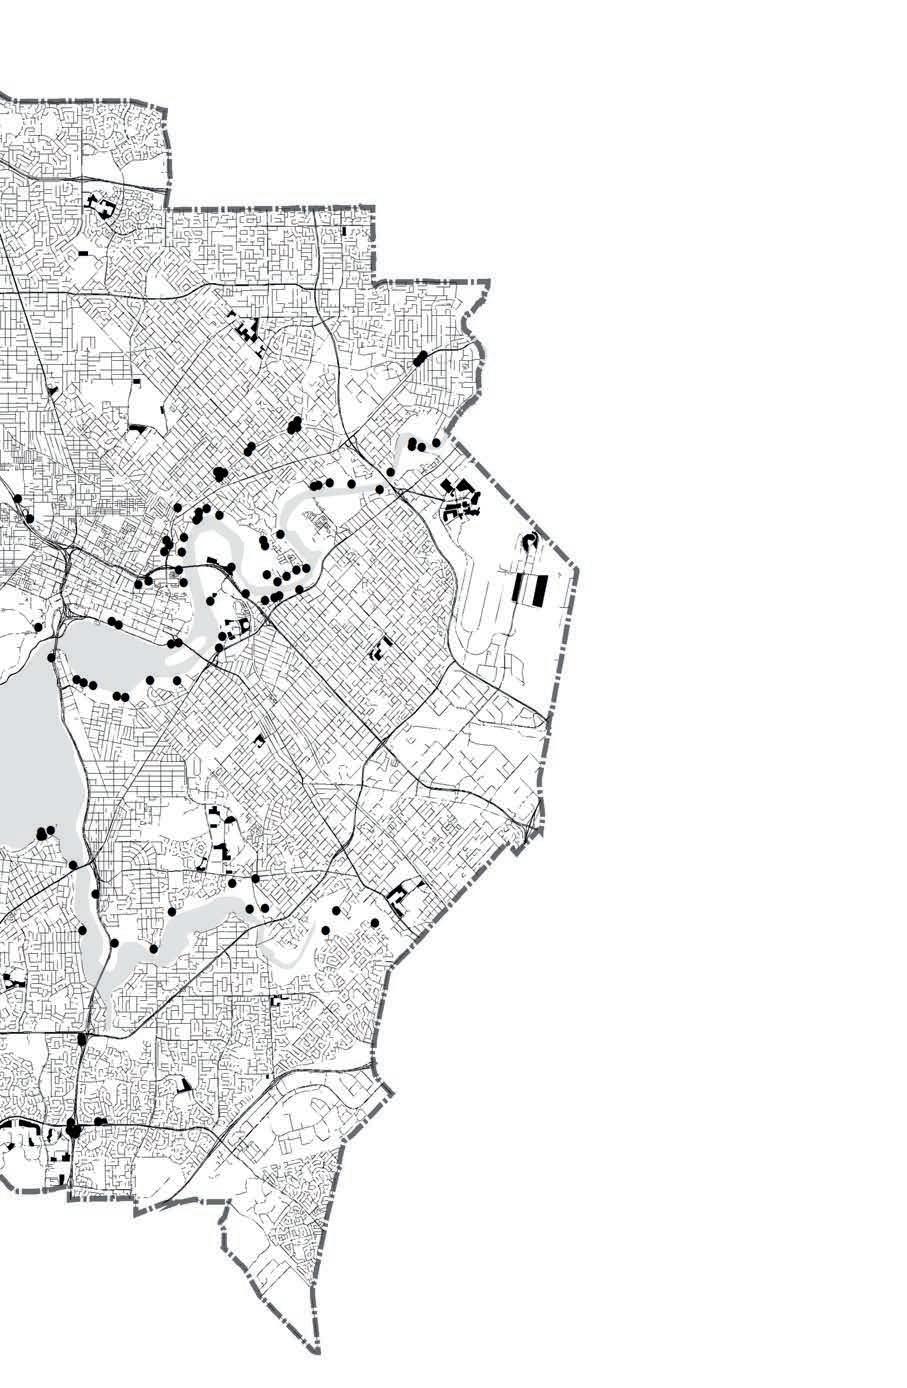
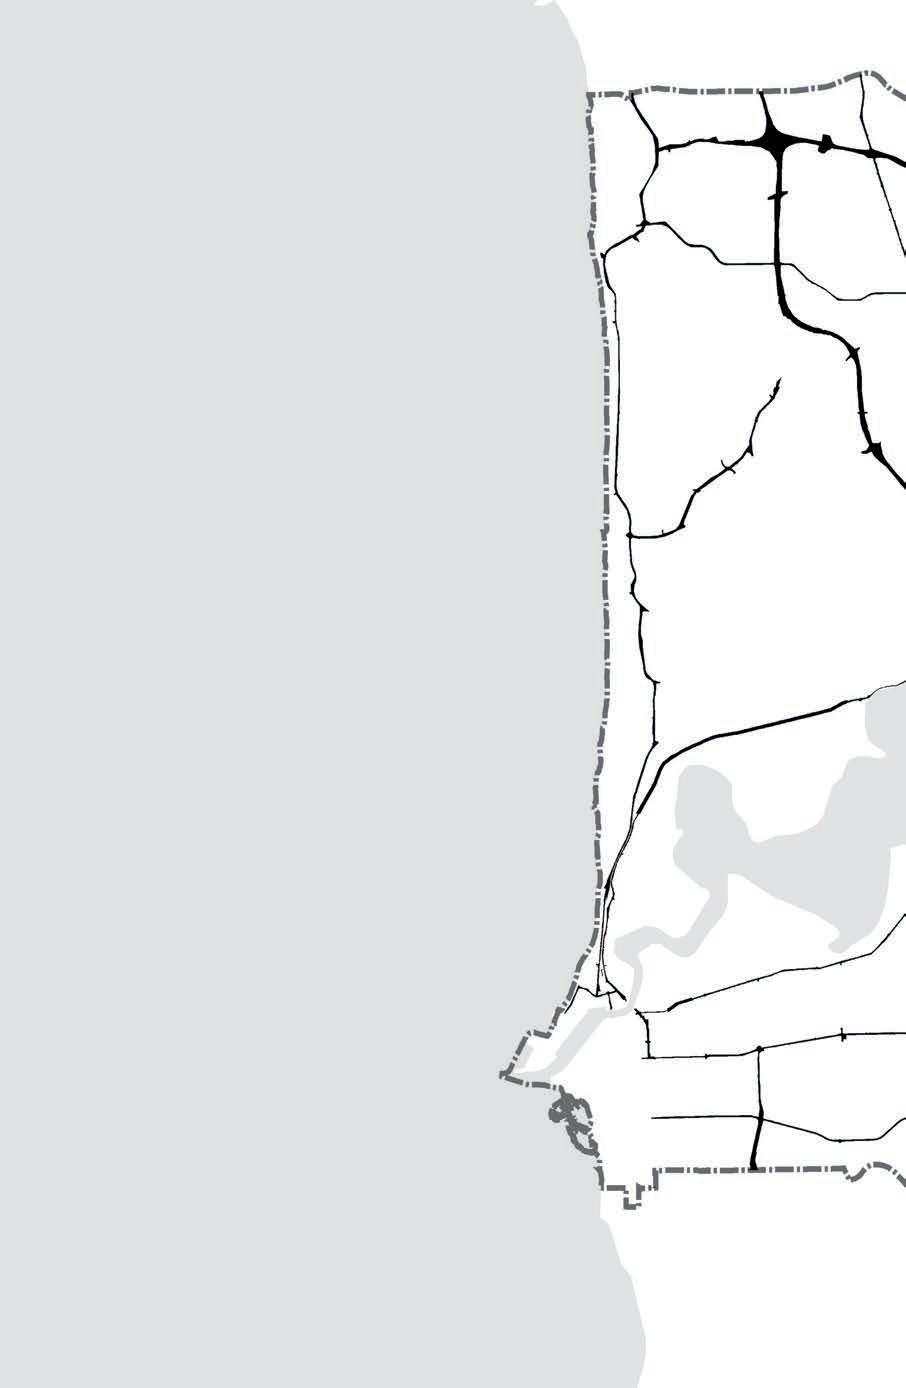
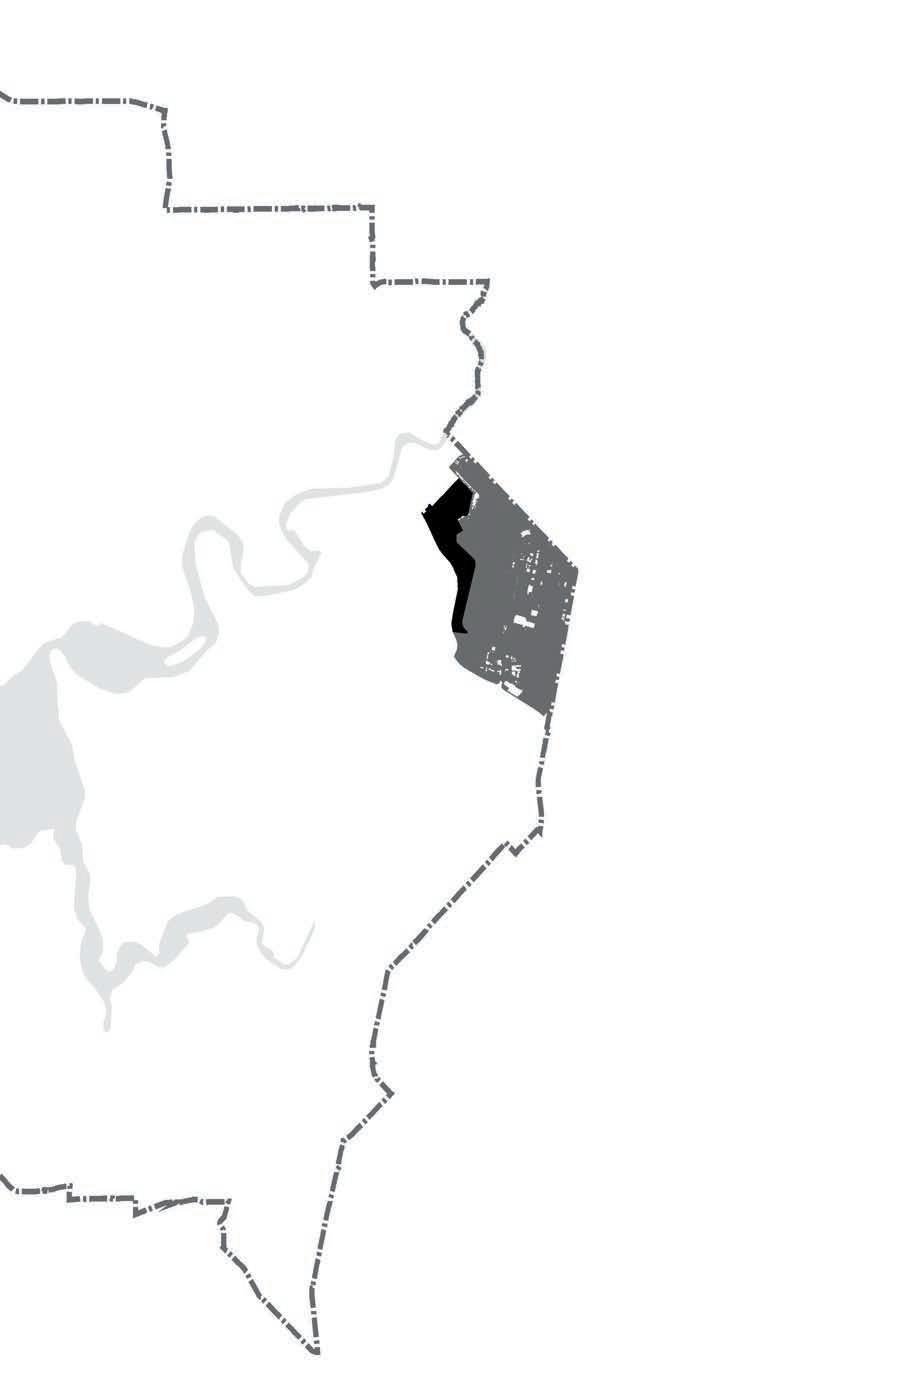
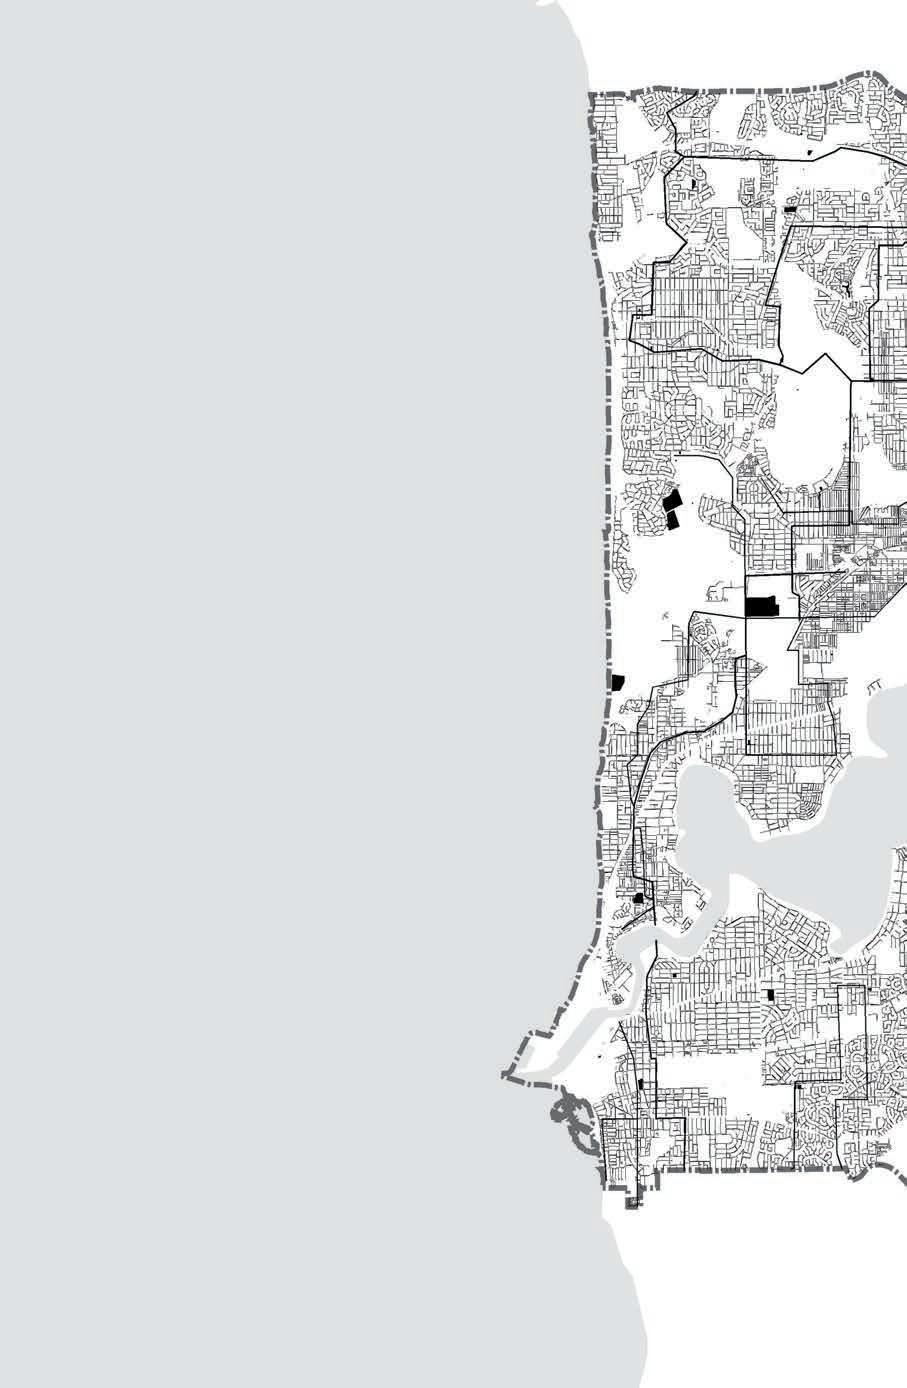
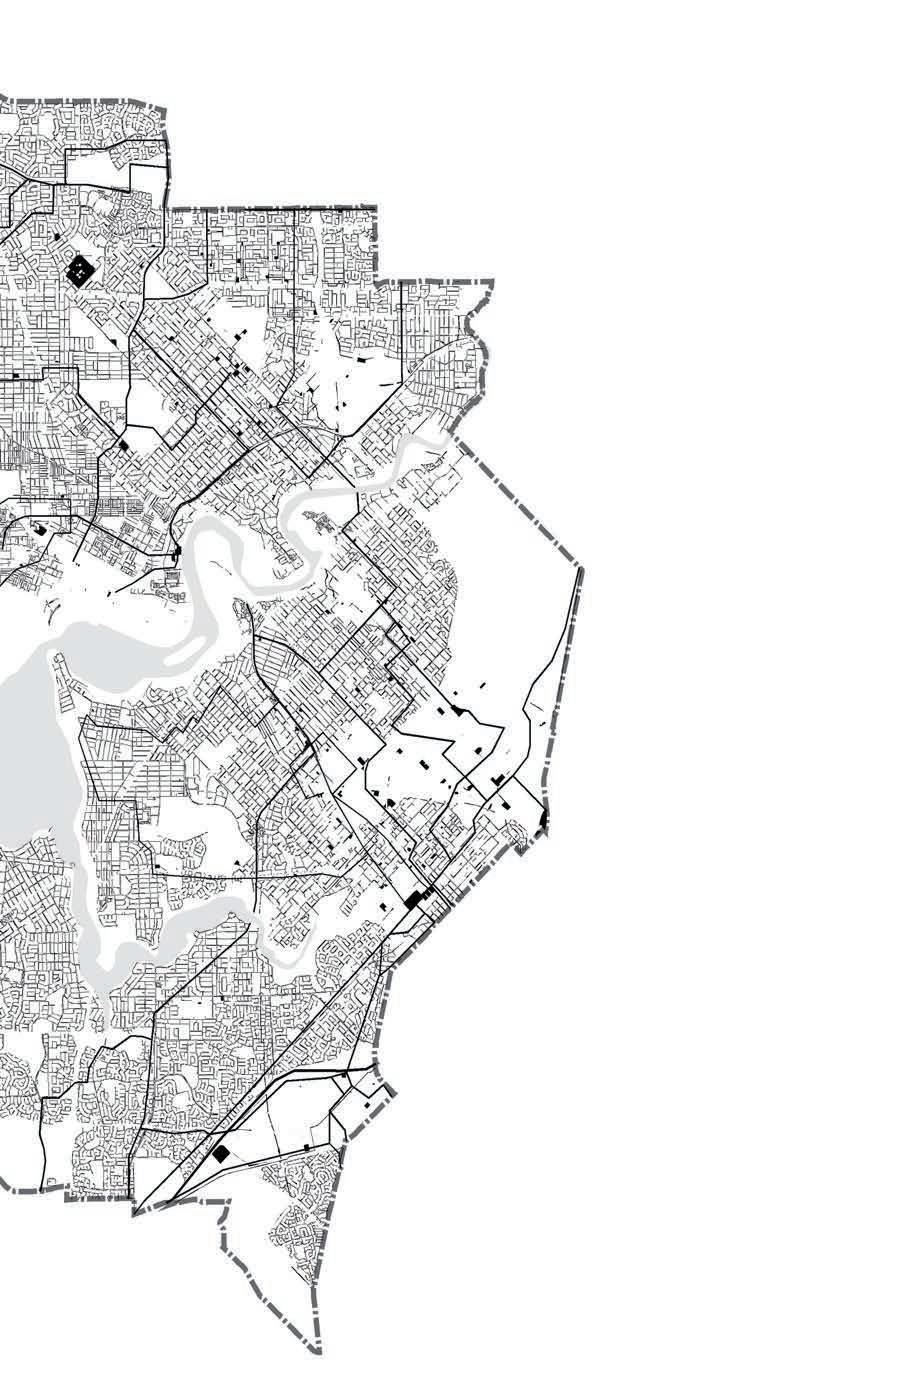
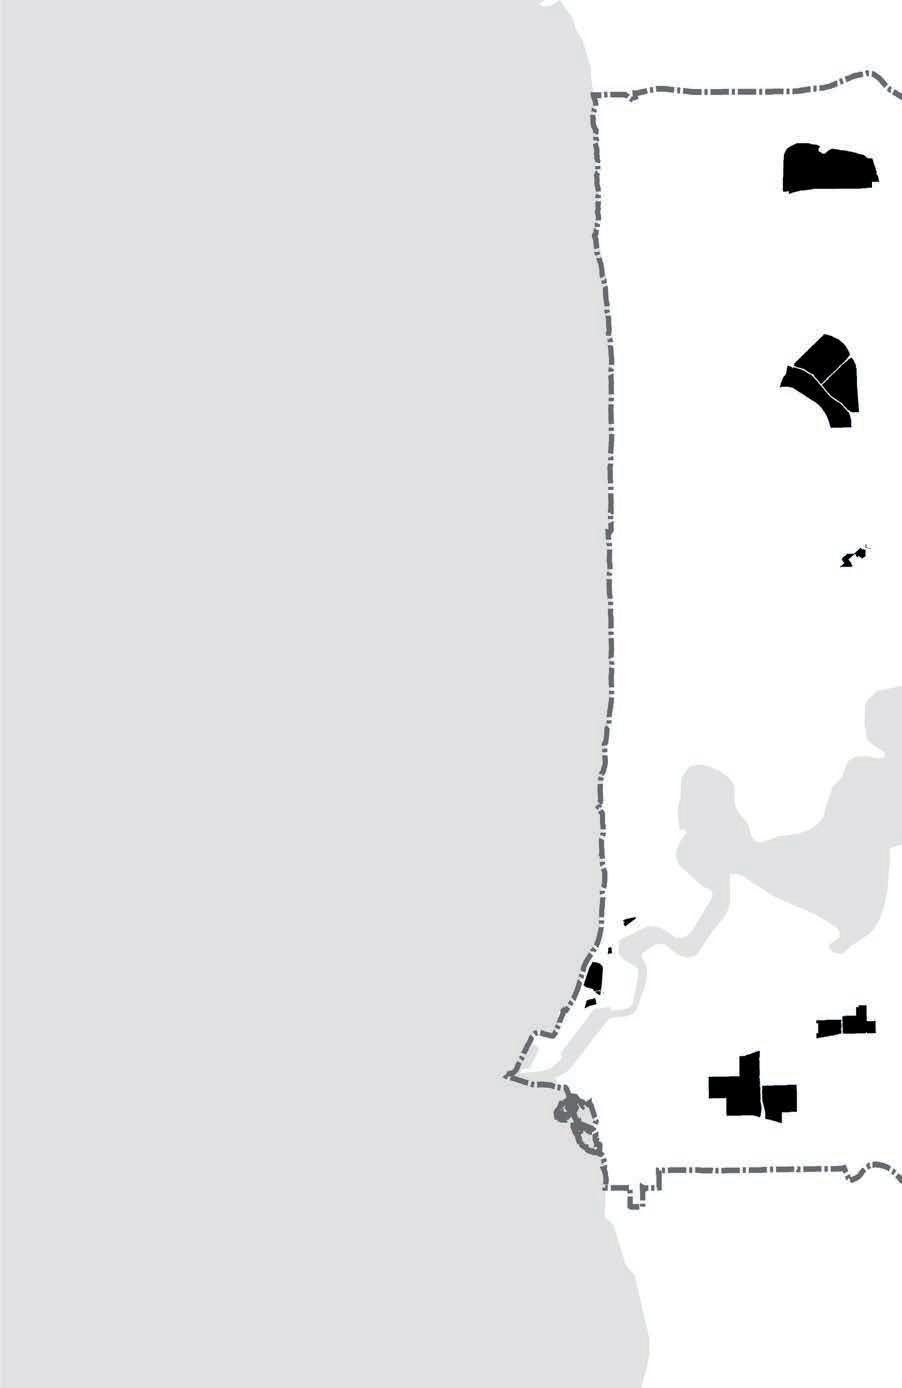
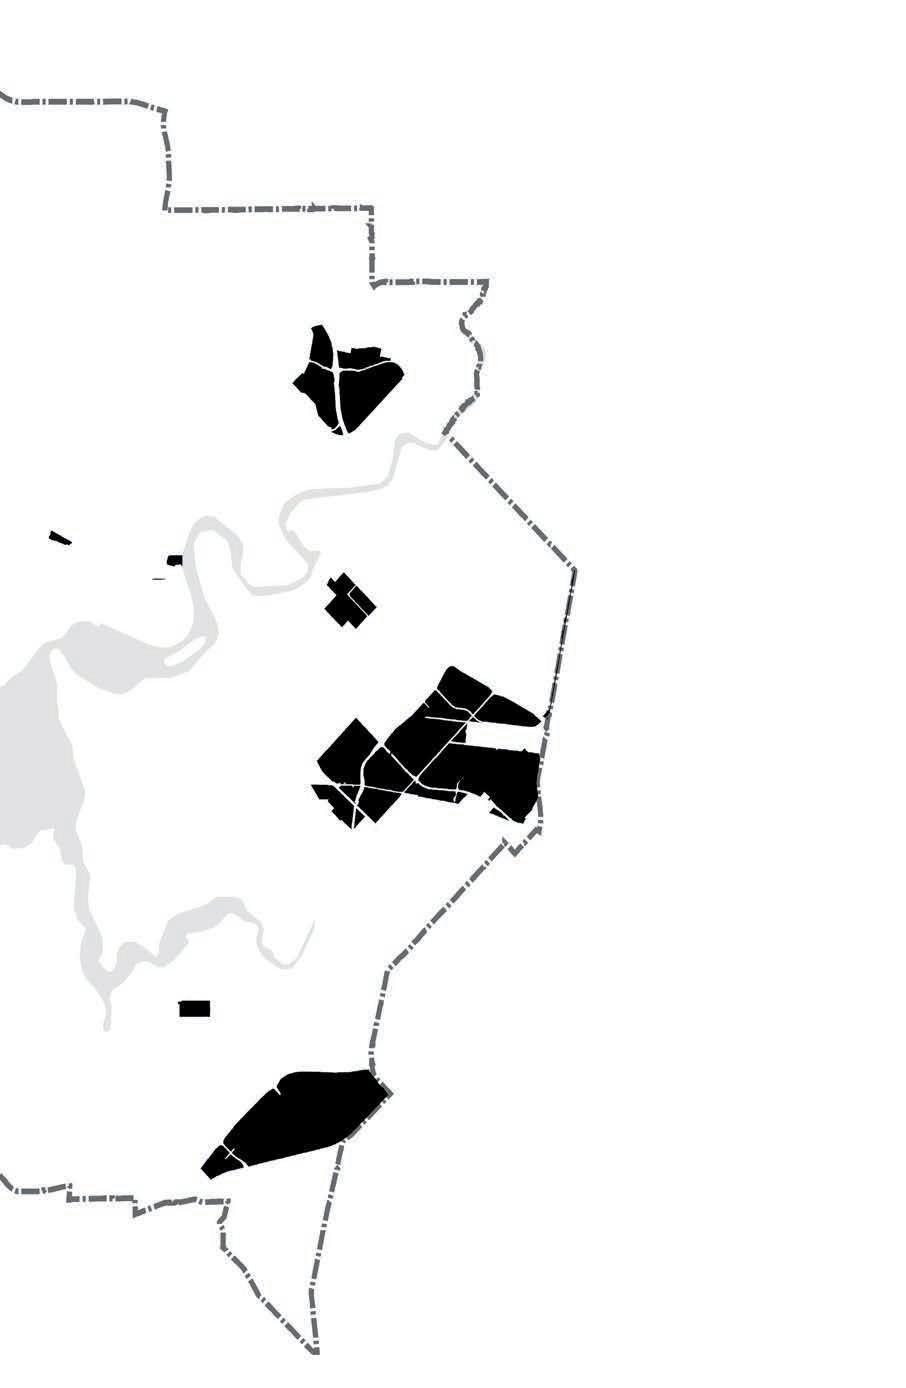
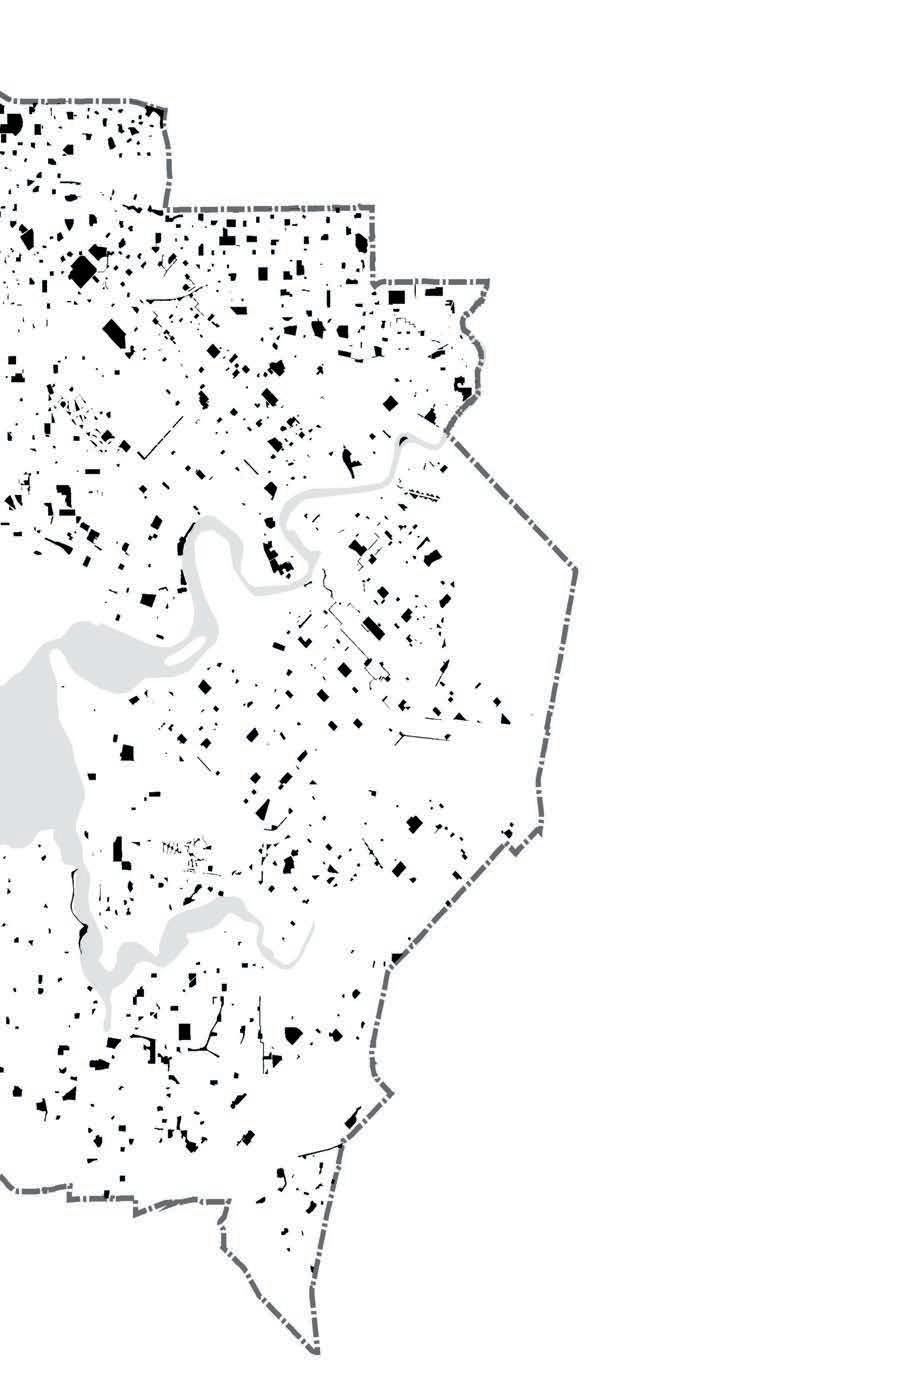
Perth’s urban footprint (shown in black) is tightly constrained by areas denoted as ‘Environmentally Sensitive’ (shown in pink) by the Department of Parks and Wildlife and areas of remnant native vegetation (shown in green). While some cleared areas do exist for suburban expansion they are typically not where people want to live, being both away from the ocean and from the freeway..

According to data from Curtin University Sustainability Policy Unit (CUSP) a new dwelling in an outer suburb requires on average 111 cubic metres of sand, per person, while a new infill dwelling, in a middle ring suburb, requires 73. Ironically for Perth, a city built on sand dunes, sand will increasingly become a factor which increasingly limits outer suburban growth this century.


According to data from CUSP outer suburban residents require much more water (70 Kilolitres per year) than those in infill dwellings in a middle ring suburb (42 Kilolitres per year). Such profligate use of water will be difficult to sustain in the context of a drying climate, and diminishing groundwater supplies.


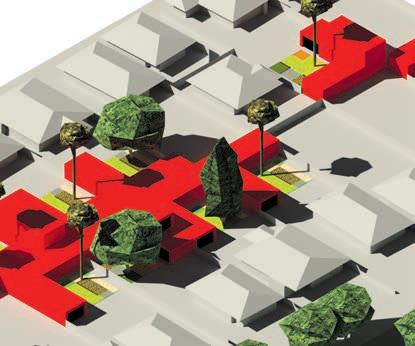
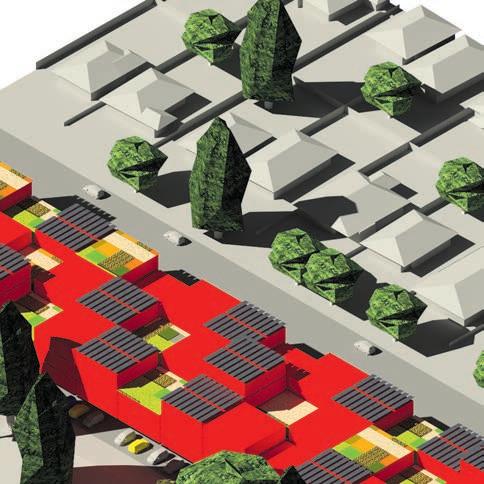
If Perth reaches its Series A ABS population projection of 6.6 million people by 2061 this could mean an increase of 1,486km2 of suburban area (shown in red). This figure presumes that infill development continues at a rate of 28% and that suburban development occurs at a net density of R15 (15 dwellings per ha), allowing for roads (20%), public open space (10%), infrastructure (15%), regional open space (10%), industry (10%), schools (1%) and universities (1%).
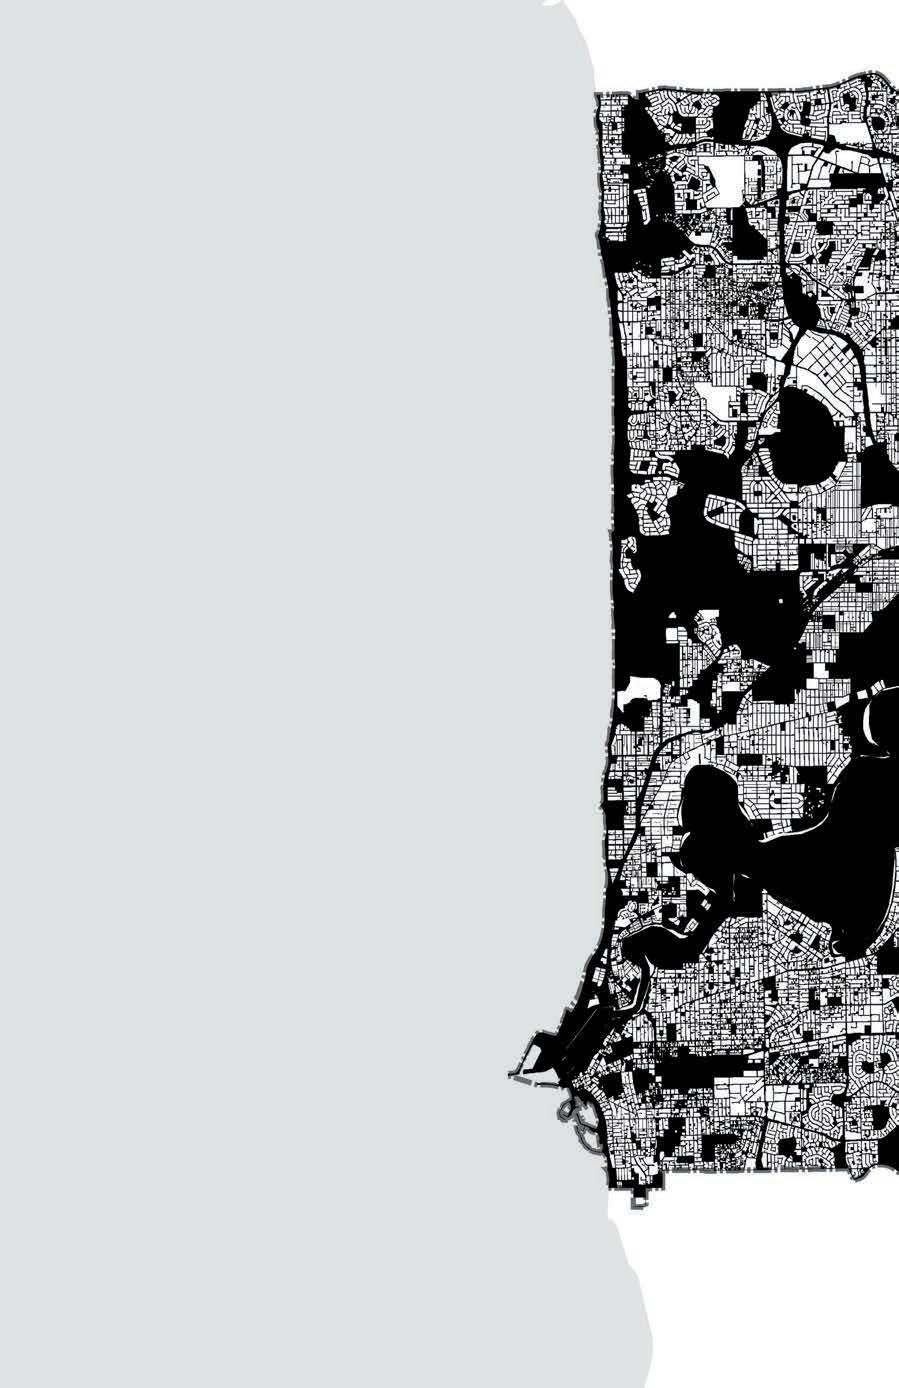
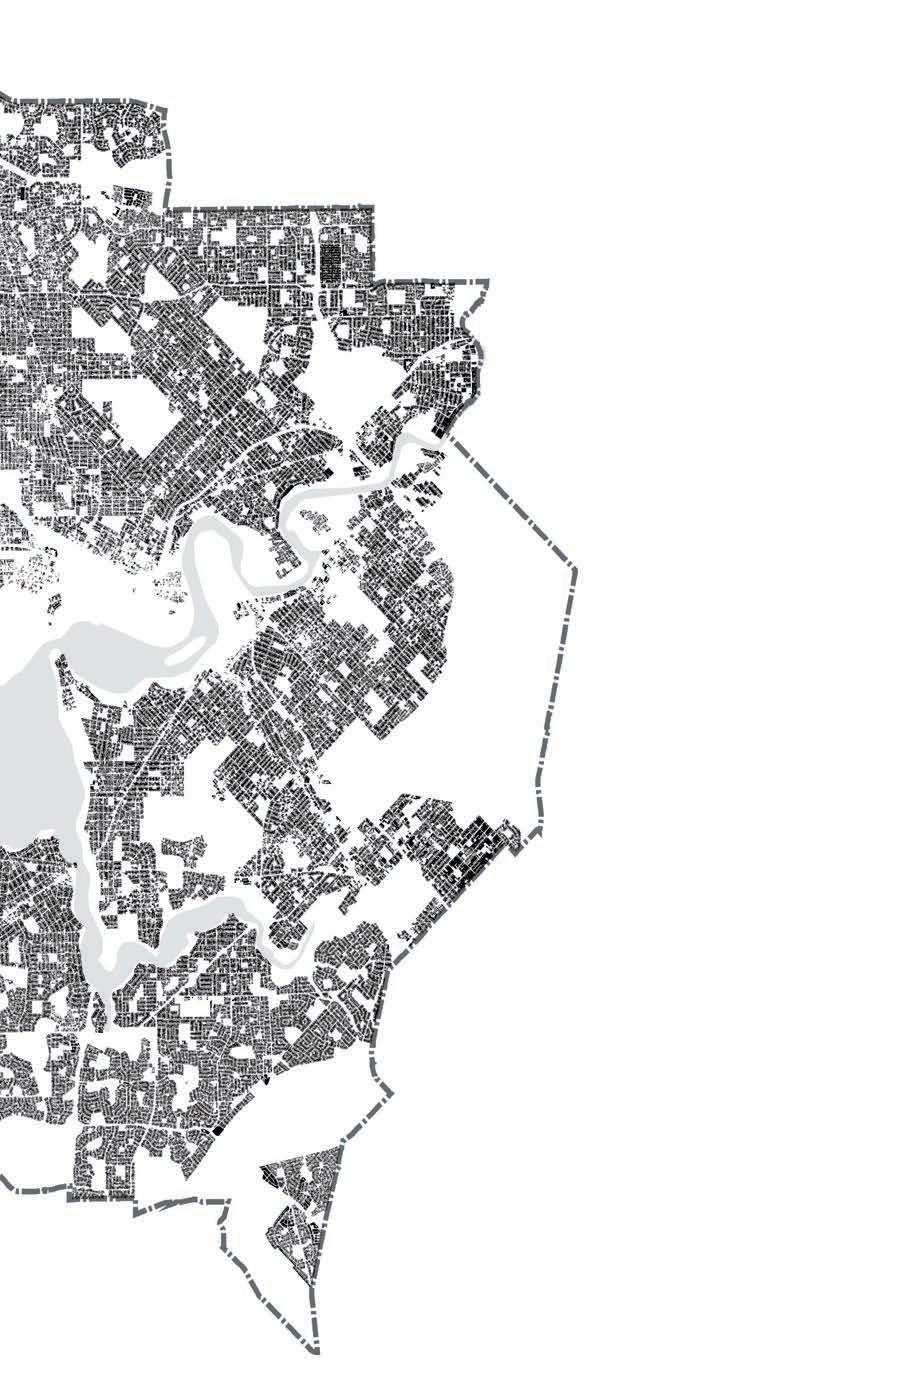
This book focuses generally on the potential of public land (shown in black) to yield infill development opportunities. Much of this land hasn’t been considered for infill development because it is controversial (owing in part to its public ownership) and/or complicated (it is the jurisdiction of government departments not concerned with urban form issues).
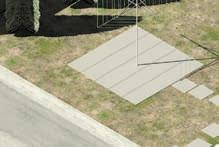
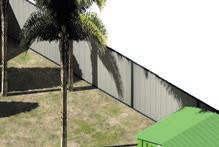
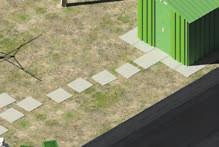
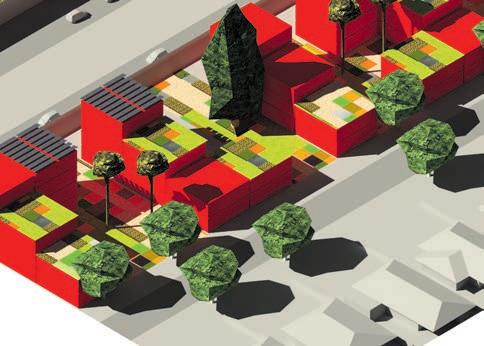
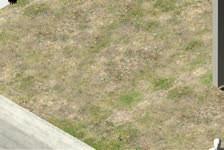
Household gardens make up the largest area of non-urbanised land in Perth’s suburban core.
Rationalising these to about half their size would still allow for gardens to contain mature trees and could yield 115,158 new dwellings.
For the first century of Perth’s growth, suburban form was attractive to English migrants because it offered a freer, more spacious life than was available in their home country. By virtue of Perth being founded after the industrial revolution that had ravaged Europe, Perth’s suburban form was a sprawled reaction to the density and overcrowding of European cities.The DNA building block of Perth’s suburban form was the classic quarter-acre block, which had a frontage of 20 metres and a depth of 50 m, creating a 1,000 m2 parcel.1 Like many of the spatial standards that underpin Perth’s suburban form, the quarter-acre block has hazy origins. In the first instance large lots sizes reflected the fact that settlers had to provide or grow much of their own food on site.2 The quarter-acre block also became a convention largely because it measured one chain by two and a half chains, the then standard measurement of distance, and was a convenient parcel to survey.3 Finally an allotment area of a quarter of an acre was regarded as the appropriate size in most soil conditions to cope with the waste flows – a requirement which was removed by the introduction of reticulated sewerage systems.4
In Perth’s first metropolitan plan, released in 1955, enshrined a preference for suburban living into zoning regulations. Its authors advocated:
1 George Seddon, “The Australian Back Yard,” in Australian Popular Culture, ed. Ian Craven (Cambridge: Cambridge University Press, 1994), 27.
2 Patrick Troy, “Saving Our Cities with Suburbs,” in Griffith Review: Dreams of Land, ed. Julianne Schultz (Brisbane: Griffith University, 2004), 117..
3 Seddon, “The Australian Back Yard.”
4 Troy, “Saving Our Cities with Suburbs,” 118..
…with comprehensive planning the cities and communities in the Metropolitan Region could grow in a spacious and orderly arrangement on either side of the broad Swan River as convenient, happy places. 5
In their estimation, suburban happiness equated to about 142 m2 of private garden space per person.6 Despite significant infill development since the 1970’s, each person within Perth’s suburban core now has on average 132 m2 of garden space, just less than Stephenson and Hepburn’s recommendation. The generosity of this figure is also borne out by comparison with the national average in new developments of 29 m2 garden area per person7 and with international figures such as the UK’s average of about 75 m2 in new developments. Despite this comparatively high figure the subdivision of Perth backyards for ad hoc infill development is causing a number of significant issues.
Firstly, ad hoc backyard infill development, which amounts to about twenty-two percent of all infill development currently occurring,8 is unevenly concentrated throughout the city. Generally areas with a lower socio-economic demographic are delivering the vast bulk of infill
5 G Stephenson and J A Hepburn, “Plan for the Metropolitan Region Perth and Fremantle 1955 Report,” (Perth: Government Printing Office 1955), 6. 6Ibid., 91.
7 Ross Elliot, “Myth # 4 Increasing House Sizes Mean Urban Sprawl,” Property Council of Australia, http://www.propertyoz.com.au/sa/Article/Resource. aspx?p=21&media=461.
8 Department of Planning and Western Australian Planning Commission, “Urban Growth Monitor: Perth Metropolitan, Peel and Greater Bunbury Regions,” (Perth: Western Australian Planning Commission, 2014), 113..
development, reflecting the fact that well organised, and wealthy suburbs in the western suburbs are able to effectively resist this form of infill. As a local developer Tony Hatt explains ‘developers don’t want to touch the golden triangle’9 it’s just too difficult. Resident groups, in wealthier suburbs, are well organized and often well connected – as another developer puts it: ‘when you take on the inner suburbs - the wealthy, well-educated suburbsyou are provoking a pretty powerful opponent. The further out you go the less opposition you have...’10 Partly as a result much (but by no means all) ad-hoc infill development has been concentrated in marginalised middle suburbs such as Balga, Medina, Bentley Midvale, Calista, Mirrabooka, Murdoch, Girrawheen, Parmelia and Koondoola- in which deprivation levels tend to be highest.11 Furthermore much of this density is occurring is generally poorly coordinatedwith public transport nodes12 (particularly train stations) leaving residents reliant on cars.
Finally this density is a problem because if it pushed ‘too hard,’ and with poorly adapted building types, it can lead to poor sustainability outcomes. In this 9 Perth’s typically wealthy western suburbs Tony Hatt, “Panel Session” (paper presented at the Density 2015, Urban Development Institute of Australia, Perth, 2015)..
10 Kim Dovey and Ian Woodcock, “Intensifying Melbourne: Trasit-Orientated Urban Design for Resilient Urban Futures,” (Melbourne: Melbourne School of Design, The University of Melbourne, 2014), 69..
11 Scott Baum, “Suburban Scars: Australian Cities and Socio-Economic Deprivation,” Griffith University Urban Research Program, no. 15 (2008): 20..
12 Jago Dodson, “In the Wrong Place at the Wrong Time? Assessing Some Planning, Transport and Housing Market Limits to Urban Consolidation Policies,” Urban Policy and Research 28, no. 4 (2010): 494..
situation suburbs lose the mature trees and understorey plantings that are crucial to a suburb’s ecological performance. The urban forest, much of which tends to be in backyards,13 supports biodiversity, sequesters carbon, infiltrates and cleans stormwater, mitigates urban heat island effects and moderates temperature extremes.14 Unfortunately backyard ad hoc infill development is steadily eating into this urban forest (in part due to the fact there are no planning provisions to protect mature trees on private land). As such this form of infill development is compromising suburban ecological performance and liveability without necessarily producing much in terms of the benefits of urbanity – such as walkability and cultural amenity.
In light of these issues, I would argue the backyards in Perth’s suburban core have the capacity to yield only a limited number of future infill dwellings. I calculate that if garden space was reduced to 75 m2 per person across the entire suburban core – a figure commensurate with the United Kingdom and still allowing for mature trees15 –then suburban backyards could yield 115,158 new dwellings at a semidetached density. Despite this being significant number it is evident that this form of infill development is unlikely to be the ‘magic bullet’ that singularly solves the problem of housing Perth’s 13 Indeed studies in a high density area of Melbourne revealed that more than 60% of tree coverage was situated in private gardens. Julie Brunner and Paul Cozens, “‘Where Have All the Trees Gone?’ Urban Consolidation and the Demise of Urban Vegetation: A Case Study from Western Australia,” Planning Practice & Research 28, no. 2 (2013): 234..
14 Ibid..
15 Mature trees are crucial to a suburb’s liveability and ecological function
growing population.
Alternative sites for infill development are urgently needed…
Area
Perth’s suburban core currently provides a generous 132m2 of household gardens per person.


The1955 Plan for the Metropolitan Region proposed that each person should have 142m2, a figure believed to roughly equate to human happiness.


 Perth 1955 (Planned)
142m2
Perth 1955 (Planned)
142m2
In the UK new residential subdivisions provide on average 75m2 of garden space per person.


In Australia new residential subdivisions provide on average 29m2 of garden space per person. Perth suburban core 2015


Australia new subdivisions


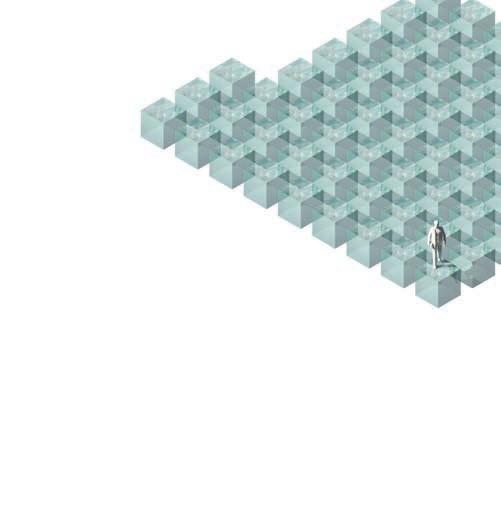
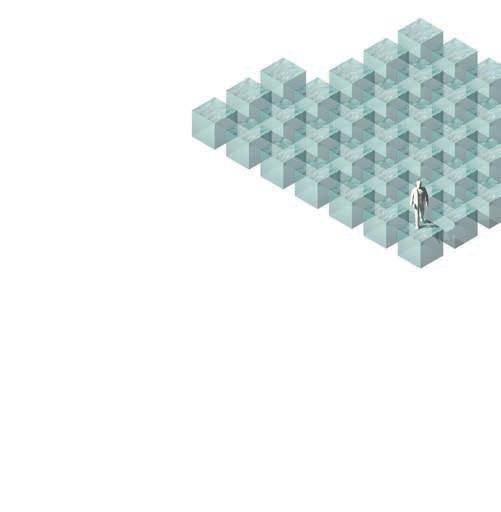
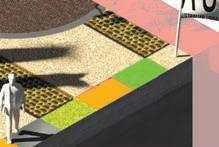
If household gardens in Perth’s suburban core were rationalised from the existing 132m2 per person to 75m2 per person (as per new UK residential subdivisions ), this could yield 115,158 new infill dwellings at a semi-detached density (based on the overall rationalised garden space being reduced by 30% to allow for inefficient land parcels and development at net density of R40). This could avoid the need for a new suburb on the urban fringe 12.1 times the size of Ellenbrook, which has about 9,460 residential dwellings.


X 115,158 yeilded


X 12.1 avoided
 Ellenbrook
Infill dwelling
Ellenbrook
Infill dwelling
Backyard infill development is unlikely to be the magic-bullet which singularly solves the problem of housing Perth’s growing population to 2061, and beyond. Indeed if we push backyard subdivision ‘too hard,’ and with poorly adapted building types it can be a problem onto itself. In this situation our suburbs lose the vegetation and spaciousness which is crucial to a suburb’s ecological performance and liveability without necessarily producing any of the benefits of urbanity – such as walkability and cultural amenity.
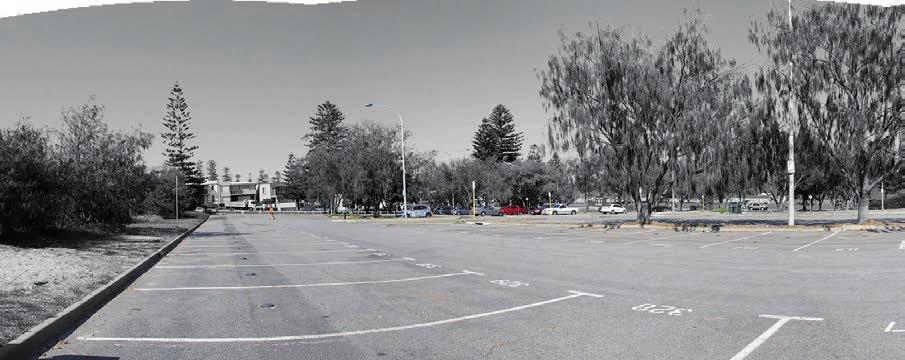
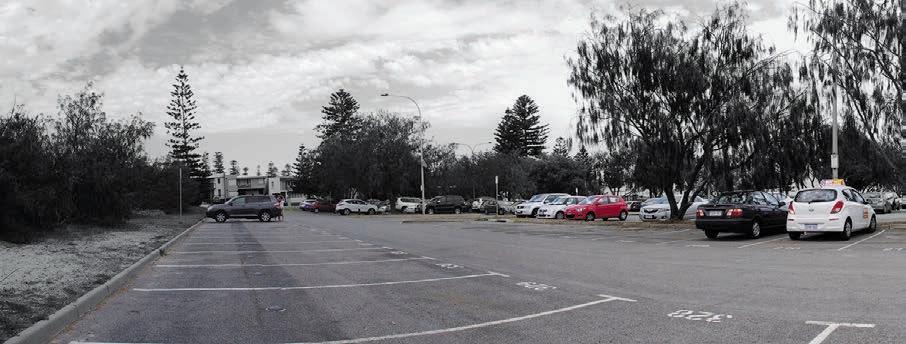
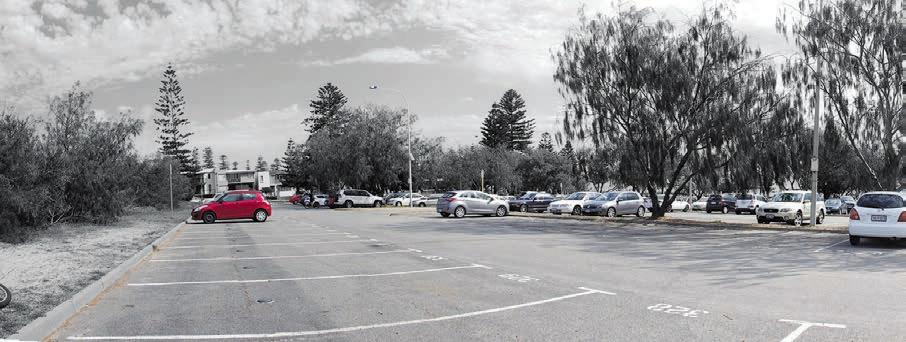
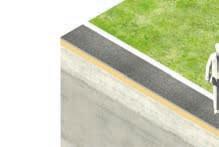
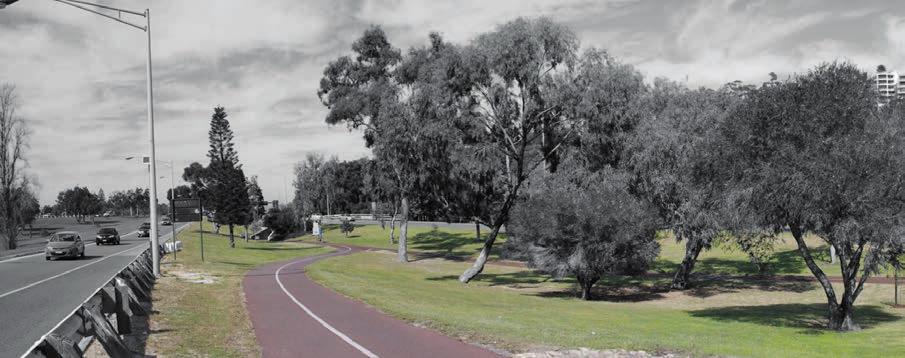
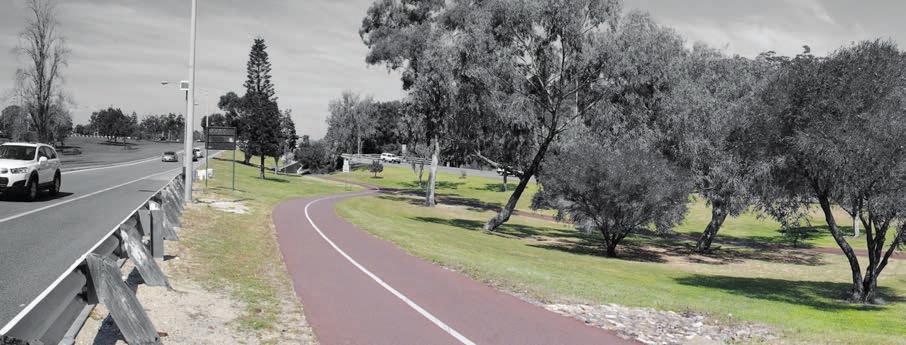
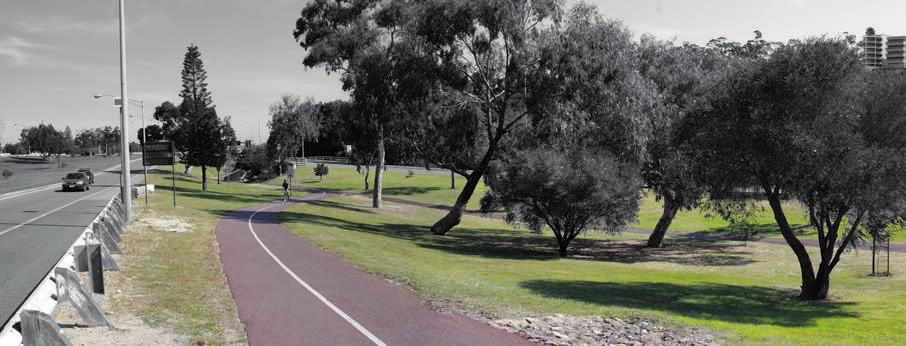
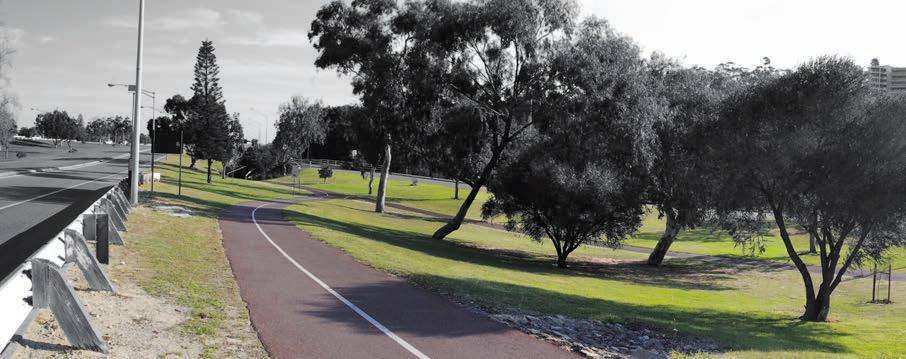
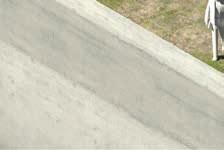
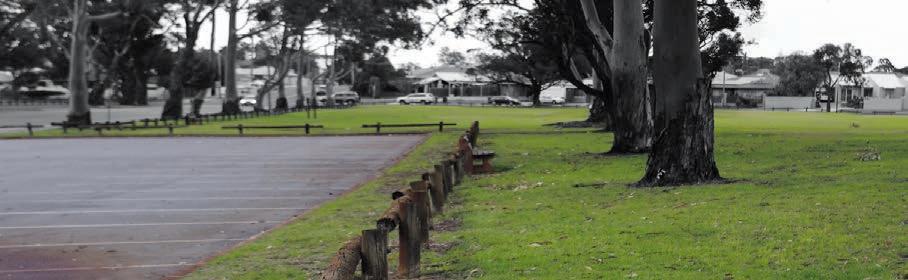
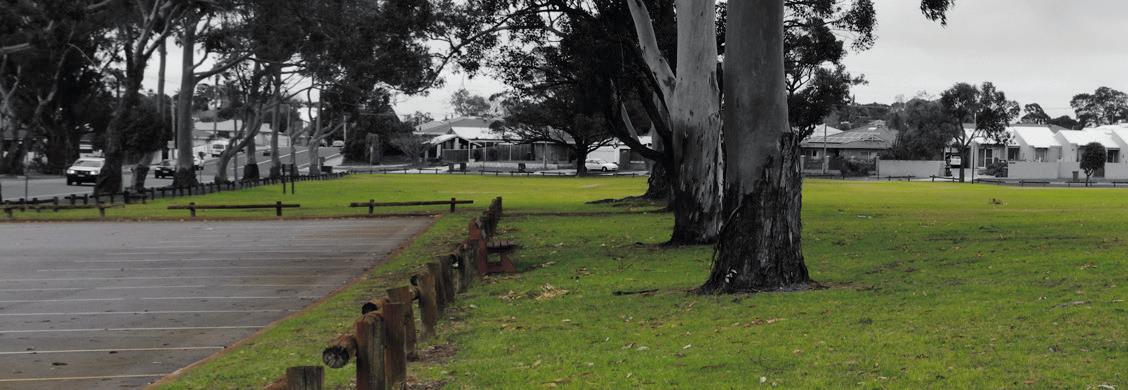
Perth’s suburban core contains a vast area of asphalt bound up in roads and carparks.
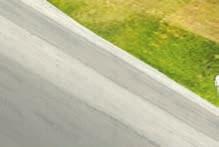
Perth’s suburban core has almost thirteen per cent of its land area swathed in asphalt in the form of major roads, local roads, laneways and carparks. This amounts to some 78 m2 per resident, a generous figure when compared with 69 m2 per resident in Melbourne’s suburban core and only 9 m2 in Manhattan, reflecting Manhattan’s considerable urban density and better public transport system, requiring fewer roads. Historical standards have led to this situation. By the mid-twentieth century Perth had a ratio of fatal accidents on the road higher than in other Australian capital cities; economic losses due to road accidents was estimated to be above £1 million (over $30 million in today’s terms).1 In response to this high rate of accidents, and for ease of movement, it was proposed that local roads have a single carriageway no less than 4.8 m wide and that larger roads carrying buses have a carriageway no less than 7.3 m wide. The net result, after these standards were replicated across the 5,200 kilometres of roads in Perth’s suburban core, was an abundance of asphalt.
While there has been a move in recent times towards ‘skinny streets’ in Perth it is unlikely that the reduction of road surface will lead to infill development opportunities. There are, however, many opportunities for infill development over Perth’s 2,300 ha of private and public ground-level carparks. With ‘peak car’2
1 G Stephenson and J A Hepburn, “Plan for the Metropolitan Region Perth and Fremantle 1955 Report,” (Perth: Government Printing Office 1955), 12. 2 Peter Newman and Jeff Kenworthy, “Peak Car Use: Understanding the Demise of Automobile Dependence,” World Transport Policy & Practice 17, no. 2 (2011): 31.
(the projected decline of motor vehicle distance travelled per capita), automated cars (which can be parked remotely elsewhere) and car-share initiatives, perhaps some carparks could be rationalised to yield infill dwellings. Most likely, where carparks exist on high-value land (such as the ~233 carparks near the coast, river or train stations3) economics may allow multistorey apartments to be developed, with the publicly accessible carparks retained underneath. While such built form would not be able to provide parking for residents this situation could be acceptable for younger generations who are valuing cars less because they are costly and limit their flexibility, choices and autonomy4 – and particularly where carparks are near public transport.5 If fifty per cent of the carparks in Perth’s suburban core were developed in this manner (as mid-rise apartments) they could yield 230,332 new dwellings.
3 As local developer Paul Lakey said at a recent density forum in Perth ‘All the wasted opportunity around train stations in Perth is really quite amazing…’ Paul Lakey, “Panel Session” (paper presented at the Density 2015, Urban Development Institute of Australia, Perth, 2015).
4 Rod McCrea and Peter Walters, “Impacts of Urban Consolidation on Urban Liveability: Comparing an Inner and Outer Suburb in Brisbane, Australia,” Housing, Theory and Society 29, no. 2 (2012): 200..
5 The requirements for car parking are in part dictated by banks who often won’t lend you money for the purchase of dwellings with no parking – the presumption being the next person who you will sell to will probably want to have a car. Simon Moore, “Panel Session” (paper presented at the Density 2015, Urban Development Institute of Australia, Perth, 2015).
Area = 6259 ha or 12.8% of the suburban core area.
Black dots indicate foreshore and trainstation carparks
Each resident in Perth’s suburban core has an average of 78m2 of asphalt.


Due to Manhattan’s considerable density each person has only 9m2 of asphalt.


Developing 50% of the area of ground-level car parking in Perth’s suburban core to low-rise apartment density would hypothetically reduce the area of asphalt per person to 64m2 yet potentially yield 230,332 new dwellings (assuming development at a net density of R200). This could avoid the need for a new suburb 24.3 times the size of Ellenbrook on the urban fringe.


Infill dwelling
X 203,332 yeilded

Existingcarpark
Existingdwellings
X 24.3 avoided
 Ellenbrook
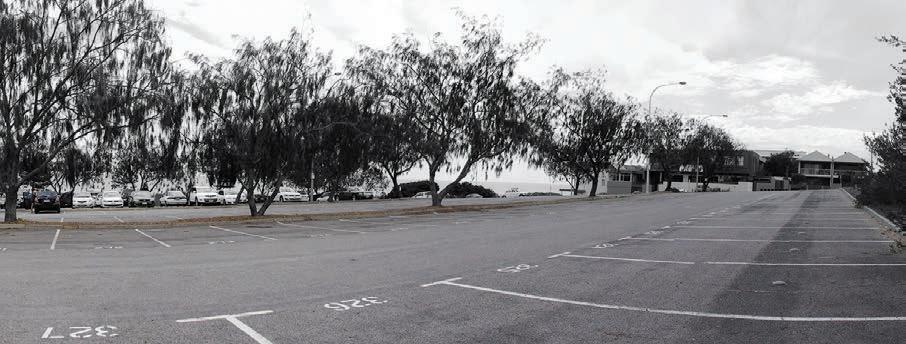
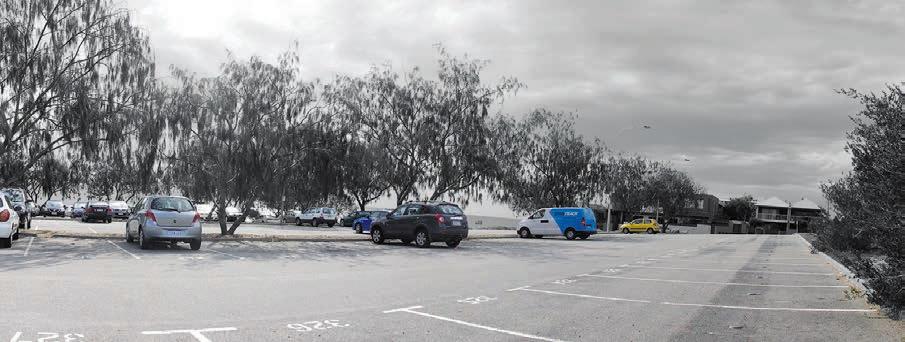
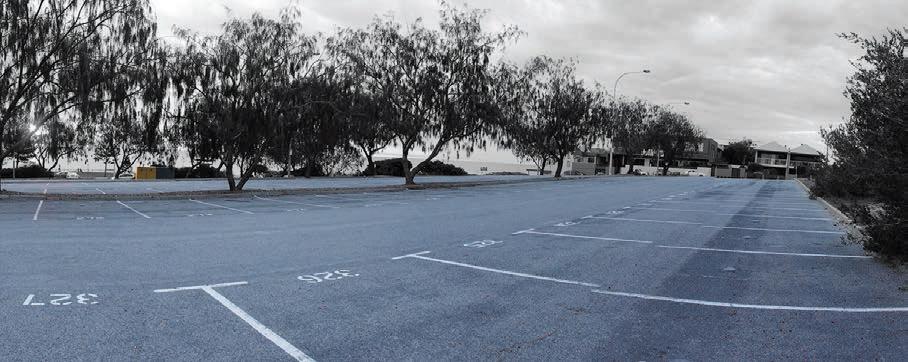
Coastal car park, time-lapse photography
Such ‘air rights’ above such carparks could be sold to yield large numbers of infill dwellings while public owned carparks are retained underneath.
0500-0600
0800-0900
1400-1500
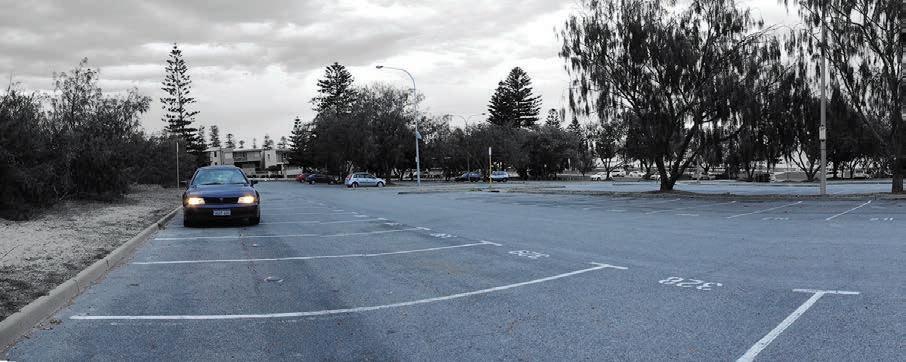
1700-1800
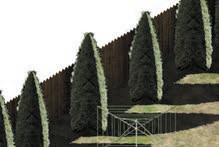
Courtesy of a mid-twentieth century vision of parkways – literally a road within a park – Perth’s freeways take up an enormous amount of land that could be partly directed towards infill development.
Landscaped freeway (and highway) reserves in Perth’s suburban core amount to 1,633 ha, which equates to 20 m2 per resident in Perth’s suburban core – just less than the ‘car loving’ city of Canberra, which provides 23 m2. Freeways in the latter half of the twentieth century were a prized feature of a modern city. This was particularly the case for an insecure city like Perth, which craved to be modern and to keep pace with its eastern state counterparts. This zeal for freeways in Perth resulted in extreme proposals such as the Main Roads Department 1960’s scheme for a freeway encircling (or strangling) the city centre that prioritised the rapid movement of cars over all other experiences of the city and its landscape. This philosophy is well summed up by the City of Perth’s motto of the time: ‘Your car is as welcome as you are’.
As with the city’s roads more generally, the development of freeways in Perth was also partly a response to terrible road accident data. In 1952 twentyeight people per 100,000 were being killed in traffic accidents, 150 per cent more than even Sydney, which was –and still is – known for its congested and chaotic road network.1 Following on from the deployment of the autobahn in Germany and the extensive motorway system in Britain, it was proposed that Perth also needed freeways if road transit was to be ‘accomplished without unnecessary waste of time or undue risk of accident’.2 Cutting a freeway off from the hindrances of adjoining roads and
1 G Stephenson and J A Hepburn, “Plan for the Metropolitan Region Perth and Fremantle 1955 Report,” (Perth: Government Printing Office 1955), 111.
2 Ibid., 108.
residential areas tended to create large areas of leftover land on either side of the freeway. Perth’s freeways also tend to take up a lot of space because they were also originally conceived as scenic parkways (literally roads within parks) that would connect major elements in Perth’s open space system.3
Given the generosity of space surrounding Perth’s freeways, they hold a reasonable potential to yield infill dwellings. A cursory examination indicates that only roughly twenty per cent of the freeway reserve area is wide enough to make development feasible. If this area was developed as medium-rise apartments, with appropriate noise mitigation, 48,990 new dwellings could be created. Sites for redevelopment would be, as much as possible, in areas of otherwise high amenity, such as adjacent to the city and river in the Freeway Interchange. While apartments in proximity to freeways might not appeal to everyone, they could suit those who prefer to live near such amenity and are willing to trade off freeway living. Indeed with the projected shift to electric vehicles some of the emission and engine noise issues associated with freeways will presumably be alleviated. While we tend to see our freeways as merely conduits for movement, the example of the Ronda de Dalt freeway in Barcelona illustrates how a freeway can be woven into the urban fabric of the city, providing for transport, housing and recreation.
3 Ibid., 109.
Freeway reserves - Perth 2015
Area = 1633 Ha or 3% of the the suburban core area 3.3%
In part due to a vision of Perth’s freeways as a road within a park the area of freeway reserves in Perth’s suburban core amounts to generous 20m2 per resident.


Freeway reserves, Canberra 2015
Canberra, which is widely known for its love affair with the car, provides 23m2 of freeways per person, just more than Perth.


The area of freeway reserves in Perth’s suburban core amounts to 20m2 per person. Reducing this area to 16m2 (by 20%) could yield 48,990 new dwellings at a medium-rise apartment density (assuming that 20% of the total freeway reserve area is developed at R200 with an allowance of 15% for internal roads and 10% for public open space). This could avoid the need for a new suburb 5.2 times the size of Ellenbrook on the urban fringe.


Infilldwellings
X 48,990 yeilded X 5.2 avoided
Existingdwellings

Freeway interchange, time-lapse photography
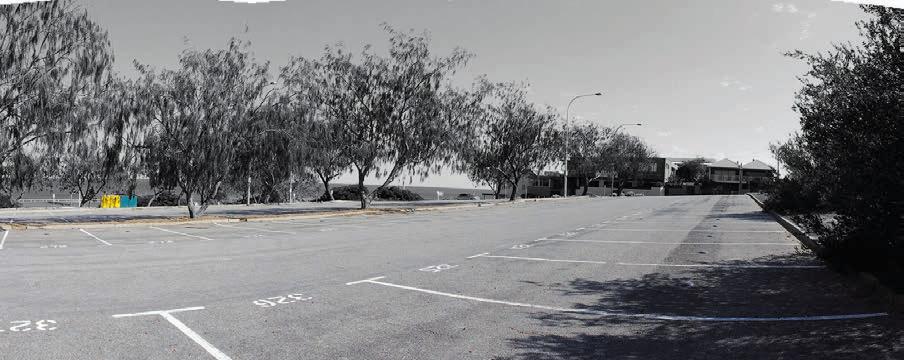
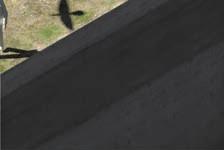
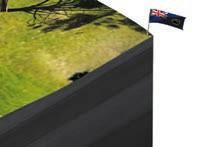
White squares in the photos indicate visible humans or animals.
0800-0900 (People=0, dogs=0)
1100-1200 (People=0, dogs=0)
1400-1500 (People=2, dogs=0)
1700-1800 (People=0, dogs=0)
With the exception of the highprofile ‘Perth City Link’ project, railway reserves have been rarely considered from an infill development perspective…
Perth’s railway system has historically been both a ‘structural spine of the metropolis’1 and a barrier dividing the city centre from the suburbs to the north. In response to this latter situation there have been numerous plans to integrate the railway into Perth’s urban fabric. In 1911 architect William Hardwick proposed to remove the Perth railway yards and sink the Fremantle–Midland line west of Perth Station and convert the land above into a turfed mall, punctuated with grand civic buildings. This unbuilt scheme was reconstituted by local advocacy group CityVision in 2007, which proposed a park over the railway line in the same area. Finally, the ‘Perth City Link’ project, now under construction, has seen the railway line sunk and a substantial urban district is taking shape above.
In total, rail reserves take up 807 ha of land in Perth’s suburban core. Much of this land swathes the twin-track railway lines of the Midland, Fremantle and Armadale lines. While these twin-track railway lines sit within a typically 45 m wide railway reserve, accepted standards indicate they only require a width of 15 m.2 If the remaining area, (comprised of ~15 m wide sites on either side of the lines) were developed at a medium-rise apartment density this area could yield 11,909 infill dwellings. While this proposal is spatially possible, many people would be hesitant about living in such an environment. Certainly the urban development of rail reserves
1 G Stephenson and J A Hepburn, “Plan for the Metropolitan Region Perth and Fremantle 1955 Report,” (Perth: Government Printing Office 1955), 5.
2 Parsons Brinckerhoff, “Corridor Public Transport Use Assessment,” (Sydney: Department of Infrastructure, Planning and Natural Resources Roads and Traffic Authority, New South Wales, 2004), 63.
would need to be accompanied with emerging noise mitigation strategies such as the use of composite break blocks (rather than cast iron), noise absorbers on rails and improved sound insulation of the dwellings. Other railway sites with potential are those formed where the railway reserve opens out into depots and freight yards. Two examples are the ‘Leighton Freight Yard’, which is disused and ripe for redevelopment given its stunning ocean views and the Claisebrook railway depot to the east of Perth. The Claisebrook railway depot is used for storing and maintaining passenger railcars, functions that are better suited to a peripheral location. In total, if both these sites could be redeveloped they could yield 3,964 new infill dwellings in high-amenity and accessible locations.
Finally, another option for achieving infill development in the rail reserve is to build over it. Perth City Link has set a precedent in Perth for sinking the railway line and building above; however, it is unlikely that the economics of this solution will stack up in areas further from the city centre, at least in the near future.
Railway reserves, Perth 2015
Area = 807 ha or 1.6% of the suburban core area.
 Claisebrook railway depot
Perth’s suburban core has 46m2 of rail reserve per daily passenger. If the Leighton freight yard and the Claisebrook railway depot were redeveloped and appropriate railway reserves sleeved with medium rise apartments the area of rail reserve per passenger would be reduced to 42m2. In turn this could yeild 15,873 infill dwellings (assuming development at a net density of R200) and avoid the need for a new suburb 1.7 times the size of Ellenbrook on the urban fringe.


Airport owners are confronting challenging business conditions. In response a large number are expanding their income sources through property developments within the airport, transforming them into airport cities.
Airports around the world are in substantial transition. In response to a challenging business environment many airport operators are diversifying their revenue streams through landside property developments within the airport boundary.1 At its extreme this phenomenon is recognised as the development of an ‘airport city’, which typically consists of an airport surrounded by clusters of aviation- and non-aviation-linked businesses and associated residential development.2 To similar ends, Australia’s major airports are developing master plans to diversify the functions they offer, proposing that an average thirty per cent of their total airport area is given over to landside development. Perth’s international airport is no exception.
Located 10 km from the city centre, Perth airport occupies some 2,105 ha, the equivalent of 933 m2 of land per daily passenger. Compare this with Adelaide airport, which manages a slightly smaller number of passengers with 449 m2 per daily passenger. Of Perth airport’s substantial area, fifty-three per cent is dedicated for airport and airside functions, thirty-three per cent for commercial and industrial functions, and fourteen per cent for conservation areas. Significantly there is no provision for residential development. This mirrors other major Australian airports except for Alice Springs, which has eleven per cent of the airport area zoned for residential
1 Landside development refers to non-directly aviation-related development. Arron Walker and Nicholas Stevens, “Airport City Developments in Australia: Land Use Classification and Analyses” (paper presented at the 10th TRAIL Congress and Knowledge Market, Rotterdam, The Netherlands, 15.09 2008).
2 John Kasarda, “About the Aerotropolis,” Aerotropolis, http://www.aerotropolis.com/airportCities/ about-the-aerotropolis.
development.3 With the imminent relocation of Perth’s domestic terminal a significant area will be freed up for possible residential development. Given this site is less than 1 km from the Swan River and will soon have a rail station, I believe this area could accommodate some appropriately designed residential infill dwellings. Indeed such areas will become increasingly suitable for residential dwellings as airport noise impacts are projected to be reduced by twenty percent due to the imminent introduction of quieter flight paths and a new generation of super quiet Boeing 787s.4
Nonetheless living next to an airport will not suit everyone, but for airport workers and frequent air travellers5 ease of access to the airport, river and public transport would have some appeal. The existing commercial zoning of this area allows for uses such as childcare premises, health centres, places of worship, restaurants and serviced apartments,6 so longer term residential development is not unreasonable. If this 142 ha area was developed as low-rise apartments, some 13,450 dwellings could be created, a step towards a real Perth ‘aerotropolis’.
3 Walker and Stevens, “Airport City Developments in Australia: Land Use Classification and Analyses,” 9.
4 Geoffrey Thomas, “Quiet Glide to Solve Airport Noise,” Yahoo! 7 News, https://au.news.yahoo. com/thewest/a/27875488/quiet-glide-to-solve-airportnoise/.
5 .Kasarda, “About the Aerotropolis”.
6 Perth Airport, “Perth Airport Preliminary Draft Master Plan 2014,” (Perth: Perth Airport, 2014), 109.
Area = 2,039 ha or 4% of the suburban core area
Area freed up by domestic terminal relocation
Per daily passenger Perth airport has 933m2 of land.


Per daily passenger Adelaide airport has 449m2 of land.


 Adelaide airport
Perth airport
449m2
Adelaide airport
Perth airport
449m2
If the commercial zoned land freed up by the relocation of the domestic terminal was developed with residential low-rise apartments, 8,559 new dwellings could be created (assuming development at a net density of R80 and allowing 15% area for roads and 10% for public open space). This could avoid the need for a new suburb 0.9 times the size of Ellenbrook on the urban fringe.


Trainstation = Ellenbrook
Infill dwelling X 8,559 yeilded X 0.9 avoided Infilldwellings

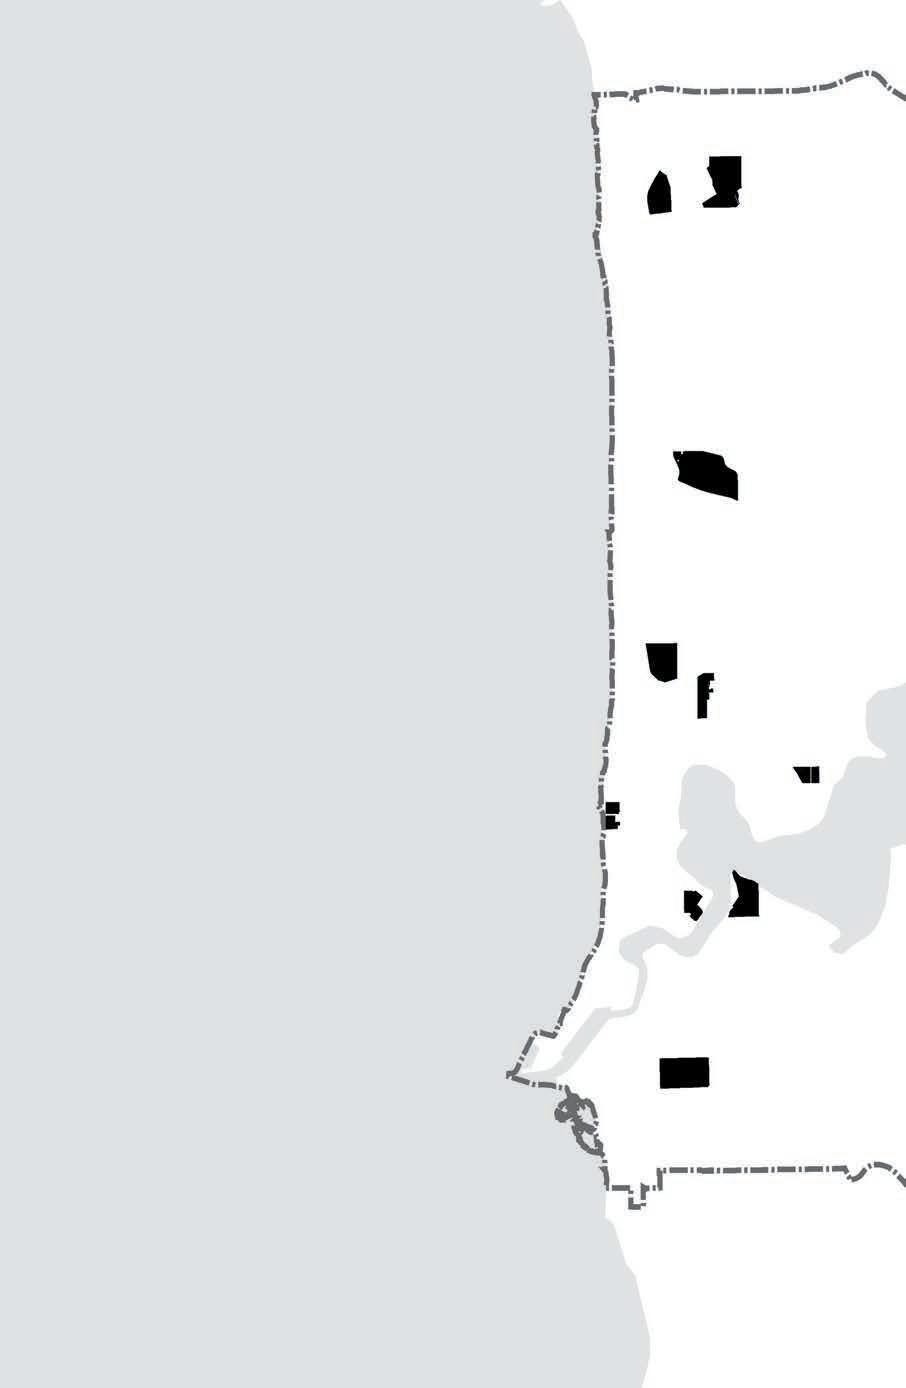
The second-largest area of nonurbanised land in Perth’s suburban core comprises infrastructural easements. This land has rarely been considered for infill development due to the complexities entailed but also because it is outside our day-to-day experience of the city.
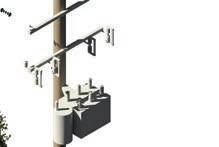
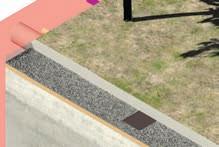
In part due to its sprawling form, Perth’s suburban core has a substantial fifteen per cent of its land area dedicated to infrastructure. This consists of easements swathing the Dampier to Busselton gas pipeline and around high-voltage powerlines, as well as the land bound up in sewerage pump stations, waste-water treatment plants, reservoirs, electrical substations and stormwater drains. At a micro level, suburban verges – which form an ambiguous ‘no man’s land’ between roads and private lots – are often riddled with horizontally laid gas, water, stormwater, telecommunications and sewerage pipes.1 Reflecting this, the amount of land dedicated to infrastructure in Perth’s suburban core is a generous 89 m2 per resident. If this figure is surprising it is because we tend to not see these ‘leftover’ infrastructural landscapes: they are outside our day-to-day experience of the city and its buildings, streets and parks.
Consequently, infrastructural land in Perth, despite its large area, has not typically been considered for its infill development potential. But this is also due to more pragmatic issues such as the complexity of infrastructural systems and the bureaucracies responsible for them, making infrastructural land terribly encumbered for a potential developer. There may be strategies to alleviate this situation, however. Much of the total area of infrastructural land in Perth’s suburban core is bound up in verges – some 56 m2 per person. Service providers require access to the services
1 Not all verges have services running beneath them, but due to the complexities of mapping the location of all existing services, I have included all verges in the calculation.
under verges, so it is unlikely these areas will become sites for permanent dwellings. But if the 2–3 m strip of verge land that lies next to private residential lots (which is typically free of services) could be sold to adjacent homeowners, this expanded front setback area2 could be large enough to accommodate a twenty-first century granny flat.3 If only one in four verge fringes in suburban residential areas were partly sold and the front setback areas developed in this way, 94,475 new dwellings within Perth’s suburban core could be created.4
While backyard subdivision has become the norm, front-yard subdivision has many advantages, including that it is easier to both build and service. A question remains, of course, whether homeowners will embrace the idea of someone living in the front garden – a space that is typically about public display (in other words, showing off to the neighbours). All the same, I contend that if landowners can benefit financially from such a proposal they just might consider it.
2 The garden area between the front of the house and the edge of the verge.
3 I am indebted to William Grace for this idea.
4 This figure assumes that three in four streetscapes will not be suitable due to inadequate front garden areas, street profiles, incompatible neighbourhood character and constraints relating to buried or overhead services.
Area = 7147 ha or 15% of the suburban core area 15%
Each person in Perth’s suburban core has, on average, the equivalent of 89m2 of infrastructural easements and landholdings.


The Perth outer suburb of Ellenbrook has been planned in accordance with the Liveable Neighbourhoods’ suburban design code - a code which sets out to provide utility services in a land efficient manner. In Ellenbrook this equates to 77m2 of infrastructural easements and landholdings per person


 Perth suburban core Ellenbrook
77m2
Perth suburban core Ellenbrook
77m2
If a 2–3m strip of verges in residential areas was sold to adjacent land owners, in 25% of cases, so they could drop a granny flat on this expanded ‘front setback area’ (between the house and verge), potentially 94,475 new infill dwellings would be created and the average verge area per person in the adjacent houses would be reduced from 56m2 to 49m2. This could avoid the need for a new suburb 8.8 times the size of Ellenbrook on the urban fringe.


Infill dwelling
Infill dwelling X 94,475 yeilded X 8.8 avoided
setbackExpandedfront area

 Ellenbrook
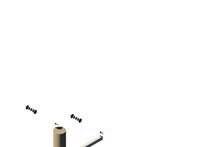
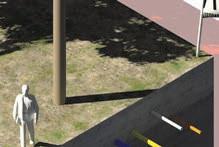
Midweek time-lapse photography of Broadway in Bassendean reveals the relative underutilisation of verges by residents for functions other than garbage disposal.
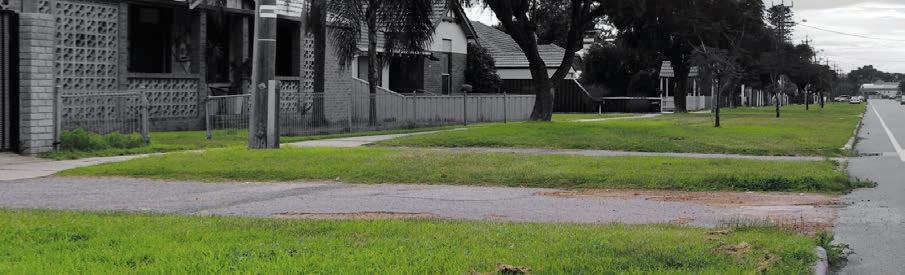
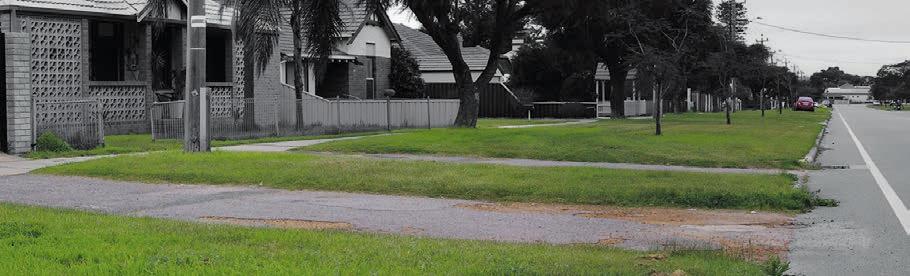
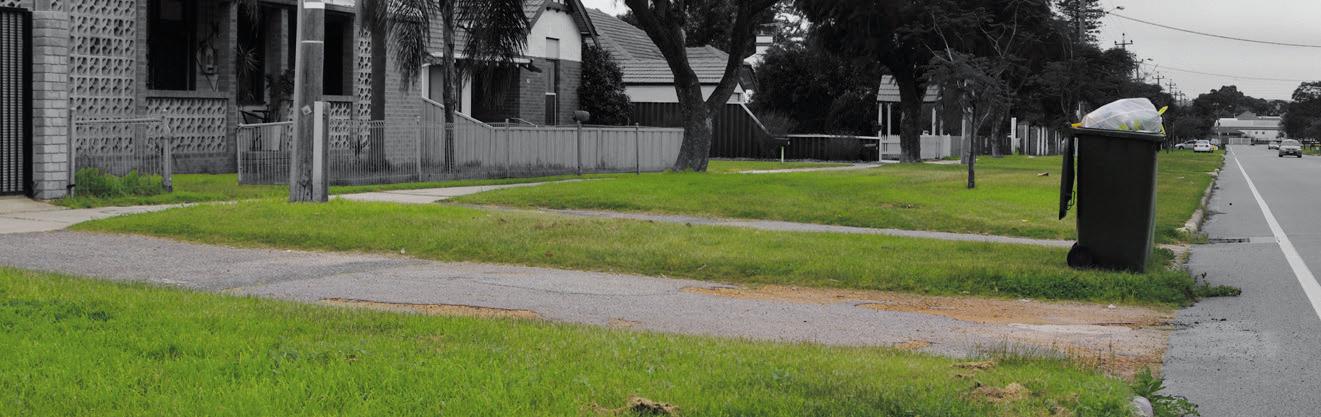
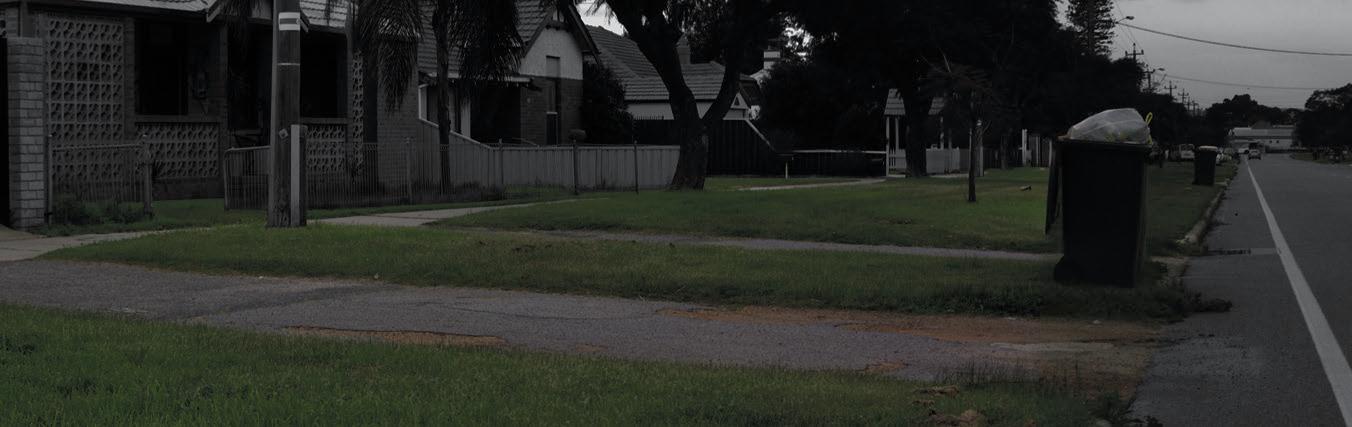

0500-0600 (People=0, Bins=42)
0800-0900 (People=0, Bins=0)
1100-1200 (People=0, Bins= 0)
1400-1500 (People=0, Bins 2)
1700-1800 (People=0, Bins=4)
Given the importance of industrial land to the state economy what should be the role of these industrial zones for supporting residential infill development – if any? Planning for ‘employment lands’ in the Sydney city council area provides an interesting precedent...
In 1947 some twenty-six per cent of Perth’s workforce was employed in manufacturing.1 As part of a greater shift towards a service economy by 2011 this figure had fallen to 8.5%.2 Regardless the existing light industrial zones, where manufacturing is concentrated in Perth’s suburban core, continue to provide the highest number of jobs (95,000) outside of the Perth and West Perth business districts.3 These jobs are spread over 3013 ha of industrial zoned land in Perth’s suburban core – or seven per cent of the total suburban core area. This is a comparatively high figure – a fact borne out in comparison to the greater Perth region that only has one point seven per cent currently zoned for industrial uses.4 Perhaps partly because of the generous provision of light industrial areas in the suburban core, this land is increasingly being infiltrated by higher end commercial uses. At the same time, some manufacturing operations are being forced to relocate to strategic industrial centres on the urban periphery, as central land becomes more and more valuable.5
Given the importance of industrial land to the state economy, what should be the role of these central light industrial zones for supporting residential infill
1 G Stephenson and J A Hepburn, “Plan for the Metropolitan Region Perth and Fremantle 1955 Report,” (Perth: Government Printing Office 1955), 45..
2 Australian Bureau of Statistics, “Greater Perth Fact Sheet,” Australain Bureau of Statistics, http://www.abs.gov.au/websitedbs/censushome.nsf/ 4a256353001af3ed4b2562bb00121564/mediafactsheets2nd/$file/Factsheets%20-%20Perth.pdf.
3 Department of Planning and Western Australian Planning Commission, “Economic and Employment Lands Strategy: Non-Heavy Industrial Perth Metropolitan and Peel Regions,” (Perth: Western Australian Planning Commission, 2012), 44..
4 Ibid., ix..
5 Ibid., 37.
development – if any? Planning for ‘employment lands’6 in the Sydney City Council area provides a clue. Planners at the City of Sydney Council have dealt with the issue of residential encroachment in light industrial/ commercial lands by allowing affordable housing to be constructed in these zones – where it does not undermine the broader employment objectives of the area.7 In the same way of thinking, if twenty per cent of the light industrial/ commercial zones of Perth’s suburban core were recast as residential areas with appropriately designed affordable housing for local workers, this could yield 95,434 new dwellings or avoid the need for 10 new Ellenbrooks on the urban fringe. Nonetheless some would question the health implications of living in such environments. In this respect it is important to distinguish between light and heavy industry. Light industrial zones (such as those in the suburban core) are where the processes carried out do ‘not adversely affect the amenity of the locality by… the emission of light, noise, electrical interference, vibration, smell, fumes, smoke, vapour, steam, soot, ash, dust, waste water or other waste products.’8 This is not the tanneries, soap factories, brickworks, and foundries which so befouled East Perth in Perth’s early years.
6 Employment land is broadly defined as land that could be used for employment generating activities, including land zoned for industrial and commercial purposes. Ibid., ix..
7 City of Sydney, “City of Sydney Employment Lands Strategy 2014 - 2019,” (Sydney: City of Sydney, 2014), 18..
8 Western Australian Planning Commission, “Statement of Planning Policy No. 4.1: State Industrial Buffer Policy,” ed. Western Australian Planning Commission (Perth: Western Australian Government, 1997), 10..
If 20% of the light industrial/ commercial zoned land in Perth’s suburban core was redeveloped with residential medium-rise apartments, 95,434 new dwellings could be created (assuming development at a net density of R200 and allowing 15% area for roads and 10% for public open space). This would reduce the average area per worker from 335 m2 to 267 m2 and could avoid the need for a new suburb 10 times the size of Ellenbrook on the urban fringe.


X 95,434 yielded X 10 avoided

Perth has a generous provision of parks, many of which are barren and have limited functionality.
Rationalising park areas could help achieve infill development targets and pay for much-needed park upgrades.
Perth’s suburban core contains 3,181 ha of parks or the equivalent of 40 m2 of park area per person.1 This figure is generous when compared with other cities and the generally accepted Australian suburban standard of 28 m2 per person.2 Perhaps by virtue of this generosity, many (but not all) of Perth’s parks are un-designed, generic in quality and typically underutilised. Local governments are responsible for maintaining parks and they simply do not have the revenue base for the design and upkeep of elaborate park schemes if population densities are not high enough in relation to open space areas.
This ubiquitous feature of the suburban landscape is typically turfed, sometimes having only scattered remnant trees. Among the parks in Perth’s suburban core, twenty-two per cent have no trees, only ten per cent have significant wildlife function, and only one per cent have wetlands3 (despite the fact that Perth was historically a landscape of wetlands). Furthermore, seventy-four per cent of parks have a pervasive underlay of reticulated turf poorly suited to Perth’s drying climate, fifty-four per cent have no walking paths, sixteen per cent have picnic tables and only nine per cent of
1 Some local government areas have even more such as the City of Stirling which has 75m2 of park per person.City of Stirling, “Public Open Space Strategy: Better Parks for All,” (Perth: City of Stirling, 2008).
2 Glen Searle, “Urban Consolidation and the Inadequacy of Local Open Space Provision in Sydney,” Urban Policy and Research 29, no. 02 (2011): 204." <style face=”italic”>Urban Policy and Research</style> 29, no. 02 (2011
3 Centre for the Built Environment and Health, “Public Open Space (Pos) Geographic Information System (Gis) Layer,” University of Western Australia http://researchdata.ands.org.au/public-open-space-pos-geographic-information-system-gis-layer.
parks have barbecue facilities.4 While such parks do provide important ecosystem services there is a question as to whether they could be reconfigured to provide a broader range of such services and to reduce their typically high water, fertiliser and energy demands.
With a park system that is both generous and of a typically low standard, I believe it is time to reflect on what could be rationalised. Indeed if the area of parks per person was rationalised to the Australian standard –and the rationalised area was redeveloped as medium-rise apartments – this could yield 144,003 new dwellings. Beyond potentially avoiding the need for a suburban area 15.2 times the size of Ellenbrook on Perth’s fringe, the funds generated by this sale could be funnelled back into upgrading the parks themselves to provide a broad range of ecosystem services, to produce energy and food,5 and finally to deliver world-class, recreational and social function.
4 Ibid.
5 Brendan Gleeson, “Waking from the Dream: Towards Urban Resilience in the Face of Sudden Threat,” Griffith University Urban Research Program (2006): 47..
Parks - Perth 2015
Area = 3,181 ha or 6.5% of the suburban core area
Perth’s suburban core has 40m2 of public open space per person.


 Perth suburban core
Parks, Sydney middle suburbs 2011
Sydney’s middle suburbs average about 20m2 park area per person – about half that of Perth.


While Perth’s suburban core has 40m2 of public open space per person some local government areas (LGA) have significantly more. The City of Stirling a large LGA in the northern part of the suburban core provides an enormous 75m2 per person - almost three times the Australian standard...


 City of Stirling
The recognised Australian standard for park provision per person is 28m2.


If park space in Perth’s suburban core was reduced to the Australian standard of 28m2 per person it would free enough land for 144,003 dwellings at medium-rise apartment density (presuming the rationalised park area is developed at a net density of R200 and allows for 10% of open space and 15% for internal roads). This could avoid the need for a new suburb 15.2 times the size of Ellenbrook on the urban fringe.


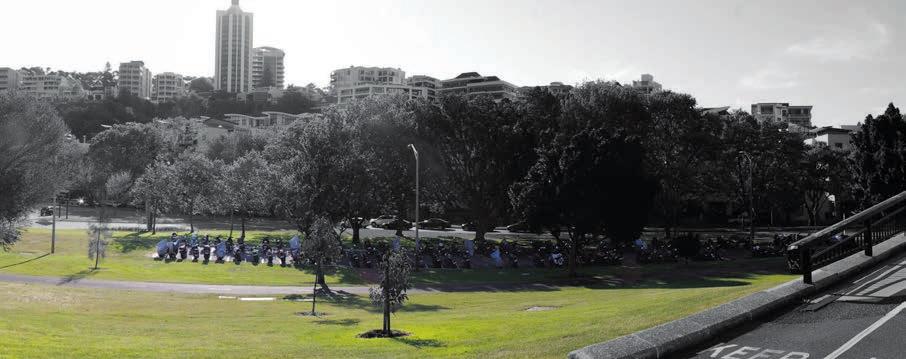
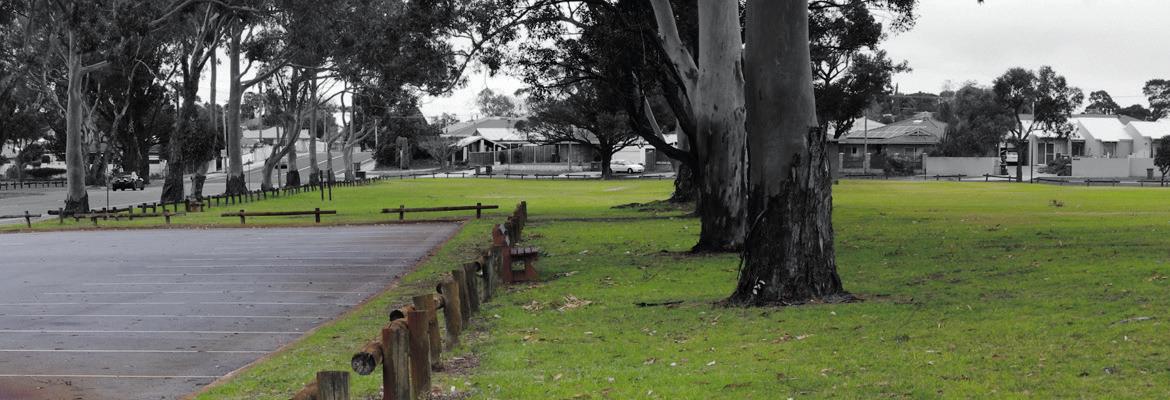
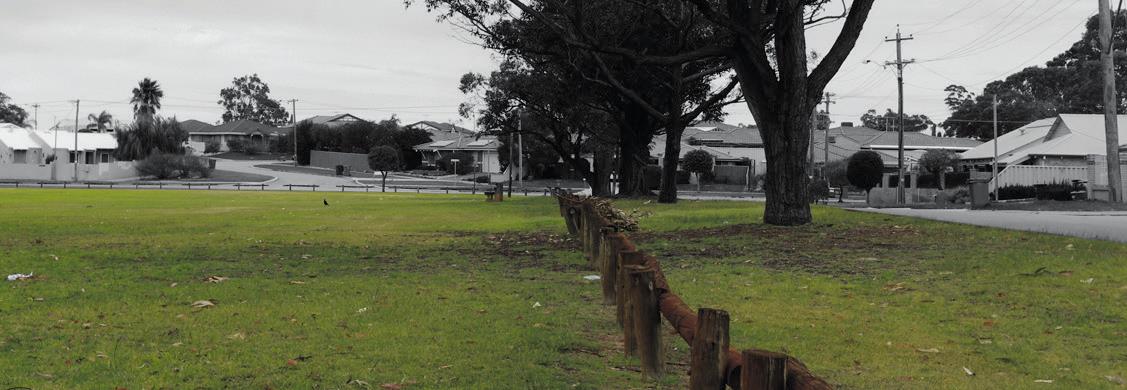
Midweek time-lapse photography of Hillcrest Park, Bayswater reveals a sparsity of occupation. Utilisation of such district open space increases significantly on weekends.
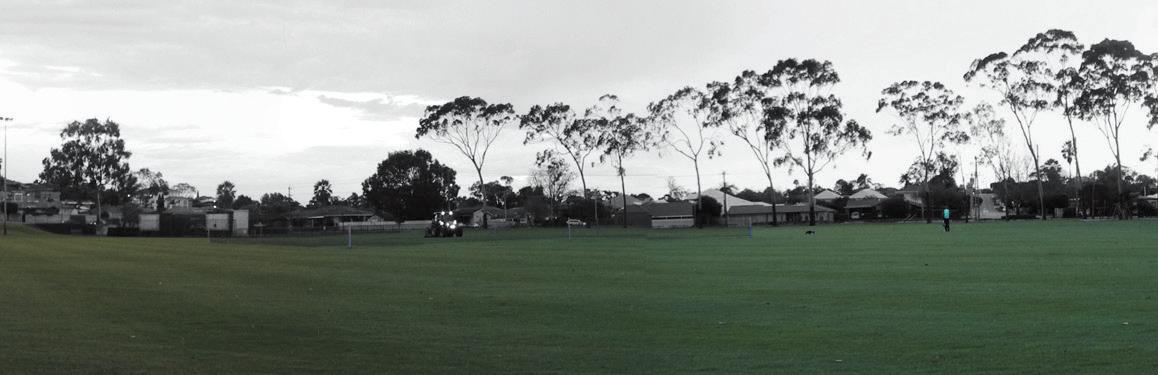
0500-0600 (People=1, dogs=0)
0800-0900 (People=3, dogs=0)
1100-1200 (People=1, dogs=0)
1400-1500 (People=2, dogs=0)
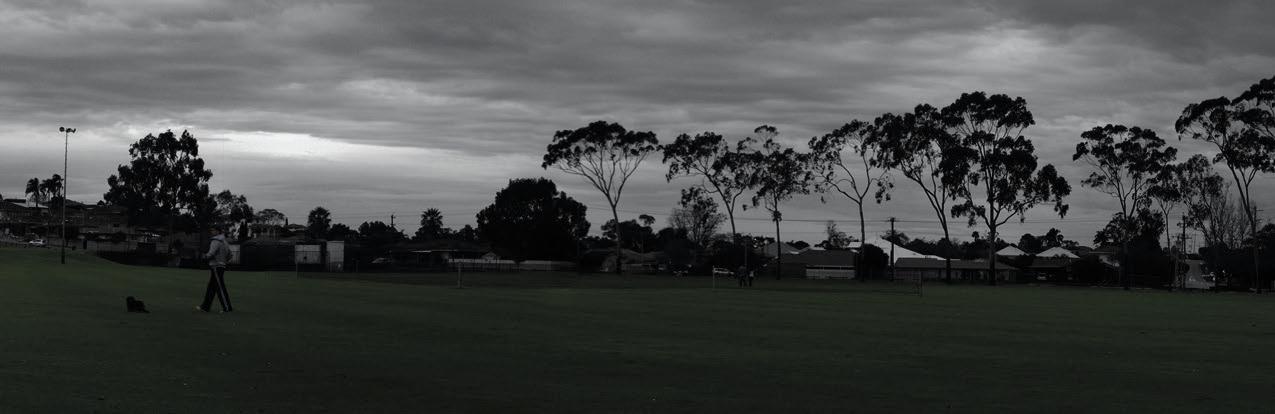
1700-1800 (People=4, dogs=3)
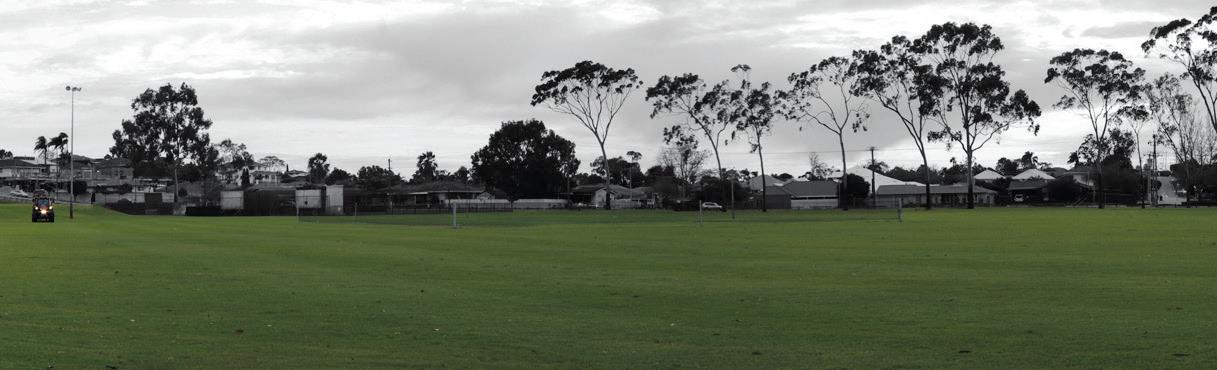
Time-lapse photography of Wymond Park, Bayswater reveals a complete absence of people on a typical weekday. Such residual open space could be rationalised to provide infill dwellings (with existing trees protected) or revegetated for greater ecological performance.
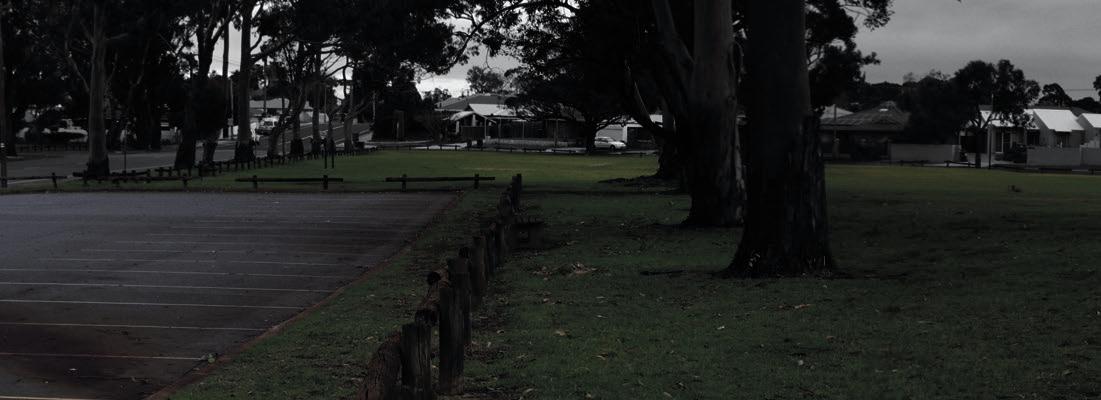
0500-0600 (People=0, dogs=0)
0800-0900 (People=0, dogs=0)
1100-1200 (People=0, dogs=0)
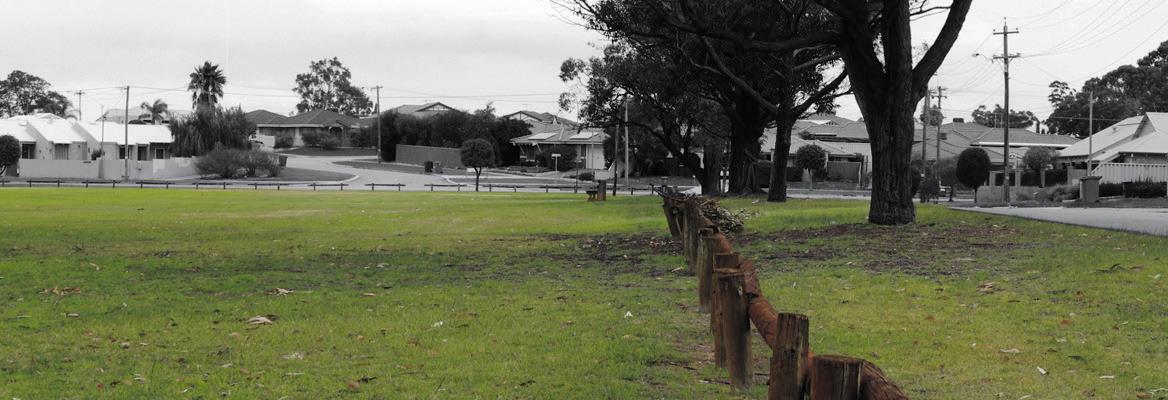
1400-1500 (People=0, dogs=0)
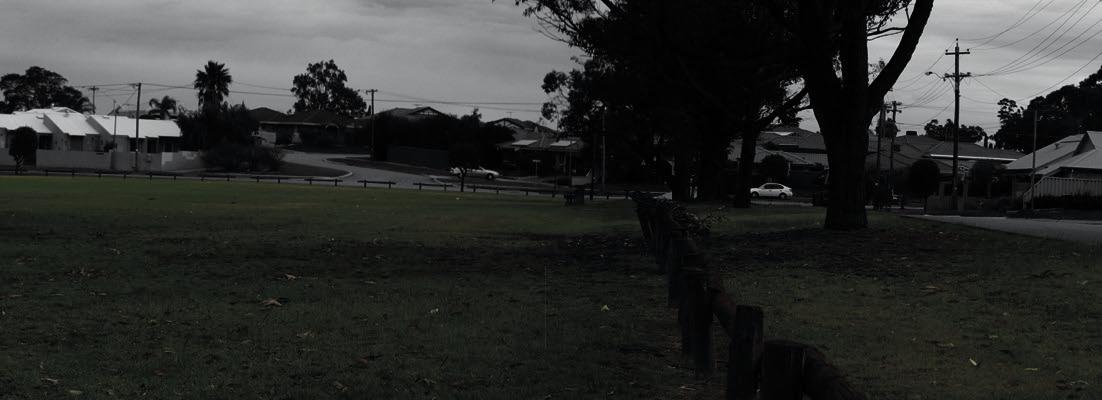
1700-1800 (People=0, dogs=0)
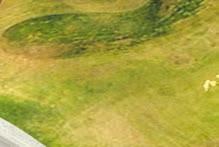
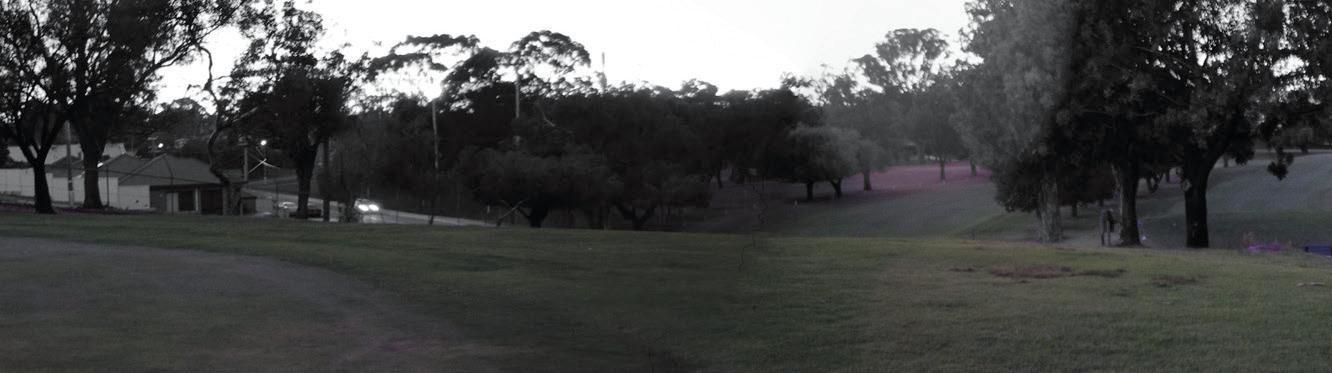
Golf courses are some of the most sparsely utilised landscapes in Perth’s suburban core and so are logical, if not uncontroversial, sites to be rationalised for infill development.
The land area contained in golf courses (both public and private) in Perth’s suburban core amounts to 1,153 ha, the equivalent of 14 m2 per person. This is roughly commensurate with the 16 m2 of golf courses suggested by Stephenson and Hepburn in Perth’s 1955 plan.1 Such targets are rarely borne out in practice, however. By way of example the city of Edinburgh in Scotland, the country where golf originated, has approximately 9 m2 of golf course per person.2 While the area of golf courses in Perth is roughly commensurate with historical planning standards, the occupation and usage of golf courses tends to be very thin. Take Mt Lawley Private Golf Club for instance: if its 1,000 playing members were to be on the course at one time (an unlikely event), they would have a massive 900 m2 of land each. There is no other land use in Perth that requires so much land for so few people. Compounding this, Australian golf club membership has been in decline for some years, particularly in private golf clubs. An increasingly ‘time poor’ and money conscious population are generally given as being the cause of this.3
Given the vast consumption of land per person required by golf courses (and generally declining memberships) I propose that the majority of full-size (eighteen-hole) golf courses in Perth’s suburban core could be rationalised
1 G Stephenson and J A Hepburn, “Plan for the Metropolitan Region Perth and Fremantle 1955 Report,” (Perth: Government Printing Office 1955), 91.
2 This figure is based on the metropolitan area within the A720 ring road.
3 C Johnstone, “Merger to Drive Golf Clubs into Future,” The Age, http://www.theage.com.au/victoria/merger-to-drive-golf-clubs-into-future-201309202u5ju.html.
down to nine-hole ‘executive’ golf courses, with full-size golf courses being relegated to Perth’s outer suburbs. These not uncommon nine-hole courses get their name from their target patronage of business executives who play the course on a long lunch or as part of a meeting. Eight of the public golf courses in Perth’s suburban core are on leased Crown land (for which some pay only a ‘peppercorn’ rent), so this process of rationalisation is not beyond what a willing government could orchestrate over time.4 Rationalising golf courses as proposed and redeveloping the land area with medium-rise apartment buildings could yield some 86,497 new high-amenity dwellings among mature stands of remnant trees. The provision of substantial new dwellings for many should outweigh the recreational demands of a few.
4 Indeed the leases on a number of these golf courses will soon expire.
Golfcourses - Perth 2015
Area = 1,153ha or 2% of the total suburban core area 2%
Perth’s suburban core provides 14m2 of golf course per person.


 Perth suburban core
The city of Edinburgh in Scotland, near to where golf originated, hprovides approximately 9m2 of golf course per person.


 Perth suburban core Edinburgh
9m2
Perth suburban core Edinburgh
9m2
In the unlikely event of all the playing members of Mt Lawley Golf Club being on the course at one time, each player would still have 900m2 of golf course to themselves.


If all the golf courses in Perth’s suburban core were reduced from eighteen holes to nine holes, enough developable land for 86,497dwellings at a mid-rise apartment density could be made available (assuming that 50% of the existing area of golf courses is developed at a net density of R200 with a 15% allowance for internal roads and 10% for open space). This could avoid the need for a new suburb 9.1 times the size of Ellenbrook on the urban fringe.

X 86,497 yeilded

Exfairway
Exfairway
X 9.1 avoided
 Ellenbrook
Infill dwelling
Ellenbrook
Infill dwelling
Embleton Golf Course, time-lapse photography
Weekday time-lapse photography of Embleton Golf Course (looking east from the ninth hole) reveals a sparsity of utilisation.
0500-0600 (People=2)
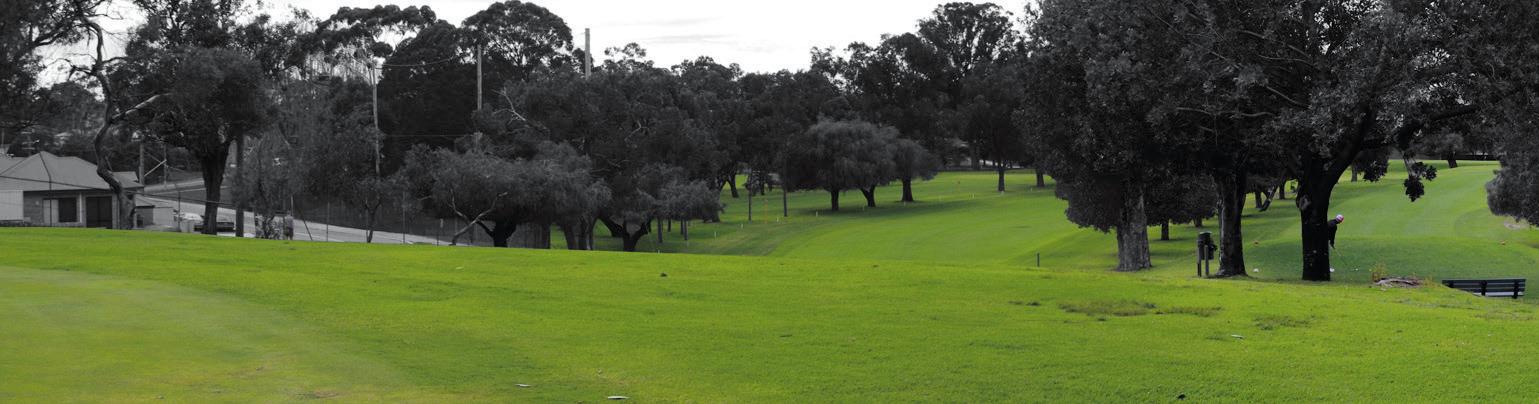
0800-0900 (People=1)
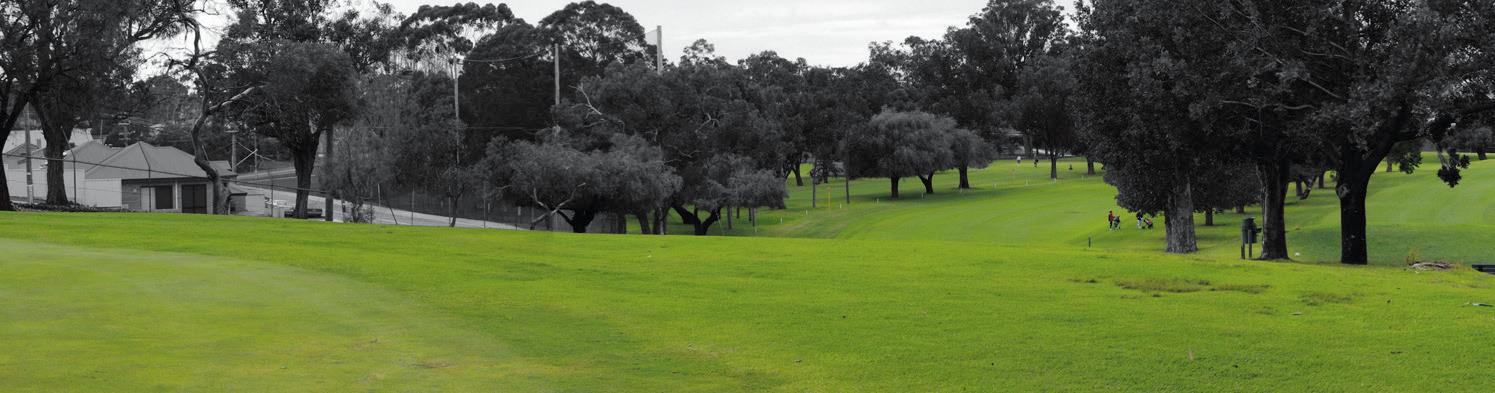
1100-1200 (People=2)
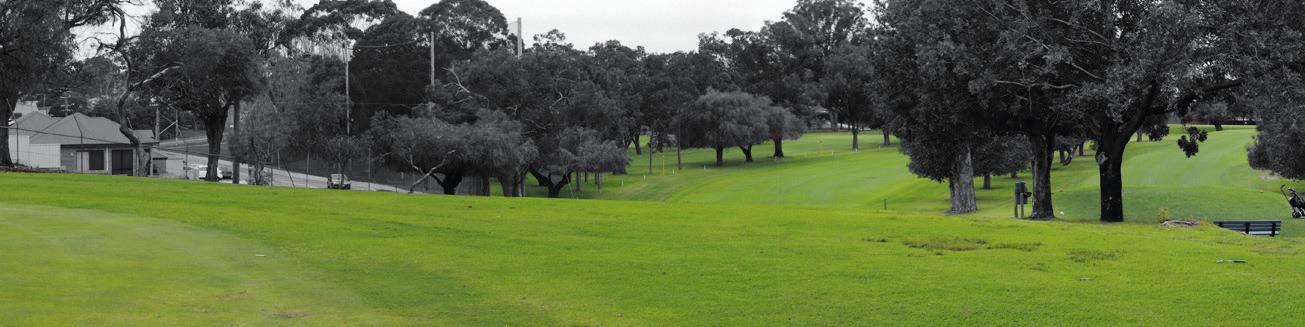
1400-1500 (People=1)
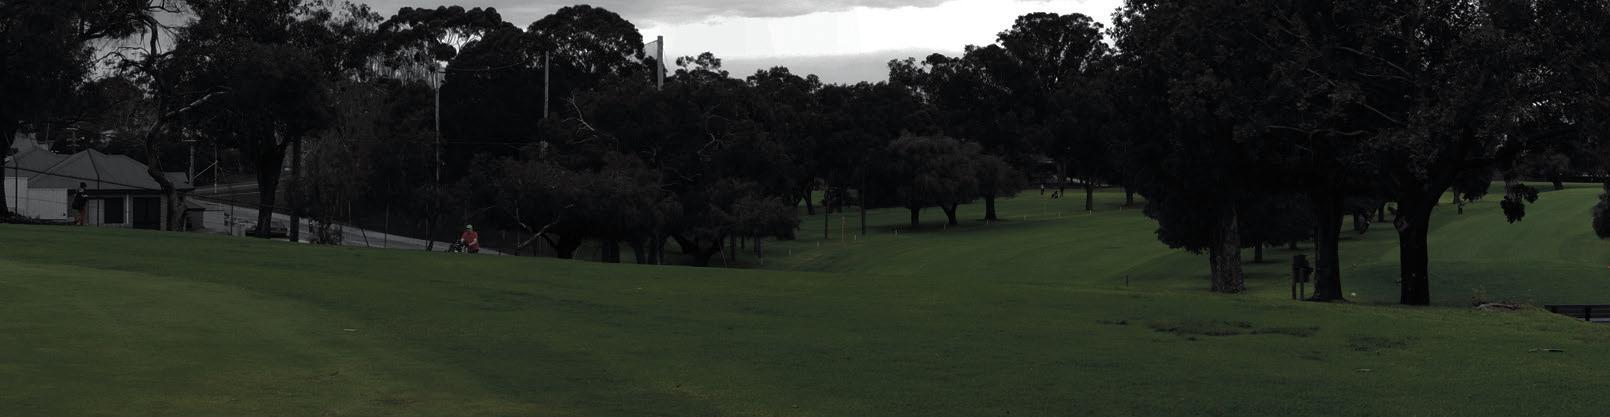
1700-1800 (People=1)
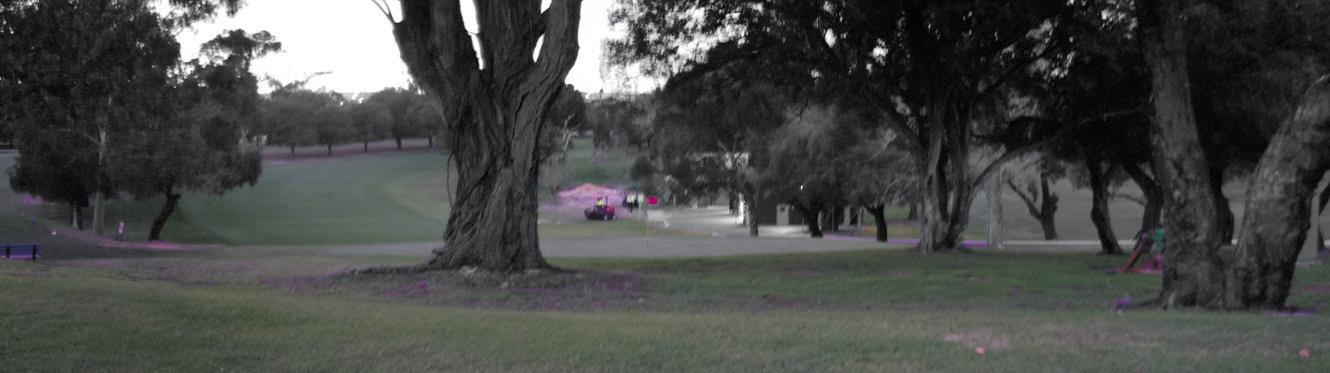
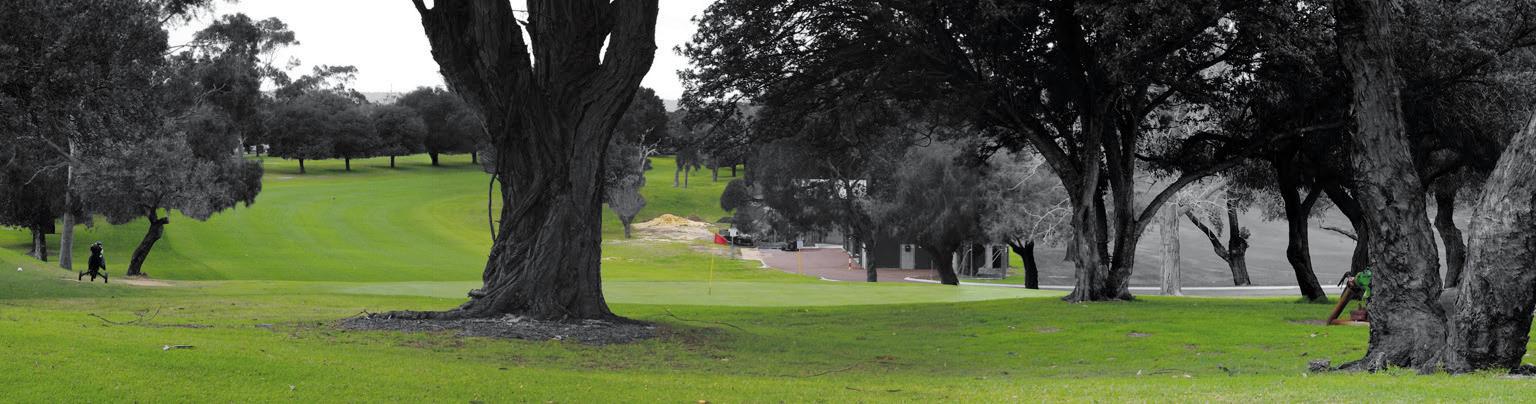
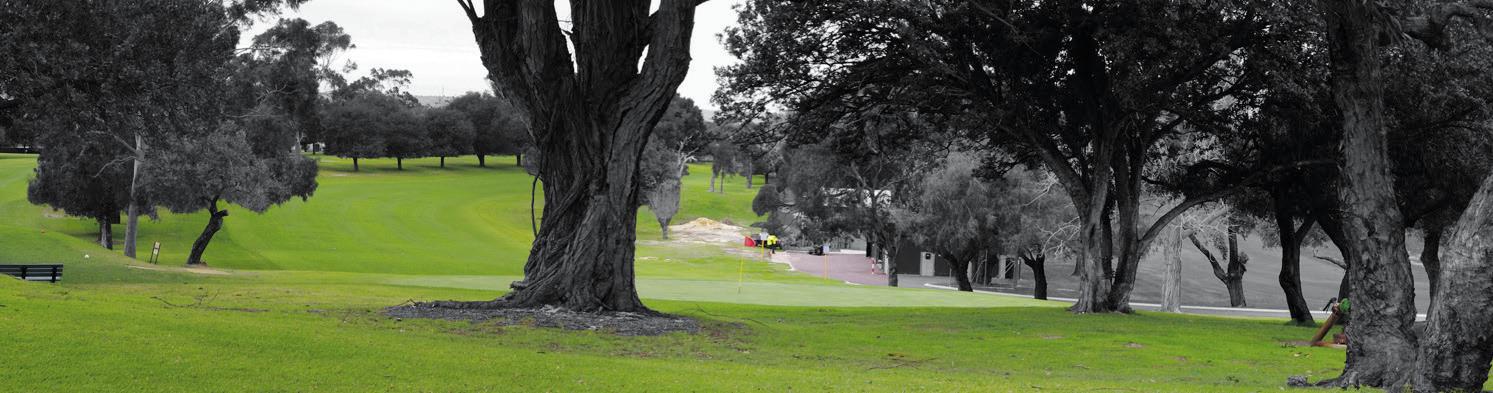
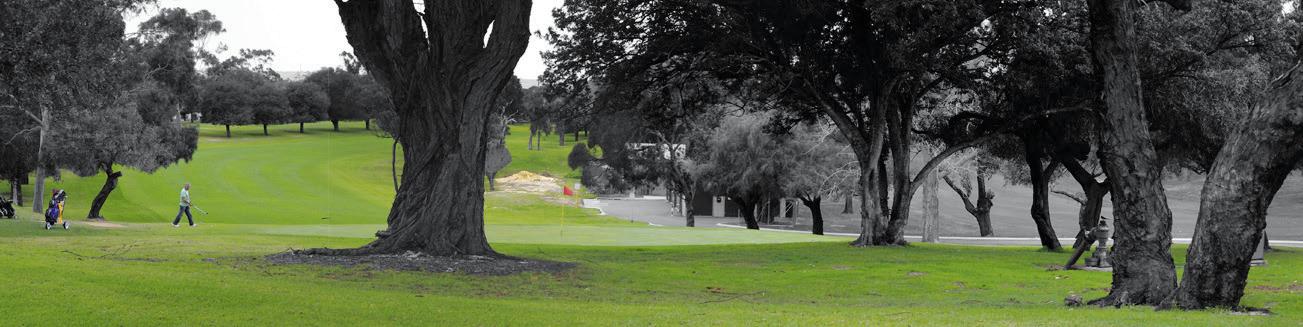
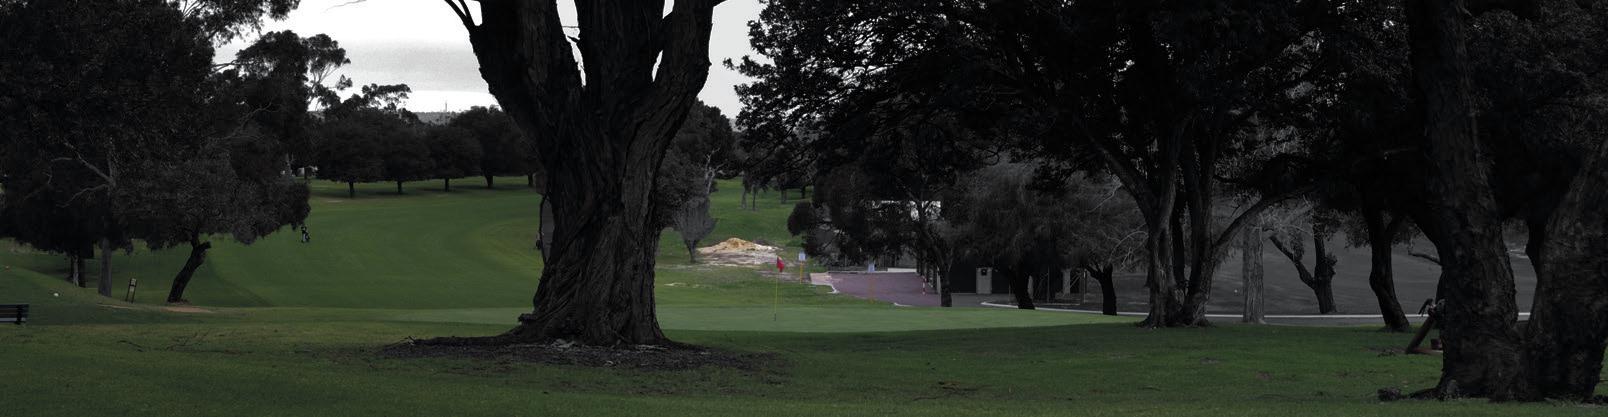
Students at Perth’s primary schools each have a generous allocation of open space compared with historical standards. Developing this land could provide funds for schools to embark on a new wave ‘recreation movement’.
119 118 Scavenging the SuburbsWhile primary schools in Perth’s suburban core comprise only 341 ha, or 0.7 per cent of the total land area, this amounts to a generous 85 m2 of open space per student. This provision is significantly above historical standards. In 1955 it was proposed that primary schools should allocate 49 m2 of open space per student, just less than half what is provided today.1 Notably this standard was proposed at the height of the ‘recreation movement’, when open space for active recreation was conceived to ‘strengthen and discipline bodies, to temper immoral impulses’.2 Given its zeal, the recreation movement could not have been accused of underestimating open space requirements.
I propose that the area of primary school open space per student could be rationalised to the 1955 standard, with two ends in mind. First, given that the number of single-parent families in Australia is projected to increase dramatically (rising between forty and seventy-seven per cent by 20313) this area could be redeveloped as low-rise apartments to provide some 8,624 new dwellings, in part to cater for this demographic. While the noise and traffic problems associated with living adjacent to a primary school may not suit most households, the convenience this position offers could appeal to some
1 G Stephenson and J A Hepburn, “Plan for the Metropolitan Region Perth and Fremantle 1955 Report,” (Perth: Government Printing Office 1955), 152.
2 Neil Sipe and Jason Byrne, “Green and Open Space Planning for Urban Consolidation- a Review of the Literature and Best Practice,” (Brisbane: Griffith University, 2010), 6.
3 J-F Kelly et al., “Social Cities,” (Melbourne: Grattan Institute, 2012), 8.
single-parent families.4 This can be understood in light of data that the average stay-at-home parent spends six hours and forty-three minutes each week driving children to school and other events.5 Second, the subdivision of surplus land could provide schools with funds for equipping the remaining outdoor space with excellent quality recreational infrastructure, an important investment given the rise of childhood obesity. Most schools are well equipped with ovals for organised team sports but poorly equipped for recreational activities such as skateboarding and scooting, which are becoming more popular. Money could be spent transitioning the remaining open space to areas that are highly interactive and stimulating – not the barren ovals and large swathes of asphalt for which most primary schools are known.
4 Indeed ‘easy access to a preferred school’ ranked third in a survey conducted in Perth to understand the most important attributes respondents considered when deciding on a dwelling. Curtin University and Hames Sharley, “The Housing We’d Choose: A Study for Perth and Peel,” (Perth: Department of Housing Department of Planning, 2013).
5 Caroline Farchild, “Driverless Cars, a Boon for Working Moms?,” Fortune http://transact.org/.
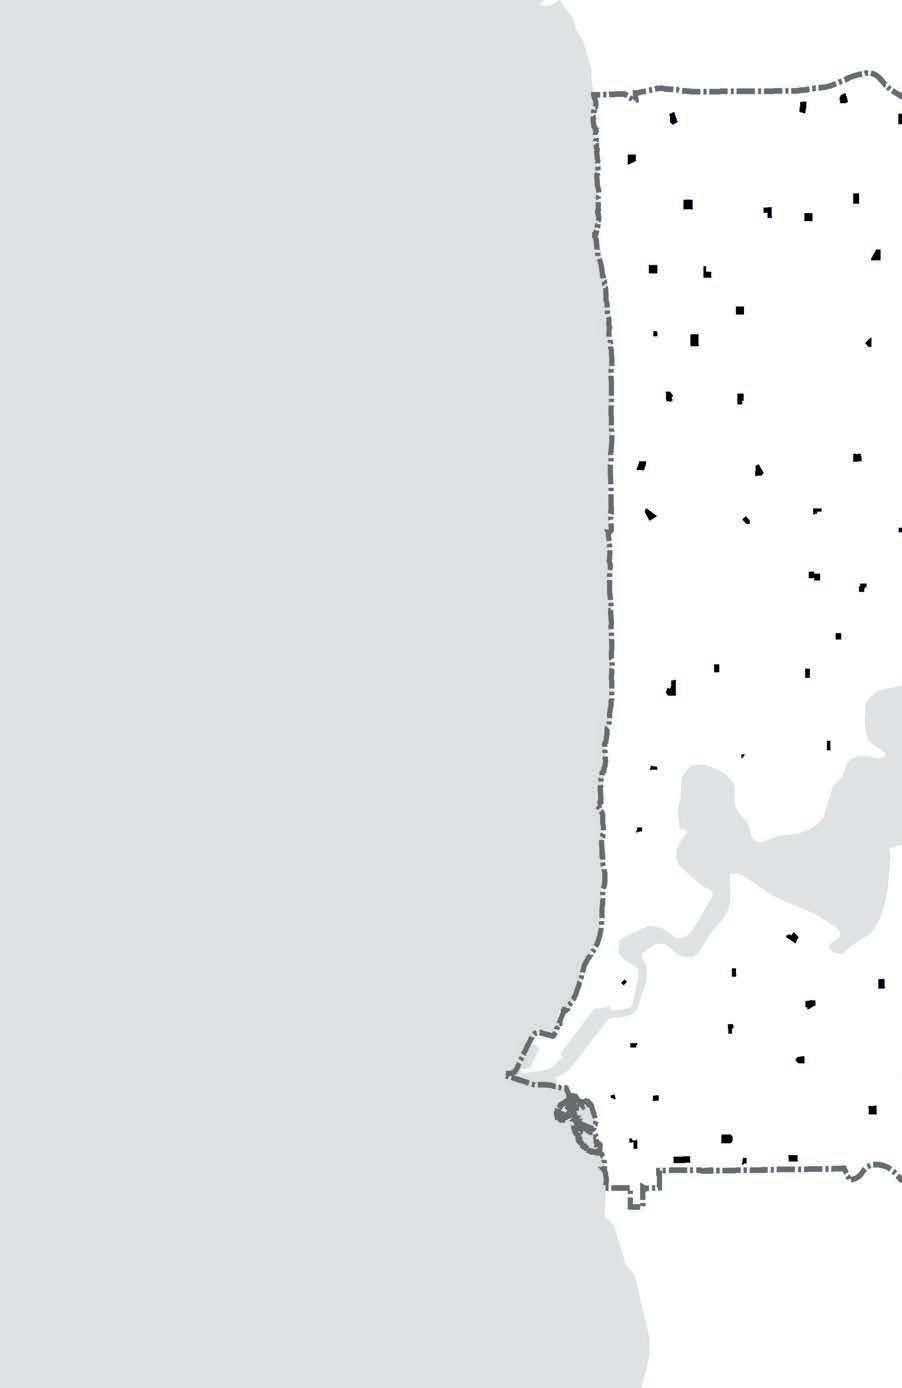
Area = 341 Hectares or 0.7% of the suburban core area 0.7%
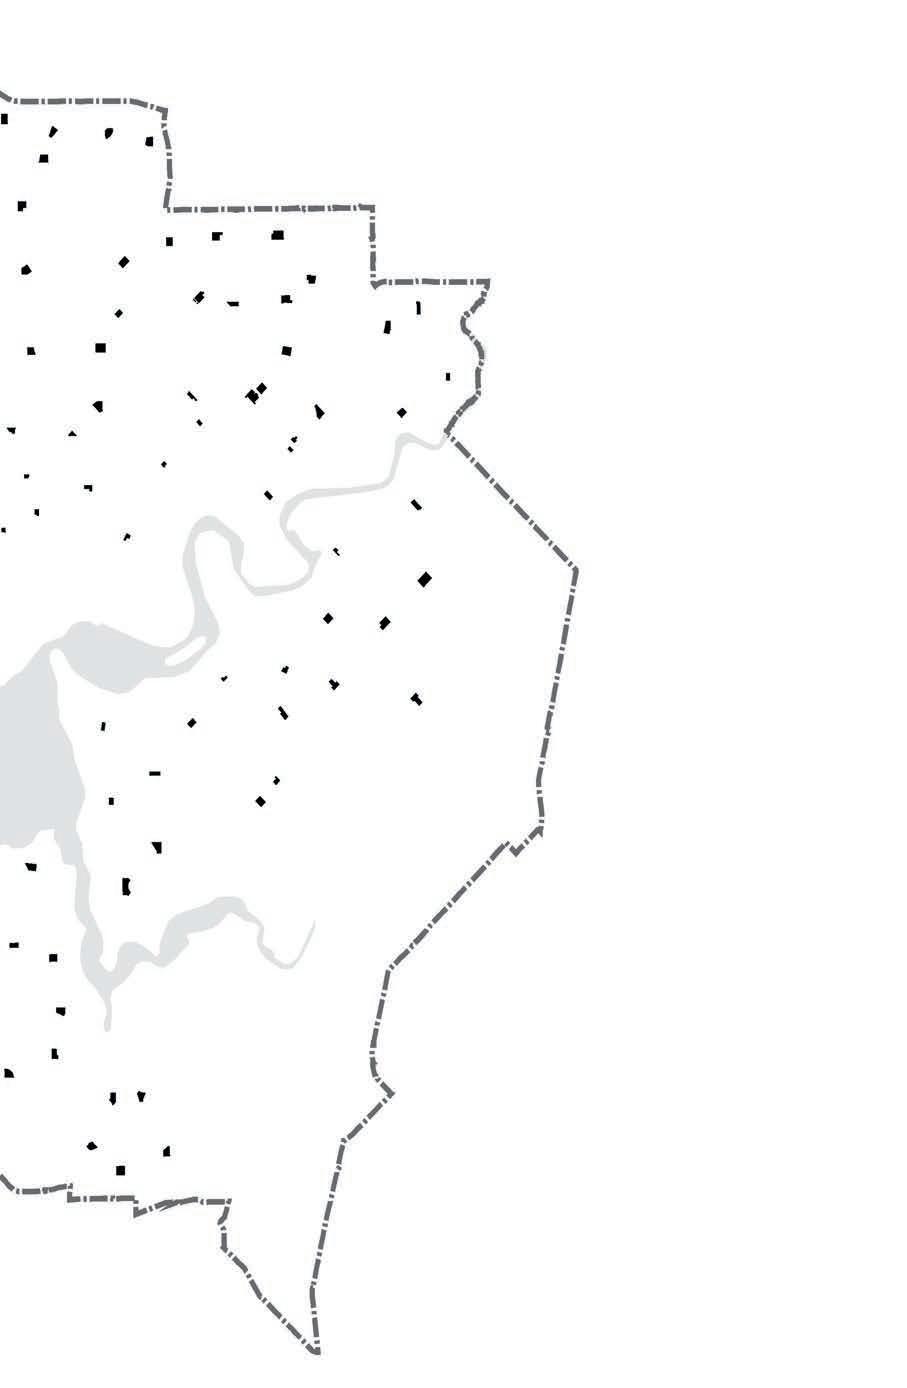
Primary-school students in Perth’s suburban core have an average 85m2 of open space each.


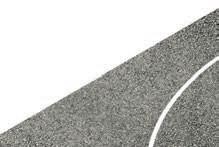


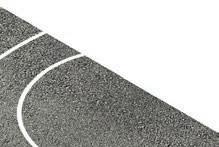
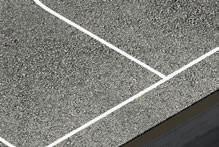


schools, Perth 1955 (Planned)
City planners Stephenson and Hepburn proposed that each student should be provided 49m2 of open space.


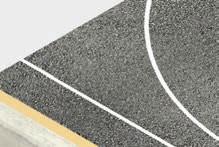


Perth 1955 (Planned) 49m2


Perth suburban core


Dropping open space from 85m2 to 49m2 per student and developing the remainder at a net density of R80 (allowing 15% area for roads and 10% for open space) could yield 8,624 new low-rise apartment dwellings. This avoids the need for a new suburb nine-tenths the size of Ellenbrook on the urban fringe, while the funds generated by such development could be invested in improving the function and aesthetic of the school’s remaining open space.


Infill dwelling X 8,624 yeilded X 0.9 avoided
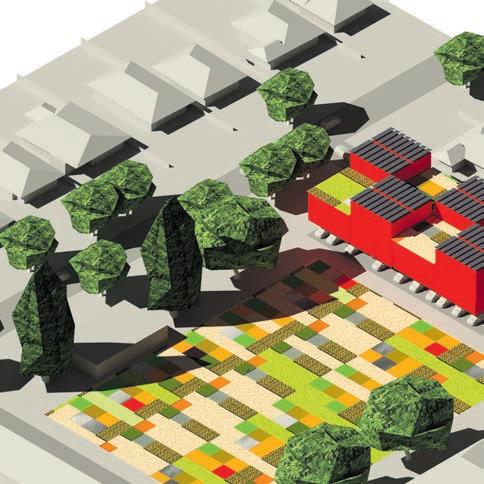
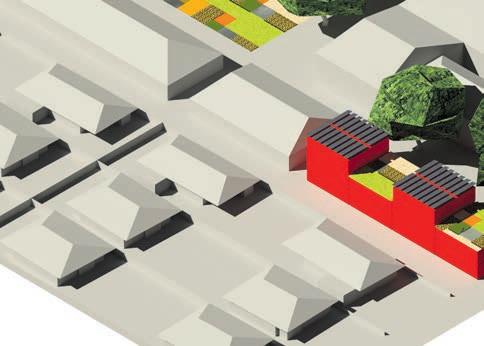

Despite their modest overall area, high schools in Perth provide a generous amount of open space per student. Developing this surplus open space could transition high schools into urban campuses that are aligned with the principally urban lifestyles of today’s teenagers.
127 126 Scavenging the SuburbsHigh schools in Perth’s suburban core comprise only 260 ha, or roughly 0.5 per cent of the total land area. While this is a low figure overall it amounts to an ample 110 m2 of open space per student, which is significantly above both historical and contemporary standards. Perth’s inaugural metropolitan plan in 1955 proposed that high schools should provide half this figure, with 55 m2 of open space per student.1 Perth’s current ‘Liveable Neighbourhoods’ suburban design code2 stipulates that high schools should be 10 ha in size, a figure that equates to 73 m2 in a recently built example.3
I propose that the area of high school open space per student could be rationalised to the ’Liveable Neighbourhoods’ standard.4 Developed at a medium-rise apartment density, this freed-up land could provide 13,076 dwellings principally for staff and struggling single-parent families requiring easy access to schools. Funds generated through such development could be directed towards upgrading the remaining open space, which is typically made up of barren sports fields.
1 G Stephenson and J A Hepburn, “Plan for the Metropolitan Region Perth and Fremantle 1955 Report,” (Perth: Government Printing Office 1955), 152.
2 West Australian Planning Commission and Department of Planning and Infrastructure, “Liveable Neighbourhoods; a Western Australian Government Sustainable Cities Initiative,” ed. West Australian Planning Commision (Perth2007).
3 Ellenbrook Senior High School, which forms part of a ‘Liveable Neighbourhoods’ suburb in Perth’s nor-eastern corridor. Ellenbrook Senior High School has 1,367 students.
4 As infill development occurs, and student numbers presumably increase, the area of school open space per student will decrease below this figure. I contend, however, that this potential issue would be offset by the upgrading of the school open spaces. The ‘Liveable Neighbourhood’ standard is also generous and is considered a target not a minimum.
This upgrade could see the provision of recreational infrastructure that reflects a growing teenage trend towards adventure, lifestyle and alternative sports such as inline skating, freestyle BMX, rock climbing and skateboarding (evidence of such trends is that two skate parks have been built per week in Australia since 2005).5 Through these sports teenagers find cultural selfidentity and self-expression,6 constructs that are often eroded by a conventional high school experience that tends to demand conformity.
To maximise the investment in recreational infrastructure I believe there is value in considering high schools as an integrated component of urban areas. The open space, recreational infrastructure, classrooms, lecture theatres and auditoriums of high schools could be much better utilised by communities if opened to the public over a twenty-four hour period. The development of surplus open space in high schools could be a first step towards transitioning them into urban campuses that are integrated into the community and aligned with the principally urban lifestyles of today’s teenagers.
5 Stefan Hakjkowicz et al., “The Future of Australian Sport: Megatrends Shaping the Sports Sector over Coming Decades,” (Australia: CSIRO, 2013), 11.
6 Ibid.
Area = 260 Hectares or 0.5% of the suburban core land area 0.5%
The high schools of Perth’s suburban core currently provide 110m2 of open space per student.

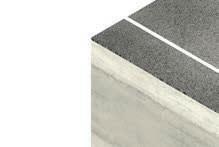


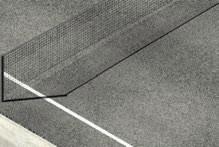


High schools, ‘Liveable Neighbourhoods’ suburban design code, Perth 2007
Perth’s current ‘Liveable Neighbourhoods’ suburban design code stipulates that high schools should be 10 hectares in size, a figure which equates to 73m2 of open space per student in the recently built example of Ellenbrook Senior High School.


Reducing the open space at high schools in Perth’s suburban core from 110m2 to 73m2 could yield 13,076 new medium-rise apartment dwellings (assuming development at R200 with a 15% allowance for internal roads and 10% for open space). This could avoid the need for a new suburb 1.4 times the size of Ellenbrook on the urban fringe.


X 13,076 yeilded

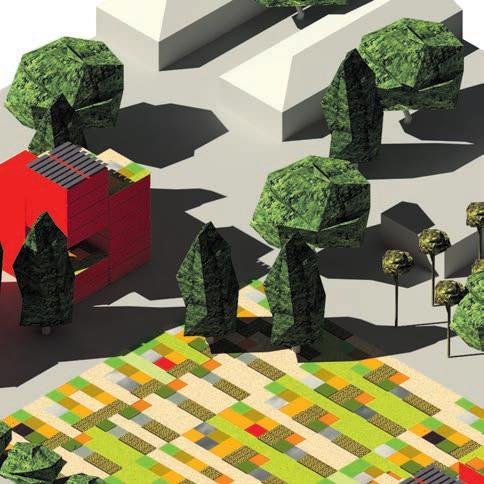
X 1.4 avoided

Perth’s universities were conceived as campuses where buildings floated in the landscape. Recasting these as urban campuses could potentially yield significant numbers of infill dwellings. 135
134 Scavenging the SuburbsUniversities in Perth’s suburban core occupy about 371 ha or less than one per cent of the total land area. Per enrolled local student this amounts to 35 m2 of university open space, a fairly low ratio of open space to student. Compare this with the Massachusetts Institute of Technology, which ranks second in the world and provides 53 m2 of open space per student. Yet, it is in the density of students living on campus where examples like MIT differ from Perth’s universities. While each MIT student campus resident has 110 m2 of university open space, on average Perth’s suburban core universities provide a vast 854 m2. Simply put, Perth’s universities are educational, not residential environments. Historically they have not had to provide many student residences, with most students being Perth locals, hence their low residential population. They are also landscape, not urban, campuses, reflecting the precedent set by the state’s first university, the University of Western Australia.
If Perth’s university campuses were recast as residential as well as educational environments, and adopted a student residential density commensurate with MIT, they could yield some 17,809 new dwellings –accommodation that is much needed by students squeezed out of Perth’s overheated real estate market. This transition has already started at some of Perth’s universities, which are designated as Specialised Activity Centres in state government planning. Curtin University has rebranded itself as Curtin City, an ‘urban environment where diverse groups from the world over will
come to work, study and interact’, and is planned to be home to 8,000 students by 2031.1 Curtin’s approach makes sense with respect to the increasing threat to traditional universities posed by online tertiary courses. In short, such universities will need to make the experience of physically attending a campus as rich and interesting as possible so as to lure students away from online alternatives. An increase in residential density, and the subsequent activation of universities, will be a key part of achieving this.
1 Curtin University, “Creating the City of Innovation,” ed. Curtin University (Perth: Curtin University, 2013).
Universities - Perth 2015
Area = 371 Hectares or 0.8% of the suburban core area 1%
Perth’s universities have an average 35m2 of open area per student.


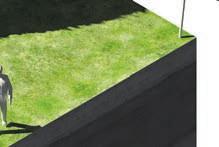


Universities, MIT 2015
Massachusetts Institute of Technology has 53m2 of open space per student.


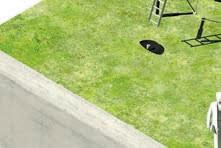


 Massachusetts Institute of Technology
53m2
Massachusetts Institute of Technology
53m2
The universities of Perth’s suburban core provide a vast 854m2 of open area per student resident.

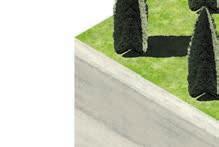


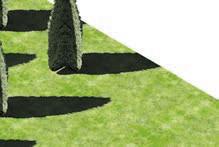
854m2


Universities, MIT 2015
Massachusetts Institute of Technology provides 110m2 open space per student resident.


Massachusetts Institute of Technology Perth


Increasing the number of student/staff residences at Perth’s universities to an area of 110m2 per resident (commensurate with MIT) would result in 17,809 new medium-rise apartment dwellings. This could avoid the need for a new suburb 1.9 times the size of Ellenbrook on the urban fringe.

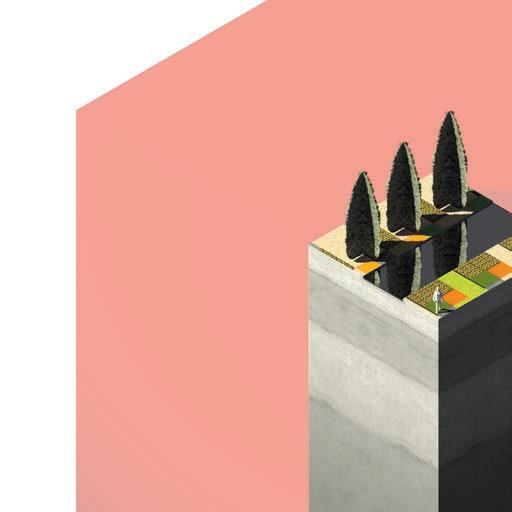


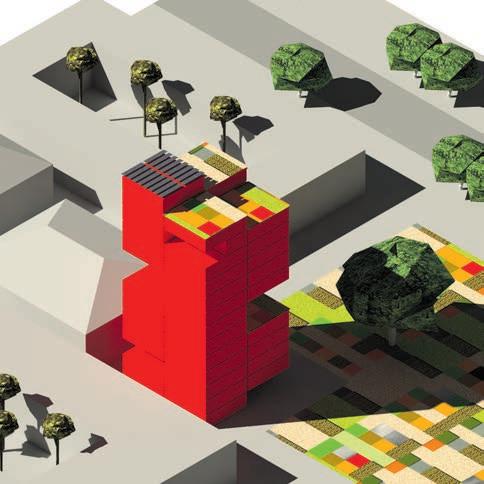
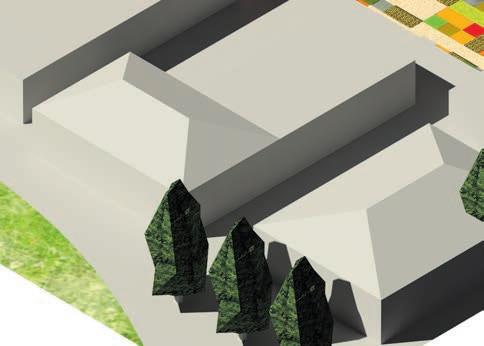

Perth’s Swan and Canning rivers are thought of as an Arcadian escape from the city, so they have rarely been considered as spaces for housing.
145 144 Scavenging the SuburbsThe beauty of the Swan River, particularly its upper reaches, was largely the reason behind Perth’s European settlement. British Captain James Stirling and his botanist, Charles Fraser, were inspired by its beauty on an exploratory voyage in 1827. The ensuing romantic accounts of the river landscape1 triggered ‘Swan River mania’ in England. In this fevered state, the desires of the aspirational class were projected onto the apparent arcadia of the river.2 While the Swan was unarguably beautiful, the soils of the surrounding plains turned out to be wretchedly unproductive. Nonetheless the image of the Swan River as an Arcadian escape from the city was lodged firmly in the public imagination. Evidence of this enduring vision is the hostile community reaction that greets plans for urbanity along the river’s edge3 – despite the fact that a significant ninety per cent of the land along the river and the coast has been acquired for public use.4 By contrast, Melbourne’s urban image of the Yarra River, based on the Seine,5 has never had currency in Perth.
The zenith of the notion of the Swan River as an escape from the city into nature is Heirisson Island. This largely reclaimed island is some 30 ha in area
1 J. Stirling, 1827, cited in David WhishWilson, Perth (Sydney: New South Publishing, 2013), 26.
2 Ibid.
3 Such as provoked by the Elizabeth Quay project.
4 Peter Newman, “The Rise of a Sustainable City: Much More Than the Wild West,” ed. Julianne Schultz and Anna Haebich, Griffith Review 47: Looking West (Brisbane: Griffith University, 2015). 135..
5 Kim Dovey and Leonie Sandercock, “Please, Politics and the “Public Interest”: Melbourne’s Riverscape Revitalization,” American Planning Association 68, no. 2 (2002).
and less than 2 km from the city centre, and is occupied by a colony of six Western grey kangaroos who are there solely to provide tourists with a taste of the bush without leaving the city.
Despite the geotechnical constraints in building on reclaimed land, that it is yet to be developed reflects both pragmatic and psychological hurdles – it is just not how the river is thought of in Perth.
Swan and Canning river foreshores comprise some 2,068 Hectares or four per cent of the suburban core area. If 20% of the Swan and Canning River’s foreshore reserves were developed for medium density residential and mixed use precincts (still far less than that along the Yarra River) this could yield 62,049 dwellings in a high amenity situation. This could have the benefit of unlocking funds to pay for the ‘extraordinary expense’6 of protecting and moving infrastructure in relation to the Swan and Canning River’s projected 1.1m sea level rise for 2100. Richard Weller explains the Elizabeth Quay project has ‘broken the spell’7 that saw the Swan River’s landscaped foreshores zealously protected from urban development. Indeed if Elizabeth Quay proves to be a success there is no reason it could not be replicated at important river nodes elsewhere along the Swan and Canning rivers.
6 James Woodford, “Knocking on the Door,” in Griffith Review: Hot Air, How Nigh’s the End?, ed. Julianne Schultz (Brisbane: Griffith University, 2006), 64..
7 Richard Weller, “Postcard from Perth,” in Take Me to the River: The Story of Perth’s Foreshore, ed. Julian Bolleter (Perth: University of Western Austrlaia Publishing, 2015).
On the 30ha island, less than 2km from the city centre, lives a colony of only six Western Grey kangaroos who have an average space of 29,920m2 each.


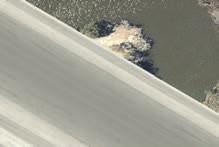


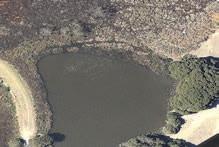
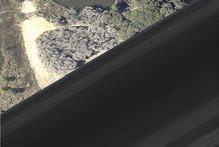


 Heirisson Island
kangaroo
Heirisson Island
kangaroo
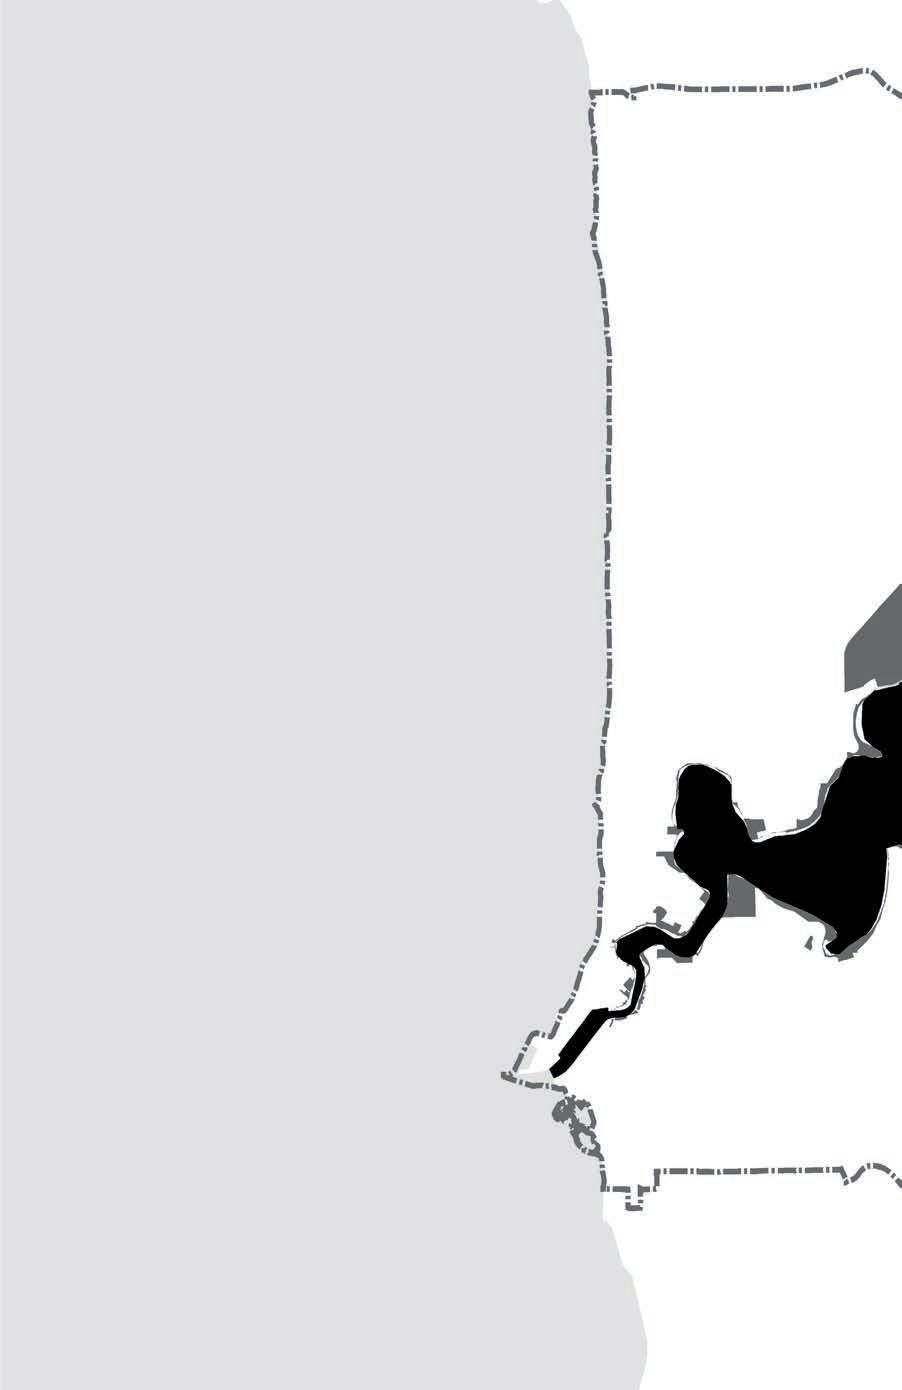
River foreshores - Perth 2015
Area = 2,068 Hectares or 4% of the suburban core area
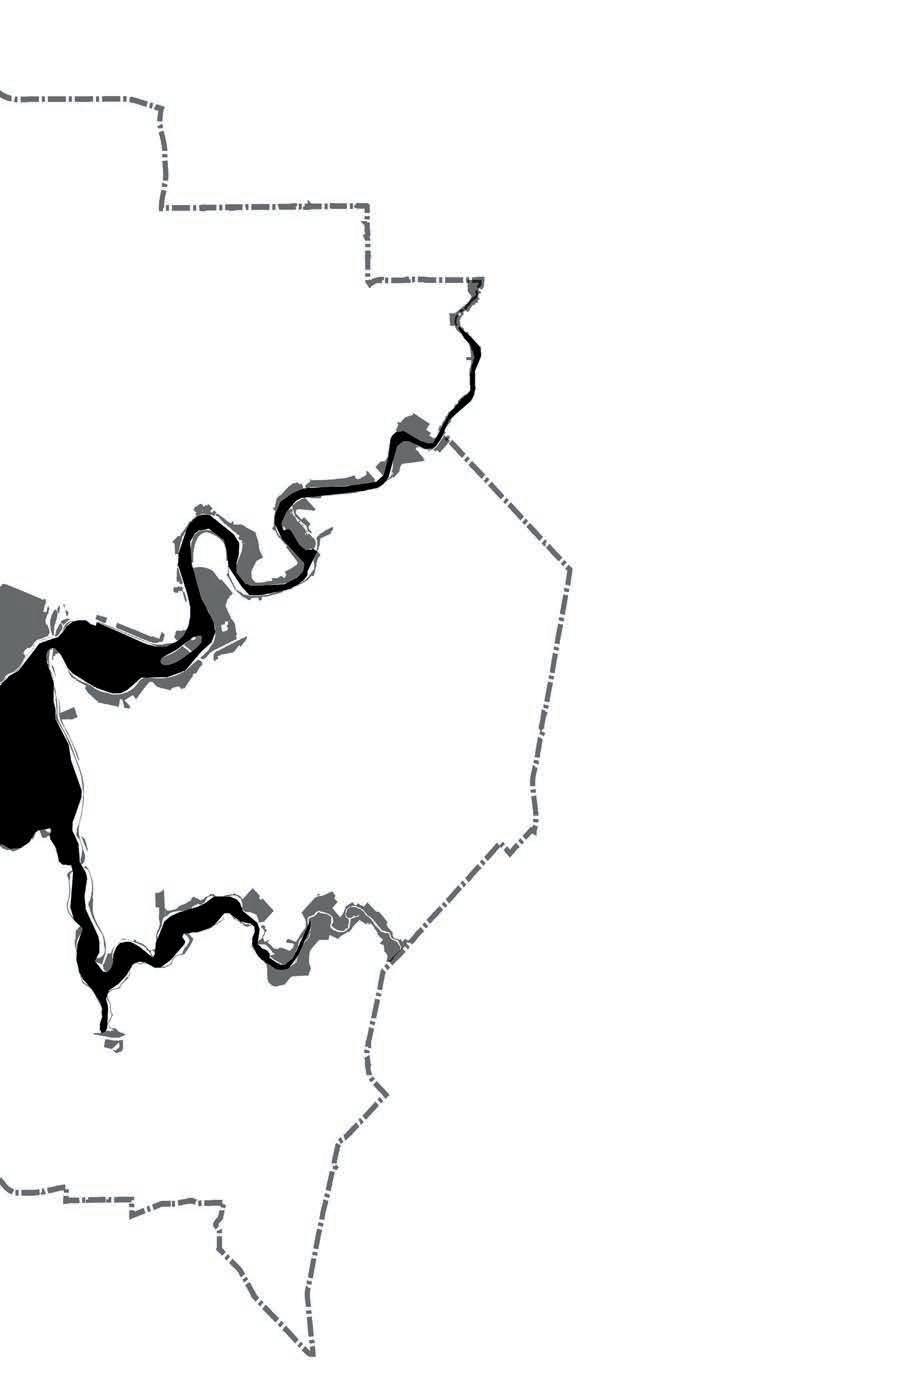
Foreshore reserves in Perth’s suburban core amounts to a generous 25 m2 per resident.
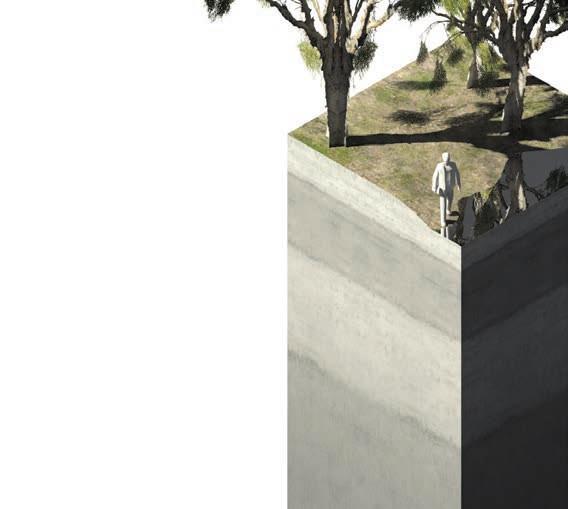


 Perth suburban core

Foreshore reserves in the Melbourne central subregion (roughly equivalent to Perth’s suburban core) amount to a 5.4 m2 per resident.


central subregion

 Perth suburban core
Melbourne
5.4m2
Perth suburban core
Melbourne
5.4m2
If the area of foreshore reserves in Perth’s suburban core were reduced from 25 m2 per resident to 20m2 (by 20%) they could yield 62,049 new dwellings at a medium-rise apartment density (calculated at a R200 density with an allowance of 15% for internal roads and 10% for public open space). This could avoid the need for a new suburb 6.6 times the size of Ellenbrook on the urban fringe.
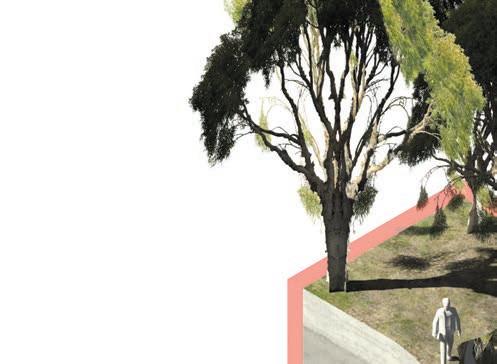


Infill dwelling

Infilldwellings
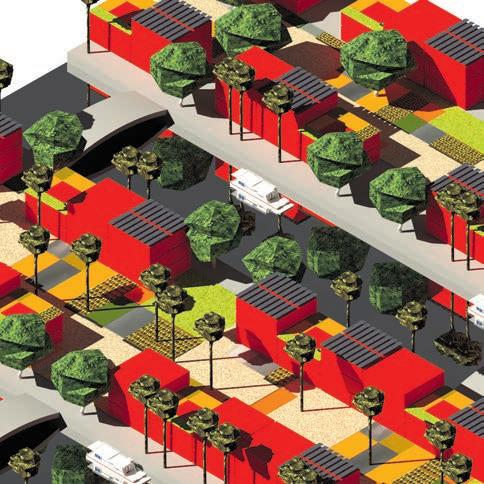

X 62,049 yeilded X 6.6 avoided
 SwanRiver
Ellenbrook
SwanRiver
Ellenbrook
Perth’s suburban core has a proportion of protected bushland that is commensurate with international conventions. To be truly effective at sustaining biodiversity, however, this area needs to be expanded.
The city of Perth is a biodiversity ‘hotspot’ within the larger regional Southwest Australia biodiversity hotspot. The endemic Perth landscape has extremely high levels of biodiversity including floristic endemism,1 which means that many of its plant species do not exist elsewhere, in Australia or the world. Within Perth’s suburban core, fragments of this landscape are contained in riparian habitats and river foreshores, coastal setbacks, wetlands and isolated patches of uncleared land. In Perth’s 1955 metropolitan plan much of this fragmented remnant bushland was officially designated as Regional Open Space and protected from development.
In 1993 Australia signed up to the Convention on Biological Diversity, which requires that a minimum ten per cent of terrestrial bioregions are set aside as protected areas;2 coincidentally this matches the amount of bushland protected in Perth’s suburban core (equivalent to 62 m2 per person). Later, at a conference of the Convention for Biological Diversity in Japan in 2010, the Aichi targets were established, which call for at least seventeen per cent of terrestrial areas to be protected by 2020 (equivalent to 104 m2 per person in Perth’s suburban core). To meet this target and provide much needed connectivity between existing isolated 1 For example, a study of remnant Banksia Woodlands around Perth found that 70% of native species are only found in 20% of the sites.Cristina Ramalho et al., “Complex Effects of Fragmentation on Remnant Woodland Plant Communities of a Rapidly Urbanizing Biodiversity Hotspot,” Ecology 95(2014): 144.
2 Simon Kilbane, “A National Green Network for Australia,” in Made in Australia: The Future of Australian Cities, ed. Julian Bolleter and Richard Weller (Perth: University of Western Australia Publishing, 2013), 307.
fragments of bushland,3 the provision of bushland in Perth’s suburban core should be increased in accordance with the West Australian Local Government Association (WALGA) biodiversity network, which proposes to provide such connections. Given the network has been partly ignored in current planning for densification, urban areas within the network should be immediately protected from further infill development and subjected to strict requirements for endemic vegetation cover and permeable ground surfaces. The resulting cohesive biodiversity network would maintain biodiversity levels in Perth’s suburban core, provide ecological connectivity4, aid in Perth meeting its targets for biodiversity protection, and reinforce connections between urban residents and the natural world. These connections are crucial because as commentators like Paul Ehrlich, Ted Trainer, and Bill Mollison explain: ‘Urbanization took us on a downward journey in which we began to lose contact with the earth, to pollute and degrade it, and to create bigger and bigger cities where people became more and more alienated.’5 In short the less connectivity Perth residents have with nature (the bush) the less likely they are to be active in caring for it at any level.
3 This connectivity is particularly important for fauna, including insects and birds, which play a vital role in the pollination of most native flora.
4 Ecological connectivity is particularly important in relation to climate change where plants and animals will, in many cases, need to move to survive the effects of changing rainfall and temperature patterns.
5 Peter Newman, Timothy Beatley, and Heather Boyer, Resilient Cities (Island Press, 2009), 38..
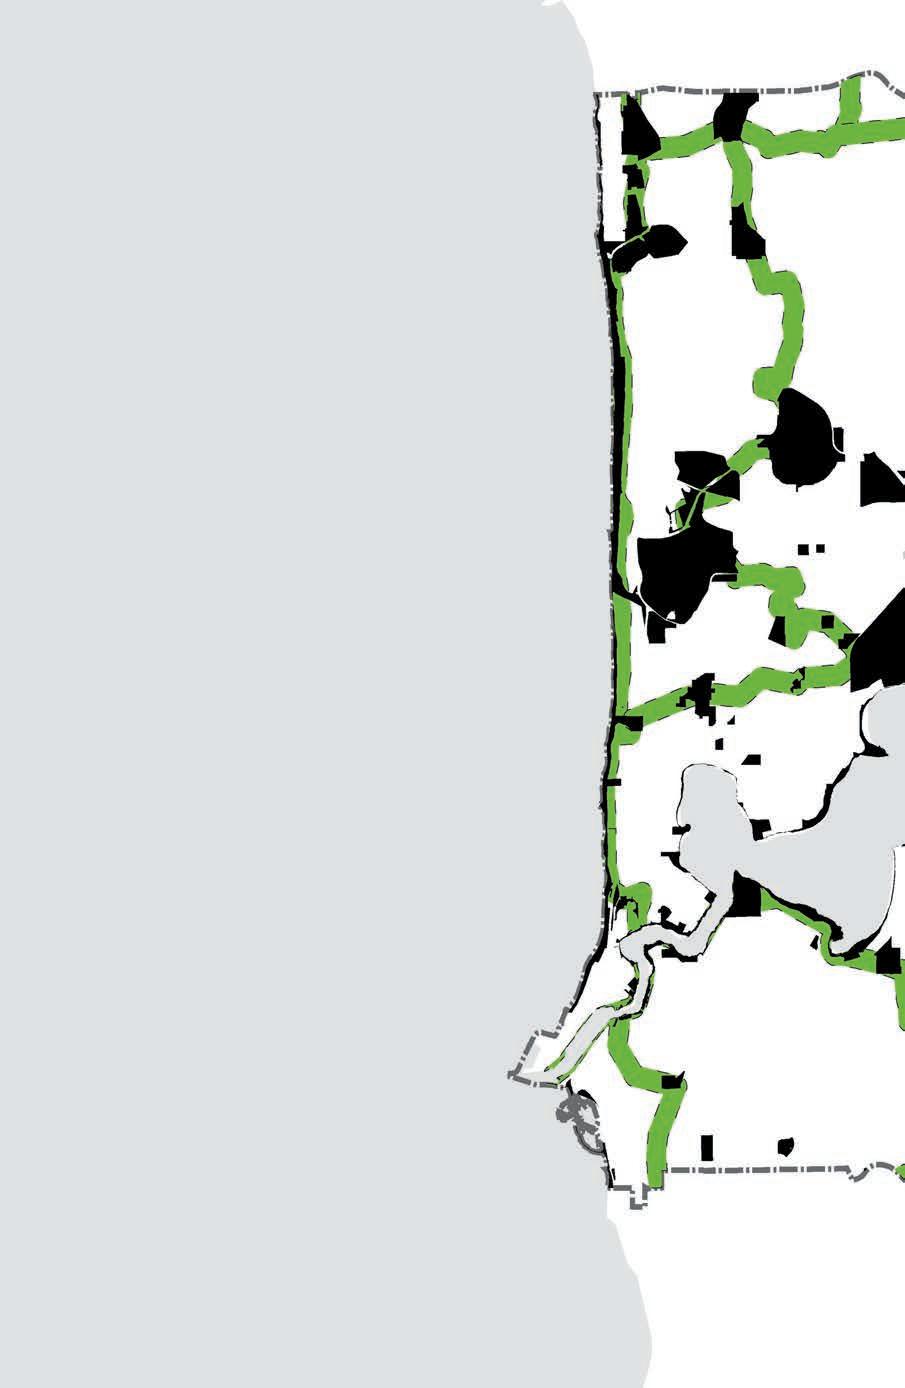
Bushland - Perth 2015
Area = 4,968 Hectares or 10% of the suburban core area 10%
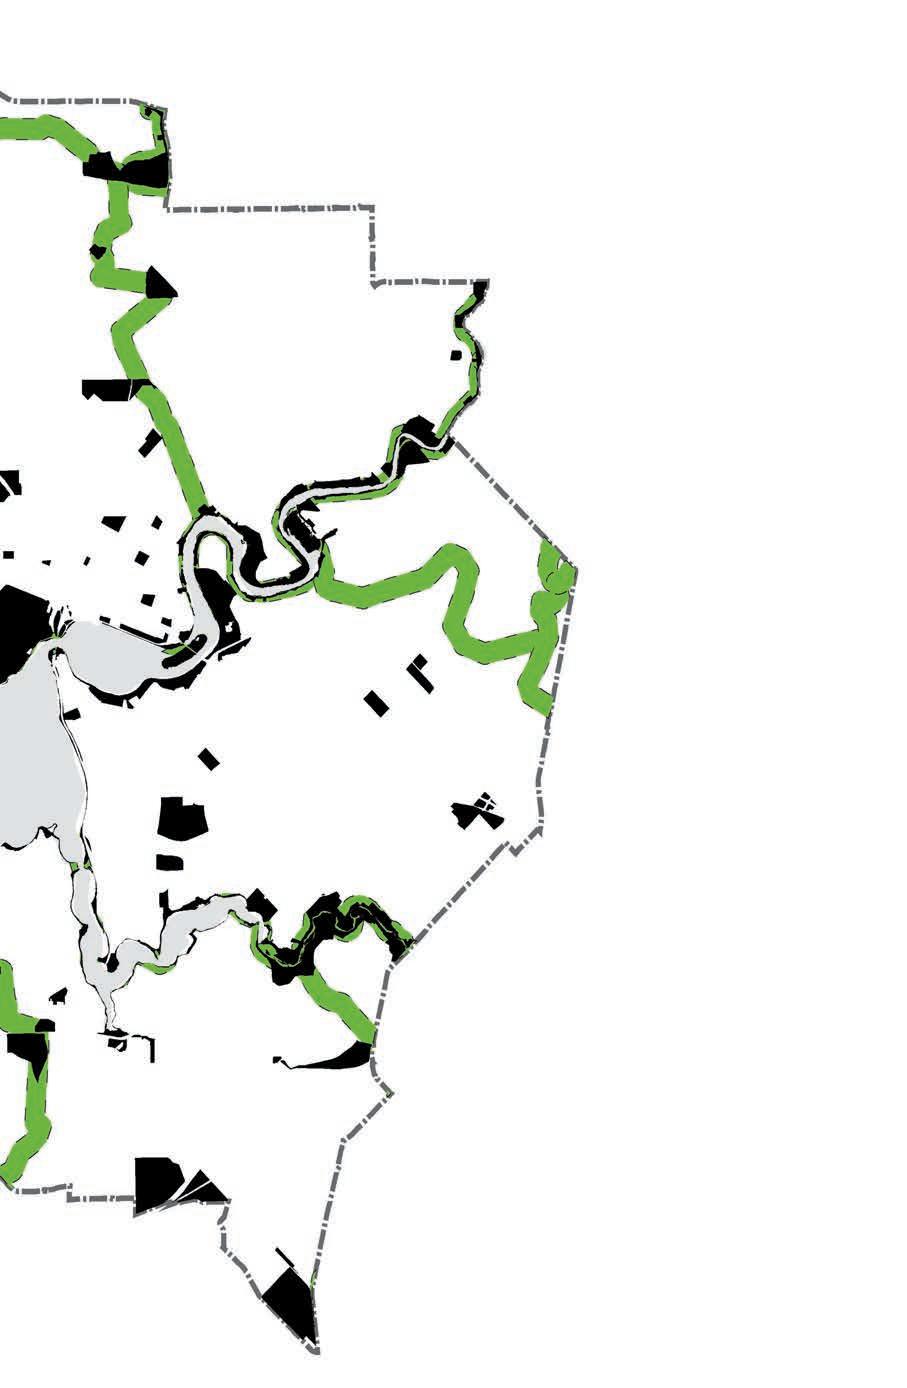
Remnant bushland
WALGA Biodiversity network
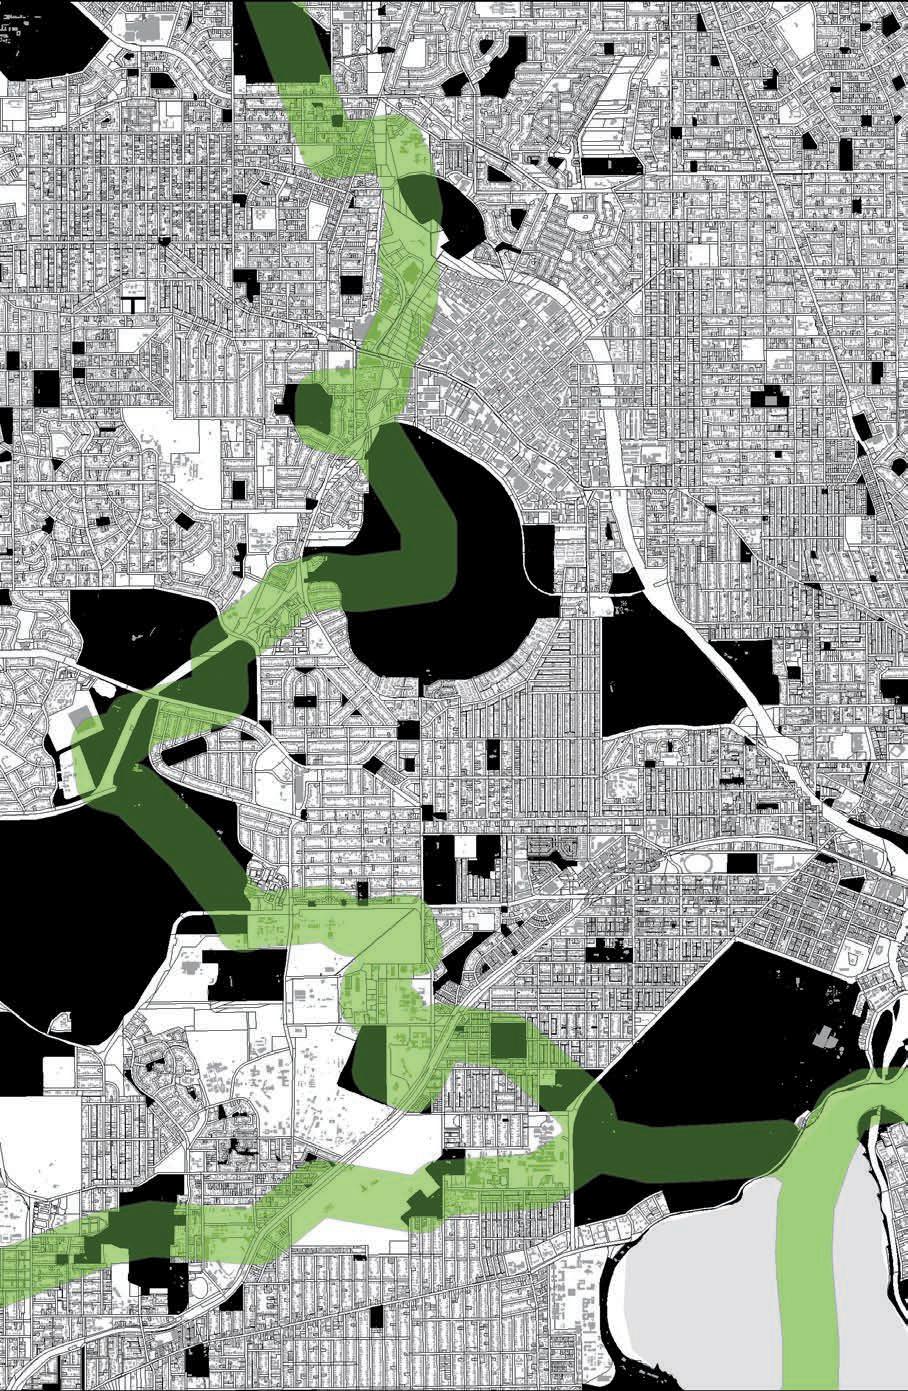
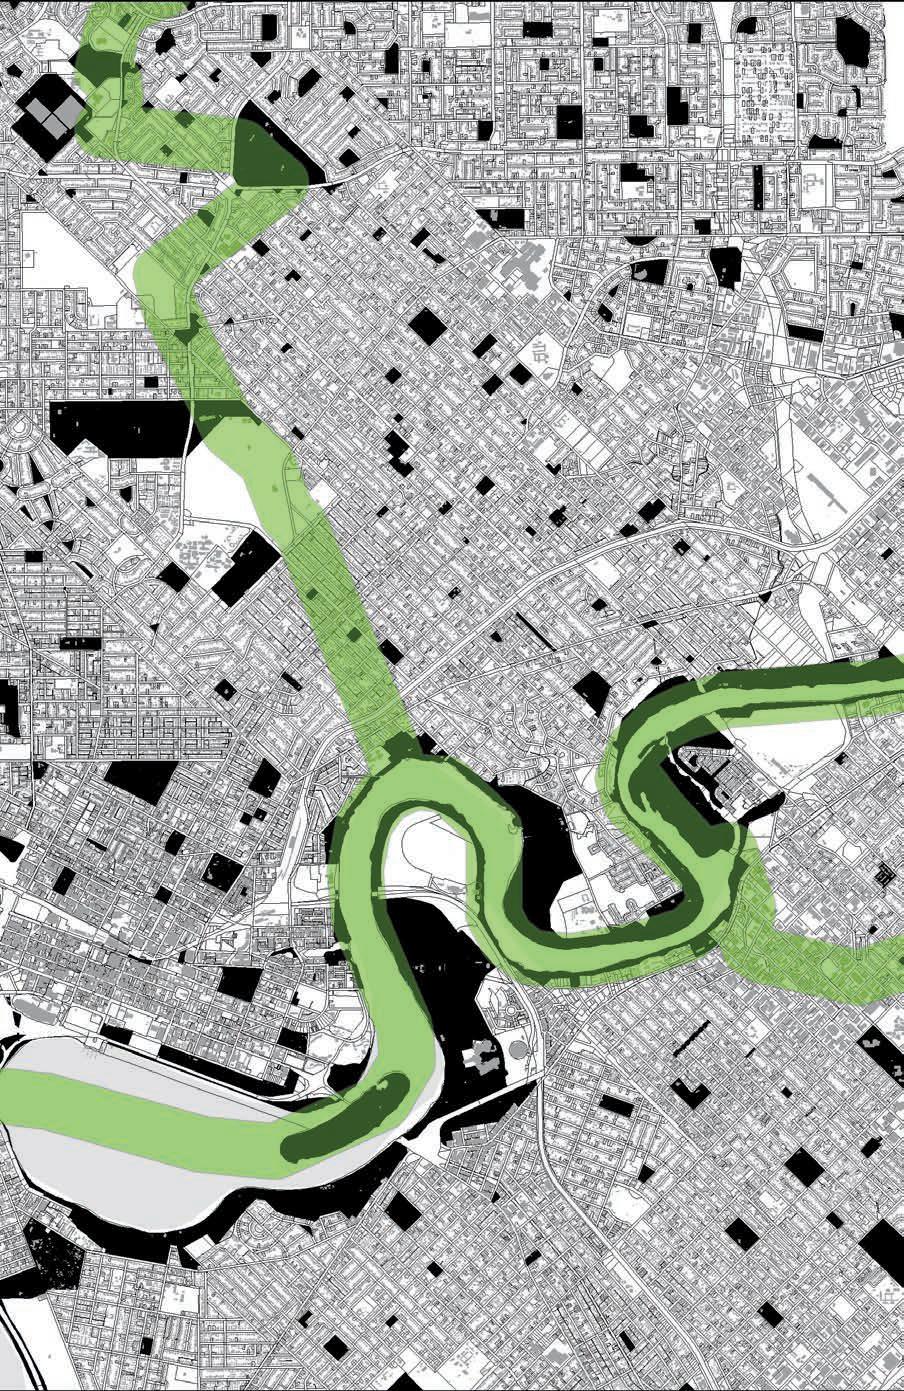
Biodiversity network - Perth 2015 the West Australian Local Government Association biodiversity network has been partly ignored in current planning for densification. Urban areas within the network should be immediately protected from further infill development and subjected to strict requirements for endemic vegetation cover and permeable ground surfaces.
In Perth’s suburban core each person has approximately 62m2 of bushland, which matches current minimum international standards set by the Convention on Biological Diversity.


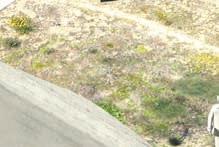


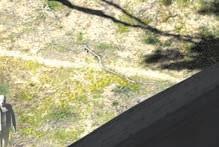


In 2010 the Aichi targets were established, requiring that at least 17% of terrestrial areas are to be protected by 2020. In Perth’s suburban core this would equal an area of 104m2 per person.


To ensure connectivity between large patches of remnant vegetation, and to meet the Aichi targets for biodiversity, requires an increase in bushland area to 104m2 per person.


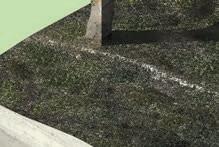


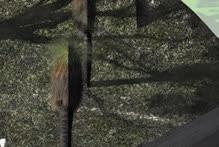


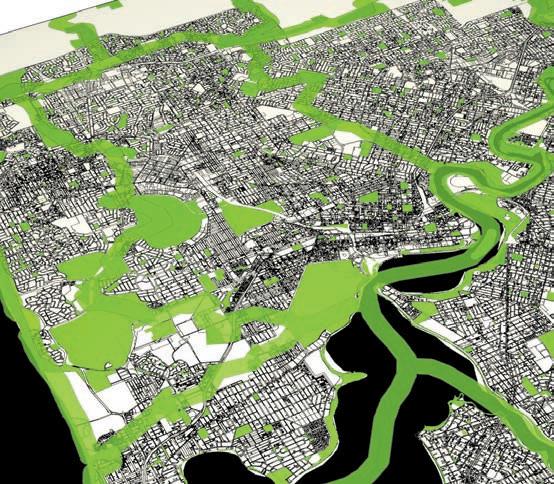
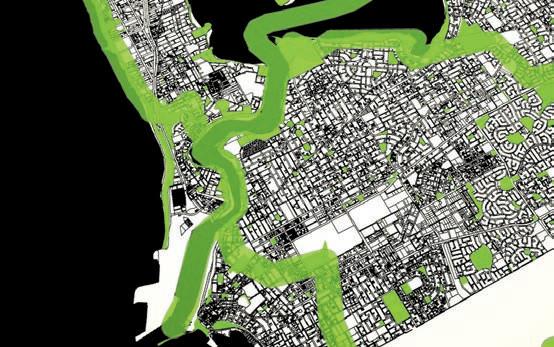
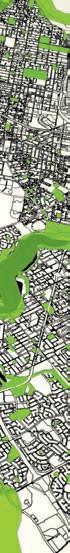
This book illustrates the potential for achieving almost three-quarters of a million new infill dwellings in Perth’s suburban core, which hypothetically could halt Perth’s suburban sprawl until 2037.
If all the opportunities for infill development proposed in this audit were achieved, hypothetically almost 1 million new dwellings in Perth’s suburban core could be created. These dwellings could house Perth’s projected population growth until 20431 and avoid the need to build a new suburban area over 97 times the size of Ellenbrook. While it may be naive to think this number of infill dwellings could be achieved, this book indicates that the modest target of 121,000 dwellings for the same region in Perth’s overarching plan has not maximised Perth’s infill development potential.2 Indeedthe infill development processes proposed in this book and those in Directions 2031 are generally complementary and thus the total infill development potential of the suburban core could be a combination of both figures, is over 1 million dwellings.
As the preface explained some of the proposals for infill development in this book are controversial. The proposed rationalisation of the landscapes that furnish the Australian ‘suburban dream’ inevitably will be unpopular, perhaps because these landscapes are linked to the enviable lifestyle Perth offers and to the city’s identity. However, the controversy could be partly alleviated through the application of two processes. First, the potential benefits
1 Based on the ABS Series B projections for population growth. Australian Bureau of Statistics, “3218.0 - Regional Population Growth, Australia, 2011-12,” Australian Bureau of Statistics, http://www. abs.gov.au/ausstats/abs@.nsf/mf/3218.0/.
2 Western Australian Department of Planning, “Central Metropolitan Perth Sub-Regional Strategy,” (Perth: Department of Planning, 2010).
unlocked by infill development need to be clearly communicated to individuals and communities. This book illustrates how funding could be generated to upgrade the open spaces if underutilised areas were developed for infill dwellings. Correlating infill development with incentives for communities gives people a reason to support such development, rather than merely tolerate or oppose it.3 Developers are generally not against such measures if it means they can increase residential density, as a Perth developer attests.
Give us those extra levels and we will give you the money for the ancillaries we all need. That’s the way I think we should do it and I don’t think there would be a developer who wouldn’t agree.4
At a more detailed level these upgrades to parks and other open spaces should be considered with respect to how they might furnish, and further, a new twenty-first century ‘Australian dream’ – this time associated with urbanity rather than sub-urbanity. Emphasis on ‘Australian’ means this dream needs to be ‘grounded in the lived experience or aspirations of the majority of Australians, not emerge from the pursuit of fashions imported from other cultures’5 – a unique challenge for Perth’s landscape architectural fraternity. Ideally it will also
3 Julian Bolleter and Dinis Candeias, “Synergistic Density: A Strategy for Residential Densification Developed in Relation to Community Preferences” (paper presented at the 6th International Urban Design Conference, Sydney, 09.09.13 2013).
4 Paul Lakey, “Panel Session” (paper presented at the Density 2015, Urban Development Institute of Australia, Perth, 2015).
5 Patrick Troy, “Saving Our Cities with Suburbs,” in Griffith Review: Dreams of Land, ed. Julianne Schultz (Brisbane: Griffith University, 2004), 125..
be productive in terms of providing ecosystem services, growing food and potentially producing energy.
Second, trade-offs between local infill development projects and overall metropolitan form need to be better communicated to Perth’s populace. The Elizabeth Quay project is a revealing case study. The proposal to develop the historic slice of riverfront turf that was ‘the Esplanade’, including infill dwellings (1,700 in total), offices, restaurants and hotels, provoked often passionate reactions in which the development was viewed as an assault on nature and Perth’s unique sense of place, despite the Esplanade’s artificiality (it being reclaimed from the river in the late nineteenth century).6 Strangely, but perhaps understandably, when a bulldozer on Perth’s northern development front ploughs into the remaining seven per cent of remnant bush in the Southwest Australia biodiversity hotspot, there is little public outcry.7 This reflects the fact that Elizabeth Quay is central to our image and experience of Perth, while the messy reality of Perth’s peri-urban fringe is not (and consequently is someone else’s problem). The fact that Perth’s overarching planning document, Directions 2031 – which should be drawing our attention to such peri-urban matters – does not make any expanded reference to the Southwest biodiversity
6 City Vision, “The Perth Waterfront Development (Elizabeth Quay) Project : Summary Report of Submissions by Invited Experts and Conclusions and Recommendations by City Vision,” ed. City Vision (Perth: CityVision, 2013), 14.
7 South west Australia Ecoregion Initiative, “The Southwest Australia Ecoregion: Jewel of the Australian Continent,” (Perth: South west Australia Ecoregion Initiative, 2006), 17.
hotspot and the threat posed to it by suburban development is both symptomatic of this disjointed vision and compounds it. This book, in contrast, openly illustrates connections between infill development proposals at a local scale with their metropolitan-scale implications.
While communicating the urgent need for infill developments to individuals and communities will be important, so will enlisting the support of the many and varied government departments that are stakeholders in Perth’s suburban form, local governments and developers. One of the main stumbling blocks for achieving infill development in Perth is an appropriate organisation which brings all the relevant stakeholders together in a productive way. As Alison Hailes representing the Western Australian Local Government Association explained at a recent density forum:
…we require a more dedicated structure either under the Western Australian Planning Commission (WAPC) or coordinated by the Metropolitan Redevelopment Authority (MRA)… Ideally it would bring together all the stakeholders, and the development industry, that need to be around the table and talking about how we can achieve the coordinated approach that’s needed.8
This organisation could be targeted to better integrate state and local levels where traditionally ‘the state holds all the 8 Alison Hailes, “Panel Session” (paper presented at the Density 2015, Urban Development Institute of Australia, Perth, 2015).
power and the purse strings, yet local councils take much of the responsibility for development decisions.’9 Across the fence the development community appears to also desire a forum to allow for better coordination of infill development (and the infrastructure required to support it), as local developer Paul Lakey attests: The way we deliver infrastructure in Perth (for infill development) is in a very silo mentality. You have MainRoads, WaterCorp and Western Power – and there is no coordination between them. The Infrastructure Coordination Committee (at the WAPC) is meant to be doing that it but it doesn’t... The sooner we understand and depoliticize infrastructure provision the betterbecause it’s holding Perth’s growth back. It could be done so much better, and much quicker 10
Furthermore there is animosity between developers and local councils that needs to be addressed. Local councils are often perceived by developers as unnecessarily blocking infill development proposals – resulting in developer frustration (and a comment by a local developer at a recent industry forum that councillors should be shot and rolled into the ocean…) Nonetheless on the need for an independent organisation for delivering infill, the warring parties seem to be very much aligned. The structure for this organisation could be based on the Neighbourhood Development Corporations (NDCs) proposed by the 9 Kim Dovey and Ian Woodcock, “Intensifying Melbourne: Trasit-Orientated Urban Design for Resilient Urban Futures,” (Melbourne: Melbourne School of Design, The University of Melbourne, 2014), 68..
10 Lakey, “Panel Session.”.
Grattan Institute. These independent bodies are intended to be partnerships between industry, local and state governments and would have real powers over planning and delivery.11
Furthermore the infill proposals in this book range across numerous landscape types, many of them the jurisdictions of government departments and corporations whose core missions are not directly linked to the need for urban consolidation (these include Western Power, the Public Transport Authority, the Department of Parks and Wildlife, the Water Corporation, the Main Roads Department and the Department of Sport and Recreation). While infill development targets are set by the state planning department and delivered by local governments, the responsibility for rationalising land assets should be shared among all departments that own or manage major urban land holdings. This book is not a manual for how this can be done, rather it is intended as a provocation for such a process to be conducted with the full input of such departments12 – perhaps coordinated by the NDCs mentioned earlier.
Alternatively, it has been suggested that what Perth needs is a ‘Department for Land Optimisation’ who would be tasked with auditing public landholdings and instructing government departments to cede particular land holdings which are superfluous to their requirements, but which could contribute to significant infill dwellings.13
11 J-F Kelly, P Breadon, and J Reichl, “Getting the Housing We Want,” (Melbourne: Grattan Institute, 2011), 1..
12As such, proposals in this book for the rationalisation of various landscapes should be understood as suggestions, not prescriptions.
13
Brett Wood-Gush, “Interview,” ed. Julian
While it hasn’t been the overt focus of this book, it should be noted that many of the obstacles to achieving infill development are regulatory and political rather than spatial, and as such solutions also need to be targeted to these areas.
While this book has tended to focus on the parts rather than the whole, what is the city model the results from such a process, and how does it differ from the current model proposed in Perth’s existing planning?14 First and foremost the city model produced by this process is one in which density is much more dispersed throughout Perth’s suburban core. Rather than infill dwellings being concentrated at medium to high densities around public transport nodes (Activity Centres) or scattered at relatively low density through backyards in this model medium density infill is dispersed among many suburban micronodes.15 There are a number of reasons for a focus on medium density (i.e. buildings between three and six stories). First and foremost the literature tells us that the energy efficiency of built form is maximised at this density.16 This scale importantly works with the economies of efficient modular construction which require a certain height threshold17 and Bolleter (Not published2015).
14 Presuming for a moment it was delivered in isolation from this planning.
15 A similar dispersed density city model has been proposed in Jago Dodson, “In the Wrong Place at the Wrong Time? Assessing Some Planning, Transport and Housing Market Limits to Urban Consolidation Policies,” Urban Policy and Research 28, no. 4 (2010): 499..
16 Ibid..
17 Simon Moore, “Panel Session” (paper presented at the Density 2015, Urban Development Institute of Australia, Perth, 2015).
avoids the substantial increase in embodied and operational energy use18 in higher density developments.19 Of course, the faith of many ‘analyses in residential density as a simple lever that can be used to manipulate urban sustainability appears to be misplaced.’20 As Brendan Gleeson explains the energy use influenced by the size, location and density of our housing only accounts for a small proportion of greenhouse emissions. Nonetheless other things being equal medium density housing appears to provide good framework within which an energy and resource efficient lifestyle can be lived. Finally this model of scattered medium density urban form works well from an urban ecology perspective as it creates the ‘patchy and diverse’ density that doesn’t overly compromise ecological connectivity across broader swathes of urban fabric.21
The disengaging of residential density from train stations (such as found in current Activity Centre planning) will require a different way of thinking about transport, public and private. In this model of medium density micro-nodes22 I envisage that the dominant mode of public transport will be formed via the
18 Rowan Gray, Brendan Gleeson, and Matthew Burke, “Urban Consolidation, Household Greenhouse Emissions and the Role of Planning,” Urban Policy and Research 28, no. 3 (2010): 338. 19 Ibid.
20 Brendan Gleeson, “Waking from the Dream: Towards Urban Resilience in the Face of Sudden Threat,” Griffith University Urban Research Program (2006): 43..
21 Cristina Ramalho, “Lecture for Audrc Case Studies Unit,” (Unpublished2015)..
22 Dodson, “In the Wrong Place at the Wrong Time? Assessing Some Planning, Transport and Housing Market Limits to Urban Consolidation Policies,” 497..
expansion of a spider web of suburban bus routes23 which connect back to Perth’s radial rail system. 24 Private transport ideally will be provided via electric cars, mopeds, electric bikes and conventional bikes (both of which will require dedicated cycle ways). While the number of public transport commuters has grown markedly in Perth, even as recently as 2011, seventy-seven per cent of Perth residents drove to work. Given our predilection for cars (we have 83 vehicles per 100 people- the highest rate in Australia)25 arguably planners should work with this obvious preference for private transport.
Tone Wheeler tells us a century of freestanding homes has ‘left Australians in love with the possibilities of indoor and outdoor private life, a life that will not be easily squeezed into towers.’26 The medium density building types proposed in this book could (partially) alleviate this situation through the provision of flat and habitable roof gardens (such as found on the Greek or Arabic home) as a substitute for traditional suburban gardens.27 Roof gardens which provide elevated amenity and food production will be particularly important for residents in marginal sites
23 Peter Mares, “Monday Morning in Mernda: A Land of Plenty, or Plenty in the Land?,” in Griffith Review 29: Prosper or Perish, ed. Julianne Schultz (Brisbane: Griffith University, 2010), 22..
24 Dodson, “In the Wrong Place at the Wrong Time? Assessing Some Planning, Transport and Housing Market Limits to Urban Consolidation Policies,” 497.
25 Department of Planning and Western Australian Planning Commission, “Draft Perth and Peel @3.5 Million,” (Perth: Western Australian Planning Commission, 2015), 47..
26 Tone Wheeler, “Garden Cities of Tomorrow: Upside Down, inside out and Back to Front,” in Griffith Review 29: Prosper or Perish, ed. Julianne Schultz (Brisbane: Griffith University, 2010), 51..
27 Ibid..
(such as light industrial areas, freeway or railway reserves) which provide little or no ground floor amenity to residents. There remains a question about whether Perth’s citizens are ready to trade-off an outer suburban house and land deal for an apartment next to a freeway with a roof garden (for instance). Evidence from a recent survey study provides some hope. This study indicated that a majority of those surveyed – sixty-seven per cent – would prefer to live in Perth’s suburban core but that only half this number could actually afford his location due to financial reasons. Furthermore three quarters of those surveyed said that they were prepared to trade off house size or type in order to live in their preferred area.28 While Perth has had a long term love affair with the free standing home – a building type which comprises 78% of all Perth homes – this could be on the wane.29
While this book has set out how Perth’s projected population growth could be accommodated within existing urban areas until 2043 a question remains as to how we should deal with a population of 6.6 million projected by 2061 – and beyond. I believe Perth will eventually require a strategy to decentralise population away from the capital towards regional centres, linked by effective public transport infrastructure such as a high-speed rail system.30 Too often the binary debate about urban 28 Department of Planning and Western Australian Planning Commission, “Draft Perth and Peel @3.5 Million,” 42..
29 ibid., 41..
30This proposal is covered in detail in Julian Bolleter and Richard Weller, Made in Australia: The Future of Australian Cities (Perth: University of Western Australia Press, 2013).
form in Australian cities oscillates between outer suburban growth and infill without consideration of decentralisation – a third way of accommodating population increases.31 The time is not yet right for a massive dispersion of Perth’s population to the regions; however, in by 2043 it will likely be essential if Perth is to not experience the problems that tend to beset larger cities.32
Cleary Perth faces major challenges in bracing for the impact of climate change, coping with basic raw materials shortages and safeguarding the biodiversity and ecosystem services upon which the city ultimately depends. While much of this may sound alarmist we have reason to be hopeful about our ability to creatively grapple with these (primarily) urban issues. As recently as 2007 visiting ex-Victorian premier Jeff Kennett described Perth as being so pristine as to be ‘almost antiseptic’. Conceding that Perth had ‘a heart,’ he then questioned whether indeed it had ‘a heartbeat’.33 Indeed up until recently even locals would engage in ‘Perth bashing’, referring to it as ‘Dullsville’. Despite Perth’s longstanding insecurities about being a ‘real’ city, there is an urban renaissance currently underway in Perth. Car use per capita is peaking,
31 This regional decentralization process could take inspiration from the policies and programs of the Whitlam government’s Department of Urban and Regional Development (DURD) between 1972 and 1975. Brendan Gleeson, “The Greatest Spoiler: Salvation in the Cities,” in Griffith Review 29: Prosper or Perish, ed. Julianne Schultz (Brisbane: Griffith University, 2010), 60..
32A city of 10 million people or more.
33 Pam Casellas, “Antiseptic Perth Is Devoid of Life: Kennet,” The West Australian, 08.03 2007.
and there has been a significant growth in rail and cycling.34 Furthermore those ‘thin bones of the walking city in Perth have been strengthened to create a much more interesting city centre.’35 As Peter Newman explains ‘The streets are now filled with pedestrians day and night, footpaths host coffee shops and bars spilling out in ways that were never imagined, even a decade ago. Young immigrants of the iron ore boom have given Perth a new urbanity.’36 The next phase of this urban renaissance now needs to extend beyond these limited urban islands to the inner and middle suburbs more generally.
This book has been about seeing the projected population growth over next decades not so much as a problem but rather as something Perth could actively benefit from. Indeed it can be regarded as an unparalleled creative opportunity – one which perhaps won’t be repeated in our time. Handled with foresight and communal purpose this growth should see our city become simultaneously denser, more liveable, and more biodiverse. This book has been directed towards this end.
34 Peter Newman, “The Rise of a Sustainable City: Much More Than the Wild West,” ed. Julianne Schultz and Anna Haebich, Griffith Review 47: Looking West (Brisbane: Griffith University, 2015). 135..
35 Ibid..
36 Ibid..


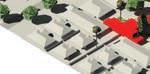
Gardens= 115,158
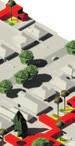


Railway reserves= 15,873


Asphalt= 230,332


Airport= 8,559


Industry= 95,434 new dwellings
Golf courses= 86,497
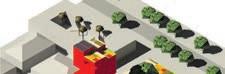

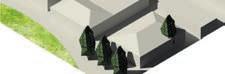
Universities= 17,809
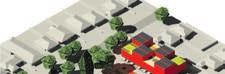
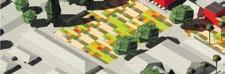

Primary schools= 8,624


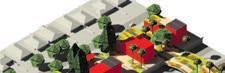
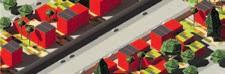
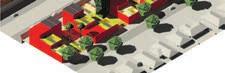
Freeway reserves= 48,990


Easements= 94,475


Parks= 144,003


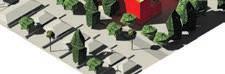
High schools= 13,076
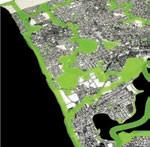


Foreshores= 62,049 new dwellings Bushland= 0 new dwellings
X 913,879 yeilded
X 97 avoided
Ellenbrook Infill dwelling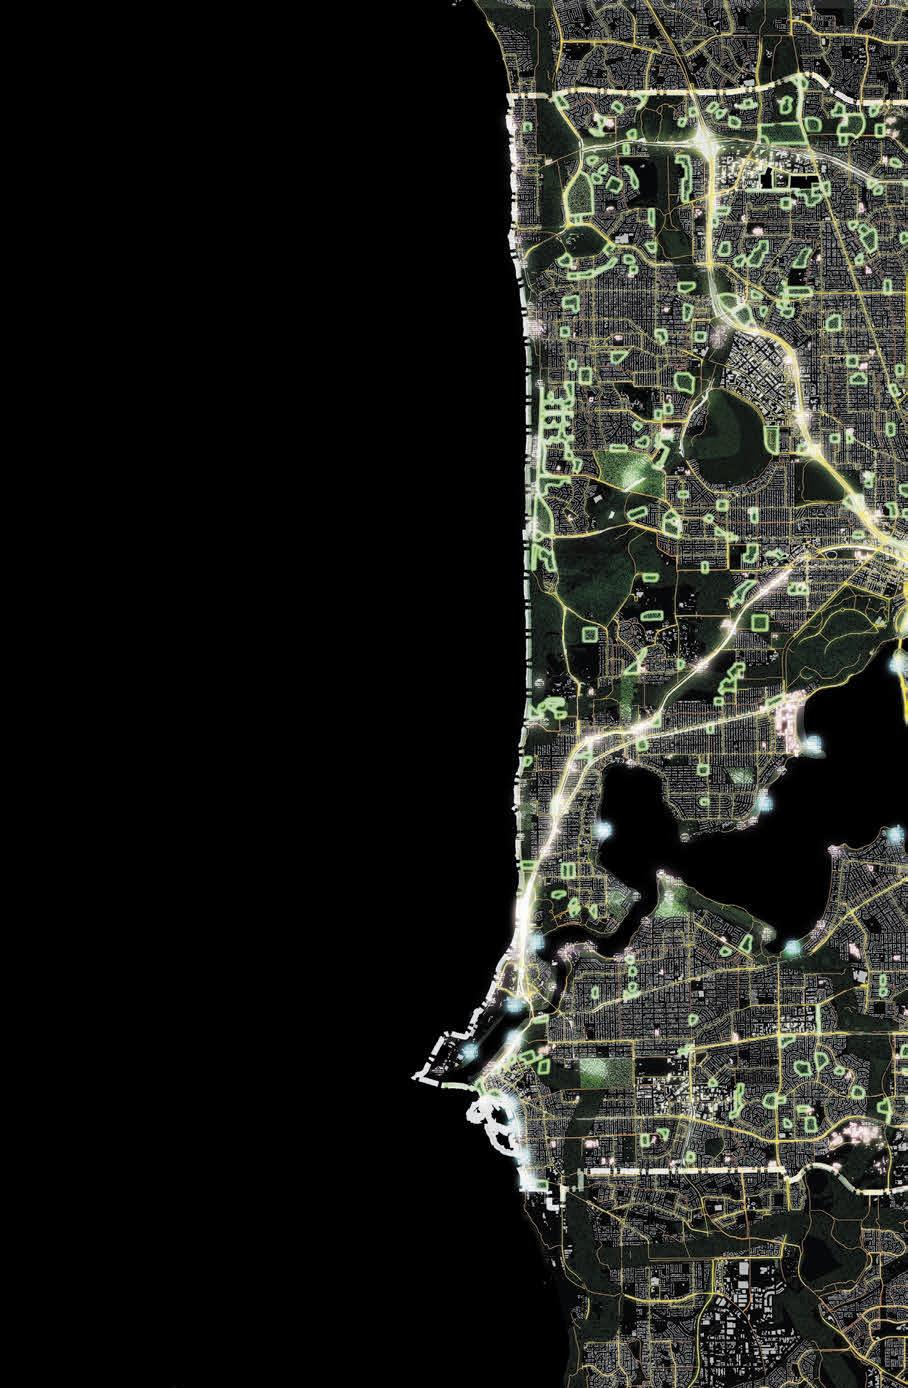
A hypothetical image of Perth’s suburban core in 2043 with an additional 913,879 infill dwellings (shown as the lit areas in this image). The dark green areas interwoven with this dense matrix is the WALGA biodiversity network which would be protected from any further urban development.
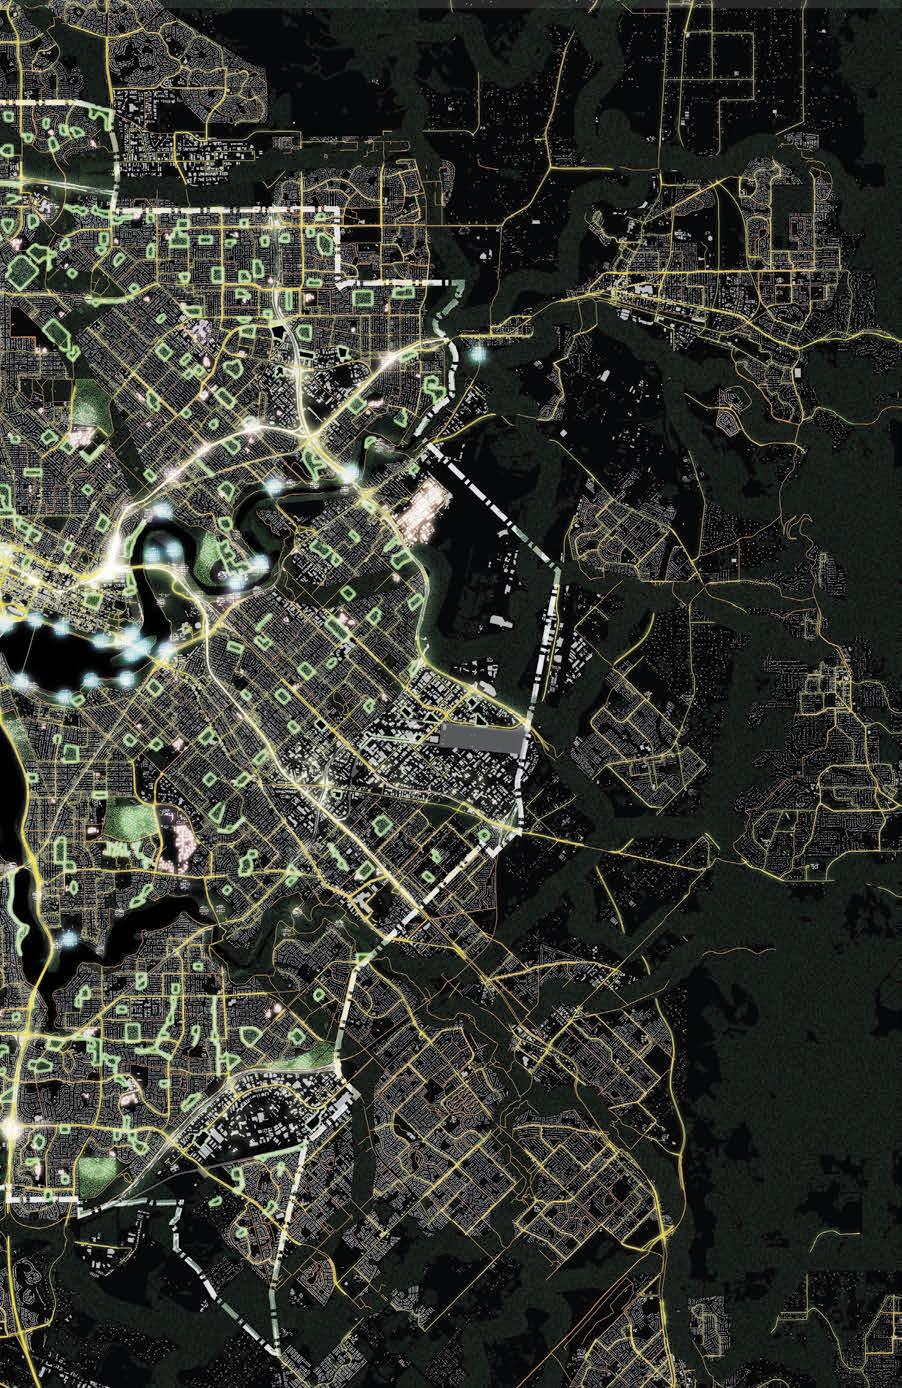
ARUP, and Curtin University Sustainability Policy Institute. “Reducing the Materials and Resource Intensity of the Built Form in the Perth and Peel Regions.” Perth: Department of Sustainability, Environment, Water, Population and Communities, 2013.
Australian Bureau of Statistics. “3218.0 - Regional Population Growth, Australia, 2011-12.” Australian Bureau of Statistics, http://www.abs.gov.au/ausstats/abs@. nsf/mf/3218.0/.
———. “Greater Perth Fact Sheet.” Australain Bureau of Statistics, http://www.abs. gov.au/websitedbs/censushome.nsf/4a256353001af3ed4b2562bb00121564/ mediafactsheets2nd/$file/Factsheets%20-%20Perth.pdf.
———. “Population Projections, Australia, 2012 to 2101.” Australian Bureau of Statistics, http://www.abs.gov.au/ausstats/abs@.nsf/ Lookup/3222.0main+features52012%20(base)%20to%202101.
Baum, Scott. “Suburban Scars: Australian Cities and Socio-Economic Deprivation.” Griffith University Urban Research Program, no. 15 (2008).
Berger, Alan. Drosscape: Wasting Land in Urban America. New York: Princeton Architectural Press, 2006.
Bolleter, Julian, and Dinis Candeias. “Synergistic Density: A Strategy for Residential Densification Developed in Relation to Community Preferences.” Paper presented at the 6th International Urban Design Conference, Sydney, 09.09.13 2013.
Bolleter, Julian, and Richard Weller. Made in Australia: The Future of Australian Cities. Perth: University of Western Australia Press, 2013.
Brunner, Julie, and Paul Cozens. “‘Where Have All the Trees Gone?’ Urban Consolidation and the Demise of Urban Vegetation: A Case Study from Western Australia.” Planning Practice & Research 28, no. 2 (2013): 231-55.
Casellas, Pam. “Antiseptic Perth Is Devoid of Life: Kennet.” The West Australian, 08.03 2007.
Centre for the Built Environment and Health. “Public Open Space (Pos) Geographic Information System (Gis) Layer.” University of Western Australia http://researchdata.ands.org.au/public-open-space-pos-geographic-informationsystem-gis-layer.
City of Stirling. “Public Open Space Strategy: Better Parks for All.” Perth: City of Stirling, 2008.
City of Sydney. “City of Sydney Employment Lands Strategy 2014 - 2019.” Sydney: City of Sydney, 2014.
City Vision. “The Perth Waterfront Development (Elizabeth Quay) Project : Summary Report of Submissions by Invited Experts and Conclusions and Recommendations by City Vision.” edited by City Vision. Perth: CityVision, 2013.
Committee for Perth. “Perth: Australia’s Most Prosperous City.” Committee for Perth, http://us7.campaign-archive1. com/?u=2d482b3fe059fe69ad22d7616&id=84c03b574d&e=[UNIQID].
Conservation International. “Hotspots.” Conservation International, http://www. conservation.org/How/Pages/Hotspots.aspx.
Curtin University. “Creating the City of Innovation.” edited by Curtin University. Perth: Curtin University, 2013.
Curtin University, and Hames Sharley. “The Housing We’d Choose: A Study for Perth and Peel.” Perth: Department of Housing Department of Planning, 2013.
Department of Infrastructure and Transport: Major Cities Unit. “State of Australian Cities.” Canberra: Department of Infrastructure and Transport, 2012.
Department of Planning, and Western Australian Planning Commission. “Draft Perth and Peel @3.5 Million.” Perth: Western Australian Planning Commission, 2015.
———. “Economic and Employment Lands Strategy: Non-Heavy Industrial Perth Metropolitan and Peel Regions.” Perth: Western Australian Planning Commission, 2012.
———. “Urban Growth Monitor: Perth Metropolitan, Peel and Greater Bunbury Regions.” Perth: Western Australian Planning Commission, 2012.
———. “Urban Growth Monitor: Perth Metropolitan, Peel and Greater Bunbury Regions.” Perth: Western Australian Planning Commission, 2014.
Dodson, Jago. “In the Wrong Place at the Wrong Time? Assessing Some Planning, Transport and Housing Market Limits to Urban Consolidation Policies.” Urban Policy and Research 28, no. 4 (2010): 487-504.
Dodson, Jago, and Neil Sipe. “Unsettling Suburbia: The New Landscape of Oil and Mortgage Vulnerabilty in Australian Cities.” Brisbane: Griffith University, 2008.
Dovey, Kim, and Leonie Sandercock. “Please, Politics and the “Public Interest”: Melbourne’s Riverscape Revitalization.” American Planning Association 68, no. 2 (2002): 151-64.
Dovey, Kim, and Ian Woodcock. “Intensifying Melbourne: Trasit-Orientated Urban Design for Resilient Urban Futures.” Melbourne: Melbourne School of Design, The University of Melbourne, 2014.
Dunham-Jones, Ellen. Retrofitting Urban Solutions for Redesigning Suburbs. New Jersey: Wiley, 2011.
Elliot, Ross. “Myth # 4 Increasing House Sizes Mean Urban Sprawl.” Property Council of Australia, http://www.propertyoz.com.au/sa/Article/Resource. aspx?p=21&media=461.
Farchild, Caroline. “Driverless Cars, a Boon for Working Moms?” Fortune http:// transact.org/.
Gleeson, Brendan. “The Greatest Spoiler: Salvation in the Cities.” In Griffith Review 29: Prosper or Perish, edited by Julianne Schultz, 57-66. Brisbane: Griffith University, 2010.
———. Lifeboat Cities. Sydney: UNSW Press, 2010.
———. “Waking from the Dream: Towards Urban Resilience in the Face of Sudden Threat.” Griffith University Urban Research Program (2006).
Gray, Rowan, Brendan Gleeson, and Matthew Burke. “Urban Consolidation, Household Greenhouse Emissions and the Role of Planning.” Urban Policy and Research 28, no. 3 (2010): 335-46.
Hailes, Alison. “Panel Session.” Paper presented at the Density 2015, Urban Development Institute of Australia, Perth, 2015.
Hakjkowicz, Stefan, Hannah Cook, Lisa Wilhelmseder, and Naomi Boughen. “The Future of Australian Sport: Megatrends Shaping the Sports Sector over Coming Decades.” Australia: CSIRO, 2013.
Hatt, Tony. “Panel Session.” Paper presented at the Density 2015, Urban Development Institute of Australia, Perth, 2015.
Hedgecock, David. “Watering a Thirsty City: Planning for Perth’s Water Regime.” In Planning Perspectives from Western Australia: A Reader in Theory and Practice, edited by I Alexander, S Greive and D Hedgcock, 85-103. Perth: Fremantle Press, 2010.
Hopper, Stephen, and Paul Gioa. “The Southwest Australian Floristic Region: Evolution and Coservation of a Global Hotspot of Biodiversity.” Annual Review of Ecology, Evolution, and Systematics 35 (2004): 623-50.
Johnstone, C. “Merger to Drive Golf Clubs into Future.” The Age, http://www. theage.com.au/victoria/merger-to-drive-golf-clubs-into-future-20130920-2u5ju. html.
Kelly, J-F, P Breadon, C Davis, A Hunter, P Mares, D Mullerworth, and B Weidmann. “Social Cities.” Melbourne: Grattan Institute, 2012.
Kelly, J-F, P Breadon, and J Reichl. “Getting the Housing We Want.” Melbourne: Grattan Institute, 2011.
Kilbane, Simon. “A National Green Network for Australia.” In Made in Australia: The Future of Australian Cities, edited by Julian Bolleter and Richard Weller, 306-13. Perth: University of Western Australia Publishing, 2013.
Lakey, Paul. “Panel Session.” Paper presented at the Density 2015, Urban Development Institute of Australia, Perth, 2015.
Law, Peter. “Future Perth: 900,000 New Homes without Urban Sprawl.” Perth Now, http://www.perthnow.com.au/news/special-features/future-perth-900000-newhomes-without-the-urban-sprawl/story-fnknbeni-1227098457513.
Mares, Peter. “Monday Morning in Mernda: A Land of Plenty, or Plenty in the Land?”. In Griffith Review 29: Prosper or Perish, edited by Julianne Schultz, 13-45. Brisbane: Griffith University, 2010.
McCrea, Rod, and Peter Walters. “Impacts of Urban Consolidation on Urban Liveability: Comparing an Inner and Outer Suburb in Brisbane, Australia.” Housing, Theory and Society 29, no. 2 (2012): 190-206.
McManus, Phil. “Planning with and for Trees in Perth: Yesterday, Today and Tomorrow.” In Planning Perspectives from Western Australia: A Reader in Theory and Practice, edited by I Alexander, S Greive and D Hedgcock, 340-53. Perth: Fremantle Press, 2010.
Newman, Peter. “The Rise of a Sustainable City: Much More Than the Wild West.” In Griffith Review 47: Looking West, edited by Julianne Schultz and Anna Haebich Brisbane: Griffith University, 2015.
Newman, Peter, Timothy Beatley, and Heather Boyer. Resilient Cities. Island Press, 2009.
Newman, Peter, and Jeff Kenworthy. “Peak Car Use: Understanding the Demise of Automobile Dependence.” World Transport Policy & Practice 17, no. 2 (2011): 31-42.
O’Connor, Andrew “Wa to Open Public Land Sales to Unsolicited Bids, Lands Minister Terry Redman Says.” Australian Broadcasting Corporation, http://www. abc.net.au/news/2015-06-24/wa-land-for-sale-to-unsolicited-bids-says-terryredman/6570782.
Parsons Brinckerhoff. “Corridor Public Transport Use Assessment.” Sydney: Department of Infrastructure, Planning and Natural Resources Roads and Traffic Authority, New South Wales, 2004.
Productivity Commission. “Performance Benchmarking of Australian Business Regulation: Planning, Zoning and Development Assessments.”. Canberra: Productivity Commission, 2011.
Ramalho, Cristina. “Lecture for Audrc Case Studies Unit.” Unpublished, 2015.
Ramalho, Cristina, Ettienne Laliberte, Pieter Poot, and Richard Hobbs. “Complex Effects of Fragmentation on Remnant Woodland Plant Communities of a Rapidly Urbanizing Biodiversity Hotspot.” Ecology 95 (01.09 2014): 143-55.
Rowley, Steven, and Peter Phibbs. “Delivering Diverse and Affordable Housing on Infill Development Sites.” Melbourne: Australian Housing and Urban Research Institute, 2012.
Searle, Glen. “Urban Consolidation and the Inadequacy of Local Open Space Provision in Sydney.” Urban Policy and Research 29, no. 02 (2011): 201-08.
Seddon, George. “The Australian Back Yard.” In Australian Popular Culture, edited by Ian Craven, 22-35. Cambridge: Cambridge University Press, 1994.
Seto, Karen C., Burak Guneralp, and Lucy Hutyra. “Global Forecasts of Urban Expansion to 2030 and Direct Impacts on Biodiversity and Carbon Pools.” PNAS 109, no. 40 (2012): 16083-88.
Sipe, Neil, and Jason Byrne. “Green and Open Space Planning for Urban Consolidation- a Review of the Literature and Best Practice.” Brisbane: Griffith University, 2010.
South west Australia Ecoregion Initiative. “The Southwest Australia Ecoregion: Jewel of the Australian Continent.” Perth: South west Australia Ecoregion Initiative, 2006.
Stephenson, G, and J A Hepburn. “Plan for the Metropolitan Region Perth and Fremantle 1955 Report.” Perth: Government Printing Office 1955.
The Greens. “Perth’s ‘Top Ten’ Places Too Precious to Lose- under Direct Threat.” The Greens, http://wa.greens.org.au/sites/greens.org.au/files/Appendix%20-%20 Top%20ten%20places%20under%20threat-1.pdf.
Troy, Patrick. “Saving Our Cities with Suburbs.” In Griffith Review: Dreams of Land, edited by Julianne Schultz. Brisbane: Griffith University, 2004.
Verity, Paul. “Ellenbrook Estate – Revisited.” Landscape Architecture Australia, no. 132 (2011).
Weller, Richard. “Postcard from Perth.” In Take Me to the River: The Story of Perth’s Foreshore, edited by Julian Bolleter, 239-44. Perth: University of Western Austrlaia Publishing, 2015.
West Australian Planning Commission, and Department of Planning and
Infrastructure. “Liveable Neighbourhoods; a Western Australian Government Sustainable Cities Initiative.” edited by West Australian Planning Commision. Perth, 2007.
Western Australian Department of Planning. “Central Metropolitan Perth SubRegional Strategy.” Perth: Department of Planning, 2010.
———. “Directions 2031 and Beyond: Metropolitan Planning Beyond the Horizon.” Perth: Department of Planning, 2010.
Western Australian Planning Commission. “Statement of Planning Policy No. 4.1: State Industrial Buffer Policy.” edited by Western Australian Planning Commission. Perth: Western Australian Government, 1997.
Wheeler, Tone. “Garden Cities of Tomorrow: Upside Down, inside out and Back to Front.” In Griffith Review 29: Prosper or Perish, edited by Julianne Schultz, 46-56. Brisbane: Griffith University, 2010.
Whish- Wilson, David. Perth. Sydney: New South Publishing, 2013.
Wood-Gush, Brett. “Interview.” edited by Julian Bolleter. Not published, 2015.
Woodford, James. “Knocking on the Door.” In Griffith Review: Hot Air, How Nigh’s the End?, edited by Julianne Schultz, 58-68. Brisbane: Griffith University, 2006.
WWF. “Perth Urban Sprawl.” WWF, http://www.wwf.org.au/our_work/saving_the_ natural_world/australian_priority_places/southwest_australia/the_perth_ metropolitan_area/perth_urban_sprawl/.

Dr Julian Bolleter is an assistant professor at the Australian Urban Design Research Centre at the University of Western Australia. His role at the AUDRC includes teaching a master’s program in urban design and conducting urban design research projects.
This publication has been made possible through the help and support of the entire Australian Urban Design Research Centre team.
In particular thanks go to:
William Grace, Rachel Pleasant and Cristina Ramalho for their insightful reviews of an earlier draft of the book
Daniela Ottmann for preparing the user-friendly graphic template for the book
Zaheer Allam and Maximillian Priebe for assistance with time-lapse photography
Georgia Evans (and her dad) for assistance with the graphics
Joerg Baumeister and Anthony Duckworth-Smith for their valuable contributions to the book’s content
Jill Penter for her ever-patient copyediting
UWA Publishing for supporting this project from the outset
My partner, Dr Sally Appleton, for making possible this second book of 2015
Imprint
First published in 2015 by UWA Publishing Crawley, Western Australia 6009
www.uwap.uwa.edu.au
UWAP is an imprint of UWA Publishing a division of The University of Western Australia
This book is copyright. Apart from any fair dealing for the purpose of private study, research, criticism or review, as permitted under the Copyright Act 1968, no part may be reproduced by any process without written permission. Enquiries should be made to the publisher.
Copyright © 2015
The moral right of the authors has been asserted.
National Library of Australia
Cataloguing-in-Publication information in process