Sprawl and the City
Combining the qualities of suburban and urban living to create better residential infill
Anthony Duckworth-SmithUWA Publishing University of Western Australia

UWA Publishing University of Western Australia
Sprawl and the City | 6
/ Sampling Sites | 16
// Base Data | 28
/// Criteria, Objectives and Measurement | 30
Amenity | 32
Quality of Life | 52
Resource Intensity | 68
Social | 90
Household Economics | 106
//// Results | 120
Summary of Totals | 122
///// Discussion and Recommendations | 124
////// Improving Area Infill | 128
/////// Summary | 136
Appendix A: Methods of Measurement | 140
Appendix B: Tactics by Scale and Type | 150
Additional References | 154 Acknowledgements | 156
Imprint | 157
How can an understanding of the qualities of different residential environments be used to assess and improve urban infill in sprawling cities?
Wealthy and politically stable mediumsized, low-density cities like Perth in Western Australia consistently rank highly in global city liveability surveys.1 Apart from the benefits afforded by their security and prosperity these types of metropolitan areas tend to perform well against functional criteria such as accessibility of services and quality of infrastructure. This is despite the challenges of providing extensive networks to service a diffuse pattern of urban settlement. These cities, in terms of averaged measures of liveability, appear to be operating close to an optimal state balancing residential amenity with effective infrastructure and service provision.
Perth is predicted to experience substantial population growth well into the future. If current and historical trends continue, this will mean a continued expansion of a sprawling suburban development pattern across the metropolitan fringe. This would mean a shift away from its advantageous combination of metropolitan scale and form and a transition into a large-sized, low-density city. There is emerging evidence to suggest that if this is the case, it will struggle to sustain the qualities of living that it has been used to, as infrastruc-
1 Definitions of liveability from global surveys vary widely with some assessments prioritising economic factors and others concentrating on lifestyle. The broadest definition would simply describe the degree to which a place supports different aspects and functions of life such as safety, employment, health, convenience and social and aesthetic needs.
ture becomes strained and reliance on the automobile makes travel more difficult and expensive.2
To counteract this loss of ‘performance’ there is much support at a strategic level in Perth for a more compact city form where a larger proportion of new development is concentrated within existing urban areas.3 This type of development is referred to as ‘urban infill’ or ‘urban intensification’. Whilst this may make sense at the metropolitan scale the challenge for planners and urban designers is to consider what forms of urban infill will be appropriate in achieving this city-wide model. The compact city demands an alternative, more intense pattern of urban development. Perth is therefore at something of a crossroads in terms of defining its future form and character. Applied research is needed to develop the new products and practices required to achieve this different city form.
At the general level there are three ways in which urban infill can be achieved in a widespread fashion –Node, Corridor and Area (see over).
2 DODSON, J. & SIPE, N. May 2008. Shocking the Suburbs: Urban Location, Homeownership and Oil Vulnerability in the Australian City. Housing Studies , 23, pp.377–401.
3 WESTERN AUSTRALIAN PLANNING COMMISSION
2010. Directions 2031 and beyond . Perth: Western Australian Planning Commission.
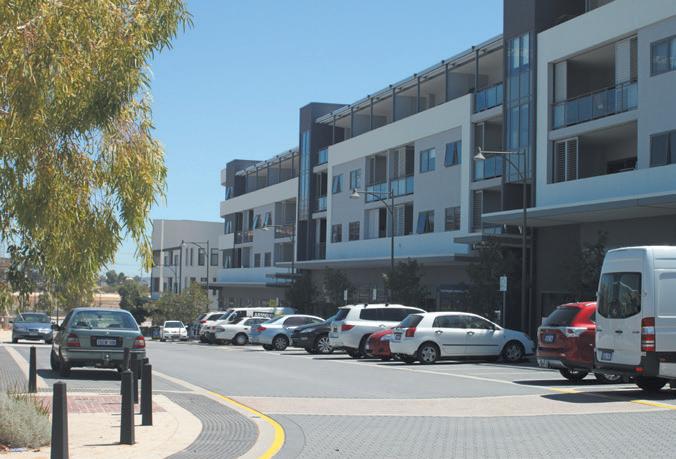
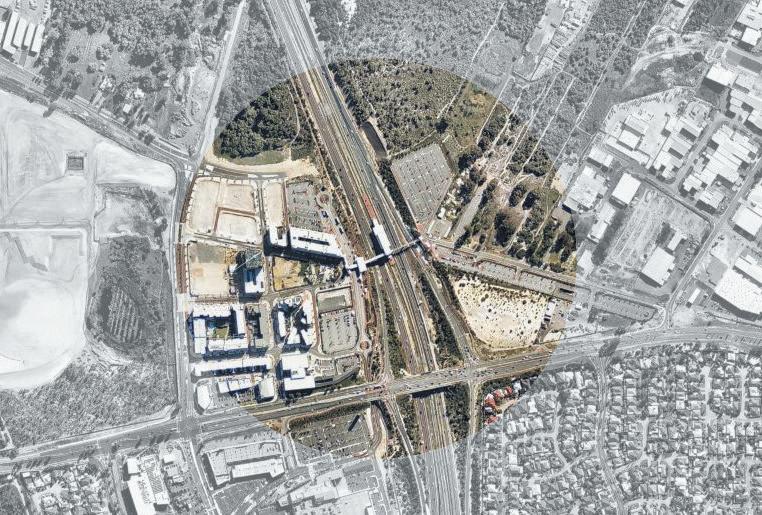
Node infill is characterised by the agglomeration of mixed use urban activity around a central facility or group of facilities, such as a train station or shopping area, and/or entertainment uses. Typically the residential typologies are high-density, medium- to high-rise apartment complexes.
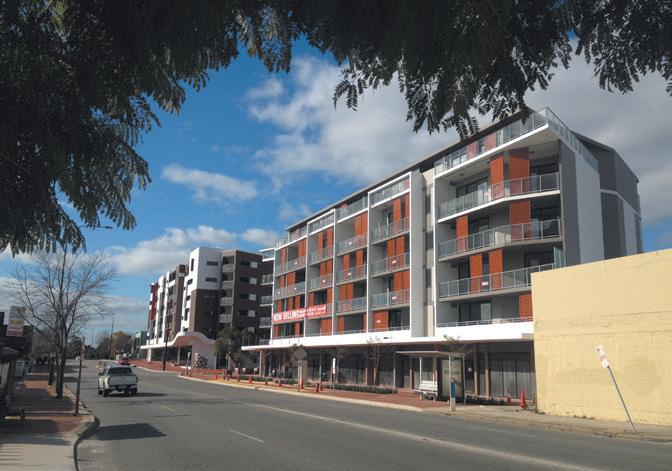
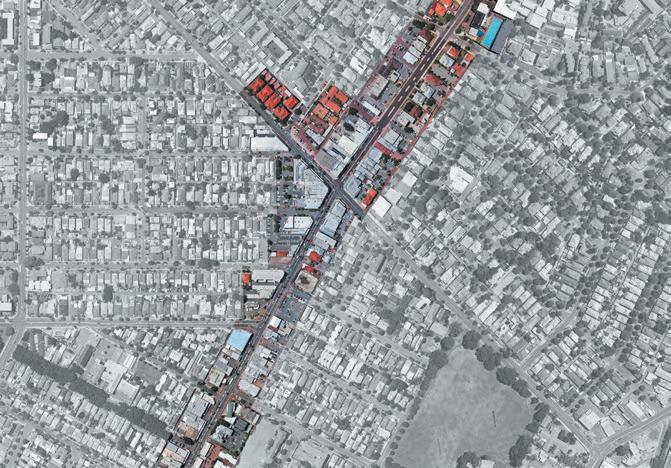
Corridor infill development consists of primarily medium- to high-density residential apartments distributed along a carriageway with road based public transport such as buses or light rail. The rear of the development often abuts an existing suburban area.
Area infill is characterised by low- to medium-rise residential development occurring in a piecemeal fashion on existing suburban lots which are typically subdivided into smaller landholdings. Building typologies are usually standalone or grouped dwellings but may also consist of apartments.
The question often debated is which of these types of infill is the most appropriate – and further what are the challenges in making these residential environments broadly attractive and an enduring model for urban development? In order to answer these questions it is necessary to understand the relative qualities of living in different residential environments in these types of cities so that expectations are understood and the shortcomings of proposed models can be identified. In turn this would allow these to be addressed and the best case put forward.
There are many different ways in which the qualities of living in a particular place or what we may term a ‘residential environment’ can be assessed. Broadly these are either from the viewpoint of the expert or from experience. Whilst inhabitants provide valuable information based on lived experience, professionals are able to study more complex factors which require specialised knowledge. For example, health professionals are able to determine the likelihood of poor health outcomes from certain living arrangements and architects are able to communicate qualities of space and light. Therefore to be robust, any framework for measuring quality must allow both professional judgement and lay opinion.
The structure of the assessment framework developed in this document works down from an urban metabolism framework and up from the study of a number of conceptual and analytical approaches to residential environment quality. The metabolic framework provides an overarching categorisation of urban functions and ensures that the diverse elements of the urban system are represented. In order to focus on the residential environment the functional categories of the urban system have been translated into elements which are specifically related to the everyday act of dwelling. The resulting elements represent the key functional domains of the residential environment nested within the broader urban metabolic framework.4
Amenity
Security Quality of Life
Transmission Resource Intensity
Community Social
Productivity Household Economy
The elements of the functional framework for dwelling are populated with criteria which are derived from a range of conceptual and analytical frameworks related to residential environment quality. These draw on both expert and layperson viewpoints. A performance
4 BAUMEISTER, J. & OTTMANN, D. 2015. Urban Ecolution . Perth WA: University of Western Australia Press.
objective is described against each criteria and a method of measurement formulated. The following studies provided useful guidelines for developing the assessment criteria and objectives utilised in this study:
▶ The Grattan Institute study ‘What Matters Most? Housing Preferences Across the Australian Population’5 examines the relative value that people place on different criteria describing the qualities of residential environments. In Perth a similar study was undertaken in 2013 – ‘The Housing We’d Choose’.6 The criteria and their organisation were slightly different but similar enough to enable a comparison of results. The comparative analysis used in this study sought to establish criteria that were clearly confirmed as important for the majority of households from both surveys.
▶ The World Health Organisation Quality of Life questionnaire (WHOQoL-100 Australian Version7) gives useful insights into key spatial factors which are associated with health outcomes. For example, several questions relate to respondents’ perceptions regarding the
5 WEIDMANN, B. & KELLY, J. F. 2011. What Matters Most? Housing Preferences Across the Australian population . Melbourne: Grattan Institute.
6 DEPARTMENT OF HOUSING WA & DEPARTMENT OF PLANNING WA 2013. The Housing We’d Choose: A study for Perth & Peel . Perth WA: Strategic Coordination Unit.
7 WORLD HEALTH ORGANISATION QOL GROUP 1998. WHOQOL-BREF Australian Version . Geneva: World Health Organisation.
physical aspects of their residential environment such as pollution and noise as well as transport accessibility and availability of key services.
▶ There is much research in the field of environmental psychology into residents’ perceptions of the quality of their built environments – what is termed ‘neighbourhood satisfaction’ or ‘perceptions of residential environment quality (PREQ).8 This field of work attempts to build assessment models based on a whole range of indicators which have been established through analysis and interviewing residents. Results are often comprehensive though technically complex. Many
8 AMÉRIGO, M. & ARAGONÉS, J. I. 1997. A Theoretical and Methodological Approach to the Study of Residential Satisfaction. Journal of Environmental Psychology , 17, pp. 47–57; SIRGY, M. J. & CORNWELL, T. 2002. How neighborhood features affect quality of life. Social Indicators Research , 59, pp. 79-114; BONAIUTO, M., FORNARA, F. & BONNES, M. 2003. Indexes of perceived residential environment quality and neighbourhood attachment in urban environments: a confirmation study on the city of Rome. Landscape and Urban Planning , 65, pp. 41–52; MARANS, R. W. 2003. Understanding environmental quality through quality of life studies: the 2001 DAS and its use of subjective and objective indicators. Landscape and Urban Planning , 65, pp. 73–83; VAN KAMP, I., LEIDELMEIJER, K., MARSMAN, G. & DE HOLLANDER, A. 2003. Urban environmental quality and human well-being: Towards a conceptual framework and demarcation of concepts; a literature study. Landscape and Urban Planning , 65, pp. 5–18; BRAUBACH, M. 2007. Residential conditions and their impact on residential environment satisfaction and health: results of the WHO large analysis and review of European housing and health status (LARES) study. International Journal of Environment and Pollution , 30, pp. 384–403; LOVEJOY, K., HANDY, S. & MOKHTARIAN, P. 2010. Neighborhood satisfaction in suburban versus traditional environments: An evaluation of contributing characteristics in eight California neighborhoods. Landscape and Urban Planning , 97, pp. 37–48; BUYS, L. & MILLER, E. 2012. Residential satisfaction in inner urban higher-density Brisbane, Australia: Role of dwelling design, neighbourhood and neighbours. Journal of Environmental Planning and Management , 55, pp. 319–38.
of the indices utilised are not directly related to spatial design decisions, such as residents’ upkeep of properties, and are difficult to quantify. If these are excluded, however, a useful set of indicators for measurement of the qualitative aspects of the residential environment can be developed from this literature. This field tends to confirm the importance of security, unpolluted areas, green space and connectivity to important services.
▶ The development of indicators to measure the performance of residential environments in terms of resource intensity was guided by relevant categories of measurement frameworks offered by the US Green Building Council’s Leadership in Energy and Environmental Design (LEED) for Neighbourhood Development.9 This document and others such as ’Liveable Neighbourhoods’10 are also useful when looking at the measurement of amenity aspects of the residential environment. They attempt a quantitative assessment of particular qualities of places, and whilst the frameworks are not applied meticulously in this study they provide useful guidelines relating to which criteria are important to measure at various scales.
9 US GREEN BUILDING COUNCIL 2009. LEED 2006 for Neighbourhood Development. Washington DC: The US Green Building Council.
10 WESTERN AUSTRALIAN PLANNING COMMISSION
2004. Liveable Neighbourhoods. Perth WA: Government of Western Australia.
▶ EnviroDevelopment™11 is an assessment scheme for new urban developments developed and adopted by the Urban Development Institute of Australia (UDIA) and is aimed at documenting outstanding performance against six key project elements. Residential environment quality for higher density developments such as urban infill addresses such criteria as reduction in urban heat island, incorporation of green roofs and walls, collective gardens, noise control, provision of communal facilities and an engaging and inclusive public realm.
▶ The UK Design Council’s ‘Building for Life standard’12 is the UK industry standard for new housing developments. It provides a number of recommendations with regard to design quality. It covers neighbourhood scale items such as access to facilities and public transport as well as promoting the sharing of streets, well designed public spaces and the availability of private space.
▶ The NSW State Environmental Planning Policy No.65 (2002) is perhaps the most comprehensive quality guideline for residential development in Australia. Its focus is primarily on design, that is
11 URBAN DEVELOPMENT INSTITUTE OF AUSTRALIA 2011. EnviroDevelopment National technical Standards Version 2 . Canberra ACT: UDIA.
12 COMMISSION FOR ARCHITECTURE AND THE BUILT ENVIRONMENT (CABE) 2008. Delivering great places to live . London UK: CABE.
aspects of amenity or quality which can be shaped through spatial design. The design guidelines13 were compiled by a large number of architects and designers working together over a substantial time period. It represents a comprehensive account of criteria which contributes to the quality of higher-density residential environments from the perspective of design professionals.
These documents represent the key inputs into the development of the assessment framework (criteria, objectives and indicators) contained within this book. There are thirty nine criteria with associated objectives and measurement indicators organised under the five functional elements – Amenity, Quality of Life, Resource Intensity, Social and Household Economics.
How can we make sense of what is a good performance – and be able to use this to inform an assessment of the different infill contexts under consideration? Firstly, we need to compare different residential environments to benchmark the range of possible scores. Ideally this would take place using a multitude of sample sites but that analytical burden is too great. Can we, however, choose two residential environments that are likely to give us
an appreciation of the range of values as well as help inform decisions about urban infill?
To answer this consider that in sprawling cities urban infill is characterised as being somewhere in-between the offer of the ‘horizontal’ individual dwelling pattern in a suburb on the metropolitan fringe (Sprawl) and the ‘vertical’ living arrangement of an apartment complex within the CBD (City). The proposition is that this ‘middle ground’ of infill could potentially take advantage of the different qualities presented by both of these locations and provide a broadly attractive and enduring pattern of infill. The benchmarking therefore could select these two opposing residential environments to understand the distinctive qualities of each. With these two extremes of quality defined and understood it should be theoretically possible to understand the position of other kinds of residential environments on this quality spectrum. Therefore a preliminary assessment of the performance of other in-between scenarios such as different kinds of urban infill is enabled.
The measurement of each criteria contained within this book follows this method, describing the range of quality – to understand which, if any, urban context (the Sprawl or the City) shows a clear advantage in relation to
the objective. Given this understanding a preliminary assessment is then made about the performance of the different infill contexts on offer – the Node, Corridor and Area.
This reveals two things. Firstly, the relative overall performance of each infill context with respect to the good and bad of the selected living environments. Secondly, through the identification of performance deficiencies against individual criteria, the scope of effort and investment required to improve each situation.
Finally, the method strives to recommend a way forward, to identify a preferred approach for urban infill based on an assessment of residential environment quality. The work is able to determine the pattern of urban development which offers the greatest quality and therefore has the greatest potential to provide a broadly attractive and enduring residential environment. In addition, the shortcomings of this pattern are scrutinised and recommendations/tactics made for its improvement – to make the best better and truly formulate the ‘best of both worlds’ which may hold the key to living in the future (un)sprawling city.
The following pages illustrate the sampling sites from the sprawling city of Perth used to benchmark the measurement framework.
The purpose of this research is to try and understand the qualities of living in Perth and to use this information to inform priorities regarding the planning and design of urban infill to achieve attractive and enduring residential environments.
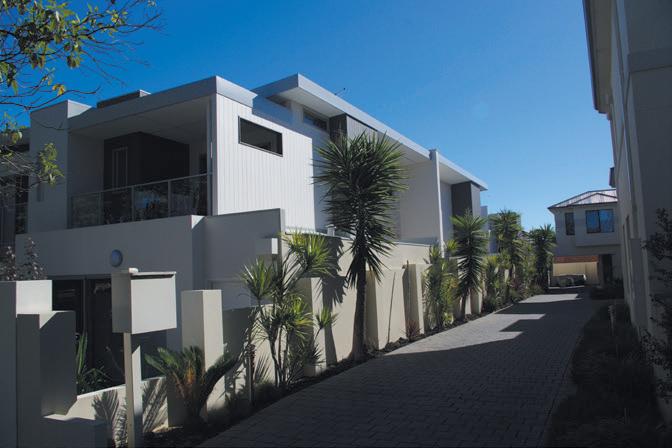
To this end, as the first step, the work proposes to benchmark the measurement framework by sampling two very different residential environments –the typical single dwelling in a modern suburb on the urban fringe (the Sprawl) and a typical apartment in the city centre (the City).
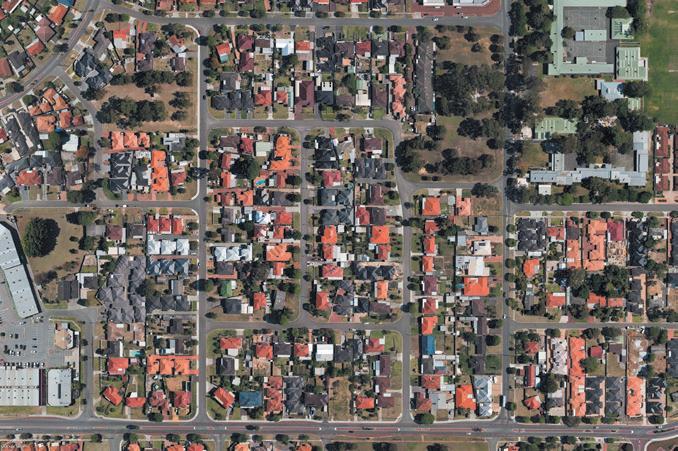
A standalone dwelling in the suburb of Butler is selected. This is a typical new suburb on the urban periphery of Perth in the northwest coastal corridor which has been designed using the New Urbanist principles of the ‘Liveable Neighbourhoods’ operational planning policy.
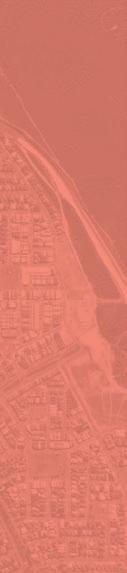
The apartment selected is in East Perth, in close proximity to Perth CBD. This dwelling is located in a typical contemporary development in an area which supports the largest number of high-rise, high-density residential buildings in the inner urban area of Perth.
/ Sampling Sites | 17 16 | Sprawl and the City
These two extremes illustrate a range of performance in terms of their residential environments. One draws on the aspects of the ‘suburban dream’ and the other the convenience and diversity of inner-city living. The two vastly different contexts have been chosen to give the best indication of what constitutes good or acceptable performance against the quality criteria.
In order to make meaningful comparisons between sites there needs to be some guidelines to ensure we are comparing ‘apples with apples’.
Of course the units need to be identical but also there needs to be a common understanding of the scale of the denominator. For example, is the measurement an average across the suburb or does it relate to just the dwelling.
In order to enable the measurement and provide a consistent framework, which can then be used in the subsequent analysis, a number of different measurement scales were developed. The following pages illustrate the measurement scales using the two initial sample sites – the Sprawl and the City.
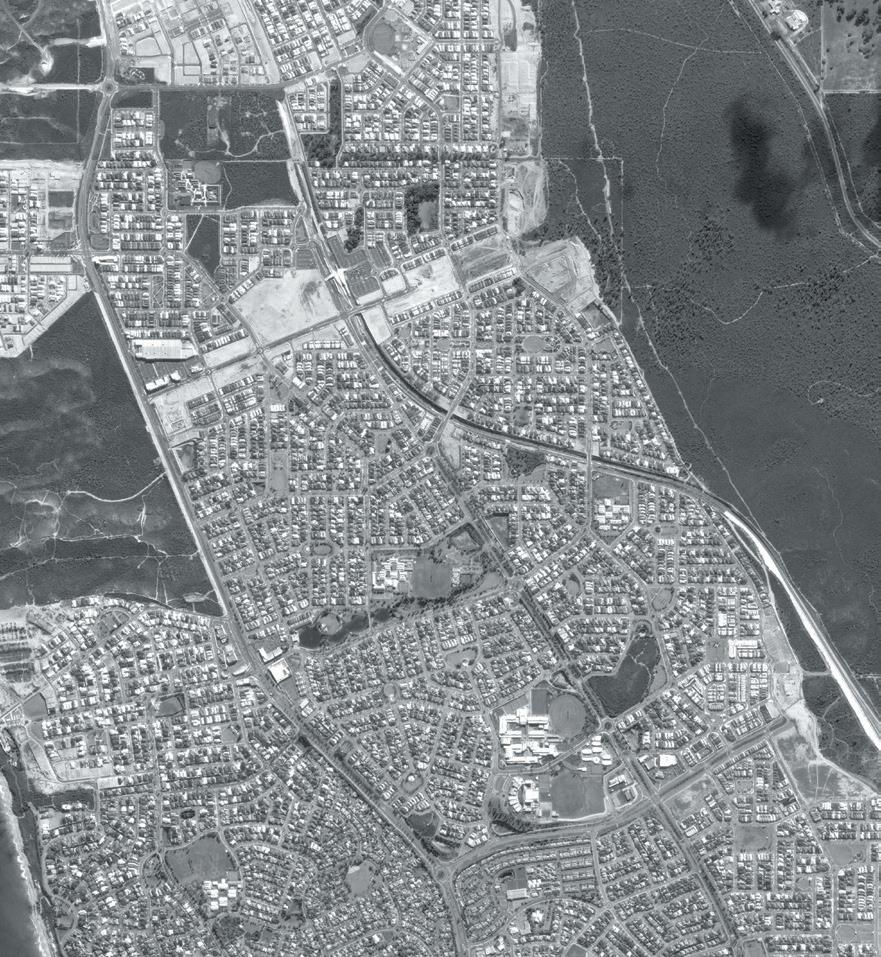
The two suburbs which contain the specific sampling sites, Butler and East Perth are shown in red in relation to the metropolitan area of Perth
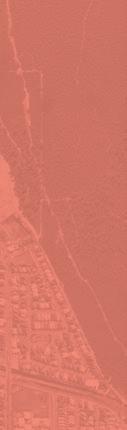
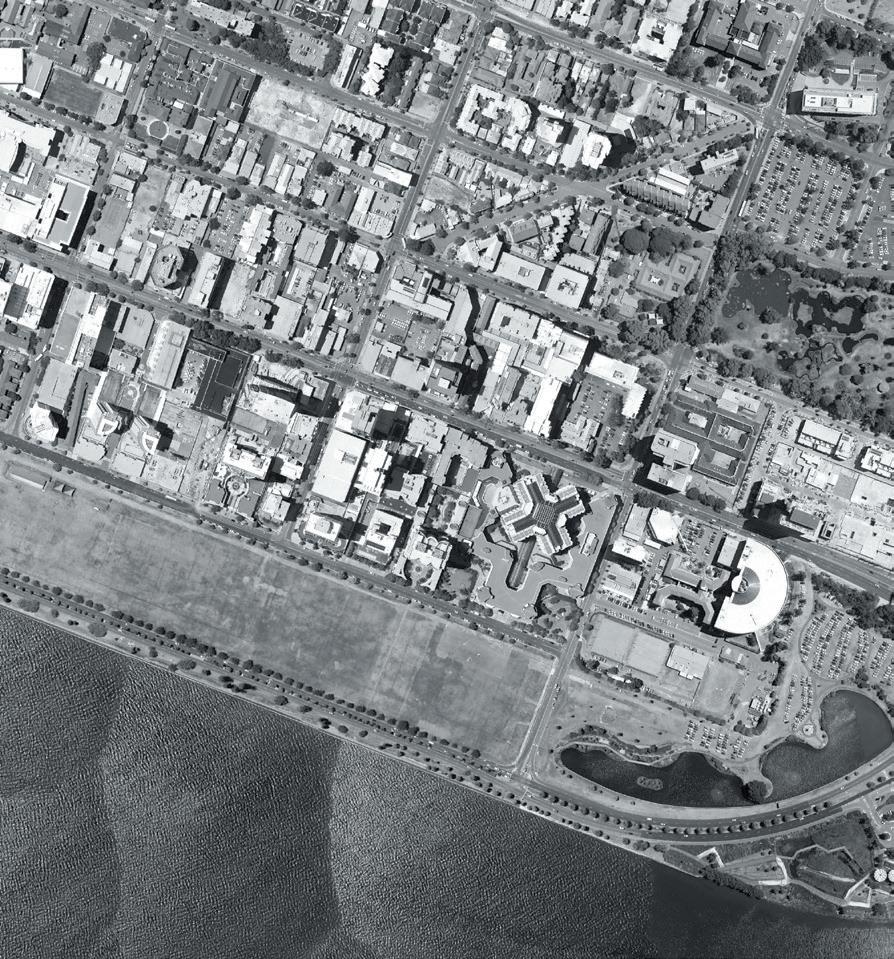
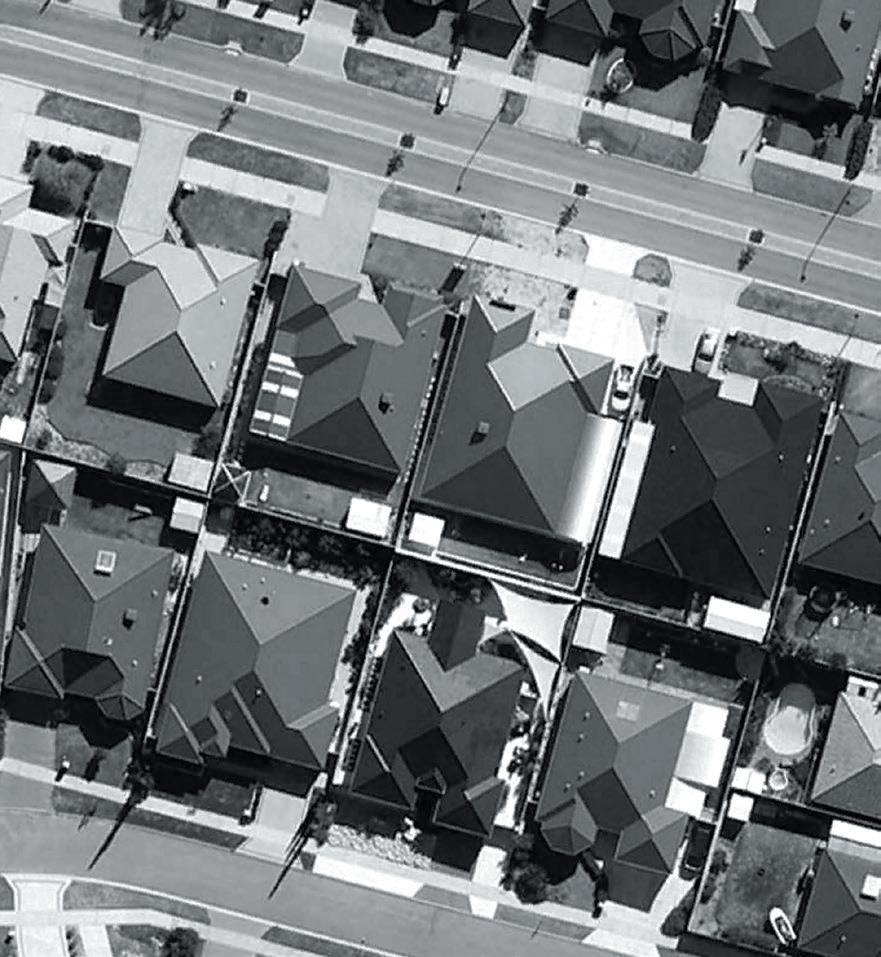
The sprawl sample site is located in one of the outer metropolitan planning sub-regions. This is a large ‘finger’ of suburban lands which has extended along the northern coast of the city. This region has the highest stocks of undeveloped land zoned for (sub)urban expansion (greenfield) as well as the highest rate of land consumption for subdivision over the last ten years (WAPC 2014, p. 62). It is the most sprawling part of the city.
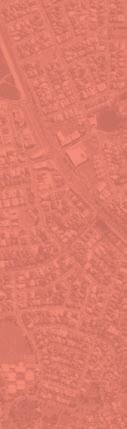
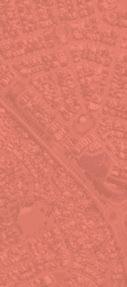
The city sample site is located in Perth city centre which belongs to the central planning sub-region. This territory contains some of the oldest urban settlement patterns in Perth and is chiefly defined by urban expansion up until 1980. Most urban infill has occurred in this region through rezoning of suburban lands, brownfield development and the construction of apartments in urban centres.
The city centre location contains the most dense residential environments in the city.
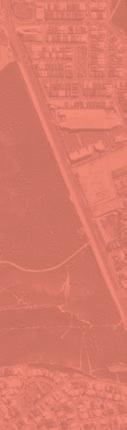
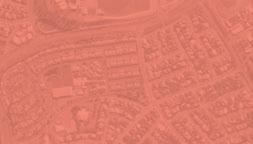
The typical sprawl suburb is indicated by the solid line. This area contains around 3,500 households and approximately 10,000 persons. The suburb is bisected by the northern suburbs passenger rail line and is designed according to New Urbanism principles contained within Western Australia’s suburban design policy ‘Liveable Neighbourhoods’. Typically the dwellings are dominated by separate houses of three to five bedrooms, with a household size of about three persons, principally a couple family with children and on average two to three vehicles owned per household.
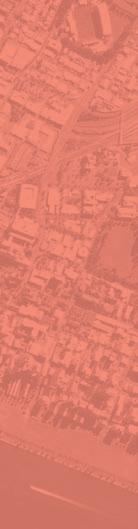
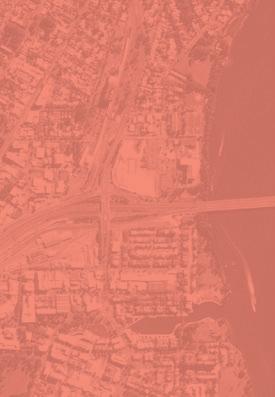
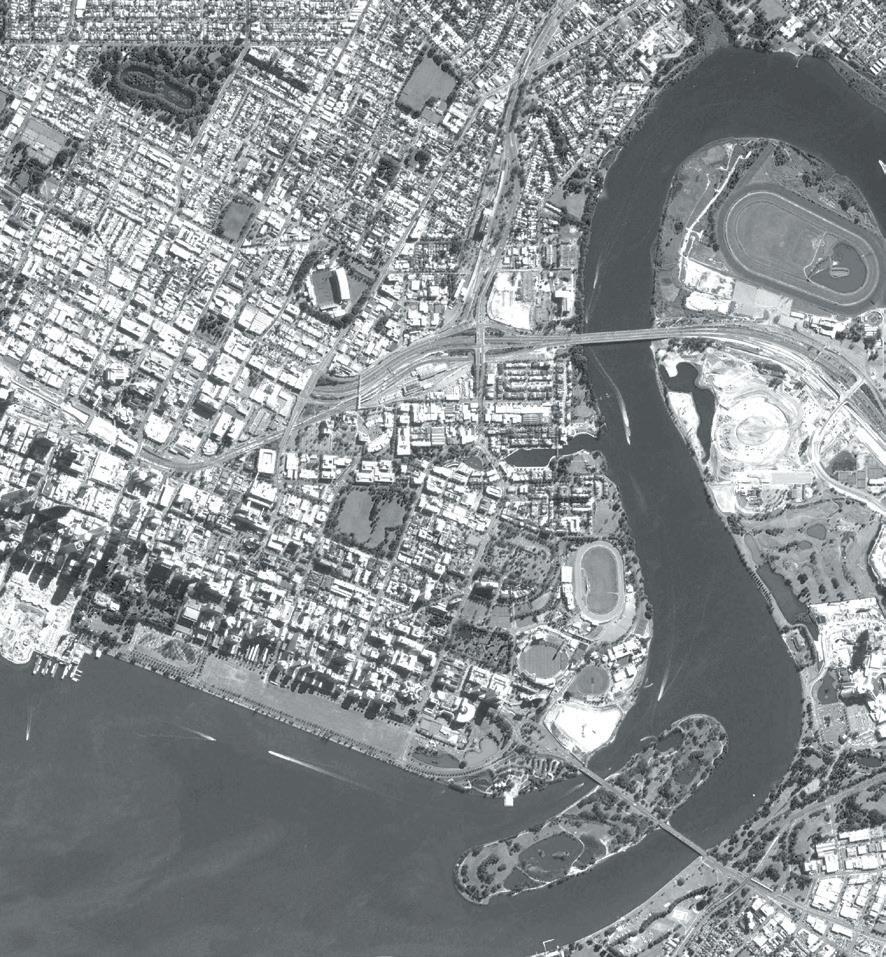
The city suburb contains a similar number of residents although a greater number of individual households, as household occupancy averages closer to two persons. The suburb contains a variety of land uses with large areas of commercial zones, metropolitan sporting facilities and transport infrastructure. The urban structure follows a traditional historical grid except where it must negotiate steep topography. Typically the dwellings are one to three bedrooms and occupied by a single person or a couple, with vehicle ownership averaging around one to two per household.
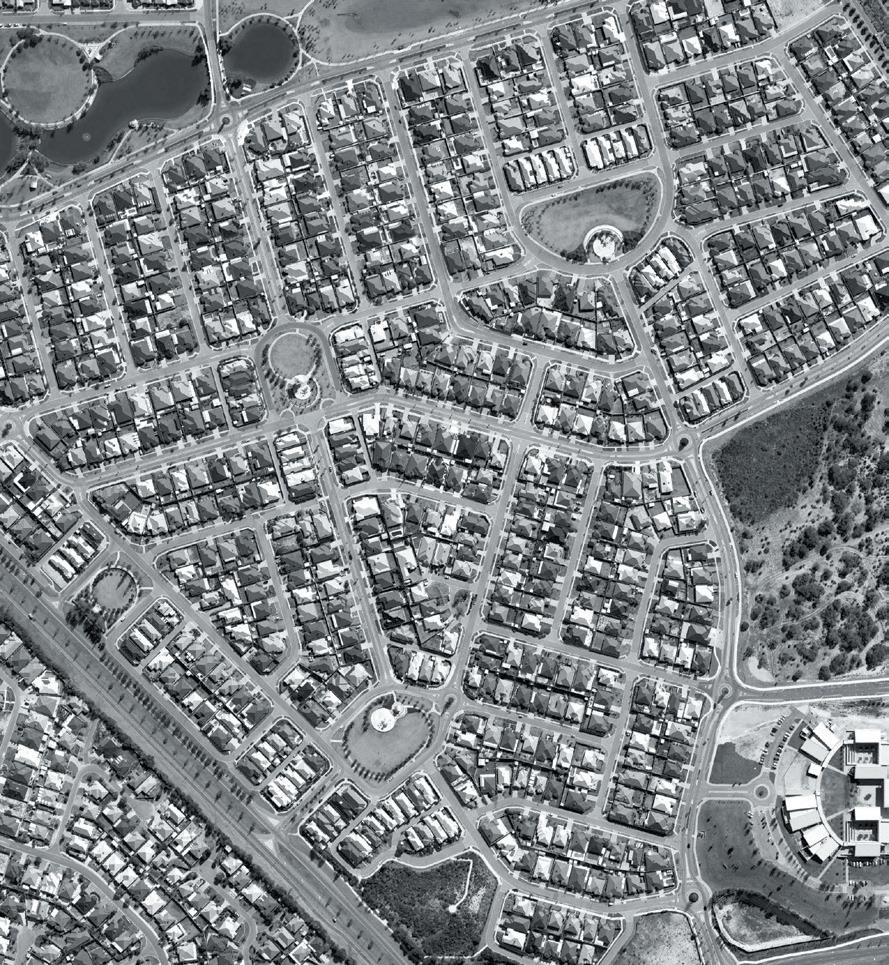
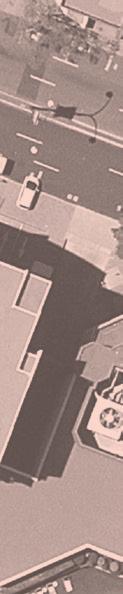
The sprawl neighbourhood is notionally represented by the 400 m walkable radius from the subject site. This is an abstract definition used for calculations. In reality it is usually busy roads, land use changes or significant topographical features such as watercourses or areas of vegetation which also help to demarcate the neighbourhood domain.
The city neighbourhood is marked by an identically scaled walkable radius of 400 m around the sample site. Of course perceptions of s neighbourhood differ but there is general agreement that it corresponds to a walkable territory around a persons’ dwelling. / Sampling Sites |
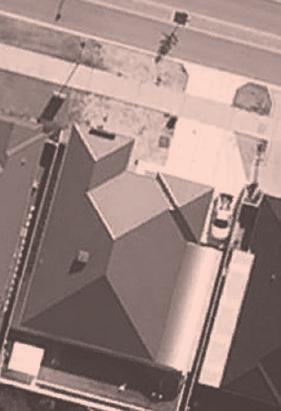

The lot represents the private land holding on which the dwelling is located and is indicated by the boundary line. It corresponds to the main certificate of title regardless of how many dwellings are actually provided. The site may contain public, communal and private internal and external areas. In the suburb there are no communal or public areas in the lot area. The ‘Urban Module’ is shown by the shaded area; this represents a piece of urban fabric which theoretically could be continually replicated to create an urban residential environment based on a particular dwelling type.
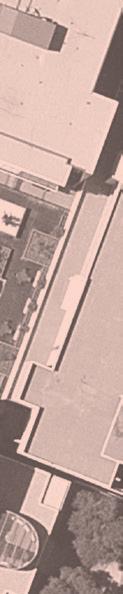
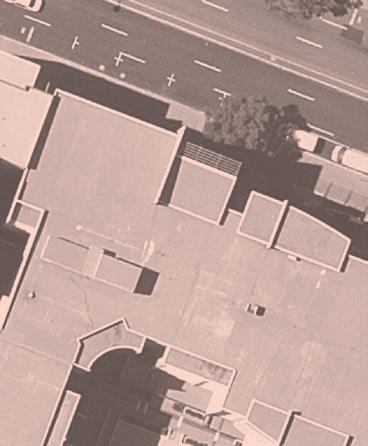

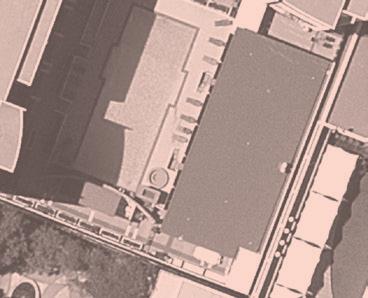
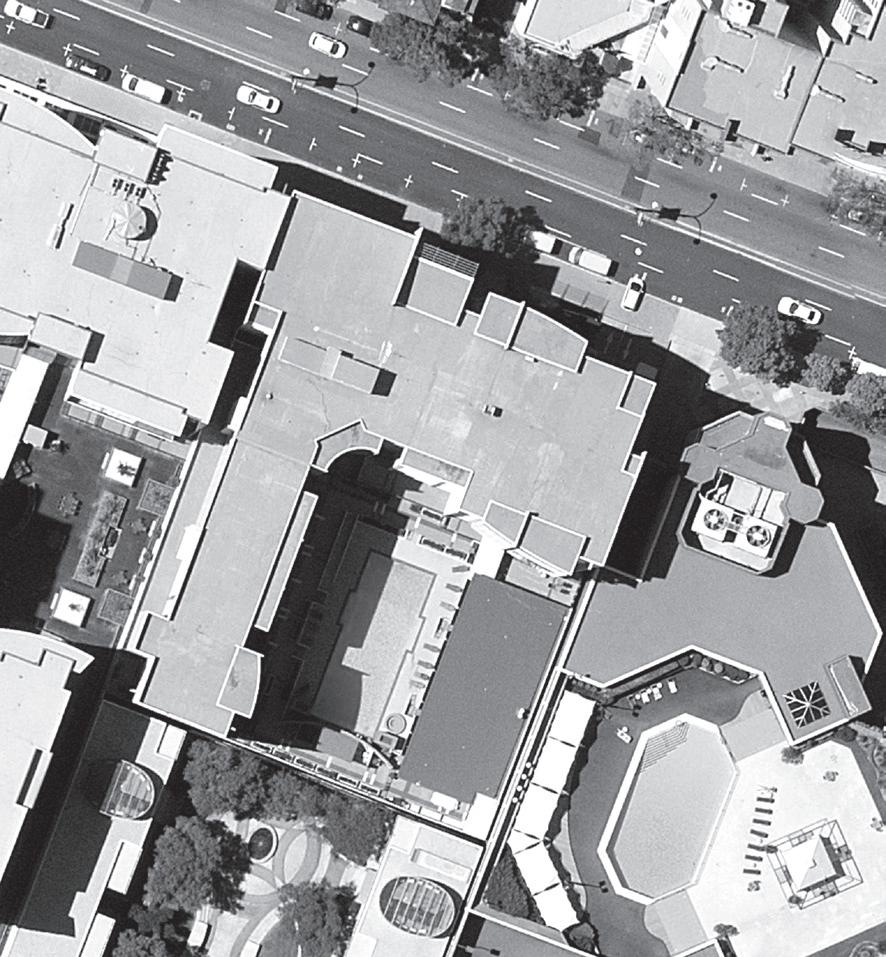
In the city the lot contains a large building divided into many dwelling units – the main title is split into a number of ‘strata-titles’ which indicate the private and common areas. In this building type communal areas are often prevalent and in some instances required by policy. Parts of the lot, such as those that address the street, may be effectively public as developers often trade this territory to the public realm for greater floor space allowances. The Urban Module is similar in that it is the essential spatial unit of a particular residential environment.
The base data is used to describe the quantitative characteristics of each of the sample sites and is used in subsequent calculations.
Site Area (m2)
Dwellings (No.)
Occupancy (pers/hhold)
Vehicles (veh/hhold)
Density (net,dw/ha)
Site Cover (%)
Communal Area (m2)
Median House Price ($)
Floor area (m2/dw)
Bedrooms (No./dw)
Full-time workers (No./hhold)
Commute (km)
Driving Age (%)
Building
The quality criteria, their objectives, the indicators used to gauge performance against them and their comparative measurements are developed and then used to inform a preliminary assessment of the different infill contexts.
The criteria and their performance objectives have been selected based on the review of the key conceptual frameworks for describing aspects of residential environment quality. These are organised according to the key residential environment elements derived from the functional categories of the urban metabolism framework.
The criteria are not functionally independent. They operate in a complex urban system and have dependencies and interact with one another. The key relationships between the criteria are indicated by the ‘see also’ links at the base of each page.
The criteria and their objectives are then translated into indicators – performance metrics which describe the fundamental aspects of living. The methods of measurement used to quantify each indicator are contained in Appendix A.
Amenity criteria and their objectives concern those aspects which would be described as pleasing, useful or desirable. There are nine Amenity criteria.
Quality of Life criteria and their objectives concern those aspects which relate to health and mental and physical wellbeing. There are seven Quality of Life criteria.
Sprawl and the City
Resource Intensity criteria and their objectives concern rates of consumption as well as the ability to offset or counteract these. There are ten Resource Intensity criteria.
Social criteria and their objectives concern individual, family and collective aspects of dwelling as they relate to human interaction. There are seven Social criteria.
Household Economics criteria and their objectives relate to the financial factors which impact on the purchase and operation of a household. There are six Household Economics criteria.
Each of the indicators are measured for the two different sample sites (the Sprawl and the City) to understand what contributes to and is meant by residential environment quality in the context of Perth.
This understanding is then used to conduct a preliminary assessment of the performance of different infill contexts (pp. 8–9), located in a similar geographical context (the Perth central sub-region), in relation to each of these qualitative aspects.


A1 Naturalist A2 Openness A3 Noisescape A4 Privacy A5 Parklife A6 Pleasure Garden
Stargazer
Walkability
Freedom Machine

Access to nature is pleasing and beneficial to humans, particularly those living in urbanised areas. But how much of the land surface is actually close to a more natural state? The sub-region gives an average representation of land use assignment in the sample urban context.
This indicator measures the proportion of land area devoted to parks, recreation and state forest in each sub-region. See also


The suburban context is replete with natural territories whilst in the city it is clearly sparser and more difficult to find.
Nodes are often dominated by parking and roadways
Corridors generally front high capacity roadways Still urban but nature and parkland opportunities distributed throughout area
Openness refers to that quality which is perhaps best defined in opposition to its counterpart – the feeling of being ‘hemmed in’. People often talk about the ‘size’ of the sky in Perth, and the fact that you can almost see to the horizon in most directions from many locations (Bolleter 2015, p. 12). This sense of openness is due to flat topography but also a low intensity of built space (floor area) in relation to open space.
This quality is defined and measured in terms of built floor space as a multiplier of the amount of open space available on the site.


0.6 10.8
The pressure on open space is much less in the suburb suggesting that the sky canopy is much more ‘available’ to residents. X X
Concentrated density places buildings in closer proximity
Low density interface allows partial view lines
Dispersed low-rise infill allows separation and access to the sky canopy

Noise levels are consistently cited as an important factor by residents when considering the overall quality of their residential environment. Conventional housing designs do not typically deal with environmental noise in an effective manner.
Background night-time noise levels were calculated using a method of Assigned Noise Levels taking into account land use and transport.
dB(A)L10, night
dB(A)L10, night
The night-time noise level in the suburb where traffic dissipates and residential uses are predominant is perceived as half that of the city. This allows relaxed outdoor conversation and buildings can be naturally ventilated.
Concentration of traffic density and mixed use
Typically adjacent to high traffic volumes and speeds
Dispersed receivers generally away from major noise sources

Privacy is a strong cultural expectation in Perth. The more concentrated people are, then generally the less opportunities for privacy. As a guide, residential development standards in Perth set a limit of 6.0–7.5m as the acceptable privacy distance between observers on neighbouring properties. This guideline is generally easily achievable in the suburban setting.
This indicator inverts the population density of the private site area to gauge the area ‘available’ for each resident. See also


The dispersed settlement pattern of the suburb makes the population density more diffuse and each individual effectively has a large amount of ground floor area to ‘themselves’.
Concentration of population is this pattern’s key feature
Linear settlement pattern affords some privacy
Dispersed settlement pattern spreads the population
Parks are a tried and tested amenity of an urbanised area. Public parks in urban areas were formalised in the nineteenth century to provide opportunities for health and wellbeing in the face of accelerated urbanisation. Today their value to people is widely recognised and they are legislated through urban planning policy.
This indicator measures the number of formal parks available to each resident within a walkable catchment.

It would seem that the city fabric, planning frameworks and policies do a good job in providing a quantity of parks for residents, no matter where they live.

Gardening is recognised as an activity and pastime which is not only pleasant but one with substantial health and wellbeing benefits as well as supporting community development and fostering personal skills.
This indicator measures the amount of private and communal ground floor open space available for gardening per person.
The suburban life has more than enough room to get your hands in the earth owing to the large areas of private open space.
Highly urbanised concentration of hardscapes
Concentration of population and limited communal area Dispersed settlement with ground plane connection

The night sky is a source of wonder, beauty and existential pondering. Light pollution obscures these qualities and is also known to have potentially adverse impacts on animal and human health (Falchi et al. 2011). Light pollution can occur where there is excess night-time illumination, for instance, from poorly controlled street and security lighting.
The limiting magnitude of star brightness for viewing by the naked eye (Naked Eye Limiting Magnitude: NELM) has been calculated for each of the sample sites.

6.0
4.5
In the ‘deep’ suburbs of the southern hemisphere you can see almost eight times as many stars with the naked eye (approximately 2700 compared to 300) and the Milky Way is still visible.
Combination of night-time land use and transport infrastructure
Close proximity to main road street lighting
Although an urban context, typically located away from locally bright sources
Having key facilities within walking distance, a street network which supports walking and a good pedestrian environment is generally recognised as a convenient and attractive attribute of any neighbourhood.
This indicator uses the Walk Score (Redfin 2015) of the suburb. This uses an algorithm to measure walkability based on urban structure and availability of facilities and amenities, but should also be mediated by an empirical assessment of the pedestrian environment. See also


The traditional city grid with its concentration of facilities, pedestrian infrastructure and wide footpaths provides a highly walkable environment.
Concentrated facilities but typically high traffic density and pedestrian conflict
Closely located to nodes but typically poor environment
Distant facilities but good environment

Individual mobility through motor vehicles and specifically cars is still an aspiration, expectation and preference for a large proportion of the population. Often this is only available when there is somewhere to park your vehicle close by, where it can be presented, maintained and preserved. Parking is often rated highly in residential preference surveys.
This indicator measures the number of free private parking places provided on average per person of driving age.


2.2
0.6
In the suburb there is an abundance of covered and paved areas for parking of automobiles adjacent to the dwelling enabling car ownership and individual mobility. bays/pers bays/pers
Concentrated mixed-use urban context and high traffic density limits parking
High capacity controlled access roadways have limited parking
Dispersed moderate intensity pattern allows on-site and street parking


Q1 Commute Time
Q2 Commute Distance
Q3 The Big Smoke
Q4 Do Run Run
Q5 Air Quality
Q6 Sea Breeze
Q7 Is it Safe?

Modern urban life often means people’s homes are not necessarily close to their workplace and the daily commute is a significant part of everyone’s day. Recent research has shown that people’s work locations in Perth are heavily influenced by the type of work they do. Professionals tend to agglomerate in and around the central business areas whereas those involved in labouring and sales tend to work more locally.
For this indicator the average total daily commute time (both directions) was calculated.


mins/worker mins/worker
Somewhat surprisingly the average travel time is quite similar, although it is probably distributed more unevenly in the sprawl scenario as employment selfcontainment rates are low and some very long trips may be commonplace.
Mixed use has potential for co-location of employment
Urban context with PT options but typically congested traffic environment
Urban context with PT options but typically congested traffic environment

As distinct from the commute time, the commute distance is indicative of the general effort required, the likelihood of disruption and instability in the journey, the possibility of engaging in more flexible work practices, ease of trip chaining and the availability of choice between different modes of transport.
The one-way average commute distance is used to inform the indicator.
See also


14.4
km/worker (one way)
2.7
km/worker (one way)
On average the distance between work and home in the city is close enough to suggest that the benefits in the objective are attainable whilst this is not the case in the sprawl.
Inner urban context generally close to employment opportunities
urban context generally close to employment opportunities
urban context generally close to employment opportunities

With the rapid expansion of suburban settlement some of the central employment types, such as retail, were relocated into these areas. Subsequent changes to technology and planning have sought to further decentralise employment; however the jobs in the centre have the highest incomes and job creation rates as well as the greatest diversity of employment, training and education opportunities.
This indicator measures the proportion of employed persons who work in Perth Local Government Area (LGA).

In the city, people are more actively participating in the diverse pool of jobs and opportunities on offer. employees employees
Infill with potentially good accessibility to central areas
Dispersed infill with moderate accessibility to central areas City Sprawl
Infill with potentially good accessibility to central areas
Even though people might take a similar amount of time to get to work, how do they get there? There has been much research to suggest that physical inactivity is increasing and disease and illness related to this is also on the rise. Combining exercise with a commute is potentially an efficient way to improve levels of physical activity on a daily basis.
This indicator measures the proportion of journeys to work that are regularly undertaken which use an active travel mode (walking and cycling).
City residents have much more opportunity to engage with active travel measures. trips trips
Inner urban context generally close to employment opportunities
Inner urban context generally close to employment opportunities
Inner urban context generally close to employment opportunities

Improving the air quality of residential environs was one of the initial reasons for the development of suburbs. It is also a consistent aspect of people’s residential preferences and is linked to various health outcomes. Ironically the desire to live in clean, uncrowded and unpolluted areas has meant a dramatic increase in the use of combustion-powered motor vehicles whose emissions are concentrated in areas of traffic density.
This indicator uses DEC monitoring sites to estimate the percentage of allowable NO2 concentration averaged over a one-year period.
allowable NO 2
allowable NO 2
Air quality is substantially better in the suburbs typically located away from arterial roads and congested areas.
Concentration of traffic typically in congested conditions
Dwellings located in close proximity to large traffic volumes
Urban context but typically located away from sources with interception possible

The prevailing cooling breeze in Perth (referred to as the ‘Fremantle Doctor’) has a substantial effect on outdoor human comfort levels as well as providing opportunities for the daytime natural ventilation of homes. In addition to the pleasing effects of this it helps with passive cooling/energy consumption reduction and also potentially indoor air quality.
This indicator measures the proportion of days during the hottest summer months which receive a sea breeze of at least moderate strength (>20km/hr).

days (Jan/Feb) days (Jan/Feb)
Proximity to the coast is the critical determinant, so the ‘verdict’ is highly locational; however, urban form can impact the availability of the breeze at the micro-level.
Node
Concentrated built form can limit breeze penetration
Linear form but street canyons can create stagnant areas on lower floors
Dispersed low-rise built form allows breeze infiltration

Residents consistently place safety and security as one of the most valued aspects of their residential environment and it rates highly in surveys of perceptions of neighbourhood quality.
This indicator measures the crime rate by calculating the number of crimes committed per 1000 people.
also
pers/yr
pers/yr
Both locations show a below-average crime rate for the metropolitan area suggesting that this result is weakly correlated to urban form context as Crime Prevention Through Environmental Design (CPTED) principles are generally applied.
Criteria, Objectives and Measurement


R1 Embodied Energy
R2 Transport Emissions
R3 PV Production
R4 Carbon Storage
R5 Urban Farming
R6 Infrastructure
R7 Asphalt Index
R8 Habitat Loss
R9 Thirsty Work
R10 No Vacancy

Embodied energy refers to the equivalent amount of energy required to produce and deliver the building materials required and have them assembled to deliver a particular product. In this instance it refers to the dwelling, consisting of just the building.
This indicator converts the amount of energy required per m2 of Usable Floor Area (UFA) into the equivalent weight of coal that would be required to be combusted to yield this.

kg coal combusted (equiv)/m 2 UFA
kg coal combusted (equiv)/m 2 UFA
The ‘cottage’ technique of building, which doesn’t require complex engineering or excavation, is significantly less energy intensive than high-rise techniques.
High-density commercial construction
Medium- to high-density commercial construction
Low-scaled cottage construction available

People use energy when they travel. This indicator focusses on the amount of energy required to sustain the motorised travel demands of people for work and leisure.
This indicator converts the total energy use from vehicle kilometres travelled per mode per resident per year into an equivalent annual automobile distance travelled.

10,286
km travel (equiv)/pers/yr
2,286
km travel (equiv)/pers/yr
Availability of public transport and proximity to employment, services and facilities means that the energy consumption from transport in the city is about a fifth of the suburb.
Infill with potentially good access to priority public transport
Infill with potentially good access to priority public transport
Infill with moderate access to public transport

With future advances in energy storage, the generation of electrical energy from solar radiation could be an important offset to the consumption of electricity generated from high emission sources such as coal and the household consumption of natural gas.
This indicator measures the potential of the settlement pattern to generate the amount of typical daily energy consumption.
The suburb with its large roof area per resident can theoretically generate more than enough power to cover its daily needs. daily energy/pers daily energy/pers
High-density infill with limited roof area per dwelling
Dispersed, horizontal pattern with relatively high roof area per dwelling City Sprawl
Medium- to high-density infill with moderate roof area per dwelling
Trees are able to sequester carbon dioxide from the atmosphere and therefore potentially offset one of the significant emissions which contribute to global warming and climate change.
This indicator measures the amount of annual carbon emissions from daily household electricity use able to be sequestered from intensive tree planting in private open space and the verge.

CO 2-e emissions/hhold
CO 2-e emissions/hhold
The suburban lot has a relatively large area of open space per resident that could potentially accommodate tree planting.
High-density infill with limited open space per resident
Medium- to high-density infill with limited open space per resident
Dispersed, horizontal pattern with relatively high open space per resident

Households and neighbours are able to put their open space to productive use, particularly to supply fruit and vegetables and offset the energy expended in the commercial production and distribution of these foodstuffs.
This indicator measures the productive potential of open space in terms of fruit, vegetables, nuts and honey in relation to the average resident’s consumption.

The suburb has a large area of open space per resident and could potentially be substantially productive. consumption/yr consumption/yr
High-density infill with limited open space per resident
High-density infill with limited open space per resident
Dispersed, horizontal pattern with relatively high open space per resident

Each development pattern requires the provision of infrastructure in order for it to be connected to the main networks of transport, communication and other services. It is often difficult to calculate the exact capacity upgrades of each of these individual elements.
This indicator measures the relative investment required to upgrade peak hour arterial road capacity to support the development pattern calculated as a cost per person, but is also indicative of the relative scale of investment required in trunk infrastructure.
3,892
321
The city with its proximity to employment and choices in travel mode requires substantially less investment. $/pers $/pers
High-density infill, but many centres congested and do not have sufficient infrastructure
Medium- to high-density infill distributed evenly along existing infrastructure routes
Dispersed pattern of infill may be less suited to alternative modes and precinct strategies
The area of asphalt (and other types of bituminous road surfacing) at the neighbourhood scale that is required to sustain habitation is an indicator of the amount of local infrastructure (e.g. drainage pits, pipes and wires, road building materials, etc.) required to sustain a pattern of dwelling. It also reveals the amount of hardscape which gives a first order indication of possible local heat absorption and urban heat island impacts.
This indicator measures the amount of road surfacing required per person.
m 2 /pers
m 2 /pers
The concentrated dwelling of the city clearly requires less road surfacing per person to support it.
High-density concentrated infill makes efficient use of resources
Medium- to high-density linear infill moderately efficient
Distributed pattern still requires investment in streets City

The construction of dwellings requires the clearing of land which often sustains some types of habitats and biodiversity more generally. Current patterns of greenfield development promote wholesale clearing of sites.
This indicator measures the amount of land that needs to be cleared per person to sustain the development pattern.
m 2 /pers
m 2 /pers
The concentrated dwelling environment of the city requires significantly less clearing of land to sustain the population.
High-density concentrated infill minimises clearing
Medium- to high-density linear infill minimises clearing
Distributed pattern typically requires clearing

Water is an important resource for cities like Perth. Periodic intense rainfall patterns make local storage difficult to achieve in a cost-effective manner. Reticulation of water is both expensive and requires increasing amounts of energy to produce and distribute.
This indicator measures the average daily consumption of water.
Irrigation of gardens and general outdoor use is substantially reduced in the city context. l/pers/day l/pers/day
High-density concentrated infill minimises water use
Infill typically demands space efficiencies City Sprawl
Medium- to high-density infill minimises water use
At any given time there are a number of bedrooms unoccupied in a particular housing development typology. Although some flexibility is desirable for some households to accommodate visitors and extra uses, an excess would represent an unutilised or inefficient use of resource.
The average number of vacant bedrooms was calculated and expressed as a ratio per dwelling. See also

1.7
bedrooms/dw
0.8
bedrooms/dw
In the city there is some spare capacity to allow flexibility while the suburb result suggests an oversupply of residential space.
Infill typically demands space efficiencies Infill typically demands space efficiencies Space efficiency less paramount


S1 Kidz
S2 Get to School
S3 Backyard Bliss
S4 Social Capital
S5 Staking a Claim
S6 Reproductive Capacity
S7 Communality
Most people acknowledge that children enrich the social dynamics of any neighbourhood.
This indicator simply measures the average proportion of persons under fifteen years of age in the suburb.
See also

The sprawl is clearly a territory for youth with a quarter of the population aged fifteen years or under. youth youth
Infill context predominantly apartments
Infill context but with greater housing options City Sprawl
Infill context predominantly apartments

Walking to school is a simple and effective way to build local relationships and effectively increase the social capital of a neighbourhood. Primary schools are sources of social cohesion for many members of the community. However, if the primary school is too far away then children and their carers and friends are less likely to walk and less likely to meet each other outside of school grounds.
This indicator measures the average distance to a primary school.

0.5
1.8
In the suburbs the primary school is often centrally located and it is typically within walking or cycling distance. km km
Concentrated urban centres are typically located with commercial use
Located within existing suburban structure City Sprawl
Fringing existing suburbs, so close but typically peripheral

Most children are very active and many families prize a private outdoor playing area where children can play relatively unsupervised with friends. Households also use these areas for more intimate social events.
This indicator calculates the average amount of private open space per resident aged under fifteen years.
m 2 /pers
m 2 /pers
In the sprawl, homes typically provide a relatively generous amount of private outdoor area where entertaining and simple games and activities are possible.
Concentrated high-density dwellings with limited private open space
Medium density with moderate amounts of private open space. City Sprawl
Concentrated dwelling environments with limited private open space

Similar to school travel, one of the ways a neighbourhood can effectively build social capital is through encounters that arise through walking to local services and facilities. People are, however, only likely to walk if these facilities can be accessed relatively easily.
This indicator uses the Walk Score (Redfin 2015) of the suburb but as discussed in A8, this value should also be mediated by an empirical assessment of the pedestrian environment.
Walk Score
Walk Score
The city context clearly provides the basic elements for a walkable suburb which substantially increases the possibility of bringing people together in public places on a regular basis.
Concentrated facilities but typically high traffic density and pedestrian conflict
Closely located to nodes but typically poor environment
More distant facilities but good pedestrian environment

One aspect of dwelling which is often coveted by urban dwellers and contributes to a sense of belonging and attachment is the sense of ownership of and direct connection to a particular piece of land.
This indicator measures the amount of private land per person typically connected to an ownership title.
m 2 /pers
m 2 /pers
The horizontal and individual pattern of dwelling in the sprawl means that property owners have a clear connection to land ownership.
Vertical pattern of apartment living means that land ownership is shared.
Vertical pattern of apartment living means that land ownership is shared.
Titling and group housing identifies and connects to private land ownership

One of the critical parameters of any localised population to sustain itself is its ability to maintain or grow its population.
This indicator measures the average number of births per woman over their reproductive life.
See also
2.1
0.9
Sprawl, in theory, provides the means to replenish its population. births/woman births/woman
Concentrated living limits space for children in households
Concentrated living limits space for children in households
Dispersed pattern provides some opportunities for children

Although people value their privacy, undertaking regular activities in a communal setting can increase social capital. This can have positive impacts in terms of security, sense of belonging, wellbeing and developing support structures for such activities as childminding. The design or arrangement of a dwelling environment can either facilitate or hinder these kinds of activities.
This indicator empirically measures the proportion of routine activities typically performed in a communal environment.
The pressures on the availability of space in the city often lead to the need to undertake routine activities in the company of others in your neighbourhood. activities activities 14%
Concentrated living creates opportunities for cooperative behaviours
Concentrated living creates opportunities for cooperative behaviours
More dispersed living environment but some communal behaviours
Criteria, Objectives and Measurement
107 106 | Sprawl and the City
of criteria


E1 Private Transport
E2 Public Transport
E3 Median House Price
E4 Bang for Buck
E5 Running Costs
E6 Self-Sufficiency

Transport costs can form a significant component of a household budget and impact on the overall living affordability. In particular, private vehicle costs–purchasing, operating and insuring one or several cars–can be substantial.
This indicator measures the average rate of car ownership per person of driving age and multiplies this by the cost of owning and operating a medium-sized passenger vehicle.
See also
9,270
$/pers/yr
5,215
$/pers/yr
There are clear economic dividends to less reliance on private cars, particularly when traditional (individual) patterns of private vehicle ownership are considered.
Potentially good access to priority public transport
Potentially good access to priority public transport
Moderate access to public transport
The cost of using public transport may also impact on household budgets and it is useful to consider this as an annual expenditure in relation to other forms of getting around.
This indicator measures the average annual cost of public transport for a worker. See also
2,068
$/pers/yr
1,316
$/pers/yr
The typically shorter distances of city trips reduces public transport expenditure.
Potentially good access to priority public transport
Potentially good access to priority public transport
Moderate access to public transport

Housing affordability is of course a critical, central financial issue for living in the city. Putting other affordability factors aside, what is the capital cost of obtaining shelter?
This indicator measures the contribution required from each working resident of the household to obtain ownership of a dwelling.
286,994
$/worker
463,592
$/worker
The greater number of working occupants and lower house price in the sprawl suburb makes this a much more affordable option for the household.
Small dwellings with relatively high cost
Small to medium-sized dwellings with relatively high cost
Medium-sized dwellings with relatively high cost

The purchase of a house is the single biggest investment for many individuals and families. Aside from the functionality of the dwelling, the amount of space that can be bought is traditionally an important consideration for preserving asset value.
This indicator uses the suburban median house price for the equivalent sample site divided by the enclosed floor area.

There is a substantial disparity in the cost of obtaining a square metre of ‘house’ between the two sites. This reflects land values but also the technical and organisational complexities of building in an inner-city location and the cost advantage of the established ‘cottage’ building industry.
Typically high-density buildings with high land value
Typically high-density buildings with high land value
High land value but lowscale ‘cottage’ construction
The operation of a household, the provision of hot water, heating, cooling and cooking can be a significant portion of the household budget.
This indicator measures the average annual energy use per household expressed as an annual cost per resident.
See also
1,028
$/pers/yr
1,137
$/pers/yr
Although the city dwelling uses less energy overall, the amount per person is boosted by smaller household sizes in comparison to the suburban dwelling.

Travelling to and from work not only has direct costs but also indirect costs in terms of the productivity losses attributable to travel time. Working relatively close to home promises that some of these indirect costs could be overcome.
This indicator measures the proportion of workers originating in the sample suburbs who work within their own planning subregion. See also
The city belongs to the central sub-region with the highest number and diversity of jobs meaning workers have greater options to stay close to home.
Infill context generally located in the central subregion
Infill context generally located in the central subregion
Infill context generally located in the central subregion
Q1
Q2
Q3
Q4
Q5
Q6 Q7
Benchmark
S prawl or C ity?
and the City
The method and results provide clarity on the relative qualities of different infill contexts and the scope of improvement needed to achieve high quality residential environments for urban infill.
The analysis has provided an objective assessment of the relative qualities of two different patterns of living in Perth – the Sprawl and the City. This affords a preliminary assessment of the relative qualities of the residential environments of three different infill contexts in the same city. The first results column ‘Sprawl or City?’ reveals which of the benchmark residential environments displayed the best performance. The remaining columns illustrate the performance assessment of the three different infill contexts relative to one another.
The results tend to confirm expectations about the relative qualities of the opposing Sprawl and City environments which provide validation of the measurement framework. Sprawl is based on principles of individual entitlement, spatial generosity and the incubation of family households whereas the City is about trading individual space for efficiency, accessibility and diversity. Accordingly the benchmark scores reveal that the residential environment element of Amenity is clearly claimed by the greenfields suburban environment (Sprawl) while Quality of Life is more or less shared. Resource Intensity and Household Economics elements perform better overall in the City habitats, and the Social element is claimed again by the Sprawl.
The summary table reveals both the highest quality overall residential environment for the urban infill contexts as well as the relative performances against the elements of Amenity, Quality of Life, Resource Intensity, Social and Household Economics; and their individual criteria.
If we assign the following scores +1 for , 0 for and –1 for then we can use this to further discuss and analyse the results. The net results for overall performance are Node (–11), Corridor (–5) and Area (+8). The Area (dispersed) infill context clearly provides the best baseline quality residential environment.
The infill context analysis is partly empirical and could be expected to have a degree of uncertainty; however, the results clearly display an order of magnitude difference between the different infill contexts under consideration. Area infill is distinctively favourable whereas Node and Corridor rate relatively poorly. This result tends to confirm the demonstrated ‘popularity’ of piecemeal suburban infill in Perth (it has historically accounted for approximately 80% of all infill dwelling) and also the ongoing difficulty in establishing more concentrated patterns of dwelling.
In terms of the individual elements the most substantial difference is evident in the Amenity group. The dispersed pattern of Area infill with its access to natural environments, low-built intensity, connection with the ground plane and distance from sources of pollution performs very well in this regard (+5) compared to Node (–7) and Corridor (–5). This performance spread between the Area and other infill contexts is also demonstrated against the Social element where the Area pattern (+1) supports the possibilities of greater household diversity and generous open space as compared to Node (–4) and Corridor (–3). In essence the Area pattern of urban infill more effectively migrates many of the outstanding qualities of the greenfields suburb residential environment giving it a clear advantage against these elements.
Quality of Life, Resource Intensity and Household Economics measures across the different infill contexts are relatively even. Many of the Quality of Life criteria are similar for each of the patterns – Node (0), Corridor (0) and Area (+2) – as they are accounted for by location in a similar geographical context – that is within the central sub-region. The Area pattern, however, succeeds in accessing some of the qualities of cleanliness and natural ventilation over the other contexts
which provides a distinguishing positive feature. Some criteria of Resource Intensity tends to slightly favour the more compact residential environments of the Node and Corridor; however, the intuitive efficiencies of the built form and location of these configurations is somewhat countered by the productive capacities of area infill (eg PV, CO2 sequestration, urban farming). Household Economics is swayed by less reliance on automobiles of the compact infill contexts –Node (0) and Corridor (+1) – which is in part offset by the possibility of construction cost efficiency of the low-rise built form of the Area pattern (0).
As well as the positive outcomes the results also reveal the elements and their constituent criteria against which each infill context perform poorly. This is useful in that it provides a description of the scale and scope of effort required to meet the overall objective of providing attractive and enduring residential environments for urban infill. Based on this the Node pattern presents the most challenging brief with twenty-one wholly negative marks out of a possible thirty-nine. The Corridor pattern does not present substantially better however with fifteen negative marks whereas the Area pattern presents only three.
Focussing on the results of this analysis it would appear that the dispersed Area pattern of infill provides the most convincing case for accommodating new dwellings. The other contexts are clearly inferior in terms of baseline residential environment quality measures indicating that they would require substantial effort and investment to present a comparable case. The options at this point are to either define the scope of the improvements required to bring the poorest performers (Node and Corridor) up to a comparable level or to concentrate on the best performer (Area) and extend its attractiveness. Both are possible; however, given the substantial scale of the metropolitan urban infill task and the difficulty that this presents, it would seem more effective, in the first instance, to work with the context which naturally presents the most
compelling case and enhance it to truly engender a pattern of attractive and enduring residential infill development.
To this end, the work develops recommendations/tactics at various scales, organised under each element, focussing on ways to improve the performance of the Area infill context. Any criteria which scored either negatively or neutral are investigated and recommendations/tactics are developed to improve performance. These outline a brief for urban planning and design actions to ensure that infill in this context receives the best opportunity for substantial uptake and that it provides a long term solution for residential environments that promote wellbeing, foster attachment and a durable pattern of development and habitation.
This section puts forward urban planning and design tactics to overcome poor and average results of the best performing infill context to demonstrate the way to achieve high quality urban infill and meet the study objectives.

▶ prioritise investment in regional cycling networks through suburbs M
▶ prioritise building scale infrastructure solutions (solar, battery, water recycling) S
▶ reduce peak demand on infrastructure (workplace decentralisation, flexible work support, energy and water storage) L
▶ investigate on-site infrastructure opportunities to limit reliance on centralised networks S
▶ investment in alternative travel modes to offset reliance on large areas of road surfacing L

▶ encourage deep planting zones and raingardens as part of development S
▶ more intensive planting of public spaces such as streets M
▶ local urban forest and biodiversity network strategies M
Note: scales of operation/responsibilityindicated as follows (see also Appendix B)
S – dwelling, lot, urban module (development)
M – neighbourhood, suburb (communities)
L – sub-region, region (government)

▶ infuse nature into buildings (materials, living roofs and walls) S
▶ make use of the streets and verges for natural amenity M
▶ retain trees! M
▶ create patches for insects and birds S
▶ incorporate nature into public land (parks, drainage basins, switchyards) M
▶ investigate the quality and relevance of park design for an infill context M


▶ lighting design which avoids ‘spill’ S
▶ lighting using warm colours M
▶ smart technology to regulate activation of public and communal lighting S
A1 Naturalist A5 Parklife A7 Stargazer
▶ street trees, shade and canopies M
▶ more communal infrastructure on streets (treehouses, sporting courts) M
▶ deprioritise vehicular movement M
▶ street furniture and artwork M
▶ flexibility in neighbourhood planning for new activities and uses M

▶ redistribution of employment into local areas L
▶ improve infrastructure to enable work from home L
▶ co-working nodes distributed throughout the city L
▶ formalise flexible working practices L

▶ redistribution of employment into local areas L
▶ improve infrastructure to enable work from home L
▶ co-working nodes distributed throughout the city L


▶ urban infill as a general strategy promises to provide a better connection between employment and dwelling L
▶ widespread priority public transport networks could connect large numbers of people to the most opportunities L
▶ improve active travel infrastructure such as cycle routes L
▶ ensure high quality end-of-trip facilities in workplaces L
▶ covered and secure bicycle storage at key locations L
Q7 Is it Safe?

R2 Transport Emissions

R4 Carbon Storage

Thirsty Work

No Vacancy
▶ enhance public and communal lighting design S
▶ ensure communal open space is readily visible from habitable rooms S
▶ ensure dwelling interfaces appropriately with street and public spaces S
▶ mandate vehicle fuel efficiency for new developments L
▶ use renewable sources for vehicle propulsion (e.g. solar-electric) L
▶ promote and enhance active travel infrastructure L
▶ decrease grid electricity reliance with localised generation S
▶ use roof areas for sequestration S
▶ intensify neighbourhood planting M
▶ investigate on-site storage technology and integration with building techniques/materials S
▶ water sensitive landscape design S
▶ water sensitive urban design principles S
▶ Precinct scaled water harvesting and reticulation strategies M
▶ communal guestrooms which can be booked in advance S
▶ flexible new home designs which allow multihousehold occupancy S
▶ investigate potential to retrofit existing typical stock (standalone dwellings) for multi-occupancy L
▶ promote housing diversity to ensure options for family households S
▶ provide a diversity of open space types to cater for different youth sectors M
R9 R10 S1 KidzS3 Backyard Bliss

S4 Social Capital
S5 Staking a Claim ////// Improving Area Infill

S6 Reproductive Potential

S7 Communality

▶ retrofit public areas for additional open and communal spaces (streets, verges) S
▶ deprioritise vehicles in open spaces to make them suitable for play and socialising M
E1 Private Transport

▶ enable local businesses and facilities in residential streets (cafés, childcare, gardens) M
▶ deprioritise vehicles and local area traffic management M
▶ encourage open neighbourhood forums (block parties, recycling and sharing) M
▶ encourage ownership of open spaces through resident involvement and management S
▶ adapt public spaces for use by children (deprioritise vehicles in streets) M
▶ ensure open spaces are suitable for children (containment and definition of boundaries) S
▶ create local spaces for communal interaction such as front yards, streets M
▶ local infrastructure for communal activities (cooking, workshops) M
▶ create local community programmes to encourage informal interaction such as block parties M
▶ car share M
▶ alternative vehicles such as bicycles or use active and public transport L
▶ trip demand technology enablers (e.g. UBER™) L
E2 Public Transport

E3 Median House Price

E4 Bang for Buck

E5 Running Costs

E6 Self-Sufficiency

▶ improve intra-suburban walking links to transit stops M
▶ secure bicycle storage at key transit stops M
▶ foster transit culture M
▶ local area public transport advice, management and promotion (TravelSmart) M
▶ investigate co-operative housing models L
▶ ‘open’ and modular building’ strategies which allow consumers to stage completion/DIY S
▶ limit the complexity and scale of building (<3 levels) S
▶ modular building strategies S
▶ allow households to fit-out their own interiors (DIY) S
▶ co-operative housing models L
▶ mandate solar passive design S
▶ extend the performance of insulation in dwellings S
▶ design homes to be zoned for heating and cooling S
▶ improve infrastructure to enable work from home L
▶ co-working nodes distributed throughout the city L
The analysis of the qualities of the suburban and urban settings helps identify gaps in the qualities of different infill contexts, which can then be addressed to meet the study objectives of creating high quality urban infill environments.
The research sits within an overall objective of creating attractive and enduring urban infill in sprawling cities so that the strategic objectives of urban planning can be met, sustained and possibly even extended.
Infill has been happening in various guises and with varying degrees of success and acceptance in sprawling cities such as Perth typically since at least the urban consolidation policies of the 1980s. Current planning, however, demands an acceleration of this pattern of urban intensification over historical rates but also to achieve this in a manner which ensures it can be sustained. In short, new or improved methods of achieving this are required. One of the outstanding tasks which promises to substantially contribute to this is to further develop our understanding of the qualities of residential environments and then use this to develop high quality urban infill.
The research method presented in this study sets out to do this by initially developing a measurement framework comprised of quality criteria developed from different conceptual approaches. This is then applied to two very different settings in Perth: the standalone dwelling in the contemporary peripheral suburb (Sprawl); and the urban apartment (City). Both exhibit distinctive quali-
ties and represent the benchmarks of performance against which any new proposal will be considered and evaluated. The understanding of the typical range of performances exhibited by these two extremes is then used to perform a preliminary assessment of the qualities of three typical different infill contexts – Node, Corridor and Area, all assumed to be situated within a similar location in the perth central sub-region. The Node is a concentrated high-density location such as around a train station; the Corridor is medium to high density distributed along a busy roadway with road-based public transport; and the Area is a pattern of low-rise mediumdensity dwellings dispersed throughout the existing residential fabric.
This assessment reveals the performance gaps of each infill context which are recorded and tallied giving an indication of the overall relative performance. This in turn gives an account of the scope and types of effort required to bring the performance of each type of infill up to a standard which would blend the ‘best of both worlds’ – exhibiting exemplary qualities of both the Sprawl and the City. If this could be achieved then urban infill would present not only as an equivalent housing choice but would theoretically exceed the performance of each of its ‘forebears’, thereby pre-
senting a compelling case for investment and habitation and succeeding in meeting strategic objectives.
The results show that of the three infill contexts the Area pattern, where dwellings are distributed in a lowrise (<4 storeys) fashion throughout the existing fabric, clearly provides the best baseline performance. This would suggest that if the objective is to provide a widespread attractive and enduring pattern of infill development, this context would be the easiest, in terms of residential environment quality, in which to achieve this. Conversely the performance gulf between this and the other infill contexts of Node and Corridor reveals that there is substantial additional effort and investment required to implement these other types as broadly attractive options.
Finally, as a case study and a means of illustrating the utility of the research, a number of urban planning and design recommendations/tactics have been developed from AUDRC’s knowledge base to demonstrate possible ways in which the performance gaps of the Area infill context could be overcome. They are not exhaustive but indicate a number of possibilities. These are simply listed, with the ‘worst’ gaps addressed first and subsequently the more mediocre
performances given attention. The recommendations/tactics are also organised under their relevant urban scale of operation and discipline area in Appendix B to assist with their utilisation. For the Area pattern a summary of the principal tactics are listed below; however, the main body of the text and Appendix B go into greater breadth and detail:
▶ the need to substantially promote active and public transport through infrastructure and behaviour change;
▶ to offset energy and water use through on-site storage and collection;
▶ to rehabilitate biodiversity, conserve and extend the urban forest and promote soil and groundwater health; and
▶ create spaces and programmes for communal activities and make better use of streets and open spaces.
Overall the work has provided clarity on the challenges facing urban infill if it is to be positioned as a widely attractive option for investment and habitation. Importantly, as well as the clear advantage of Area infill, the shortcomings of Node and Corridor type contexts are qualified and whilst they are not excluded the scale of the challenge for these environments in meeting the vital performance standards is made apparent. To this end
the work presents an outline brief for the types of urban planning and design research and policy development necessary if urban infill is to present a widely attractive and enduring residential environment for the residents of the sprawling city.
This appendix provides technical information and references with respect to the methods of measurement for the indicators.
The proportion of land area devoted to parks, recreation and state forest in each planning sub-region.
The amount of built floor area (GFA) divided by the open space area of each urban module.
Assigned noise levels calculation method taking into account land use and transport influences.
References
Western Australian Planning Commission 2014. Urban Growth Monitor. ‘Urban Development Program’ Perth WA: Department of Planning WA.
Base Data Department of Environmental Protection WA. Assigned Noise Levels. Environmental Protection (Noise) Regulations 1997. Perth WA: Government of Western Australia.
The population density of the private site area.
The number of parks available to each resident within a walkable catchment (neighbourhood).
The amount of private and communal ground floor open space available for gardening per person.
The limiting magnitude of star brightness for viewing by the naked eye (Naked Eye Limiting Magnitude: NELM) correlated with the star brightness listing for the Southern Hemisphere.
Base Data
Centre for the Built Environment and Health (2013). Geo-Spatial Analytic Tool for public open spaces. Perth WA: University of Western Australia. [http://www.postool.com.au].
Base Data
Walkscore™
The number of free parking places in the urban module either uncovered, covered or enclosed divided by the average number of persons of driving age.
Light Pollution Science and Technology Institute 2006. [http://darksitefinder.com/maps/ world.html].
Hoffleit, D. and Warren, Jr., W. H., (1991). The Bright Star Catalog, 5th Revised Edition (Preliminary Version). [http://heasarc.gsfc.nasa.gov/ W3Browse/star-catalog/bsc5p.html].
[https://www.walkscore.com/]
Australian Bureau of Statistics (ABS) (2011). Census of population and housing. Canberra ACT.
Indicator
Q1 Commute Time
Sprawl: Average AM peak road travel speeds for three key routes applied over average commute distance.
City: Average AM travel speeds based on bus route timetabling applied over average commute distance.
Q2 Commute Distance
Q3 The Big Smoke
Average commute distance for outer northwest statistical sub-region (Sprawl) and Perth inner SLA (City).
References
ARUP (2013). 2012 Travel Time Surveys. RAC Travel Time Data. Perth WA: Royal Automobile Club WA.
Transperth (2013). [http://www. transperth.wa.gov.au/Timetables].
Bureau of Infrastructure Transport and Regional Economics (BITRE) (2010). Population growth, jobs growth and commuting flows in Perth. Canberra ACT.
Bureau of Infrastructure Transport and Regional Economics (BITRE) (2010). Population growth, jobs growth and commuting flows in Perth. Canberra ACT.
Q4 Do Run Run
The percentage of workers who work in the Perth LGA.
Sprawl: Average of six Liveable Neighbourhoods SA2 areas in outer planning sub-regions.
City: Average of Perth (C) SLA
The percentage of work trips by active travel modes.
Sprawl: Average of six Liveable Neighbourhoods SA2 areas in outer planning sub-regions.
City: Average of Perth (C) SLA
Australian Bureau of Statistics (ABS) (2011). Census of population and housing. Canberra ACT.
Australian Bureau of Statistics (ABS) (2011). Census of population and housing. Canberra ACT.
DEC monitoring site data: Department of Environment & Conservation (WA).
Indicator
Q5 Air Quality
Q6 Sea Breeze
Q7 Is it safe? Appendix A: Methods of Measurement
Method of Measurement
The yearly average concentration of nitrogen dioxide as a percentage of the allowable average yearly concentration as per the national ambient air quality standards, averaged over a ten-year period.
Sprawl: Duncraig City: Queens Building
The proportion of days during the summer months of Jan/Feb which receive a sea breeze of at least moderate strength triangulated from BOM and DEC weather recording stations.
The crime rate calculated by number of crimes reported (assault, burglary (dwelling), burglary (other), graffiti, robbery, stolen motor vehicle) per 1000 residents averaged over a three-year year period 2009 to 2012 to coincide with population data.
143 142 | Sprawl and the City
References
National standards for criteria air pollutants 1 in Australia. [https:// www.environment.gov.au/protection/ publications/factsheet-nationalstandards-criteria-air-pollutantsaustralia] BOM: Bureau of Meteorology DEC: Department of Environment & Conservation (WA)
Australian Bureau of Statistics (ABS) (2011). Census of population and housing. Canberra ACT. [http://www.police.wa.gov. au/Aboutus/Statistics/ Searchcrimestatistics/tabid/998/ Default.aspx]
Note: Calculations also completed on entertainment precincts and ‘best’ and ‘worst’ suburbs to gauge performance.
Indicator
R1 Embodied Energy
The equivalent weight of coal required to produce the amount of energy used in the production, transport and assembly of building materials expressed as weight per m2 of Gross Floor Area (GFA) constructed.
References
Grace, W. (2007) Sustainable Urban Living – a Perth perspective Australian Journal of Multidisciplinary Engineering, 5:1, pp.49–59.
Sprawl: Reduced embodied energy scenario of 551GJ/dw.
City: Embodied Energy multiplier of 0.87 per dwelling from literature review.
Note: 1kg coal (WA) = 20MJ with 0.414 thermal efficiency.
R2 Transport Emissions
R3 PV Energy Production
Average transport emissions (CO2-e) per resident per year converted into an equivalent distance of private vehicle travel in km.
The productive capacity of roof mounted PV cells for each urban private lot as a proportion of the average consumption of energy of all residents (gas and electricity).
Kinesis (2010). Urban Planning, Information Technology and Evidence Based Decision Making for Emission Reductions in our cities, Sydney NSW.
Sprawl: Urban Fringe 2 scenario City: Urban Infill 1 scenario
US EPA Greenhouse Gas Equivalencies Calculator. [http://www.epa. gov/cleanenergy/energy-resources/ calculator.html#results].
Energy Efficient Strategies. (2008). Energy Use in the Australian Residential Sector 1986–2020. Department of the Environment, Water, Heritage and the Arts. Canberra ACT.
Sprawl: 50% of roof area for PV. City: 75% of roof area for PV.
Clean Energy Council (2013). How Solar PV Works. [http:// www.solaraccreditation.com.au/ consumers/purchasing-your-solarpv-system/how-solar-pv-works. html].
Indicator
R4 Carbon Storage
The sequestration capacity of tree planting on open space in the urban module in relation to the emissions from all residents; daily operation of household devices, fixtures and appliances (electricity only).
Note: 1 tree/12.5m2 open space. Sequestration rate 260t CO2-e/30yr/Ha
Emission factor: 0.76kg CO2-e/kWh
References
Energy Efficient Strategies. (2008). Energy Use in the Australian Residential Sector 1986–2020. Department of the Environment, Water, Heritage and the Arts. Canberra ACT.
Sprawl: 6923 kWh/yr/dw City: 4005 kWh/yr/dw
Johnson, I. and Coburn, R. (2010). Trees for carbon sequestration, Primefact 981. Department of Industry and Investment NSW.
R5 Urban Farming
The annual productive potential of the open space in the urban module in terms of yield of fruit, vegetables, nuts and honey, as a proportion of the average Australian annual consumption.
Zainuddin (2013). Melbourne Urban Backyard Food Production: How much and how? A minor thesis submitted to the School of Global, Urban and Social Studies, RMIT University.
Ghosh, S. and Head, L. M. (2009) Retrofitting the Suburban Garden: morphologies and some elements of sustainability potential of two Australian residential suburbs compared. Australian Geographer, 40:3, pp. 319–46.
DAFF (2013). Australian food statistics 2011–12. Department of Agriculture, Fisheries and Forestry: Canberra ACT.
Indicator
R6 Infrastructure
The cost of the required upgrade to arterial road infrastructure to sustain current journey to work travel patterns calculated as a cost per person.
Note: Arterial road upgrade cost $4M/km from survey of recent projects (WA).
R7 Asphalt Index
R8 Habitat Loss
The area of road surfacing in the neighbourhood divided by the number of dwellings (assuming that the neighbourhood is developed to the same residential density as the subject site).
Note: Road surfacing assumed to occupy 75% of road reserve area (City).
The area of land that is required to be cleared to support the development pattern – effectively the gross residential density measured at the neighbourhood scale (assuming that the neighbourhood is developed to the same residential density as the subject site).
References
Austroads (2013). Guide to Traffic Management Part 3: Traffic Studies and Analysis. Sydney NSW: Austroads.
Bureau of Infrastructure Transport and Regional Economics (BITRE) (2010). Population growth, jobs growth and commuting flows in Perth. Canberra ACT.
Landgate (2014). Cadastral data. Government of Western Australia.
Google (2014), Digital Globe
Western Australian Planning Commission (2014). Urban Growth Monitor. Urban Development Program. Perth WA: Department of Planning WA.
University of Toronto (2007). Urban Density in the Greater Golden Horseshoe. Centre for Urban & Community Studies: Toronto, Canada.
Indicator
R9 Thirsty Work
R10 No Vacancy
Method of Measurement
The average daily consumption of water factored between internal and external use.
The average number of vacant bedrooms per dwelling.
References
Water Corporation (2010). Perth Residential Water Use Study. Perth WA.
Base Data
Note: Assumes an average bedroom occupancy of 1.5 persons.
Indicator
S1 Kidz
The proportion of the resident population in the suburb aged fifteen years and under.
Sprawl: Average of six Liveable Neighbourhoods SA2 areas in outer planning sub-regions.
City: Average of Perth (C) SLA
S2 School Travel
S3 Backyard Bliss
S4 Social Capital
S5 Staking a Claim
S6 Reproductive Potential
The distance from the sample site to a primary school.
The amount of private open space per person aged under fifteen years.
Walkscore™
The amount of land in individual private ownership typically represented on the property title.
Total fertility rate (2001–2013 average) representing the number of children a female would bear during her lifetime if she experienced current age-specific fertility rates at each age of her reproductive life.
Sprawl: Average of six Liveable Neighbourhoods SA2 areas in outer planning sub-regions.
City: Perth City SA2
S7 Communality
The percentage of routine daily activities which can easily be or are typically undertaken in a communal setting.
Note: Activities analysed are coffee breaks, small child play, personal fitness, pet exercise, gardening, DIY/ workshop, laundry, cooking.
References
Australian Bureau of Statistics (ABS) (2011). Census of population and housing. Canberra ACT.
Landgate (2014). Cadastral data. Government of Western Australia.
Base Data
[https://www.walkscore.com/]
Base Data
Australian Bureau of Statistics (ABS) (2014). Births Australia Table 3: Births, Summary, Statistical Area Level 2—2001 to 2013, cat. no 3301.0: Canberra ACT.
Desktop assessment, scores are assigned 0 – never/infrequently, 1 –always/frequently.
Indicator
E1 Private Transport
The average number of vehicles owned per person of driving age multiplied by the weekly cost of owning and operating a medium-sized passenger vehicle in Perth.
Note: City cost rate reduced by 10% to account for lower VKT.
The Royal Automobile Club of WA (Inc.) (2015). Vehicle Running Costs Guide. [http://rac.com.au/motoring/motoring-advice/buying-a-car/ running-costs].
E2 Public Transport
E3 Median House Price
E4 Bang for Buck
The public transport fare for the average commute distance was calculated for each leg (all working days).
The median house price was divided by the average number of employed persons per household.
Sprawl: Median price of established house at the suburb level.
City: Average of 147 sales of twobedroom apartments over a one year period (suburb).
The cost of purchasing a square metre of private enclosed floor area utilising the median price measures outlined in E3.
[http://www.transperth.wa.gov.au/ tickets-fares/fares].
Australian Bureau of Statistics (ABS) (2011). Census of population and housing. Canberra ACT
REIWA. [realestate.com.au/].
E5 Running Costs
E6 SelfSufficiency
Typical annual operational household energy use expressed as a cost per resident.
Note: Energy cost 25c/kWh, supply charge 47c/day.
Base Data
The average proportion of workers who work within their own planning sub-region (SA4).
Sprawl: Average of six Liveable Neighbourhoods SA2 areas in outer planning sub-regions.
City: Average of Perth (C) SLA
Energy Efficient Strategies. (2008). Energy Use in the Australian Residential Sector 1986–2020. Department of the Environment, Water, Heritage and the Arts. Canberra ACT.
Sprawl: 10826 kWh/yr/dw City: 6679 kWh/yr/dw
Australian Bureau of Statistics (ABS) (2011). Census of population and housing. Canberra ACT.
Infrastructure
Landscape
Programme
Design
Appendix B: Tactics by Scale and Type
Community | 151 150 | Sprawl and the City
▶ prioritise building scale infrastructure solutions (solar, battery, water recycling)
▶ investigate on-site infrastructure opportunities to limit reliance on centralised networks
▶ smart technology to regulate activation of public and communal lighting
▶ investigate on-site storage technology and integration with building techniques/materials
▶ mandate solar passive design
▶ encourage deep planting zones and raingardens as part of development
▶ infuse nature into buildings (materials, living roofs and walls)
▶ create patches for insects and birds
▶ water-wise landscape design
▶ water-sensitive urban design principles
▶ communal guestrooms which can be booked in advance
▶ flexible new home designs which allow multi-household occupancy
▶ promote housing diversity to ensure options for family households
▶ lighting design which avoids ‘spill’
▶ enhance public and communal lighting design
▶ ensure dwelling interfaces appropriately with street and public spaces
▶ ‘open’ and modular building’ strategies which allow consumer to stage completion/DIY
▶ ensure communal open space is readily visible from habitable rooms
▶ limit the complexity and scale of building (<3 levels)
▶ modular building strategies
▶ allow households to fit-out their own interiors (DIY)
▶ extend the performance of insulation in dwellings
▶ design homes to be zoned for heating and cooling
▶ retrofit public areas for additional open and communal spaces (streets, verges)
▶ encourage ownership of open spaces through resident involvement and management
▶ ensure open spaces are suitable for children (containment and definition of boundaries)
Infrastructure
▶ prioritise investment in regional cycling networks through suburbs
▶ deprioritise vehicular movement
▶ car share
▶ improve intra-suburban walking links to transit stops
▶ secure bicycle storage at key transit stops
▶ Precinct scaled water harvesting and reticulation strategies
Landscape
▶ more intensive planting of public spaces such as streets
▶ local urban forest and biodiversity network strategies
▶ make use of the streets and verges for natural amenity
▶ retain trees!
▶ incorporate nature into public land (parks, drainage basins, switchyards)
▶ investigate the quality and relevance of park design for an infill context
▶ street trees, shade and canopies
▶ street furniture and artwork
Programme
▶ flexibility in neighbourhood planning for new activities and uses
▶ enable local businesses and facilities in residential streets (cafés, childcare, gardens)
▶ encourage open neighbourhood forums (block parties, recycling and sharing)
▶ lighting using warm colours
▶ more communal infrastructure on streets (treehouses, sporting courts)
▶ local area public transport advice, management and promotion
▶ provide a diversity of open space types to cater for different youth sectors
▶ deprioritise vehicles in open spaces and streets (local area traffic management) to make them suitable for play and socialising
▶ create local spaces for communal interaction such as front yards, streets
▶ local infrastructure for communal activities (cooking, workshops)
▶ create local community programmes to encourage informal interaction such as block parties
▶ adapt public spaces for use by children (deprioritise vehicles in streets)
Infrastructure
Programme
Design
▶ reduce peak demand on infrastructure (workplace decentralisation, flexible work support, energy and water storage)
▶ investment in alternative travel modes to offset reliance on large areas of road surfacing
▶ improve infrastructure to enable work from home
▶ widespread priority public transport networks could connect large numbers of people to the most opportunities
▶ improve active travel infrastructure such as cycle routes
▶ covered and secure bicycle storage at key locations
▶ use renewable sources for vehicle propulsion (e.g. solar-electric)
▶ promote and enhance active travel infrastructure
▶ alternative vehicles such as bicycles or use active and public transport
▶ co-working nodes distributed throughout the city
▶ trip demand technology enablers (e.g. UBER™)
▶ redistribution of employment into local areas
▶ formalise flexible working practices
▶ urban infill as a general strategy promises to provide a better connection between employment and dwelling
▶ ensure high quality end-of-trip facilities in workplaces
▶ mandate vehicle fuel efficiency for new developments
▶ investigate potential to retrofit existing typical stock (standalone dwellings) for multi-occupancy
▶ co-operative housing models
BOLLETER, J. 2015. Scavenging the Suburbs. Perth WA: UWAP.
Additional References | 155 154 | Sprawl and the City
DUCKWORTH-SMITH, A. 2012. Mean Streets: residential intensification strategies for the Sprawled City. Doctor of Philosophy: University of Western Australia.
FALCHI, F., CINZANO, P., ELVIDGE, C. D., KEITH, D. M. & HAIM, A. 2011. Limiting the impact of light pollution on human health, environment and stellar visibility. Journal of Environmental Management, 92, pp. 2714–22.
MUSTERD, S. & MURIE, A. (eds) 2010. Making Competitive Cities: Debates & Challenges. Oxford UK: Blackwell Publishing Ltd.
NEWMAN, P. & KENWORTHY, J. 1999. Sustainability and Cities. Overcoming Automobile Dependence. Washington DC: Island Press.
REDFIN REAL ESTATE. Walk Score®. [https://www.walkscore.com/AU-WA/].
ROWLEY, S. & PHIBBS, P. 2012. Delivering diverse and affordable housing on infill development sites. AHURI Final Report No. 193. Melbourne: Australian Housing and Research Institute (AHURI).
TINDALL, M. 2008. Perth: A Social Atlas. Australian Bureau Of Statistics: Belconnen ACT.
TRUBKA, R., NEWMAN, P. & BILSBOROUGH, D. 2008. Assessing the Costs of Alternative Development Paths in Australian Cities. Fremantle WA: Curtin University Sustainability Policy Institute.
WELLER, R. 2009. Boomtown 2050 Perth, WA: UWA Press.
WELLER, R. & BOLLETER, J. 2013. Made in Australia: The future of Australian cities. Perth WA: UWA Press.
WESTERN AUSTRALIAN PLANNING COMMISSION (WAPC) 2003. Dialogue with the city – Survey Results. Department of Planning WA: Perth WA.
WESTERN AUSTRALIAN PLANNING COMMISSION 2013. State Planning Policy 3.1 Residential Design Codes. Perth WA: Department Of Planning WA.
WESTERN AUSTRALIAN PLANNING COMMISSION 2014. Urban Growth Monitor. Urban Development Program. Perth WA: Department of Planning WA.
YIGITCANLAR, T., BAUM, S. B. & HORTON, S. H. 2007. Attracting and retaining knowledge workers in knowledge cities. Journal of Knowledge Management, 11, pp. 6–17.
The author would like to acknowledge the following persons who have provided input and guidance with regard to the development of this project and publication:
AUDRC
Prof Dr Joerg Baumeister
Bill Grace
Dr Daniela Ottman
Dr Julian Bolleter
Jill Penter
Dr Cristina Ramalho
Nadine Blasche
Dennis Meyer
Ana Maria Velasco Munoz
Dinis Candeias
Dr Zoe Myers
Mark Taylor
Annabel Smith
This project was undertaken with the assistance of the Western Australian Planning Commission (WAPC) and the Department of Planning WA.
Dr Anthony Duckworth-Smith is Assistant Professor at the Australian Urban Design Research Centre (AUDRC). He is a senior researcher, practitioner and teaches in the Master of Urban Design Programme (UWA).
First published in 2016 by UWA
Publishing
Crawley, Western Australia 6009
<www.uwap.uwa.edu.au>
UWAP is an imprint of UWA
Publishing, a division of The University of Western Australia
This book is copyright. Apart from any fair dealing for the purpose of private study, research, criticism or review, as permitted under the Copyright Act 1968, no part may be reproduced by any process without written permission. Enquiries should be made to the publisher.
Copyright text, pictures and illustrations
© 2016 by AUDRC / Anthony Duckworth-Smith
The moral right of the authors has been asserted.
National Library of Australia
Cataloguing-in-Publication information in process.
ISBN: 978-1-74258-865-0