To cite: Foster S, Maitland C, Hooper P, et al. High Life Study protocol: a cross-sectional investigation of the influence of apartment building design policy on resident health and well-being. BMJ Open 2019;9:e029220. doi:10.1136/ bmjopen-2019-029220
Received 18 January 2019
Revised 29 June 2019
Accepted 04 July 2019
High Life Study protocol: a crosssectional investigation of the influence of apartment building design policy on resident health and well-being
Sarah Foster, 1,2 Clover Maitland,1,3 Paula Hooper,4 Julian Bolleter,4 Anthony Duckworth-Smith,4 Billie Giles-Corti,1 Jonathan Arundel1
AbStrACt
Introduction The rapid increase in apartment construction in Australia has raised concerns about the impacts of poorly designed and located buildings on resident health and well-being. While apartment design policies exist, their content varies across jurisdictions and evidence on their impact on health and well-being is lacking. This cross-sectional observational study (2017–2021) aims to generate empirical evidence to guide policy decisions on apartment development and help to create healthy, equitable higher-density communities. Objectives include to benchmark the implementation of healthpromoting apartment design requirements and to identify associations between requirements and resident health and well-being outcomes.
Strengths and limitations of this study
► The High Life Study aims to provide policy-specific health evidence to help to shape the content of apartment design guidelines.
► The study will use objective measures of the apartment and building design derrived from development and strata survey plans to investigate their relationship with health and well-being outcomes.
► The study has resourced knowledge translation outputs including the co-creation of indicators with state government planning departments to benchmark, monitor and evaluate the implementation and impact of apartment design policies.
1Centre for Urban Research, RMIT University, Melbourne, Victoria, Australia
2School of Agriculture and Environment, University of Western Australia, Crawley, Western Australia, Australia
3School of Human Sciences (Exercise and Sport Science), University of Western Australia, Crawley, Western Australia, Australia
4Australian Urban Design Research Centre, University of Western Australia, Crawley, Western Australia, Australia
Correspondence to Dr Sarah Foster; sarah.foster@rmit.edu.au
Methods and analysis Eligible buildings in three Australian cities with different apartment design guidelines will be stratified by area disadvantage and randomly selected (~n=99). Building architects, developers and local governments will be approached to provide endorsed development plans from which apartment and building design features will be extracted. Additional data collection includes a resident survey (~n=1000) to assess environmental stressors and health and wellbeing impacts and outcomes, and geographic information systems measures of the neighbourhood. The study has 85% power to detect a difference of 0.5 SD in the primary outcome of mental well-being (Warwick-Edinburgh Mental Well-being Scale) at a 5% level of significance. Analyses will compare policy compliance and health-promoting design features between cities and area disadvantage groups. Regression models will test whether higher policy compliance (overall and by design theme) is associated with better health and well-being, and the relative contribution of the neighbourhood context.
Ethics and dissemination Human Research Ethics Committees of RMIT University (CHEAN B 21146-10/17) and the University of Western Australia (RA/4/1/8735) approved the study protocol. In addition to academic publications, the collaboration will develop specific healthpromoting indicators to embed into the monitoring of apartment design policy implementation and impact, and co-design research dissemination materials to facilitate uptake by decision makers.
► The High Life Study is limited by its cross-sectional design; although the study will provide a benchmark of current policy implementation which could be repeated to monitor policy uptake and compliance, and the survey provides baseline data for a future longitudinal study contingent on funding.
► The number of apartment buildings sampled (n=99), focus on buildings developed between 2006 and 2016, and an expected resident response rate of ~15% may limit the generalisability of the findings.
IntroduCtIon
Against a global background of rapid urbanisation and population growth, and calls for more compact cities,1 2 apartment development has proliferated in major Australian cities.3 The influx of new apartment buildings has ignited concerns about the quality, amenity and future versatility of the housing being provided,4–7 with potential implications for the health and well-being of apartment residents.8 In response, several Australian states have developed comprehensive new apartment design guidelines, including minimum design standards. Not only do these guidelines aim to raise the quality of new apartments, but some also aspire to promote public health.9 10 However, to date, there is little policy-specific health evidence to help to shape the content
Foster S, et al BMJ Open 2019;9:e029220. doi:10.1136/bmjopen-2019-029220
Open access
of apartment design guidelines, and mandate the inclusion of health-promoting design standards.
Apartment living and health
Apartment design can expose (or protect) residents from a range of environmental stressors which, in turn, can impact health and well-being.1 8 Studies of housing and health focusing wholly, or in part, on residents of high-density housing consistently underscore the importance of natural ventilation,11–13 thermal comfort,14–17 sunlight access18–20 and acoustic privacy21–25 to a range of health and well-being outcomes. Evidence also suggests that apartment outlook onto ‘natural’ vegetated areas can positively impact well-being and satisfaction,26 attention27 and cognitive functioning.28 However, there is less compelling evidence for other design attributes, such as internal space, which typically impacts health via the mechanism of crowding.25 29–31
At the building-level, design features, such as communal space, green space, access arrangements, maintenance, storage and car and bicycle parking, can affect the ease and experience of apartment living, and indirectly impact health via psychosocial processes.8 A review found more mental health problems among high-rise residents than those in low-rise or detached houses, and implicated social isolation as the likely explanatory pathway.32 This may relate to a lack of communal space for residents to interact.25 Several small studies also suggested that the design of communal spaces, and activities they supported (eg, gardening), were important for mental health.33 34 However, as with most apartment-level and building-level studies, these studies lack the specificity needed to inform evidence-based policy.
The building location and neighbourhood setting can also support healthier behaviours and interactions, but equally, certain neighbourhood characteristics may negatively impact residents’ health. Higher densities ensure that there are sufficient people to support the local shops, services and transport that encourage active transport.8 35 While proximate retail destinations have been associated with a range of positive outcomes (eg, walking and social capital),1 36 37 some unintended consequences can stem from the intensification of land-uses. Increased numbers of local destinations can inflate perceptions of crime,38 and specific destinations (eg, alcohol outlets) have been associated with crime and disorder,39 increased alcohol consumption40 and poorer mental health.41 Further, apartment buildings are often located along major arterial roads, exposing residents to higher pollutant levels and increasing the risk of respiratory ill health and cardiovascular disease for those within 300 m.1 Thus, the neighbourhood context may aggravate some environmental stressors experienced by apartment residents, while also directly impacting on other behaviours and processes that influence their health and well-being.
Apartment design policies that mandate health-promoting design requirements may play an important role in reducing social and health inequities. Apartment-level,
building-level and neighbourhood-level characteristics coalesce to create living environments that support (or compromise) health. While it may be relatively easy to deliver quality apartments in more affluent settings, apartment and build quality may be compromised in peripheral suburbs or disadvantaged areas where profit margins are lower.42 Further, the neighbourhood influences on health may be intensified in disadvantaged areas, which are often characterised by more disorder, crime, traffic exposure, alcohol availability and poorer amenity.43–45 As lower-income populations typically have fewer choices about the location, design and quality of their housing,46 they may be doubly disadvantaged if their building is both poorly designed and located in an unsupportive and/or health-compromising neighbourhood.
Apartment design policy
Apartments in different Australian cities have been developed under different policy environments, with considerable variation in the detail, specificity and language of the design requirements. Since 2002, apartment buildings in New South Wales (NSW) have been developed under State Environmental Planning Policy 65 (SEPP65), which is the most comprehensive Australian design policy for apartment development. Since its introduction, SEPP65 is widely considered to have improved the quality of medium-density and higher-density buildings.42 This suggests that the quality of apartments delivered in other states, where design guidance has been limited, may produce poorer outcomes. However, claims that SEPP65 has had a positive effect on design have not been substantiated by empirical research, nor has the policy’s impact on residents’ health and well-being been evaluated.
Nevertheless, in the last few years, other Australian states have sought to improve design quality by introducing guidelines that largely emulate SEPP65. In Victoria (VIC), apartment design guidance was limited,9 47 until the introduction of a new guideline in 2017. Similarly, in Western Australia (WA), apartments were governed by a policy that primarily catered to suburban development,48 until a comprehensive apartment design policy was released in 2019,10 drawing heavily on NSW’s SEPP65. Indeed, several other Australian states have either drafted or proposed developing new state-specific design guidelines.49
The evolution of design guidelines illustrates a dynamic policy environment and highlights a clear trend towards more comprehensive design guidance. However, there are still inconsistencies between the design guidelines, including if and where to set minimum standards. For example, NSW includes minimum size standards for different apartment types (eg, studio and one-bedroom); WA specifies minimum sizes that are larger for studios but smaller for one-bedroom and two-bedroom apartments; and VIC does not stipulate minimum apartment sizes at all. These inconsistencies suggest that rather than rely on opinion or industry best practice, there is a need for an evidence base to assist policymakers to set minimum standards that promote health.
Apartment design guidelines have also become more aspirational, with some explicitly aiming to impact health. For instance, the Victorian standards aim to provide ‘safe and healthy living environments’9 (p.3), and the WA guideline recognises the importance of good design in promoting social engagement and physical activity in inclusive, equitable communities.10 50 This shift in emphasis in states undergoing policy transition highlights an increasing awareness within government of the role that quality apartment design could play in promoting health and well-being.
the High Life Study
Despite numerous studies examining aspects of apartment design or higher-density living in relation to health and well-being, to date, the health evidence lacks the specificity required to adequately inform design policy.51 52 Few studies create and analyse policy-specific design measures (ie, based on the planning policies or design codes that underpinned and shaped the provision of the building), to evaluate the ‘on-the-ground’ impact of design requirements on health. Further, no studies examine whether the holistic application of more comprehensive design guidelines improves design quality, and, in turn, enhances residents’ health and well-being. They also offer little clarity on which (if any) specific requirements should be prioritised from a health perspective, or whether the standards stipulated are sufficient to support health. The High Life Study addresses these gaps by creating policy-specific measures of apartment design and assessing their associations with residents’ health and well-being.
Aims and objectives
The overall purpose of the High Life Study is to provide empirical evidence on the association between apartment design requirements and resident health and wellbeing outcomes to guide future policy decisions on the design and location of residential apartment buildings and contribute to the creation of healthy, equitable higher-density communities. The term ‘requirements’ refers to the specific content of apartment design policies and their companion guidelines. The specific research objectives are to:
1. Assess whether apartments built under a more comprehensive apartment design policy (ie, SEPP65; Sydney, NSW), incorporate more health-promoting design requirements than apartments built in jurisdictions with comparatively limited design guidance (Melbourne, VIC and Perth, WA).
2. Benchmark the ‘on-the-ground’ implementation of health-promoting apartment design requirements in each city to assess if current development meets (or how far it is from) the aspirations outlined in the state-specific design policies.
3. Evaluate differences in the implementation of health-promoting apartment design requirements by neighbourhood disadvantage (ie, do buildings in lower-income neighbourhoods contain fewer health-pro-
moting design requirements, and if so, what requirements are being excluded?).
4. Identify whether residents living in apartments incorporating more health-promoting design requirements report better health and well-being, and which specific design requirements are associated with health and well-being outcomes.
5. Identify the wider neighbourhood contextual features (eg, shops, public open space and public transport) that, when paired with apartment living, are associated with health and well-being outcomes.
6. Examine the potential explanator y pathways through which apartment, building and neighbourhood design impact on residents’ health and well-being (eg, via fear of crime, social isolation and environmental stressors).
MEtHodS Study design
The High Life Study is a cross-sectional observational study of approximately 1000 adults residing in apartment buildings across three Australian cities: Sydney, Melbourne and Perth. It combines objective policy-specific measures of apartment and building design requirements (sourced from building plans), neighbourhood contextual measures (created in geographic information systems (GIS)) and a survey of building residents on their perceived apartment building and design exposures, environmental stressors, psychosocial impacts, health behaviours, and health and well-being outcomes (self-reported).
Conceptual framework
Figure 1 displays the conceptual framework for the High Life Study. The study is underpinned by an ecological model, which seeks to understand multiple levels of influence on behaviour due to the constant interaction between individuals and their environments.53 There are several hypothesised pathways connecting apartment design policy, and apartment and building design, with resident health and well-being outcomes. These pathways are potentially complex and influenced by the design of housing as well as its location within the broader neighbourhood context.32 54 In addition to direct effects on health and well-being from building-induced environmental stressors (eg, noise annoyance, crowding and inadequate privacy), these factors can also impact health and well-being indirectly via psychosocial and behavioural impacts.32 Sociodemographic factors are included in the framework as potential confounders.
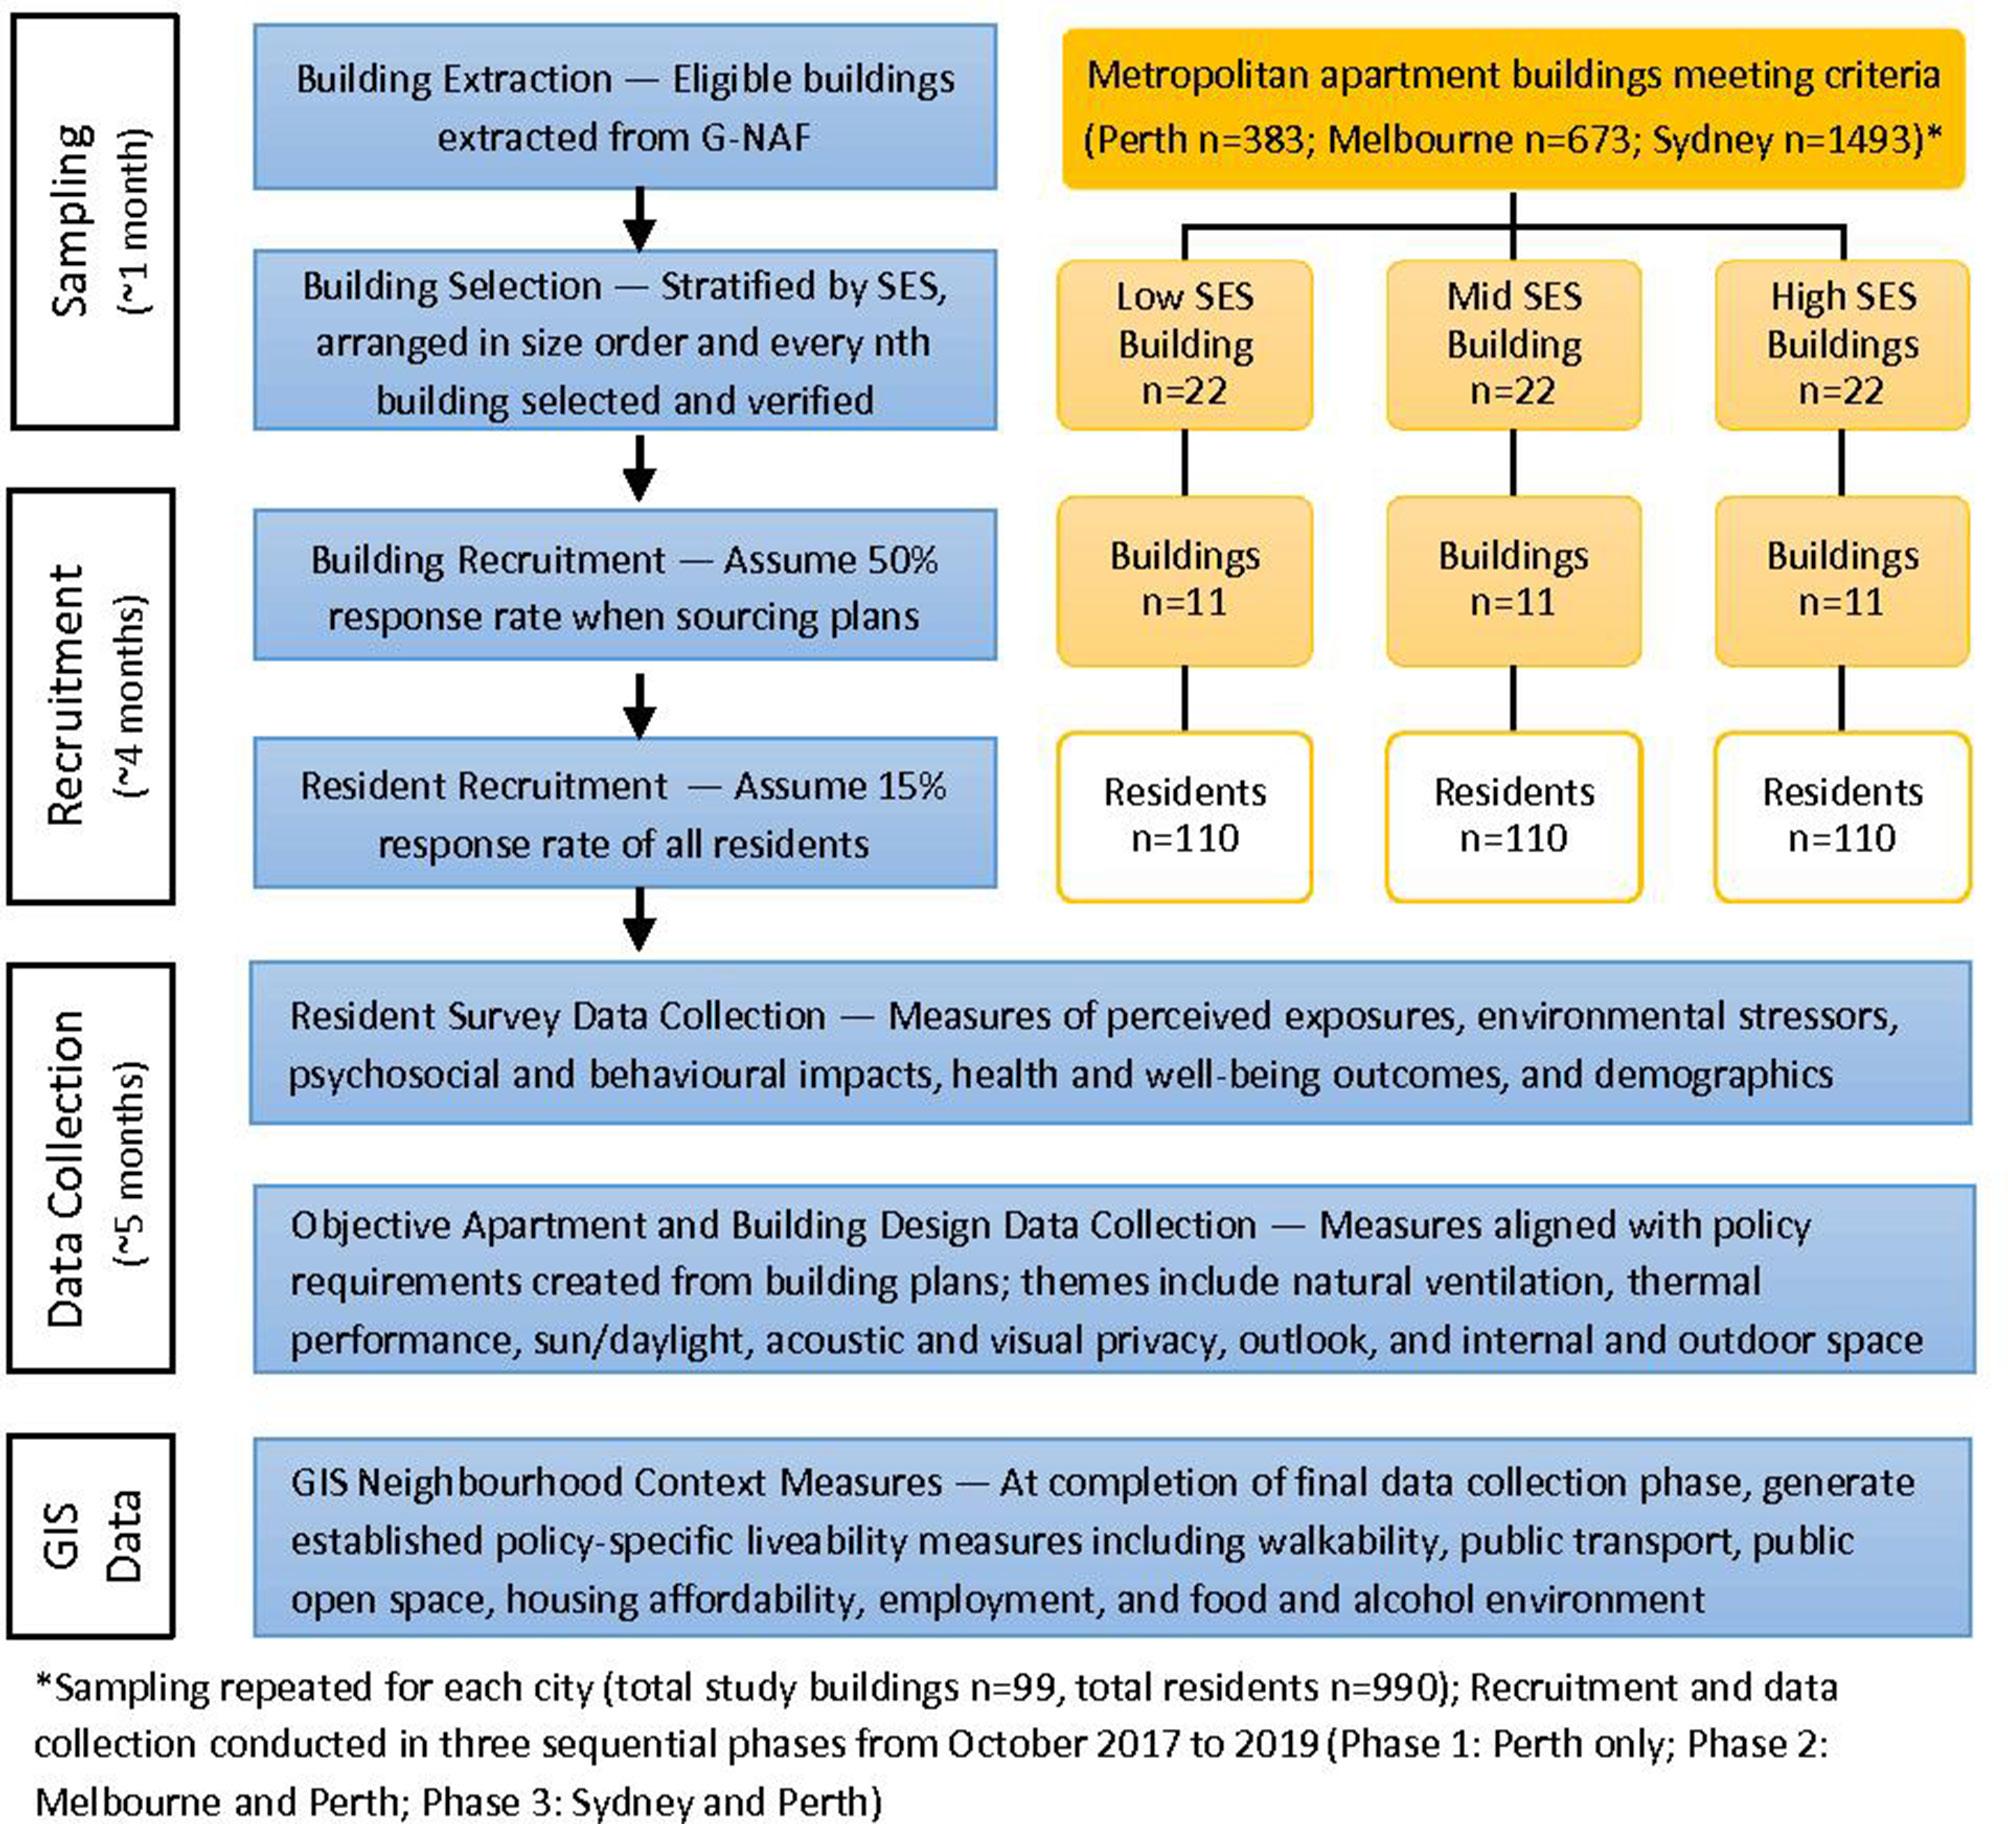
building sampling and recruitment
Figure 2 shows an overview of the study sampling, recruitment and data collection methods for one city (ie, this method will be repeated in all three cities). A previously developed methodology will be used to randomly select buildings in the greater metropolitan areas of Sydney, Melbourne and Perth. To be eligible, buildings must have 40+ apartments (no maximum size limit), three or
New
Figure 1 Conceptual framework of the High Life Study—hypothesised pathways connecting apartment design policy and resident health and well-being.
more storeys, be built between 2006 and 2016, and the endorsed architectural or development plans (including floor plates for each building level and elevations for each aspect) be available. The date range limits buildings in Sydney to those developed under SEPP65 and minimises the influence of building maintenance. A list of addresses most likely representing apartment buildings built between 2005 and 2017 will be compiled using Geocoded National Address File data from these two periods.55 56 Primary addresses from 2017 will be associated with counts of new (ie, in 2017, but not in 2005) secondary addresses within 10 metres of the primary address location. Results will be filtered to include only those mesh blocks with a primary land use of ‘residential’.
Additional information added to the returned set of developments will include: (1) distance to the central business district categorised into five bands (ie, <5, 5–10, 10–20, 20–30 and >30 km) and (2) the Index of Relative Socio-economic Disadvantage (IRSD) (2011)57 within state statistical area level 1 decile ranking, stratified into high (deciles 8–10), mid (deciles 5–7) and low (deciles 1–4) socioeconomic status (SES). Buildings in each area disadvantage grouping will be ordered by the number of apartments, and every nth building will be randomly selected. If the selected building doesn’t meet the criteria after a review using Google Earth, Internet searches and/ or a site visit, it will be replaced by the next building. For each building selected, the responsible local government authority, architect and developer will be contacted to locate a copy of the building plans. Using this method, 66
buildings will be selected in each city, with a recruitment target of 11 buildings in each of the low, mid and high SES areas (ie, based on the assumption that plans can be sourced for 50% of buildings).
Participant sampling and recruitment
All residents of the confirmed apartment buildings will be invited to participate in the study, except for larger buildings where the number of invitations will be capped at 200. Where this occurs, a purposive method will identify apartment numbers to be removed in each building (eg, selecting apartments from different buildings within complexes, a range of floor levels and apartment types). The building selection criteria and process ensures buildings of a sufficient scale will be included so the number of apartment residents approached to participate, together with an anticipated response rate of ~15%, will achieve a final sample size of approximately n=1000 residents (ie, at least n=6667 apartment residents will be invited to participate).
An information pack will be posted to ‘The Resident’ describing the study and inviting the adult (18 years and older) with the next birthday to participate in an online or hard copy survey. The pack will include an invitation and information letter, a hard copy survey and reply-paid envelope, and a small up-front incentive (eg, tea bag or scratch and win card). The letter will also provide a weblink and unique participant ID to allow residents the option to complete the survey online. The survey takes approximately 30 min to complete. Those who complete
Figure 2 Sequence of sampling, recruitment and data collection methods in each of the three participating cities (Perth, Melbourne and Sydney). GIS, geographic information systems; G-NAF, Geocoded National Address File; SES, socioeconomic status.
the survey will be entered into a prize draw to win a retail voucher. Additional awareness of the High Life Study will be built through contact with owners corporations, building managers and resident groups.
data collection
Data will be collected over a 2-year period from October 2017 to October 2019 (during spring and autumn) in three phases: (1) Perth only; (2) predominantly Melbourne and (3) predominantly Sydney. The initial Perth data collection includes fewer buildings, with additional Perth buildings added to the Melbourne and Sydney data collection. This sequenced approach to data collection is due to the resource-intensive nature of sourcing the development applications necessary for building inclusion in each jurisdiction. The following data collection methods were included to capture measures from all pathways of
the conceptual model (figure 1). An overview of data collection methods and a description of the measures is contained in table 1
The
resident survey
The resident survey will be subject to test–retest reliability prior to administration using a convenience sample of apartment residents (n>100). The survey is available on request from the first author.
Apartment and building design perceived exposure measures and environmental stressors—Perceived exposures will be measured using new items that address: natural ventilation, thermal performance, sunlight and daylight, acoustic privacy, visual privacy, outlook and internal space, outdoor space and building facilities. Additionally, most survey items assessing environmental stressors (ie, draught sensation, thermal comfort, air conditioner
Table 1 Overview of the High Life Study measures and data collection methods
The High Life Study measures Description (source)*
Apartment and building design exposures
Natural ventilation Cross-through apartment‡; openable windows‡; ratio of inlet/outlet windows‡; windows in corridors‡ and fresh air flow§
Sunlight/daylight Aspect of living area/balcony‡; area of windows/glass‡; snorkel windows, sky lights and light wells‡; direct sunlight between 09:00 and 15:00‡; direct sunlight§ and windows§‡
Thermal performance Air conditioner required§
Acoustic privacy Bedrooms/living room adjacency to external noise sources/circulation spaces‡; windows open to common areas‡; neighbours above/below/beside/with common walls‡ and noise from inside/outside building§
Visual privacy Separation between living area/bedrooms and adjacent buildings‡; balconies overlooking communal spaces‡ and overlooking from adjacent buildings§
Outlook External facing living rooms/bedrooms‡; overlook communal/public space‡ and features in view§
Internal size/space/ layout Open plan layout‡; number/area of rooms‡; ceiling height‡; wardrobes‡; internal storage area‡; bedrooms/ bathrooms off living areas‡ and overall space§‡
Outdoor size/space/ layout Presence/area/access/aspect of balcony/courtyard‡; external storage‡ and overall space§‡
Building facilities Number/mix of apartments‡; floors, lifts, corridors and entrances‡; presence/area of various communal/ retail spaces‡; landscaping treatment‡; car/bicycle parks‡; external storage area/location‡ and presence of eight types of facilities§‡
The High Life Study measures Description (source)*
1. Walkability indexCalculated as the sum of z-scores of street connectivity, dwelling density and daily living score87
► Daily living: The sum of access indicators to three kinds of daily living as a proxy for land use mix
► Dwelling density per ha: The ratio of the total number of dwellings located in mesh blocks intersecting each participants’ 1600 m buffer divided by the buffer size in hectares
► Street connectivity per km2: The ratio of the count of 3+ ways intersecting a participants’ 1600 m buffer divided by the buffer size in square kilometres
2. Public transportA stop on the public transport network within mode-specific threshold distances, that is, either a bus stop within 400 m, tram stop within 600 m or train station within 800 m
3. Public open spaceAccess to at least 1.5 ha in size POS within 400 m of a residence
4. Housing affordabilityBased on the ABS 30:40 indicator of housing affordability stress inverted to form a housing affordability indicator; statistical area 1 (SA1) where, on average, households with income in the bottom 40% of the Australian income distribution pay less than 30% of their income on housing costs
5. Local employmentPercentage of employed persons who live and work in the same statistical area 3 (SA3), calculated at statistical area 2 (SA2) level
6. Food environmentPercentage of food outlets within 3200 m that are healthy food destinations and percentage residential dwellings within 1 km of a supermarket
7. Alcohol environmentPercentage of residences without access to an on-licence within 400 m and percentage of residences without access to an off-licence within 800 m
interaction Acts of neighbouring and weak social ties (internal consistency: α=0.86 and 0.77; test–retest reliability: r=0.73 and 0.70; acceptable construct validity)60
Loneliness Scale (internal consistency: α=072; satisfactory discriminant and concurrent and validity: r=0.82 compared with gold-standard test)61
Nutrition Evening meal preparation (acceptable face and content validity)67
Use of public places, shops and transport Use of neighbourhood places; transport mode and time to travel to work
Health and wellbeing outcomes
Mental well-being Warwick-Edinburgh Mental Well-being Scale (internal consistency: α=0.89; test–retest reliability: ICC=0.83; validity: r=0.42–0.77 with other scales of well-being)68
Mental health Non-specific psychological distress (Kessler-6) (internal consistency: α=0.89; validity: r=0.97 with Kessler-10)69
General health General health—single item, five-point response scale70 88 (independent predictor of mortality89; determined by most physical and mental health indicators)90
Respiratory health American Thoracic Society Questionnaire—respiratory symptoms (internal consistency: α=0.80 and 0.86)71
Subjective well-being Life satisfaction—single item, 10-point response scale (World Values Survey)72 (life satisfaction scales correlate with each other, objective well-being measures and life circumstances)91
*No source reference is provided for new items.
†Building plans include endorsed development plans and strata/subdivision plans.
‡Objective measures extracted from building plans.
§Perceived measures collected via resident survey.
¶Australian Bureau of Statistics data. All variables are quantitative. GIS data from 2018 and ABS data from 2016 will be used to generate neighbourhood context measures in GIS. ABS, Australian Bureau of Statistics; GIS, geographic information systems; ICC, intraclass correlation; POS, Public Open Space.
reliance, natural light, noise annoyance, inadequate privacy, poor outlook, lack of space, crowding, and apartment and building utility) were developed or adapted for the study (table 1). Factor analysis will be used to identify and construct scales from individual items to measure perceptions of the environmental exposures and stressors. Items that do not load on a factor will be examined individually.
Psychosocial and behavioural impact measures—Psychosocial and behavioural impacts will include: sleep quality,58 housing satisfaction,59 social interaction (multidimensional measure of neighbouring—acts of neighbouring and weak social ties),60 loneliness (the Loneliness Scale),61 fear of crime,62 63 cycling for transport and recreation,64 walking for transport and recreation,65 domain-specific sitting time,66 nutrition (meal patterns and cooking habits)67 and use of public places, shops and transport. Validated and reliable items have been included where possible (table 1).
Health and well-being outcome measures—Outcome measures will include self-reported mental well-being (Warwick-Edinburgh Mental Well-being Scale),68 mental health (non-specific psychological distress, Kessler-6),69 general health (self-assessed health status),70 respiratory health (American Thoracic Society Questionnaire)71 and life satisfaction (World Values Survey).72 Existing validated survey instruments will be administered (table 1).
Confounder measures—The survey will include items to measure potential individual-level confounding factors. Sociodemographic factors will include: sex, age, ethnicity, household composition, education, employment status, occupation, household income, car availability, disability status, financial stress and pet ownership. Potential housing-related confounders will include: tenure, length of residence, previous dwelling type, preferred dwelling, reasons for choosing current apartment/neighbourhood, hours spent at home and apartment renovations. Finally, health-related confounders will include: body mass index, smoking status, alcohol consumption and history of chronic disease.
Apartment and building design objective exposure measures
Using the endorsed development plans and strata/subdivision plans, research team members with architectural, urban design and planning expertise will extract objective measures of buildings and apartments. These policy-specific measures will be generated using a methodology previously developed to assess whether the implementation of neighbourhood design guidelines impacted on health and well-being.73 74 Where appropriate, data extraction will be supplemented with data from other sources and innovative tools (eg, daylight visualisation models, shade modelling and green floor view index).75
Measures will quantify the design features of each building that are contained in the ‘gold standard’ policy (ie, SEPP65), and (where guidance differs) the WA and VIC guidelines. The guideline documents will be audited for design requirements and standards that could be
objectively measured. Design guidance relating to the following features will be extracted: (1) natural ventilation; (2) thermal performance; (3) sunlight/daylight; (4) acoustic privacy; (5) visual privacy; (6) outlook; (7) internal space (ie, indoor apartment space and communal circulation spaces) and (8) outdoor space (ie, private outdoor space and communal outdoor spaces). The presence of these requirements will be assessed for each apartment/building from its plans and combined into summary exposure measures for each of the above design features and into an overall ‘policy compliance’ score. Table 2 provides examples of policy/guideline objectives, design requirements and their aligned objective apartment/building measures.
GIS neighbourhood context measures
Objective measures will be created to capture the neighbourhood environment surrounding the buildings using GIS. Measures will consist of ‘liveability’ indicators, including walkability, public transport, public open space, housing affordability, employment, food and alcohol environment,76 crime and safety, social infrastructure and traffic exposure, and features that impact the quality of space (eg, tree cover and shade). Where possible, we will replicate existing policy-specific spatial liveability measures.77 Some measures do not have a spatial policy standard, so in these instances, we will use the road network distance of 1600 m, as this has frequently been applied to represent the maximum distance a resident could walk in approximately 15 min,78 79 and/or a distance that is appropriate for the measure (eg, traffic exposure will be measured at both the area-level and for the street address) (table 1). The IRSD (2011) will be used to generate measures of area-level socioeconomic disadvantage.57
Sample size
The study has 85% power to detect a difference of 0.5 SD in mean mental well-being based on the Warwick-Edinburgh Mental Well-Being Scale68 80 at a 5% level of significance, with 11 buildings per group (ie, higher and lower IRSD areas) per city, and approximately 10 participants per building (ie, 22 buildings per city, 66 buildings in total, n=660 participants). As participants will be clustered in buildings, an inflation factor has been applied assuming an intraclass correlation of 0.05. Just five participants per building would still provide 80% power to detect an effect of 0.6 SD. The sample size is also adequate to assess the associations between apartment design and other study outcomes. Moreover, we will aim to include 33 buildings/city (including those in mid IRSD areas) to ensure buildings of different scales, with a variety of apartment and building features and varied access to services are included in the benchmarking of the health-promoting design requirements implemented for each jurisdiction (study objectives 1 and 2) (ie, 33 buildings per city, 99 buildings in total, n=990 participants).
Table 2 Examples of SEPP65 objectives and design requirements with the aligned objective apartment/building measures from the High Life Study
Design themeSEPP65 design guidance objective
Natural ventilation Objective 4B-1: All habitable rooms are naturally ventilated
Related SEPP65 design standards and/or guidance
The area of unobstructed window openings should be equal to at least 5% of the floor area served
Example of the High Life Study objective apartment-level or building-level measure
Area of the living room and bedroom windows extracted from elevation drawings. Floor area of the living room and bedrooms within the unit extracted from floor plates.
Building indicator=Number of apartments with habitable rooms meeting the standard/total number of apartments
Natural ventilation Objective 4B-3: The number of apartments with natural cross ventilation is maximised to create a comfortable indoor environment for residents
Sunlight/ daylight Objective 4A-1: Optimise the number of apartments receiving sunlight to habitable rooms, primary windows and private open space
Acoustic privacy Objective 4H-1: Noise transfer is minimised through the siting of buildings and building layout
Overall depth of a cross-over or cross-through apartment does not exceed 18 m, measured glass line to glass line
Single aspect, single storey apartments should have a northerly or easterly aspect
Primary living room or bedroom windows should not open directly onto common circulation spaces, whether open or enclosed
Internal spaceObjective 4D-1: The layout of rooms within an apartment is functional, well-organised and provides a high standard of amenity
Apartments are required to have the following minimum internal areas: Studio 35 m2; one-bedroom 50 m2; two-bedroom 70 m2 and threebedroom 90 m2 (internal areas include one-bathroom, additional bathrooms increase the minimum internal area by 5 m2)
Internal space Objective 4C-1: Ceiling height achieves sufficient natural ventilation and daylight access
Measured from finished floor level to finished ceiling level, minimum ceiling heights for habitable rooms are 2.7 m
Outdoor spaceObjective 4E-1: Apartments provide appropriately sized private open space and balconies to enhance residential amenity All apartments are required to have primary balconies as follows: Studios 4 m2 (no minimum depth); onebedroom 8 m2 (2 m minimum depth); two-bedroom 10 m2 (2 m minimum depth) and
Outdoor spaceObjective 3D-1: An adequate area of communal open space is provided to enhance residential amenity and to provide opportunities for landscaping
Communal open space has a minimum area equal to 25% of the site
Identify cross-through apartments from the floor plates (ie, does it run the entire width of the building?) and measure depth of cross-through apartment (window to window).
Apartment indicator=Is apartment depth<policy standard (Yes or No)
Building indicator=(Number of apartments meeting standard/total number of cross-through apartments)×100
Assess the orientation of all apartments by placing a compass rose on the floor plate and identifying the aspect from the perpendicular angle of the living-balcony area door.
Apartment indicator=If single aspect, does it have a northerly or easterly aspect? (Yes or No)
Building indicator=(Number of apartments with northerly or easterly aspect/total number of single aspect apartments)×100
Assess whether the windows in each habitable room (living room and bedrooms) open directly onto a common circulation core or space using floor plates.
Apartment indicator=(Number of habitable rooms not opening onto a circulation space/total number of habitable rooms)×100
Building indicator=(Number of apartments with no windows opening onto a circulation space/total number of apartments)×100
Measure total apartment areas and all habitable room sizes and dimensions from floor plans. Apartment indicator=Does the apartment achieve minimum area for its apartment type? (Yes or No)
Building indicator=(Number of apartments achieving space standard/total number of apartments)×100
Measure indicative ceiling heights (ie, finished floor heights on each floor) using the elevations. Ceiling heights will be estimated through a calculation to subtract 0.3 m for the assumed structures and ceiling bulkheads.
Apartment indicator=Do ceilings in habitable rooms meet the standard? (Yes or No)
Building indicator=(Number of apartments achieving ceiling standard/total number of apartments)×100
Identify of the presence of balconies and measure their area and dimensions (depth and width) from the floor plates.
Apartment indicator=Does the apartment achieve the minimum balcony area for its apartment type? (Yes or No)
Building indicator=(Number of apartments achieving standard/total number of apartments)×100
Measure the area and dimensions of outdoor communal open space (ie, total area of outdoor space; area of turfed or grassed areas and area of hardscaped areas) and the total site area from site plan.
Building indicator=(Area of communal open space/total area of site)×100 Continued
Table 2 Continued
Design themeSEPP65 design guidance objective
Building facilities Objective 3D-2: Communal open space is designed to allow for a range of activities, respond to site conditions and be attractive and inviting
Related SEPP65 design standards and/or guidance Example of the High Life Study objective apartment-level or building-level measure
Facilities are provided within communal open spaces and common spaces for a range of age groups (eg, seating for individuals or groups, barbecue areas, play equipment or play areas, swimming pools, gyms, tennis courts or common rooms)
Identification of the number and different types of communal spaces and facilities provided within the building/complex from floor plates and marketing material.
Building indicator=(Number of different spaces or facilities/total number of spaces or facilities identified in the sample of buildings)×100
The second line of enquiry will examine whether apartment and building design and location impacts on residents’ health and well-being (research objectives 4–6). First, regression models will test whether higher policy compliance scores are associated with better health and well-being impacts and outcomes; and identify which design themes, apartment ‘typologies’ and individual requirements could optimise health and well-being. Models will control for established individual-level and neighbourhood confounders. Second, specific design themes will be examined for associations with their aligned impacts and outcomes (eg, acoustic privacy with sleep quality and mental well-being). Third, multilevel models will examine the relative influence of the three exposure levels (ie, dwelling, building and neighbourhood), with a focus on isolating the impact of the neighbourhood impacts. Finally, mediation analysis will identify explanatory pathways between apartment, building and
Cluster analyses will identify distinct apartment ‘typologies’ (ie, apartments that are homogeneous in the mix of design features implemented) that are more likely to comply with SEPP65 design guidance.
The first line of enquiry will focus on apartment design guidelines and the objectively derived apartment and building measures. This will determine whether more comprehensive apartment guidance impacts on apartment design; benchmark developments against their state-specific guidelines to assess if (and how far) current development is from the policy aspirations; and assess whether there is any disparity between the design features implemented in higher and lower IRSD areas (research objectives 1–3). Descriptive statistics and analyses (eg, analysis of variance and χ 2 ) will compare SEPP65 compliance in Sydney, Perth and Melbourne (and Perth and Melbourne against their own state-specific policies); and test whether there are differences between cities in the uptake of specific health-promoting design themes (eg, natural ventilation, daylight, space, etc). Pooled and separate city analyses will test whether there are differences in compliance by IRSD, and identify which features, if any, are less likely to be delivered in disadvantaged areas.
d ata analysis
Patient and public involvement Apartment residents, and government and industry stakeholders provided input into the study design and formulation of research questions and outcome measures. Apartment residents, building resident associations, government stakeholders, architects and developers will be involved in the recruitment of buildings and interpretation of findings; however, survey participants themselves will not be involved in the ongoing conduct of the study. Results will be disseminated to participants and building, government and industry stakeholders via an e-newsletter; however, this will only be sent to survey participants who provide consent for the study team to keep their email address on file.
SEPP65, State Environmental Planning Policy 65.
Open access
neighbourhood exposures and the health and well-being impacts and outcomes.
Ethics and dissemination
All invited residents will receive a Participant Information Statement (PIS) providing details of the study, what type of information is being collected and what is required of participants. The PIS confirms that participation is voluntary, all responses are confidential and only de-identified aggregated data will be reported. Residents choosing the written survey will signify active consent by completing and returning the survey. Residents completing the online survey will be required to click on the ‘Yes, I wish to participate’ option before proceeding to the survey. Important details from the PIS will be reproduced on the inside cover of the written survey and the entry page to the online survey.
A data management plan will be created in adherence with the RMIT University Research Data Management Policy Process. Potentially identifying information (eg, participant postal and email addresses) will be removed from the survey responses and stored separately. All primary data files (survey, apartment building data and neighbourhood measures) and processed data files used for analysis will be stored on a secure password-protected RMIT University server and backed up according to the University’s requirements for research data retention for at least 7 years after project completion.
Findings will be disseminated via a final High Life Study report and summary infographics and policy briefs will be created and distributed to government, policy and advocacy networks nationally. Results will also be disseminated through seminars and other engagement strategies with stakeholders and via university and project partners’ electronic communications and websites. Academic outputs will include manuscripts in international peer-reviewed journals and conference presentations. To facilitate data sharing and multidisciplinary collaborations with other academic and government institutions, protocols will be established to allow researchers access to the de-identified data, subject to approval. Metadata will be lodged with Research Data Australia.
Knowledge translation
The research team will collaborate with state government planning departments, government architects and industry partners to develop and implement the following knowledge translation activities to monitor and help to shape apartment design policy. Examples from WA are provided.
1. Develop a subset of policy-specific indicators to assess design policy implementation. These indicators will focus on the policy requirements that have the strongest associations with health and/or are important for multiple health and well-being outcomes. The study buildings will be ‘benchmarked’ against the WA guidelines10 to provide a baseline assessment of how current development performs against the new policy aspirations
(ie, which requirements are being implemented and which are not). This benchmarking process can be repeated in subsequent years to evaluate the uptake of the health-promoting policy requirements.
2. Embed policy-specific indicators into routine monitoring and evaluation practices. As part of an established collaboration with Department of Planning Lands and Heritage, the research team and policymakers will co-create a framework for the ongoing monitoring and evaluation of the implementation and impact of the WA apartment design policy. Discussions will explore the most efficient process to embed the policy indicators into a monitoring and evaluation process (eg, assessment by local or state government planners, assessment during design review panels, or developer self-assessment).
3. Strengthen health-promoting design features in future apartment design policies. The research findings will be provided to all state planning departments and government architects to help to refine, strengthen and/or mandate specific health-promoting design requirements in future iterations of the apartment design policies. The research team will work with these agencies to ensure that the project evidence is readily available when a policy review (inevitably) occurs, in a form that facilitates its comprehension and uptake by decision makers (eg, policy briefings or infographics).
More general knowledge translation strategies will be employed throughout the project to ensure that the research is co-designed with, and the findings reach, a range of project stakeholders—town planners, state and local government agencies, architects, developers, designers, and health and community agencies. Government and industry representatives have provided input on the methodology for collecting building measures and will assist in interpreting, framing and disseminating the findings to specific industry groups.
dISCuSSIon
The High Life Study is a unique example of policy-relevant research. The study objectives and methods have been developed to generate policy-specific measures and evidence, primarily by using development applications (ie, building floor plates and elevations) and strata plans to generate objective measures of design policy requirements and compliance, and assess their impact on health and well-being. That is, the measurement and analysis of apartment design will be based on the planning policies and standards that underpin the provision of the buildings in the three cities. Further, the quality and amenity of the surrounding neighbourhood is a key influence on the health of local populations.8 The High Life Study will also generate a comprehensive suite of objective neighbourhood measures in GIS. Analyses will both control for these neighbourhood factors and test for their independent associations with residents’ health and well-being. Finally, data collection will occur across three cities where apartment development has occurred
under different policy regimes, and buildings have been randomly selected from a range of socioeconomic strata and within different distances of the city centre, to ensure variability in the independent (building-level and neighbourhood-level) variables.
The High Life Study has a strong focus on translating evidence into policy and practice, with an overarching ambition to help to create evidence-based policy.81 Australian cities are experiencing a marked increase in apartment construction,3 and there is an appetite for more comprehensive, even aspirational, design guidance. The current political interest is key to policy formation; however, once enacted, policies need to be evaluated, so subsequent policy reviews—when they inevitably happen—can improve the policy (or at the very least prevent policy attrition).81 82 To maximise its potential to influence policy, the High Life Study has: (1) consulted with, and garnered support from, state government departments and professional industry bodies involved in the design, planning, approval and development of apartment buildings; (2) allocated project time and resources to collaborative activities with the government agencies responsible for drafting and implementing design policy and (3) embedded research translation strategies, including distributing and publicising the findings to policymakers, practitioners, the wider community and academics.
Housing is an important social determinant of health and well-being throughout the world. Although based in Australia, this research is timely to contribute to the goals identified in the United Nation’s 2030 Agenda for Sustainable Development.83 The research aims to generate evidence on how apartment building design and location can promote health and well-being, including reducing risk factors for non-communicable disease throughout the lifespan (Sustainable Development Goal (SDG) 3). It will also provide evidence, through the investigation of neighbourhood-level influences, on several of the important challenges identified for rapidly growing cities of the future, including the provision of adequate and safe housing with access to services, and public and green space (SDG 11). Finally, the research will identify inequalities in health-promoting apartment design features across socioeconomic areas with the purpose of informing healthier apartment design policy to provide more equitable housing for the future (SDG 10). By aligning research objectives with both global agendas and local policy and planning processes, the High Life Study has the potential to create healthy, equitable higher-density communities in Australia and contribute to the broader international sustainable development agenda.
The High Life Study has several limitations. First, the study focuses on a relatively small number of apartment buildings (n=99) built between 2006 and 2016, which may limit the generalisability of the findings. This was necessary as the process for accessing the building plans and extracting objective apartment-level and building-level measures is time and resource intensive. However, our
methodology selects buildings from areas of low, mid and high disadvantage, within different distances of the city centre—maximising variability in the buildings and neighbourhood environment. Second, generalisability may be impacted by the anticipated response rate. A pilot of the study methodology generated a response rate of 14% (Perth) and 15% (Melbourne)—rates which are not uncommon for a non-personalised community postal survey in Australia.84 However, the study is adequately powered to address the study objectives, and the sampling of buildings from different socioeconomic areas will help to ensure that a broad cross-section of apartment residents are included. Third, the study is cross-sectional which limits attribution of causality, although the survey instrument has been designed to be repeatable and participants will be asked to confirm their interest in participating in a subsequent longitudinal study contingent on funding. Finally, there are limitations relating to the reliance on building plans to extract the apartment and building measures, as building designs can change between what was approved for development and what was built. Steps will be taken to ensure that the plans replicate the completed building, including: (1) checking building plans against the strata plans (note: strata plans are prepared by a registered surveyor after the building is complete); (2) site visits and (3) the use of online real-estate sites to validate apartment layouts and numbering. Despite these limitations, the use of building plans to extract design measures specific to each participant’s apartment and building remains a unique aspect and strength of the study.
The recent rise of residential apartment buildings in Australian cities has ignited concerns about the impact of poorly designed and located apartment buildings on residents’ health and well-being.85 Once built, apartment buildings are difficult and expensive to retrofit or rebuild, so poor design is likely to have a negative impact on both present residents and future generations. As highlighted by the Commission for Architecture and Built Environment (UK), ‘badly designed places impose costs on their occupiers, their neighbours and on society’.86 While apartment design policies and guidance currently exist to direct apartment developments, their content varies across jurisdictions. Furthermore, evidence on the impact and outcomes of policy-specific design features on health and well-being is lacking. Within this context, the High Life Study aims to generate evidence to guide current policy implementation and future policy decisions on the design and location of residential apartment buildings, to ultimately improve the health and well-being of apartment residents.
Acknowledgements Study collaborators providing in-kind support include the Department of Planning Lands and Heritage (WA), the Office of the Government Architect (WA), the Government Architect NSW (GANSW), the Planning Institute of Australia (PIA), Landcorp and Heart Foundation. The assistance of apartment residents, resident associations, architects, developers and local government in the study is gratefully acknowledged.
Open access
Contributors SF conceived and designed the study. PH, CM, JB, AD-S, BG-C and JA had input to the study design. SF and CM drafted the manuscript. All the authors contributed to the manuscript drafts and read and approved the final manuscript.
Funding SF is supported by an Australian Research Council (ARC) Discovery Early Career Researcher Award (DECRA) (DE160100140) and RMIT Vice-Chancellor’s Research Fellowship, PH by a Healthway Research Fellowship (#32992) and the Australian Urban Design Research Centre, and BG-C by a National Health and Medical Research Council Senior Principal Research Fellowship (#1107672). The High Life Study is funded by an ARC, DECRA, DE160100140, and a UWA Fellowship Support Scheme grant, RA/1/1997/43; Perth and Sydney arms of the High Life Study are supported by funding from the Western Australian (WA) Health Promotion Foundation (Healthway; #31986).
Competing interests None declared.
Patient consent for publication Not required.
Ethics approval The study protocol has been approved by the RMIT University Design and Social Context College Human Ethics Advisory Network (Subcommittee of the RMIT Human Research Ethics Committee) (CHEAN B 21146-10/17) and the University of Western Australia Human Ethics Research Committee (RA/4/1/8735).
Provenance and peer review Not commissioned; externally peer reviewed. open access This is an open access article distributed in accordance with the Creative Commons Attribution Non Commercial (CC BY-NC 4.0) license, which permits others to distribute, remix, adapt, build upon this work non-commercially, and license their derivative works on different terms, provided the original work is properly cited, appropriate credit is given, any changes made indicated, and the use is non-commercial. See: http://creativecommons.org/licenses/by-nc/4.0/.
rEFErEnCES
1. Giles-Corti B, Vernez-Moudon A, Reis R, et al. City planning and population health: a global challenge. The Lancet 2016;388:2912–24.
2. United Nations. New Urban Agenda, in HABITAT III. United Nations: Quito, Ecuador, 2017.
3. Shoory M. The growth of apartment construction in Australia, in Bulletin. Reserve Bank of Australia, 2016: 19–26.
4. Randolph B. Delivering the compact City in Australia: current trends and future implications. Urban Policy and Research 2006;24:473–90.
5. State Government of Victoria. Better Apartments: A discussion paper. Melbourne: Department of Environment, Land, Water & Planning., 2015.
6. Nethercote M, Horne R. Ordinary vertical urbanisms: City apartments and the everyday geographies of high-rise families. Environ Plan A 2016;48:1581–98.
7. City of Melbourne. Understanding the quality of housing design. City of Melbourne: Melbourne, 2013.
8. Giles-Corti B, Ryan K, Foster S. Increasing density in Australia: Maximising the health benefits and minimising harm. National Heart Foundation of Australia: Melbourne, 2012.
9. The State of Victoria Department of Environment Land Water & Planning. Better Apartments Design Standards - New Apartment Design Standards for Victoria, Environment Land Water and Planning and Office of the Victorian Government Architect, Editors. State of Victoria: Melbourne, 2016.
10. Western Australian Planning Commission. State Planning Policy 7.3 Residential Design Codes Volume 2 - Apartments, Department of Planning Lands and Heritage, Editor. Perth: Western Australian Planning Commission, 2019.
11. Wargocki P, Sundell J, Bischof W, et al. Ventilation and health in non-industrial indoor environments: report from a European multidisciplinary scientific consensus meeting (EUROVEN). Indoor Air 2002;12:113–28.
12. Ruotsalainen R, Jaakkola1 JJK, Ronnberg R, et al. Symptoms and perceived indoor air quality among occupants of houses and Apartments with different ventilation systems. Indoor Air 1991;1:428–38.
13. Wong NH, Huang B. Comparative study of the indoor air quality of naturally ventilated and air-conditioned bedrooms of residential buildings in Singapore. Build Environ 2004;39:1115–23.
14. Clinch JP, Healy JD. Housing standards and excess winter mortality. J Epidemiol Community Health 2000;54:719–20.
15. Lloyd EL, McCormack C, McKeever M, et al. The effect of improving the thermal quality of cold housing on blood pressure and general health: a research note. J Epidemiol Community Health 2008;62:793–7.
16. Wilson J, Dixon SL, Jacobs DE, et al. Watts-to-Wellbeing: does residential energy conservation improve health? Energy Effic 2014;7:151–60.
17. Howden-Chapman P, Matheson A, Crane J, et al. Effect of insulating existing houses on health inequality: cluster randomised study in the community. BMJ 2007;334.
18. Brown MJ, Jacobs DE. Residential light and risk for depression and falls: results from the LARES study of eight European cities. Public Health Rep 2011;126 Suppl 1(1_suppl):131–40.
19. Lai P-C, Low C-T, Tse W-SC, et al. Risk of tuberculosis in high-rise and high density dwellings: an exploratory spatial analysis. Environ Pollut 2013;183:40–5.
20. Vandentorren S, Bretin P, Zeghnoun A, et al. August 2003 heat wave in France: risk factors for death of elderly people living at home. Eur J Public Health 2006;16:583–91.
21. Babisch W, Wölke G, Heinrich J, et al. Road traffic noise and hypertension--accounting for the location of rooms. Environ Res 2014;133:380–7.
22. Bluhm G, Nordling E, Berglind N. Road traffic noise and annoyance-an increasing environmental health problem. Noise Health 2004;6:43–9.
23. Jakovljevic B, Paunovic K, Belojevic G. Road-Traffic noise and factors influencing noise annoyance in an urban population. Environ Int 2009;35:552–6.
24. Maschke C, Niemann H. Health effects of annoyance induced by neighbour noise. Noise Control Eng J 2007;55:348–56.
25. Guite HF, Clark C, Ackrill G. The impact of the physical and urban environment on mental well-being. Public Health 2006;120:1117–26.
26. Kaplan R. The nature of the view from home: psychological benefits. Environment and Behaviour 2001;33:507–42.
27. Tennessen CM, Cimprich B. Views to nature: effects on attention. J Environ Psychol 1995;15:77–85.
28. Wells NM. At Home with Nature: Effects of “Greenness” on Children’s Cognitive Functioning. Environment and Behavior 2000;32:775–95.
29. Oswald F, Jopp D, Rott C, et al. Is aging in place a resource for or risk to life satisfaction? Gerontologist 2011;51:238–50.
30. Baum A, Davis GE. Reducing the stress of high-density living: an architectural intervention. J Pers Soc Psychol 1980;38:471–81.
31. Evans GW, Lepore SJ, Schroeder A. The role of interior design elements in human responses to crowding. J Pers Soc Psychol 1996;70:41–6.
32. Evans GW. The built environment and mental health. J Urban Health 2003;80:536–55.
33. Kim D, Ohara K. A study on the role of gardening and planning of green environments for daily use by residents in senior housing. Journal of Asian Architecture and Building Engineering 2010;9:55–61.
34. Kimura M, Nishiwaki M, Miyata M. Attitudes among residents towards the creation of a community by horticultural activity on the roof top of a housing complex in Tokyo Acta Hortic 2008;790:205–11.
35. Giles-Corti B, Foster S, Shilton T, et al. The co-benefits for health of investing in active transportation. N S W Public Health Bull 2010;21:122–7.
36. Leyden KM. Social capital and the built environment: the importance of walkable neighborhoods. Am J Public Health 2003;93:1546–51.
37. Rogers SH, Halstead JM, Gardner KH, et al. Examining Walkability and social capital as indicators of quality of life at the municipal and neighborhood scales. Appl Res Qual Life 2011;6:201–13.
38. Foster S, Wood L, Christian H, et al. Planning safer suburbs: do changes in the built environment influence residents' perceptions of crime risk? Soc Sci Med 2013;97:87–94.
39. Popova S, Giesbrecht N, Bekmuradov D, et al. Hours and days of sale and density of alcohol outlets: impacts on alcohol consumption and damage: a systematic review. Alcohol Alcohol 2009;44:500–16.
40. Foster S, Trapp G, Hooper P, et al. Liquor landscapes: does access to alcohol outlets influence alcohol consumption in young adults? Health Place 2017;45:17–23.
41. Pereira G, Wood L, Foster S, et al. Access to alcohol outlets, alcohol consumption and mental health. PLoS One 2013;8:e53461.
42. Mould P. A review of the first 9 years of the NSW state environmental planning policy No. 65 (SEPP 65). Architecture Australia 2011;100.
43. Braubach M, Fairburn J. Social inequities in environmental risks associated with housing and residential location--a review of evidence. Eur J Public Health 2010;20:36–42.
44. Marmot M, Wilkinson RG, ed. Social determinants of Health. Oxford: Oxford University Press, 2006.
45. Foster S, Hooper P, Knuiman M, et al. Does alcohol outlet density differ by area-level disadvantage in metropolitan Perth? Drug Alcohol Rev 2017;36:701–8.
46. Howden-Chapman Pet al. Smith SJ, ed. Health, well-being and housing, in international encyclopedia of housing and home. San Diego: Elsevier, 2012: 344–54.
47. Hodyl L. To investgate planning policies that deliver positive social outcomes in hyper-dense, high rise environments. The Winston Churchill Memorial Trust of Australia: Melbourne, Australia, 2015.
48. Western Australian Planning Commission. State Planning Policy, 3.1, Residential Design Codes, Department of Planning Lands and Heritage, Editor. Perth: Western Australian Planning Commission, 2018.
49. Government of South Australia. Design guidelines: design quality and housing choice (draft for consultation), O.f.D.a. Architecture, Editor Government of South Australia: Adelaide, 2017.
50. Western Australian Planning Commission. State Planning Policy, 7.0 Design of the Built Environment (SPP 7.0), Department of Planning Lands and Heritage, Editor. Perth: Western Australian Planning Commission, 2019.
51. Durand CP, Andalib M, Dunton GF, et al. A systematic review of built environment factors related to physical activity and obesity risk: implications for smart growth urban planning. Obes Rev 2011;12:e173–82.
52. OECD. Compact City Policies, 2012.
53. De Bourdeaudhuij I, Van Dyck D, Salvo D, et al International study of perceived neighbourhood environmental attributes and Body Mass Index: IPEN Adult study in 12 countries Int J Behav Nutr Phys Act 2015;12.
54. Halpern D. More than Bricks and Mortar? mental health and the built environment. London: Taylor & Francis Ltd, 1995.
55. PSMA Australia Limited. G-NAF: the Geocoded National Address File. Canberra, ACT: Callpoint Spatial Pty Ltd, 2005.
56. PSMA Australia Limited. Open Geocoded National Address File Canberra, ACT, 2017.
57. Australian Bureau of Statistics. 2033.0.55.001 - Census of Population and Housing: Socio-Economic Indexes for Areas (SEIFA), Australian Bureau of Statistics, Editor. Commonwealth of Australia: Canberra, Australia, 2011.
58. Rayward AT, Burton NW, Brown WJ, et al Associations between changes in activity and sleep quality and duration over two years Med Sci Sports Exerc 2018;50:2425–32.
59. Diaz-Serrano L. Disentangling the housing satisfaction puzzle: does homeownership really matter? J Econ Psychol 2009;30:745–55.
60. Skjaeveland O, Gärling T, Maeland JG. A multidimensional measure of neighboring. Am J Community Psychol 1996;24:413–35.
61. Hughes ME, Waite LJ, Hawkley LC, et al. A short scale for measuring loneliness in large surveys: results from two population-based studies. Res Aging 2004;26:655–72.
62. Foster S, Knuiman M, Hooper P, et al. Do changes in residents' fear of crime impact their walking? longitudinal results from reside. Prev Med 2014;62:161–6.
63. Ferraro KF. Fear of Crime: Interpreting Victimization Risk. New York: State University of New York Press, 1995.
64. Heesch KC, Giles-Corti B, Turrell G. Cycling for transport and recreation: associations with the socio-economic, natural and built environment. Health Place 2015;36:152–61.
65. Ghani F, Rachele JN, Washington S, et al. Gender and age differences in walking for transport and recreation: are the relationships the same in all neighborhoods? Prev Med Rep 2016;4:75–80.
66. Marshall AL, Miller YD, Burton NW, et al. Measuring total and domain-specific sitting: a study of reliability and validity. Med Sci Sports Exerc 2010;42:1094–102.
67. Pettinger C, Holdsworth M, Gerber M. Meal patterns and cooking practices in southern France and central England. Public Health Nutr 2006;9:1020–6.
68. Taggart F, Stewart-Brown S, Parkinson J. Warwick-Edinburgh Mental Well-being Scale (WEMWBS) - User Guide, Version 2, 2015. Available: http://www.healthscotland.com/uploads/documents/ 26787-WEMWBS%20User%20Guide%20Version%202%20May% 202015.pdf [Accessed 2 Feb 2017].
69. Kessler RC, Andrews G, Colpe LJ, et al. Short screening scales to monitor population prevalences and trends in non-specific psychological distress. Psychol Med 2002;32:959–76.
70. Australian Bureau of Statistics, 4363.0.55.001 - Australian Health Survey: Users' Guide, 2011-13.2013
71. Cassidy RN, Roberts ME, Colby SM. Validation of a respiratory symptom questionnaire in adolescent smokers. Tob Regul Sci 2015;1:121–8.
72. Inglehart RCet al World Values Survey: Round Six - Country-Pooled Datafile Version 6. Madrid: JD Systems Institute, 2014.
73. Hooper P, Giles-Corti B, Knuiman M. Evaluating the implementation and active living impacts of a state government planning policy designed to create walkable neighborhoods in Perth, Western Australia. Am J Health Promot 2014;28(3 Suppl):S5–S18.
74. Hooper P, Knuiman M, Bull F, et al. Are we developing walkable suburbs through urban planning policy? Identifying the mix of design requirements to optimise walking outcomes from the ‘Liveable Neighbourhoods’ planning policy in Perth, Western Australia. Int J Behav Nutr Phys Act 2015;12.
75. Yu Set al View-based greenery: A three-dimensional assessment of city buildings’ green visibility using Floor Green View Index. , 2016: 152, 13–26.
76. Badland H, Whitzman C, Lowe M, et al. Urban liveability: emerging lessons from Australia for exploring the potential for indicators to measure the social determinants of health. Soc Sci Med 2014;111:64–73.
77. Arundel Jet al Creating liveable cities in Australia: Mapping urban policy implementation and evidence-based national liveability indicators. Melbourne, Australia: Centre for Urban Research, RMIT University, 2017.
78. Giles-Corti B, Bull F, Knuiman M, et al. The influence of urban design on neighbourhood walking following residential relocation: longitudinal results from the reside study. Soc Sci Med 2013;77:20–30.
79. Foster S, Knuiman M, Villanueva K, et al. Does walkable neighbourhood design influence the association between objective crime and walking? International Journal of Behavioral Nutrition and Physical Activity 2014;11.
80. Wood L, Hooper P, Foster S, et al. Public green spaces and positive mental health – investigating the relationship between access, quantity and types of parks and mental wellbeing. Health Place 2017;48:63–71.
81. Giles-Corti B, Sallis JF, Sugiyama T, et al. Translating active living research into policy and practice: one important pathway to chronic disease prevention. J Public Health Policy 2015;36): :231–43.
82. Kingdon J, Thurber J. Agendas, alternatives, and public policies. 2nd ed. New York, NY: Longman, 1995.
83. United Nations. The Sustainable Development Goals Report 2018 New York: United Nations, 2018.
84. Sinclair M, O'Toole J, Malawaraarachchi M, et al. Comparison of response rates and cost-effectiveness for a community-based survey: postal, Internet and telephone modes with generic or personalised recruitment approaches. BMC Med Res Methodol 2012;12:132.
86. Commission for Architecture and the Built Environment. The cost of bad design. London: CABE, 2006.
87. Badland H, Mavoa S, Boulangé C, et al. Identifying, creating, and testing urban planning measures for transport walking: findings from the Australian National liveability study. J Transp Health 2017;5:151–62.
88. Ware J, Kosinski M, Keller SD. A 12-Item short-form health survey: construction of scales and preliminary tests of reliability and validity. Med Care 1996;34:220–33.
89. Idler EL, Benyamini Y. Self-Rated health and mortality: a review of twenty-seven community studies. J Health Soc Behav 1997;38:21–37.
90. Singh-Manoux A, Martikainen P, Ferrie J, et al. What does self rated health measure? results from the British Whitehall II and French Gazel cohort studies. J Epidemiol Community Health 2006;60:364–72.
91. Diener E, Inglehart R, Tay L. Theory and validity of life satisfaction scales Soc Indic Res 2013;112:497–527.