
ISSN: (Print) (Online) Journal homepage: https://www.tandfonline.com/loi/cppr20

ISSN: (Print) (Online) Journal homepage: https://www.tandfonline.com/loi/cppr20
Julian Bolleter, Bill Grace, Sarah Foster, Anthony Duckworth & Paula Hooper
To cite this article: Julian Bolleter, Bill Grace, Sarah Foster, Anthony Duckworth & Paula Hooper (2021): Projected Extreme Heat Stress in Northern Australia and the Implications for Development Policy, Planning Practice & Research, DOI: 10.1080/02697459.2021.2001733
To link to this article: https://doi.org/10.1080/02697459.2021.2001733

Published online: 01 Dec 2021.

Submit your article to this journal


View related articles
View Crossmark data
Full Terms & Conditions of access and use can be found at https://www.tandfonline.com/action/journalInformation?journalCode=cppr20

PLANNING PRACTICE & RESEARCH

Julian Bolleter a , Bill Grace a , Sarah Fosterb, Anthony Duckwortha and Paula Hooper a
aAustralian Urban Design Research Centre, University of Western Australia, Perth, Australia; bSustainability and Urban Planning, RMIT, Melbourne, Australia
ABSTRACT
Heat stress, resulting from elevated heat and absolute humidity associated with climate change, will increasingly occur in the tropics and parts of the mid-latitudes and could threaten the liveability and viability of many regions. Concomitant with predictions of increased heat stress in northern Australia, the Australian Government seeks to boost the population in northern Australia substantially. This paper assesses the heat stress-related wet-bulb temperatures the largest northern centres could experience under Representative Concentration Pathways 4.5 and 8.5 by 2080. The paper finds that substantial population growth could place significant future urban populations at risk from heat stress-related health issues.
Introduction
KEYWORDS
Population growth; climate change; heat stress; wet bulb temperature; wet bulb globe temperature; Northern Australia
While there has been a general presumption that humans will be capable of adapting to climate change, recent research has begun to identify regional hotspots where climate change, in the absence of substantial mitigation, will have serious consequences for human health and wellbeing in the future due to chronic heat stress (Pal & Eltahir, 2016). Indeed, chronic heat stress could potentially call the viability of some regions into question, particularly in the tropics and parts of the mid-latitudes (Coffel et al., 2017). Such regions include the Middle East (Pal & Eltahir, 2016; Bolleter et al., 2021), northern South America, Central and Eastern Africa, and South-East Asia. These regions are some of the world’s most densely populated (Coffel et al., 2017). This threat is dramatically and powerfully rendered in an Indian city by the speculative projections of Kim Stanley Robinson in the opening chapter of his latest work (Robinson, 2020). Urban areas are also known to exacerbate the impacts of extreme heat events through the Urban Heat Island (UHI) phenomenon (Gardes et al., 2020). The further concentration of population in urban areas, which may also be subject to climate change-related heat stress due to their morphology, poses significant challenges from an adaptation planning perspective (Füssel, 2007; Anderson et al., 2018). Contemporary policies encouraging or promoting settlement patterns of future populations could be seen as a macro approach to
CONTACT Julian Bolleter Julian.bolleter@uwa.edu.au
https://doi.org/10.1080/02697459.2021.2001733 © 2021 Informa UK Limited, trading as Taylor & Francis Group
adaptation planning since these are deliberate and purposeful decisions being undertaken within a context of an awareness of ‘actual or expected climate and its effects’ (Field et al., 2014).
Northern Australia (Figure 1) is likely to be affected by chronic heat stress. Present climate projections for northern Australia under Representative Concentration Pathway (RCP) 8.51 – based on no substantial efforts to constrain emissions – show that from 2020 to 2090, northern Australia will get progressively hotter, with a possible 4–5°C summer temperature increase (Figure 2) (Australian Government, 2017).
Due to a coincidence of elevated temperatures and absolute humidity (Coffel et al., 2017), northern Australia will also experience elevated wet-bulb temperatures (WBTs) –a measure that combines the effects of temperature and humidity (Pal & Eltahir, 2016). The Northern Territory currently experiences WBTs approaching 30°C in the wet season, which already poses liveability and economic issues (Hyndman, 2015). Furthermore, under RCP 8.5, northern Australia is likely to be increasingly hot with similar relative (meaning higher absolute) humidity (Australian Government, 2017), a situation that will generally compound WBTs and associated heat stress risks. At the same time, the Australian Federal Government is seeking to boost the population of northern Australia substantially. This planning could see the population increase fourfold by 2060, according to projections cited in the recent White Paper for Developing Northern Australia.
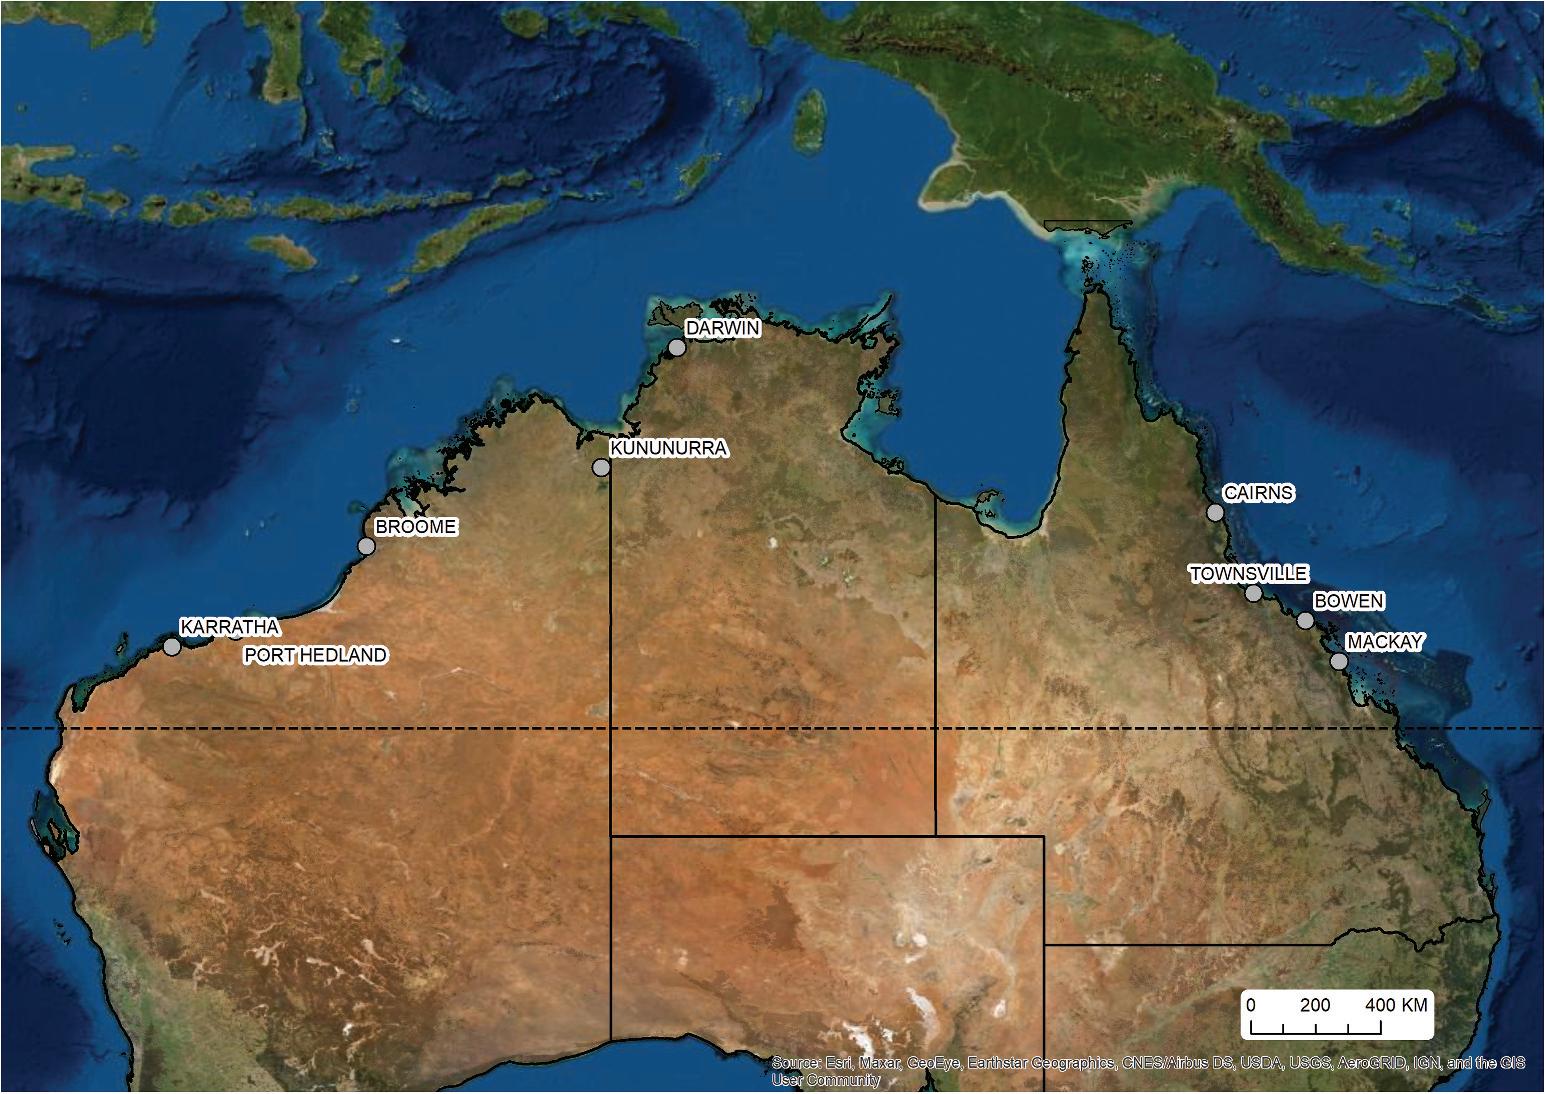
1. Northern Australia, the case study area of this paper. Northern Australia is defined as the area of the Australian continent north of the 26S latitude. Map by the authors with data from Esri, Maxar, GeoEye, Earthstar Geographics, CNES/ Airbus DS, USDA, AeroGRID, IGN and the GIS User Community.
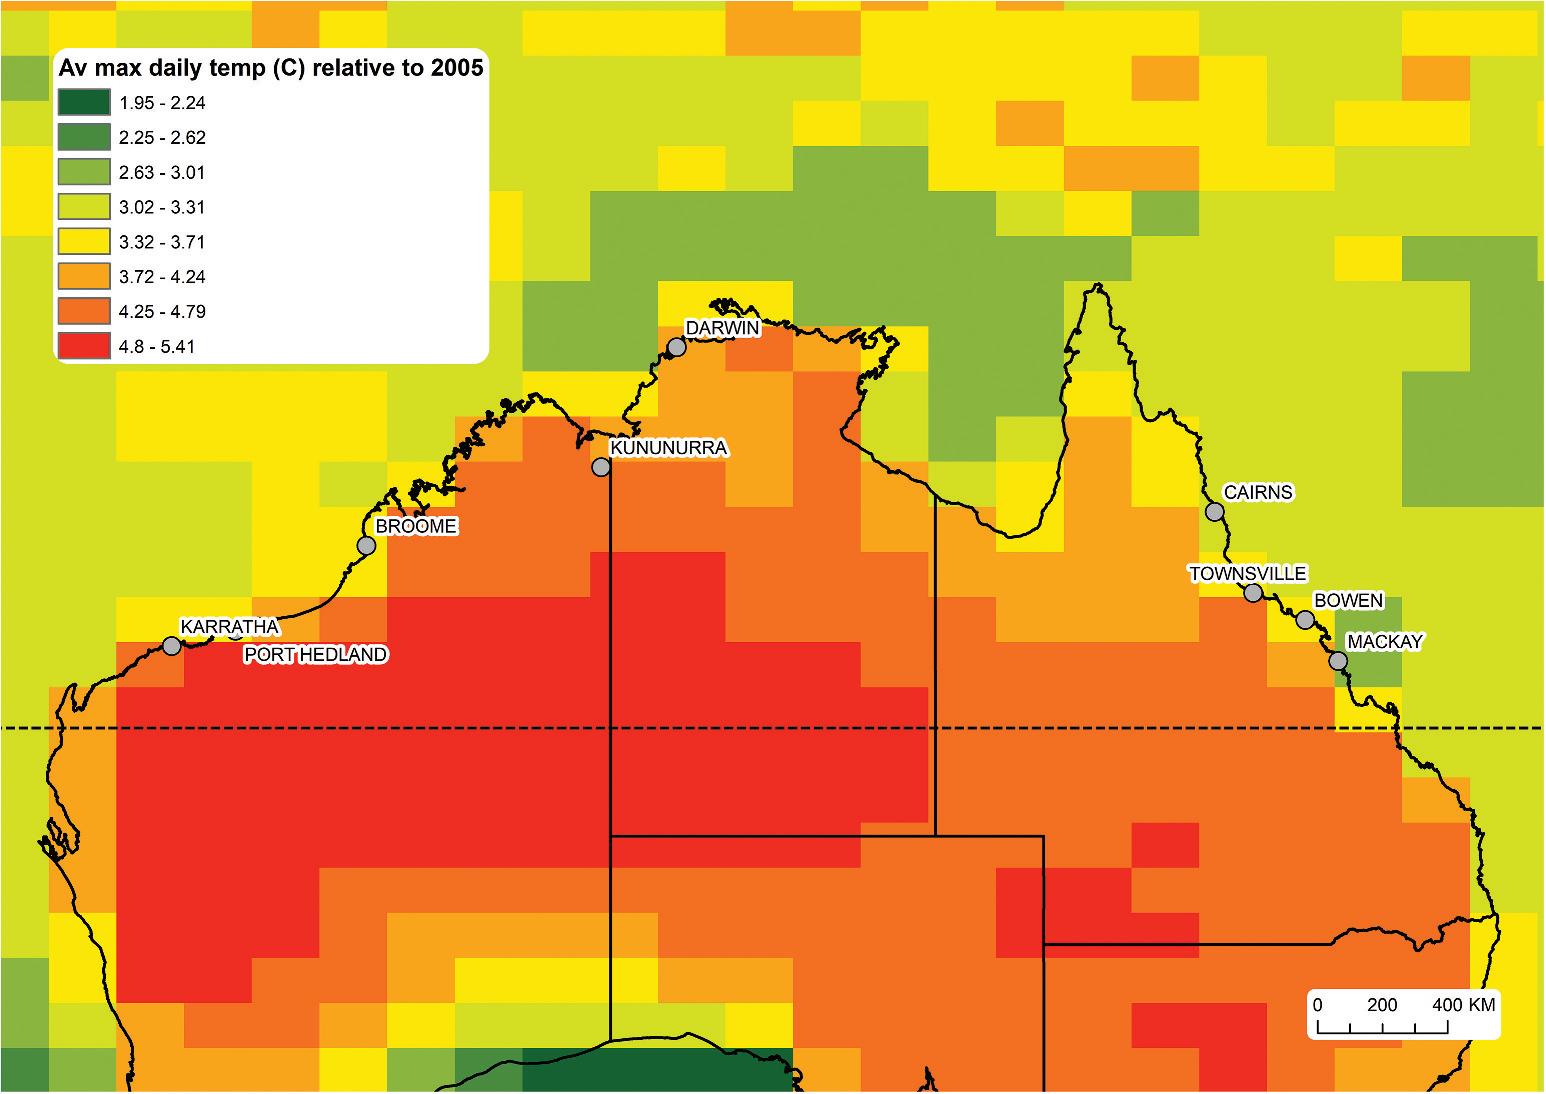
2. Average maximum temperatures (°C) for December to February 2090 (under RCP 8.5 and ACCESS1.0) relative to 2005. Map by the authors based on data from Climate Change Australia.
Given a potential confluence of extreme population growth with concerning shifts in northern Australia’s climate, the research question guiding this paper is, ‘are the current adaptation policies and planning for growth in northern Australia consistent with the projected chronic nature of climate change-induced heat stress?’ This paper addresses the lack of related analysis in the White Paper and is important because the confluence of population growth and increasing WBTs could incur substantial societal or economic costs.
The paper’s international contribution is to explain how regional-scale population planning can be considered in relation to WBT projections. This contribution is important because while WBT vulnerabilities have attracted substantial scholarship (Sherwood & Huber, 2010; Pal & Eltahir, 2016; Coffel et al., 2017), broad-scale planning responses remain nascent in most of the regions affected (Bolleter et al., 2021). This comparative absence is partly because many regions lack effective urban and regional planning frameworks for managing regional-scale population distribution.
The paper commences with a literature review on projected global vulnerabilities to WBT extremes, a review of different heat stress measurements, and planning for population growth in northern Australia. Next, the methods section develops a conceptual framework and outlines the research questions and methods. In the results section, we model the degree to which planning for population growth in northern Australia could, if realised, expose future populations to WBT extremes under different climate change scenarios. We also consider the degree to which current climate change adaptation policy
deals with the likely chronic nature of heat stress. Finally, the discussion section raises concerns around development plans for northern Australia, tables recommendations and ultimately concludes that planning for population growth should respond to future climate projections nationally and regionally.
Extreme dry-bulb temperature (DBT) increases the risk of heat illness and can exacerbate pre-existing diseases such as heart and kidney conditions (Bi et al., 2011). The twentyfirst century has already seen a swathe of extreme heat events (Coffel et al., 2017). For vulnerable groups such as children, older adults, obese people, those with blood pressure, heart or lung conditions and pregnant women, heat stress can trigger various health problems. These include exhaustion, dehydration, kidney failure, heat cramps, and breathing problems (Lenzholzer, 2015, p. 23). Illnesses due to heat can initially comprise heat cramps or heat exhaustion; however, if left unaddressed, these can develop into potentially fatal heatstroke (Gubernot et al., 2014). Reflecting this, the World Health Organization has identified severe weather (including extreme temperatures) as a leading global health threat (Gubernot et al., 2014).
Australian cities are amongst the fastest-growing cities in developed nations, and there are mounting worries about their thermal conditions (Shooshtarian et al., 2020). Indeed, in Australia, extreme heat is the most perilous form of natural hazard, resulting in a greater proportion of deaths (55%) than all other natural threats (Zander et al., 2015). This situation is concerning as hot weather is becoming increasingly common and extreme. For example, the 2011 to 2020 decade was Australia’s hottest on record (Shooshtarian et al., 2020).
The effects of many lethal heatwaves are due to not only elevated temperatures but also humidity.2 High heat combined with high humidity weakens the human body’s ability to control its temperature by sweating. Therefore, hot and humid weather is normally more hazardous than hot, dry conditions (Steadman, 1979). Indeed, humans may acclimatise to DBT extremes through sweating and associated evaporative cooling if the WBT stays below 35°C which is the average skin temperature (Pal & Eltahir, 2016). Currently, peak heat stress, measured by the WBT, is comparable across diverse climates and usually does not exceed 31°C. However, any exceedance of 35°C wet-bulb temperature for several hours escalates the risk of inducing ‘hyperthermia in humans as dissipation of metabolic heat becomes impossible’, and the body becomes unable to sustain a stable core temperature (Coffel et al., 2017). Considering both aspects, researchers approximate that the survivability limit for peak six-hourly wet-bulb temperature is approximately 35°C. While 35°C has not happened for prolonged periods so far, it will likely occur later this century with forecast temperature increases accompanying the higher end of the emission scenarios identified by the IPCC. This situation could threaten the habitability of some cities and regions (Sherwood & Huber, 2010).
It is projected that by 2080 exposure to extreme levels of WBT will increase in frequency by a factor of 100 to 250 in the tropics and parts of the mid-latitudes (Coffel et al., 2017). Confining global average surface temperature rises to less than 2°C relative to 1986–2005 (RCP 4.5) will likely avoid WBT exceedance of 35°C. However, if emissions continue to surge unabated (RCP 8.5), global average surface temperatures are projected to rise by 3.2–5.4°C by 2100, relative to 1986–2005. Under RCPs 8.5, temperatures are projected to continue to rise until 2300 (median projection). Under RCPs 4.5 and 8.5, Coffel et al (2017) project WBT exceedance of 32°C potentially reaching 60 million person-days and 600 million person-days respectively by 2070–2080.
All cities rely on workers servicing them through outdoor manual work, and in practice, extensive frequencies and durations of 32°C WBT (and above) would make these outdoor activities extremely hazardous. Moreover, elevated WBTs decrease labour productivity due to a need for more frequent rest periods, increase work accident frequency because of concentration lapses and higher fatigue levels (Zander et al., 2015; Jia et al., 2018). Finally, WBT extremes will negatively affect agricultural industries such as meat and livestock due to heat stress on beef cattle, and workers, in feedlots (Davidson, 2007).
While the WBT provides broad guidance on heat stress conditions, outdoor work safety guidelines usually relate to a different index, the wet bulb globe temperature (WBGT). This measure combines DBTs and WBTs with relative humidity, solar radiation and wind speed. The WBGT is the reference index for ISO standard 7243:2017 Ergonomics of the thermal environment (International Organization for Standardization, 2017) and is used in many countries to evaluate the potential of heat stress in a working environment. The IPCC predicts that globally labour productivity will decline due to increases in WBGT (Zander et al., 2015).
The serious threat of elevated WBT and WBGTs may be surprising as the major climatic consequences of climate change that city policymakers are urged to consider have been DBT changes, precipitation changes, sea-level rise and extreme events such as more intense storms and flooding.
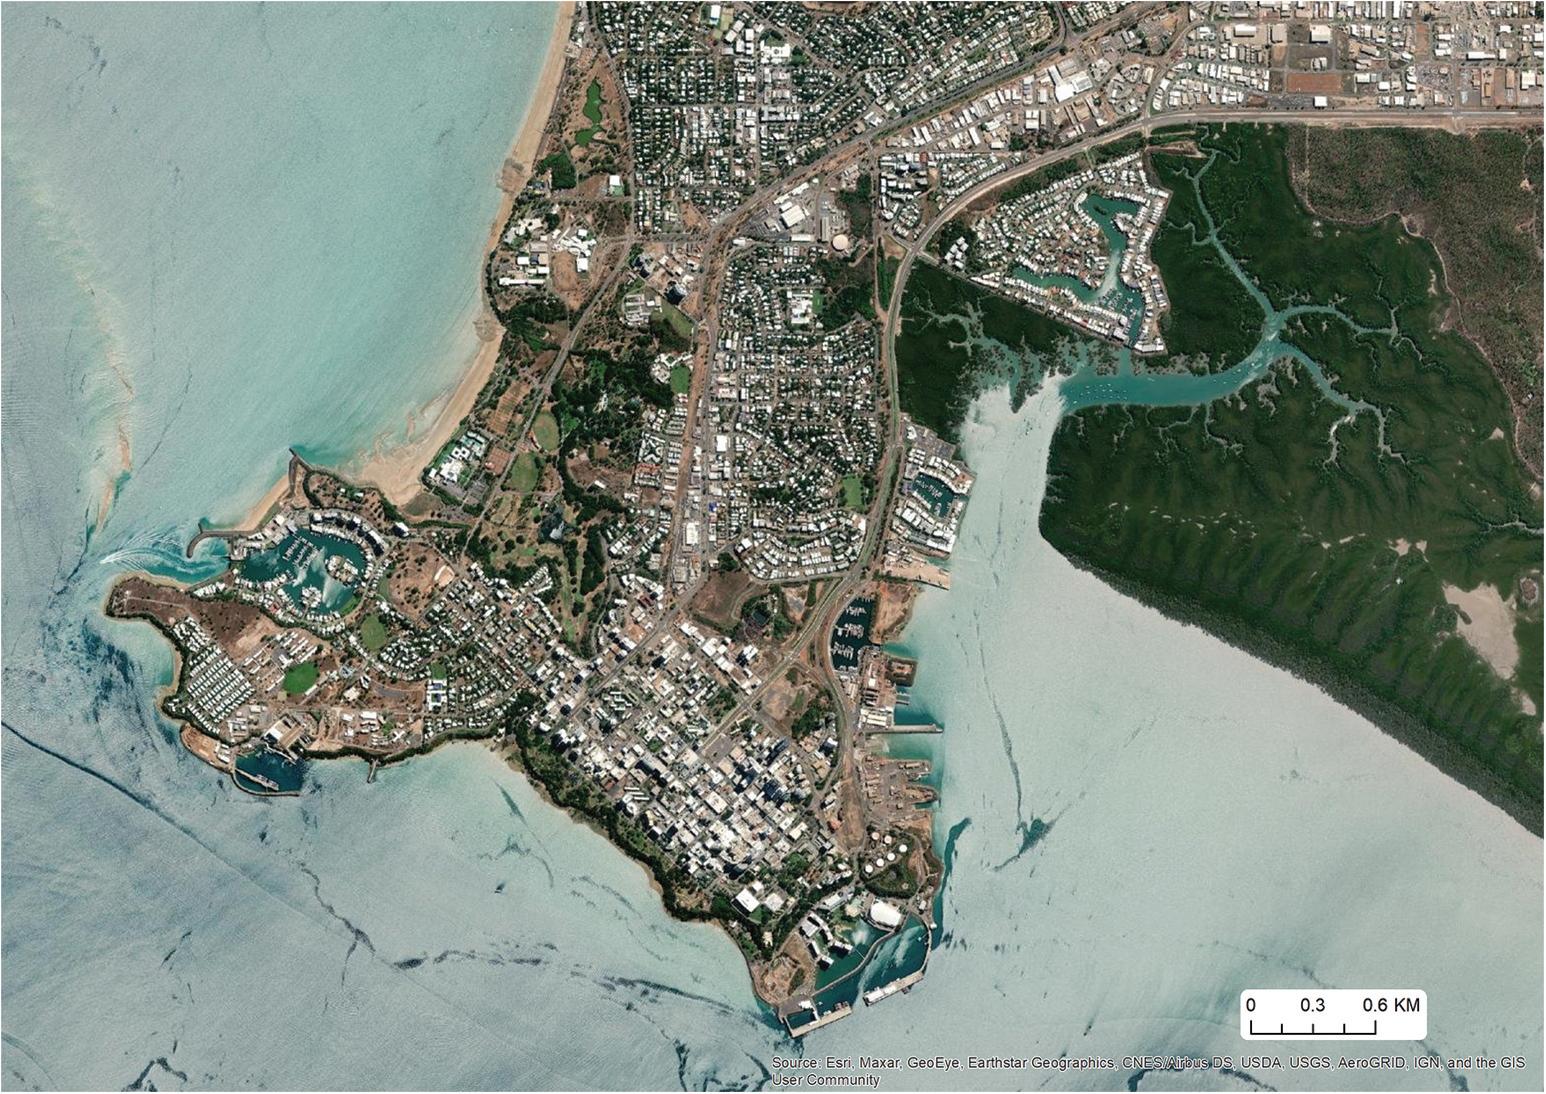
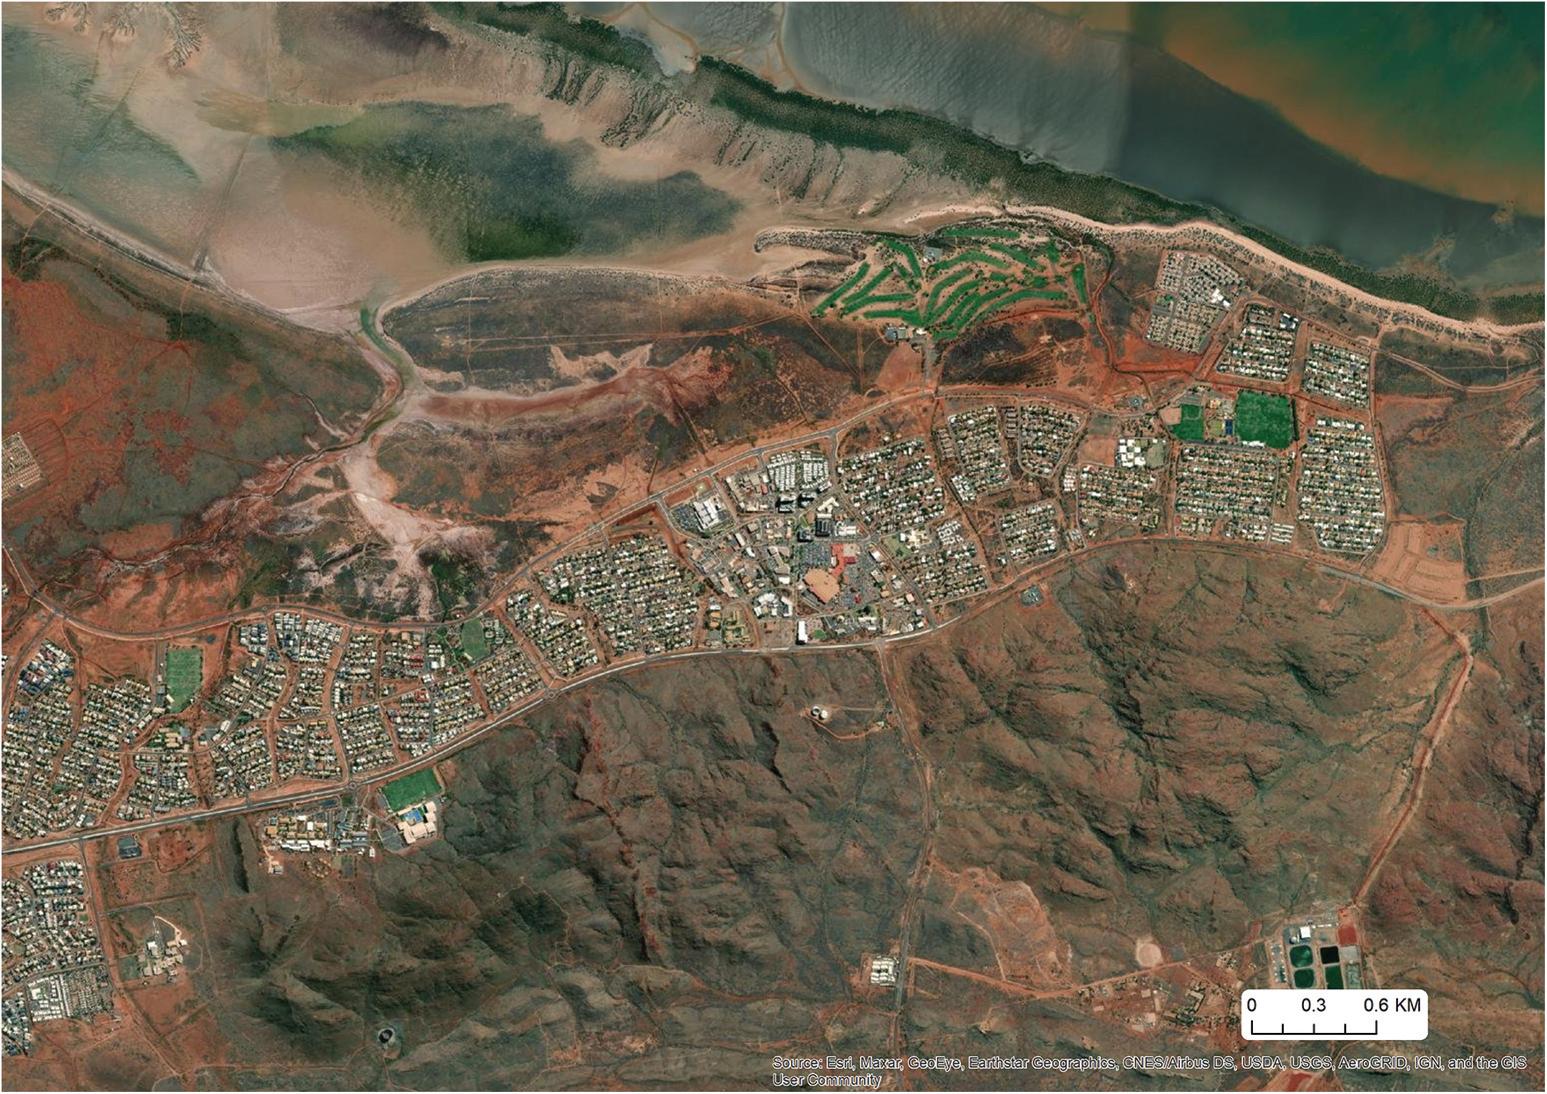
At the same time, as climate change-induced heat stress concerns are mounting, planning for substantial population growth in northern Australia is being pursued. Northern Australia encompasses 45% of the continent yet presently accommodates only 5% of its population (Bolleter, 2018) (Figure 3). Its population is distributed between small cities, towns, and remote communities. In Queensland, these include the sea-change cities of Cairns (population 140,000) (Figure 4), Townsville (170,000) and Mackay (115,000). In the Northern Territory, the capital city of Darwin (106,000) (Figure 5), and in Western Australia, the lifestyle and tourist town of Broome (15,000) and the resource towns of Port Hedland (15,000) and Karratha (17,000) (Figure 6) (Bolleter, 2019).
The existing climate partly explains this comparatively sparse population. Northern Australia typically has a tropical savannah climate, mainly comprising a dry and wet season. The dry season extends from May to August and the wet season from December to April. From early September to early December is the ‘build-up’ season, during which humidity intensifies but does not manifest as rainfall (Jia et al., 2018). Maximum DBTs in
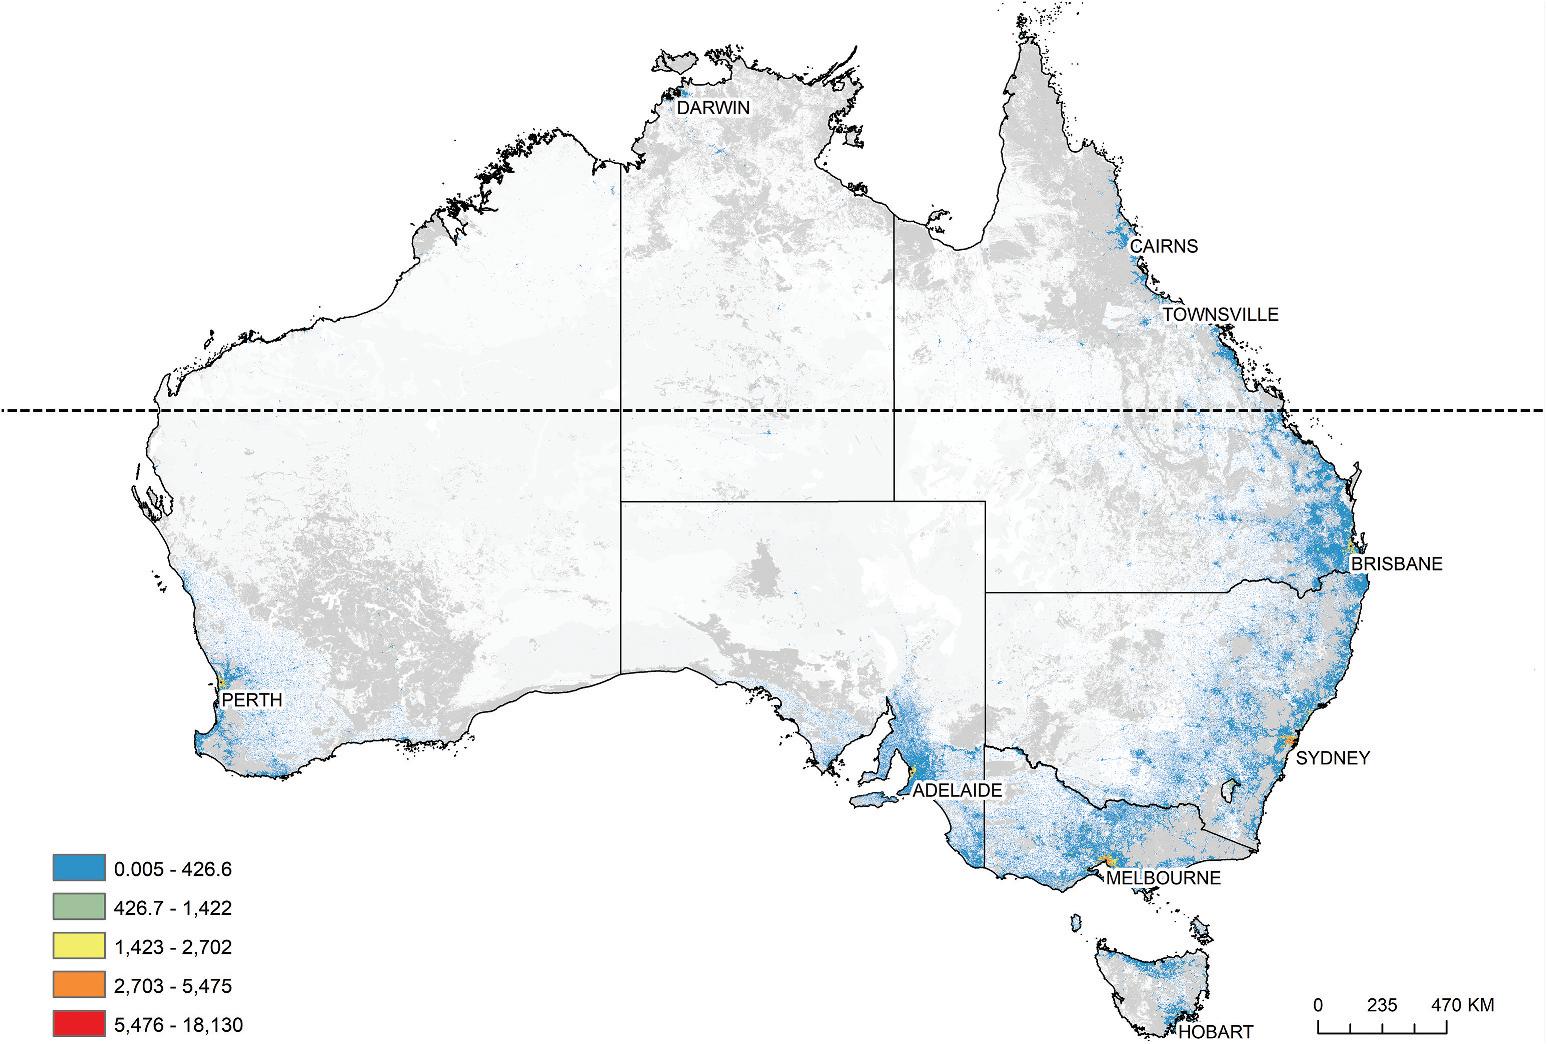
Figure 3. Existing population density per square kilometre. Northern Australia encompasses an area of approximately 3,500,000 km2, or 45% of Australia’s total landmass, yet houses only 5% of Australia’s total population. Map by the authors based on data from the Australian Bureau of Statistics.
this period in the coastal zone varies from the high thirties (Celsius) in the Pilbara to the low thirties in northeast Queensland and are accompanied by uncomfortably high levels of relative humidity sometimes above 70%.
Nonetheless, advocates of northern development (Dale et al., 2014; Harding, 2014; Kaesehagen, 2014; Robb, 2014) envisage substantial population increases, in part, because of northern Australia’s growing importance in geopolitical terms. Northern Australia sits at the intersection of the ‘two most important global axes of the twentyfirst century: Asia and the tropics’ (Roux et al., 2014, p. xi) – regions that will increase significantly in population and economic power (Bolleter, 2018).
Federal government planning for northern Australia is captured in the ‘Our North, Our Future: White Paper on Developing Northern Australia’ (Australian Government, 2015b). The report assumes a pro-development posture, in alignment with the characterisation of northern Australia as a land of ‘economic abundance and opportunity’ (Bolleter, 2019). To deliver rapid growth, the federal government has committed $5 billion to the Northern Australian Infrastructure Facility to deliver loans for building major infrastructure (Bolleter, 2019). While the white paper is silent concerning settlement patterns, it promotes significant urbanisation:
Development will require many more people living in the north. we need to lay the foundations for rapid population growth and put the north on atrajectory to reach apopulation of four to five million by 2060 (australian government, 2015b, p.4)
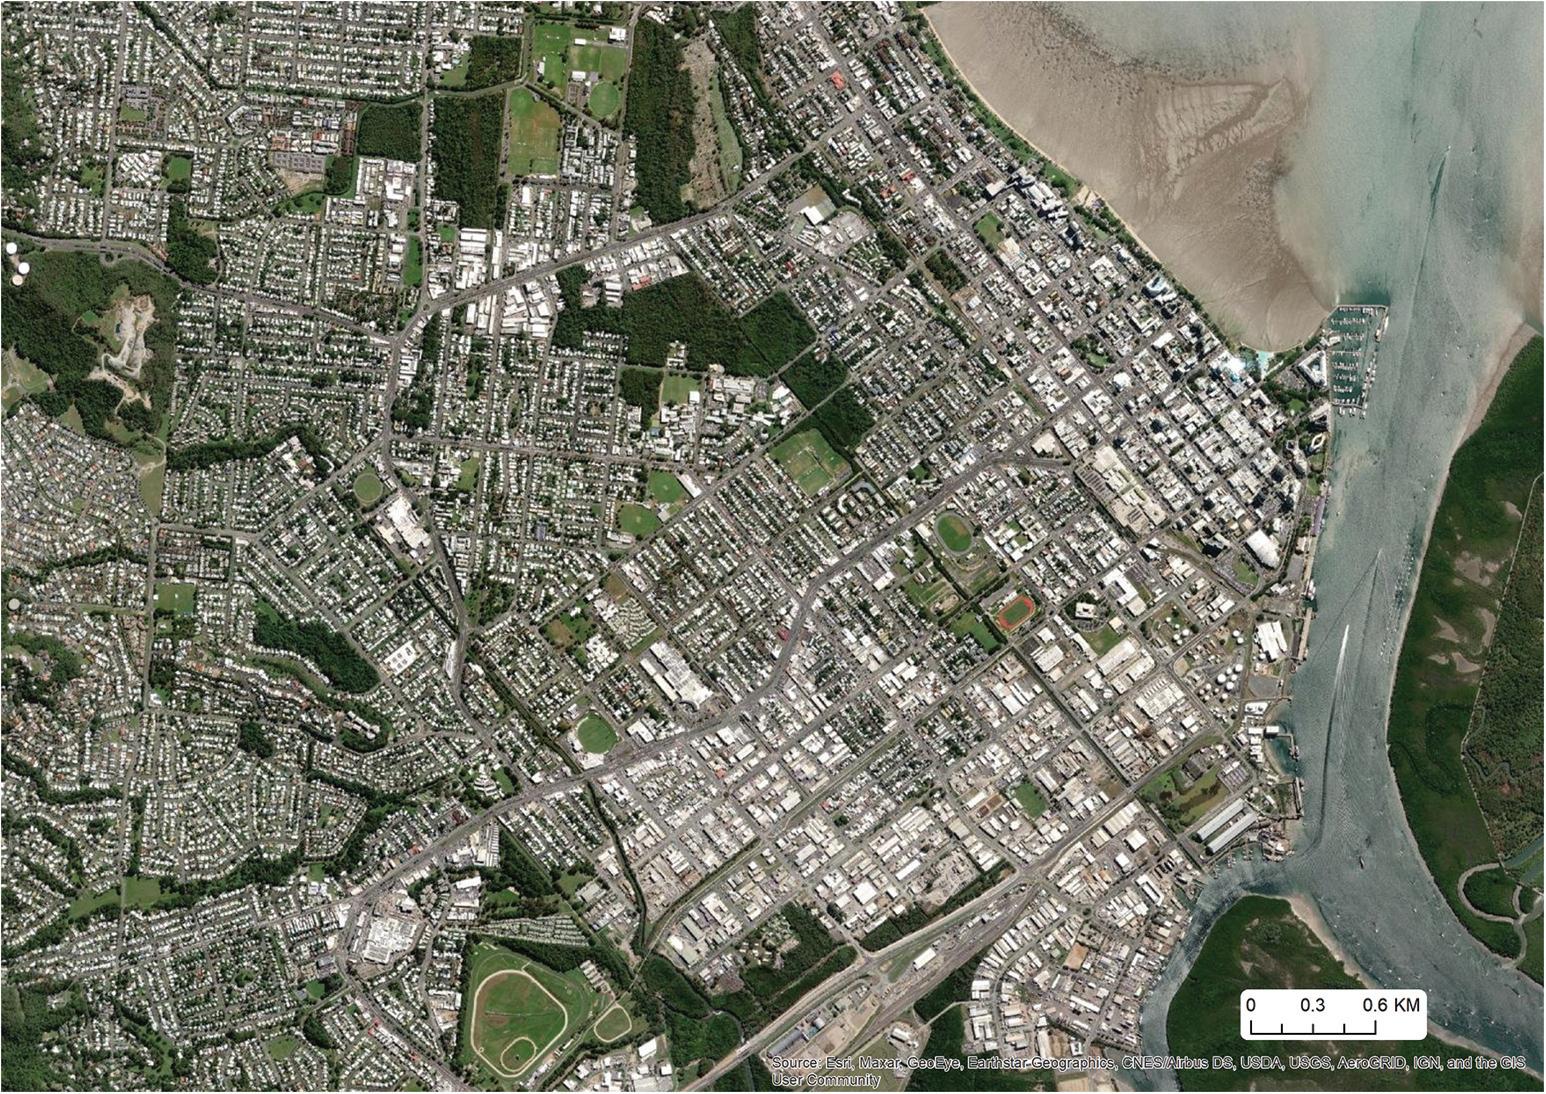
4. Cairns city centre and surrounding suburbs (total population 140,000). Map by the authors with data from Esri, Maxar, GeoEye, Earthstar Geographics, CNES/ Airbus DS, USDA, AeroGRID, IGN and the GIS User Community.
This projection represents an almost four-fold increase in northern Australia’s existing population of 1,300,000 (a further 3,700,000 people) by 2060. In this respect, the white paper ambiguously advocates for ‘the development of major population centres of more than a million people’ – such cities would be six times the size of Townsville, the current largest city, with a population of 170,000 people (Bolleter, 2018). While Northern Australia’s population had been growing at around 2.0% per annum – above the national average of 1.7% (Australian Government, 2015b) – this is substantially below the growth rate required for a four-fold increase by 2060. Indeed, data for 2019 indicates that the Northern Territory’s population reduced (Australian Bureau of Statistics, 2020). While the White Paper is strangely mute on the composition of this expanded population, it is generally characterised as a workforce solicited through Designated Area Migration Agreements (DAMAs) to support the labour markets of northern regions, including in the Northern Territory and the Pilbara (in northern Western Australia), in combination with Seasonal Worker Programmes (Australian Government, 2015b).
In Northern Australia, planning is organised on a city and state, and territory basis and is fragmented spatially (Freestone, 2014) into the northern regions of Western Australia, the Northern Territory and Queensland. The overarching planning agencies in the region include the Western Australian Department of Planning, Lands and Heritage, the Northern Territory Department of Infrastructure, Planning and Logistics, and the Queensland Department of Development, Infrastructure and
the
Community.
Planning. Nonetheless, the major population centres have planning policies prepared by the respective Local Government organisations (Freestone, 2014). The existing city, state or territory planning of northern Australia endorses population increase, albeit not commensurate with the scale anticipated in the government’s white paper (Bolleter, 2019). For example, the plan for Cairns and the surrounding Far North Queensland region scopes the period to 2031 and an extra 100,000 people in the Cairns region (Queensland Government, 2009). Likewise, the planning scheme for Townsville extends to 2031 and an extra 110,000 people (Townsville City Council, 2017, p. 3). The ‘Greater Darwin Plan’ sanctions a population increase of 70,000 people by 2027 (Northern Territory Department of Lands and Planning, 2012). The Pilbara Cities Vision scopes a population of 50,000 in both Karratha and Port Hedland for 2035, an increase from 16,800 and 14,500, respectively (Pilbara Regional Planning Committee, 2012, p. 21). The Shire of Broome endorses a population increase from 17,300 to 39,500 by 2036 (Shire of Broome, 2020, p. 28).
Other authors have identified the potential implications of climate change to developing northern Australia – concerning maintaining sustainable cropping, grazing and tourism, and essential ecosystem services and biodiversity (For example Turton, 2015). However, there has been little written about increasing heat stress impacts on cities and people in northern Australia – a gap in the knowledge this paper specifically addresses.
Framework
The study is underpinned by a model that presumes increased temperatures and absolute humidity in coastal areas associated with climate change will increase heat stress. The conceptual model hypothesises that heat stress will adversely affect the health and wellbeing of urban populations (Chang, 2016, p. 1192) and reduce the sustainability, liveability and productivity of affected cities (Haddad et al., 2018). Although a comfortable thermal environment can increase people’s ability to spend time outdoors, heat stress can result in substantial discomfort, changing the patterns of outdoor activities (Sharifi et al., 2016). Indeed, research indicates that both necessary and optional activities begin to wane after the apparent temperature reaches 28°C DBTs (Sharifi et al., 2016).
The combined effects of heat stress, retreat to interior environments, and greater private vehicle use will likely lead to increased energy consumption (Shooshtarian et al
2020), public health impacts, and declining liveability. Moreover, increasing heat stress is an occupational health hazard and profoundly affects labour productivity (Zander et al., 2015). The result will likely be that northern Australia will struggle to attract substantial migration and could experience some out-migration of existing residents.
.,With this concerning situation in mind, this paper systematically considers the risks for future planned populations attributable to exposure to increased heat stress due to climate change – risks that to date have been largely overlooked in planning for population growth. To this end, this paper documents an evaluative research process to explore the research question:
Are the current adaptation policies and planning for growth in northern australia consistent with the projected chronic nature of climate change-induced heat stress?
This question is addressed by evaluating the areas of northern Australia most affected by changes in temperature and humidity, as measured by WBTs and WBGTs.
The data we have used derives from weather files that have been obtained from the Climate. OneBuilding.Org website (Climate.OneBuilding, 2020) for the northern Australian locations. These file types represent a ‘typical’ (TMY) or ‘representative’ meteorological year (RMY) and were originally developed to model buildings’ energy performance. The files include a range of weather variables for each hour of the year, including air temperature, relative humidity, solar radiation and wind speed. The data files were then ‘morphed’ to identify future conditions using the climate change world weather file generator, CCWorldWeatherGen, developed by the Sustainable Energy Research Group at the University of Southampton and the Department of Mechanical Engineering at the University of Malaya in Kuala Lumpur (University of Southampton Energy & Climate Change, 2020).
CCWorldWeatherGen uses summary data of the ‘HadCM3 A2’ experiment ensemble, reported in the Special Report on Emissions Scenarios (SRES) for the IPCC, published in 2000. Here, we have used projections for the A2 scenario for the 2080s. The A2 scenario predicts a 2100 temperature rise between the RCP 6.0 and 8.5 scenarios. The methodology used by CCWorldWeatherGen was initially developed by Belcher et al. (2005).
We have calculated the WBT using an empirical relationship between DBT and relative humidity derived by Stull (2011) as set out in Equation (1). This equation is suitable for use for locations at sea level (i.e. atmospheric pressure of 101.325 kPa).
4 686035
Where:
Tw is the WBT in degrees Celcius
T is the air temperature measured in degrees Celcius RH% is the relative humidity expressed as a percentage ‘atan’ is the inverse of the trigonometric ‘tan’ function expressed in radians
The WBGT for each hour of the year was then derived using an online calculator3 to solve the following equation (Equation (2)):
Where:
Tnwb (natural WBT) is calculated from Td by iteration, Td = dew point
Tg = globe temperature,
Ta = ambient temperature.
The calculator uses the Liljegren method (Liljegren et al., 2008) to calculate Tg and Tnwb.
We chose to include the SRES A2 scenario because ‘without additional efforts to constrain emissions’, our current trajectory ranges between RCP 6.0 and 8.5 (Intergovernmental Panel on Climate Change, 2014, p. 8). Moreover, because there is still much uncertainty over global warming projections, miscalculations could cause significant hardship and even loss of life. It, therefore, makes sense to invoke the precautionary principle. We present our weather data from December to February, encompassing the build-up and early wet-season in Northern Australia (Jia et al., 2018).
We have quantified heat stress using WBTs and WBGTs. These indices are just two out of the 162 human thermal climate indices ventured over the past century (de Freitas & Grigorieva, 2015; Shooshtarian et al., 2020). Furthermore, schemes employed vary in the method concerning the number of variables included, the complexity of the underlying body – atmospheric heat exchange theory, and the specific design for application (de Freitas & Grigorieva, 2015, p. 109; Zhao et al., 2021). Nonetheless, we have chosen WBT and WBGT because all indices incorporate the combined effects of temperature and humidity, and this paper builds on a considerable body of emerging research globally that focuses on heat stress as quantified by WBT (Sherwood & Huber, 2010; Pal & Eltahir, 2016; Coffel et al., 2017), and WBGT (Zander et al., 2015; Newth & Gunasekera, 2018).
While a WBT of 35°C is potentially lethal (Sherwood & Huber, 2010), we also report on WBT exceeding 30°C, as extensive frequencies of that level would make outdoor activities (such as physical work) impossible and make cities effectively uninhabitable.
Because of the ambiguities in the Northern Australia White paper about the actual distribution of the boosted population, it has been assumed that population growth will increase across seven of the biggest urban centres in the north, Karratha, Broome, Kununurra, Darwin, Cairns, Townsville and McKay (Figure 1). We then considered the degree to which heat risks would affect current and future populations in these centres.
The research question asks, to what degree does population and climate change adaptation policy in northern Australia consider, and respond to, the chronic nature of likely heat stress? To answer this question, we reviewed the Northern Australia White Paper and then considered the degree to which heat risks would affect current and future populations in these centres.
We also conducted an ‘illustrative’ literature review (Swaffield & Deming, 2011) of climate change adaptation policies relating to northern Australian regions and populations produced by federal, state, and territory governments. This qualitative review focused on references to climate change-induced heat stress (Australian Government: Department of the Environment and Energy, 2012; Loughnan et al., 2012).
The Exposure of Current and Future Populations to the Adverse Effects of Increased Wet-Bulb Temperatures
Our results from the analysis of existing and weather shifted data under the SRES A2 scenario are set out in the following.
Table 1 contains the exceedance of wet bulb (WBT) and wet bulb globe (WBGT) thresholds during daylight hours in the summer months now and in future (2080).
Figure 7 sets out for each centre the existing and future (2080) values of WBTs and WBGTs together with the magnitude of exceedance of WBGT thresholds for daylight hours over the summer months (December – February). The WBGT threshold limit values (TLVs) for allowable work in the ISO standard 7243 (for acclimatised people) are illustrated in Table 2.
According to Newth (2018): resting creates around 117 W; moderate labour and walking create around 297 W, and very heavy labour and intensive activities create around 522 W.
The results indicate significant increases in both WBT and WBGT by 2080. The WBT values for all centres are projected to rise to maxima above 30°C by 2080 but do not reach the 32°C threshold. The WBGT values are more valuable for assessing the impact of heat stress on outdoor work and exercise. All centres currently have significant WBGT exceedances of 26°C, which is problematic for very intense work. By 2080 the projections
Table 1. Percentage of daylight hours (7 am-7 pm) for December to January in which the WBT and WBGT exceed the stated thresholds.
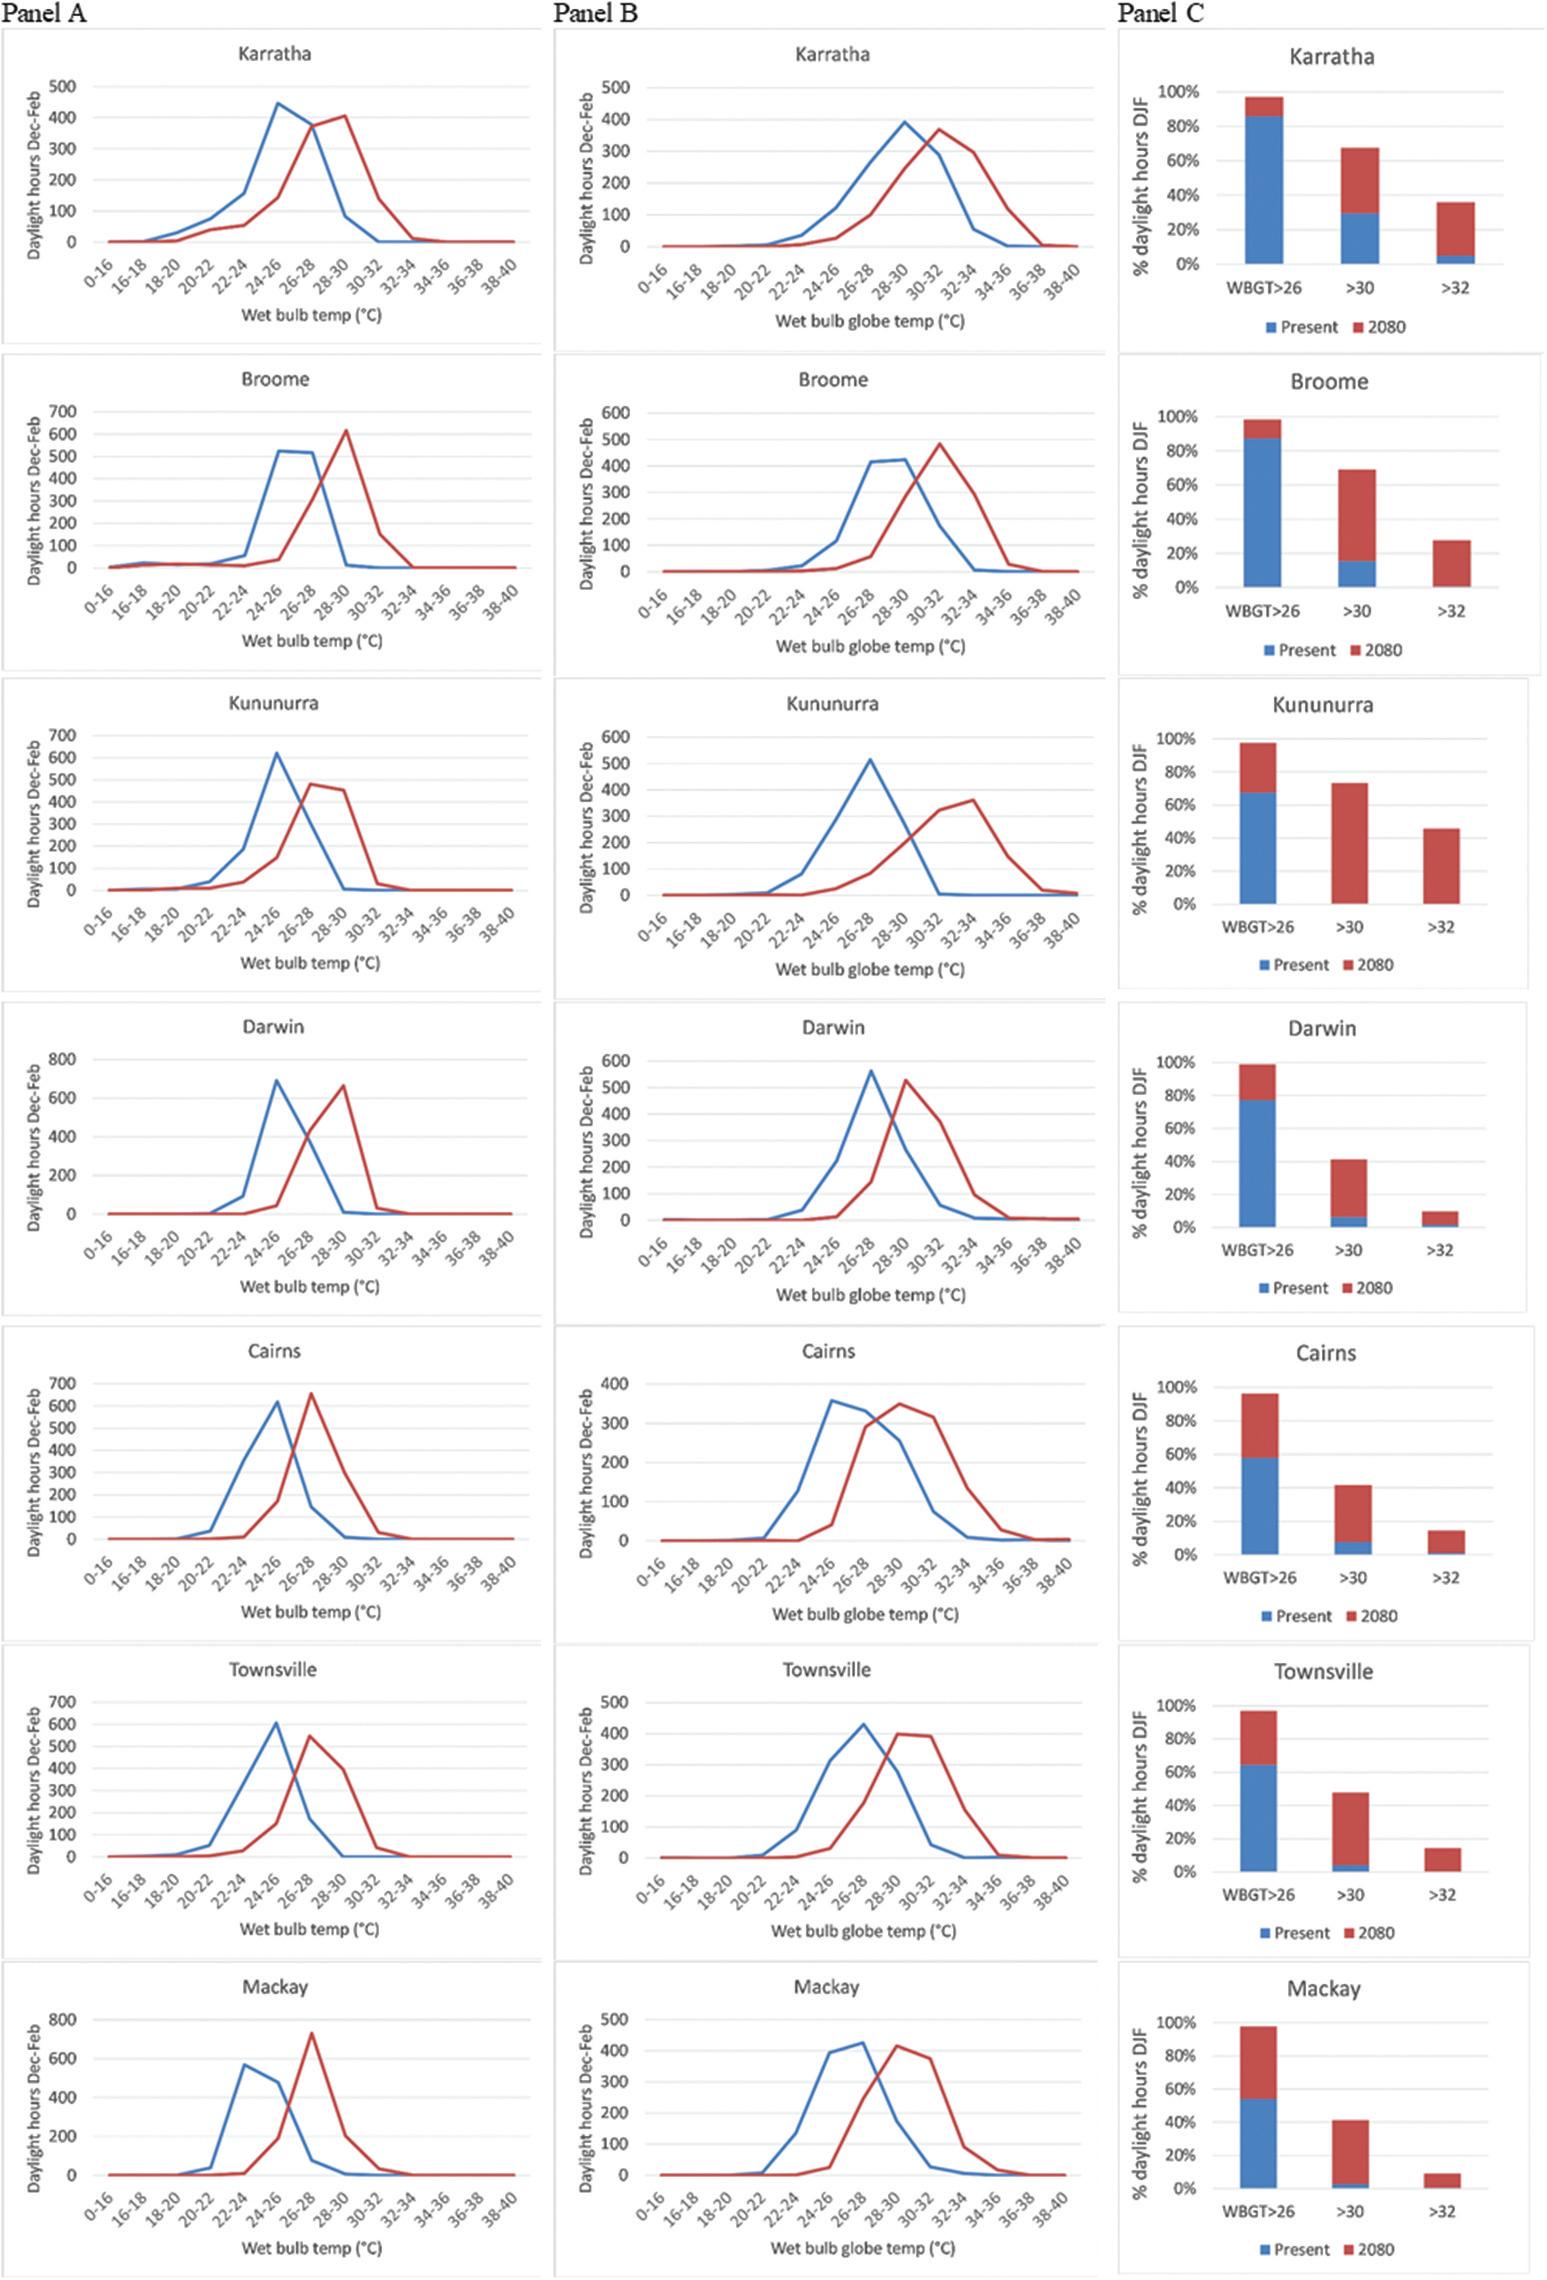
Figure 7. Panel A – Present and 2080 distribution of WBTs in the hours of 7am-7pm in the months December to February; Panel B – Present and 2080 distribution of WBGTs in the hours of 7am-7pm in the months December to February; and Panel C – Present and 2080 exceedance of threshold WBGT in the hours of 7am-7pm in the months December to February.
Table 2. ISO 7243 threshold limit values (acclimatised people).
indicate that summer daytime WBGT values will exceed that value almost 100% of the time. Although only the Western Australian centres currently have exceedances of 30°C, by 2080, all those centres are projected to have exceedances of that value for over 60% of working hours in the summertime. In the Darwin and Queensland centres, the 30°C WBGT threshold will be reached in 40% of summer working hours. According to the ISO standard, at WBGT values between 30–32°C, even light work should be limited to 15–30 minutes in the hour. In the Western Australian centres, WBGT is projected to exceed 32°C in 20–40% of summer daylight hours, making most outdoor work or exercise dangerous.
In assessing these results, it is important to note that under the SRES A2 scenario, CO2 concentrations and temperatures will continue to rise well beyond 2100, meaning that the projected WBT and WBGT values will also rise. Further, the future weather projections reflect a ‘typical’ year and do not represent extreme conditions. Also, the base data for the projections derive from Bureau of Meteorology weather stations, which are not necessarily representative of conditions in adjacent areas. For example, in their 2015–17 study of heat stress in a Darwin worksite, Jia et al. (2016) found temperatures were over 7°C higher onsite than in the nearest weather station, and regular WBGT exceedances of 30°C were directly measured. Moreover, the projections do not account for local scale temperature variation in the Urban Heat Island effect (UHI). This effect is important because UHI can cause substantial temperature increases. For instance, central Darwin can be up to twelve degrees warmer than the surrounding non-urbanised monsoon woodland (Cox & Nield, 2015). This situation could substantially increase the WBT risks experienced in the larger urban centres.
Several adaptation policies exist at the national and state/territory levels, as set out in our ‘illustrative’ policy review (Table 3). The Australian Federal Government released the National Climate Resilience and Adaptation Strategy (Australian Government, 2015a) in 2015. This document outlines policy in respect of various ‘sectors and policy areas.’ We focus on the following subset: cities and the built environment and health and well-being for this research.
The main focus of the National Climate Resilience and Adaptation Strategy is the impact of climate change on infrastructure. However, it does acknowledge ‘greater risk of human injury, disease and death, and interrupted labour force productivity, due to
Table 3. Climate change adaptation policy in Australia.
Policy Responsibility Date release
National Climate Resilience and Adaptation Strategy
The Queensland Climate Adaptation Strategy
Climate Change Response: Towards 2050
Western Australian Climate Policy
Australian Government Department of Agriculture, Water and the Environment 2015
Queensland Department of Environment and Heritage Protection 2017
Northern Territory Office of Climate Change
Western Australian Department of Water and Environmental Regulation
hotter, drier conditions, increasing the bushfire risk to lives and private property and the incidence of heatwaves’ (Australian Government, 2015a, p. 34). It also acknowledges that there could be ‘serious’ implications for human health. However, the only remedy identified is urban greening, citing the City of Melbourne’s Urban Forest Strategy as an example. The role of the land-use planning system is limited to considering ‘disaster risks’ and the approval processes for future development.
While acknowledging the health risks of higher temperatures, this section of the strategy considers this as an event-based risk due to the potential of ‘increasing incidence of heat waves,’ rather than a systemic change in climate resulting in chronic conditions. The cited remedy is accordingly about managing the impact of these events on the health system. Nowhere in the strategy is it contemplated that climate change could result in consistent threats to the liveability and viability of urban populations.
The Queensland Climate Adaptation Strategy (Department of Environment and Heritage Protection, 2017a) acknowledges that ‘There is likely to be a substantial increase in the temperature reached on the hottest days, and an increase in the frequency of hot days and the duration of warm spells’, which ‘could result in heat exhaustion and increased heat-related mortality, particularly among outdoor workers and vulnerable people’ (p. 5). The strategy has companion documents that include (among other things) a Human Health and Wellbeing Climate Change Adaptation Plan (Department of Environment and Heritage Protection, 2018) and a Built Environment and Infrastructure Sector Adaptation Plan (Department of Environment and Heritage Protection, 2017b).
In the former, the risk of heat stress is identified as the top concern of stakeholders, but again, the remedy is seen as improving the ability of the sector to respond to heatwaves rather than chronic conditions. Stakeholders cite poor urban planning that fails to consider climate change as a barrier to adaptation.
The main focus of the Built Environment Plan (Department of Environment and Heritage Protection, 2017b) is the risk to infrastructure, noting ‘ . . . if unmanaged, climate change represents a material risk to business operations in the short to medium term’ (p. iii). Consideration of urban planning issues in Queensland falls to local government via the Climate Risk Management Framework for Queensland Local Government and its companion guideline. Importantly these documents acknowledge that climate change brings both acute and chronic risks such as ‘steadily increasing temperatures and sea levels.’ However, both documents, which are in draft, are processoriented, i.e. they address how local government should go about addressing climate change rather than the specific actions required.
The Northern Territory has recently released ‘Climate Change Response: Towards 2050ʹ (Office of Climate Change, 2020). This brief document outlines climate change as a ‘challenge and an opportunity’ and incorporates policy direction on emission reductions and adaptation (under the banner ‘A Resilient Territory’). The document says the government ‘ . . . is working with researchers and experts to examine the effects of climate change on the health of the community, and to identify strategies to mitigate the health impacts of climate change on our communities.’ A key element of the response is establishing the Darwin Living Lab under a partnership with the Commonwealth Scientific and Industrial Research Organisation (CSIRO), the Australian Government and the City of Darwin. This project seeks to evaluate the potential of ‘heat mitigation measures’ for Darwin and other tropical centres. The government also intends the Planning Commission to address climate change, possibly including building design guidelines for tropical and arid environments. However, this planning again relates to the control of future development, neglecting the impacts on existing urban and built forms.
The Government of Western Australia has just released a climate change policy for the state (Department of Water and Environmental Regulation, 2021). The document is largely a blueprint for future action, indicating that a Climate Resilience Action Plan (2022–25) will be prepared to ‘support Western Australian industries, cities and regions to identify and manage climate impacts.’ However, it is silent on heat stress risk in the north of the state. The government also released separate findings from a climate health inquiry (Weeramanthri et al., 2020). While this document acknowledges the increasing risk of higher temperatures, it does not specifically address the impacts of heat stress conditions in the state’s north.
Our findings raise questions about the wisdom of attempting to populate the north of Australia further, as proposed in the Northern Australia White Paper in the age of climate change. Indeed, given that climate proves to be a major driver of population growth, the worst affected centres will likely experience significant out-migration to the more temperate northern centres or southern capital cities. Mundane issues such as obtaining insurance could drive much of this migration. Indeed, as early as 2014, Allan Dale predicted, ‘Climatic risks could mean a red-line from Rockhampton to Port Headland, above which, the insurance industry would prefer not to provide cover . . . Suddenly, the north becomes too much trouble for the rest of Australia’ (Dale, 2014, p. 139). Such out-migration may require government funding to support the relocation of vulnerable segments of society, including aboriginal communities.
In respect of adaptation planning, the existing national and state/territory responses to increasing heat stress in the north of Australia inadequately reflect the chronic nature of the problem, focussing rather on the increased frequency of heatwave events and the ability of the local government and health systems to cope with these ‘events.’
In a major global survey of climate change adaptation responses to heat stress (TurekHankins et al., 2021), the authors identify that heat is being considered a ‘health issue’ to manage in high-income countries. However, the research does not identify any countries
presently implementing policies concerning population distribution associated with heat stress. Furthermore, in reviewing the literature, we found only a small number of articles canvassing ‘transformational adaptation’, i.e. ‘fundamental systems’ changes that address root causes of vulnerability may be needed” (Kates et al., 2012; Fedele et al., 2019). Heat stress in northern Australia and other vulnerable parts of the world will eventually require such a strategy.
Ideally, developing an overarching national population distribution strategy that limits vulnerability to exposure to climate change and related heat stress requires spatial planning intervention at the national scale. The OECD has identified 162 countries with national-level urban policies, although in different forms, at different development stages and with varying thematic foci (OECD et al., 2021b). However, only 52 national urban plans have an ‘extensive’ spatial dimension, which would be required to shape population settlement patterns (UN Habitat, 2021).
The National Climate Resilience and Adaptation Strategy (Australian Government, 2015a) should coordinate national and state policies to deliver northern population distributions less vulnerable to WBT extremes in Australia. These policies would demarcate future urban growth areas, install spatial limits for current cities and towns, and coordinate infrastructure spending concerning cities. The Strategy should delineate future growth areas through a comprehensive analysis of enabling infrastructures such as existing ports, water supplies, economic development potential, present population, and environmental fragility – as well as climate change projections. The Strategy should also address the implications of the declining future population in the most affected locations.
Scientists worldwide estimate the likely impact of the nationally determined contributions (NDCs) made in the 2015 Paris agreement. The consensus is that the current emission reduction policies will not achieve their NDC commitments, which in any case are insufficient to achieve the objective of limiting warming to well below 2°C above pre-industrial levels. To achieve that goal, it is generally accepted that net emissions will need to be near zero by 2050. However, it is increasingly unlikely that there is sufficient momentum to reduce emissions in time to achieve a less than 1.5–2°C outcome.
Accordingly, it is well past time to be realistic about the prospects of limiting temperature rise to 1.5–2°C. It is time to prepare for the 3°C+ world described in this research while ramping up emission reductions to ensure that future generations are not facing a plus 4–5°C world. While climate change mitigation is not the core focus of this paper, emissions reductions need to become one element of preparing for the worsening effects of climate change. Despite the decades of knowledge about climate change, the status of adaptation planning is, at best, preliminary, and at worst, totally inadequate. Climate change is here and will be with us for centuries to millennia, so it is time to
combine mitigation and adaptation into a single coherent national strategy. Regarding mitigation, the policy needs to be focussed on urgently reducing domestic emissions while advocating strong international action.
This paper has explored the vulnerabilities of urban centres in northern Australia to chronic heat stress at a broad scale. However, readers should note the limitations of this paper. The impacts of heat depend on both exposure and vulnerability on a finer scale. Concerning exposure, it will be necessary to address the increasing risks associated with heat stress in northern Australia through urban and built form design. Climate-sensitive urban design aims to create thermally comfortable environments by designing for temperature, humidity, wind, and solar access (Coutts et al., 2013). Such approaches can include measures such as shading the public domain through adjacent development, funnelling cooling wind through street networks, adopting advanced building materials to reduce the absorption of heat and adopting solar control systems (Haddad et al., 2018) and adding ‘vegetation.’ This latter strategy includes preserving and enlarging existing parks; and planning more city parks, green wedges and green corridors which cool their surroundings (Coutts et al., 2013; Lenzholzer, 2015).
Nonetheless, urban greening measures will only provide a limited remedy to the heat stress likely to be experienced in northern Australia by the end of the century and beyond. This limitation is because the cooling associated with evapotranspiration from vegetation is reduced with increasing humidity (Coutts et al., 2013; Rahman et al., 2020), so as humidity rises, the cooling benefits are diminished, limiting the benefit of this strategy during high heat stress conditions, such as in northern Australia. Adaptation to these conditions through planning and design is worthy of future research.
Vulnerability to heat stress depends on numerous other factors, including population age, pre-existing health conditions, acclimatisation, adaptive capacity, availability of air conditioning, emergency response to severe heat waves, and sociocultural and economic factors that influence behaviour (Loughnan et al., 2012). Given the broad geographical scope of this paper, we do not discuss these issues in detail. Nonetheless, research indicates relatively basic adaptation strategies such as early warnings and education about heatwaves and social check-ups on vulnerable demographics during heatwaves can significantly lessen the death tolls. Furthermore, because of the necessary brevity, we do not discuss the additional challenges posed to northern development by climate change-induced sea-level rise, increased intensity storm events, and increasing prevalence of mosquito-borne diseases (Australian Government: Department of the Environment and Energy, 2012) – worthy as these are of consideration.
While exposure to extreme heat stress in vulnerable regions depends heavily on future greenhouse gas emissions, there is much uncertainty about the degree to which humanity can (and is willing to) reduce those emissions (Coffel et al., 2017). Accordingly, Australia’s policymakers should proactively respond at the national and regional planning scale to assume that we continue on a trajectory towards RCP 6.0–8.5. This response
should entail a comprehensive review of the ‘Our North, Our Future’ white paper to avoid expanding populations in areas likely to experience extreme WBTs and other climate change-related risks.
The time for such proactive planning is now. The problem is that the bulk of contemporary development in northern Australia will be with us as the climate crisis unfolds. As this paper has discussed, policymakers are not adequately responding to increased WBTs that could become credible threats to liveability and the viability of northern Australian cities and towns in the coming decades. Adaptation to climate change in Northern Australia should engage all of society, communities and individuals, governments, industry and sectors (Turton, 2015) – and a good place to start would be with climate scientists. Moreover, the focus for investment in identified vulnerable centres should also be retrofitting the urban structure to be more resilient to projected future climatic conditions, not just funding that directly seeks to propagate population growth.
Northern Australia is not exceptional, and the issues raised in this paper pertain to much of the Middle East (Pal & Eltahir, 2016; Bolleter et al., 2021), northern South America, Central and Eastern Africa, and South-East Asia (Coffel et al., 2017). Given the yet emerging nature of predicted heat stress issues, adequate planning responses have been yet to be developed in most affected countries, including ‘transformational adaptation’ involving (among other things) the potential for population movement. Nonetheless, Australia has strong governance and is well resourced to adapt settlement patterns to emerging constraints such as severe heat stress. Indeed, Australia could be an exemplar for climate change adaptation; however, such aspirations remain elusive.
Notes
1. RCPs are greenhouse gas concentration trajectories utilised in the Fifth Assessment Report of the Intergovernmental Panel (IPCC) on Climate Change in 2014 as a basis for the report’s findings. According to the IPCC ‘Scenarios without additional efforts to constrain emissions (‘baseline scenarios’) lead to pathways ranging between RCPs 6.0 and 8.5ʹ (Intergovernmental Panel on Climate Change, 2014, p. 8). Current projections for climate change in the coming decades fall somewhere between RCPs 4.5 and 8.5. [Note: Since the original submission of this article, the Sixth Assessment Report has been released with updated modelling and the replacement of RCPs with Shared Socioeconomic Pathways (SSPs). The 2100 temperature projections for SSP2-4.5 and SSP5-8.5 are broadly similar to the equivalent RCPs (approximately 0.2–0.3°C higher) meaning the analysis presented here remains suitable for its intended purpose.]
2. Absolute humidity is a measure of the actual quantity of moisture in the air while ‘relative’ humidity is the quantity of moisture relative to the maximum moisture content of the air at a given dry bulb temperature.
3. https://climatechip.org/excel-wbgt-calculator
Disclosure Statement
No potential conflict of interest was reported by the author(s).
The preparation of this paper was part funded by an Australian Research Council, Discovery Project grant [DP190101093].
Julian Bolleter http://orcid.org/0000-0002-1514-2007
Bill Grace http://orcid.org/0000-0002-1305-7466
Paula Hooper http://orcid.org/0000-0003-4459-2901
References
Anderson, G. B., Oleson, K. W., Jones, B., & Peng, R. D. (2018) Projected trends in high-mortality heatwaves under different scenarios of climate, population, and adaptation in 82 US communities, Climatic Change, 146(3), pp. 455–470. doi:10.1007/s10584-016-1779-x.
Australian Bureau of Statistics (2020) National, state and territory population. Accessed 6 September 2021. Available at https://population.gov.au/data-and-forecasts/data-and-forecastsnational-state-and-territory-population-data-release-december-2020.html
Australian Government (2015a) National climate resilience and adaptation strategy. Accessed 15 December 2019. Available at https://www.environment.gov.au/climate-change/adaptation/ strategy
Australian Government (2015b) Our north, our future: White paper on developing Northern Australia, Canberra. Accessed 29 Febraury 2016. Available at https://www.industry.gov.au/sites/ g/files/net3906/f/June%202018/document/pdf/nawp-fullreport.pdf
Australian Government (2017) Climate change in Australia. Accessed 11 May 2017. Available at http://ccia2007.climatechangeinaustralia.gov.au/
Australian Government: Department of the Environment and Energy (2012) Climate change impacts in the Northern Territory. Accessed 02 March 2021. Available at http://www.environ ment.gov.au/climate-change/climate-science-data/climate-science/impacts/nt
Belcher, S., Hacker, J., & Powell, D. (2005) Constructing design weather data for future climates, Building Services Engineering Research & Technology, 26(1), pp. 49–61. doi:10.1191/ 0143624405bt112oa.
Bi, P., Williams, S., Loughnan, M., Lloyd, G., Hansen, A., Kjellstrom, T., Saniotis, A., & Saniotis, A. (2011) The effects of extreme heat on human mortality and morbidity in Australia: Implications for public health, Asia Pacific Journal of Public Health, 23(2_suppl), pp. 27S–36S. doi:10.1177/ 1010539510391644
Bolleter, J. (2018) The Ghost Cities of Australia: A Survey of New City Proposals and Their Lessons for Australia’s 21st Century Development (London: Springer).
Bolleter, J. (2019) The consequences of three urbanisation scenarios for northern Australia, Australian Planner, pp. 1–23. doi:10.1080/07293682.2019.1620302.
Bolleter, J., Grace, B., Foster, P., & Hooper, P. (2021) Wet-bulb temperature and sea-level rise in the United Arab Emirates - planning responses, Planning Practice & Research, 36, pp. 408–429. doi:10.1080/02697459.2020.1859199.
Chang, J.-H. (2016) Thermal comfort and climatic design in the tropics: An historical critique, The Journal of Architecture, 21(8), pp. 1171–1202. doi:10.1080/13602365.2016.1255907
Climate.OneBuilding (2020) Climate.OneBuilding.Org. Accessed 02 March 2021. Available at http://climate.onebuilding.org/
Coffel, E., Horton, R. M., & De Sherbinin, A. M. (2017) Temperature and humidity based projections of a rapid rise in global heat stress exposure during the 21st century, Environmental Research, 13(014001), pp. 3–9. doi:10.1088/1748-9326/aaa00e
Coutts, A. M., Tapper, N. J., Beringer, J., Loughnan, M., & Demuzere, M. (2013) Watering our cities: The capacity for Water Sensitive Urban Design to support urban cooling and improve human thermal comfort in the Australian context, Progress in Physical Geography, 37(1), pp. 2–28. doi:10.1177/0309133312461032.
Cox, T., & Nield, L. (2015) Cooling a tropical city, Landscape Australia, pp. 22–26.
Dale, A. (2014) Beyond the North-south Culture Wars: Reconciling Northern Australia’s Recent past with Its Future (New York: Springer).
Dale, A., Campbell, A., Douglas, M., Robertson, A., & Wallace, R. (2014) From myth to reality: New pathways for northern development, in: A. Roux, M. Faubell, & D. McGauchie (Eds) Northern Development: Creating the Future Australia (Melbourne: ADC Forum), pp. 7–17. Davidson, W. (2007) Geographic Information System (GIS) dataset for the Australian Feedlot sector, Sydney. Accessed 02 March 2021. Available at http://www.mla.com.au/download/finalre ports?itemId=3442
de Freitas, C. R., & Grigorieva, E. A. (2015) A comprehensive catalogue and classification of human thermal climate indices, International Journal of Biometeorology, 59(1), pp. 109–120. doi:10.1007/s00484-014-0819-3
Department of Environment and Heritage Protection (2017a) Pathways to a climate resilient Queensland: Queensland Climate Adaptation Strategy 2017–2030, Brisbane. Available at https://www.qld.gov.au/__data/assets/pdf_file/0017/67301/qld-climate-adaptation-strategy. pdf
Department of Environment and Heritage Protection (2017b) Queensland climate adapatation strategy: Built environment and infrastructure sector adaption plan. Accessed 01 October 2021. Available at https://www.qld.gov.au/__data/assets/pdf_file/0037/68797/built-environmentinfrastructure-sector-adaption-plan.pdf
Department of Environment and Heritage Protection (2018) Queensland climate adapatation strategy: Human health and wellbeing adaption plan. Accessed 02 March 2021. Available at https://www.qld.gov.au/__data/assets/pdf_file/0022/64237/h-cap-qld.pdf
Department of Water and Environmental Regulation (2021) Western Australian Climate Policy: A plan to position Western Australia for a prosperous and resilient low-carbon future. Accessed 06 September 2021. Available at https://www.wa.gov.au/sites/default/files/2020-11/Western_ Australian_Climate_Policy.pdf
Fedele, G., Donatti, C. I., Harvey, C. A., Hannah, L., & Hole, D. G. (2019) Transformative adaptation to climate change for sustainable social-ecological systems, Environmental Science & Policy, 101, pp. 116–125. doi:10.1016/j.envsci.2019.07.001
Field, C. B., Barros, V. R., Mastrandrea, M. D., Mach, K. J., Abdrabo, M.-K., Adger, N., . . . Barnett, J. (2014) Summary for policymakers Climate Change 2014: Impacts, Adaptation, and Vulnerability. Part A: Global and Sectoral Aspects. Contribution of Working Group II to the Fifth Assessment Report of the Intergovernmental Panel on Climate Change, Cambridge University Press, pp. 1–32.
Freestone, R. (2014) Progress in Australian planning history: Traditions, themes and transformations, Progress in Planning, 91, pp. 1–29. doi:10.1016/j.progress.2013.03.005.
Füssel, H.-M. (2007) Vulnerability: A generally applicable conceptual framework for climate change research, Global Environmental Change, 17(2), pp. 155–167. doi:10.1016/j. gloenvcha.2006.05.002.
Gardes, T., Schoetter, R., Hidalgo, J., Long, N., Marquès, E., & Masson, V. (2020) Statistical prediction of the nocturnal urban heat island intensity based on urban morphology and geographical factors-An investigation based on numerical model results for a large ensemble of French cities, Science of the Total Environment, 737, pp. 139253. doi:10.1016/j. scitotenv.2020.139253.
Gubernot, D. M., Anderson, G. B., & Hunting, K. L. (2014) The epidemiology of occupational heat exposure in the United States: A review of the literature and assessment of research needs in a changing climate, International Journal of Biometeorology, 58(8), pp. 1779–1788. doi:10.1007/ s00484-013-0752-x
Haddad, S., Paolini, R., Synnefa, A., & Santamouris, M. (2018) Mitigation of urban overheating in three Australian cities (Darwin, Alice Springs and Western Sydney). Paper presented at the Engaging Architectural Science: Meeting the Challenges of Higher Density, Melbourne.
Harding, S. (2014) Leveraging northern Australials tropical and east Asian connections to build a modern economy, in: A. Roux, M. Faubell, & D. McGauchie (Eds) Northern Development: Creating the Future Australia (Melbourne: ADC Forum), pp. 190–197.
Hyndman, B. (2015) The heat in northern Australian classrooms could impede learning, July 8. Accessed 13 February 2018. Available at http://theconversation.com/the-heat-in-northernaustralian-classrooms-could-impede-learning-44592
Intergovernmental Panel on Climate Change (2014) Climate change 2014: Synthesis report. Contribution of working groups I, II and III to the fifth assessment report of the intergovernmental panel on climate change, Geneva. Available at https://www.ipcc.ch/site/assets/uploads/2018/05/ SYR_AR5_FINAL_full_wcover.pdf
International Organization for Standardization (2017) ISO 7243:2017: Ergonomics of the thermal environment. Assessment of heat stress using the WBGT (wet bulb globe temperature) index, International Organization for Standardization
Jia, A. Y., Gilbert, D., & Rowlinson, S. (2018) Seasonal patterns of thermal stress in the work environment of construction workers in a megaproject in Australia. Paper presented at the International Conference of the Architectural Science Association, Melbourne.
Kaesehagen, D. (2014) Settlement patterns: Effective models for managing a growing population in northern Australia, in: A. Roux, M. Faubell, & D. McGauchie (Eds) Northern Development: Creating the Future Australia (Melbourne: ADC Forum), pp. 304–307.
Kates, R. W., Travis, W. R., & Wilbanks, T. J. (2012) Transformational adaptation when incremental adaptations to climate change are insufficient, Proceedings of the National Academy of Sciences, 109(19), pp. 7156–7161. doi:10.1073/pnas.1115521109
Lenzholzer, S. (2015) Weather in the City: How Design Shapes the Urban Climate (Rotterdam: nai010).
Liljegren, J. C., Carhart, R. A., Lawday, P., Tschopp, S., & Sharp, R. (2008) Modeling the wet bulb globe temperature using standard meteorological measurements, Journal of Occupational and Environmental Hygiene, 5(10), pp. 645–655. doi:10.1080/15459620802310770.
Loughnan, M., Nicholls, N., & Tapper, N. J. (2012) Mapping heat health risks in urban areas, International Journal of Population Research, 2012, pp. 1–13. doi:10.1155/2012/518687.
Newth, D., & Gunasekera, D. (2018) Projected changes in wet-bulb globe temperature under alternative climate scenarios, Atmosphere, 9(5), pp. 187. doi:10.3390/atmos9050187
Northern Territory Department of Lands and Planning (2012) Greater Darwin Plan. Accessed 22 October 2020. Available at https://planinc.org.au/images/stories/pdfs/Greater_Darwin_Plan_ Full_1.3.2012.pdf
Office of Climate Change (2020) Northern territory climate change response: Towards 2050. Accessed 22 October 2020. Available at https://denr.nt.gov.au/__data/assets/pdf_file/0005/ 904775/northern-territory-climate-change-response-towards-2050.pdf
Pal, J. S., & Eltahir, E. A. B. (2016) Future temperature in southwest Asia projected to exceed a threshold for human adaptability, Nature Climate Change, 6(2), pp. 197–200. doi:10.1038/ nclimate2833.
Pilbara Regional Planning Committee (2012) Pilbara planning and infrastructure framework. Accessed 22 October 2020. Available at https://www.dplh.wa.gov.au/getmedia/235e34de-4724445d-8855-42166e482462/PIL_Pilbara_Planning_and_Infrastructure_Framework_Summary Queensland Government (2009) Far North Queensland regional plan 2009–2031: Planning for a stronger, more liveable and sustainable community. Accessed 02 March 2021. Available at http://www.dlgrma.qld.gov.au/resources/plan/far-north-queensland/fnq-regional-plan-200931.pdf
Rahman, M. A., Stratopoulos, L. M., Moser-Reischl, A., Zölch, T., Häberle, K.-H., Rötzer, T., Pauleit, S., & Pauleit, S. (2020) Traits of trees for cooling urban heat islands: A meta-analysis, Building and Environment, 170, pp. 106606. doi:10.1016/j.buildenv.2019.106606
Robb, A. (2014) The Australian Government’s long-term vision for developing Australia’s north, in: A. Roux, M. Faubell, & D. McGauchie (Eds) Northern Development: Creating the Future Australia (Melbourne: ADC Forum), pp. 173–178.
Robinson, S. (2020) The Ministry for the Future (London: Orbit).
Roux, A., Faubell, M., & McGauchie, D. (2014) Northern Development: Creating the Future Australia (Melbourne: ADC Forum).
Sharifi, E., Sivam, A., & Boland, J. (2016) Resilience to heat in public space: A case study of Adelaide, South Australia, Journal of Environmental Planning and Management, 59(10), pp. 1833–1854. doi:10.1080/09640568.2015.1091294.
Sherwood, S. C., & Huber, M. (2010) An adaptability limit to climate change due to heat stress, Proceedings of the National Academy of Sciences, 107(21), pp. 9552–9555. doi:10.1073/ pnas.0913352107.
Shire of Broome (2020) Broome growth plan: Strategy and action program. Accessed 22 October 2020. Available at https://kdc.wa.gov.au/wp-content/uploads/2020/01/broome-growth-planstrategy-and-action-program-Shire-Doc.pdf
Shooshtarian, S., Lam, C. K. C., & Kenawy, I. (2020) Outdoor thermal comfort assessment: A review on thermal comfort research in Australia, Building and Environment, 177, pp. 106917. doi:10.1016/j.buildenv.2020.106917.
Steadman, R. G. (1979) The assessment of sultriness. Part I: A temperature-humidity index based on human physiology and clothing science, Journal of Applied Meteorology, 18(7), pp. 861–873. doi:10.1175/1520-0450(1979)018<0861:TAOSPI>2.0.CO;2.
Stull, R. (2011) Wet-bulb temperature from relative humidity and air temperature, Journal of Applied Meteorology and Climatology, 50(11), pp. 2267–2269. doi:10.1175/jamc-d-11-0143.1.
Swaffield, S., & Deming, E. (2011) Research strategies in landscape architecture: Mapping the terrain, Journal of Landscape Architecture, 1(Spring), 2011, pp. 34–45.
Townsville City Council (2017) Planning together for Townsville’s future. Accessed 02 March 2021. Available at https://www.cabinet.qld.gov.au/documents/2011/apr/draft%20townsville% 20futures%20plan/Attachments/Townsville%20Futures%20Plan.pdf
Turek-Hankins, L. L., De Perez, E. C., Scarpa, G., Ruiz-Diaz, R., Shwerdtle, P. N., Joe, E. T., . . . Singh, C. (2021) Climate change adaptation to extreme heat: A global systematic review of implemented action, Oxford Open Climate Change, 1. doi:10.1093/oxfclm/kgab005
Turton, S. (2015). Climate: The elephant in the room for developing northern Australia. Accessed 09 October 2020. Available at https://theconversation.com/climate-the-elephant-in-the-roomfor-developing-northern-australia-43528
University of Southampton Energy & Climate Change (2020) Climate change world weather file generator for world-wide weather data – CCWorldWeatherGen. Accessed 02 March 2021. Available at https://energy.soton.ac.uk/climate-change-world-weather-file-generator-for-world -wide-weather-data-ccworldweathergen/
Weeramanthri, T. S., Bowman F, J. S., Bangor-Jones, R., & Law, C. (2020) Climate health WA inquiry: Final report Perth (WA).
Zander, K. K., Botzen, W. J., Oppermann, E., Kjellstrom, T., & Garnett, S. T. (2015) Heat stress causes substantial labour productivity loss in Australia, Nature Climate Change, 5(7), pp. 647–651. doi:10.1038/nclimate2623.
Zhao, Q., Lian, Z., & Lai, D. (2021) Thermal comfort models and their developments: A review, Energy and Built Environment, 2(1), pp. 21–33. doi:10.1016/j.enbenv.2020.05.007