

Planning Practice & Research
ISSN: (Print) (Online) Journal homepage: https://www.tandfonline.com/loi/cppr20
Wet-bulb Temperature and Sea-level Rise in the United Arab Emirates – Planning Responses
Julian Bolleter, Bill Grace, Paula Hooper & Sarah Foster
To cite this article: Julian Bolleter, Bill Grace, Paula Hooper & Sarah Foster (2021): Wet-bulb Temperature and Sea-level Rise in the United Arab Emirates – Planning Responses, Planning Practice & Research, DOI: 10.1080/02697459.2020.1859199
To link to this article: https://doi.org/10.1080/02697459.2020.1859199

Published online: 21 Mar 2021.

Submit your article to this journal


View related articles
View Crossmark data
Full Terms & Conditions of access and use can be found at https://www.tandfonline.com/action/journalInformation?journalCode=cppr20

PLANNING PRACTICE & RESEARCH
https://doi.org/10.1080/02697459.2020.1859199

Wet-bulb Temperature and Sea-level Rise in the United Arab Emirates – Planning Responses
Julian Bolleter a , Bill Gracea, Paula Hoopera and Sarah Fosterb
aThe Australian Urban Design Research Centre, University of Western Australia, Perth, Australia; bCentre for Urban Research, RMIT University, Melbourne, Australia
ABSTRACT
Increased heat stress and sea-level rise, associated with climate change could threaten the viability of some cities by the latter part of this century. This paper reviews urban development patterns in Dubai and Abu Dhabi, in the United Arab Emirates, and concludes these cities are highly vulnerable to elevated wet-bulb temperatures and sea level rise. This is predominantly due to the focus of development along the Gulf coastline, where these issues are concentrated. In response, this paper ventures regional planning responses to adapt to these threats through decentralising populations to inland areas.
Introduction
ARTICLE HISTORY
Received 17 October 2019
Accepted 30 November 2020
KEYWORDS
Heat stress; Wet-bulb temperature; sea-level rise; Arabian Gulf; climate change; Dubai; Abu Dhabi; climate responsive design
The ranking of cities concerning assessments of their liveability has become commonplace, and there is growing interest in creating evidence-based indicators of liveability to measure progress towards enhancing health and wellbeing outcomes (Badland et al., 2014). While such rankings rate a city’s liveability, based on factors such as housing affordability, healthcare, education and public transport, they rarely countenance climatic change threats to liveability. However, in this century, there are reasons to think, that in a largely unmitigated climate change situation, some cities will not be liveable or viable due to extreme wet-bulb temperature (WBT) (Pal & Eltahir, 2016), and sea-level rise (SLR).
This paper focusses on the United Arab Emirates (UAE), a nation likely to be impacted, and particularly the UAE’s two largest cities, Dubai (population 3.3 million) and Abu Dhabi (population 1.45 million) (Garland, 2010; Pal & Eltahir, 2016). Firstly, the paper backgrounds the threats to cities posed by elevated WBTs and SLR. In the subsequent section, we describe the methods which underpin a climate focussed suitability analysis of the UAE. In the results section, we consider the suitability analysis results and the degree to which current planning for urban expansion in Dubai and Abu Dhabi expose future urban populations to the adverse effects of increased WBT and SLR. In the subsequent discussion section, we consider what adaptive measures UAE policymakers could undertake to adapt settlement patterns to climate change. Finally, we conclude with the implications of the study and possible future research.
CONTACT Julian Bolleter julian.bolleter@uwa.edu.au
Wet-bulb Temperature Extremes
Extreme dry-bulb temperatures (DBT) intensify the risk of heat illness and can also aggravate pre-existing illnesses such as heart and kidney disease (Bi et al., 2011). The early decades of the twenty-first century have already seen a plethora of extreme heat events, including the European heatwave in 2003 which killed tens of thousands of people (Coffel, Horton, & De Sherbinin, 2017). The young and elderly are particularly vulnerable to extreme heat events. However, the effects of the most lethal heatwaves are due to not only elevated temperatures but also the effects of humidity. Extremely high heat combined with elevated humidity diminishes the human body’s ability to regulate temperature by sweating. Hence, hot and humid conditions can be more dangerous than equivalently hot dry conditions (Steadman, 1979).
A human body may be able to adapt to extremes of DBT through perspiration and related evaporative cooling, provided that the WBT – a measure of temperature and humidity – remains below 35°C (Pal & Eltahir, 2016). Currently, peak heat stress, measured by the WBT, is similar across varied climates and generally does not exceed 31°C. However, any exceedance of 35°C WBT for several hours increases the risk of inducing ‘hyperthermia in humans as dissipation of metabolic heat becomes impossible’ (Sherwood & Huber, 2010, p. 9552) and the ‘body may become unable to maintain a stable core temperature’ (Coffel et al., 2017, p. 2). Considering both of these factors, researchers estimate that the survivability limit for peak sixhourly WBT is probably close to 35°C for humans (Sherwood & Huber, 2010). While 35°C has not occurred for prolonged periods to date, it will likely occur later this century with predicted temperatures associated with the higher end of the emission scenarios identified by the Intergovernmental Panel on Climate Change, calling the habitability of some regions, and cities, into question (Sherwood & Huber, 2010).
Global temperatures and humidity are projected to rise significantly in the coming century, but all countries are not impacted equally. Coffel et al. project that by 2080 exposure to extreme levels of WBT will increase in frequency by a factor of 100 to 250 in the tropics and parts of the mid-latitudes (Coffel et al., 2017). Restricting global average surface temperature rises to less than 2°C relative to 1986–2005 (Representative Concentration Pathway 4.51) will likely avoid WBT exceedance of 35°C. However, if emissions continue to increase unabated (RCP 8.5) global average surface temperatures are projected to rise by 3.2–5.4°C by 2100 relative to 1986–2005 leading to annual exposure to WBTs of 35°C potentially exceeding 1 million person-days by 2070–2080. Under RCP 4.5 and 8.5, Coffel et al. (Coffel et al., 2017) project WBT exceedance of 32°C potentially reaching 60 million person-days and 600 million person-days, respectively, by 2070–2080. In the absence of significant mitigation or adaptation, the related mortality and morbidity are projected to surge in a warming climate, particularly in vulnerable groups such as the elderly, children, those with chronic diseases, and workers performing physical labour in non-cooled environments (Bi et al., 2011). The seriousness of the threat of WBT to cities may be surprising as the climatic consequences of climate change that cities are urged to consider, and policymakers
have focused on, have been heat waves and rainfall changes, and extreme storm events (McDonald, 2015).
Sea Level Rise
Seas have risen by more than 20 cm since 1880, transforming coastal environments around the world. Since 1993, sea level has been rising faster still, at about 3 mm per year (Church & Clark, 2016). The two most significant contributions to the rise are thermal expansion of the oceans, and the loss of ice from glaciers both which are products of climate change (Church & Clark, 2016). This SLR poses significant risks to coastlines – through flooding, permanent inundation and erosion. At the same time, coastal populations are projected to increase in the next decades, compounding this situation (Hurlimann et al., 2014).
Given historic greenhouse gas emissions alone, seas will now continue to rise for centuries. Moreover, with sustained growth in emissions, the Intergovernmental Panel on Climate Change has projected a rise of up to 7 m by 2500 but also cautioned that the available ice-sheet models might underestimate Antarctica’s future contribution (Church & Clark, 2016). As such, coastal cities will need to adapt as this situation plays out over the coming decades and centuries.
Impacts of Increased WBT and SLR in the Gulf
Not surprisingly, researchers’ project that WBT will have particularly pronounced effects in areas that currently experience a coincidence of elevated temperatures and humidity. One such area is coastal regions of the Arabian Gulf, where increased WBTs ‘result from the interaction of hot desert air masses with onshore moisture advection from warm bodies of water’ (Coffel et al., 2017, p. 7). Pal and Eltahir have projected using regional climate model simulations, that extremes of WBT adjacent to the Arabian Gulf will likely ‘approach and exceed this critical threshold’ of 32°C WBT under the high emissions scenario (RCP 8.5) (Pal & Eltahir, 2016, p. 197). As they unequivocally state:
Our results expose a specific regional hotspot where climate change, in the absence of significant mitigation, is likely to severely impact human habitability in the future (Pal & Eltahir, 2016, p. 197).
These hotspots include major cities such as Abu Dhabi, Doha and Dubai (Pal & Eltahir, 2016). While the areas surrounding the Arabian Gulf are mostly desert, coastal areas experience very high relative and absolute humidity because the surface albedo of the Gulf is low, resulting in strong absorption of solar radiation and increased heat flux. Moreover, the extreme evaporation rate intensifies water vapour (Pal & Eltahir, 2016). Broader regions adjacent to this body of water are susceptible to high WBTs because sea breezes transport air inland (Pal & Eltahir, 2016).
SLR will also drastically affect the Arabian Gulf because significant cities such as Abu Dhabi and Dubai are located on the predominantly sandy shorelines of the southern Gulf which will be particularly prone to coastal erosion as SLR occurs (Garland, 2010, p. 135). Policymakers have situated these cities on typically low-lying land that often was originally salt marshes or sabkha, an Arabic word which translates to ‘mud’ (Mandaville, 1998, pp. 202,203). As such, there is little freeboard to accommodate incremental SLR.

Figure 1. The UAE, and its two largest cities Abu Dhabi and Dubai are located on the UAE’s eastern coastal fringe. The Al Hajar Mountains are on the western border with Oman, and the Empty Quarter to the southwest. Base imagery courtesy of Esri, Digital Globe, Geo Eye, Earthstar Geographics, CNES/ Airbus DS, USDA, USGS AeroGrid, IGN, and the GIS User Community.
Study Context: Dubai and Abu Dhabi Urban Form and Current Planning
We have chosen The United Arab Emirates (UAE) (Fig 1) – and its two largest cities Abu Dhabi and Dubai as case studies for investigation because they could be drastically affected by the twin impacts of climate change, extreme WBTs and SLR.
Dubai’s urban developers work loosely within the framework of Dubai’s overarching spatial plan which seeks to ‘mitigate any environmental degradation’ and promote ‘safe and healthy urban environments’ (Government of Dubai, 2012, p. 1). The plan concentrates urban development within an approximately 20-kilometre band along the coast, with areas inland designated ‘non-urban areas’ for conservation, farming and aquifer zones (Government of Dubai, 2012, p. 3). The bulk of the city’s fabric is arranged as a narrow band along the coast and serviced by a network of east-west running arterial roads (Fig 2).
Much of Dubai’s recent high profile development has been delivered in the form of offshore islands (Bolleter, 2019). The most notable projects are the Palm Jumeirah, the World development, and the now-cancelled Universe development2 (Fig 3). Developers have ‘written’ these projects into the shallow, warm waters of The Gulf to achieve maximum legibility for their logo (Al Maktoum, 2012, p. 155). Between 2003 and 2011 extensive changes in the coastline appeared as 6,800 hectares were added to the total land area of the Dubai Emirate by offshore reclamation projects (Nassar et al., 2014, p. 56). The largest of the Palm developments was to be the vast Palm Deira – proposed

Figure 2. Dubai’s urban form is concentrated within an approximately 20-kilometre band along the coast. Base imagery courtesy of Esri, Digital Globe, Geo Eye, Earthstar Geographics, CNES/Airbus DS, USDA, USGS, AeroGrid, IGN, and the GIS User Community.

Figure 3. In 2008, developers Nakheel delivered the first of the offshore projects, the Palm Jumeirah. Since then, developers Nakheel has lined the Palm’s trunk with apartment buildings, resorts, malls, restaurants and marinas, and it’s radiating fronds with luxurious villas. Image courtesy of Expeditioner/Shutterstock.com.
to be bigger than Manhattan Island and house over a million people (Caton & Ardalan, 2010, p. 46).3
The majority of Abu Dhabi’s urban footprint is spread across an archipelago of islands and policymakers have planned for this situation to continue (Abu Dhabi Urban Planning Council, 2007). (Fig 4). Such planning includes a new iconic precinct, the Cultural District, the ‘Palace Row,’ and the Embassy District on Saadiyat Island, (Abu Dhabi Urban Planning Council, 2007, p. 11). The Central Business District, which is currently scattered over several islands, is to be concentrated on Al Maryah Island (Fig 5). The remainder of Al Mina, Al Reem and Saadiyat Islands are proposed to constitute mostly medium density residential districts (Abu Dhabi Urban Planning Council, 2007). The highest density in the city is to be located at the tip of Abu Dhabi island (Abu Dhabi Urban Planning Council, 2007). Immediately north of Abu Dhabi island is Lulu Island, a 400-hectare human-made island, which will have significant tourist development and housing (Abu Dhabi Urban Planning Council, 2007).
The coastal focus and associated risks of Abu Dhabi and Dubai’s planning, we believe contradicts national strategic planning for the UAE, encapsulated in the ‘UAE Vision 2021: United in ambition and determination’ document which declares that the UAE Federation will ‘safeguard Emiratis from harm in the event of large-scale environmental emergencies’ (Government of the United Arab Emirates, 2010, p. 25).

Figure 4. Abu Dhabi’s urban footprint is spread across an archipelago of islands. Base imagery courtesy of Esri, Digital Globe, Geo Eye, Earthstar Geographics, CNES/Airbus DS, USDA, USGS AeroGrid, IGN, and the GIS User Community.

Figure 5. Abu Dhabi’s urban footprint is mostly concentrated on Abu Dhabi Island (1) but is also spreading to Saadiyat Island (2), Al Maryah Island (3), Al Reem Island (4), Al Mina (5) and Lulu Island (6). Base imagery courtesy of Esri, Digital Globe, Geo Eye, Earthstar Geographics, CNES/Airbus DS, USDA, USGS, AeroGrid, IGN, and the GIS User Community.
Methods
With this tension in mind, we conducted a climate focussed suitability analysis to explore the research question:
To what degree could the current planning for urban expansion in Dubai and Abu Dhabi expose future urban populations to the adverse effects of increased WBTs and SLR?
Over the last forty years or so, suitability analyses have sought to answer such questions of how settlement patterns should respond to environmental health hazards, amongst other factors. Indeed, suitability analyses have increasingly become integral components of urban, regional and environmental planning activities (Pettit et al., 2015, p. 94; Zhang et al., 2013, p. 741).4
To evaluate appropriateness for urbanisation, suitability analyses, often focus on a selection of four principal themes. The first is natural factors, e.g. slope (Wang, Jin, Lu, & Lu, 2017), the second infrastructure-related factors, e.g. roads (Kumar & Shaikh, 2013), the third is economic-related factors, e.g. employment (Wang et al., 2017), the fourth, climatic factors such as temperature, humidity, rainfall (Wang et al., 2017) and in some cases prevailing winds (Lotfi, Habibi, & Koohsari, 2009).
While all of these factors are important, we have focussed principally on SLR and WBT related factors given the explicit climate change focus of this paper, and the
substantial threats they pose to Dubai and Abu Dhabi. We have also included DBT and rainfall as part of the UAE scale analysis, as extreme DBTs, in particular, are an issue in some inland locations. By focussing on these climatic factors, we do not mean to downplay other non-climate related considerations, they are, however, beyond this necessarily brief paper.
Factor mapping
We have based our SLR factor mapping on peer-reviewed projections that indicate for non-sheltered sites in the Abu Dhabi region, water height by 2099 could hypothetically reach over nine metres above present datum during extreme events. This figure includes storm and tide surges 3 (4m) and expected significant waves (4m)4 (Garland, 2010). It also includes up to 1.81 metres SLR under RCP 8.5 (Irani, Massah Bavani, Bohluly, & Alizadeh Katak Lahijani, 2017). It should be noted, that under RCP2.6, 4.5 and 6.0 SLR in the Arabian Gulf will be 0.84, 0.86 and 0.89 metres, respectively5 (Irani et al., 2017). We utilised elevation data to generate our mapping to illustrate the vulnerability of Dubai and Abu Dhabi to SLR (Fig 6, 7). This mapping reveals water level increases, at the scale above, could substantially consume the existing urban footprints of Dubai and Abu Dhabi.
We have based our WBT factor mapping on typical current summer 6 WBT weather charts produced by Meteologix (2019). (Fig 8). We concede that it is difficult to project the exact degree to which areas of WBT extend inland as moisture in the air from the Gulf

6. Dubai SLR vulnerability factor map. This map shows the elevation (in metres) of the Dubai coastline. Projected water level increases could substantially consume the existing urban footprint of Dubai.
Figure

Figure 7. Abu Dhabi SLR vulnerability factor map. This map shows the elevation (in metres) of the Abu Dhabi coastline. Projected water level increases could substantially consume the existing urban footprint of Abu Dhabi.

Figure 8. UAE WBT factor map. The connection between increased WBTs and proximity to the Gulf can be observed in current UAE charts of WBT that reveal high WBTs occurring along the coast in the summer months. This WBT map is from the 8th August 2019 at 1 pm and is typical of the patterns from the summer period. Map by the authors, data courtesy of Meteologix.
diffuses laterally due to winds, which can be coastal, or land breezes. Nonetheless, the Meteologix charts consistently show coastal areas to be subject to elevated WBTs (2019), a situation which is likely to compound over time.
While WBT extremes are concentrated along the coast, UAE charts reveal elevated DBTs (in the summer months) tend to occur inland and in the southwest of the UAE, coinciding with the broad expanse of the Rub al Khali desert, a vast and inhospitable expanse covering much of the Arabian Peninsula7 (Meteologix, 2019) (Fig 9). Nonetheless, Dubai and Abu Dhabi also experience consistently high DBTs in the summer months.
We have also included factor mapping showing average annual rainfall (mm) which shows a steady decrease from the Al Hajar mountains in the northeast to the Rub Al Khali desert in the southwest (National Water Center, 2020) (Fig 10). Rainfall remains a significant climate factor in potentially mitigating extreme DBTs because rainfall can be collected for the irrigation of green spaces. Several studies have demonstrated the cooling effect of large-scale green structures on their surroundings (Coutts, Tapper, Beringer, Loughnan, & Demuzere, 2013; Lenzholzer, 2015). This is, in part, through evapotranspiration from vegetation, a process that absorbs heat and reduces the air temperature (Coutts et al., 2013; Rahman et al., 2020).
Weighting the Suitability Factors
There is a relative consensus in the literature regarding suitability analyses that weighting of the suitability factors presents a ‘difficult problem’ as it ‘introduces subjectivity into the

Figure 9. UAE DBT factor map. The highest DBTs typically occur in the southwest of the UAE in the summer months. This DBT map is from the 13th August 2019 at 1 pm and is typical of the patterns from the summer period. Map by the authors, data courtesy of Meteologix.
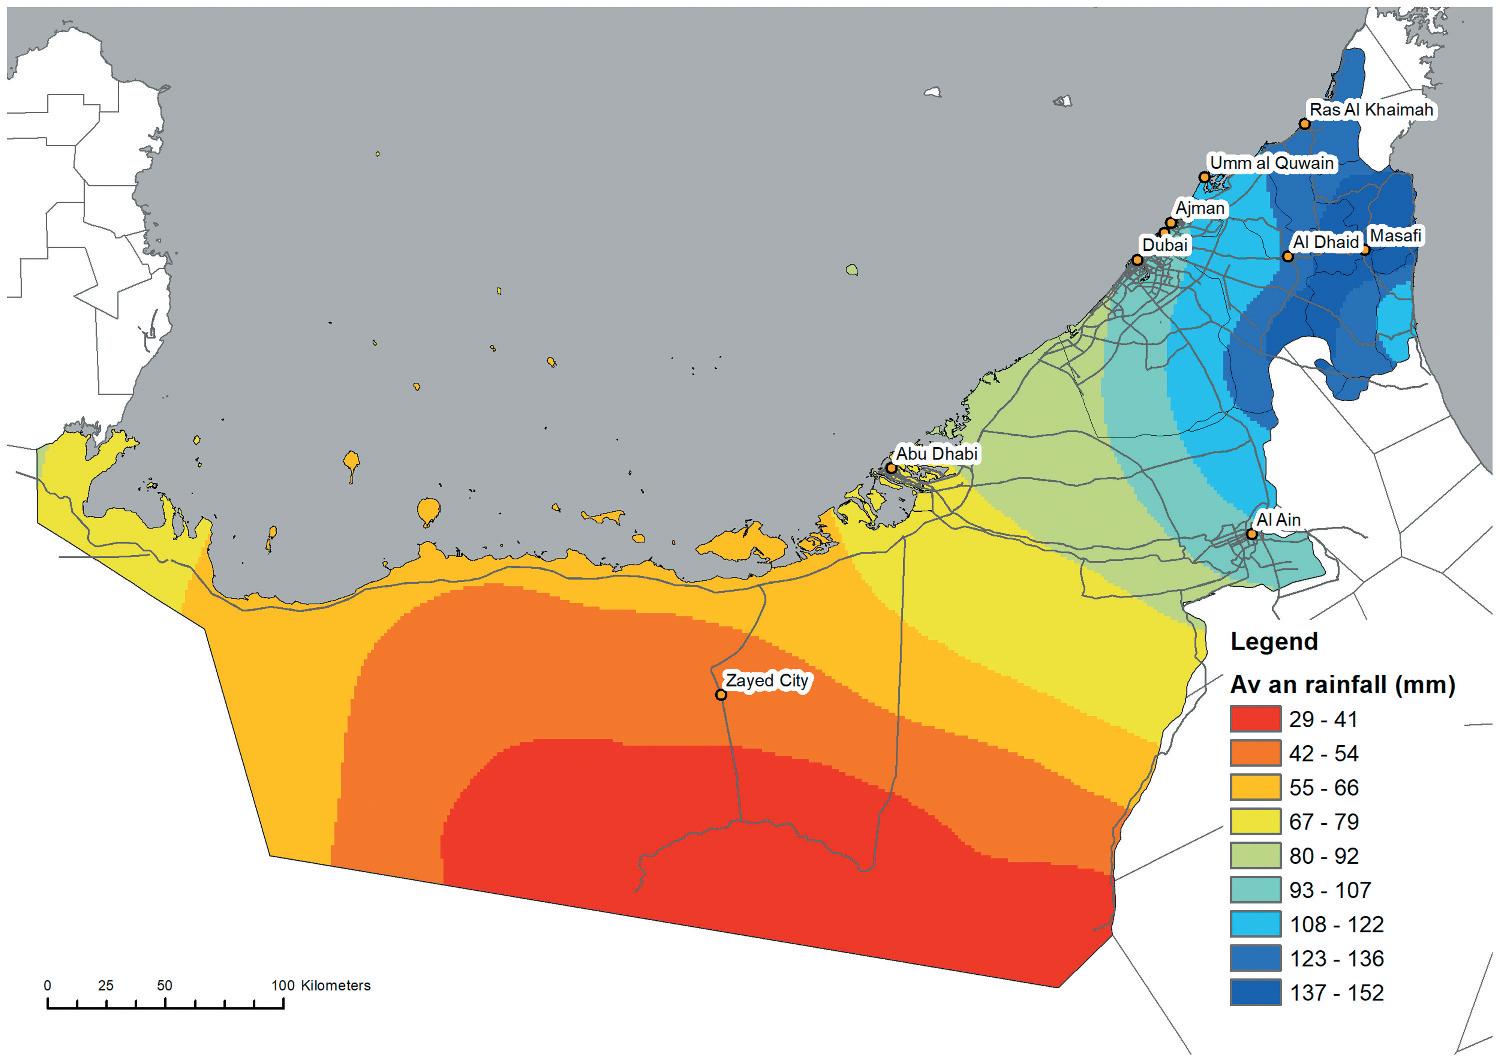
Figure 10. UAE annual rainfall factor map. The UAE’s rainfall decreases from the Al Hajar Mountains (in the north-east) to the Empty Quarter to the southwest. Map by the authors from data by the National Water Center.
decision-making process since the weight is [often] assigned arbitrarily to each set of factors’ (Chen, 2016, p. 50). This can lead to considerable variations in results depending on the ‘interests of the experts who are assigning the weights’ (Flitter et al., 2013, p. 22). As a result of such challenges, ‘there remains still no widely accepted method for weight determination’ (Zhang et al., 2013, p. 742) and ‘the most frequently raised problem is how to establish weights for a set of activities according to importance’ (Al-Shalabi et al., 2006, p. 5).
To tackle this problem, we have employed the Analytic Hierarchy Process (AHP) which is a ‘theory of measurement through pairwise comparisons’ to derive priority scales (Saaty, 2008, p. 83). In constructing a set of pairwise comparison matrices, we used M-Macbeth software8 (Bana e Costa et al., 2020) to compare all possible pairs of suitability factors (e.g. WBT and SLR) and to weight relative importance of one criterion over another (Saaty, 2008, p. 85).
This process led to WBT receiving the highest weighting because of the potentially lethal effects of extreme WBTs and the breadth of area possibly affected (Pal & Eltahir, 2016). This was followed by DBT because of the threats high DBTs pose to health and wellbeing (Loughnan, Nicholls, & Tapper, 2012). Nonetheless, the risks of extreme DBTs can be, at least partly, obviated through climate-sensitive urban design (Coutts et al., 2013). SLR receiving the third highest weighting. While SLR poses serious threats to coastal development the effects are unlikely to be life threatening or sudden, and at least temporary measures can be undertaken to adapt to SLR (Grace & Thompson, 2020).
Rainfall received the lowest ranking not because it is insignificant, just because cities in the Arabian Gulf often rely extensively on desalination.
Computing the Results
With the factors and weightings in place, we converted the factors maps into a raster data environment, in Arcmap 10.5 at a resolution of 10 by 10 kilometres in ArcInfo Grid files. Since the input factors layers were in different numbering systems with different ranges, we reclassified them into a standard preference scale from 1 to 9, with 1 designating the lowest suitability and 9 the highest (Table 1).
While a WBT of 35 °C is potentially lethal (Coffel et al., 2017; Sherwood & Huber, 2010) we focus on a WBT of 30°C as a critical threshold. As such, we have reclassified areas of WBT above 30°C to have a low preference score of 1. We reclassified the SLR mapping to show areas 1m above current sea-level to have a low preference score of 1, while areas 9m+ above sea level to have a preference score of 9 as they are hypothetically above projected
Table 1. This table sets out the factors, classifications, preference scores and factor weightings we derived from the pairwise comparison process.
(Hijmans, Guarino, & Mathur, 2020)
(Meteologix, 2019)
(Meteologix, 2019)
Center, 2020)
extreme water levels (Garland, 2010, p. 143). We reclassified areas prone to extreme summer DBTs of above 44°C to have a low preference score of 1, and areas with typically milder DBTs of below 29.5°C to have a preference score of 9. Finally, we have reclassified areas with less than 41mm annual rainfall to have a low preference score of 1, whereas areas with comparatively high annual rainfall of 136mm (and above) to have a preference score of 9. Finally, we applied the algorithm of the weighted linear summation, which multiplies all grid cells of a layer by their weight.
Results
Our overall suitability analysis which combines both summer WBT and DBT, SLR and annual rainfall factors reveal that the UAE’s major coastal cities are highly vulnerable to extreme WBTs and SLR. Indeed the major coastal cities of Abu Dhabi and Dubai received a suitability score of only 4 (on a 9 point scale), and other coastal cities such as Ajman, Sharjah even less, with scores of 3 and 2 respectively. The poor suitability scores of these centres is due to their proximity to the shallow and warm waters of the Gulf, and as such elevated WBTs. They are also particularly vulnerable to SLR because of low lying, sandy shorelines, and, in Abu Dhabi and Dubai, extensive offshore development on natural or artificial islands. At the same time, inland cities to the east, such as Al Ain (the UAE capital) and Al Dhaid rated considerably better, with both scoring 6, because of reduced WBT and SLR risk as well as higher rainfall (Fig 11 and Table 2). Nonetheless, these centres do experience high DBTs and this has moderated their scores.

Figure 11. Our overall suitability analysis which combines both summer WBT and DBT, with SLR and annual rainfall factors reveal that the UAE’s coastal cities rate poorly, while inland cities and towns to the east, such as Al Ain and Al Dhaid rate considerably better.
Table 2. Suitability scores for the major urban centres in the UAE. The suitability score is out of nine with a score of one denoting very low suitability, five medium suitability and nine very high suitability. The median score is five, and this divides the rankings between areas broadly suitable or unsuitable for urbanisation over another.
Urban centre
Discussion
The results of our suitability analysis reveal that the UAE’s coastal cities of Dubai and Abu Dhabi are particularly vulnerable to the effects of WBT extremes and SLR. In contrast, interior centres such as Al Ain and Al Dhaid rate comparatively better. These findings have substantial implications for UAE regional planning exercises.
Readers should note the limitations of our study. Like all suitability analyses, ours relies on weightings which considerably affect the distribution of suitability scores. We accept that there remains a degree of subjectivity about such weightings and have proceeded with a method which at least makes decisions around weighting transparent. As Saaty (2008, p. 85) implores: ‘even when numbers are obtained from a standard scale, their interpretation is always, I repeat, always, subjective.’ Our research has also been limited by a lack of WBT and DBT mapping describing seasonal average maxima. As such, we have had to extrapolate from WBT and DBT patterns experienced on a particular day which is, to some degree, typical of the season.
With this noted, in the following sections we discuss the vulnerabilities of Dubai and Abu Dhabi to elevated WBTs and SLR. Subsequently, we consider what regional planning strategies UAE’s policymakers could develop to adapt to elevated WBTs and SLR. In particular, we consider the decentralisation of population to areas of the UAE that are less vulnerable. We carry out our discussion concerning the Dubai 2020 Urban Masterplan (Government of Dubai, 2012) and Plan Abu Dhabi 2030 (Abu Dhabi Urban Planning Council, 2007).
Sea-level Rise Vulnerabilities
SLR is particularly an issue in Dubai and Abu Dhabi, as the value of existing infrastructure constructed along sandy low-lying shorelines, and on natural and fabricated islands, is enormous. As Mohammad Raouf of The Gulf Research Centre warns, given the predicted SLR in the next century, Dubai’s new ‘artificial islands will disappear’ (Landais, 2007). A possible premonition of this is that the ferry company contracted to deliver visitors to The World development has recently sued the developer Nakheel,
claiming that the channels have begun to silt up and some islands have begun to sink (Day, 2015).
Fortification is generally the most accepted response to SLR. Such hard engineering solutions typically involve the controlled disruption of natural processes by using fabricated structures (Stephenson & Turner, 2013). Fortification responses to SLR typically take the form of sea walls and embankments (Kellett, Balston, & Western, 2014). While coastal fortification may be workable in short to medium term, fortification responses to SLR will likely be futile in the longer term (Kellett et al., 2014) given the projections that sea levels will still be rising in hundreds of years from now. Indeed, with continued growth in emissions, the Intergovernmental Panel on Climate Change has projected a rise of as much as 7m by 2500 – a figure which does not include storm and tide surges and significant waves (Church & Clark, 2016).
WBT Vulnerabilities
It may be tempting to think that urban policymakers in Abu Dhabi, Dubai and other UAE coastal cities could devise protections against the unprecedented WBT extremes such as the broad-scale adoption of air conditioning. While this may be possible for internal spaces or enclosed outdoor spaces such as stadia,9 it is not sustainable – from either an economic or energy perspective. The power requirements of dehumidification and air conditioning would surge; energy would become more expensive; power failures would become more commonplace and threatening to human health; and people would be virtually imprisoned in their homes (Sherwood & Huber, 2010). Moreover, the outdoor temperatures would surge due to the hot air, air-conditioning units channel into the environment – a phenomenon that commentators have already identified as an issue in Dubai (Khaishgi, 2018).
Abu Dhabi and Dubai, like all cities, rely on workers servicing daily life through outdoor manual employment. However, extensive frequencies of 32 °C WBT would make such outdoor activities dangerous, if not impossible and Abu Dhabi and Dubai virtually uninhabitable (Coffel et al., 2017). Unskilled migrant labourers, who already face dangerous working conditions, would be particularly vulnerable (Human Rights Watch, 2016). Indeed, according to official data, between 2005 and 2015, over 30,000 Indian workers died in The Gulf states, with death most commonly caused by stress, illhealth and extreme temperatures (Srivastava, 2017).
In summary, a substantial proportion of coastal urbanisation that developers are delivering in Dubai and Abu Dhabi could exacerbate the risks to urban populations of WBT events above 32°C and SLR. As such, current city planning (Abu Dhabi Urban Planning Council, 2007; Government of Dubai, 2012) is unlikely to deliver the ambition of the UAE government to ‘safeguard Emiratis from harm in the event of large-scale natural or man-made environmental emergencies’ and ‘protect citizens from environmental health hazards’ (Government of the United Arab Emirates, 2010, p. 25). Given this situation, the following section proposes long term planning solutions for population decentralisation to inland, higher elevation areas, less affected by increased WBTs and SLR.
Adaptive Strategies
The adaptive strategies we table in this section respond to the insubstantial ‘National Climate Change Plan of the United Arab Emirates 2017-2050’ which states that climate change will require ‘comprehensive, evidence-based adaptation planning at the national level’ (UAE Ministry of Climate Change & Environment, 2017, p. 25). While this paper only focuses on a limited number of factors, it does speak to the national scale planning to which the UAE government aspires – but struggles to deliver in their planning.
Regional Population Decentralisation
While the overarching planning documents for Dubai and Abu Dhabi encompass their respective emirates (not just the cities themselves) neither plan identifies a need for the development of regional cities. Instead, the plans propose to continue to concentrate population growth in the two burgeoning coastal cities. However, given that Dubai’s population could more than double to 5 million by 2030 (Zaatari, 2017) and Abu Dhabi’s increase four-fold in the same time-frame (Abu Dhabi Urban Planning Council, 2007), policymakers should consider whether to refocus urban development away from the coast to interior regions. While these areas are slightly hotter in summer, 10 the air is considerably drier, and thus WBTs reached will not be as extreme (Pal & Eltahir, 2016). Indeed, in typical current summer conditions, the inland city of Al Ain can have WBTs between 2 and 6°C lower than the coastal city of Abu Dhabi (Meteologix, 2019). Moreover, even projections of 7m SLR by 2500 (Church & Clark, 2016) will pose few issues for such inland centres because of their elevation.
This shift in development focus could find expression in boosted regional centres in interior environments, connected by efficient transport infrastructure to Dubai and Abu Dhabi – which are likely to continue to thrive, in some form, as tourist and business destinations at least in the coming decades (Fig 12). These boosted regional centres could, in time, be connected to the coastal cities by a high-speed rail network, a realignment of the current proposed coastal link between Abu Dhabi and Dubai (Abu Dhabi Urban Planning Council, 2007).
Possible Boosted Urban Centres
It should be noted, that there are many factors which determine the success of decentralisation exercises, for example the availability of existing infrastructure or employment in regional centres (Bolleter, 2018), however these are beyond the scope of this necessarily brief paper. Nonetheless, policymakers could plan for the growth of inland oasis centres (at the foothills of the Hajar Mountains), such as Al Ain, located in the Emirate of Abu Dhabi (population 770,000), or Al Dhaid located in the Emirate of Sharjah (population 20,165). Both of these centres could potentially accommodate influxes of population from Abu Dhabi and Dubai as WBTs and SLR increasingly impact these cities.
Al Ain has the largest existing population of the UAE’s non-coastal cities and substantial existing infrastructure. The increased elevation of Al Ain (300m above sea level), could also be beneficial as at increased altitudes, the atmosphere becomes thinner, which decreases the total amount of water vapour the atmosphere can hold, thus

Figure 12. Policymakers could consider boosting regional centres in interior environments connected by efficient transport infrastructure to Dubai and Abu Dhabi, such as high-speed rail (HSR). Two such centres could be Al Ain, the capital of the UAE located in the Emirate of Abu Dhabi, and Al Dhaid located in the Emirate of Sharjah, both oasis towns at the foothills of the Hajar Mountains.
ameliorating WBT extremes. Al Dhaid is capital of the Central Region of the Emirate of Sharjah, and is an oasis town with extensive palm plantations irrigated with water channelled from the adjacent Hajar Mountains. Like Al Ain, it benefits from increased elevation of 115m above sea level. Al Dhaid also offers reasonable access to urban centres in the Hajar Mountains, such as Masafi and Hatta, which experience a comparatively benign climate; however, their footprints are constrained by dramatic topography and rocky outcrops.
Despite the challenges to population decentralisation from dominant primate cities (Bolleter, 2018), disruption in the form of extreme WBT events could shift this dynamic quickly and dramatically. Through proactive planning for decentralisation, policymakers in Dubai and Abu Dhabi could reduce the harmful effects of such events when they do occur. Of course, this would require policymakers to also revisit the existing planning of Al Ain (Abu Dhabi Planning Council, 2014) and Al Dhaid to introduce further capacity for absorbing population growth.
Readers should note, such inland centres under RCP8.5 will experience extreme DBTs in the summer months (Pal & Eltahir, 2016), and will be uncomfortable and possibly hazardous to human health. Nonetheless, the summer DBT of Al Ain and Al Dhaid will be generally survivable, if the centres are appropriately designed. This will necessitate measures such as the shading of the public domain, the funnelling of cooling wind through street networks, the adoption of advanced building materials to reduce the
absorption of heat, and the adoption of solar control systems (Haddad, Paolini, Synnefa, & Santamouris, 2018).
Implications
The implications of this study extend to the broader Arabian Gulf region, and beyond. Indeed, Dubai, in particular, is having a disproportionate influence on urban development patterns around the world. While the West often view Dubai as being a ‘fantasy world in the desert’ (Davis 2007, p. 63), its significance in the broader context cannot be underestimated. Many rulers, administrators and developers in the region view Dubai’s model of coastal urban development as an example that they can replicate. In the Gulf region, the Dubai model is spreading to Saudi Arabia, Bahrain, Kuwait and Qatar, all of which will confront elevated WBT and SLR issues to varying degrees. As such, policymakers should understand the vulnerabilities of such coastal development models.
Future Research
In this paper we have not discussed efforts the UAE government could make to mitigate climate change, through reducing greenhouse gas emissions. Nonetheless, this is muchneeded research. Indeed, the country’s capital, Abu Dhabi, has very high emissions, equating to 39.1 tonnes per capita which is more than triple the average of Organisation for Economic Co-operation and Development nations (Khaishgi, 2018).
Secondly, the impacts of extreme DBTs and WBTs depend on exposure and vulnerability, and are contingent on many factors such as age, pre-existing health conditions, acclimatisation, the capacity to adapt, availability of air conditioning, emergency response in heatwaves, and economic and socio-cultural factors that affect behaviour (Loughnan et al., 2012). Also, research has shown that adaptation strategies such as early warning of heatwaves, public education on the dangers of extreme heat, and social checkups on vulnerable people can substantially reduce the number of deaths in extreme heat events (Coffel et al., 2017, p. 7). These are all important initiatives that researchers could consider for application in the UAE context.
Conclusions
There is much uncertainty about the degree to which humanity can, and is willing to, reduce its greenhouse gas emissions (Coffel et al., 2017). Nonetheless, if we continue on a trajectory to between RCP 4.5 and 8.5, then the UAE’s policymakers should proactively respond at the regional planning and urban design scales. This response should entail a review of Abu Dhabi and Dubai’s spatial plans (Abu Dhabi Urban Planning Council, 2007; Government of Dubai, 2012) so to avoid an over-concentration of an expanding population along the coast and yield the ‘safe and healthy urban environments’ the Dubai government (for instance) aspires to (Government of Dubai, 2012, p. 1). Concomitantly policymakers should pre-emptively plan for population decentralisation to interior centres designed to be climate responsive.
The time for such proactive planning will be soon. The problem is that the bulk of contemporary development in Dubai and Abu Dhabi will be with us as the climate crisis
unfolds. Moreover, there is strong path dependency associated with ongoing development in the UAE’s major cities, and redirecting development efforts elsewhere will take years – even under Dubai’s ‘benevolent dictatorship’ (Davis, 2007). Nonetheless, policymakers cannot ignore this challenge.
Given global warming trends and projections, most plausible climatic scenarios still require us to prepare for a planetary climate far more brutal than the benign Holocene world that human beings have inhabited in recent millennia (Wiseman, 2016). Policymakers in the UAE are not adequately responding to projections for increased WBTs and SLR, which could become credible threats to Dubai’s and Abu Dhabi’s liveability, and indeed viability in the future. As UAE Founder Sheikh Zayed bin Sultan al Nahyan (1918-2004) rightly warned:
Future generations will be living in a world that is very different from that to which we are accustomed. It is essential that we prepare ourselves and our children for that new world (In UAE Ministry of Climate Change & Environment, 2017, p. 3)
We have directed this paper towards this end.
Notes
1. Representative Concentration Pathways (RCPs) were used in the Fifth Assessment Report of the Intergovernmental Panel on Climate Change (IPCC) in 2014 as a basis for the report’s findings. RCP 4.5 relates to a medium effort to curb emissions, 8.5 to a low effort to curb emissions (CoastAdapt, 2015).
2. Only part of this proposed gargantuan island is now being constructed.
3. A long duration Shamal with winds blowing consistently from the north west can result in a positive storm surge of up to 4 m at Jazirat Ghagha, a near-shore recording station some 200 km west of Abu Dhabi city (Garland, 2010, p. 140).
4. Modelling suggests that it is reasonable to assume that there will be eight occurrences of 4 m waves along the Abu Dhabi shoreline before 2099 (Garland, 2010, p. 141).
5. These assessments are based on modelling undertaken since the most recent IPCC Assessment Report 5 in 2014.
6. The summer months in Dubai are May, June, July August, September.
7. We recognize that one constituent element of WBT is DBT however have included both in our suitability analysis because distributions of WBT and DBT are quite different across the UAE.
8. The AHP and Macbeth approaches are slightly different. AHP uses 9-point fundamental scales (ratio scale), whereas MACBTEH uses six semantic scale (ordinal scale). In addition, for calculating weight and scale, MACBETH uses liner programing method, whereas AHP uses eigenvalue method (Rietkötter, 2014).
9. The Gulf state of Qatar is air-conditioning outdoor stadiums that will be used for the 2022 soccer World Cup.
10. The average maximum temperature for Al Ain in August is 44.6°C (National Centre for Meteorology, 2017b) while in Abu Dhabi it is 42.9°C (National Centre for Meteorology, 2017a).
Disclosure statement
No potential conflict of interest was reported by the author(s).
ORCID
Julian Bolleter http://orcid.org/0000-0002-1514-2007
References
Abu Dhabi Planning Council. (2014) Plan Al Ain 2030: Urban structure framework plan. Available at https://faculty.uaeu.ac.ae/abintouq/GEO_Fall_2015/PlanAlAin2030.pdf
Abu Dhabi Urban Planning Council. (2007) Plan Abu Dhabi 2030. Abu Dhabi Available at https:// www.ecouncil.ae/PublicationsEn/plan-abu-dhabi-full-version-EN.pdf
Al Maktoum, M. B. R. (2012) My Vision: Challenges in the Race for Excellence (Dubai: Motivate Publishing).
Al-Shalabi, M. A., Mansor, S. B., Ahmed, N. B., & Shiriff, R. (2006) GIS based multicriteria approaches to housing site suitability assessment. Paper presented at the XXIII FIG congress, shaping the change, Munich, Germany, October.
Badland, H., Whitzman, C., Lowe, M., Davern, M., Aye, L., Butterworth, I., Giles-Corti, B. (2014) Urban liveability: Emerging lessons from Australia for exploring the potential for indicators to measure the social determinants of health, Social Science & Medicine, 111, pp. 64–73. doi:10.1016/j.socscimed.2014.04.003
Bana e Costa, C., De Corte, J.-M., & Vansnick, J.-C. (2020) M-Macbeth: A Multiple Criteria Decision Support System (Lisbon).
Bi, P., Williams, S., Loughnan, M., Lloyd, G., Hansen, A., Kjellstrom, T., Dear, K., & Saniotis, A. (2011) The effects of extreme heat on human mortality and morbidity in Australia: Implications for public health, Asia Pacific Journal of Public Health, 23(2_suppl), pp. 27S–36S. doi:10.1177/ 1010539510391644
Bolleter, J. (2009). Para-Scape: Landscape Architecture in Dubai. Journal of Landscape Architecture, Spring 09(4),28–55.
Bolleter, J. (2018). The ghost cities of Australia: A Survey of New City Proposals and Their Lessons for Australia’s 21st Century Development. London: Springer.
Bolleter, J. (2019). Desert paradises: Surveying the landscapes of Dubai’s urban model. London: Routledge.
Caton, S., & Ardalan, N. (2010) New Arab Urbanism, the Challenge to Sustainability and Culture in the Gulf (Cambridge, MA: Harvard Kennedy School).
Chen, S. (2016) Land-use suitability analysis for urban development in Regional Victoria: A case study of Bendigo, Journal of Geography and Regional Planning, 9(4), pp. 47. doi:10.5897/ JGRP2015.0535
Church, J., & Clark, P. (2016) What does the science really say about sea-level rise? Available at https://theconversation.com/what-does-the-science-really-say-about-sea-level-rise-56807
Church, J., Clark, P., Cazenave, A., Gregory, J., Jevrejeva, S., Levermann, A., Nunn, P. (2013) Sea level change. Available at http://drs.nio.org/drs/handle/2264/4605 CoastAdapt. (2015) What are the RCPs? Available at https://coastadapt.com.au/sites/default/files/ infographics/15-117-NCCARFINFOGRAPHICS-01-UPLOADED-WEB%2827Feb%29.pdf
Coffel, E., et al. (2017) Temperature and humidity based projections of a rapid rise in global heat stress exposure during the 21st century. Environmental Research, 13(014001), pp. 3–9.
Criado, M., Martínez-Graña, A., Santos-Francés, F., Veleda, S., & Zazo, C. (2017) Multi-criteria analyses of urban planning for city expansion: A case study of Zamora, Spain, Sustainability, 9 (10), pp. 1850. doi:10.3390/su9101850
Davis, M. (2006) Fear and money in Dubai, New Left Review, 41, pp. 47–68. Day, C. (2015) State of the world, LA+, Pleasure, 02, pp. 90–91.
Department of Infrastructure Transport Regional Development and Local Government. (2010) A profile of high-speed railways. Canberra Available at https://www.bitre.gov.au/publications/ 2010/other_001
Esri. (2020) How weighted overlay works. Available at https://desktop.arcgis.com/en/arcmap/10.3/ tools/spatial-analyst-toolbox/how-weighted-overlay-works.htm
Fleming, B. (2015) Towards a Mega Regional Future: Analysing Progress, Assessing Priorities in the US Mega Region Project (Megaregions: Globalization’s New Urban Form).
Flitter, H., Laube, P., Luscher, P., Rogers, S., & Hagi, S. (2013) Suitability analysis. Available at http://www.gitta.info
Garland, G. (2010) Rising sea level and long term sustainability of near-shore islands of the United Arab Emirates: An approach to establishing setback lines for Abu Dhabi, Transactions on Ecology and the Environment, 130, pp. 135–146.
Government of Dubai. (2012) Dubai 2020 Urban Masterplan. Dubai Available at https:// d3nnd088b6efuy.cloudfront.net/wp-content/uploads/2020/03/Dubai2020-broshureA4english24.4.2012-2.pdf
Government of the United Arab Emirates. (2010) Vision 2021: United in ambition and determination. Abu Dhabi Available at http://fgccc.org/wp-content/uploads/2016/08/UAE_ Vision_2021.pdf
Grace, R., Kinghorn, R., & Thakur, P. (2016) Urban form and function in the autonomous era. Paper presented at the Australasian Transport Research Forum 2016, Melbourne.
Hanahan, J. (2010) A demand for water, Al Manakh- Gulf Cont’d, 25(2), pp. 286–289.
Hegazy, I. R., & Moustafa, W. S. (2013) Toward revitalization of new towns in Egypt case study: Sixth of October, International Journal of Sustainable Built Environment, 2(1), pp. 10–18. doi:10.1016/j.ijsbe.2013.07.002.
Henderson, J. V. (1982) The impact of government policies on urban concentration, Journal of Urban Economics, 12(3), pp. 280–303. doi:10.1016/0094-1190(82)90019-5.
Hijmans, R., Guarino, L., & Mathur, P. (2020) Free spatial data. Available at http://www.diva-gis. org/gdata
Human Rights Watch. (2016) United Arab Emirates: events of 2016. Available at https://www.hrw. org/world-report/2016/country-chapters/united-arab-emirates
Hurlimann, A., Barnett, J., Fincher, R., Osbaldiston, N., Mortreux, C., & Graham, S. (2014) Urban planning and sustainable adaptation to sea-level rise, Landscape and Urban Planning, 126, pp. 84–93. doi:10.1016/j.landurbplan.2013.12.013.
Kellett, J., Balston, J., & Western, M. (2014) Sea-level rise and planning: Retrospect and prospect, Australian Planner, 51(3), pp. 203–211. doi:10.1080/07293682.2013.808681.
Khaishgi, A. (2018) Freezing inside UAE’s high rise buildings while temperatures soar outside. Available at http://www.ipsnews.net/2018/09/freezing-inside-uaes-high-rise-buildingstemperatures-soar-outside/
Kumar, M., & Shaikh, V. R. (2013) Site suitability analysis for urban development using GIS based multicriteria evaluation technique, Journal of the Indian Society of Remote Sensing, 41(2), pp. 417–424. doi:10.1007/s12524-012-0221-8.
Landais, E. (2007) Climate change ‘Will Hit coastlines soon. Available at http://archive.gulfnews. com/articles/07/03/05/10108903.html
Liu, R., Zhang, K., Zhang, Z., & Borthwick, A. G. (2014) Land-use suitability analysis for urban development in Beijing, Journal of Environmental Management, 145, pp. 170–179. doi:10.1016/j. jenvman.2014.06.020.
Lotfi, S., Habibi, K., & Koohsari, M. J. (2009) An analysis of urban land development using multi criteria decision model and geographical information system (a case study of Babolsar city). American Journal of Environmental Sciences, 5(1), 87–93.
Loughnan, M., Nicholls, N., & Tapper, N. J. (2012) Mapping heat health risks in urban areas, International Journal of Population Research, 2012, pp. 1–12. doi:10.1155/2012/518687
Mandaville, J. (1998) Vegetation of the Sands, in: S. Ghazanfar & M. Fisher Eds Vegetation of the Arabian Peninsula (The Netherlands: Kulwer Academic Press).
McDonald, R. (2015) Conservation for Cities: How to Plan and Build Natural Infrastructure (Washington: Island Press).
Meteologix. (2019) Observations. Available at https://meteologix.com
Nassar, A. K., Blackburn, G. A., & Whyatt, J. D. (2014) Developing the desert: The pace and process of urban growth in Dubai, Computers, Environment and Urban Systems, 45, pp. 50–62. doi:10.1016/j.compenvurbsys.2014.02.005
National Water Center. (2020) Maps. Available at https://www.uaeu.ac.ae/en/dvcrgs/research/ centers/nwc/maps.shtml
Open Street Map. (2019) Open street map data extracts. Available at https://download.geofabrik. de/index.html
Pal, J. S., & Eltahir, E. A. B. (2016) Future temperature in southwest Asia projected to exceed a threshold for human adaptability, Nature Climate Change, 6(2), pp. 197–200. doi:10.1038/ nclimate2833.
Pettit, C. J., Klosterman, R. E., Delaney, P., Whitehead, A. L., Kujala, H., Bromage, A., & NinoRuiz, M. (2015) The online what if? Planning support system: A land suitability application in Western Australia, Applied Spatial Analysis and Policy, 8(2), pp. 93–112. doi:10.1007/s12061015-9133-7
Raupach, M., McMichael, A., Alford, K., Fulton, E., Finnigan, J., Grigg, N., . . . Walker, B. (2012) Living scenarios for Australia as an adaptive system, in: M. Raupach, A. McMichael, J. Finnigan, L. Manderson, & B. Walker Eds Negotiating Our Future: Living Scenarios for Australia to 2050, pp. pp. 1–53 (Canberra: Australian Academy of Science).
Rietkötter, L. F. B. (2014) Ending the War in Multi-criteria Decision Analysis: Taking the Best from Two Worlds: The Development and Evaluation of Guidelines for the Use of MACBETH in Multi-criteria Group Decision Making for the Assessment of New Medical Products (Enschede: University of Twente).
Saaty, T. L. (2008) Decision making with the analytic hierarchy process, International Journal of Services Sciences, 1(1), pp. 83–98. doi:10.1504/IJSSCI.2008.017590.
Sherwood, S. C., & Huber, M. (2010) An adaptability limit to climate change due to heat stress, Proceedings of the National Academy of Sciences, 107(21), pp. 9552–9555. doi:10.1073/ pnas.0913352107.
Srivastava, R. (2017) Death brings home reality of Indian workers’ life in Gulf. Available at https:// www.reuters.com/article/us-india-migration-death/death-brings-home-reality-of-indianworkers-life-in-gulf-idUSKBN1CZ034
Steadman, R. G. (1979) The assessment of sultriness. Part I: A temperature-humidity index based on human physiology and clothing science, Journal of Applied Meteorology, 18(7), pp. 861–873. doi:10.1175/1520-0450(1979)018<0861:TAOSPI>2.0.CO;2.
Stephenson & Turner (2013) From Resistance to Resilience: A New Paradigm of Coastal Cities (New Zealand: Stephenson & Turner).
Swaffield, S., & Deming, E. (2010) Landscape Architecture Research (New Jersey: Wiley).
UAE Ministry of Climate Change & Environment. (2017) National climate change plan of the United Arab Emirates 2017–2050. Dubai Available at https://u.ae/en/about-the-uae/strategiesinitiatives-and-awards/federal-governments-strategies-and-plans/national-climate-changeplan-of-the-uae
Wang, Y., Jin, C., Lu, M., & Lu, Y. (2017) Assessing the suitability of regional human settlements environment from a different preferences perspective: A case study of Zhejiang Province, China, Habitat International, 70, pp. 1–12. doi:10.1016/j.habitatint.2017.09.010.
Weller, R. (2009) Boomtown 2050 (Perth: University of Western Australia Press).
Wennersten, J. R., & Robbins, D. (2017) Rising Tides: Climate Refugees in the Twenty-first Century (Bloomington: Indiana University Press).
Wiseman, J. (2016) Accommodating new perspectives: Facing a harsh climate future with honesty and courage, Griffith REVIEW, 52, pp. 86.
Zaatari, S. (2017). Dubai Population to Double by 2027? Available at https://gulfnews.com/news/ uae/society/dubai-population-to-double-by-2027-1.2075117
Zhang, X., Fang, C., Wang, Z., & Ma, H. (2013) Urban construction land suitability evaluation based on improved multi-criteria evaluation based on GIS (MCE-GIS): Case of New Hefei City, China, Chinese Geographical Science, 23(6), pp. 740–753. doi:10.1007/s11769-013-0609-6