This report presents the development of the Urban Health Check Planning Support System (PSS) to use local empirical data to explore and predict relative health impacts associated with proposed urban design planning changes fromalternative new station precinct masterplan concepts.
Report Authors are Paula Hooper and Julian Bolleter.

Urban health check

Development of a planning support system to evaluate masterplan concepts for optimal health outcomes
© Australian Urban Design Research Centre 2024
Contents 1. Introduction 6 2. Methods 10 3. Results 22 4. Discussion 26 5. Conclusion 32 References 34
5
1. Introduction
One
of the biggest challenges is ensuring 0urbanisation facilitates physical and mental health...
6
Population projections estimate Australia’s population will double by 2066 (Australian Bureau of Statistics, 2017), with the majority expected to live in existing urban areas (Australian Bureau of Statistics, 2017). One of the biggest challenges is ensuring this urbanisation facilitates physical and mental health.
Walkability and health
The concept of walkability is concerned with the extent to which the built environment facilitates or hinders walking for the purposes of daily living and has represented an important area of enquiry in public health, planning and transportation fields. A large volume of research has focused on the walkability of the built environment and its relationship to a range of health promoting behaviours and outcomes (Baobeid et al., 2021). The application of Geographic Information Systems (GIS (Pearce et al., 2006) has enabled the creation of objective environmental exposure measures to evaluate the presence and quality of desirable features that create environments conducive to encouraging and enabling walking and positive health behaviours and outcomes (Butz and Torrey, 2006). Measures include walkability indices (residential density; connectivity; and land use mix), access (distance) and travel times to daily destinations, public transport infrastructure and parks; an the amount of green space.
Transit-oriented development as a walkable antidote to sprawl
While the health benefits of walkable neighbourhoods are well established,
the sprawling, low density, mostly mono-functional residential development that dominates Australian cities – and those in North America limit people’s ability to walk or cycle for their daily travel requirements (Duany et al., 2000), and has been associated with adverse health effects such as higher rates of obesity, high blood pressure, hypertension and chronic diseases (Ewing, 2008). Sprawl is also correlated with increased energy use, pollution, traffic congestion, loss of natural land and wildlife habitat (Ritchie et al., 2021). This form of continued suburban growth is unsustainable and unhealthy (Duany et al., 2000; Ewing et al., 2003; Ewing, 2008; Frumkin et al., 2004) and has spurred the pursuit of infill targets by Australian state governments to consolidate new development in existing urban areas and integration with public transportation that supports a mode shift away from private motor vehicles towards walking, cycling and public transport use (Stevenson et al., 2016).
The recurring spatial planning strategy that most notably integrates these goals is Transit-Oriented Development (TOD) – which aims to encourage public transport usage by placing residential and commercial areas within walking distance of mass transit hubs.Walkability is thus a core element of TOD and delivers many benefits including reduced car dependency and CO2 emissions, and higher public transport patronage. TODs also aim to improve access to local services and jobs – creating conditions conducive for increased active travel behaviours and associated physical, social and mental health benefits (Ibraeva et al., 2020), Science-
7
based geo-design and planning support systems for designing healthy cities.
Despite an expanding evidence base, and a growing acceptance of the need for health-enhancing planning interventions, planning professionals need clearer guidance on the features that are likely to produce optimal community-wide health impacts (Allender et al., 2009; Brownson and Jones, 2009; Giles-Corti et al., 2015; Oliver et al., 2014). Urban planning professionals need tools that provide evidence-based data to enable them to review the potential impacts of spatial plans and explore alternatives in an iterative and interactive way to make informed, evidence-based decisions (Batty, 2012; Miller, 2012; Corburn, 2004).
8
This sentiment is echoed in the United Nations’ New Urban Agenda (United Nations, 2017), which emphasises the need for increased data analysis in spatial planning (Pettit et al., 2018). The ‘smart cities’ movement has also created interest in data-driven urban modelling to support land use planning (Batty, 2012). It is thus timely to develop and test innovative evidencebased digital tools to support the translation and application of health evidence into planning practice, to positively influence the design of future healthy, liveable communities.
‘Geo-design’ infuses geography and urban planning with a blend of sciencebased information, analytical tools and scenario planning principles to help designers, planners and stakeholders make informed, evidence-based decisions (Miller, 2012). It is
characterised by the integration of geographic information systems (GIS), science methods and information communication technology tools to transform spatial data into relevant knowledge to test alternative design scenarios to inform democratic planning and spatial decision-making (Campagna, 2016).
Planning Support Systems (PSSs) are a family of computer-based instruments (geo-design tools) specifically designed to support planners in making complex decisions (Br¨ommelstroet, 2013). PSSs are designed to measure, spatially analyse, visualise and test or evaluate impacts that arise from alternative urban development design scenarios (Arciniegas and Janssen, 2012; Geertman and Stillwell, 2004, 2020; Pettit et al., 2020).
Health Impact Assessment (HIA) is a technique that allows those responsible for planning decisions to make informed choices in order to maximise the health benefits of any proposed development and tominimise any negative impacts (Wong, et al., 2011). PSSs that are designed to facilitate HIA are known as health impact decision support systems (Ulmer et al., 2015). A previous review Hooper et al., 2021) of PSS incorporating health-related metrics found these provide an opportunity to apply empirical evidence on built environment relationships with healthrelated outcomes to inform real-world land use and transportation planning decisions (Hooper et al., 2021). These tools allow the exploration and potential impact/s of different design concepts on selected health and well-being
outcomes (Boulange et al., 2017, 2018; Hooper et al., 2021; Schoner et al., 2018).
Planning for Metronet - Perth’s transformative blueprint for transitoriented development
Metronet is the State Government of Western Australia’s long-term blueprint to meet Perth’s future transport and planning needs and is the single largest investment in public transport in the state’s history. The project plans to install 72 km of new passenger rail lines, 18 new train stations and upgrades to existing stations. It will also be a catalyst for the transformation of over 5,000 hectares of land within the station precincts to create liveable communities with increased residential and employment opportunities, improved accessibility and attractiveness of public transport, and provision of a range of facilities and services (Government ofWestern Australia, 2021b). The station precinct masterplans will set the design vision and long-term planning of the areas around the stations. It is important these designs must create built environments that will enable optimal outcomes for the community for current and future generations.
The commencement of the development of masterplan concepts for the new Metronet station precinctsmotivated the development of theUrban Health Check PSS. The aim was to use local empirical data to explore and predict relative health impacts associated with urban design changes resulting from different
masterplan design concepts. This paper presents the development of the Urban Health Check PSS, the analytical models developed to provide locallyderived relationships between the built environment and spatial, environmental and health-related outcomes to: (a) benchmark the current built environment within a proposed station precinct; (b) measure potential built environmental changes of alternative future masterplan concepts for the station precinct; and to (c) explore the potential health impacts associated with changes to the built environment as a result of the different masterplan concepts.
9
2. Methods
The case study for this paper is the new Morley train station, to be built approximately 10 km northeast of the Perth CBD
10
Study area
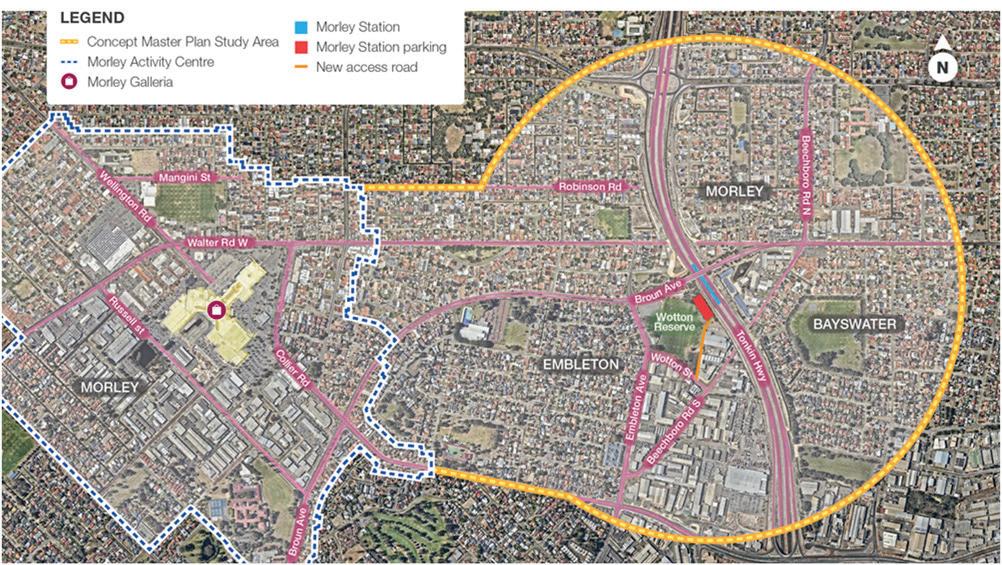
The Morley–Ellenbrook Line is the WA State Government’s signature Metronet project and is included on Infrastructure Australia’s ‘Infrastructure Priority List’ (Infrastructure Australia, 2021). Hooper et al. 2431 It will connect the previously unlinked north-eastern suburbs of Perth to the broader rail network through the installation of five new stations heading northeast from the Perth central business district (CBD), along 21 km of new rail line (Government ofWestern Australia, 2020) (Figure 1). The case study for this paper is the new Morley train station, to be built approximately 10 km northeast of the Perth CBD and 3 km from the Morley activity centre boundary, which contains Perth’s secondlargest commercial shopping centre (Figure 1). The station (Figure 2) will be in the central median of a major freeway. To the east and south of the station location is an area of light industry and to the west is a substantial park that accommodates a sports club.
Urban health check model development
Software selection.
The Urban Health Check was developed in GIS (ArcGIS v10.7, ESRI) using ComunityViz, a commercially available PSS software package (City Explained Inc, 2020) that works as an extension to ArcGIS. CommunityViz was selected due to its versatility in providing a suite of interactive tools which can be used to model, analyse and dynamically visualise spatial information, and its capacity to build custom models to operationalise
built environment variables and relate them to outcomes of interest (e.g. health impacts) (Boulange et al., 2018; Pelzer et al., 2015). It has previously been applied for building custom models to evaluate a health impact model that estimates the probability of walking for transport in response to planning for a new activity centre in Victoria, Australia (Boulange et al., 2018).
Indicator selection.
Two types of indicators were developed to evaluate the masterplan concepts for the station precinct: (1) built environment metrics and (2) health and environmental impact indicators. A limited suite of indicators were created to match the master planning phase for this study. Moreover, the rationale was to create a relatively simple model that would be transparent and understandable for communities and urban designers/ planners.
Built environment metrics.
A concept masterplan sets the general frame to guide an area’s long-term development. It outlines the vision, principles and macro-scale recommendations for proposed spatial layouts, movement networks and connections, land uses and open space provision and indicative residential densities and building heights (Government ofWestern Australia, 2021a). The built environment metrics provided quantitative spatial measures of the urban form within the station precinct and corresponded to features that were part of the master planning process.
A geodatabase was created in ArcGIS
11

Figure 1: The new Metronet rail lines and location of the Morley station case study area.
and loaded with the spatial layers, cropped to the boundary of the station precinct study area (Figure 1), required for calculating the built environment variables. Table 1 outlines the twenty built environment metrics programmed into the PSS. These were selected as they are widely recognised as having associations with walking for transport and positive physical, mental health and well-being outcomes (Hooper et al., 2020). They also represent five variables commonly used to model travel behaviour and walking (Cervero and Kockelman, 1997): (1) distance to public transport; (2) diversity of land uses; (3) destination accessibility; (4) density and housing mix; and (5) design.
CommunityViz was programmed so that automatic calculations generated the built environment metrics and displayed the indicators in dynamic charts on the interactive interface.
Health and environmental impact indicators.
Statistical formulae were programmed into CommunityViz using coefficients derived from local empirical research (Table 2) to model and estimate the potential health and environmental outcomes associated with the values of the built environmental metrics. This subsequently allowed us to test the potential impacts of the masterplan design scenarios and changes to the built environment against the following outcomes: (1) walking for transport, (2) mental health and (3) land surface temperature and cooling. The following sections detail the specific research evidence and statistical formulae underpinning the computation and coupling of the built environment metrics to each outcome.
13
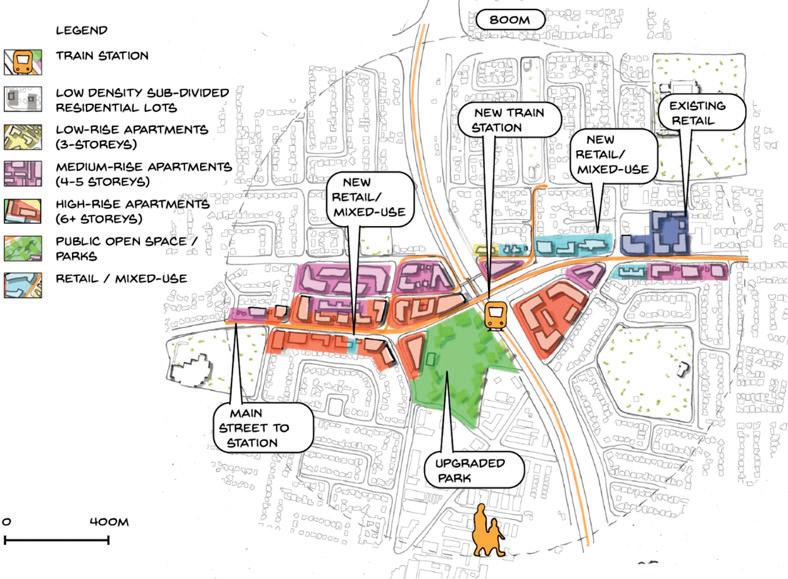
Figure 2: The Morley Metronet station precinct and study area (Source: Government of Western Australia, 2021a).
Walking for transport.
Earlier work from the RESIDE project has estimated the relationships between features of the built environment and a range of health-supportive behaviours and well-being outcomes for participants living across metropolitan Perth (Hooper et al., 2020) – including walking for transport. Regression coefficients from fully-adjusted models (that accounted for demographics and known covariates of the outcome variables such as age, gender, education and income) were identified for associations with undertaking walking for transport (i.e. one or more trips) in a usual week, and the built environment metrics (Table 2). Then, the following algorithm was programmed into CommunityViz to estimate the probability that an individual undertakes (any) walking for transport that takes in the values for each built
environment spatial indicator multiplied by the corresponding coefficients where P(y = 1) is the probability of the dependent variable y taking on the value 1 (y = 1), if a participant undertakes at least one or more walking for transport trips; xk (k = 1, 2, ..., p) are the independent variables relating to the built environment and sociodemographic variables; a is the constant and bk (k = 1, 2, ..., p) is the estimated regression coefficients. In this model, the effect of each built environment variable (xk) is ‘weighted’ by its regression coefficient (bk) to measure the probability that the dependent variable y taking on the value. The formula indicates that adults living in a neighbourhood a variety of destinations and public open spaces, shorter distances to public transport Infrastructure and tree-covered streetscapes have greater odds of walking for transport.

14
Table 1: Urban Health Check built environment metrics.
Distance to public transport
1) Distance to train station
2) Access to a train station
3) Distance to a bus stop
4) Access to a bus stop
Destination accessibility and mix
5) Land use mix
6) Access to mixed use
7) Access to mixed use
Density and housing mix
8) Single dwellings
9) Grouped dwellings
10) Low-rise apartments
11) Medium-rise apartments
12) High-rise apartments
13) Total number of dwellings
14) Net residential density
15) Gross residential density
16) Area of public open space
17) Access to Public open space
18) Access to Public open space
19) POS grass area (km2)
Design – Tree canopy cover
20) Percentage tree canopy cover in POS
21) Percentage tree canopy cover in public realm/ roads
Average distance to the closest train station from all dwellings
Percentage of dwellings within 800m walk to a train station
Average distance to the closest bus stop from all dwellings
Percentage dwellings within 400m walk to a bus stop
Area of land devoted to ‘retail’, ‘industrial’ or ‘public open space’.
Average distance to the closest mixed-use destination/ land use/ precinct from all dwellings
Percentage of dwellings within 800m walk to a mixed-use destination/ land use/ precinct
Number of single residential dwelling units (area of land zoned single residential ÷ 666 m2)
Number of group residential dwelling units (area of land zoned group residential ÷ 300 m2)
Number of low-rise apartment dwelling units (area land zoned lowrise apartments ÷ 200 m2)
Number of medium-rise apartment dwelling units (area land zoned medium rise apartments÷120 m2)
Number of high-rise apartment dwelling units (area land zoned highrise apartments/ 80 m2)
The number of residential dwellings within the station precinct
Number of residential dwellings ÷ area of the residential land
Number of residential dwellings ÷ area of the station precinct
Sum (ha) of all POS within the station precinct
Average distance to the closest POS from all dwellings
Percentage of dwellings within the station precinct within 400m walk to a POS
Assume that 85% of the gross land area of each park is devoted to grass/turf
Average percentage of tree canopy cover within parks.
Average percentage of tree canopy cover within all road cadastre
15
The RESIDE study also identified associations between the quantity of parks and mental health (Wood et al., 2017). The number of parks was positively associated with positive mental health, where, for every additional park WEMWBS scores increased by 0.11 (p < 0.05). Additionally, with every additional hectare of parkland within 1.6 km of the home, WEMWBS increased by 0.07 (p < 0.05). The mean WEMWBS score for the RESIDE population was identified (BLINDED FOR REVIEW, 2020) and a formula programmed into CommunityViz to estimate the potential change to WEMWBS score (i.e. positive mental well-being benefit) with changes to the number and area of parks provided.
16
Urban heat island effects.
A recent study in Perth, identified coefficient estimates of the average cooling effect of different urban vegetation types (i.e. grass, shrubs and tree canopy) on land surface temperature (Duncan et al., 2019). The coefficient estimates indicated the effect on urban monthly average (daytime) land surface temperatures for a 1 km2 increase in grass (1.589°C) and tree canopy (10.080°C) (Duncan et al., 2019). These coefficients were programmed into a formula in CommunityViz to estimate the potential cooling impact with changes in tree canopy cover and the area of green open spaces (per km2) (Table 2). programmed into a formula in CommunityViz to estimate the potential cooling impact with changes in tree canopy cover and the area of green open spaces (per km2) (Table 2).
*Selected coefficients from multivariate models adjusted for demographics; Odds ratios were converted to coefficients by computing the logarithm of the odds ratio (=log(OR)); Source. aBLINDED FOR REVIEW (2020). bWood et al. (2017). cDuncan et al. (2019).
Mental health.
Built environmental variable/ indicator Outcome Coefficient % of residential lots within 800m of a train station Transport walking 0.0224*a % of residential lots within 400m of a bus stop Transport walking 0.0296*a % of residential lots within 400m of a retail destination
mixed land use Transport walking 0.0405*a Housing diversity Transport walking 0.0945*a Net residential dwelling density Transport walking 0.0668*a Tree density (number per km of road) Transport walking 0.017*a Area (Ha) of parks Mental health 0.007b Number of parks Mental health 0.11b 1 km2 increase in grass (i.e. park area) Cooling 1.589c 1 km2 increase in tree canopy cover Cooling 10.080c 10.080c
of
Table 2: Regression coefficients for walking for transport, mental health (WEMWBS) and land surface temperature used in the urban health check PSS model.
Design review – testing station precinct masterplan concepts
A spatial representation of the current built environment (i.e. baseline) within the station precinct area was constructed in ArcGIS and CommunityViz (Figure 3) using a cadastral parcel dataset and the local planning scheme for the area that identified the current land use classifications. The creation of new land-use scenarios reflecting the alternative masterplan concepts within the station precinct were modelled into the CommunityViz (ArcGIS) interface by editing the cadastral parcel polygon extents (i.e. cutting, adding, deleting and altering boundaries) and assigning alternative land uses using a paint tool of possible land uses classifications. Changes to the land use and respective spatial layers (and their attribute values), were then used as inputs to execute the models and formulae to compute the built environment metrics and potential walking for transport, mental health and cooling outcomes. Dynamic charts were programmed to display the computed values for all indicators that automatically updated when alternative masterplan concepts were modelled, and changes were made to the spatial layers.
The authors developed three propositional concept masterplans that were informed by government policies for urban consolidation (Department of Planning, 2018): (1) a traditional TOD; (2) A Green Oriented Development (GOD); and (3) a TOD Corridor (Table 3). A fourth ‘business as usual’ concept plan
was developed to reflect potential outcomes without the intervention of a masterplan for the site, with ‘background infill development through comparatively low-medium density through the subdivision of existing residential lots (Table 3). Two further concept masterplans were developed with the Metronet team: (1) a community concept, developed through a collaborative design workshop using physical, scaled interactive models, with the Community Working Group that captured their aspirations for the station precinct (Table 3); and (2) an initial draft concept masterplan developed by a planning consultant (Table 3). Each of the six concepts were modelled in the Urban Health Check. Using the CommunityViz report tool, summary results were generated to compare the different masterplan concepts.
17
Table 3: Station precinct masterplan concepts modelled and evaluated in the Urban Health Check PSS.
Master-plan concept
The TOD
Includes mixed used and medium to high rise residential density development immediately around the station and frames the existing soccer pitches with urban form.

The GOD
Correlates urban densification around upgraded parks within the station precinct. The densified park precincts are connected to the train station by upgraded streetscapes with significant street tree plantings.

18
Table 3: (Continued)
Master-plan concept
The TOD Corridor
Correlates urban densification with activated street precincts
Substantial medium to high-rise densification is located along an arterial road leading to the station – the predominant focus of existing commercial activity in the area.
The BAU
Low–medium density, dispersed, ‘background infill’ is enabled through the subdivision of existing residential lots targeted along the two main corridors (roads) leading to the new station. No other changes to land use are proposed within the station precinct.

19
Table 3: (Continued)
Master-plan concept
Community Co-designed Urban Village
Transformation of the industrial area to create a new urban village providing mixed use and employment opportunities supported by high-rise and medium-rise apartments.
Regenerating the drainage sump to create a useable park.
Greening the streets with additional tree canopy.
20

Initial Draft Concept Masterplan
Creation of a new urban ‘village’ in the industrial area with retail, mixed use and low-, mediumand high-rise apartments.
Converts an existing drainage sump into a useable park.
Increases tree canopy cover on the streets leading to the station.


Figure 3: The Urban Health Check PSS scenario development process and development in ArcGIS and CommunityViz.
21
3. Results
22
GOD concept masterplan performed best...
The
Table 4 outlines the results calculated by the Urban Health Check models, comparing the built environment metrics in the baseline scenario to the six masterplan concepts. All include the additional new train station, plus varied changes to the land uses and tree canopy cover within the station precinct. The addition of the new station significantly improved the accessibility to public transport for all residential dwellings – decreasing the average distance to a train station by 1.7 km and resulting in 17% of the residences being within an 800 m walking distance of the station. Under all masterplan concepts, the number of residential dwellings increased, but the type and distribution across the precinct varied. All concepts increased residential density by around 30%. Under the alternative concepts, medium and higher residential
apartments were introduced that increased the potential dwelling yield. The GOD and TOD scenarios intensified the residential development around the new station and on existing underutilised public open space and borrowing from the current industrial land, resulting in an increase >30% of new residential dwellings. Under the TOD Corridor scenario, the increased density was distributed along a main arterial route leading to the station. The land use mix changed under the various alternative concepts: the GOD concept increased the area of parks whilst the draft masterplan resulted in the highest mix of retail land.
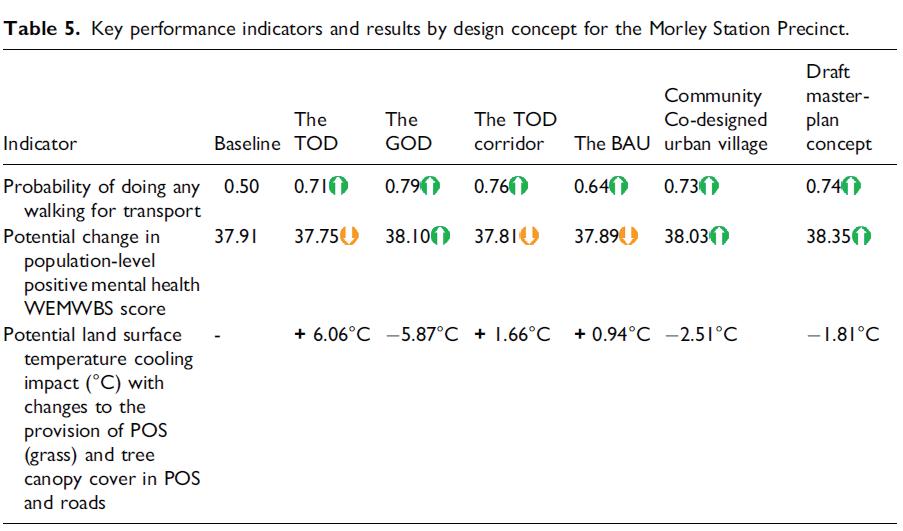
Table 5 presents the estimated values for the outcome indicators. Under all alternative masterplan scenarios, the probability that adults did some transport-walking trips increased above

23
the estimated 50% at baseline (Table 5). The BAU approach saw no cooling or mental health benefit. The GOD concept masterplan performed best, with the greatest probability of undertaking transport walking (79%) and increase in
population WEMWBS mental health scores and greatest potential cooling effects due to the greening through tree canopy and public open space.


25
4. Discussion
Health impact PSS have an important role in ensuring health is considered in the design and master planning phases of the new TOD station precincts.
26
The study developed and trialled a customised, evidence-based, health impact PSS to: (1) provide evidence on the connection between built environmental features and health outcomes and (2) evaluate the potential spatial, environmental and health impacts that might result from proposed new station precinct design concepts in Perth, Western Australia.
Like the health-impact PSS developed by Schooner et al. (2018) and Boulange et al. (2018), we have demonstrated that empirical models of the relationship between the built environment and health-related outcomes can be incorporated into PSSs. The health impact component of our PSS was underpinned by local rigorous empirical analyses and modelling to identify coefficients describing the strength of association between multiple built environmental features and walking for transport and mental health (BLINDED FOR REVIEW., 2020). This moves beyond conventional research translation approaches from the public health field through its ability to introduce an academic evidence-base to the world of planning professionals who lack evidence in practice (Allender et al., 2009; BLINDED FOR REVIEW., 2019; Russo et al., 2018) and to provide decision-makers with the opportunity to trial different scenarios of potential interventions and to assess them against health-oriented indicators. Moreover, because the Urban Health Check PSS was built on a customisable system (CommunityViz), the proposed methodology can be applied to construct further health-impact PSS applicable to other projects, contexts
and locations.
In this study, we demonstrated that installing a new train station would have considerable benefits on the local community’s access to public transport. The master-planned station precinct site was somewhat constrained in the land available within the station precinct that could realistically be altered. However, all scenarios, bar the ‘business as usual’ concept, offered noticeable improvements against the baseline scenario (and the BAU scenario), with the land use mix and residential density increased by converting current light industrial areas to a variety of residential dwellings, mixed-use and retail offerings and upgrading public open space. The alternative masterplan scenarios provided noticeable health (walking and mental health) and environmental (cooling) improvements over the current baseline environment and the ‘business as usual’ approach to background infill in the study area, typical of the growth/ infill pattern that might be expected to occur In absence of the Metronet station intervention (BLINDED FOR REVIEW). This situation suggests the underlying model, even with a basic set of built environmental factors, was sensitive enough to detect the relatively small changes and model differential potential walking outcomes as a result.
Walking for transport
Including a new train station, supermarket and providing proximate access to mixed-use areas also increased the probability of walking for transport by providing destinations to which residents could walk. Increasing access to destinations is well
27
established in the built environment literature to increase local walking (Hajna et al., 2015). Interestingly, the TOD scenario ranked comparatively lowly concerning walking for transport. This finding is in contrast to the literature claiming that compact urban form co-located with public transport nodes will reduce automobile dependency, encouraging walking. Perhaps this reflects the presence of the major freeway, which splits the TOD precinct in half. In contrast, the TOD Corridor scenario ranked highly for walkability, which resonates with the literature on corridor densification, which supports ‘local activities and pedestrian environment’ and provides a place ‘where cafes, small businesses, apartments, transit, parking and through traffic all mingle in a simple and timetested hierarchy’ (Calthorpe, 2011).
Finally, The BAU scenario unsurprisingly ranked lowest for walkability, a finding which resonates with the literature about ad-hoc, dispersed methods for achieving urban infill development, which is typically vehicular dependent (BLINDED FOR REVIEW, 2020).
Mental health. The inclusion of a modelled mental health outcome indicator in our Urban Health Check PSS is unique. The health outcomes included in previous health impact PSS have focussed on physical health behavioural outcomes (BLINDED FOR REVIEW, 2021). There was little variation between the schemes, reflecting the multitude of factors that influence mental health and well-being. Nonetheless, The GOD scenario, which correlates densification with POS, ranked highly.
This finding resonates with the literature, which highlights that the mental health benefits of access to nature (McDonald, 2015) are achieved through reducing exposure to stress factors and providing an environment for physiological and mental recovery that delivers coping resources to deal with life stressors. Conversely, the TOD, TOD corridor and BAU scenarios – none of which focus explicitly on green-space provision –ranked comparatively low. This situation reinforces the need to address urban densification in concert with greenspace provision.
Land surface temperature. The land surface temperature results, show substantial variation between the TOD and GOD concepts, reflecting the potential of urban design to heavily influence land surface temperatures (Coutts et al., 2016). The ability of the GOD scenario to reduce temperature significantly conforms to the literature that indicates high tree canopy cover in parks and streets can cool the microclimate and improve thermal comfort (Coutts et al., 2016). The role of trees in microclimatic regulation and thermal comfort is becoming particularly relevant in the context of increased temperatures in cities due to the combined effects of climate change and Urban Heat Island (Coutts et al., 2016; Kovats and Hajat, 2008).
The value of the Urban Health Check PSS and our contribution to the field. Previous reviews into the use of PSS in the planning profession have concluded that PSS research still has to prove its added value to planning practice (Vonk et al., 2005, 2007) through empirical
28
research that moves away from the experimental case studies that have predominated in the literature, towards real-world planning problems and applications (Russo et al., 2018; Vonk et al., 2005). This case study provides a unique example of a PSS being developed and deployed to a significant large-scale real-world public transport Infrastructure project to ensure proposed design concepts create built environments that will enable optimal outcomes for the community for future generations. Importantly, the Urban Health Check PSS was developed in collaboration with our industry partner to ensure it was suited to the planning tasks required. Furthermore, the spatial and health indicators were chosen to address the project’s specific design principles and community concerns, thus ensuring their relevance and fitness for purpose and providing decisionmakers with health evidence.
Limitations and future directions.
Whilst the health impact models were multivariate (accounting for changes in the combination of built environmental features included), a relatively limited set of built environmental variables were included. Our health impact model included macro-level urban design and built environmental features associated with walking and mental health outcomes such as land use mix, access to public transport, retail and other daily use destinations, green space, amount of green space, dwelling mix and residential densities that are considered at the master-planning phase.
In this case study, no interventions or alterations were made to the street
network. As such, a ‘connectivity’ metric was not included in the underlying walking for transport model. Whilst connectivity is an important component of ‘walkability’, the constrained nature of the station
precinct site, because of existing established infrastructure, meant the opportunity for making
significant changes to the road network was limited. Moreover, the focus of the master planning process was concerned with exploring alterations to the land uses within the site. Additionally, other micro-level design features relating to the detail and quality of the built environment that would enhance the walking experience and make walking an attractive, safe and desirable option (e.g. footpaths and streetlights) are considered as part of planning phases and therefore were not included In the current model.
The model used was derived from quantitative analyses that inevitably ignore the qualitative dimensions and subjective experiences of urban design outcomes and built environments. Other factors such as safety conditions and the quality of the environment are important factors determining the walkability of an area and have important impacts on the walking for transport behaviour modelled in a health impact PSS. For example, studies have shown that the quality of public open spaces might be more important for mental health benefits than the quantity of these spaces (Francis et al., 2012; McDonald, 2015). In addition, the decision of a resident to walk for
29
transport rests on several other qualitative factors (for example, how comfortable a female resident may feel walking home from the station after dark), which are to a large degree not able to be converted to a PSS algorithm.
The PSS modelled the likelihood of participating in any (at least one trip) of walking for transport in a usual week. A binary outcome measure was used as it utilised locally applicable data taken from the Perth-based RESIDE study - of which the majority of results were from logistic models for binary behavioural outcomes (such as any/none walking). Future models could be developed to estimate the number of walking trips or the duration (time) of walking.
30
Lastly, our Urban Health Check PSS and others (Boulange et al., 2018; Schoner et al., 2018) assess simulated alternative urban design scenarios. However, the actual built form that eventuates may be markedly different. Despite this, health impact PSS have an important role in ensuring health is considered in the design and master planning phases of the new TOD station precincts. More studies that can evaluate and demonstrate the benefits of health impact PSS in educating policymakers and planners of the importance and impact of their decisions on the health of the communities they are planning for is an essential first step to ensure policies and plans include the design features needed for optimal on-ground outcomes to be achieved.
31
5. Conclusion
The Urban Health Check
PSS can be easily adapted to be applied to the new Metronet (and other) station precincts to evaluate different master-planning concepts.
32
Ours is one of few projects to develop a robust, empirically based health impact PSS specifically developed to estimate baseline and custom scenario health impacts of planning and urban design concepts. This contribution supports previous work (Hooper et al., 2021; Schooner et al., 2018; Boulange et al., 2018), indicating that PSS represent a potential toolkit for the integration, translation and application of health evidence into urban design and planning practice.
Considering the potential health and environmental impacts is essential when significant land development and transportation interventions can have large-scale infrastructural, fiscal and community consequences. This project is significant in its timing as masterplans are currently being developed that will set the design vision and long-term planning and transformation of over 5,000 hectares of land within the Metronet station precincts. Our Urban Health Check PSS allows planners to test different station precinct masterplan concepts to ensure these will improve accessibility and attractiveness of public transport and create optimal health and environmental outcomes for the current and future community.
PSS may progress to becoming valuable tools for enhancing the role of health evidence and knowledge in planning, thereby enabling and facilitating more evidence-based planning and bridging the gap between public health research and planning policy and practice. This shift could stimulate strategic decisions and prioritise design solutions tailored to optimising communities’ health
outcomes and ultimately produce healthier on-ground communities. The Urban Health Check PSS can be easily adapted to be applied to the new Metronet (and other) station precincts to evaluate different master-planning concepts.
Acknowledgements
This study was undertaken in collaboration with the Metronet team at the Western Australian Department of Planning, Lands and Heritage. Dr Anthony Duckworth and Grace Oliver ran the collaborating co-design exercise with the community reference group.
33
References
Allender S, Cavill N, Parker M, et al (2009) `Tell us something we don’t already know or do!’ The response of planning and transport professionals to public health guidance on the built environment and physical activity. Journal of Public Health Policy 30: 102–116.
Arciniegas G and Janssen R (2012) Spatial decision support for collaborative land use planning workshops. Landscape and Urban Planning 107: 332–342.
Australian Bureau of Statistics (2017) 0 - Population Projections, Australia, 2017. 3222. (base) - 2066. Available at: https://www.abs.gov.au/AUSSTATS/abs@.nsf/Lo okup/3222.0Main+Features12017% 20(base)%20-%202066?OpenDocument.
Baobeid A, Koç M and Al-Ghamdi SG (2021)Walkability and its relationships with health, sustainability, and livability: elements of physical environment and evaluation frameworks. Frontiers in Built Environment 7: 2297–3362.
Batty M (2012) Building a science of cities. Cities 29: S9–S16.
Boulange C, Pettit C and Giles-Corti B (2017) The walkability planning support system: an evidence-based tool to design healthy communities. In: Lecture Notes in Geoinformation and Cartography, 15th International Conference on Computers in Urban Planning and Urban Management (CUPUM 2017) Adelaide – AustraliaJuly 11-14, 2017, pp. 153–165.
Boulange C, Pettit C, Gunn LD, et al (2018) Improving planning analysis and decision making: the development and application of a Walkability Planning Support System. Journal of Transport Geography 69: 129–137.
Br¨ommelstroet Mt (2013) Performance of planning support systems: what is it, and how do we report on it? Computers, Environment and Urban Systems 41: 299–308.
Brownson RC and Jones E (2009) Bridging the gap: translating research into policy and practice. Preventive Medicine 49: 313–315.
Butz WP and Torrey BB (2006) Some frontiers in social science. Science 312: 1898–1900.
Calthorpe P (2011) The Urban Network. Urbanism in the Age of Climate Change. Washington, DC: Island Press. Available at: https://doi.org/10.5822/978-1-61091005-7_7.
Campagna M (2016) Metaplanning: about designing the Geodesign process.
34
Landscape and Urban Planning 156: 118–128.
Cervero R and Kockelman K (1997) Travel demand and the 3Ds: density, diversity, and design. Transportation Research Part D: Transport and Environment 2(3): 199–219.
City Explained Inc (2020) CommunityViz: Urban Analytics for Planners 5.1.
Charlotte, NC: City Explained Inc.
Corburn J (2004) Confronting the challenges in reconnecting urban planning and public health. American Journal of Public Health 94: 541–546.
Coutts AM, White EC, Tapper NJ, et al. (2016) Temperature and human thermal comfort effects of street trees across three contrasting street canyon environments. Theoretical and Applied Climatology 124: 55–68.
Department of Planning LaH (2018) Perth and Peel @ 3.5 Million. Perth, Western Australia: Department of Planning LaH.
Duany A, Plater-Zyberk E and Speck J (2000) Suburban Nation: The Rise of Sprawl and the Decline of the American Dream. New York: North Point Press.
Duncan JMA, Boruff B, Saunders A, et al. (2019) Turning down the heat: an enhanced understanding of the relationship between urban vegetation and surface temperature at the city scale. Science of The Total Environment 656: 118–128.
Ewing R, Schmid T, Killingsworth R, et al. (2003) Relationship between urban sprawl and physical activity, obesity and morbidity. American Journal of Health Promotion 18: 47–57.
Ewing RH (2008) Characteristics, causes, and effects of sprawl: a literature review. In: Marzluff JM, Shulenberger E, EndlicherW, et al. (eds) Urban Ecology: An International Perspective on the Interaction between Humans and Nature. Boston, MA: Springer US, 519–535.
Francis J, Wood LJ, Knuiman M, et al (2012) Quality or quantity? Exploring the relationship between public open space attributes and mental health in Perth, Western Australia. Social Science & Medicine 74(10): 1570–1577.
Frumkin H, Frank L and Jackson R (2004) Urban Sprawl and Public Health: Designing, Planning and Building for Healthy Communities. Washington: Island Press.
Geertman S and Stillwell J (2004) Planning support systems: an inventory of current practice. Computers, Environment and Urban Systems 28: 291–310.
Geertman S and Stillwell J (2020) Planning support science: developments and challenges. Environment and Planning B: Urban Analytics and City Science 47(8): 1326–1342.
35
Giles-Corti B, Sallis JF, Sugiyama T, et al (2015) Translating active living research into policy and practice: on important pathway to chronic disease prevention. Journal of Public Health Policy 36: 231–243.
Government of Western Australia (2020) Metronet: Morley-Ellenbrook Line Project Definition Plan (June 2020). Perth, Western Australia: Government of Western Australia.
Government of Western Australia (2021a) Draft Morley Station Precicnt Concept Master Plan. Perth, WA: Government of Western Australia.
Government of Western Australia (2021b) Metronet. Available at: https://www. metronet.wa.gov.au/.
Hajna S, Ross NA, Brazeau A-S, et al. (2015) Associations between neighbourhood walkability and daily step in adults: a systematic review and meta-analysis. BMC Public Health 15: 768.
Hooper P, Boulange C, Arciniegas G, et al. (2021) Exploring the potential for planning support systems to bridge the research-translation gap between public health and urban planning? International Journal of Health Geographics 20(1): 36.
36
Hooper P, Foster S, Bull F, et al (2020) Living liveable? RESIDE’s evaluation of the “liveable neighborhoods” planning policy on the health supportive behaviors and well-being of residents in Perth,Western Australia. SSM - Population Health 10: 100538.
Ibraeva A, Correia GHdA, Silva C, et al. (2020) Transit-oriented development: a review of research achievements and challenges. Transportation Research Part A: Policy and Practice 132: 110–130.
Infrastructure Australia (2021) Infrastructure Priority List: Project and Initiative Summaries. Kovats RS and Hajat S (2008) Heat stress and public health: a critical review. Annual Review of Public Health 29: 41–55.
McDonald R (2015) Conservation for Cities: How to Plan and Build Natural Infrastructure. Washington: Island Press. Miller W (2012) Introducing Geodesign: The Concept. Redlands, CA: ESRI.
Oliver K, Innvar S, Lorenc T, et al. (2014) A systematic review of barriers to and facilitators of the use of evidence by policymakers. BMC Health Services Research 14: 1–12.
Pearce J, Witten K and Bartie P (2006) Neighbourhoods and health: a GIS approach to measuring community resource accessibility. Journal of Epidemiology and Community Health 60: 389–395.
Pelzer P, Arciniegas G, Geertman S, et al. (2015) Planning support systems and task-technology fit: a
comparative case study. Applied Spatial Analysis and Policy 8: 155–175.
Pettit C, Bakelmun A, Lieske SN, et al. (2018) Planning support systems for smart cities. City, Culture and Society 12: 13–24.
Pettit C, Biermann S, Pelizaro C, et al. (2020) A data-driven approach to exploring future land use and transport scenarios: the online what if? Tool. Journal of Urban Technology 27: 21–44.
Ritchie AL, Svejcar LN, Ayre BM, et al. (2021) A threatened ecological community: research advances and priorities for Banksia woodlands. Australian Journal of Botany 69(2): 53–84.
Russo P, Lanzilotti R, Costabile MF, et al. (2018) Towards satisfying practitioners in using planning support systems. Computers, Environment and Urban Systems 67: 9–20.
Schoner J, Chapman J, Brookes A, et al. (2018) Bringing health into transportation and land use scenario planning: creating a national public health assessment model (N-PHAM). Journal of Transport and Health 10: 401–418.
Stevenson M, Thompson J, de S´a TH, et al. (2016) Land use, transport, and population health: estimating the health benefits of compact cities. Lancet 388(10062): 2925–2935.
Ulmer JM, Chapman JE, Kershaw SE, et al. (2015) Application of an evidencebased tool to evaluate healt impacts of changes to the built environment. Canadian Journal of Public Health 106(1 Suppl 1): eS26–34. DOI: 10.17269/cjph.106.4338.
United Nations (2017) Transforming Our World: The 2030 Agenda for Sustainable Development A/RES/70/1. Vonk G, Geertman S and Schot P (2005) Bottlenecks blocking widespread usage of planning support systems. Environment and Planning A: Economy and Space 37: 909–924.
Vonk G, Geertman S and Schot P (2007) A SWOT analysis of planning support systems. Environment and Planning A: Economy and Space 39: 1699–1714.
Wong F, Stevens D, O’Connor-Duffany K, et al. (2011) Community health environment scan survey (CHESS): a novel tool that captures the impact of the built environment on lifestyle factors. Global Health Action 4: 5276. DOI: 10.3402/gha. v4i0.5276.
Wood L, Hooper P, Foster S, et al. (2017) Public green spaces and positive mental health – investigating the relationship between access, quantity and types of parks and mental well-being. Health & Place 48: 63–71.
37
