
Urban Forestry & Urban Greening 101 (2024) 128533
Contents lists available at ScienceDirect
Urban Forestry & Urban Greening
journal homepage: www.elsevier.com/locate/ufug

Urban Forestry & Urban Greening 101 (2024) 128533
Contents lists available at ScienceDirect
journal homepage: www.elsevier.com/locate/ufug
Maassoumeh Barghchi a , * , Bill Grace a , Nicole Edwards a , Julian Bolleter a , Paula Hooper a
a Australian Urban Design Research Centre (AUDRC), School of Design, The University of Western Australia, Clifton St, Nedlands, WA 6009, Australia
ARTICLE INFO
Keywords: Climate change
Diurnal cooling
Perth WA Plant transpiration
Shade provision
Urban parks
Extreme heat is Australia’s most perilous natural hazard, and increasing urban temperatures due to climate change are a growing concern. Consequently, there is growing interest in developing nature-based solutions (i.e., greenery and vegetated surfaces) to cool urban areas. Appropriately designed urban parks are anticipated to be crucial for maintaining thermal comfort as temperatures rise. The two main diurnal cooling mechanisms of urban parks are shade provision and vegetation transpiration. However, limited studies have examined the cooling performance of vegetation through transpiration, especially in the southern hemisphere. This study addresses this gap by examining the microclimatic conditions, cooling benefits, and thermal performance of a typical neighbourhood park in Perth, Western Australia, with a focus on the cooling performance of vegetation through shade and transpiration. Present and future microclimates were modelled and simulated for average and hottest summer days based on 25 years of local weather data and projections for 2090 under the Representative Concentration Pathway (RCP) 8.5 scenario. The findings reveal that trees provided diurnal cooling benefits for park users by lowering the Universal Thermal Comfort Index (UTCI) by up to 17◦ C, with this benefit persisting in projected 2090 conditions. This cooling benefit was predominantly achieved through shade provision, with marginal contributions from transpiration. Additionally, on hot days, as leaf temperature exceeded 30◦ C, increased stomatal resistance led to reduced transpiration. Therefore, more attention must be paid to transpiration cooling limits due to stomatal closure during hot hours to improve cooling performance in park design. Moreover, comparing different plant species’ behaviour and adaptability on hot days is crucial, especially in future climatic conditions.
Climate change is increasing annual average temperatures and the number and duration of extreme heat events across Australia, with the 2011–2020 decade being the hottest on record (Shooshtarian et al., 2020). The Intergovernmental Panel on Climate Change (IPCC) warns of an ‘extremely challenging future’ for Australia, with significant disruptions to human and natural systems (IPCC, 2022). Extreme heat is now considered Australia’s most dangerous natural hazard, causing more deaths than all other natural threats combined (i.e., bushfires, cyclones, earthquakes, floods, and severe storms) (Zander et al., 2015). Urban heat and the associated Urban Heat Island (UHI) effect are predicted to amplify the heat-related impacts of climate change in urban areas. Increasing heat affects outdoor thermal comfort, which is crucial for using urban parks (Zhang et al., 2020). Therefore, maintaining comfortable outdoor conditions is critical for planners and policymakers
(Shooshtarian et al., 2020).
Nature-based solutions, particularly vegetation, have been identified as a way to mitigate UHI effects, reduce heat intensity and improve thermal comfort [5]. Urban green spaces can regulate and cool the microclimate, directly enhancing the outdoor thermal environment and comfort levels [6]. The literature identifies two primary cooling benefits of urban parks: (1) the cooling effect within the park (Aram et al., 2019; Aram et al., 2020; Bowler et al., 2010; Morakinyo et al., 2017) and (2) the cooling effect in adjacent areas (Al-Gretawee et al., 2016; Lin et al., 2015; Yan et al., 2018). These benefits are influenced by factors such as vegetation type, local climate, biophysical conditions (water, soil, atmosphere) (Carter, 2011; Meili et al., 2021), and the park’s size, shape, configuration and orientation, which impact the duration of direct solar radiation and Mean Radiant Temperature (MRT) (Taleghani et al., 2015). [MRT is a measure of the average temperature of the surfaces surrounding a particular point and is a critical element affecting human
* Correspondence to: Australian Urban Design Research Centre (AUDRC), The University of Western Australia, Clifton St, Nedlands, WA 6009, Australia. E-mail address: maassoumeh.barghchi@uwa.edu.au (M. Barghchi).
https://doi.org/10.1016/j.ufug.2024.128533
Received 17 June 2024; Received in revised form 28 August 2024; Accepted 30 September 2024
Available online 9 October 2024
1618-8667/© 2024 The Author(s). Published by Elsevier GmbH. This is an open access article under the CC BY license (http://creativecommons.org/licenses/by/4.0/).
thermal comfort (Gal and Kantor, 2020)]. To date, studies from Europe, Australia and Asia across a range of climatic zones have typically measured the cooling effect of urban parks using the Cooling Effect Distance (CED) (Al-Gretawee et al., 2016), which assesses how far the cooling extends beyond the park and the Cooling Effect Intensity (CEI), which measures the temperature difference between the green space interior and its nearby surroundings.
Other studies have explored the cooling effects of different types of vegetation within the park (e.g., lawns, shrubs and trees) (Amani-Beni et al., 2018; Bartesaghi Koc et al., 2018; Duncan et al., 2019; Rakoto et al., 2021; Yang et al., 2017). These studies consistently conclude that trees are the most effective and grass the least effective in providing diurnal cooling benefits and mitigating thermal discomfort (Adams and Smith, 2014). Various characteristics of different tree species (i.e., height, leaf type, Leaf Area Index (LAI), Leaf Area Density (LAD), trunk height, and crown height) influence their ability to improve microclimate conditions (Morakinyo et al., 2018). Furthermore, local climate and microclimate conditions play a significant role. For instance, trees with shorter trunk heights provide more shade near their base, making them suitable for locations closer to the equator with high solar inclination, while broad, umbrella-shaped foliage offers optimised shading benefits in low and medium latitudes (Li, 2016).
The cooling benefits of vegetation in urban parks are primarily due to two main diurnal cooling mechanisms: shade provision and transpiration (Coutts et al., 2015; Howe et al., 2017). An extensive body of research has demonstrated that trees reduce MRT through shade provision, thereby enhancing thermal comfort (Coutts et al., 2016; Lai et al., 2023; Liao et al., 2021) (Armson et al., 2012; Sodoudi et al., 2018; Zhao et al., 2018). For example, a study on temperature and human thermal comfort effects of street trees in Melbourne, Australia, suggested that strategically placing trees to maximise shade can enhance cooling effects (Coutts et al., 2016). However, few studies have examined the role of transpiration in the cooling benefits of urban parks.
Moreover, studies assessing the cooling benefits of parks and vegetation have typically focused on current climate conditions (Amani-Beni et al., 2018; Bartesaghi Koc et al., 2018; Bowler et al., 2010; Duncan et al., 2019; Emmanuel and Loconsole, 2015; Jim et al., 2015; Lin et al., 2016). However, a better understanding of these cooling benefits under future conditions is crucial with projected warming climates and increasing extreme heat events. Indeed, urban planners and designers, and landscape architects need evidence-based research to inform park design for optimal cooling and thermal comfort, ensuring continued community use, particularly in the context of a warming climate (Cheng et al., 2021; Frantzeskaki et al., 2019; Parks. and Ozkeresteci, 2003). Only one study (Gherri et al., 2021) has explored the cooling performance of urban open spaces under changing or future climatic conditions. Gherri et al. (2021) used ENVI-met to model the change in thermal comfort conditions of two open spaces in Venice, Italy, under current weather data and future IPCC climate scenario projections to 2050. To our knowledge, no studies have modelled the cooling benefits of parks under future climatic conditions in the southern hemisphere.
Parks offer significant physical health and well-being benefits, and their usage is heavily influenced by thermal comfort (Murakami, 2006; Staiger et al., 2012; Zhao et al., 2021). Rising temperatures diminish the thermal comfort of parks, making them less appealing and potentially unusable due to increased heat stress (Murakami, 2006). As a result, evaluating and considering human comfort is becoming increasingly crucial in environmental design (Staiger et al., 2012; Zhao et al., 2021).
Outdoor thermal comfort, defined as “the temperature at which a person feels comfortable and experiences neither heat nor cold” (ASHRAE, 2010), or as “a mental state expressing satisfaction with the thermal environment” (ASHRAE, 2010; Fischereit and Schlünzen, 2018), is assessed using thermal comfort indices. However, many indices, such as Perceived Temperature (PTJ), often fail to account for essential meteorological factors like solar radiation, wind speed, and MRT, which are critical in landscape planning and design assessments (Fiala et al., 2012;
Park et al., 2014). The Universal Thermal Climate Index (UTCI), developed by the International Society of Biometeorology, is specifically designed for outdoor thermal environments and considers key factors affecting physiological responses, such as ambient temperature, humidity, wind, and solar radiation, making it the most suitable measure of thermal stress on the human body in outdoor conditions (Fiala et al., 2012).
A limited number of studies have explored vegetation’s effects on thermal comfort in parks within hot-summer Mediterranean climates similar to Perth. For example, a study in Madrid found that a large urban park lowered air temperature and consequently enhanced thermal comfort (Aram et al., 2020), while another study in Algeria observed that vegetation cover improved thermal comfort, particularly during the hottest hours of the day, by reducing air temperature by 4◦ C and MRT by 3◦ C (Labdaoui et al., 2021). Nevertheless, these studies focused on typical summer days rather than the most extreme heat conditions and were not conducted in the southern hemisphere, limiting their generalisability to Australian contexts.
Microclimate simulation methods, particularly using software like ENVI-met, have become increasingly popular for studying the cooling benefits and thermal comfort of parks and green infrastructure. Advances in computational techniques, such as computational fluid dynamics (CFD), have enhanced the integration of urban climate knowledge into landscape design (Toparlar et al., 2017). ENVI-met effectively quantifies the impact of landscape elements on microclimates and supports urban-scale design strategies by modelling various climatic variables (Abdallah et al., 2020; Albdour and Baranyai, 2019; Bruse, 2017). Numerous studies across diverse climatic zones, including Europe, China, Africa, Australia, and Asia, have utilised ENVI-met to evaluate the cooling and thermal comfort performance of parks (Lam et al., 2021; Noro and Lazzarin, 2015; Palomo Amores et al., 2023; Semeraro et al., 2023; Yilmaz et al., 2018). The software has also been employed to assess the influence of different vegetation types and arrangements on thermal comfort in parks (Atwa et al., 2020; Lai et al., 2023), and it has been validated for accurately modelling thermal conditions, such as air temperature, MRT, and tree transpiration rates, with studies confirming its reliability in both European and Australian climates (Jamei et al., 2019; Lam et al., 2021; Piselli et al., 2018; Simon et al., 2018). In response to gaps in the literature, this study aimed to use ENVI-met software to model and assess (1) the thermal performance of a typical park on present and future average and hottest summer days and (2) the respective role of shade and transpiration mechanisms on the cooling provided by vegetation within the park.
2.1. Study context - Perth, Western Australia
Perth, Western Australia’s climate is defined by the Koppen-Geiger climate classification system as Csa (C: warm temperature, s: summer dry, a: hot summer) (Rubel and Kottek, 2010). The maximum daily temperature often reaches more than 40◦ C in the hottest month (February), with inner metropolitan suburbs up to six degrees hotter than coastal suburbs (Young, 2015). In the summer of 2022, the number of days above 40◦ C in Perth was 13, compared to just four, six and three days in 2021, 2020, and 2019, respectively (Bureau of Meteorology, 2022). Perth is projected to experience warmer weather, with more heatwaves and fewer cool days by 2090 (Government of Western Australia, 2021). Perth’s worst-case (RCP8.5) projections include annual temperature increases between 2.7 and 4.2◦ C (Australian Academy of Science, 2021). There is reason to believe those responsible for urban environments in Perth should take the worst-case projections seriously. Indeed, the total emission reductions currently pledged through the Paris Agreement, even if implemented on time, will translate as average global surface temps of 3◦ C or more above the pre-industrial period by 2100 (Intergovernmental Panel on Climate,
2023). Such a rise will have dire implications for Perth, and other Australian cities and towns.
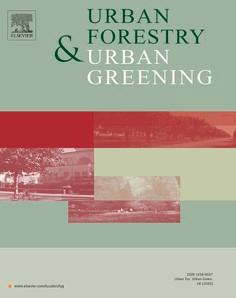
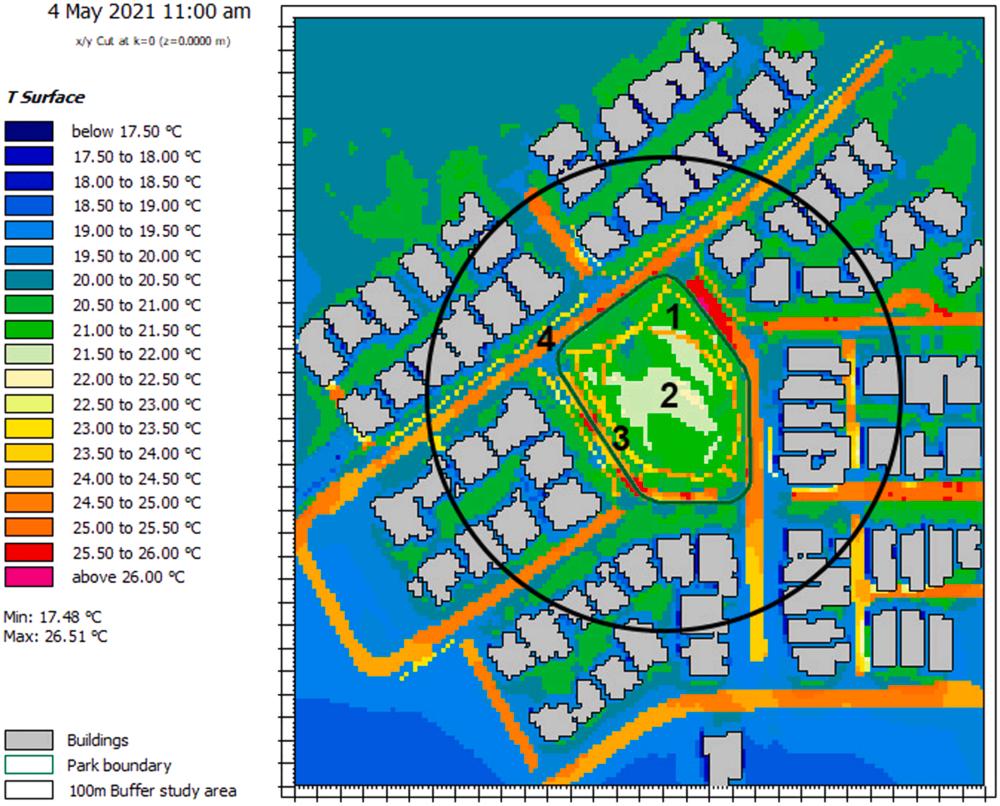
The case study for this paper, Colmworth Park, is a typical small (0.48-hectare) park located in a greenfield suburb 40 km northwest of the Perth CBD (Fig. 1). Colmworth Park is typical of the smaller yet accessible ‘Neighbourhood Parks’ being delivered in greenfield development across Australia in accordance with New Urbanism theory and related policy documents such as Western Australia’s ‘Liveable Neighbourhoods’ code (DP, 2015). The Park comprises an oval-shaped grass area, concrete footpaths, and perimeter trees, including Platanus x acerifolia (ubiquitous in Perth), Eucalyptus marginata, Melaleuca quinquenervia and Corymbia maculata trees. It also includes pockets of hedges and greenfield shrubs, a small playground, benches and a covered picnic bench. The study area was defined as the park and its surrounding area within a circular buffer of a 100 m radius (Fig. 1). The 100 m surrounding distance has previously been deemed appropriate for micro-scale climate observations (Chow et al., 2016; Li and Roth, 2009).
Field measurements Tree locations (longitude and latitude) within the park were captured on-site using the GPS Kit Mobile app (2021c). The Arboreal Tree Mobile app (2021a) was used to photograph and measure tree heights. The Plant Identification Australia Mobile app (2021d) was used to identify all vegetation in the park, matching the tree identification data obtained from the Local Government Authority (City of Wanneroo). Field surface temperature measurements were taken using a thermal imaging camera, FLUKE TIS45 Infrared camera, at different locations within the park and the surrounding area (FLUKE, 2021).
Microclimate modelling was conducted using ENVI-met 4.4.6 (2021) through pre- and post-processing programs. Initially, GIS spatial layers (Fig. 2a), including buildings footprints, grass surface, concrete footpath in the park, and asphalt surface were converted through the Monde program (Figs. 2b, 2c) (GmbH). Australian native trees are not included in the default ENVI-met vegetation library, so the park’s four tree species were created using the Albero program. Attributes such as tree height, crown height and width, and trunk height, measured using the Arboreal Application during the field audit, were incorporated in constructing these trees. Additionally, tree calendar and leaf type were considered
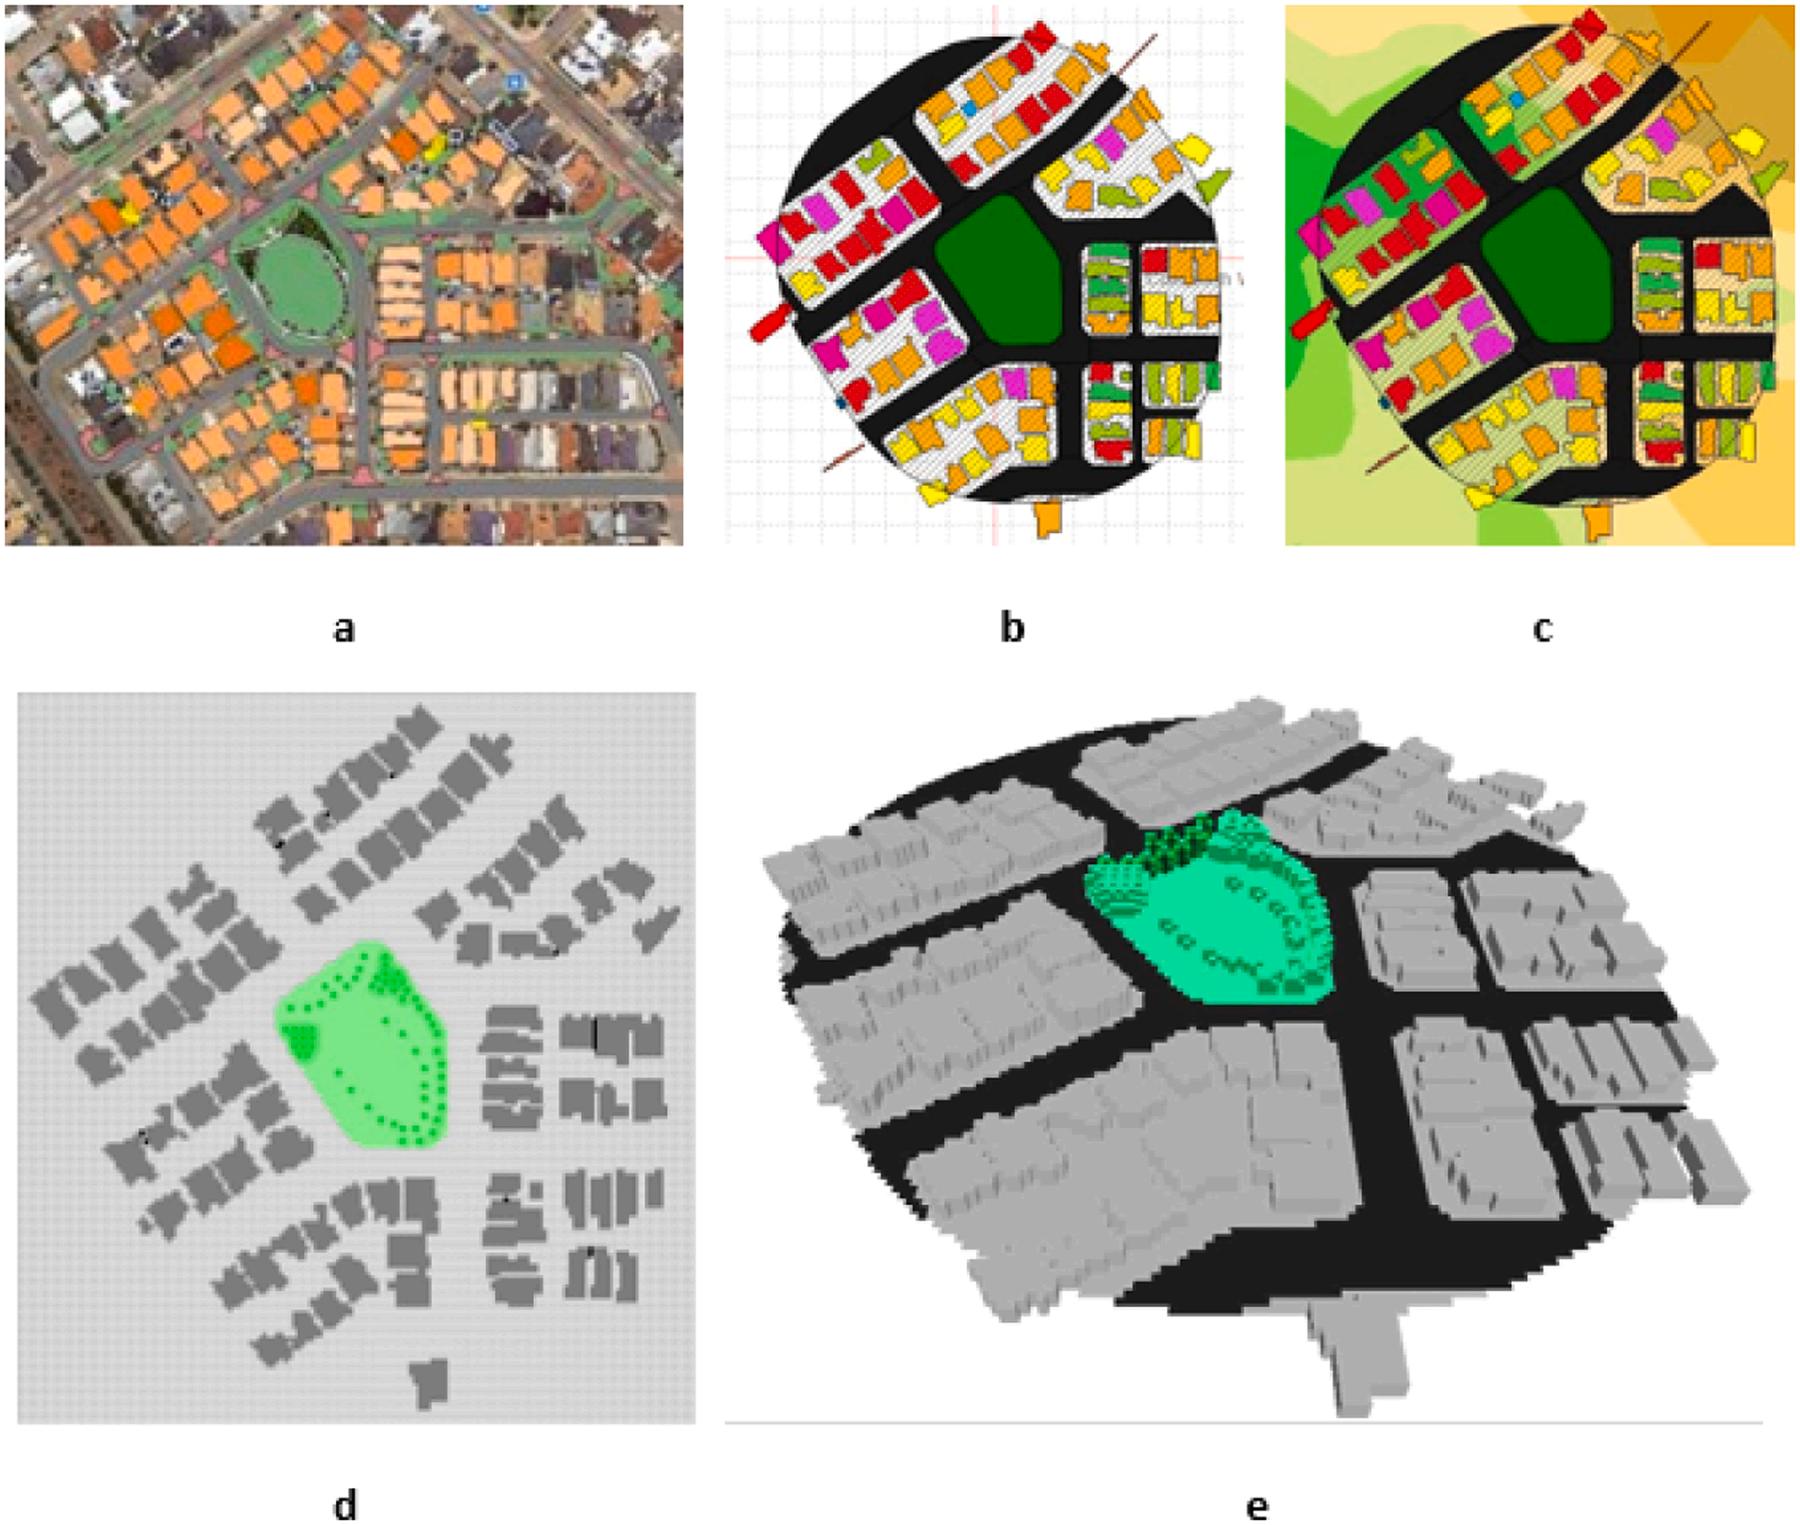
according to the identified species. These trees were then added to the Space program to define the study area’s spatial details (Figs. 2d, 2e). Three trees were specifically marked before running the simulation to obtain detailed results on plant transpiration and latent heat flux (Fig. 3). The modelling and simulation parameters are detailed in Table 1
The Commonwealth Scientific and Industrial Research Organisation (CSIRO) have produced Energy Plus Weather (EPW) format files for 83 locations across Australia (Government, 2020), including Perth, based on 1990–2015 climate data (i.e., 25 years). Climate data for Perth were input into the ENVI-met model via an EPW file. The file includes the date, time, temperature, relative humidity, wind speed, wind direction, radiation and cloud coverage for every hour of a typical meteorological year (Government, 2020; Zhengen et al., 2021). Hourly temperature and humidity data from the Perth metropolitan station were obtained from the Bureau of Meteorology (BOM) for the date of field data collection (i. e., 4 May 2021). These were used in the ENVI-met modelling to compare with the field temperature measurements. Interrogation of the EPW file identified 7 January 1998 as the hottest summer day based on the highest maximum temperatures and 16 February 2010 as the average summer day. These two dates were used to model the “present hottest day” and the “present average day”
CSIRO has also produced future weather files using climate change projections from the Coupled Model Intercomparison Project Phase 5 (CMIP5) for Representative Concentration Pathways (RCPs) (Government of Australia Department of the Environment and Energy, 2016). Introduced in the IPCC’s fifth assessment report in 2014, RCPs reflect various degrees of climate change and build scenarios about the potential impacts that cover 1850–2100 (Jubb et al., 2016). The projections range from RCP 2.6 (low emissions, low adaptation cost) to RCP 8.5 (high emissions, high adaptation cost) (Government of Australia Department of the Environment and Energy, 2016). The EPW files for Perth in 2090 (“projected 2090”) were used to model the “projected hottest day” and “projected average day” under the RCP 8.5 scenario.
All models were pre-processed using the ENVI-Guide program, and the full forcing method was employed to create simulation input files (SIMX file). These simulations, run by the ENVI-Core program, covered the present and projected 2090 average and hottest days over 24 hours. The results were post-processed and visualised with the Leonardo program (https://www.envi-met.com/software/). The methodology flow chart is presented in the below (Fig. 4).
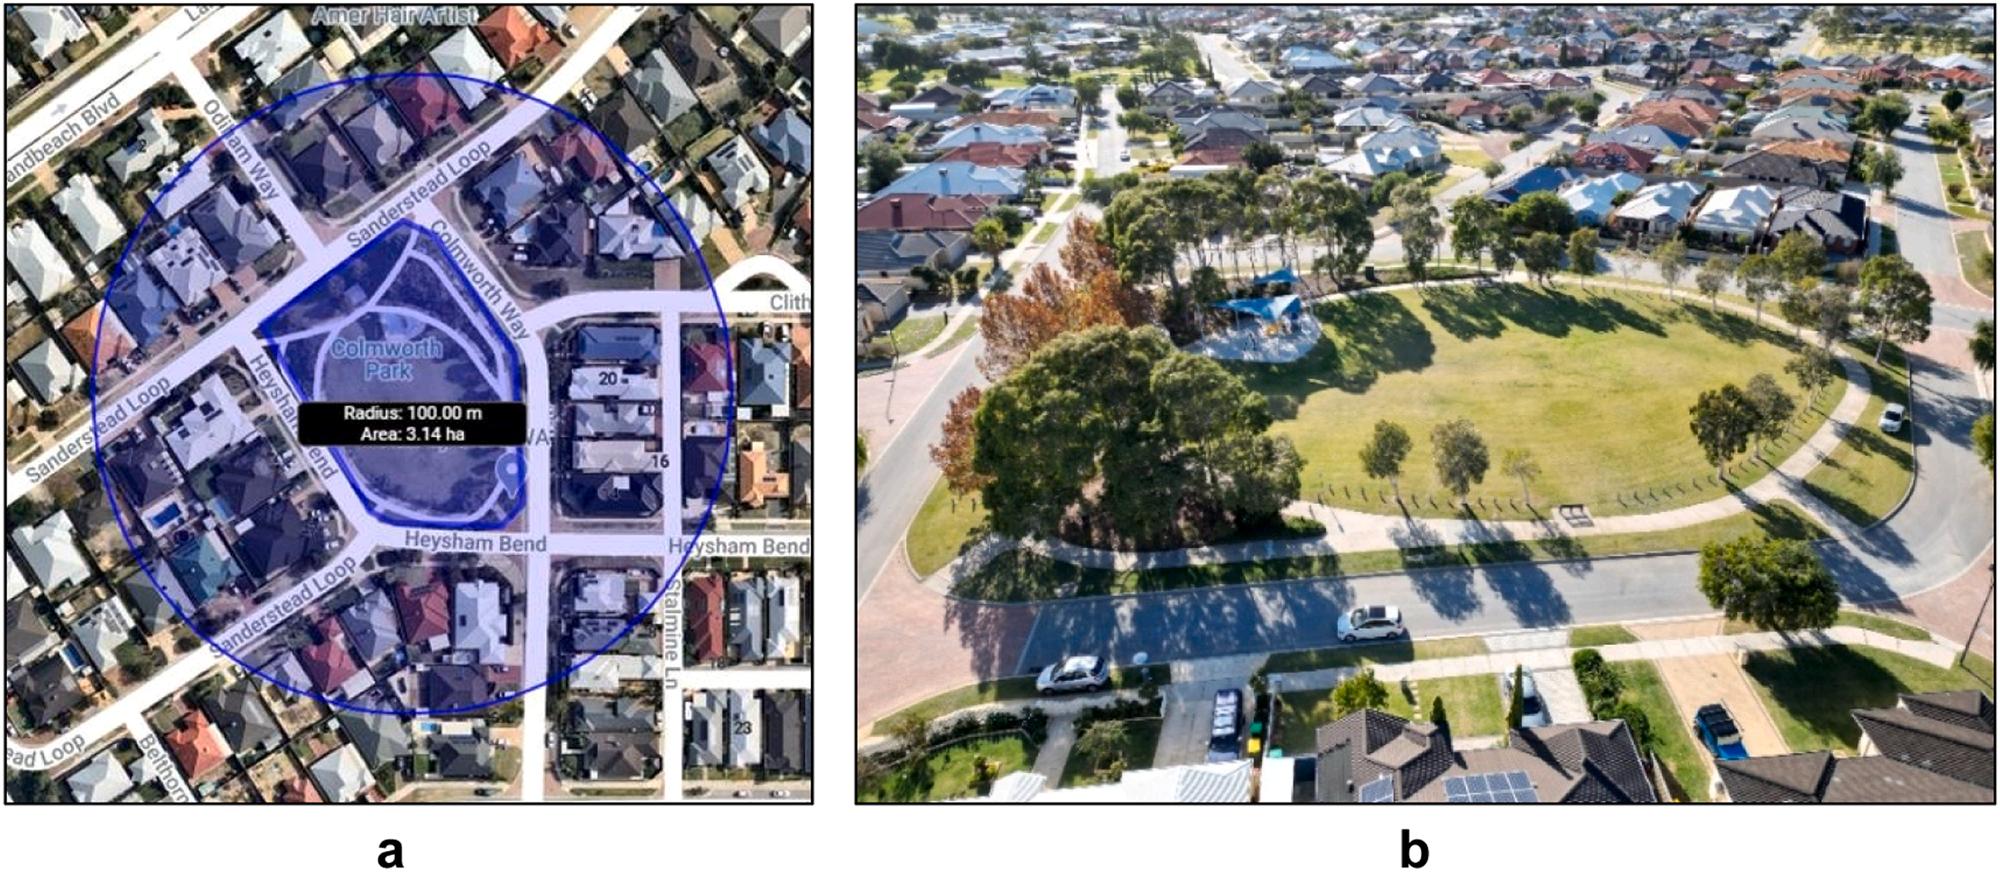
2. Process of modelling in ENVI-met: (a) creation of spatial layers in ArcMap, (b) conversion into the Monde ENVI-met program, (c) export topography into the Monde ENVI-met Program, (d) ENVI-met Program Space, (e) Final model ENVI-met Program Space.
2.4. The outdoor thermal comfort index
The thermal comfort in the study park was estimated using the UTCI, derived from the ENVI-met BioMet program, a post-processing tool for calculating human thermal comfort indices from the ENVI-met output files. Human parameters were set for a 35-year-old male (75 kg, 175 cm)
with a clothing insulation index of 0.90 (ENVI-admin n.d) and a metabolic rate of 164.49 (Sum, W), based on 86.21 W/m2 of body surface area. Distribution maps for six meteorological variables underpinning the UTCI scores (MRT, potential air temperature, relative humidity, land surface temperature, wind speed, and wind direction) were also generated.
Table 1
ENVI-met Modelling and simulation input parameters.
Domain size: 173 * 187 * 25
Grid spatial resolution: 2 m
Meteorology: Full forcing using EPW file
Modelling features: Buildings: moderate insulation wall
Soils: Loamy soil
Vegetation: 4 species of tree (considering the height of each tree), Grass
Surfaces: Street (Asphalt Road), footpaths in the park (concrete pavement)
Duration: 24 h
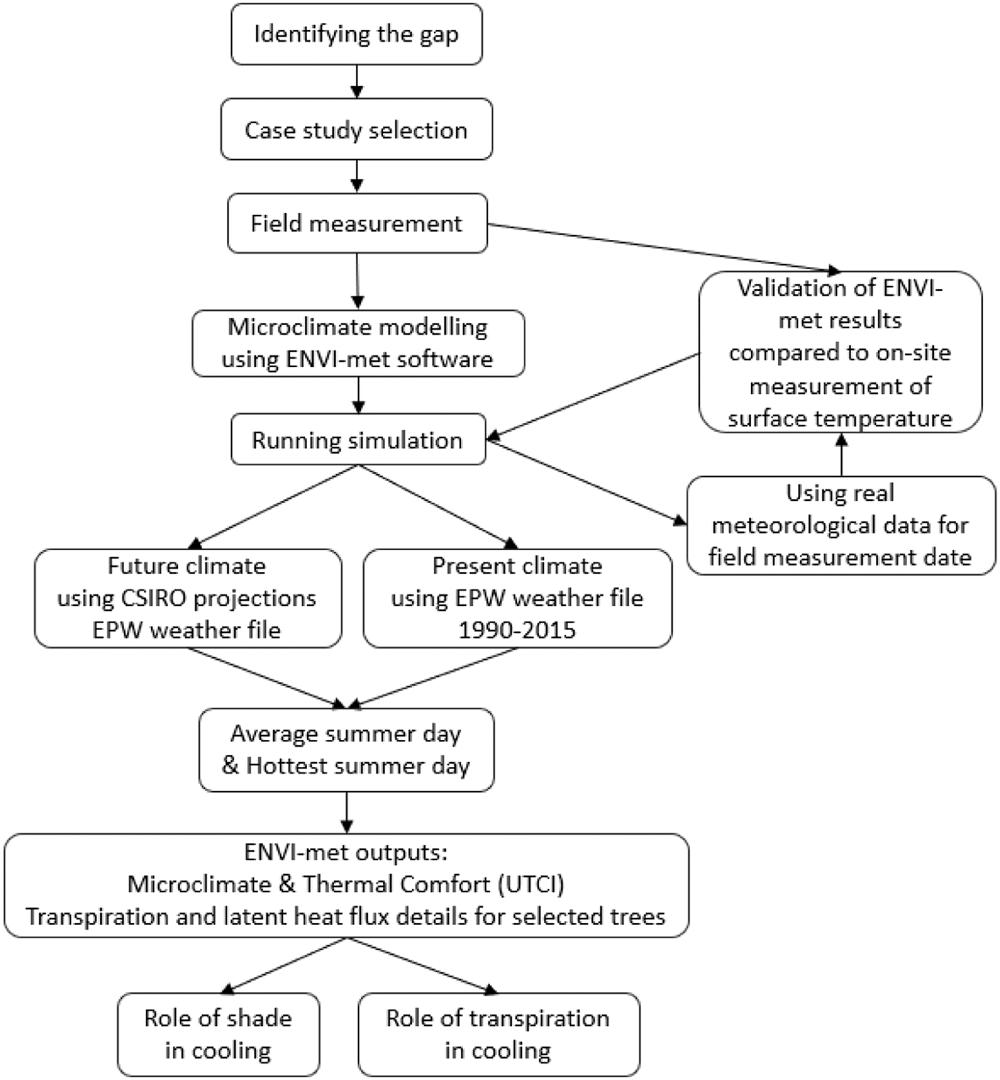
Fig. 4. Methodology Flow Chart.
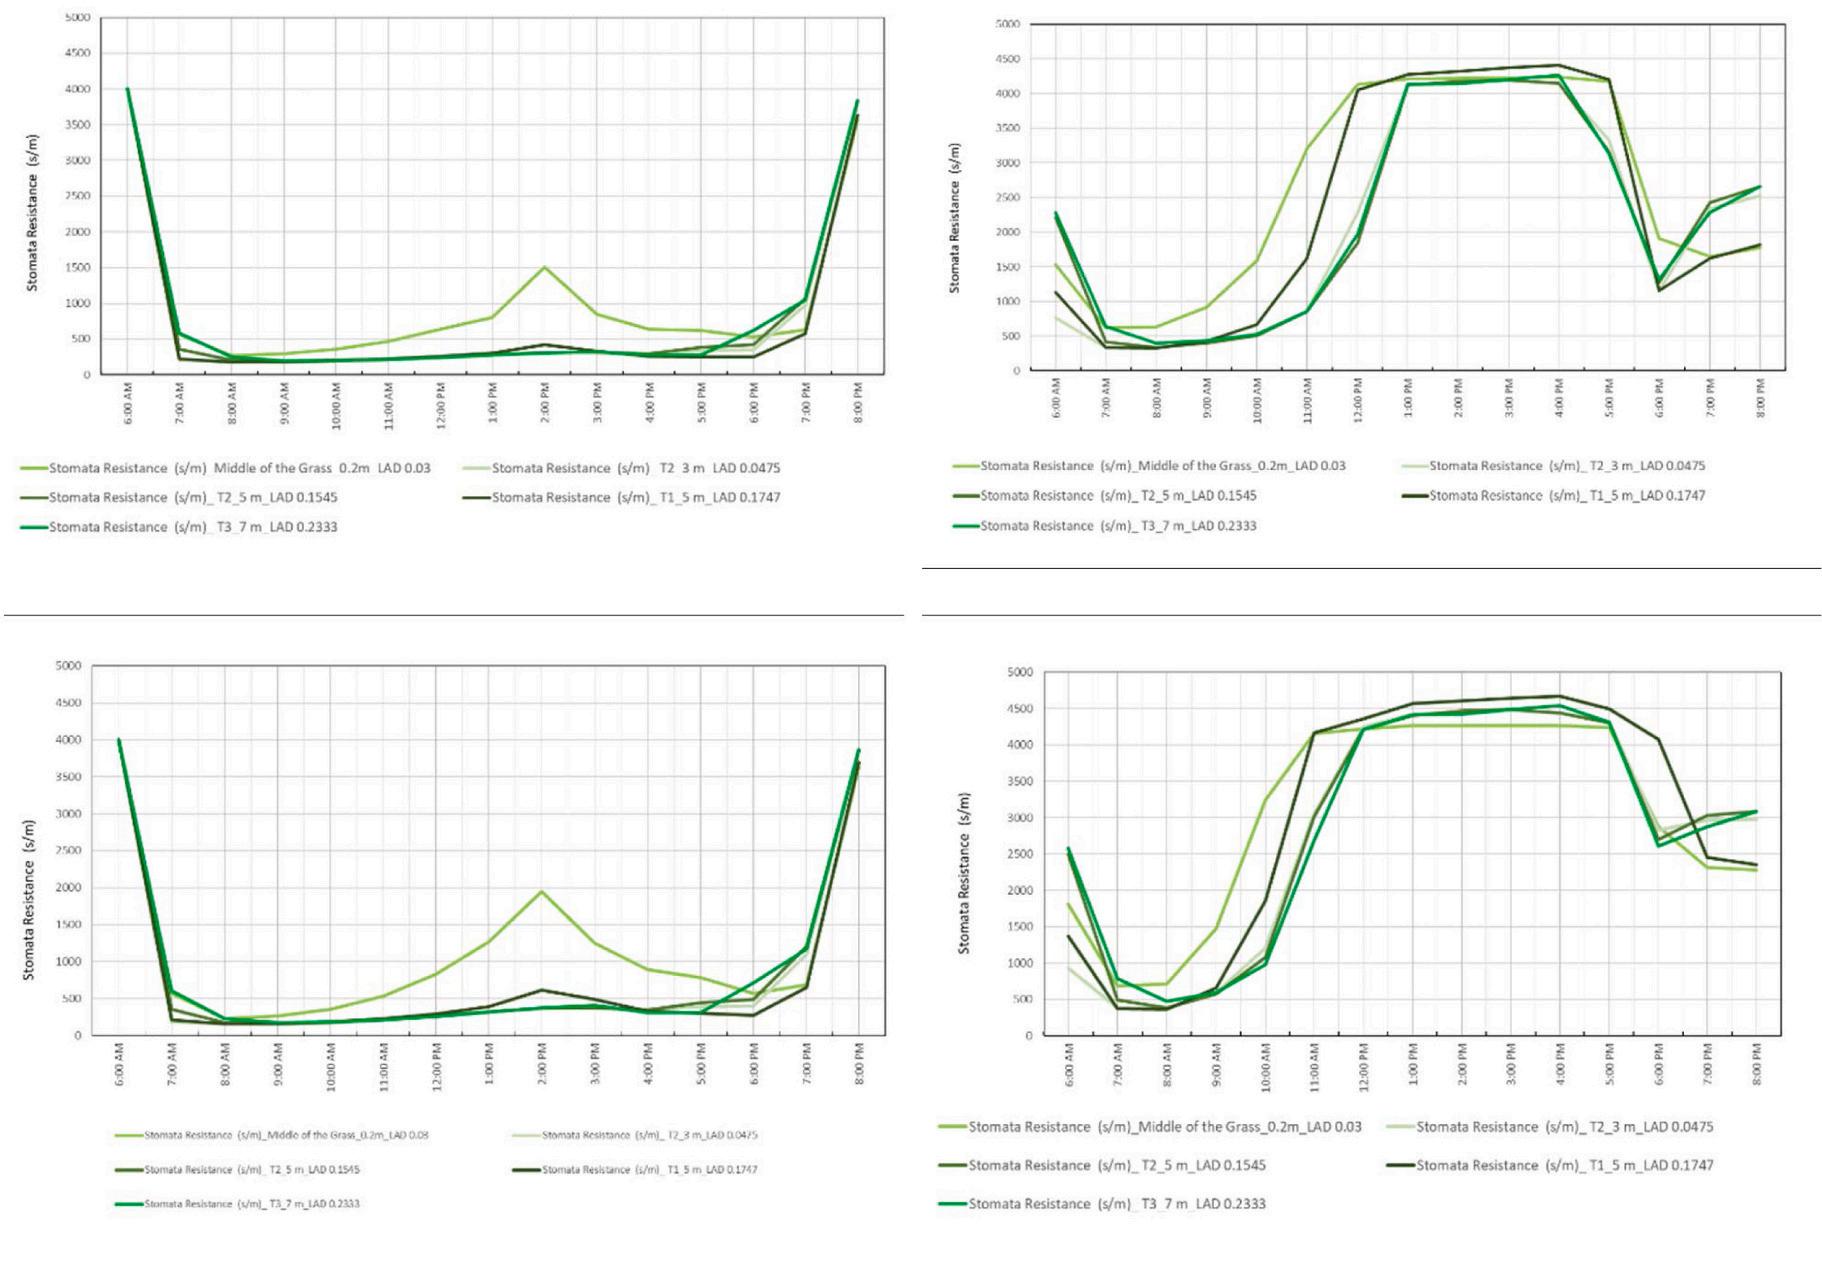
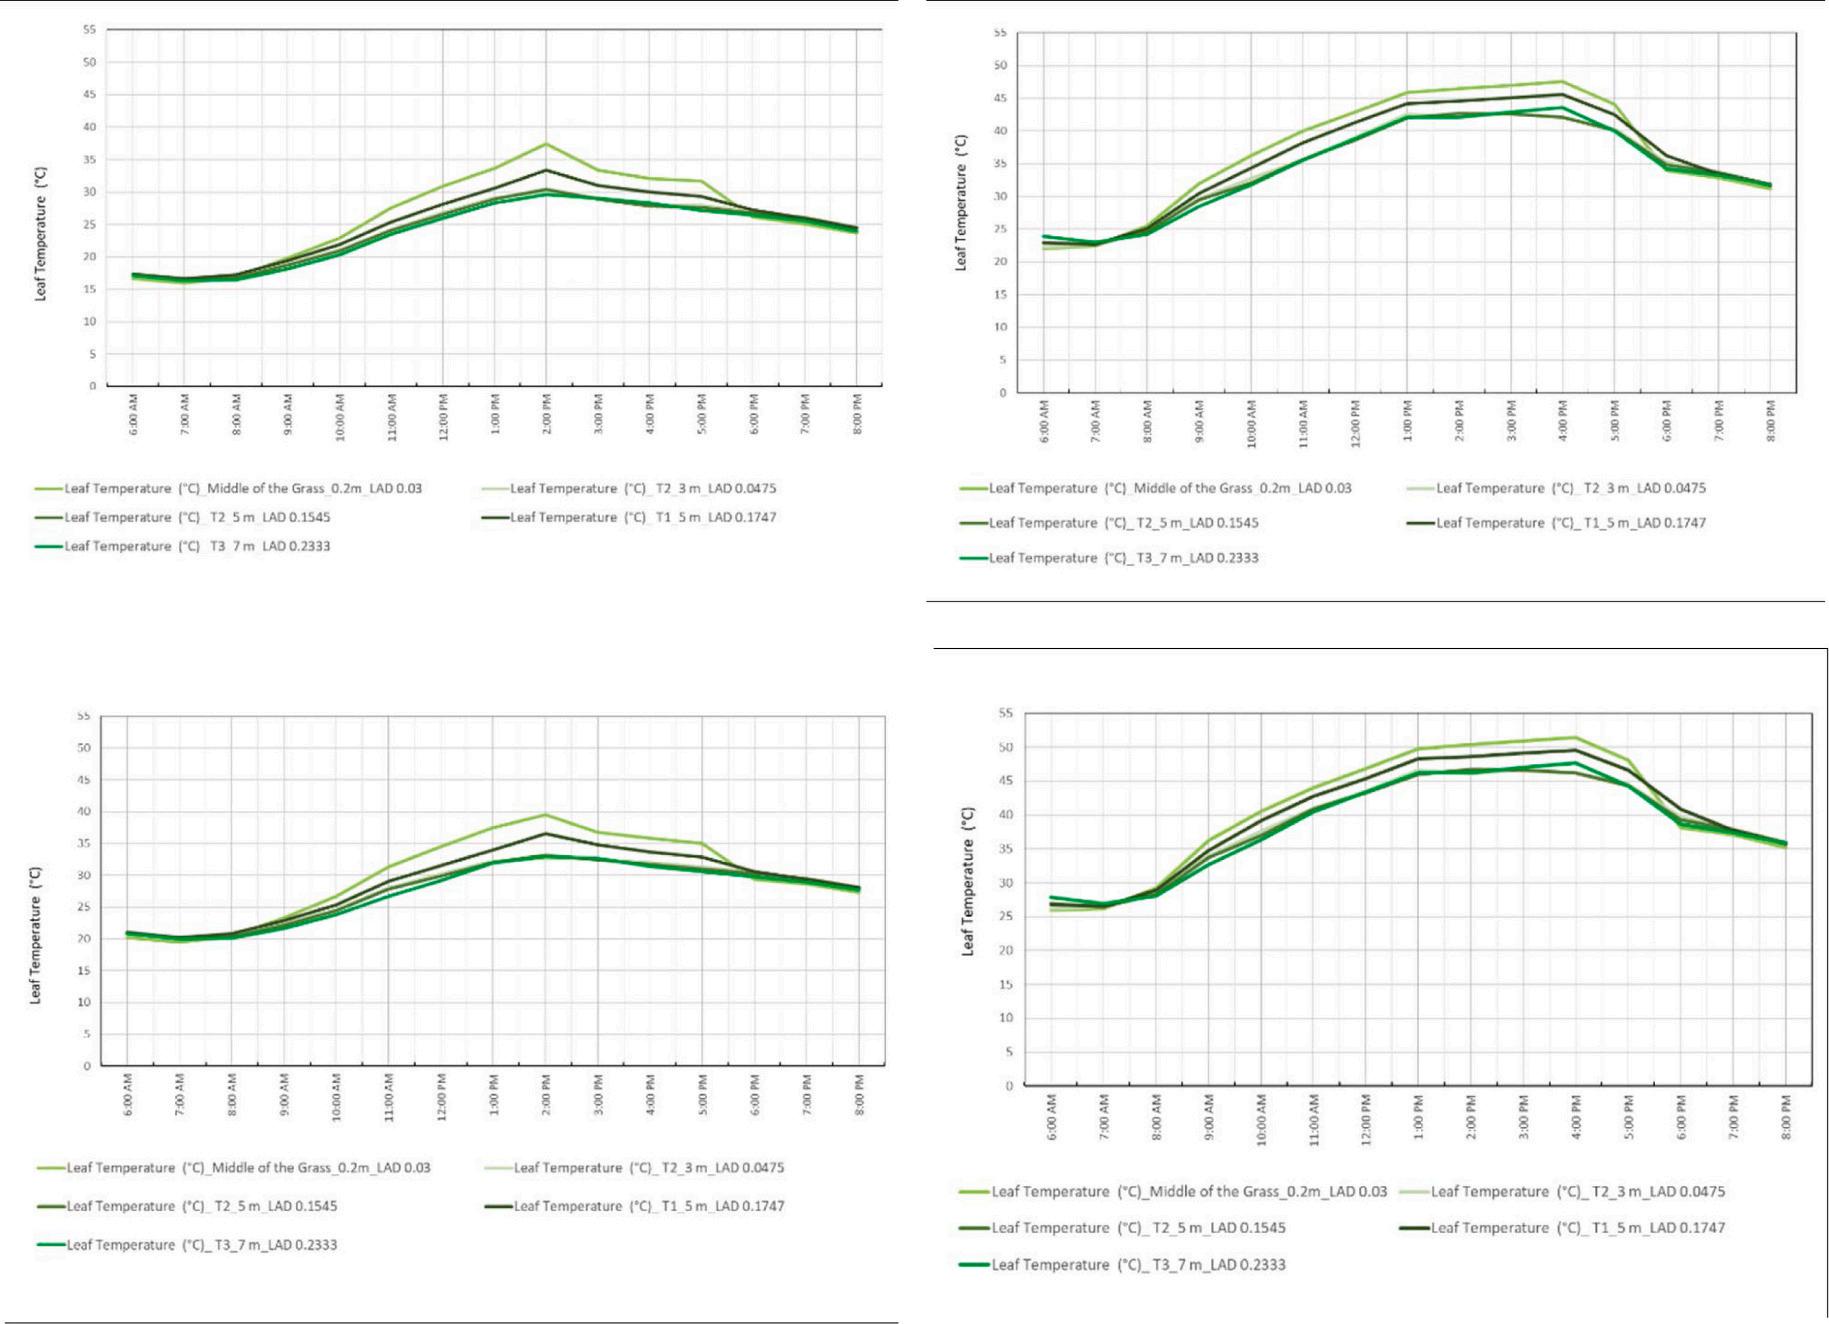
2.5. Stomatal resistance and transpiration of park vegetation
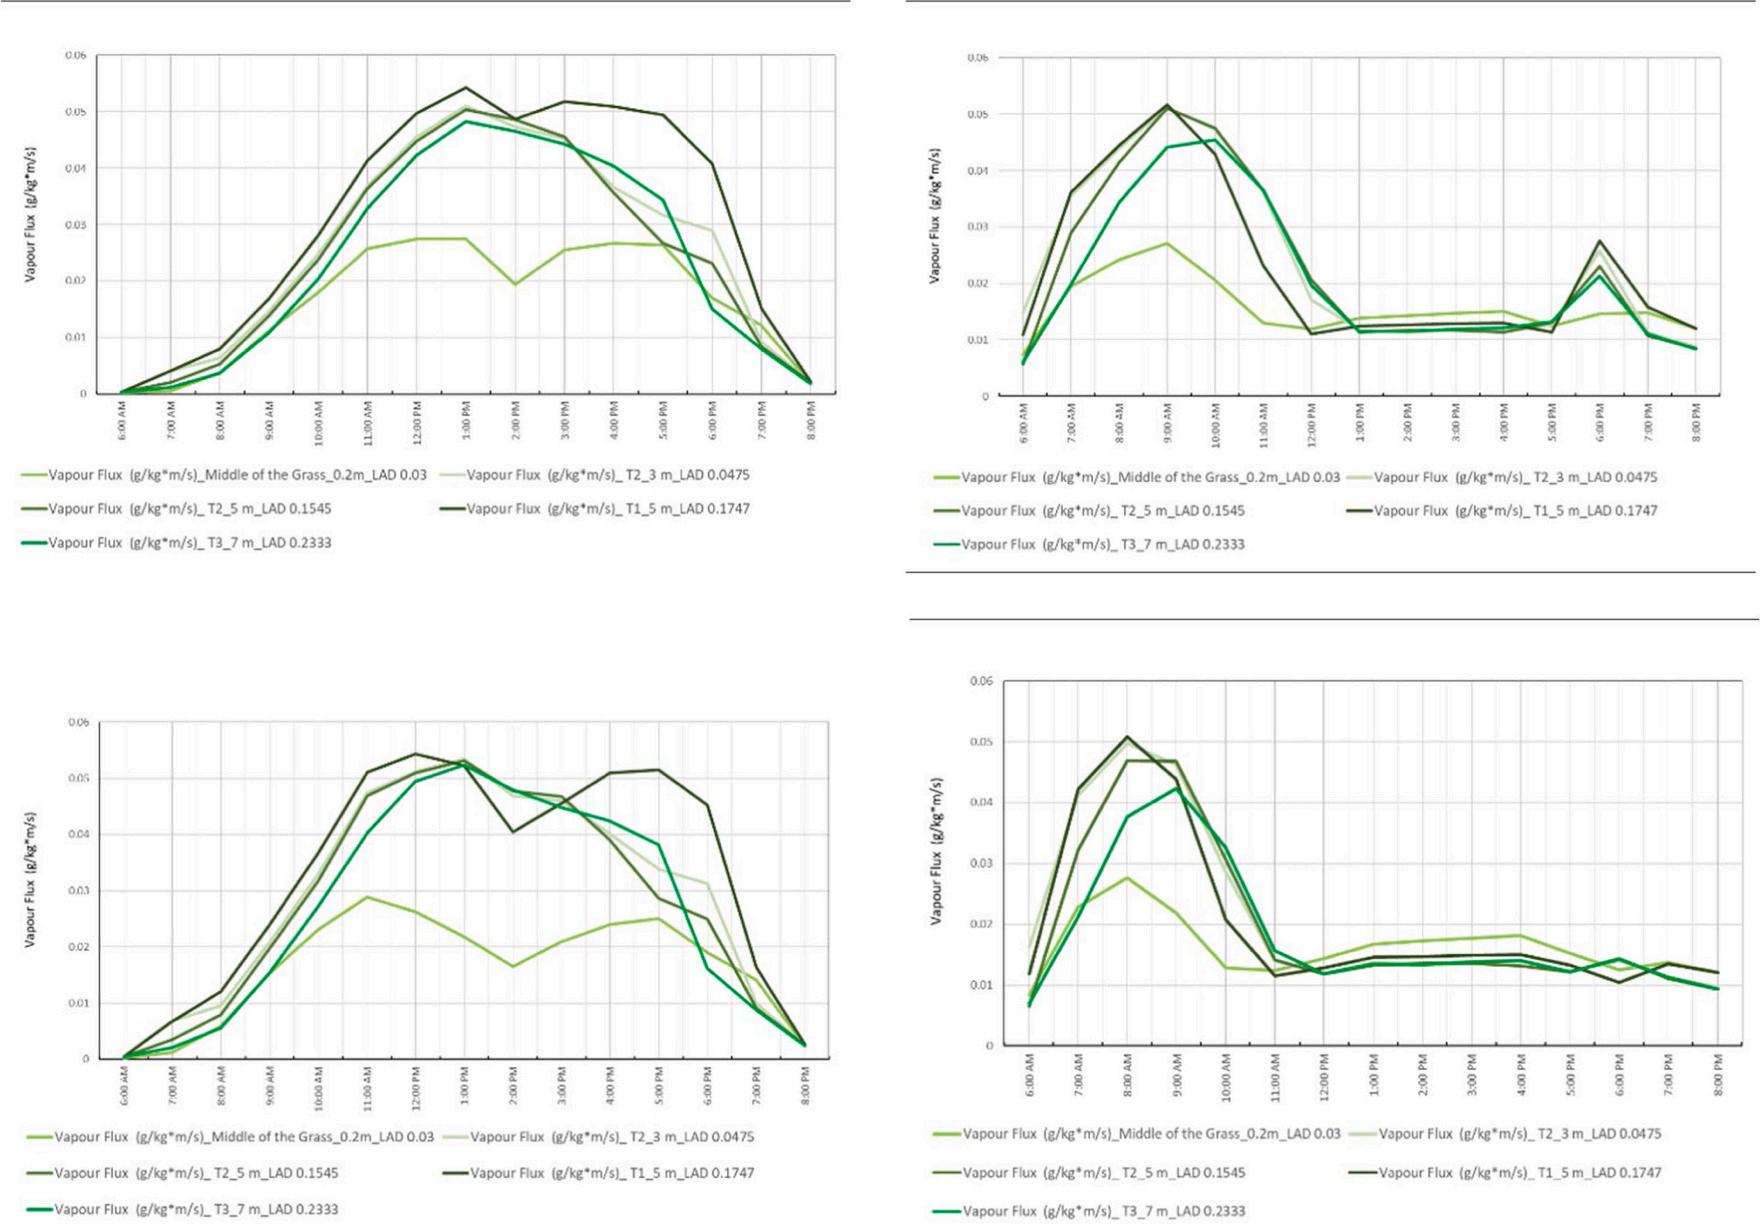
Stomata are tiny openings or pores in plant leaves that enable water and CO2 exchange with the atmosphere (Bruse, 2004), directly affecting photosynthesis capacity and transpiration (stomatal conductance) (Britannica, 2020), and thereby the cooling benefits of vegetation. The latent heat flux arising from the evaporation of the transpired moisture cools the surrounding air. Water stress, severe drought, extreme temperature and low light result in the stomata closing to inhibit water loss (stomatal resistance), which reduces transpiration and associated cooling benefits (Duursma et al., 2019). The stomatal resistance model in ENVI-met is based on the relationship between the photosynthetic rate and the stomatal conductance (Bruse, 2004). Distribution maps were obtained from ENVI-met to study transpiration effects on cooling through stomatal resistance in different climate conditions (Salata et al., 2016). Additionally, the vapour flux (rate of vapour exchange) was graphed to present how the stomata resistance relates to the vapour flux from the leaves.
Results
3.1. Comparison of ENVI-met results with field measurements
The modelled surface temperature for the matched weather day is
presented in Fig. 5 The comparison of the modelled and observed surface temperatures using the index of agreement d (the ratio of the mean square error and the potential error) was 0.985, where an agreement value of 0 indicates no agreement and 1 indicates perfect agreement. This degree of correlation thus provides confidence in the suitability and accuracy of the ENVI-met modelling for this study.
3.2. Microclimate results - present weather condition
3.2.1. Present climate - average summer day
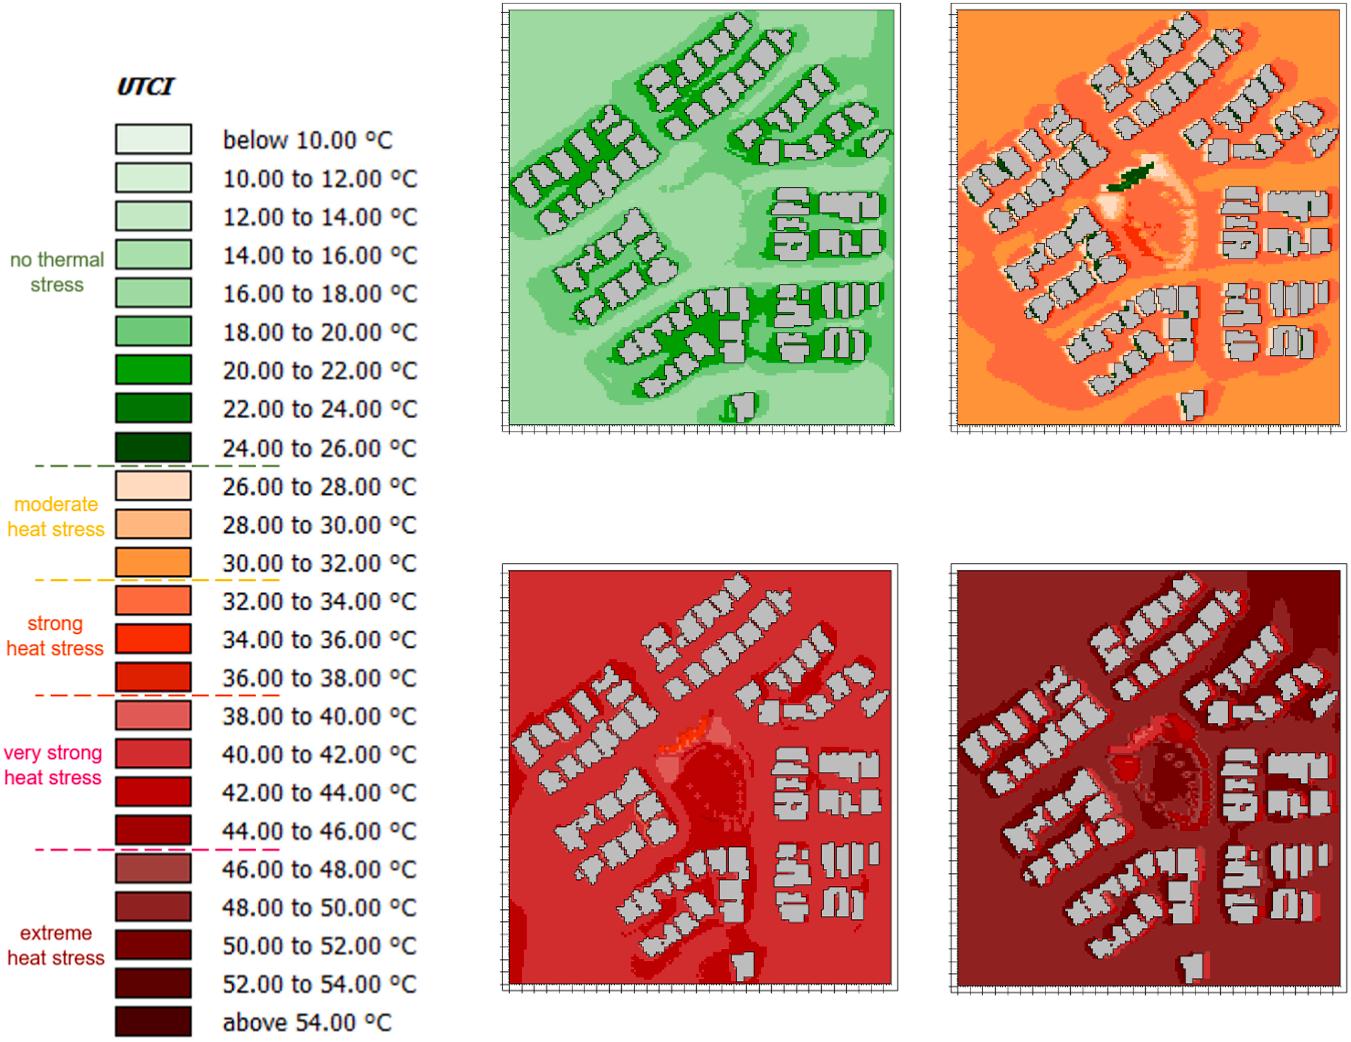
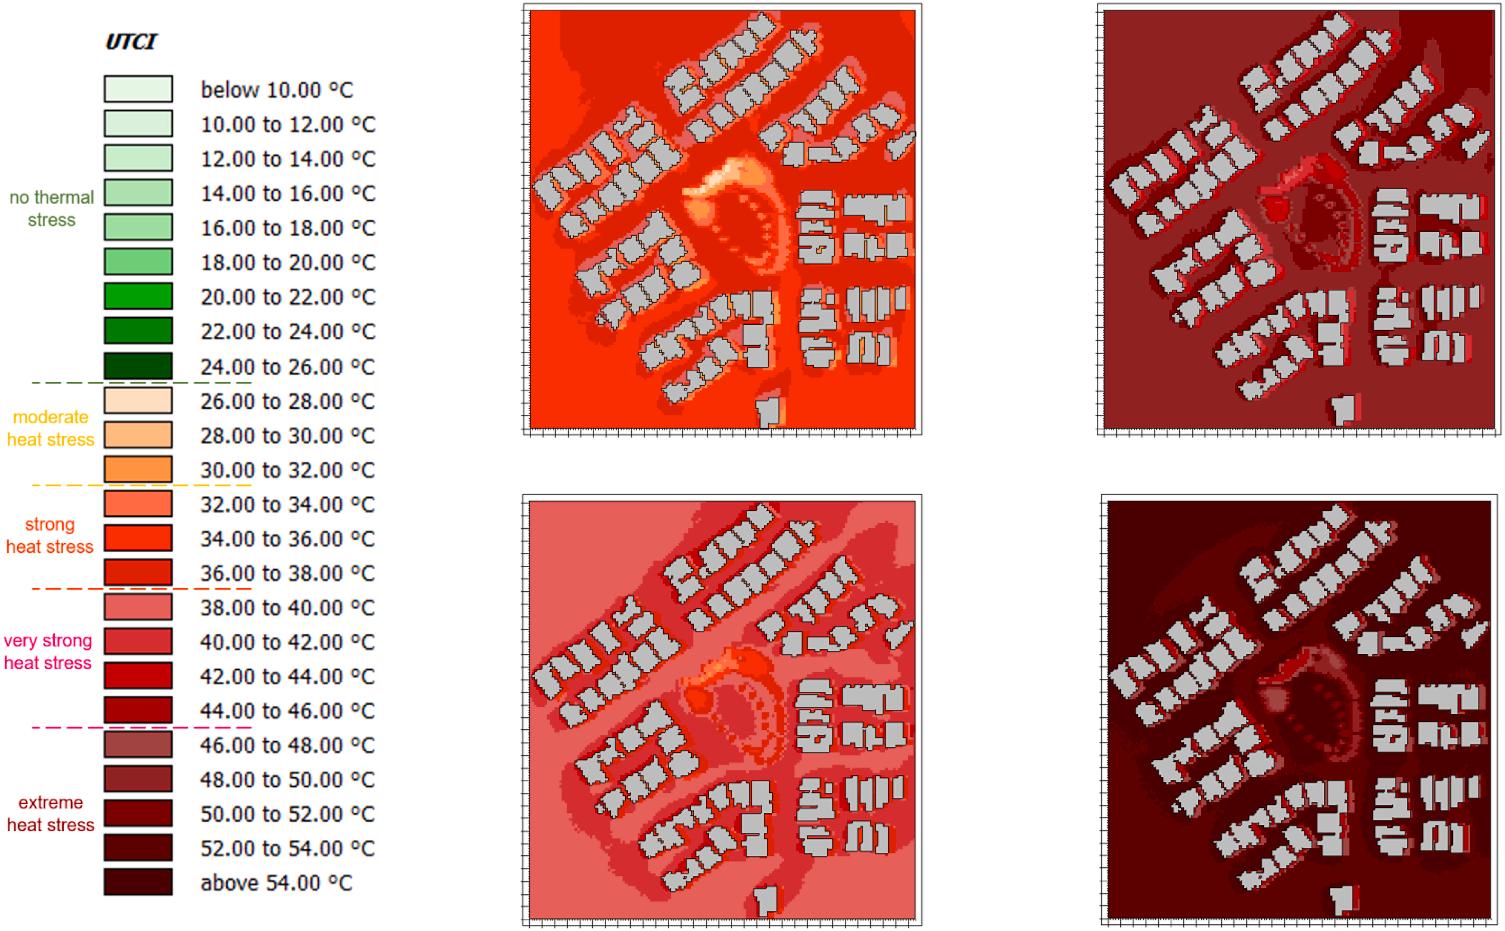
The results of the ENVI-met simulation for the present average day are shown through UTCI distribution maps at four time points in Table 2 The maps reveal differences in thermal comfort between tree-covered areas, open grassed areas on the park boundary, and the surrounding streets at all times:
• 6 am: UTCI values in all areas were in the ‘no thermal stress’ range (10.50–19.46◦ C). The grassed area in the middle of the park was 2–4◦ C colder (12–14◦ C) than the surrounding streets (14–18◦ C).
• 9 am: UTCI values remained in the ‘no thermal stress’ category, except near buildings showing ‘moderate heat stress’ The clustered tree-covered area in the north-easterly and north-westerly corners of the park (14–16◦ C) was 6◦ C cooler than the middle of the open grassed area (20–22◦ C) and 10–12◦ C cooler than surrounding streets (24–28.18◦ C).
• 12 pm: Most areas experienced ‘moderate heat stress’ , except under the deciduous Platanus x acerifolia trees in the northern part of the park, which had ‘no thermal stress’ The open grassed area in the middle of the park and surrounding streets showed ‘strong heat stress’ .
• 4 pm: The maximum temperature occurred at 4 pm, with most park areas experiencing ‘strong and very strong heat stress.’ Only the treecovered areas in the park’s north showed ‘moderate heat stress.’ These areas had a 9–12◦ C cooling benefit (26–30◦ C), while the southern shaded areas had a 6–8◦ C cooling benefit (30–34◦ C) compared to surrounding streets (36–39.83◦ C).
These results indicate that even on the hottest average summer day, tree shade improved park thermal comfort by 6–12◦ C UTCI compared to streets, with the northern cluster of Platanus x acerifolia trees consistently showing the lowest heat stress.
Present average summer day UTCI distribution maps.
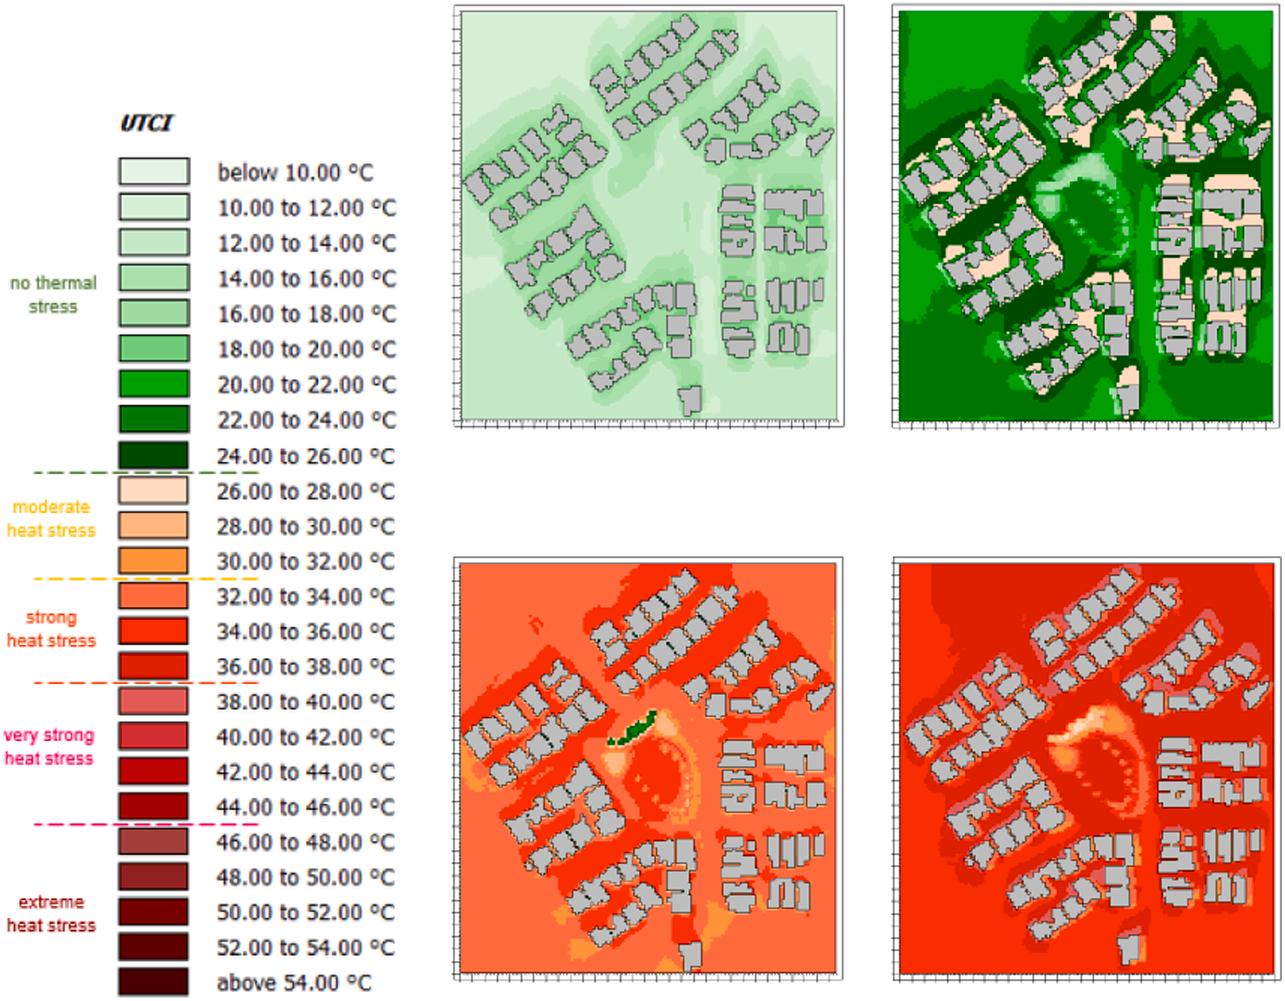
Table 3 presents distribution maps of meteorological variables driving UTCI scores. At 4 pm on average days, MRT under clustered treecovered areas (22.5–32.5◦ C) was approximately 10◦ C cooler than individually planted perimeter trees (32.5–42.5◦ C). The grassed area in the
middle of the park had an MRT of 50–52.5◦ C, while Surface Temperature (ST) under tree clusters (27.5–30.10◦ C) was at least 4◦ C lower than under individual trees (31.40–32.70◦ C), especially under Platanus x acerifolia. Open grassed areas displayed higher ST (32.70–34.00◦ C). The
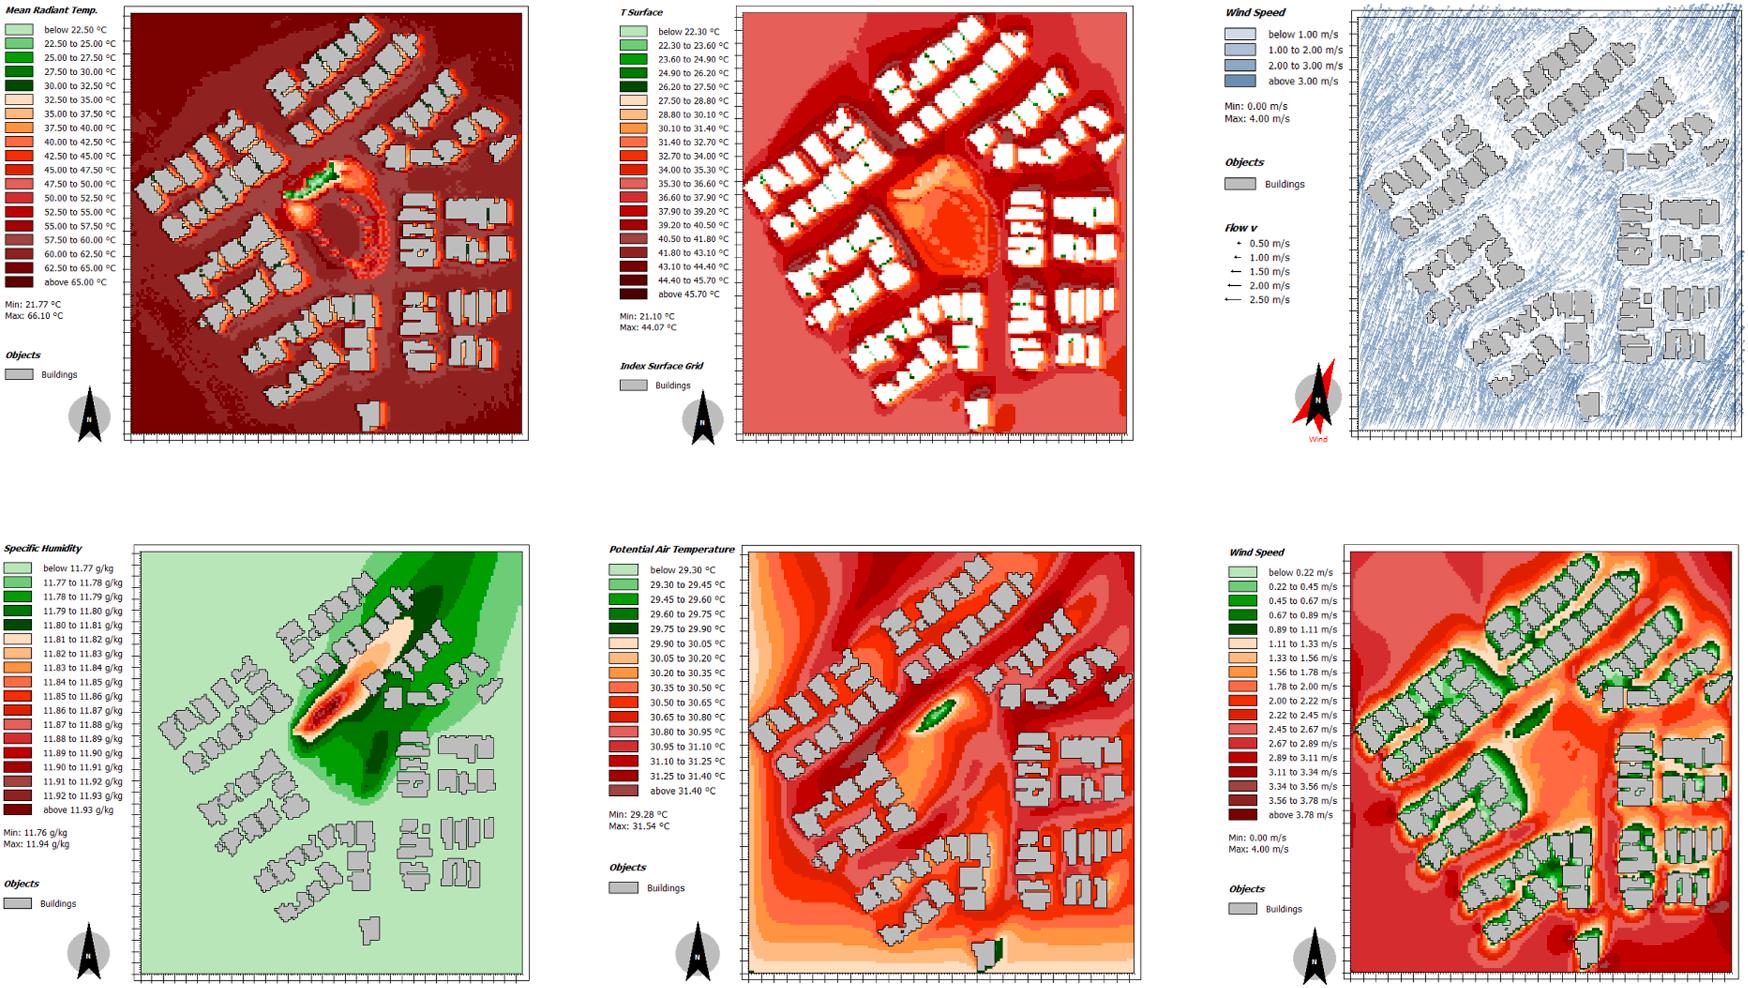
ST and air temperature at the park boundary were notably lower than surrounding areas. Trees influenced wind direction and speed, slightly slowing and redirecting the wind.
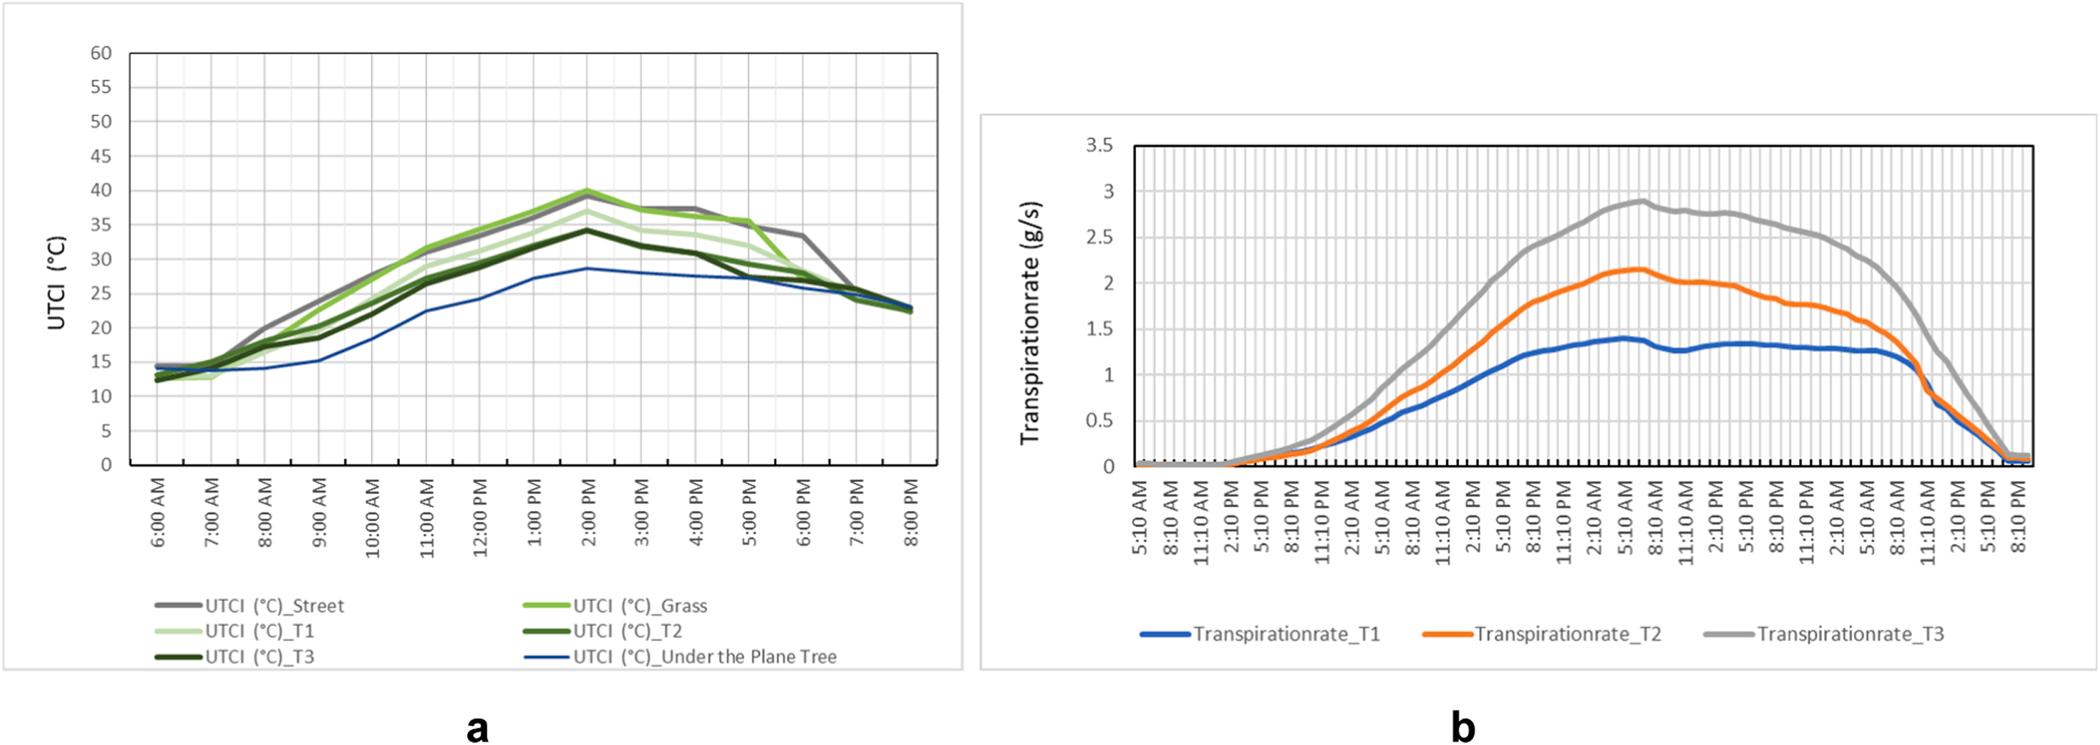
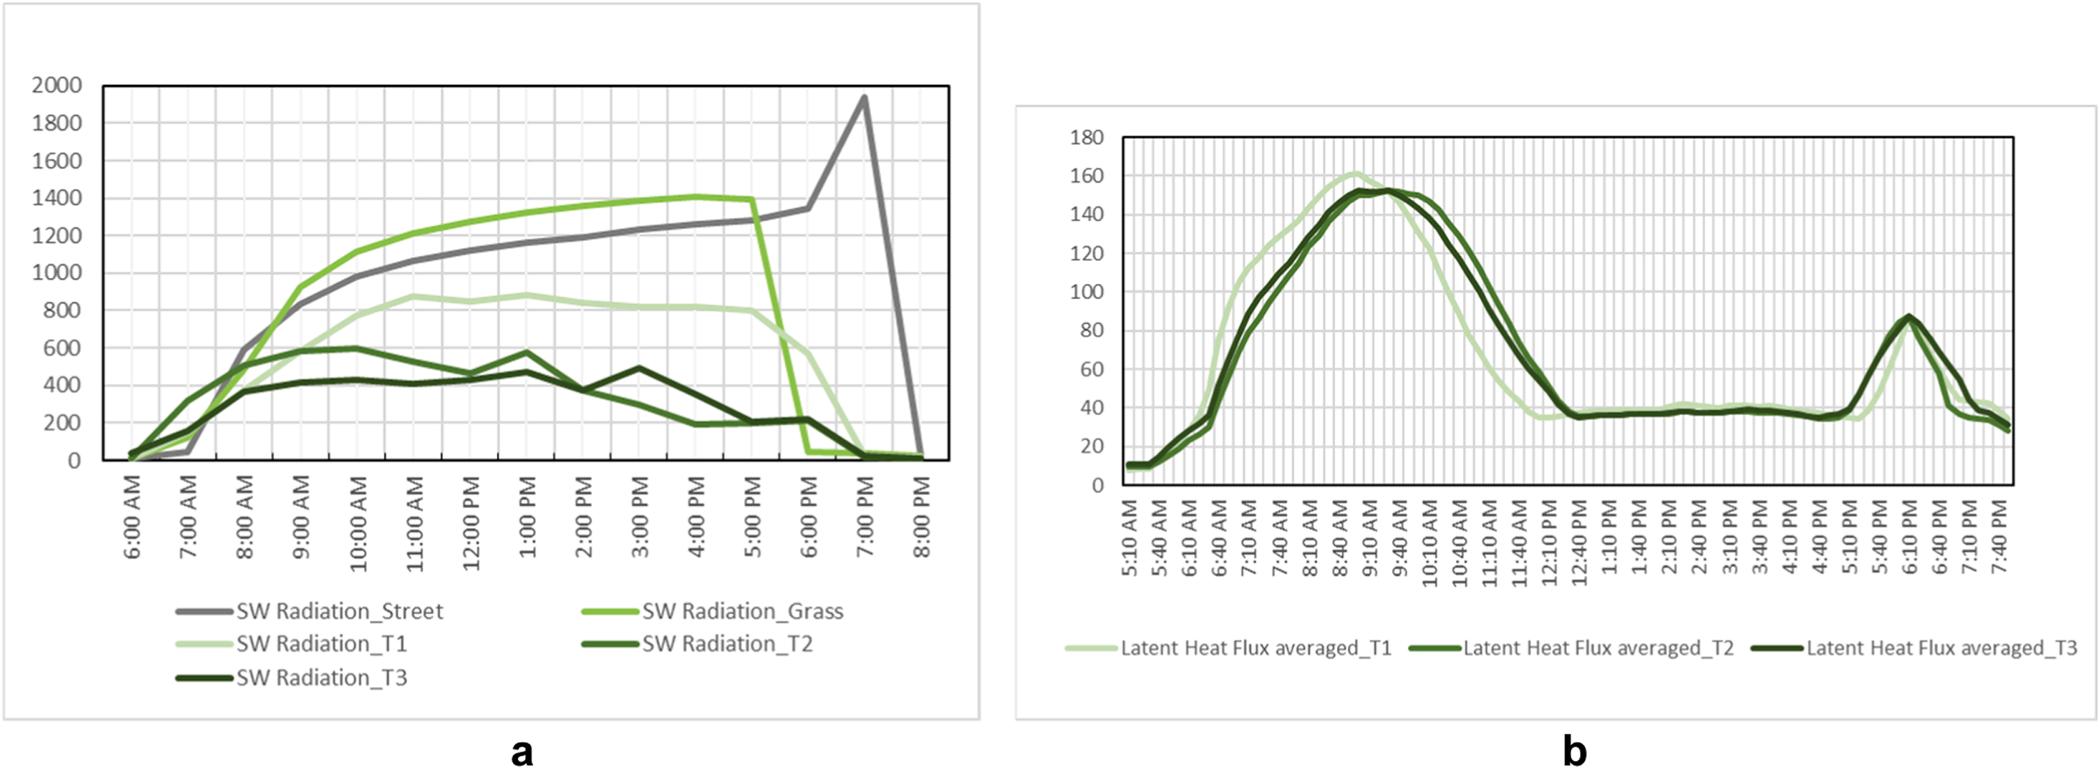
Fig. 6a compares UTCI values at 1.4 m height across six locations: street, open grassed areas, under 5.5 m (T1), 10.8 m (T2), and 14.5 m (T3) height trees (Fig. 3 a), and the cluster of Platanus x acerifolia trees. The results reveal 2.5–7.22◦ C cooling benefits under different trees compared to streets, attributed to shade and transpiration. Taller trees notably enhance thermal comfort, especially from 11 am to 6 pm, supported by higher transpiration rates (Fig. 6b). The Platanus x acerifolia cluster offers the most significant thermal comfort benefits.
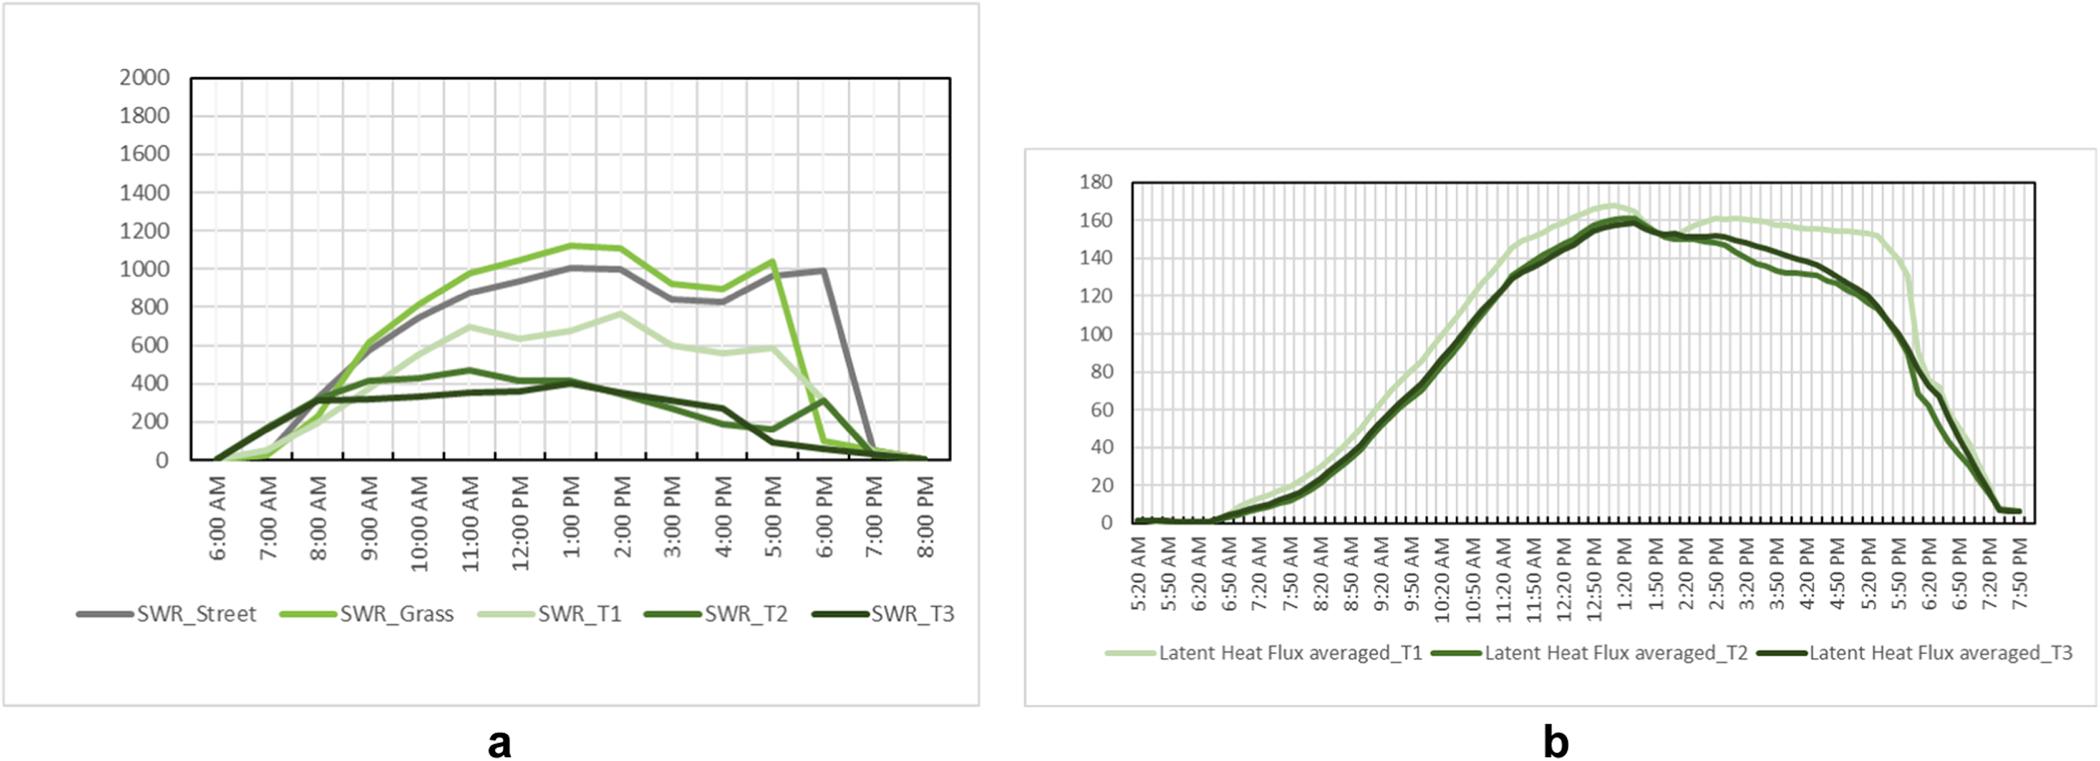
The benefit of shade under trees is reduced direct, diffused, and reflected shortwave radiation (SWR) and, to a lesser extent, long-wave radiation (LWR). Fig. 7a compares the SWR received by the street, grass and the three different trees. Due to the shade provision and the canopy width, the total SWR received under the three marked trees is less than the open grass area. The SWR decreases as the canopy width and the trunk height increase. Under the trees, the SWR is offset by the latent heat flux, which is the cooling energy produced by a plant through the evaporation of moisture through evapotranspiration (The correlation between the transpiration rate and latent heat flux for the three marked trees is illustrated in the graphs in Appendix A). The latent heat flux (associated with transpiration) under the three trees (Fig. 7b) is significant, albeit less than the received SWR, identifying that there are only marginal cooling benefits provided by transpiration and only directly under trees.
3.2.2. Present climate - hottest summer day
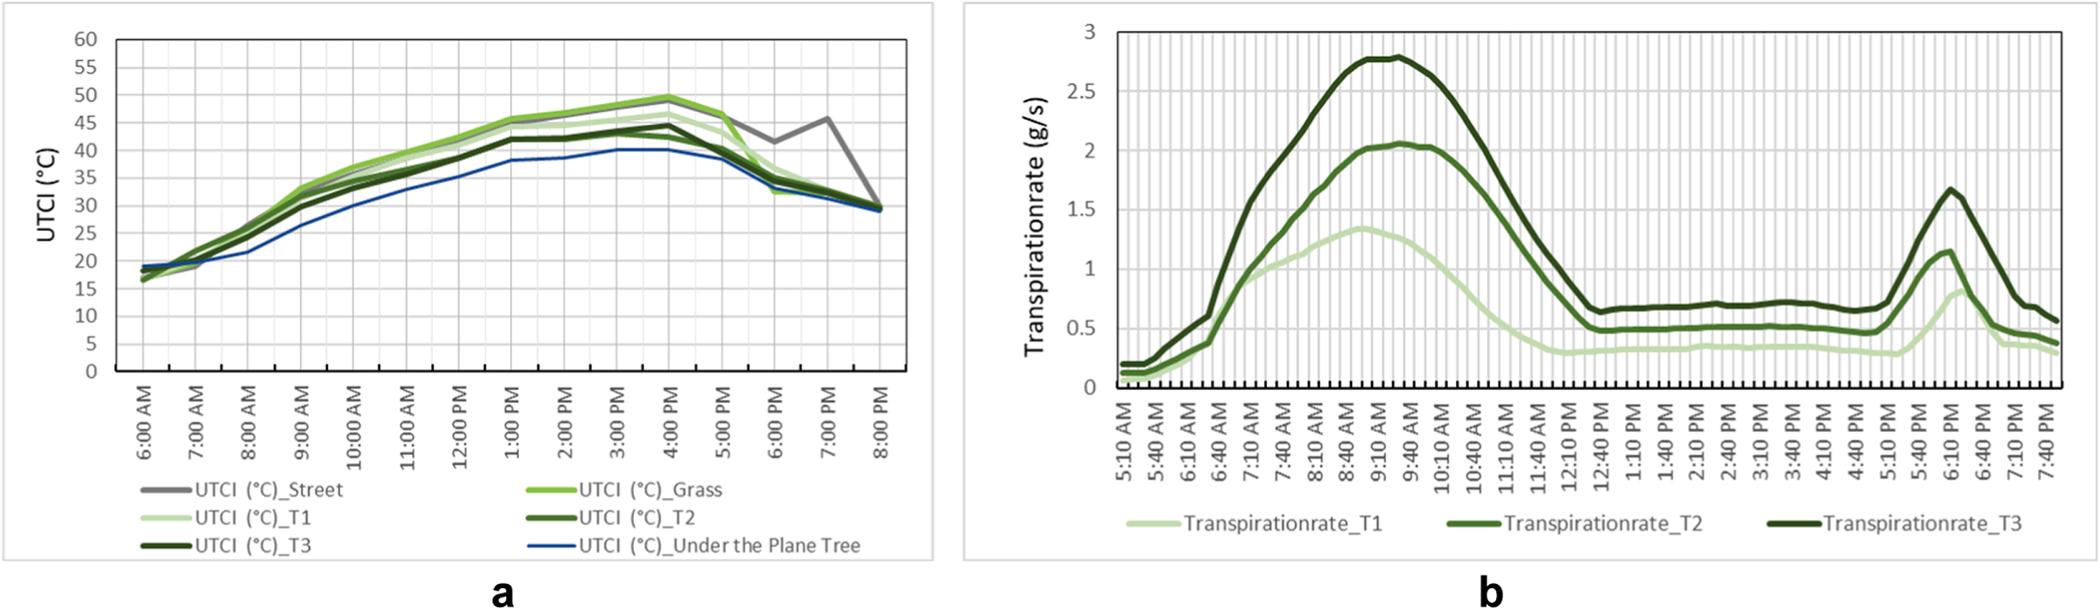
Thermal comfort (UTCI) results for the present hottest day are demonstrated at four time points in Table 4. At 6 am, all areas were in the “no thermal stress” range (15.99–21.68◦ C). At 9 am, most areas experienced “moderate” to “strong heat stress” (23.70–35.50◦ C), except for the clustered Platanus x acerifolia trees, which remained in the “no thermal stress” range. Trees within the park were 5–6◦ C cooler (26.00–30.00◦ C) than surrounding streets (32.00–35.50◦ C). At 12 pm, all areas fell into “strong” to “very strong heat stress” (33.54–44.27◦ C), but areas under trees still had lower UTCI values. At 4 pm, only the Platanus x acerifolia trees in the north avoided “very strong” to “extreme heat stress” (37.42–53.75◦ C), maintaining “moderate heat stress.” Again, clustered and individual trees showed lower UTCI values than open grass areas.
Fig. 8a compares UTCI values at 1.4 m height at six different points. The results show that the denser Platanus x acerifolia canopy and taller trees provide greater thermal benefits than younger trees, which have higher transpiration rates in the morning and evening. However, this
effect dissipates by midday (Fig. 8b). Open grass-covered areas only offer a thermal benefit over streets from 5 pm to 8 pm. Fig. 9 shows that the latent heat flux produced dissipates in accordance with transpiration by the trees and is less than the SWR received.
Table 5 displays UTCI distribution maps at 4 pm, the hottest time of the day in 2090. Table 6 shows UTCI comparison of the present and projected 2090 for average and hottest summer days under RCP 8.5 at six different points, including the street, middle of the open grass area, under the three marked trees (Fig. 3 a), and the Platanus x acerifolia tree cluster.
Simulations under the RCP 8.5 scenario indicated that maximum air temperature increased by around 4◦ C, reaching 35.38◦ C (average summer day) and 49.44◦ C (hottest summer day) in projected 2090. Despite this, Table 5 shows that the park would continue to provide relative cooling benefits. The intra-park UTCI values increased from the present day to 2090 in both the average and the hottest scenarios. The UTCI readings under the trees were 9–12◦ C lower than the surrounding buffer on average and a further 5◦ C up to 17◦ C lower on the hottest future scenario days, maintaining their relative cooling benefits.
Under the predicted RCP8.5 condition in 2090, the most significant cooling benefits were observed under the clustered deciduous treecovered areas in the northern part of the park, followed by the clustered and separated Eucalyptus marginata trees. The relativity between average and hottest days is unchanged (Table 6).
The greenhouse effect that gives rise to higher temperatures results from more heat being trapped in the atmosphere, and accordingly, LWR is increasing with climate change rather than SWR. The comparisons of LWR are provided in Table 7 to depict the impacts of climate change. The LWR is higher on the hottest summer day than the average summer day, and LWR is around 25 W/m2 higher in the future climate on average days and 50 W/m2 on the hottest days. Taller trees provide more shade, which leads to less SWR (as noted above), but the influence of LWR is less significant.
Table 8 compares the vapour flux to illustrate the transpiration changes between present and future average and hottest days. Trees with higher LADs (0.174, 0.154, 0.233) result in higher vapour flux, indicating increased transpiration, particularly in trees compared to the grass areas. On the present average summer day, transpiration peaks for both trees and grass occur between 11:00 am and 3:00 pm, but on the hottest days, peek transpiration for trees occurs at 09:00 am and decreases until 05:00 pm. Future predictions for 2090 show a similar trend, with decreased vapour flux and narrower duration.
4. Discussion
Outdoor human thermal comfort is an important factor in the liveability of urban areas (Lai et al., 2020). The design of nature-based solutions for public spaces presents one opportunity to mitigate the impacts of climate change whilst ensuring the amenity of public spaces to offer a comfortable outdoor environment for human activities (Coccolo et al., 2018). This study is unique in its use of ENVI-met to evaluate the role of shade and evapotranspiration mechanisms of different vegetation components in cooling a suburban park in both present and projected 2090 average and hottest summer climatic conditions in the Southern Hemisphere.
4.1. ENVI-met model validation
This study used ENVI-met climatic modelling software to assess the cooling benefit and thermal comfort performance of a suburban park in Perth, Australia. Validation is a critical element of simulation-based experimentation, as it determines how accurately a computer model represents the real world in the context of its intended application (Thacker et al., 2004). A growing body of studies has demonstrated the calibration of the ENVI-met model results to field measurements of air temperature, surface temperature, MRT, relative humidity, wind speed and human thermal comfort indices (Lam et al., 2021). Our field validation results, showing a high agreement between modelled and on-site
surface temperature (index of agreement d = 0.985; R2 =0.9417), provide confidence in the ability of ENVI-met to simulate urban environments in Perth’s particular climatic conditions and are comparable with other validation studies in Csa climates (Piselli et al., 2018) and from elsewhere (Jamei and Rajagopalan, 2019; Piselli et al., 2018; Simon et al., 2018; Yang et al., 2013).
4.2. Thermal performance and cooling mechanisms of the park in the present climate
Our study found that Colmworth Park provided negligible cooling effects beyond its boundaries in average and hot weather conditions. This finding aligns with previous research that examined different-sized parks and found smaller parks offer minimal microclimate benefits (i.e., cooling effect beyond the park boundary) (Al-Gretawee et al., 2016; Aram et al., 2019). Within the park, shaded areas significantly enhance thermal comfort for users in a small neighbourhood park. At 4:00 pm, when the temperature peaked, the coolest locations under clustered tree-covered areas improved thermal comfort by up to 12◦ C UTCI on an average summer day and 17◦ C UTCI on the hottest summer day. In contrast, open grass areas provided negligible benefits, which is consistent with previous research (Armson et al., 2012; Duncan et al.,
2019; Sodoudi et al., 2018; Tan et al., 2021). While heat stress in tree-covered areas was categorised as ‘moderate’ on average summer days, it intensified to ‘strong’ or ‘very strong’ on the hottest days (Table 9). Therefore, although the park offers some thermal comfort during typical summer conditions, it cannot be considered a reliable heat refuge on the hottest days.
The received SWR and latent heat flux comparison graphs (Figs. 7 and 9) depict the relative cooling benefits provided by shade and evapotranspiration. Although transpiration is evident (see the comparison of vapour flux on average and hottest days in Table 8), on the hottest days, transpiration decreases when leaf temperatures exceed 30 ◦ C after around 9 am, as stomata resistance starts increasing (see additional graphs in Appendix B and C). Evapotranspiration-related cooling is measured by the “latent heat flux” , which represents the amount of cooling energy produced by a plant due to the evaporation of transpired moisture. Under the trees, the received SWR and LWR are offset by the latent heat flux. As illustrated in Figs. 7 and 9, the “latent heat flux” is significantly less than the received SWR. Therefore, the cooling benefit from transpiration is marginal compared to the cooling effect of shade, even when transpiration occurs. This finding aligns with previous research by (Sun et al., 2017), which concluded that the stomatal behaviour of tree leaves directly affects the tree’s cooling ability in
Table 5
UTCI Distribution Maps of the Present and Projected 2090, Average and Hottest Summer Days at the Hottest Time of the Day, 4:00 pm, at 1.4 m Height.
6
Comparison of UTCI, Present and Projected 2090, Average and Hottest Summer Days, 1.4 m Height.
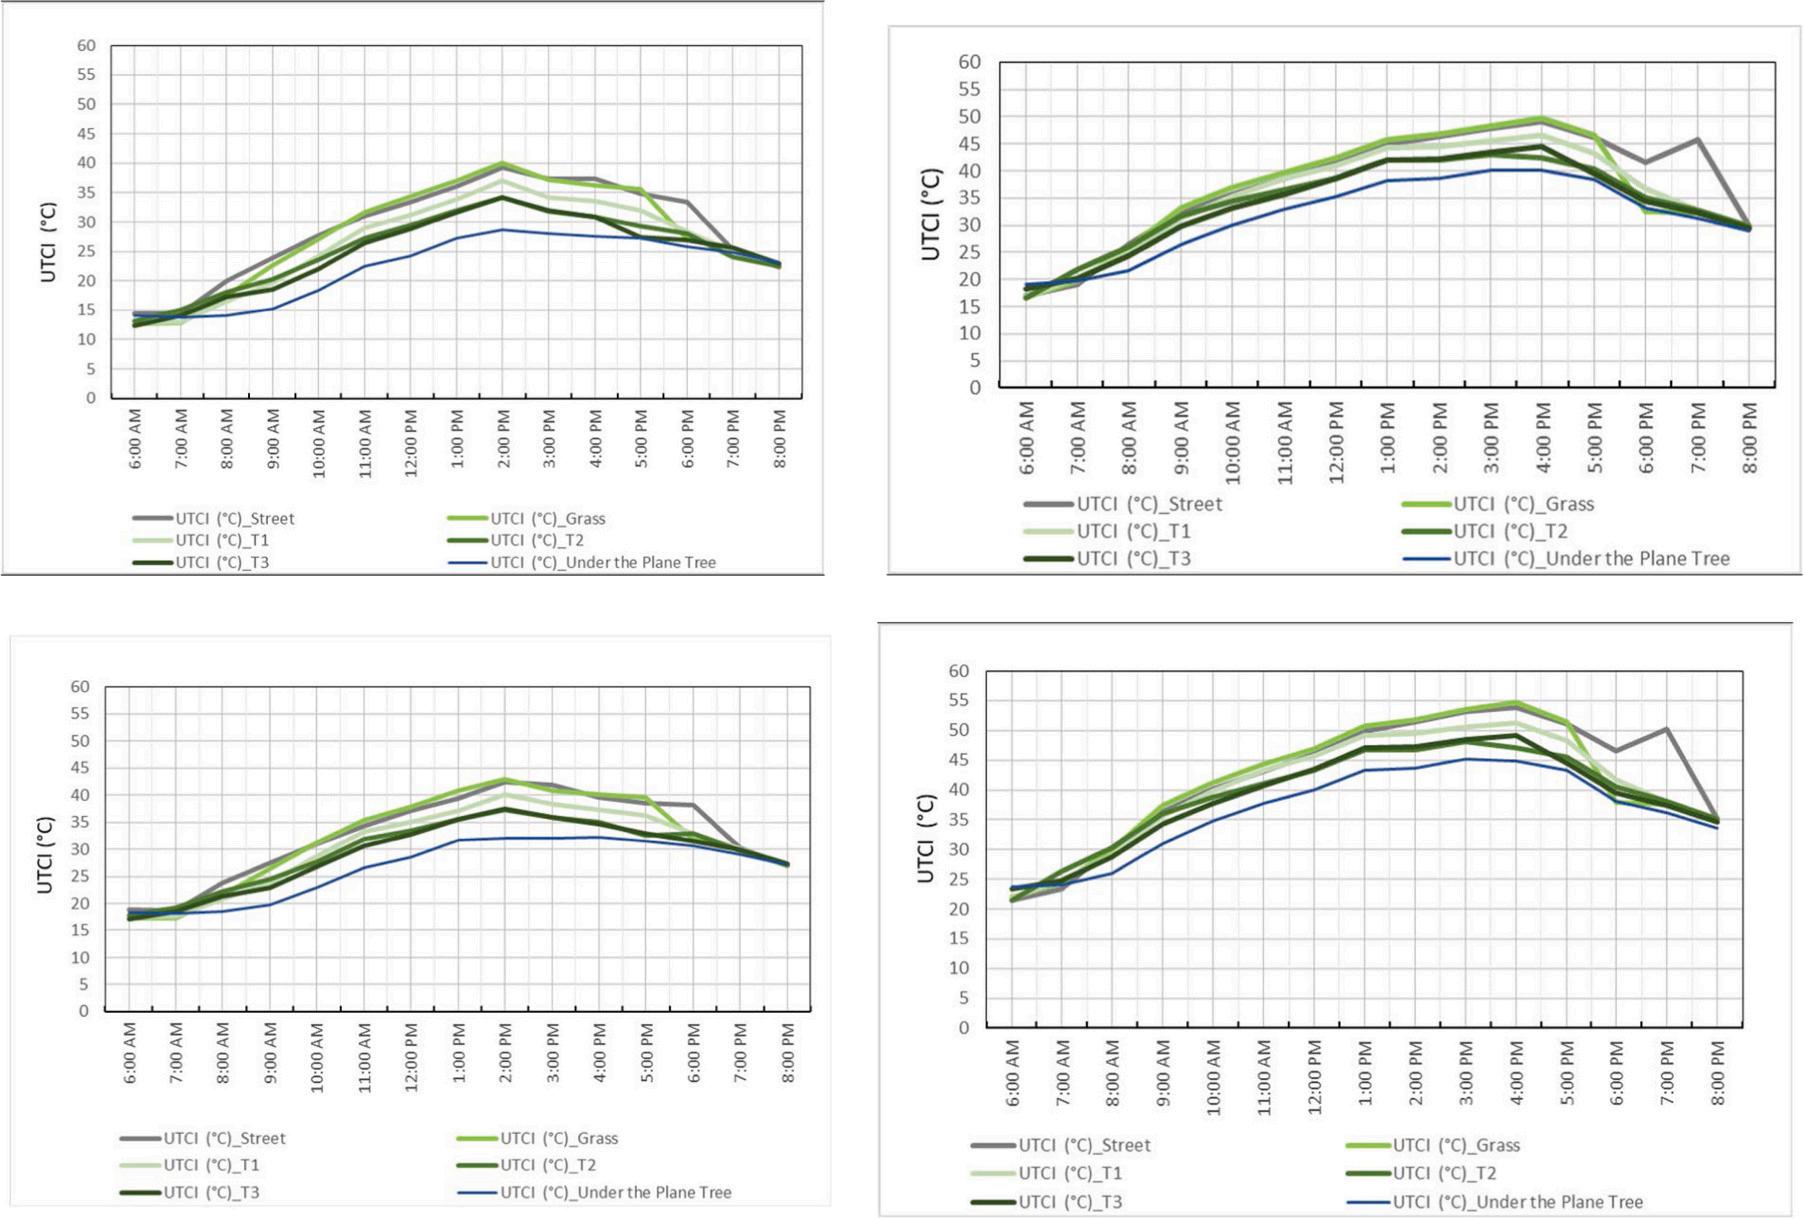
Table 7
Comparison of LWR, Present and Projected 2090, Average and Hottest Days, 1.4 m Height.

extreme heat situations. Given the minimal cooling effect of evapotranspiration, shade from trees provides the primary cooling benefit, although this is limited by the relatively small canopy cover of the park and individual tree clusters.
These findings confirm the impact of plant type and configuration, aligning with a study in Florence, Italy, which found that trees and tree shade, particularly tree canopy density, effectively cool and improve thermal comfort by reducing exposure to short- and long-wave radiation (Petralli et al., 2020). Consistent with previous research (Wujeska-Klause and Pfautsch, 2020), this study also demonstrated that denser tree canopies, achieved through tree clustering, significantly reduce the UTCI compared to individually planted trees around the park perimeter. While tree species affect cooling efficacy (Kukal and Irmak, 2018), a recent review highlighted that only a few studies have examined the impact of tree species on microclimate and human thermal comfort (Kong et al., 2017). Kong, Lau, and colleagues (Kong et al., 2017) investigated 12 tree species in a high-density area in Hong Kong, finding that species with large crowns and dense canopies most effectively reduced MRT, thereby enhancing thermal comfort. This study’s
comparison of three trees corroborated previous findings, showing that the taller tree with higher leaf area density (LAD) had higher transpiration rates and was a more effective barrier to SW radiation. The modelling in this study showed that large open grass areas provided minimal thermal comfort during the heat of the day. Although grass areas had slightly lower surface temperatures than surrounding streets, direct solar radiation offset this benefit. This finding aligns with previous research in Sydney, which shows that trees are more effective than grass in reducing land surface temperatures (Adams and Smith, 2014). Despite this, 37 % of studies in a review of 75 papers included grass as a UHI mitigation strategy (Balany et al., 2020). Our study found that trees offered greater cooling and thermal comfort benefits under all summer conditions due to shade provision, consistent with other research (Coutts et al., 2016; Lai et al., 2023; Liao et al., 2021; Sodoudi et al., 2018). Additionally, the results indicate that grass alone has little impact on thermal comfort, which aligns with other studies (Armson et al., 2012; Liao et al., 2021).
of Vapour Flux, Present and Projected 2090, Average and Hottest Days.
Summary of thermal comfort – present climate.
4.3. Thermal performance and cooling mechanisms of the park in future climates
On the projected 2090 average and hottest days (RCP 8.5 scenario), the maximum air temperature increased by 3.84◦ C on an average day and by 4.08◦ C on the hottest day. The model results reveal that the park will continue to provide some cooling benefits over the surrounding environment (see Table 10). Clustered trees provided 9–12◦ C UTCI and up to 17◦ C UTCI values lower than the surrounding streets. The most
significant cooling benefits were provided by the clustered deciduous tree-covered areas in the northern part of the park, followed by individually planted trees.
In the present climate, transpiration occurs throughout an average summer day but decreases on hot days as leaf temperatures rise. In the predicted 2090 climate, the duration and extent of transpiration further narrowed and reduced. Although the park offers some benefits over surrounding areas, this park environment does not sufficiently alleviate heat stress on the hottest days, either in the present or future climate.
Summary of thermal comfort – 2090 climate (RCP 8.5).
This research confirmed the previous findings by (Gherri et al., 2021), which concluded similar results for the present and 2050 projections by comparing thermal comfort values through modelling in the ENVI-met software.
This research represents the initial phase in refining guidelines for landscape architects to design climate-sensitive urban parks. Future research should investigate the role of irrigation and in enhancing the cooling benefits and thermal comfort provided by vegetation in urban parks, especially under conditions of reduced water availability. Additionally, studies should explore optimal vegetation arrangements to provide more precise guidance for designers and local councils on the species, configuration, and placement of trees that maximise thermal comfort both within parks and in their surrounding areas. As this study focused on a small neighbourhood park with limited tree coverage, future research should evaluate the cooling benefits of parks of varying sizes and vegetation configurations under projected future climate conditions. Moreover, future research should explore how the role of parks in providing climate regulation can be balanced against other ecosystem services, and park uses. Since Australian tree species are not included in the ENVI-met version 4.4.6 plant library, proxies were used in this study. Therefore, to advance research in this region, it is crucial to quantify the cooling effects of different indigenous tree species and their configurations in both current and future climates specific to Western Australia.
Modifying the vegetation arrangement in urban parks can improve the microclimate under the hot conditions projected to increase with climate change. Clustered trees have greater cooling benefits than a single tree, and trees offer more benefits than grass. In the southwest Australian climate, most benefits are derived from shade rather than evapotranspiration, which is limited in the afternoon hours of the hottest days due to stomata closure, which is evident even in the existing climate.
In order to increase the cooling performance of parks, more attention needs to be paid to the overall canopy coverage and the leaf area index (LAI) (the ratio of one-sided leaf area per unit ground area) of the tree species. Therefore, landscape architects and local governments who manage and maintain parks should emphasise the importance of integrating suitable coverage of appropriate trees in the park and surrounding streetscape to maximise the cooling benefits in future climate
change conditions. More attention needs to be paid to the behaviour of different plant species with respect to diminished evapotranspiration on hot days due to stomata closure.
By 2090, the absolute thermal comfort afforded by the current level of tree cover in existing parks of this kind will decline substantially. However, trees will continue to provide cooling benefits relative to the surroundings, although conditions on the hottest days will not alleviate heat stress in parks such as in this study. Therefore, solutions beyond conventional park design will be necessary to provide additional cooling benefits. Microclimatic analysis using ENVI-met can contribute to urban planners’ and policymakers’ efforts to design evidence-based, climatesensitive designs for urban parks.
Climate change will disproportionally impact vulnerable communities. Appropriate design/adaptation of urban parks to provide relief from hot weather will be an essential climate change adaptation measure, both for park users and to combat the urban heat island effects in park surroundings.
Maassoumeh Barghchi: Writing – review & editing, Writing –original draft, Visualization, Validation, Software, Resources, Methodology, Formal analysis, Conceptualization. Nicole Edwards: Writing –review & editing, Supervision, Methodology. Bill Grace: Writing – review & editing, Validation, Supervision, Software, Methodology. Paula Hooper: Writing – review & editing, Supervision, Methodology, Conceptualization. Julian Bolleter: Writing – review & editing, Supervision, Methodology, Conceptualization.
The authors declare that they have no known competing financial interests or personal relationships that could have appeared to influence the work reported in this paper.
This research was supported by an Australian Government Research Training Program (RTP) Scholarship awarded to the corresponding author. The Australian Urban Design Research Centre is funded by The Western Australian Planning Commission, the Department of Communities and Development WA. The authors also appreciate the thoughtful feedback, comments, and suggestions provided by the anonymous reviewers and the editor.
References
Abdallah, A.S.H., Hussein, S.W., Nayel, M., 2020. The impact of outdoor shading strategies on student thermal comfort in open spaces between education building.
Sustain. Cities Soc. 58
Adams, M.P., Smith, P.L., 2014. A systematic approach to model the influence of the type and density of vegetation cover on urban heat using remote sensing. Landsc. Urban Plan. 47–54
Albdour, M.S., Baranyai, B., 2019. An overview of microclimate tools for predicting the thermal comfort, meteorological parameters and design strategies in outdoor spaces. Pollack Period. Pollack Period. 14, 109–118
Al-Gretawee, H., Rayburg, S., Neave, M., 2016. The cooling effect of a medium sized park on an urban environment. Int. J. Geomate
Amani-Beni, M., Zhang, B., Xie, G.-D., Xu, J., 2018. Impact of urban park’s tree, grass and waterbody on microclimate in hot summer days: a case study of Olympic Park in Beijing, China. Urban For. Urban Green. 32, 1–6
Aram, F., Higueras García, E., Solgi, E., Mansournia, S., 2019. Urban green space cooling effect in cities. Heliyon 5, e01339 Aram, F., Solgi, E., Baghaee, S., Higueras García, E., Mosavi, A., Band, S.S., 2020. How parks provide thermal comfort perception in the metropolitan cores; a case study in Madrid Mediterranean climatic zone. Clim. Risk Manag. 30, 100245
Arboreal Tree [Mobile app]2021a.
Armson, D., Stringer, P., Ennos, A.R., 2012. The effect of tree shade and grass on surface and globe temperatures in an urban area. Urban For. Urban Green. 11, 245–255 ASHRAE, 2010. Thermal Environmental Conditions for Human Occupancy. Atwa, S., Ibrahim, M.G., Murata, R., 2020. Evaluation of plantation design methodology to improve the human thermal comfort in hot-arid climatic responsive open spaces. Sustain. Cities Soc. 59
Australian Academy of Science, 2021. The risks to Australia of a 3◦ c warmer world. Balany, F., Ng, A.W., Muttil, N., Muthukumaran, S., Wong, M.S., 2020. Green Infrastructure as an Urban Heat Island Mitigation Strategy A Review. Water 12. Bartesaghi Koc, C., Osmond, P., Peters, A., 2018. Evaluating the cooling effects of green infrastructure: a systematic review of methods, indicators and data sources. Sol. Energy 166, 486–508
Bowler, D.E., Buyung-Ali, L., Knight, T.M., Pullin, A.S., 2010. Urban greening to cool towns and cities: a systematic review of the empirical evidence. Landsc. Urban Plan. 97, 147–155
Britannica, T.Eo.E., 2020. evapotranspiration.
Bruse, M., 2004. ENVI-met implementation of the Jacobs A g s Model to calculate the stomata conductance (Working paper).
Bruse, D., 2017. Decoding Urban Nature.
Bureau of Meteorology, 2022. Daily maximum temperature Perth Metro. Carter, J.G., 2011. Climate change adaptation in European cities. Curr. Opin. Environ. Sustain. 3, 193–198
Cheng, Y., Farmer, J.R., Dickinson, S.L., Robeson, S.M., Fischer, B.C., Reynolds, H.L., 2021. Climate change impacts and urban green space adaptation efforts: evidence from U.S. municipal parks and recreation departments. Urban Clim. 39, 100962.
Chow, Winston T.L., Akbar, Siti Nur Assyakirin Binte Ali, Heng, Su Li, Roth, Matthias, 2016. Assessment of measured and perceived microclimates within a tropical urban forest. Urban For. Urban Green. 16, 62–75
Coccolo, S., Pearlmutter, D., Kaempf, J., Scartezzini, J.-L., 2018. Thermal Comfort Maps to estimate the impact of urban greening on the outdoor human comfort. Urban For. Urban Green. 35, 91–105
Coutts, A.M., White, E.C., Tapper, N.J., Beringer, J., Livesley, S.J., 2015. Temperature and human thermal comfort effects of street trees across three contrasting street canyon environments. Theor. Appl. Climatol. 124, 55–68
Coutts, A.M., White, E.C., Tapper, N.J., Beringer, J., Livesley, S.J., 2016. Temperature and human thermal comfort effects of street trees across three contrasting street canyon environments. Theor. Appl. Climatol. 124, 55–68
DP, 2015. Liveable Neighbourhoods, in: Planning, D.o. (Ed.). Government of Western Australia.
Duncan, J.M.A., Boruff, B., Saunders, A., Sun, Q., Hurley, J., Amati, M., 2019. Turning down the heat: an enhanced understanding of the relationship between urban vegetation and surface temperature at the city scale. Sci. Total Environ. 656, 118–128
Duursma, R.A., Blackman, C.J., Lop´ ez, R., Martin-StPaul, N.K., Cochard, H., Medlyn, B. E., 2019. On the minimum leaf conductance: its role in models of plant water use, and ecological and environmental controls. N. Phytol. 221, 693–705
Emmanuel, R., Loconsole, A., 2015. Green infrastructure as an adaptation approach to tackling urban overheating in the Glasgow Clyde Valley Region, UK. Landsc. Urban Plan. 138, 71–86 ENVI-admin, n.d. ENVI-met BIO-met.
ENVI-met 4.4.6 ed. 2021. ENVI-met GmbH, Germany.
Fiala, D., Havenith, G., Brode, P., Kampmann, B., Jendritzky, G., 2012. UTCI-Fiala multinode model of human heat transfer and temperature regulation. Int. J. Biometeorol. 56, 429–441
Fischereit, J., Schlünzen, K.H., 2018. Evaluation of thermal indices for their applicability in obstacle-resolving meteorology models. Int. J. Biometeorol. 62, 1887–1900 FLUKE, 2021. FLUKE TIS45 Infrared camera.
Frantzeskaki, N., McPhearson, T., Collier, M.J., Kendal, D., Bulkeley, H., Dumitru, A., Walsh, C., Noble, K., van Wyk, E., Ord ´ onez, C., Oke, C., Pint´ er, L., 2019. Naturebased solutions for urban climate change adaptation: linking science, policy, and practice communities for evidence-based decision-making. BioScience 69, 455–466. Gal, C., Kantor, N., 2020. Modeling mean radiant temperature in outdoor spaces, A comparative numerical simulation and validation study. Urban Clim. 32, 100571 Gherri, B., Maiullari, D., Finizza, C., Maretto, M., Naboni, E., 2021. On the thermal resilience of venetian open spaces. Heritage 4 Government, A., 2020. In: Climate Change, E., the Environment and Water (Eds.), Weather files for commercial building energy modelling. Australian Government Government of Australia Department of the Environment and Energy, B.o.M., 2016. Australias Changing Climate. Government of Western Australia, 2021. Western Australian climate projections, in: Regulation, D.o.W.a.E. (Ed.). GPS Kit [Mobile app]2021c.
Howe, D.A., Hathaway, J.M., Ellis, K.N., Mason, L.R., 2017. Spatial and temporal variability of air temperature across urban neighborhoods with varying amounts of tree canopy. Urban For. Urban Green. 27, 109–116
Intergovernmental Panel on Climate, C., 2023. Climate Change 2022 – Impacts, Adaptation and Vulnerability: Working Group II Contribution to the Sixth Assessment Report of the Intergovernmental Panel on Climate Change. Cambridge University Press, Cambridge. IPCC, 2022. IPCC Working Group II Sixth Assessment Report.
Jamei, E., Rajagopalan, P., 2019. Effect of street design on pedestrian thermal comfort. Archit. Sci. Rev. 62, 92–111
Jamei, E., Seyedmahmoudian, M., Horan, B., Stojcevski, A., 2019. Verification of a bioclimatic modeling system in a growing suburb in Melbourne. Sci. Total Environ. 689, 883–898.
Jim, C.Y., Lo, A.Y., Byrne, J.A., 2015. Charting the green and climate-adaptive city. Landsc. Urban Plan. 138, 51–53
Jubb, I., Canadell, P., Dix, M., 2016. Representative Concentration. Pathways (RCPs). Bureau of Meteorology & CSIRO
Kong, L., Lau, K.K.-L., Yuan, C., Chen, Y., Xu, Y., Ren, C., Ng, E., 2017. Regulation of outdoor thermal comfort by trees in Hong Kong. Sustain. Cities Soc. 31, 12–25
Kukal, M.S., Irmak, S., 2018. Climate-Driven Crop Yield and Yield Variability and Climate Change Impacts on the U.S. Great Plains Agricultural Production. Scientific Reports 8, 3450.
Lai, D., Lian, Z., Liu, W., Guo, C., Liu, W., Liu, K., Chen, Q., 2020. A comprehensive review of thermal comfort studies in urban open spaces. Sci. Total Environ. 742
Lai, D., Liu, Y., Liao, M., Yu, B., 2023. Effects of different tree layouts on outdoor thermal comfort of green space in summer Shanghai. Urban Clim. 47, 101398
Lam, C.K.C., Lee, H., Yang, S.-R., Park, S., 2021. A review on the significance and perspective of the numerical simulations of outdoor thermal environment. Sustain. Cities Soc. 71, 102971
Li, H., 2016. Impacts of pavement strategies on human thermal comfort. In: Li, H. (Ed.), Pavement Materials for Heat Island Mitigation. Butterworth-Heinemann, Boston, pp. 281–306
Li, R.M., Roth, M., 2009. SPATIAL VARIATION OF THE CANOPY-LEVEL URBAN HEAT ISLAND IN SINGAPORE, The seventh International Conference on Urban Climate, Yokohama, Japan.
Liao, J., Tan, X., Li, J., 2021. Evaluating the vertical cooling performances of urban vegetation scenarios in a residential environment. J. Build. Eng. 39, 102313.
Lin, B., Meyers, J., Beaty, R., Barnett, G., 2016. Urban green infrastructure impacts on climate regulation services in Sydney, Australia. Sustain. (Basel, Switz. ) 8, 788
Lin, W., Yu, T., Chang, X., Wu, W., Zhang, Y., 2015. Calculating cooling extents of green parks using remote sensing: method and test. Landsc. Urban Plan. 134, 66–75
Meili, N., Manoli, G., Burlando, P., Carmeliet, J., Chow, W.T.L., Coutts, A.M., Roth, M., Velasco, E., Vivoni, E.R., Fatichi, S., 2021. Tree effects on urban microclimate: diurnal, seasonal, and climatic temperature differences explained by separating radiation, evapotranspiration, and roughness effects. Urban For. Urban Green. 58, 126970
Morakinyo, T.E., Kong, L., Lau, K.K.-L., Yuan, C., Ng, E., 2017. A study on the impact of shadow-cast and tree species on in-canyon and neighborhood s thermal comfort. Build. Environ. 115, 1–17
Morakinyo, T.E., Lau, K.K.-L., Ren, C., Ng, E., 2018. Performance of Hong Kong’s common trees species for outdoor temperature regulation, thermal comfort and energy saving. Build. Environ. 137, 157–170
Murakami, S., 2006. Environmental design of outdoor climate based on CFD. Fluid Dyn. Res. 38, 108–126
Noro, M., Lazzarin, R., 2015. Urban heat island in Padua, Italy: simulation analysis and mitigation strategies. Urban Clim. 14, 187–196
Palomo Amores, T.R., Sanchez Ramos, J., Guerrero Delgado, M., Castro Medina, D., Cerezo-Narvaez, A., ´ Alvarez Domínguez, S., 2023. Effect of green infrastructures supported by adaptative solar shading systems on livability in open spaces. Urban For. Urban Green. 82, 127886
Park, S., Tuller, S., Jo, M., 2014. Application of Universal Thermal Climate Index (UTCI) for microclimatic analysis in urban thermal environments. Landsc. Urban Plan. 125, 146–155
Parks, Ozkeresteci, 2003. Use and Evaluation of the Envi-Met Model for Environmental Design and Planning: An Experiment on Linear Parks, 21st International Cartographic Conference (ICC) ‘Cartographic Renaissance’ , Durban, South Africa.
Petralli, M., Massetti, L., Pearlmutter, D., Brandani, G., Messeri, A., Orlandini, S., 2020. UTCI field measurements in an urban park in Florence (Italy). Misc. Geogr. 24. Piselli, C., Castaldo, V.L., Pigliautile, I., Pisello, A.L., Cotana, F., 2018. Outdoor comfort conditions in urban areas: on citizens’ perspective about microclimate mitigation of urban transit areas. Sustain. Cities Soc. 39, 16–36
Plant Identification Australia [Mobile app]. 2021d.
Rakoto, P.Y., Deilami, K., Hurley, J., Amati, M., Sun, Q., 2021. Revisiting the cooling effects of urban greening: planning implications of vegetation types and spatial configuration. Urban For. Urban Green. 64, 127266
Rubel, F., Kottek, M., 2010. World Maps of Koppen-Geiger Climate Classification, Austria.
Salata, F., Golasi, I., de Lieto Vollaro, R., de Lieto Vollaro, A., 2016. Urban microclimate and outdoor thermal comfort. A proper procedure to fit ENVI-met simulation outputs to experimental data. Sustain. Cities Soc. 26, 318–343
Semeraro, T., Gatto, E., De Bellis, L., Luvisi, A., Emmanuel, R., Buccolieri, R., 2023. A decision-making framework for promoting the optimum design and planning of Nature-based Solutions at local scale. Urban For. Urban Green. 84, 127945
Shooshtarian, S., Lam, C.K.C., Kenawy, I., 2020. Outdoor thermal comfort assessment: a review on thermal comfort research in Australia. Build. Environ. 177, 106917
Simon, H., Lind´ en, J., Hoffmann, D., Braun, P., Bruse, M., Esper, J., 2018. Modeling transpiration and leaf temperature of urban trees – a case study evaluating the microclimate model ENVI-met against measurement data. Landsc. Urban Plan. 174, 33–40
Sodoudi, S., Zhang, H., Chi, X., Müller, F., Li, H., 2018. The influence of spatial configuration of green areas on microclimate and thermal comfort. Urban For. Urban Green. 34, 85–96.
Staiger, H., Laschewski, G., Gratz, A., 2012. The perceived temperature – a versatile index for the assessment of the human thermal environment. Part A: scientific basics. Int. J. Biometeorol. 56, 165–176
Sun, S., Xu, X., Lao, Z., Liu, W., Li, Z., Higueras García, E., He, L., Zhu, J., 2017. Evaluating the impact of urban green space and landscape design parameters on thermal comfort in hot summer by numerical simulation. Build. Environ. 123, 277–288
Taleghani, M., Kleerekoper, L., Tenpierik, M., van den Dobbelsteen, A., 2015. Outdoor thermal comfort within five different urban forms in the Netherlands. Build. Environ. 83, 65–78
Tan, X., Liao, J., Bedra, K.B., Li, J., 2021. Evaluating the 3D cooling performances of different vegetation combinations in the urban area. J. Asian Archit. Build. Eng. 21, 1124–1136
Thacker, B., S.W..Doebling, Hemez, F., Anderson, M., Pepin, J.E., Rodriguez, E., 2004. Concepts of Model Verification and Validation.
Toparlar, Y., Blocken, B., Maiheu, B., van Heijst, G.J.F., 2017. A review on the CFD analysis of urban microclimate. Renew. Sustain. Energy Rev. 80, 1613–1640
Wujeska-Klause, A., Pfautsch, S., 2020. The best urban trees for daytime cooling leave nights slightly warmer. Forests 11
Yan, H., Wu, F., Dong, L., 2018. Influence of a large urban park on the local urban thermal environment. Sci. Total Environ. 622-623, 882–891
Yang, C., He, X., Wang, R., Yan, F., Yu, L., Bu, K., Yang, J., Chang, L., Zhang, S., 2017. The effect of urban green spaces on the urban thermal environment and its seasonal variations. Forests 8.
Yang, X., Zhao, L., Bruse, M., Meng, Q., 2013. Evaluation of a microclimate model for predicting the thermal behavior of different ground surfaces. Build. Environ. 60, 93–104
Yilmaz, S., Mutlu, E., Yilmaz, H., 2018. Alternative scenarios for ecological urbanizations using ENVI-met model. Environ. Sci. Pollut. Res Int 25, 26307–26321
Young, E., 2015. Research reveals Perth’s hottest real estate in terms of tree cover, WAtoday.
Zander, K.K., Botzen, W.J., Oppermann, E., Kjellstrom, T., Garnett, S.T., 2015. Heat stress causes substantial labour productivity loss in Australia. Nat. Clim. Change 5, 647–651
Zhang, L., Wei, D., Hou, Y., Du, J., Liu, Za, Zhang, G., Shi, L., 2020. Outdoor thermal comfort of urban park a case study. Sustainability 12
Zhao, Q., Lian, Z., Lai, D., 2021. Thermal comfort models and their developments: a review. Energy Built Environ. 2, 21–33
Zhao, Q., Sailor, D.J., Wentz, E.A., 2018. Impact of tree locations and arrangements on outdoor microclimates and human thermal comfort in an urban residential environment. Urban For. Urban Green. 32, 81–91
Zhengen Ren, Zhi Tang, James, M., 2021. Typical meteorological year weather files for building energy modelling in: CSIRO (Ed.).