This article was downloaded by: [William Grace]
On: 20 August 2015, At: 21:41
Publisher: Routledge
Informa Ltd Registered in England and Wales Registered Number: 1072954 Registered office: 5 Howick Place, London, SW1P 1WG


Click for updates

This article was downloaded by: [William Grace]
On: 20 August 2015, At: 21:41
Publisher: Routledge
Informa Ltd Registered in England and Wales Registered Number: 1072954 Registered office: 5 Howick Place, London, SW1P 1WG
Click for updates
Publication details, including instructions for authors and subscription information: http://www.tandfonline.com/loi/rjnr20
William Gracea a Australian Urban Design Research Centre, University of Western Australia, Perth, Australia Published online: 04 Jun 2015.
To cite this article: William Grace (2015): Simulating sustainability: a resources perspective, Journal of Natural Resources Policy Research, DOI: 10.1080/19390459.2015.1050202
To link to this article: http://dx.doi.org/10.1080/19390459.2015.1050202
Taylor & Francis makes every effort to ensure the accuracy of all the information (the “Content”) contained in the publications on our platform. However, Taylor & Francis, our agents, and our licensors make no representations or warranties whatsoever as to the accuracy, completeness, or suitability for any purpose of the Content. Any opinions and views expressed in this publication are the opinions and views of the authors, and are not the views of or endorsed by Taylor & Francis. The accuracy of the Content should not be relied upon and should be independently verified with primary sources of information. Taylor and Francis shall not be liable for any losses, actions, claims, proceedings, demands, costs, expenses, damages, and other liabilities whatsoever or howsoever caused arising directly or indirectly in connection with, in relation to or arising out of the use of the Content.
This article may be used for research, teaching, and private study purposes. Any substantial or systematic reproduction, redistribution, reselling, loan, sub-licensing, systematic supply, or distribution in any form to anyone is expressly forbidden. Terms &
JournalofNaturalResourcesPolicyResearch,2015 http://dx.doi.org/10.1080/19390459.2015.1050202

WilliamGrace*
AustralianUrbanDesignResearchCentre,UniversityofWesternAustralia,Perth,Australia
Aglobalpopulation–economy–resourcemodelexploresthefutureimpactofdeclining resourceavailabilityontheworldeconomy.Themodeltracksthelikelyfutureconsumptionofrenewableresources,fossilfuelsandnon-renewablematerialsandthe economicimpactofavailability.Scarcitywilllikelybecomeevidentduringthelatter partofthiscenturyandconstraineconomicproduction,reducingincomepercapita, livingstandardsandultimatelypopulation.Policyinterventionsinvolvingarapid transitionfromfossilfuelstorenewableenergy,reducedresourceintensityandmaterialsrecyclingarenecessarytocorrectthistrajectoryandfacilitateongoingimprovementsinglobalaveragelivingstandards.
Keywords: sustainability;population;resources;scarcity;limits;systems
1.Introduction
Inorderforpeopleeverywheretoattainandretainareasonablequalityoflife(i.e.,to achieveenduringhumanwellbeing),humansocietymustlivewithinthelimitsimposed bythebio-physicalworld.Thisistheessentialmessageconveyedinitiallybythefindings ofSystemDynamicsresearchintheearly1970s(e.g.,WorldDynamicsandLimitsto Growth)andnumerousresearcherssince.
UsingthetechniqueofSystemDynamics,theWorldDynamicsandLimitstoGrowth modelsestablishacausalstructurelinkinglivingstandards(thebasicconstituentof wellbeing)toproductionandconsumptionofrenewableandnon-renewableresources andpollutionabsorptioncapacity.Thesemodelsoperateattheglobalscale.However, effectivemanagementofproductionandconsumptioncannotoccur(presently)atthat scale.Thenear-termsystembehaviorattheglobalscalewill ‘emerge’ frominteractionsat smallerscales – nations,regionsandcities.Howevernocountrycanbe ‘sustainable’ in isolationandsoanymodelthatoperatesatthatscalemustreflectthekeyexogenous variablesarisingfromtheglobalscaleresourceflows.
Theworkdescribedhereusesarelativelysimplepopulation–economy–resource modeltoexplorethetrajectoryoftheworldsystemandtheimplicationsforenduring humanwellbeing.ThepurposeofthemodelisnottoprovideanalternativetotheLimits toGrowthWorld3modelbutrathertoestablishasimplifiedversionthatusesreadily availablemetricsforwhichdataisavailableatnationalandregionalscales.Thesame modelarchitecturecanthenbeusedasabasisforsmallerscaleversionsofthemodel which,whilebeingreflectiveoftheglobaldynamics,facilitatesexplorationofhighlevel policyoptionswithrespecttoresourceuseatthatscale.
*Email: bill.grace@uwa.edu.au
JayW.Forrester ’slandmarkwork, WorldDynamics (Forrester, 1971),wasthepredecessorof better-knownglobalmodelsthatfollowed.Forrester’sWorld2model,whichusedtheSystem DynamicstechniqueintheDYNAMOprogramminglanguage,linkedpopulation,natural resourcesuse,capitalinvestment,foodandpollution.Themodelhighlightedthepotential limitstopopulationgrowtharisingfromcrowding,foodsupply,pollutionandnatural resources. 1 Anumberofotherglobalmodelshavebeenproducedsince,asdocumentedby severalauthors(Castro&Jacovkis, 2015;Meadows,Richardson,&Bruckmann, 1982).
IncludedintheseisthefamousLimitstoGrowthstudy(Meadows,Meadows, Randers,&Behrens, 1972)whichbuiltonForrester ’sworkin WorldDynamics viathe World3modelusingtheSTELLAsoftware.KeyvariablesintheWorld3modelincluded worldpopulation,industrialization,pollution,foodproductionandresourcedepletion. Themodelexploredvariousscenariosforthefutureoftheworldsystem.Severalofthe scenariossaw ‘overshootandcollapse’ oftheglobalsystemduringthetwenty-first century,whileothersresultedina ‘stabilizedworld’.Thestudywasupdatedinitiallyin 1992(Meadows,Meadows,&Randers, 1992)withtheWorld3–91modelandmore recently(Meadows,Meadows,&Randers, 2004)withafurtheriterationofthemodel, World3–03.Theessentialconclusionofthelateststudy,nowadecadeold,isthat humanityisdangerouslyinastateofovershoot.
Scenario1oftheWorld3–03modelisthereferencepointfortheotherscenarios presentedinLimitstoGrowth:The30YearUpdate.Thisscenarioproducesovershootand collapseintheworldsystemaround2025duetoa ‘non-renewableresourcescrisis’.In Scenario2themodelassumeshigherstocksofnon-renewableresourceswhichdelaysthe onsetofpopulationcollapsetoaround2050,althoughlivingstandardsbegintodecline around2025,asinScenario1.ThecollapseinScenario2istriggeredbypollution.
ThemodelIpresenthereishighlysimplifiedincomparisontotheWorld3–03model.It doesnotcontainmanyofthesectors(i.e.,sub-models)inWorld3–03,includingthe disaggregationoftheeconomyintoindustrialandagriculturalsectors.Furthermore,it onlyaccountsforcarbonpollution,whileWorld3–03includespersistentpollutionfrom industryandagriculture.Thesesimplificationsallowthemodeltofocusontheinfluenceof resourceconstraintsonaggregateglobaloutput.Thusitseekstocapturetheessential resourcecrisisreflectedinScenarios1and2ofWorld3–03butusingmoreaccessibledata.
Oneadvantageofthissimplifiedmodelisthatitusesmetricsthatcaneasilybe calibratedagainstreadilyavailabledata,whichfacilitatesaquasi-quantitativeanalysisof systemtrajectory.Themodelhasbeenconstructedtoprojectthecurrenttrajectoryof population,economicproductionandassociatedresourceuseintothefuture.Bydefinition therefore,itdoesnotreflectanychangesthatmayoccurtotheunderlyingrelationshipsin thefuture,whetherduetoscarcityorpolicy.
Ahighlevelcausalloopdiagram2 forthemodelissetoutin Figure1.Causalloop diagramsindicatetheinfluenceovertimeofinteractingvariablesonsystembehavior,and arethebuildingblocksofastockandflowmodel.
Themodel,whichissimulatedintheVensimsoftware,exploresthe350-yearperiod of1960–2310usinga1-yeartimestepandEuler ’sMethodfornumericalintegration.
Rapidgrowthineconomicproductionhasfacilitatedthemassiveincreaseinglobal populationoverhumanhistory(LoopR1),particularlysincetheriseofagriculturesome 10,000yearsago.Howevereconomicproductionisnotlinkedpurelytopopulationgrowth. GrossDomesticProduct(GDP)percapitagrowth(themaininfluenceonbasicliving standards)alsoreinforcespopulationgrowth(LoopR2),andhasbeengrowinginboth

Figure1.Causalloopdiagramofglobalsustainabilitymodel. Keystocksareshowninboxeswithinflowandoutflowratesasarrows.Arrowpolarityispositive unlessnotedasnegative. ‘R’ and ‘B’ representtheoverallpolarityofaloopaseitherreinforcingor balancing.

Figure2.(a)WorldPopulation;(b)WorldGDP.
developedanddevelopingnationsforcenturies.Morerecently,however,theriseinliving standardsindevelopingnationshasledtoreducedbirthrates(theso-calleddemographic transition) – LoopB1.
Economicproduction,inturn,dependsontheuseofnaturalresources(LoopB2), someofwhicharerenewable(e.g.,foodandfiber)andsomeofwhicharenon-renewable (e.g.,metalsandfossilfuels).Ofcoursethehumanpopulationalsoreliesmoredirectlyon naturalresourcesforsurvival(e.g.,productivesoilsandcleanwater) – LoopB3.
Amongthefiveloopsin Figure1,R1andR2havebeendominanttodate,as suggestedbythesimilaritiesbetweenthetrajectoriesofglobalpopulation(Figure2a) (UnitedNations, 2004)andglobalgrossdomesticproduct(Figure2b)(GroningenGrowth andDevelopmentCentre, 2010).
Akeyquestionforthefutureiswhetherglobalpopulationandlivingstandardscanbe stabilizedatlevelsthatdeliverenduringwell-beinggivenavailableflowsofnaturalresources.
TheeconomyismodeledhereinlinewithRobertSolow’sgrowthmodel(Solow, 1956)as developedbyMichaelRadzicki(2004).Specifically,theeconomy’soutputorGDPis determinedbytheCobbDouglasproductionfunction.
whereGDP=GlobalGrossDomesticProduct(ameasureofeconomicoutput)
K=stockofcapitalintheworldeconomy
L=stockofeffectivelaborintheworldeconomy
β =outputelasticityofcapital
RadzickihasshownthattheSolowmodelcanonlyexplainallofKaldor ’sso-called stylizedfacts3 (Kaldor, 1957)if(asSolowposited)itincludestechnicalprogress.In Radzicki ’smodel,technologyismodeledasastockthatactsasamultiplieronlabor, representingproductivityimprovementsduetotechnologicaldevelopmentintheworld economy.
TheSolowgrowthmodelwithtechnologicalprogressdescribeswellthehistorical exponentialgrowthintheworldeconomy.However,nothinglimitsgrowthinthismodel andsoitcontinuestoproduceGDPgrowthovertime(evenwithzeropopulationgrowth) aslongastherearestocksoflaborandcapital.TheversionoftheSolowmodelpresented hereincludesfactorsthatfacilitateproductionreachingadynamicstability.Thisis achievedthroughbalancingloopsthatconstrainsavings,andhenceinvestment,when GDPpercapitareachesathresholdvalue.ThethresholdoccurswhenGDPpercapita reachestheglobalaverageofaround$7000perpersonperyearcomparedtothepresent figureofaround$6000(constant2000US$).Exceedingthisthresholdultimatelyreduces Investmentto$0ataround$35,000perpersonperyearwhichisabout40%higherthan thatoftheOrganizationforEconomicCooperationandDevelopment(OECD)countries presently(World_Bank, 2013).
Themodelisfurthermodifiedtoaccountfornaturalresources.Specifically,the economicsectorisunaffecteduntilResourceAvailability(theratioofavailableresource flows4 todemandforresources)fallsbelow1.Furthermore,whenResourceAvailability fallstozero,Savings/InvestmentandTechnologygrowthalsofalltozero.Thecausalloop diagramoftheeconomyisshownin Figure3.

Asdescribedbefore,themodelassumesthatlivingstandardshaveacausal relationshiptopopulationgrowth( Figure1 ).Howeverathigherlevelsofliving standards,thedemographictransitionistriggeredandtherateofpopulationgrowth reduces,ultimatelytozero.TheUnitedNationsHumanDevelopmentIndex(HDI)is usedasaproxyforlivingstandards.ThecurrentglobalaverageHDIisaround0.68 (UnitedNationsDevelo pmentProgram[UNDP], 2012 ).Inthemodel,Iassume populationgrowthbecomeszeroatanHDIofaround0.90,whichisslightlyhigher thantheexistingindexforveryhighHDIcountries.Ialsoassumethatpopulation growthbeginstoslowwhennaturalresourcestocksfalltoaround40%oftheir initialvalue.
Thecausalloopdiagramforpopulationandlivingstandardsisshownin Figure4, whichexpandsthestructureshownin Figure1 toincorporateloopsforbothGDPand GDPpercapita.ThedemographictransitionbalancestheGDPloop(asdepictedin Figure1),butreinforcestheGDPpercapitaloop.Accordinglythedemographictransition loopisdepictedasbothreinforcingandbalancing,aspopulationchangeshaveopposite effectsonGDP(positivecausation)andGDPpercapita(negativecausation).

Figure4.Causalloopdiagramofthepopulationandlivingstandardssector.
Naturalresourcesarerepresentedinthemodelthroughthreesubsectors:fossilfuels(asa specificsubsetofnon-renewableresources);renewableresources;andothernon-renewablematerials.
Economicactivityacrosstheglobeisdrivenbyenergy,whichremainslargelyderived fromthecombustionoffossilfuels – afinitenaturalresource.Themodelassumesthat demandforfossilfuelsisafunctionofthedemandforenergyacrosstheeconomy,taking intoaccountthefractionprovidedfromnuclearenergyandrenewableresourcessuchas solarenergy,windenergy,biomass,andsoon.Thecurrentfractionfromthesesourcesis around19%ofglobalenergyuse(InternationalEnergyAgency, 2009).Non-energyuseof

fossilfuels(e.g.,fertilizer,plastics)hasbeensimplymodeledataround30%ofthatused forenergypurposes,whichistheaveragesplitsince1980.Thecausalloopdiagramfor thefossilfuelssectorisshownin Figure5
2.3.2Renewableresources
RenewableresourcesarethosedefinedbyTheGlobalFootprintNetwork(GFN)andused inthecalculationoftheEcologicalFootprint(GFN, 2012).EcologicalFootprintrepresentstheconsumptionrateofrenewableresources,specifically:cropland,grazingland, forestland,fishinggrounds,andbuilt-upland.Thedemandforforestlandalsoincludes thatsufficienttosequestercarbonafteraccountingfortheoceans’ sequestrationcapacity (referredtohereafterasthecarbonfootprint).
DistinctfromEcologicalFootprint,Biocapacityisameasureoftheregenerationrate ofrenewableresources.BothBiocapacityandEcologicalFootprintareexpressedinunits calledglobalhectares(gha)peryear,where1gharepresentstheproductivecapacityof 1haoflandatworldaverageproductivity.Forexample,datafrom2010indicateaglobal Biocapacityof11.6×109 gha/yr.
Finally,theEcologicalFootprintRatioistheratioofEcologicalFootprintto Biocapacity;hence,itisameasureofresourceexploitationrelativetoregeneration. Statedanotherway,EcologicalFootprintisadepletionflow,whereasBiocapacityisa regenerationflow.ThesetwoflowsmodifyastockthatIhavereferredtoasEcological Capacity.Inturn,EcologicalCapacitydeterminestheabilityofecosystemstoprovide servicestosocietyfromrenewableresources.
ConventionalanalysestypicallyassumethatBiocapacityisaconstant,thatis,the regenerativecapacityofecosystemsisunaffectedbythestockofEcologicalCapacity.My model,incontrast,(optionally)allowsBiocapacitytoreduceasthestockofEcological Capacitydeclines,ultimatelytozeroifthestockisdepletedentirely.
Thetotalecologicalfootprinthasbeendisa ggregatedintocomponentsofrenewable resourcesandthecarbonfootprint(derivedherefromenergydemandandfossilfuel use).Thecarbonfootprintisconvertedtoaresourceconsumption(ingha/yr)by calculatingtheamountofproductivelandandseaarearequiredtosequestercarbon dioxideemissions.
ThecausalloopdiagramfortheEcologicalFootprintRatioisshownin Figure6

2.3.3Othernon-renewablematerials
Othernon-renewablematerialsaredefinedhereasmetaloresandthemineralsusedin industryandconstruction.Theseresourcesarefiniteandstocksarebeingconsumedatarate determinedbyeconomicdemand.Manymetalorescantheoreticallyberecycledcontinuously,althoughinpracticethemyriadwaysmetalsareincorporatedinproductslimitsthe potentialopportunity(UnitedNationsEnvironmentProgramme, 2011).Constructionand industrialmineralsaremainly ‘down-cycled’ ratherthanrecycled(e.g.,re-useofwaste concreteasaggregate).Forsimplicity,allnon-renewableresourcesareassumedheretobe recyclable,albeitwitha10%lossineachcycle.Aservicelifeof25yearsisassumed.The causalloopdiagramforothernon-renewablematerialsisshownin Figure7
3.Modelcalibration
Themodelwascalibratedforaninitialperiod(i.e.,1960through2010)byselecting initialstocklevelsandconst antsfromhistoricalrecords( Table1 ).Causalrelation-

Figure7.Causalloopdiagramoftheothernon-renewablematerialssub-sector.
Table1.Datasources.
DatausedinmodelSourceReference
GDPandInvestmentWorlddatabank(World_Bank, 2013)
PopulationWorlddatabank(World_Bank, 2013)
HumandevelopmentindexUnitedNations(UNDP, 2012)
Ecologicalfootprintand Biocapacity
Energyandfossilfuels
Globalfootprintnetwork (Ewingetal., 2010)
Worlddatabank (World_Bank, 2013)
Non-renewablematerialsSustainableEuropeResearchInstitute (SERI) (SERI, 2013) 8 W.Grace
shipsandgraphicalfunctionshavebeenconstructedsuchthatthesimulatedresults matchtherealdataascloselyaspossibleforthisperiod(graphsincludedin Appendix1 ).
Scenario1 (Infiniteresources)
Themodelwasinitiallyrunfortheyears1960to2310assumingunlimited resources(byselectingveryhighinitialstockvaluesforecologicalcapacity,fossil fuelsandothernon-renewablematerials).Thisrunrepresentsafutureinwhichinfinite resourcesallowforcontinuouseconomicgrowthandimprovementinlivingstandards, unhinderedbyscarcity.Thepurposeofthisscenarioistoapproximatetheannualflow ofresourcesrequiredtoachievethisoutcome,asapointofreferenceforfurther scenarios.Thisscenario,ifitwerepossible,representsa ‘smoothlanding’ forhumanity (Figures8a–8d).
Continuedeconomicgrowthimproveslivingstandards,whichenablesthedemographic transitionthatslowsandthenhaltspopulationgrowth.Globallivingstandards(HDI)and GDPpercapitaachievelevelssimilartothoseofcurrentlyhighincomecountries(over 0.9andUS$25,000respectively)atapopulationofaround11billionpeople(Figure8a). TheresultingglobalGDPisaround3.75x1014 constantUS$2000,aboutninetimesthe currentvalue.
4.2Energyandfossilvs.non-fossilfuels
Scenario1assumesnon-fossil-fuelenergyconsumptionremainsatthecurrentvalue ofaround19%,andmaterialsrecyclingremainsatlowlevels(10%).Becausea majorityofenergydemandremainsderiv edfromfossilfuels,fossilfueldemand followsasimilarpathtooverallenergydemand( Figure8b ).Energydemand stabilizesataround35millionkilotonnes oilequivalentperannum,overthree timesthecurrentrate.

Figure8.(a)Simulatedpopulation,GDPpercapita&livingstandards –Scenario1(RHSandLHSrefertorighthandandlefthandscalerespectively);(b) Simulatedenergydemandandfossilfueldemand –
Scenario1;(c)Simulatedecologicalfootprint –
Scenario1;(d)Simulatedconsumptionofothernon-renewable materials –Scenario1.
4.3Ecologicalfootprint
Inthemodel,theecologicalfootprintcontainstwoparts:arenewableresourcesfootprint (fromconsumptionofcropland,grazingland,forestland,fishinggrounds,andbuilt-up land)andacarbonfootprint(fromconsumptionoffossil-fuels). Figure8c depictsthese footprintsunderthe ‘no-limits’ simulation(Scenario1).The2007renewableresource footprintof8.4billionglobalhectaresperyeargrowsquitemodestlyto12ghaperyearin 2310.Howeverthecarbonfootprintgrowsrapidlyfrom8billionghaperyearin2007to around40billionghaperyearin2310.Thecombinedecologicalfootprintof50billion globalhectaresperyearisoverthreetimesthe2007valueandrepresentsanecological footprintratioofover4.
4.4Othernon-renewablematerials
Asidentifiedinthefigurein Appendix1 panelg,theconsumptionofmetaloresand industrial/constructionmaterialshasbeenrecentlygrowingatagreaterratethanrenewableresourcesorevenfossilfuels. Figure9 showstheglobalconsumption5 ofthese materialsandtheshareofconsumptionbytheUSAandChinasince1980(SERI, 2013).
Globalconsumptionisbeingdrivensign ificantlybygrowthintheChineseeconomyandassociateddemandformaterials.Whenthisrelationshipistranslatedintothe modelandprojectedforward,globalconsumptiongrowsbymorethanninetimes comparedwithconsumptionin2010( Figure8d ).Thismayinfactbeaconservative figurebecausethegraphica lfunctioncontrollingmaterialsuseperunitofGDPhas beensettoplateau.
5.Introducingnaturalresourcelimits
Next,themodelismodifiedtosetlimitsforeachoftheresourcesofinterest,inturn: renewableresources,fossilfuelsandothernon-renewablematerials.

Figure9.Actualglobalconsumptionofothernon-renewablematerials,1980–2009.
Themodelstructuredescribedin Figure6 wasinvokedbyassuminganinitialvalueofthe stockthatrepresentsEcologicalCapacity.Whileconceptuallywecanenvisionastockof globalhectaresfromwhichrenewableresourcesflow,thereisnophysicalstockthatcan bedirectlymeasured.AccordinglytheGlobalFootprintNetwork(GFN, 2012)doesnot reportthestocklevel,onlytheflowstoandfromthisstock.Forthepurposesofmodeling, however,itisnecessarytoestimatetheinitiallevelofstockintheyear1960.
Forthissimulation,IassumeaninitialEcosystemCapacityof3680billionglobal hectaresin1960,equivalenttoabout500yearsofthe1980netdepletionrate(7.36bn gha/year).6 ThisrunalsoassumesthatBiocapacityisconstant(11.6bngha/yr),thatis, unaffectedbythestatusofthestock.Latersimulationsvarytheseassumptions.Allother resourcesremainunlimited.
Figure10a showsthestatusofEcologicalCapacity(specificallytheratioofthe resourcestockinagivenyeartoitsinitialstock)andtheavailabilityofrenewable resources(specificallytheratioofavailableresourcestothedemandforthoseresources). TheimpositionofanupperlimitonEcologicalCapacityresultsinrapiddepletionof EcologicalCapacityaftertheecologicalfootprintexceedsunity,thatis,around1980.This declineultimatelyleadstorenewableresourcescarcityaroundtheendofthetwenty-first century.Asisevidentfrom Figure10a,themodelassumesrenewable-resourceavailability beginstofallshortofdemand(i.e.,itsratiodipsbelow1.0forthefirsttime)when EcologicalCapacityisreducedtohalfofitsinitialvalue.
Thisscarcityofrenewableresourcesactsasabrakeoneconomicproduction,impactingadverselyonGDPpercapitaandhencelivingstandards.Aslivingstandardsdrop,and resourcesdiminish,populationgrowthplateaus,andthenreducesrapidly(Figure10b)to around600millionattheendofthesimulationperiod. Figure10b isdirectlycomparable to Figure8a
Becausetheregenerationofrenewableresourcesisconstantinthisscenario,ecologicalcapacitybeginstorecoveraround2150(Figure10a)aspopulationdeclines.However thisrecoveryisnotsufficienttostopthedeclineofGDPandpopulation.7 Thisscenario representsanovershootandcollapsesituation.
Scenario2b (DoubletheinitialstockofEcologicalCapacity)
Totestthemodel’ssensitivitytoassumptionsaboutEcologicalCapacitythisscenario doublestheinitialstocklevelto1000yearsofthe1980netdepletionrate.Doublingthe EcologicalCapacitydelaystheonsetofthethresholdsnotedabovebutdoesnotchange thesystem’sessentialbehavior(Figure11).
Scenario2c (HalftheinitialstockofEcologicalCapacity)
Ofcourseitisequallypossiblethattheinitialstockislessthanthearbitraryvalue assumedinScenario2a.HalvingtheinitialEcologicalCapacityto250yearsofthe1980 netdepletionratebringsforwardthepeaksin Figure11 byaround50yearsto2085 (graphnotshown).
Scenario2d (DegradingBiocapacity)
Thenextrunofthemodelinvokesthereinforcingloopshownin Figure6,which modifiesBiocapacity(theregenerationrateofrenewableresources)inaccordancewith thestocklevelofEcosystemCapacity.Aconvexgraphicalfunctioncontrolsthis

Figure10.(a)Simulatedrenewableresourcesavailability –Scenario2a;(b)Simulatedpopulation,GDPpercapita&livingstandards –Scenario2a.

Figure11.Simulatedpopulation,GDP/candlivingstandards – Scenario2b.
feedback,reducingBiocapacitytozerowhenEcosystemCapacityreaches10%ofits initialvalue(whichisreturnedtotheScenario2avalueforthisrun).
Resultsfromthismodificationofthemodel(Figure12a)initiallyfollowthepathsin Figure10a.Butinsteadofrecovering,EcologicalCapacityiscompletelydepleted, resultinginavailabilityofrenewableresourcesfallingtozerointhemiddleofthe twenty-secondcentury.
Theimplicationsofthisscenarioforpopulation,GDPpercapita,andlivingstandards aredepictedin Figure12b.Thepathissimilarto Figure10b initially,butpopulationfalls towardszeroasrenewableresourcesarecompletelydepleted.Thus,Scenario2dalso representsanovershootandcollapsesituation.
Inthenextroundofsimulations,therenewableresourcelimitisremovedbutalimiton thestockoffossilfuelsisintroduced.Thelimitassumedforfossilfuelsisbasedon MaggioandCacciola(2012),inwhichhistoricaldataonoil(crudeandnaturalgas liquids),naturalgas,andcoalproductionarecombinedwiththreepossiblescenariosto estimatetheglobalquantityofresources(i.e.,ultimaterealizableresource=cumulative productionplusremainingreservesplusundiscoveredresources).Theirvaluesforultimateresources,basedonacomprehensiveliteraturesurvey,areshownin Table2
Theuppervaluesin Table2 represent177%,234%and125%,respectively,ofthe provenreservesofoil,gasandcoalreportedinBP’s ‘StatisticalReviewofWorldEnergy’ publishedinmid-2014.Theseuppervaluesareadoptedforthepurposesofthisstudy, afterbeingconvertedtokilotonnesofoilequivalent(ktoe)andtotaled.
Theultimaterealizablefossil-fuelresourceisincorporatedinthemodelastheinitial totalstock,reducedbythefractionusedbythecommencementofthemodelin1960 (approximately10%fromthehistoricalproductiondata),leaving1.38×109 ktoeasthe initialvalueoftheFossilFuelstock.Thisquantityrepresentsabout110yearsofproductionat2012rates(12.6×10⁶ ktoe/year;see Appendix1 panelh).
Theresultsofthisrunaresummarizedin Figures13a and 13b. Figure13a showsthe statusofthefossil-fuelstock(stockvalue/initialvalue)andtheavailabilityoffossilfuels

Figure12.(a)Simulatedrenewableresourcesavailability –Scenario2d;(b)Simulatedpopulation,GDPpercapita&livingstandards –Scenario2d.
Table2.Fossilfuels – ultimaterealizableresources.
Oil&naturalgasliquids2250–3000Gigabarrels(GB)
409,200,000
Naturalgas 9500–15,400Trillioncubicfeet(Tcf) 362,208,000 Coal 550–750Gigatonnesofoilequivalent(Gtoe)750,000,000
Total 1,521,408,000
Source:MaggioandCacciola(2012).
(theratioofavailableresourcestothedemandforthoseresources).Theavailabilityof fossilfuelsbecomesconstrainedaround2035andtheresourceisexhaustedbytheendof thetwenty-firstcentury.Asinpreviousmodelruns,thisresourcescarcityhasadramatic effectontheeconomy,leadingtoovershootandcollapse(Figure13b).Doublingthe initialstockoffossilfuelsdelaystheonsetofthepeaksin Figure13b byaround40years (graphnotshown).
Asimilarapproachwastakentomodelingtheimpactofinitialavailabilityofothernonrenewablematerials,specificallymetaloresandindustry/constructionmaterials.After removingthefossilfuellimit,acapwasplacedonthetotalquantityofothernonrenewablematerialsavailabletotheeconomy.Unlikefossilfuels,someofthesematerials arenotfully-consumedandremainavailableforrecyclingandreuse,althoughthe viabilityofdoingsovariesfrommaterialtomaterial.
Inthe30-yearupdateoftheLimitstoGrowthstudy(Meadowsetal., 2004,p.105),an estimateforthelifeexpectancyofvariousmetalsisquotedassuminganannualproductiongrowthrateof2%peryearfrom1999.Theselifeexpectancyfiguresrangefrom 530yearsfornickelto1070yearsforaluminum.Noguidanceisavailable,though,for totalglobalstocksofindustryandconstructionmaterials.
Scenario4 (Limitedstockofothernon-renewablematerials)
Itisassumed(conservatively)thattheinitialstockofallothernon-renewablematerials(in1960)isequivalentto1000yearsofproductionat1980rates.Itisfurtherassumed that25%ofthesematerialshadalreadybeenexploitedby1960,leaving75%availablefor firsteconomicuse.Ofthematerialsalreadyexploited,itisassumedthat60%were ‘inuse’,20% ‘lost’,and20% ‘recovered’ andavailableforrecyclingin1960.Forsimplicity therecyclingrateissetto10%forthisinitialsimulation.
Figure14 depictsthechangingstatusofothernon-renewablematerialsstocks throughoutthissimulation.Itindicatesarapidriseinthequantityofmaterialslost,due torapiddepletionofavailablematerialsandalowrecoveryrate.
Therapidconsumptionofothernon-renewablematerials(acontinuationofthe historicaltrendobservedin Appendix1 panelg)leadstoaparticularlysharp reductioninavailability(theratioofavailablematerialstodemandforthosematerials)asstocksbecomedepletedaftermid-century( Figure15a ).Availabilityislimited ultimatelybyrecoveredratherthanvirginmaterials.Theresultingsystembehavioris similartopreviouscases,involvingovershootandeventualcollapse( Figure15b ). Furthermore,doublingtheinitialstockof othernon-renewablematerialsdelaysthe

Figure13.(a)Simulatedfossilfuelandstock –Scenario3;(b)Simulatedpopulation,GDPpercapita&livingstandards –Scenario3.

onsetofpeakconditions(asobservedin Figure15b )by30 – 40years(graphnot shown).
6.Discussionofresults
LikeallSystemDynamicsstudies,thetimingandexactnumericvaluesarethecombined effectsofinitialconditions,positedcausalrelationships,andinparticular,theequations andgraphicalfunctionsthatregulatethem.Therefore,thetimingandvaluespredictedby thesimulationsarenottobetakenasaccurate.Howeverthebasicbehaviorofthesystem ispredictablefromourunderstandingofthedynamicsofgrowth-limitedsystems,thatis, thatdepletingresourcesatafasterratethantheirregenerationorsubstitutionmust eventuallyleadtotheirexhaustion,givingrisetoovershootanddeclineorcollapse. Giventhatthemodelshowsreasonablecalibrationwithactualdatafromthepast 50years,thenear-termresultsarelikelytobeclosertorealitythanthoseforlaterperiods ofthemodel.
Theseresults,whentakentogether,suggestpeakssomewhatlaterthanthosesuggested byScenario1ofWorld3–03(thereferencecaseofLimitstoGrowth – The30Year Update).Morespecifically,myresultssuggestGDPpercapitaandlivingstandardsmay peakasfollows(Table3),notingthatthemodelpresentedhereismoresimplistic,and initialstockvaluesmoreconservative.
Itisworthstressingagainthattheresultspresentedhereshouldnotbeconsideredas ‘predictions’.Norshouldtheybeconsideredmoreaccurateinmagnitudeortimingthan theWorld3–03Scenario1,notingthateventheauthorsofthatwork ‘donotbelieveit representsthemostlikelyrealworldoutcome’ (Meadowsetal., 2004,p.171).Rather,the intentisonlytoshowthatthissimplifiedmodelproducessimilartrajectories,yetwas easiertoparameterize.
Theessentialbehaviorofthesystemiscontrolledbytheratesofresourceconsumptionandregenerationorrecycling,andthevariablesthataffecttheserates.Thekey variableaffectingtheoverallconsumptionofresourcesinthemodelistheratioof resourcedemandtoGDP(hereafterreferredtoasresourceintensity).
Formostofthecalibrationperiodofthemodel(1960–2010)realworlddatashows thatworldwideresourceintensityhasbeendeclining.Muchofthisdeclinecanbe attributedtogrowthoftheservicesector.Bythemid-1990s,servicesaccountedfor almosttwo-thirdsofworldGDP(Figure16),upfromabouthalfinthe1980s (Soubbotina, 2000,p.50).Asdevelopingcountriesbecomewealthier,theproportionof

Figure15.(a)Simulatedothernon-renewablematerialsavailabilityandstock –Scenario4;(b)Simulatedpopulation,GDPpercapita&livingstandards
Scenario4.
Table3.PeakGDPpercapitaandlivingstandardsundervariousscenarios.
LimitAssumed[RelevantScenario]TimingofPeak[RelevantFigure]
StockofOthernon-renewablematerials [Scenario4]
Towardstheendofthetwenty-firstcentury [Figure15b]
StockofFossilfuels[Scenario3]Secondhalfofthetwenty-firstcentury [Figure13b]
FlowofBiocapacity[Scenario2d]Firsthalfofthetwenty-secondcentury [Figure12b]

Figure16.Sectorialstructureofworldeconomiesin1995. Source:Soubbotina(2000).
materialsandenergyperunitofoutputdeclinessignificantlyaseconomicproduction shiftsawayfromindustryandagriculturetowardsservices.China,forexample,has achieveda65%declineinenergyintensitybetween1970and2000(Soubbotina, 2000).
DataonGDPandtheglobalEcologicalFootprintfrom1961–2007supportthe hypothesisthatreductionsinresourceintensityaremainlyattributabletochangesin thestructureoftheworldeconomy. Figure17 illustratesthepercentageoftotal EcologicalFootprintattributabletodifferentresource-usecategoriesoverthisperiod. Thecontributionofcroplandandgrazinghasreducedmarkedlyandhasbeenreplaced bycarbon(aproxyforfossil-fuel-basedenergyconsumption).By2007,carboncontributesmorethan50%tothetotalEcologicalFootprint. 8 Ifcarbonisdeductedfromthe footprintmeasurement,thesubsequentEcologicalFootprintRatioreducestowellbelow 1(depletionislessthanrenewal),andisincreasingatamuchslowerratethanifthe carbonfootprintisincluded.Thispointisoftenneglectedinmediapresentationsofthe EcologicalFootprint.
Althoughtheeconomicintensityofrenewableresourceusehasbeensteadilydeclining(Figure18),thereseemstohavebeensomechangesintherelationshipbetweenGDP andnon-renewableresourcessincetheyear2000.First,therehasbeenasharpupturnin theresourceintensityofothernon-renewablematerials(i.e.,excludingfossilfuels). Second,energyintensityseemstohavestabilized,ratherthancontinuingitsrecent


decline.Finally,thecarbonfootprintintensityhasreturnedto1990levelsafteragradual declinesincearound1980.
Theshapesoftheseintensitycurvesarethebasisofthemodel’sassumedrelationships betweenresourceuseandGDP.Thus,asthelattergrowsexponentially,resourceuseis increasedaccordingly.
Inthesimulationsdescribedearlier,consumptionofresourcesisconstrainedonlyby availability,thatis,whetherornottherearesufficientresourcestomatchdemandatany pointintime.Asshownin Figures10a, 12a and 13a,suchresourceconstraintstakeeffect wellafterdepletionoftheresourcestocksbegin.Althoughtheassociatedbalancingloop eventuallytakeseffect – toreduceGDPand,thus,resourcedemand – itistoolateto avoidovershootanddecline.Thisresultchallengestheconventionalwisdomthatmarket economicswillhelpavoiddepletion,thatis,thatscarcitywillinduceapricesignalthat incentivizestechnologyimprovementsthatinturnleadtoreductionsinresourceuseor substitution.Acknowledgingthatmysimplifiedmodeldoesnotallowpricesignalsto
directlyaffectresourcedemand,itsresultssuggestthattherapidonsetofeconomic scarcitywillprecludeourabilitytoavoidovershoot.AsSterman(2012)putsit:
Evenwithsignificantpotentialfornewtechnicalsolutions,aprosperousandsustainable futurecanonlybebuiltifgrowthofbothpopulationandmaterialthroughputceasevoluntarily,beforegrowthisstoppedinvoluntarilybyscarcityorenvironmentaldegradation.(p.50)
TheLimitstoGrowth – the30YearUpdate (Meadowsetal., 2004)includesscenariosthat avoidcollapse(Scenario6,8,9and10)throughtheadoptionofvariouspolicymeasures. Otherauthorshaveproducedsimilarcredibleoutcomesfromglobalmodels.Developers oftheHumanandNatureDynamics(HANDY)model(Motesharrei,Rivas,&Kalnay, 2014)foundthat:
collapsecanbeavoidedandpopulationcanreachequilibriumifthepercapitarateof depletionofnatureisreducedtoasustainablelevel,andifresourcesaredistributedina reasonablyequitablefashion.(p.101)
Toinvestigatethevoluntarypolicymeasuresnecessarytoavoidovershootanddeclineor collapse,Iexpandthemodeltoincorporatefurtherbalancingloops(i.e.,endogenous behavior).Modificationsarespecificallyappliedtothefossilfuelsandothernon-renewablematerialssub-sectorsonly.Nochangesaremadetotherenewableresourcessector, althoughthissub-sectorisaffectedindirectlybythecarbonfootprintofenergy.
Anadditionalbalancingloopisaddedtothemodelwhichincreasestherenewableenergy fractionasfossilfuelstocksaredepleted(see Figure19).

Figure19.Causalloopdiagramofthemodifiedfossilfuelssub-sector.
7.2Othernon-renewablematerials
Additionalbalancingloopsareaddedtotheothernon-renewablematerialssub-sector. Thesebalancingloopsaretriggeredbythedeclineofothernon-renewablematerials stocks.Inresponsetothisdecline,theycauseagradualreductioninoveralldemandfor thesematerials,andagradualincreaseinthefractionofmaterialsrecoveredandreused.
Themodifiedcausalloopdiagramisdepictedin Figure20
Scenario5 (Voluntarymitigationmeasures)
Thestrengthsoftheadditionalbalancingloopsin Figures19 and 20 arevaried iterativelyuntiltheyoffsettheovershootbehaviorandreinstatethe ‘smoothlanding’ evidentintheno-limitsscenario.Thissmoothlandingisultimatelyachievedthrough additionofthefollowingpolicies.
Withrespecttofossilfuels:
● Increasingthefractionofrenewableenergyrapidlyfromthepresentlevelto1by thetimefossilfuelstocksdepleteto25%oftheirinitialvalue.
Withrespecttoothernon-renewablematerials:
● Reducingdemandforothernon-renewablematerialsby75%(perunitofGDP)as theirstocksdecline;andsimultaneouslyincreasingthefractionofmaterialsrecoveredfrom10–70%asstocksdecline.
Theapplicationofthesemodificationsreturnsthesystembehaviortosomethingcloseto the ‘smoothlanding’ oftheno-limitsscenario,asshownin Figure21a.Inthisscenario, livingstandardsreachthesamehighvaluesastheno-limitsscenariobutGDPpercapitais slightlylowerandpopulationstabilizesatlessthan9billion,comparedto11billion previously.Thischangedbehaviorisduetoreductionsinresourceintensitytriggeredby thevoluntarymeasures.Theresourceintensitywithrespecttofossilfuelsandcarbon footprintisdepictedin Figures21b and 21c

Figure20.Causalloopdiagramofthemodifiedothernon-renewablematerialssub-sector.
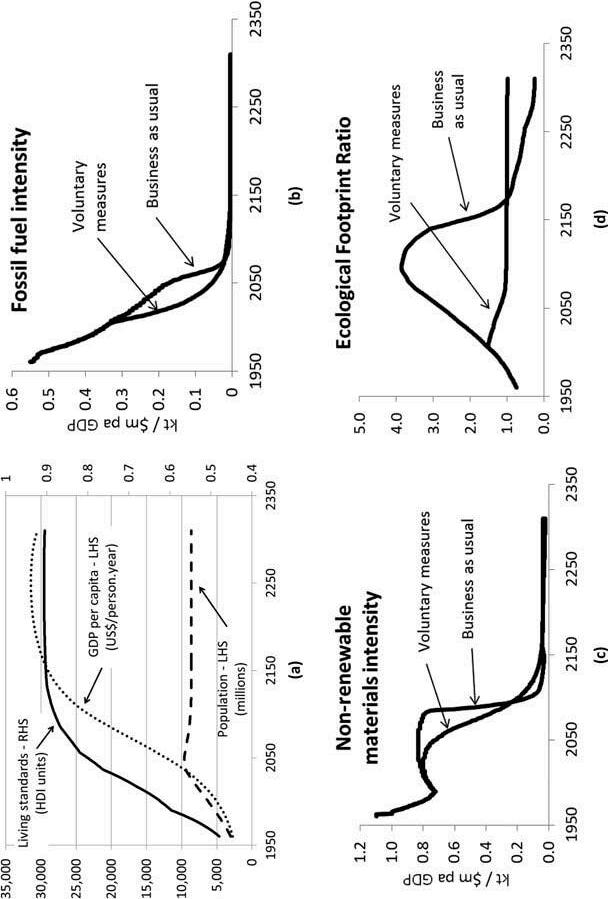
Scenario5;(b)Simulatedfossilfuelsintensity –
Figure21.(a)Simulatedpopulation,GDPpercapita&livingstandards –
Scenario5.
Scenario5;(d)Ecologicalfootprintintensity
Scenario5;(c)Simulatedother non-renewablematerialsintensity –
ThismodificationalsoreturnstheEcologicalFootprintRatiotounityastheCarbon Footprintreducestozero(Figure21d).Notethatthe ‘voluntarymeasures’ simulationdid notincludeanydirectreductionintherenewableresourceintensity(itisindirectly reducedbyreducingfossilfueluse).Thisresultthereforeimpliesthatcurrentpatterns ofrenewableresourceintensitymaybesustainableifthecarboncomponentcanbe eliminatedthroughatransitiontorenewableenergy.However,thereisanimportant caveatonthisconclusionwhichisdiscussedbelow.
Closerinspectionof Figure21a (Scenario5)suggeststhat,towardstheendofthe simulationperiod,GDPpercapitaisdropping,andlivingstandards(whicharemodeled asadirectfunctionofGDPpercapita)areonthevergeofdecline.Extendingthe timeframeofthemodelrevealsthatequilibriumhasnotinfactbeenachieved;overshoot hasbeenmerelydelayed,andoccursthereafter.Thereasonsforthisbehaviorareclear fromconsiderationof Figure20,whichdepictstheothernon-renewablematerials’ causal structure.
Thetotalstockofothernon-renewablematerialsatanytimeisthesumof:virgin materials,materials-in-use,materialsrecovered,andmaterialslost.Asvirginmaterialsare usedforthefirsttime,theyareconvertedtomaterials-in-useaccordingtotherateof demand.Thetimetheyresideinthatstockdependsonthelifeofthematerials,orrather thelifeoftheproductsthatembodythematerials.Clearlythisvariessignificantly,froma verylongperiod(e.g.,concreteintransportinfrastructure)toaveryshorttime(e.g., materialsinconsumergoods).Attheendoftheirlifetheyareeitherrecoveredor discarded.Itisimpossibletorecover100%ofmaterialsbecausetheyareboundtogether inproductsthatmaketheirseparationverydifficultinmanysituations(UNEP, 2011).In thecaseofsomemetals,veryhighrecoveryratesareatleasttheoreticallypossible. However,evenifitisassumedthat90%ofthematerialsinusecanberecovered,the balanceislosttotheeconomy.
Becausethelawsofthermodynamicspreclude100%recovery,theactofreducing demandandincreasingtherecyclingfractiononlydelaytheinevitable,albeitconsiderably.Eventually,stocksofviablyobtainablevirginmaterialswillbedepletedcompletely.Accordingly,inthelongtermtheconsumptionofmaterialsmustequaltheir recoveryorrecyclingrate.Becausesomeproportionwillbelostthrougheachcycle, theavailabilityofmaterialsmustdiminishovertimewithconsequencesforeconomic useofthosematerials.
Inthelongterm,theproportionofmaterialsthatarelostmustbesubstitutedwith renewablematerials,ifthesameeconomicdemandistobemet.Ifwefurtherassumethat therecoveryrateitselfwilllikelydiminishinthelongterm,asmaterialsgothrough multiplecyclesofrecoveryandrecycling,thissubstitutiontowardsrenewablematerials willneedtoincreaseovertime.TheimpactofthisontheEcologicalFootprintmustbe consideredinanymodelingoffutureeconomicuseofothernon-renewablematerials.
Thevoluntarymeasuresoutlinedabove,withrespecttofossilfuelsandothernon-renewablematerials,onlyachieveglobalstabilityifallofthefollowingconditionsapply:
● Continuingimprovementsinlivingstandardsinthedevelopingworlddeliverthe demographictransition(andtherebyconstrainnetglobalresourceconsumption);
● Fossilfueluseforenergyiscompletelyeliminated;
● 70%ofothernon-renewablematerialsareultimatelyrecoveredandrecycled;
● Demandforothernon-renewablematerialsisultimatelyreducedby75%;and
● Allmeasuresoccursimultaneouslyandwithoutdelay.
Absenttheseconditions,themodelproducesovershootandcollapsebehaviorduringthe simulationperiod.Althougheasytoconfigureinamathematicalmodel,theimplementationoftheseorsimilarpoliciesatanywherenearthescaleandtimeframerequired, appearspresentlyinfeasible.Althoughsomeactionisbeingtakenwithrespecttogreenhousegasemissionsandrecoveryorrecyclingofmaterials,thescaleoftheseactionsdoes notreflecttheurgencyofthetask.Almostnoactionisbeingtakenonreducingthe economicdemandforothernon-renewablematerials,anditishighlyquestionable whetheritisevenpossibletoreducedemandperunitofGDPforsuchmaterialsby 75%,letaloneinthetimeframeidentified.
Thereispresentlylittlefocusontheproblemssetoutinthisarticleattheinternational ornationallevel.AlthoughtheUnitedNationsEnvironmentProgram’sInternational ResourcePanel9 recentlyproducedareportonde-couplingresourceusefromeconomic growth,10 eventhisdocumentistentativeaboutrecommendingnationalpolicies. Recommendationsrelatetoleadership,institutionalframeworks(changingthemindsets ofdecision-makers),andtheadoptionofpricesignals.Eventhisagendahasvirtuallyno momentuminnationalpoliticsinthecountriesthatmattermost.Thereisnoreferenceto theworkofthispanel,forexample,onthewebsitesoftheUSEnvironmentalProtection Agency,NaturalResourcesCanada,ortheUKDepartmentforEnvironmentFood& RuralAffairs.Policiesintheseandmostcountriesremainfocusedonwastemanagement andrecycling,ratherthantheeconomy-widetransformationsneeded.
Policychangewillonlyfollowmuchgreaterpublicawarenessoftheissuesand translationofthisawarenessintopoliticalaction.Acceleratingthisprocessisimperative ifwearetoavoidthepresentstateofglobalovershootprogressingtoseriousdeclineor collapse.UrgencyhasonlygrowninthenearlyhalfacenturysincetheoriginalLimitsto Growthstudy(Meadowsetal., 1972)cametothissameconclusion.
Themodelpresentedhereaveragesglobalstocksandflows.Accordingly,itdoesnot accountforthelargedisparitiesbetweendevelopedanddevelopingnations’ resource demandandaccesstoresources.Thenextphaseofthestudywillseektoexplore interactionsbetweenthe ‘haves’ and ‘have-nots’ duetoresourcedistributionacross nations.FurtherphasesofmodelingwillbebasedonOECDGDPgroupings,nations, andcities.Developmentofthesemodelswillneedtoaddressavarietyofcomplexities relatedtotheimportandexportelementsoflocaleconomies.Accommodatingthese complexitieswillnecessarilyinvolveanumberofassumptions,theresultsofwhichcan onlyrealisticallybetestedthroughsensitivityanalysis.Accordingly,themodelswill(like themodelpresentedhere)include ‘sliders’ thatfacilitatesuchsensitivitytesting.
Anopensourceonlineversionofthismodelisavailableat https://forio.com/simulate/ williamrgrace/sustainable-world tofacilitateexplorationofthesystemdynamicsand policyoptions.Futuremodelswillsimilarlybemadeavailableonline.
Disclosurestatement
Nopotentialconflictofinterestwasreportedbytheauthor.
Notes
1.Asthenameimplies,therewasalsoaWorld1model,developedearlierbyForresteratthe behestoftheClubofRometohelpinvestigate ‘thepredicamentofmankind’ .
2.AnexplanationofcausalloopdiagramsisincludedinAppendix2andfurtherexplanationis availableat http://www.public.asu.edu/~kirkwood/sysdyn/SDIntro/ch-1.pdf.
3.Kaldor ’ssix ‘stylizedfacts’ areempiricalobservationsrelatedtoeconomicgrowththatappear toapplytotheeconomictrendsinmanydifferentindustrializedcountries.
4.Resourceflows(andhenceconsumptionofresources)areconstrainedasthestockofresources isdiminished.
5.InfactSERIreportsthesefiguresas ‘usedextraction’ whichapproximatesconsumption.
6.500yearsisanarbitraryfigurechosentoreflectthepossibilitythatconsiderableecological reservesmayremainevenaftertheecologicalfootprintexceeds1,beginninginthe1980s.
7.GDPpercapitaandlivingstandardsbegintorisearound2250butonlybecausedeclining populationreducesmorequicklythandecliningGDP.
8.Notingthatthecarbonfootprintistheamountofproductivelandandseaarearequiredto sequestercarbondioxideemissions.Therequiredquantityoflandandseaisthe ‘resource’ in thiscase.
9. http://new.unep.org/resourcepanel/
10.Itisnotphysicallypossibletocompletelydecoupleeconomicproductionandresourceuse. Thethrustofthereportisreallyaboutreducingtheeconomicintensityofresourceuse.
References
Castro,R.,&Jacovkis,P.(2015).Computer-basedglobalmodels:Fromearlyexperiencesto complexsystems. JournalofArtificialSocietiesandSocialSimulation, 18(1).Retrievedfrom http://jasss.soc.surrey.ac.uk/18/1/13.html
Ewing,B.,Moore,D.,Goldfinger,S.,Oursler,A.,Reed,A.,&Wackernagel,M.(2010).The EcologicalFootprintAtlas2010.Oakland:GlobalFootprintNetwork. Forrester,J.W.(1971). Worlddynamics.Cambridge,MA:Wright-AllenPress. GFN.(2012). Thenationalfootprintaccounts,2011edition.Oakland,CA:GlobalFootprint Network.
GroningenGrowthandDevelopmentCentre.(2010).MadisonProjectRetrieved13July2014 InternationalEnergyAgency.(2009).FAQs:RenewableenergyRetrievedJuly13,2014,from http:// www.iea.org/aboutus/faqs/renewableenergy/ Kaldor,N.(1957).Amodelofeconomicgrowth. TheEconomicJournal, 67(268),591–624. Maggio,G.,&Cacciola,G.(2012).Whenwilloil,naturalgas,andcoalpeak? Fuel, 98,111–123. doi:10.1016/j.fuel.2012.03.021
Meadows,D.,Richardson,J.,&Bruckmann,G.(1982). Gropinginthedark:Thefirstdecadeof globalmodelling.Chichester:JohnWiley&Sons. Meadows,D.H.,Meadows,D.L.,&Randers,J.(1992). Beyondthelimits.PostMills,VT:Chelsea GreenPublishingCompany.
Meadows,D.H.,Meadows,D.L.,&Randers,J.(2004). Limitstogrowththe30yearupdate.White RiverJunction,VT:ChelseaGreenPublishingCompany.
Meadows,D.H.,Meadows,D.L.,Randers,J.,&Behrens,W.W.I.(1972). Thelimitstogrowth.New York,NY:UniverseBooks.
Motesharrei,S.,Rivas,J.,&Kalnay,E.(2014).Humanandnaturedynamics(HANDY):Modeling inequalityanduseofresourcesinthecollapseorsustainabilityofsocieties. Ecological Economics, 101,90–102.doi:10.1016/j.ecolecon.2014.02.014
Radzicki,M.J.(2004). AsystemdynamicsrepresentationoftheSolowGrowthModel.Worcester, MA:DepartmentofSocialScience&PolicyStudies.WorcesterPolytechnicInstitute. SERI.(2013).RetrievedApril2013,fromSustainableEuropeResearchInstitute www.material flows.net
Solow,R.M.(1956).Acontributiontothetheoryofeconomicgrowth. TheQuarterlyJournalof Economics, 70(1),65–94. Soubbotina,T.P.(2000).Beyondeconomicgrowth meetingthechallengesofglobaldevelopment TheWorldBank,Washington,D.C.
Sterman,J.D.(2012).Sustainingsustainability:Creatingasystemsscienceinafragmentedacademy andpolarizedworld.InM.Weinstein&R.E.Turner(Eds.), Sustainabilityscience:The emergingparadigmandtheurbanenvironment (pp.21–58).Springer,NewYork,USA. UNDP.(2012).humandevelopmentreport2011.UnitedNationsDevelopmentProgram. UNEP.(2011).Decouplingnaturalresourceuseandenvironmentalimpactsfromeconomicgrowth. Areportoftheworkinggroupondecouplingtotheinternationalresourcepanel. UnitedNations.(2004).WorldPopulationto2300.:UNDepartmentofEconomicandSocialAffairs PopulationDivision. World_Bank.(2013).Worlddatabank.RetrievedMarch2013,from http://databank.worldbank.org/
Appendix1.Simulatedvsobserveddataforcausalrelationshipsandgraphical functionsassumedinthemodel 28 W.Grace

Allsystemswithfeedbackaremadeupofcombinationsofso-calledreinforcingandbalancing loops.Thesecanbecharacterizedbycausalloopdiagrams.Inthefollowing,thearrowsindicatethe directionofcausality,forexample,chickenscomefromeggs.Thepolarityindicatesthatthe causationispositive.

Morechickensleadtomoreeggs,whichleadtomore chickens andsoon.
Thisisareinforcingloopandleadstoexponentialchicken populationgrowth(intheabsenceofotherinfluences)
Howevernothinggrowsforever,soinrealsystemstherearefactorsthatlimitgrowthordecline.We couldassume,forexample,thatchickensliveinanareainhabitedbyfoxes.

Themorechickenstherearethemorefoxestherewillbe (positivepolarity).Howeverthemorefoxestherearethe fewerchickenstherewillbe(negativepolarity).
Thisisabalancingloopbecauseitcounteractsthegrowthof chickenandfoxnumbers.Ifthisloopoperatedinisolation fromthefirstloop,chickennumberswouldfalltozero.
Whenthetwoloopsoperateintandem,wehavebothreinforcingandbalancingloopsinfluencing thenumberofchickensovertime,onethatcausesgrowthandonethatcausesdecline.

Theresultingbehaviorofthesystemovertimedependson:
● thenumberofeggshatchedperchickenperyear;and
● thenumberofchickensconsumedperfoxperyear.
Dependingontheseparametervalues,thenumberofchickensmay:
● growexponentially;

● stabilizeatanequilibriumlevel;or

● growexponentiallyinitiallyandthen collapsetozero.

Alloftheseoutcomesarepossible,demonstratingthatcomplexbehaviorcanresultfromasimple systemstructure.