
Renew.EnergyEnviron.Sustain. 8,7(2023)
© W.Grace,Publishedby EDPSciences,2023
https://doi.org/10.1051/rees/2023008

Availableonlineat: www.rees-journal.org
Optimisinggenerationandenergystorageinthetransitiontonet zeropowernetworks
WilliamGrace*
AustralianUrbanDesignResearchCentre,UniversityofWesternAustralia,Perth,WA6009,Australia
Received:17February2023/Receivedin finalform:22May2023/Accepted:22May2023
Abstract. Aselectricitynetworksplantoachievenet-zeroemissions,theroleofprivatebehind-the-meter (BTM)generationandstoragebecomesincreasinglyimportant.Twokeyquestionsariseforplanners:how muchBTMwilltherelikelybeinthelongerterm;andwhatimpactwillthishaveonnetworkgenerationand storage?Thecombinationofhighinsolationandreducingcostofsmall-scalesolarPVsystemsinWestern Australiahasledtoarapidandongoingtake-upofprivategenerationwhichalreadysuppliesaround20%of demand(aroundonethirdofhouseshaverooftopsolar),anddecliningmiddaynetworkloads,whichwilllikely becomenegativebefore2030atsometimesofdayandyear.However,themarketoperatorhasconsistently underestimatedtherateofprivatepenetration,leadingtoinadequateplanningforthefuturenetwork.Most publishedresearchfocussesonnetworkscalerenewablegenerationbutneglectstheimpactofprivate generationandstorage.Incontrast,thisarticlepresentsamodeloftheintegratedsystemto2050,projecting thelikelyscaleofBTMgenerationandidentifyingtheoptimalformofnetworkrenewableenergyandstorage toachievenetzeroemissions.By2050BTMgenerationwilllikelysupplyaround50%ofthetotalannual demandof54,000GWhpa.Giventhediurnalandseasonalshapeoftheresultingnetworkloadandprojected renewablegenerationcosts,onshorewindenergywillbethemostcostoptimalgenerationsource, supplementedbysmallercapacityoffshorewind,waveandsolarPVfacilities.Networkstorageintheformof batteriesandpumpedhydrowillberequired,butsignificantcurtailmentwillstillbenecessarytooptimally matchsupplywithdemand.NetworkgenerationandstoragecostsperMWhofnetworkloadintothefuture arelikelytobesimilarto,orlowerthanexistingcosts(∼$85/MWh)withtherangeoftechnologiesconsidered inthisstudy.
Keywords: Renewableenergy/storage/solarPV/emissions
1Introduction
1.1TheriseofprivatesolarPV
Worldwide,theamountofsolarPVinstalledeachyear hasgrownfromaround20GWpin2010toover200GWp in2022withcumulativeinstallationsapproaching1000 GW[1].TheInternationalEnergyAgency’s ‘NetZero Emissionsby2050Scenario’ projectsthatglobalsolar capacitywillreach11,000GWby2040[2].InAustralia thereareover3millionsmallscale(rooftop)solarPV installations(athirdofhouses)withacapacityof13.5 GWp 1.Ithasbeenestimatedthatthetotalpotentialfor
* e-mail: bill.grace@uwa.edu.au
1 https://pv-map.apvi.org.au/historical
rooftopinAustralia “is179gigawattswithanannualenergy outputof245terawatt-hours” whichismorethanthe currentannualconsumptionintheNationalElectricity Market[3].
Thislevelofexistingandpotentialpenetrationreflects thesolarinsolationcharacteristicsofthepopulated southernregionsofAustraliaincombinationwithgovernmentsubsidies,reducingcapitalcostsandrelativelyhigh networkelectricitytariffs[4].
Thesecircumstancesarenotreflectedinallcountries withsolarinsolationlevelssuitableforsmallscalesolarPV. ForexamplethelevelofpenetrationinU.S.residential buildingsiscurrentlylessthan1%[5].However,100% renewableenergyscenariomodellingofU.S.electricity demandpredictsthatsolarpowerwilldominatethe generationmix[6],andundoubtedlythiswillmeanthat small-scalesystemswillplayasignificantroleinthefuture

[7].InIndiaby2019rooftopPVsystemcapacitywasabout 2GWbutgovernmentpolicyistoreach40GWofrooftop PVcapacity(ofatotalof100GWtotalofgridconnected solarpowerby2022)[8].
ThebenefitsofBTMsolarPVintermsofcostsavingsis limitedbydaytime-onlysupply.Couplingsuchsystems withbatteryenergystoragesystems(BESS)offers significantadditionalsavingsaseveningdemandismet fromstoredexcessdaytimegeneration[9–12].Penetration ofprivateBESSishowevernotpresently financially attractiveduetothehighcapitalsystemcosts.Presentlyin AustraliatheinstalledcostofBESSisaroundAUD1500/ kWh2.ThecapitalcostofBESSgenerally,includingfor smallscalesystems,isprojectedtoreducesignificantlyas demandincreases,andwillbecome financiallyattractive whencostsfalltoEuro400/kWh(approx.AUD655)[13].
Althoughprogressvariessignificantlyacrosstheworld, itisclearthatBTMrooftopsolarPV,coupledwithbattery storagewillsupplyaverysignificantfractionofelectricity demandinthefuture.Thisstudyseekstoidentifyand quantifytheimpactofthatemergingtrendonelectricity networks.
1.2Climatepolicycontext
ThegoaloftheParisAgreementis “tolimitglobalwarming towellbelow2,preferablyto1.5°C,comparedtopreindustriallevels”.SincetheAgreementwassignedin2016 therehasbeenrenewedworldwidefocusontransitioning energysystemstoachievezeroemissionsby2050[14],with Californiaoftencitedasleadingonpolicy[15].So-called “Scope2” emissionsarethoserelatedtothepurchaseof electricityfromnetworkgenerationandareasignificant componentofthenationalgreenhousegas(GHG)emission profileinmostcountries.
InAustraliain2019theScope2GHGemissionswere 179,446ktCO2-ewhichwas34%oftotalemissions.Inthe stateofWesternAustralia,thefocusofthisstudy,Scope2 emissionsfrompurchasedelectricitywere25,048ktCO2-e or27%oftotalemissions3.Thisrepresentsanincreaseof 185%sincetheyear2000.Mostofthestate’spopulationis servicedbytheSouthWestInterconnectedSystem (SWIS),wheretheGHGintensityhasdeclinedbyaround 30%since1990to0.69kgCO2-e/kWhasgasandmore recently,solarPVandwindpower,hasledtoareductionin coal-firedgeneration.TheGovernmentofWestern Australiahasdeclaredanintentionforthestatetoachieve “NetZero” emissionsby2050,andisdevelopingstrategies foreachsectoroftheeconomytoreachthatgoal.Clearly Scope2emissionsareamajorcomponentofeachsector’s emissionsandwillplayacentralroleinachievingNetZero.
1.3Thesouthwestinterconnectedsystem
TheSWISservicesthesouthwestofthestateofWestern Australia(WA)includingthecapitalofPerth,withover 1.1millionhouseholdandbusinesscustomers.Western Australiahasamongstthehighestpenetrationofbehindthe-meter(BTM)privatesolarPVintheworldwithover 340,000systemsinstalledontheSWISwithanameplate capacityofover2000MWproducingsome3200MWhof energyor12%ofelectricityconsumedannuallybySWIS customers[16].TheAustralianEnergyMarketOperator (AEMO)isresponsibleforoperatingtheelectricitysystem includingsystemplanning,dispatchingenergyandmonitoringvoltageandfrequency.AEMOoperatesthe WholesaleElectricityMarket(WEM)inwhichlicensed retailerspurchaseelectricityfromgeneratorstoon-sellto customers.In2021,some17,600MWhofenergywas deliveredtocustomersfromthesourcessetoutin Figure1.
2 https://www.solarchoice.net.au/residential/battery-storageprice/
3 NationalGreenhouseAccounts https://www.greenhouseac counts.climatechange.gov.au/


Fig.3. (a)HalfhourlyelectricitydemandanddistributedPV(DPV)generation.(b)ResultinghalfhourlySWISnetworkloads.
1.4PrivatesolarPVinwesternaustralia
EachyearAEMOproducesaStatementofOpportunities fortheWEMinwhichitsetsoutprojectionsforfuture electricitydemandoverthecomingdecade,includingthe impactofprivateBTMsolarPV[16].Theseprojections havecontinuallyunder-estimatedthetake-up,asillustrated in Figure2
Thelatestprojectionsassumethattheannualrateof take-upwilldeclinefrom11%pato5%by2031,despitethe factthatannualincreaseshaveaveraged26%pasince2015. ThisisimportantbecauseoftheimpactofBTMsolaronthe SWISintermsofannual,seasonalanddiurnalnetwork demand.Some36%ofhomesandbusinesseshavesolarPV systemsconnectedtotheSWIS,leavingplentyofroof-space availableforcapacitytogrow.Theimpactoftheexisting capacityisalreadybeingfeltwithcustomerssupplying70% ofdemandandnetworkloadsfallingto707MWinOctober 2022requiringnetworkgenerationtobecurtailed4.Half
4 www.watoday.com.au/politics/western-australia/spring-sunand-solar-panels-push-wa-power-system-towards-its-limits20220913-p5bhsw.html
hourlynetworkdatafrom2021clearlyillustratesthe emergingimpactasillustratedin Figure3 whichshows middaynetworkloadsreducedbyupto1,500MWatsome timesofyear.
NegativeloadshavealreadyoccurredintheSouth Australianetworkduetohighprivatesolargeneration5.
1.5Studyobjectives
Mostpublishedresearchontheenergytransitionhasa focusonnetworkrenewableenergyandstorage[17,18]but neglectstheimpactofprivategenerationandstorageon electricitynetworks.Theobjectiveofthestudyreported hereistoexplorethroughsystemsmodelling,thelikely amountoffutureprivateBTMgenerationandenergy storage,andtheoptimumgenerationandenergystorage profilefora100%renewablesSWISbasedon:the underlyingdemandforelectricityasthepopulationgrows; homesandbusinesseselectrifyingtheirappliancesand vehicles;andprivateBTMgenerationandenergystorage
5 www.sapowernetworks.com.au/data/313655/sa-network-setsa-new-mark-for-negative-demand

growth.AlthoughthestudyisfocusedontheSWIS,ithas relevanceforanyregionwithhighlevelsofsolarinsolation whererooftopsolarPVwillbefavoured,includingAfrica, CentralandSouthernAmericaandtheUnitedStates[19].
2Methodology
2.1Modelconfiguration
Themodeldescribedhereisanadaptationofthatdescribed inpreviouslypublishedwork[20],andutilizesthestockand flowandoptimisationcapabilityoftheVensim6 system dynamicssimulationsoftware.Themodel(see Fig.4) incorporatesunderlyingcustomerdemandforelectricity, BTMgenerationinhomes,businessesandprecinctscale microgrids,andSWISnetworkgeneration(solarPV,on andoffshorewind,wave)andstorage(intheformof pumpedhydro[21],batteries[22]andhydrogen).Accordingly,itisamodeloftheelectricitysystemcomprising theseinteractingelementsratherthanamodelperseofthe SWIS.
Themodelsimulatestheperiodfrom2021to2051by whichtimethestateofWesternAustraliaaimstohave ‘NetZero’ emissions.Themodelusesa1hourtimestepfor atypicaldayineachmonth.
2.2Demandassumptions
Assumptionsfortheunderlyingcustomerdemandforsuch anextendedtimeframewillalwaysbeuncertain.Forthis study,theoverallphilosophyofAEMOforAustralia’s NationalEnergyMarket(NEM)setoutintheir2022 IntegratedSystemPlan(ISP)[23]hasbeenadopted.This approachwastakenasAEMOhasnotpreparedthesame ISPfortheSWIS.TheISPincludesseveralscenariosin responsetotheenergytransition,including “Progressive
6 https://vensim.com/
Change pursuinganeconomy-widenetzeroemissions 2050targetprogressively,ratchetingupemissionsreductiongoalsovertime”.Thisscenarioincludesprojections associatedwithenergyefficiencyandthefollowing transitiontimeline:
– 2020s consumerDistributedEnergyResources(DER) investment,corporateemissionabatement,andtechnologycostreductions;
– 2030s commerciallyviablealternativestoemissionsintensiveheavyindustry;
– 2040s industrialelectrification,ElectricVehicles(EVs) becomingmoreprevalentandconsumerelectrification;
– Post2045–Somedomestichydrogenproductionsupportingthetransportsectorandasablendedpipelinegas, withsomeindustrialapplicationsafter2045.
TheNEMISPdemandprojectionswerenormalisedfor energyintensityoftheeconomy(i.e.asafractionof projectedGrossStateProduct(GSP)takenfromthesame report)andfactoredtoapplytoWesternAustraliafrom 2021.Electricvehicle(EV)projectionsweretakenfroma reportbytheCommonwealthScientificandIndustrial ResearchOrganisation(CSIRO)[24],see Figure5.
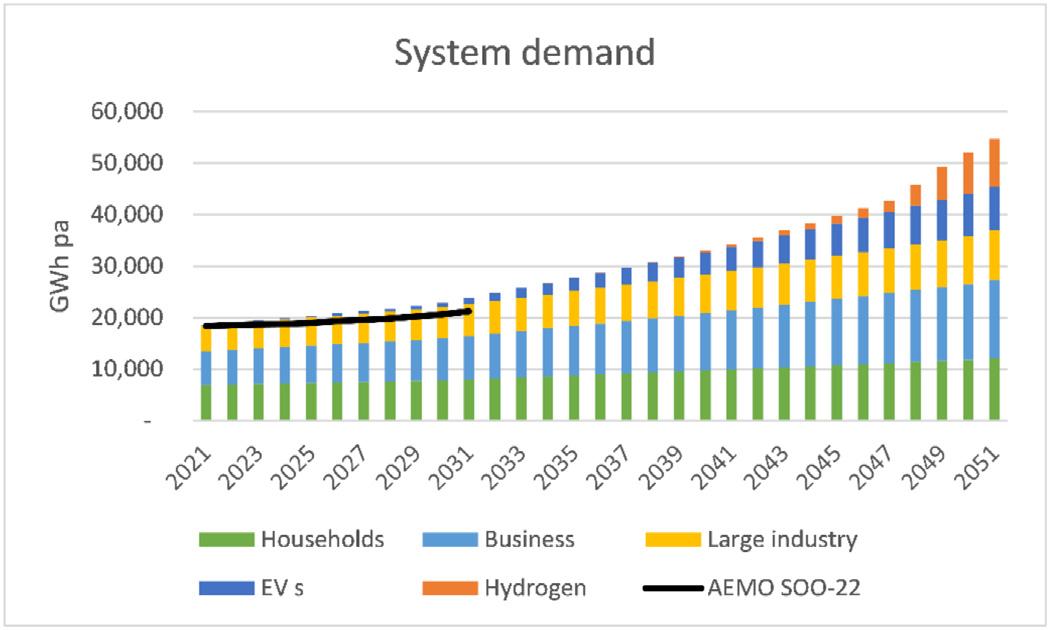
TheseassumptionswerecombinedwithAEMO’s2022 ElectricityStatementofOpportunities(ESOO)forthe SWIS[16],whichcontainsatenyearoutlook,toproducea disaggregateddemandprojectionfortheSWISto2051 (Fig.6)whichwasusedinthemodel.
Thediurnalandseasonaldemandpatternforhomes andbusinesseswasderivedasfollows.AEMOprovides datafromtheSWISthatsetsoutthetotal ‘operational load’ foreachhalfhouroftheyear7.The2021datawas combinedwiththecalculatedoutputoftheprivatesolar (alsoreportedintheESOO)toderiveanhourlydemand patternacrosstheyearforthewholeoftheSWIS.This patternwasthenappliedtotheannualdemand(Fig.6),
7 https://aemo.com.au/energy-systems/electricity/wholesaleelectricity-market-wem/data-wem/market-data-wa


anddisaggregatedintousertypesusingacombinationof informationfromtheESOO(existingdemand)andthe NEMISP(futuredemand).Althoughnoprojectionof demandoverthistimeframecanbeaccurate,thisapproach isdeemedsuitableforthepurposesofthisstudy.
2.3PrivatesolarPVprojections
Thediurnalandseasonalgenerationofhouseholdscale solarPVforsystemsintheSWISwasderivedfromthe NationalRenewableEnergyLaboratory’s ‘PVWatts’ calculator8 incombinationwithassumptionsofAustralia’s CleanEnergyRegulator,whichisanannualcapacityfactor of0.183.Thebatterycomponentofthemodelassumes10% lossesinchargingandadepthofdischarge(DOD)of90% (reflectingtherangeofdifferentbatterytypes).Batteryuse issimulatedsimply,i.e.thebatteryischargedwhen
8 https://pvwatts.nrel.gov/
generationexceedsdemand,anddischargedwhendemand exceedsgeneration.Excessgenerationisexportedtothe network,andenergyisimportedfromthenetworkwhen thebatteryisdischargedtoitsDOD.
ProjectionsforprivateBTMsolarPVandbattery storageareproducedbythemodelonthebasisofpayback periodasfollows.Ateachtimestep,thepaybackperiodfor investmentinasolarPVinstallationiscalculated(Annual savingsfromavoidednetworkpurchases/Capitalcostof system)andthetake-up(percentageofpremiseswithout solarPV)determinesthenumberofsystemsaddedtothe stockofprivatesolarPVineachtimestep.Thetake-uprate isbasedon Figure7,andisthesameasthatusedinprevious modelswhichhaveproventomatchreasonablywellwith actualtake-upoverrecentyears(see Fig.2).
Thisapproachwasappliedseparatelytohouseholdand businesspremiseswithandwithoutEVs,andthepayback periodofprivatebatteriesiscalculatedonthebasisofthe ‘additional’ savingsoverandabovethosearisingfromthe solarPVinvestment.

Althoughthesavingsfromprivatesystemsare dependentontheSWIStariffs,previousworkhasindicated thatthisissecondarytothereducingcostofsolarand batteries.Accordingly,themodelassumesstaticSWIS tariffsthroughoutthesimulationperiodforthepurposesof estimatingtake-up.
ThepriceofresidentialandbusinesssolarPVand batterysystemswastakenfromcombiningthe NEMISPcostprojectionswithhistoricalmarket prices 9 .Pricesarecurrentlyreducedbyadiscount derivedfromtheAustralianGovernment ’ sRenewable EnergyTarget(RET)scheme 10 ,whichwilldiminish untiltheschemecomestoanendin2030.Theresulting pricepro fi leisdepictedin Figure8 ,whichisinclusiveof invertercosts.
Asimilarapproachwastakentoprojectthepriceof residentialandbusinessscalebatterysystemsresultingin thepriceprofilesetoutin Figure9
Themodelalsocalculatestheescalatingcapacityof privatesolarsystemsbasedondecliningpricesovertime usingthesamepaybacklogicdescribedabove.Themodel ‘selects’ asuitablebatterycapacitybasedonaseparate model(notdescribedhere)thatoptimisesbatterycapacity foragivensolarPVcapacityandthedemandprofileof averageresidentialandbusinesspremises.Take-upof batterysystemsisthengovernedbypaybackinaccordance with Figure7.Ascostsfall,thepenetrationofprivatebattery storagesystemswillbecomemore financiallyviable[25].
Inadditiontoresidentialandbusinesssolarandbattery systems,thesystemwillalsobeinfluencedbyBTM microgridsolutions,suchasthosebeingimplementedby theWesternAustralianGovernment’slanddevelopment agencyDevelopmentWAatthePeelBusinessPark12 south
9 https://www.solarchoice.net.au/
10 https://www.cleanenergyregulator.gov.au/RET
11 Itshouldbenotedthattherearemanyoffersinthecurrent marketthatarelowerthanthepricesusedhere.
12 https://developmentwa.com.au/projects/industrial-and-com mercial/peel-business-park/microgrid-faqs
ofthecapitalcityofPerth,inwhichtheauthorwas involved.Theseschemesoperateasembeddednetworks withgenerationandstorage,andoffercustomershigh levelsofrenewableenergyaswellasdiscountsonregulated tariffs13.Itislikelythattheseschemeswillincreasein future,particularlyinindustrialsettings,andthemodel assumesthatby2050some20%oflargeindustrialloads willbeservicedbynetworkconnectedmicrogrids.
2.4Networkscalegenerationandstorage
Theseasonalanddiurnalgenerationpatternsandcapacity factorsofnetworkscalesolarandonshorewindgeneration werederivedfromAEMOdataonexistingfacilities.The resultingannualcapacityfactorsassumedforthesewere0.26 for fixedPVand0.4foronshorewind,basedonpublished AEMOhistoricaldata.Thegenerationpatternforsingleaxis PVwastakenfromPVWattswithacapacityfactorof0.26. Generationpatternsforoffshorewindwereobtainedfromthe GlobalWindAtlas14 (capacityfactor0.47),andfromHughes andHeap[26]forwavetechnology(capacityfactor0.3).
Thecostoflargescalegeneration,pumpedhydro, batterystorageandelectrolyserswasobtainedfrom CSIRO’sGenCost2021–22report[27].Themodeluses LevelisedCostofEnergy(LCOE)valuesforgeneration facilitiesbutEquivalentAnnualCost(EAC)forstorage facilities(i.e.theannualcostofowning,operating,and maintainingtheassetoveritsentirelife).Eachsetofcosts issetoutinthe Tables1-3 forgeneration,batterystorage andpumpedhydrorespectively.
Themodellingalsoconsidersthepossibilityofusing hydrogentostoreexcessenergy,anduseittofuelOpen CycleGasTurbines(OCGTs).Themodelassumesthe
13 Thediscountsarisefromacombinationofthelowercostof renewablegenerationandtheavoidanceofnetworktransmission anddistributioncosts.
14 https://globalwindatlas.info/en

Fig.9. Projectedcapitalcostofresidentialandbusinessbatterysystems.
Table1. LCOEforselectedgenerationfacilities($/MWh).
2021203020402050
Opencyclegasturbineswithfuelcosts$174.70$191.92$193.00$191.92
Opencyclegasturbineswithoutfuelcosts$50.88$45.17$44.09$43.01
LargescalesolarPV$50.52$34.22$26.90$24.71
Onshorewind$50.14$44.74$42.53$40.79
Offshorewind$124.62$105.53$98.91$93.29
Wave$296.77$91.57$91.57$78.63
PEMElectrolysers$232.60$102.54$57.65$49.77
Table2. EACforbatterystoragefacilities($/MWhpa).
2021203020402050
1hour$107.72$82.51$70.07$59.54
2hours$71.86$52.40$44.74$39.21
4hours$55.50$37.95$32.84$29.97
8hours$48.68$31.98$27.83$26.02
electrolyserloadtobe57MWh/tH2 and10.9MWh/tH2 of energyproducedingeneration,i.e.aroundtripefficiencyof around19%[23].
2.5Networkcosts
TherearenopublishedgenerationcostsfortheWEMbut JuliusSusanto(TechnicalDirectoratAustralianEnergy MarketCommission)hasproducedsomeestimates15 which aresummarisedin Table4,excludingthecostofancillary servicesandmarketfees.Thishasbeenusedtobenchmark thecostoffuturenetworkconfigurations.
15 https://www.linkedin.com/pulse/estimating-total-cost-whole sale-electricity-wem-julius-susanto/
2.6Simulations
Themodelwasused firstlytoprojectthetake-upofprivate residential,businessandmicrogridsolarPVandbattery systemsto2051.Themodelassumessaturationat72%of households(80%ofseparatehouses,and50%ofmedium andhighdensitydwellings)and50%ofbusinesspremises.16 Thebalanceofdemandisassumedtobemetby privatemicrogridsandtheSWIS.
Thenextphaseofmodellingexploredtheoptimum combinationofSWISnetworkgenerationandenergy storagetosupplythatdemand.Forthesesimulationsthe modelproducesthehourlynetworkloadprofilearising
16 HousingdemographicsforPerthsourcedfromAustralian BureauofStatisticsdata.
8W.Grace:Renew.EnergyEnviron.Sustain. 8,7(2023)
Table3. EACforpumpedhydrostoragefacilities($/MWhpa).
Table4. WholesaleelectricitycostsintheWEM.
Table5. 2030Networkconfigurations.

Fig.10. Householdpaybackperiods.17
17 Theinitialincreaseinbatterypaybacksarisesfromthe assumptionsaboutbatterysizeselection.AsPVcapacity increasesthecapacityofthebatteryincreasesresultinginhigher costsuntilbatterycostsreduceconsiderablyby2025(Fig.8)

Fig.11. Businesspaybackperiods.
fromgrosssystemdemandlesstheself-supplyfromprivate solarPVandbatteries.Thecapacityofnetworkgeneration andstoragetosupplythatnetdemandwasthenoptimised toachievethelowestannualnetworkcostusingVensim’s optimizingengineusingPowellhillclimbingalgorithm searches[28].


3Results
3.1PrivatesolarPVandbatterystorage
Thepaybackprofilesgeneratedbythemodelforresidential andbusinesssystemsareshownin Figures10 and 11 Itisclearfromthedecliningpaybackperiodsin Figures10 and 11 thatboththecapacityandpenetrationof privatesolarwillincreaseovercomingdecades.
Thepenetrationofprivatebatterysystemswillsomewhat lag,butlikelytogrowstronglyafter2025.
Figures12a and 12b depictthesimulatedpenetration ofsolarandbatteriesinhousesandbusinesseswith internalcombustionengines(ICE).Penetrationisprojectedbesaturatedbyaround2035inhouseholdsbut earlierinbusinesseswhosedemandpatternisbettersuited tosolarPVgeneration.Penetrationinhousesand businesseswithelectricvehicles(notshown)isslightly

Fig.15. (a)Solarperformance EVhousewithbatteryin2021.(b)Solarperformance EVhousewithbatteryin2050.
higherinhousesbecauseoftheadditionalbenefitin overnightEVcharging.
Figures13aandbdepictthesimulatedsolarPVand batterycapacityinhouseholds,businessesandmicrogrids associatedwiththeprojectedlevelofpenetration.The modelprojectsthatby2030therecouldbearound7000 MWofprivatesolarcapacityand4,200MWhofbattery capacity,withsolarcapacitydoublingby2050andbattery capacityrapidlyescalatingto24,000MWhby2050.
3.2Networkimpacts
Theimpactofthislargeincreaseinprivategenerationand storagecapacitybecomesclearwhenviewingtheperformanceofindividualprivatesystems.
Figures14aandbdepictanindividualhousewithan ICEvehicleandsolarPVonanaveragedayin2021and 2050,whileFigures15aandbdepictanEVhousewitha batteryin2021and2050.These figuresillustratethe growingquantityofenergythatwillbeexportedtothe networkfromanindividualhouse,ifnotcurtailed.When thisiscompoundedbytheprojectedlargetake-upitcanbe seenthatthiswillhaveamassiveimpactontheSWIS network.Whiletheemergenceofprivatestoragesomewhat amelioratestheimpactofsolarexports[29],thiswillnotbe sufficienttototallyabsorbprivateenergyexports.
Theprojectednetworkloadarisingfromthese projectionsisdepictedinFigures16a–16hforatypical dayinSummerandAutumn(whensolargenerationishigh anddemandisnormallylowest)inselectedyearsto2050. Theseindicatethatnetworkloadswilllikelybecome negativebefore2030unlessprivateexportsarecurtailed.
Recentlyintroducedrulesrequireallnewandupgraded invertersinstalledwithacapacityof5kVAorgreatertobe capableofbeingremotelyswitchedoff “duringanextreme minimumdemandevent”.However,asnotedherethiswill becomeanevery-dayeventinmostmonthsinfutureyears. Theconcernofnetworkmanagersinrespectoflarge exports,whetherleadingtolowornegativeloads,relates tonetworkstabilityinrespectofvoltageandfrequency regulation[30].However,curtailmentwouldbeaperverse outcomeleadingtothelossof(almost)freerenewable energytoallowexpensiveandpollutingfossilfuel
generatorstocontinueoperating(forsometimeatleast). Renewabletechnologiesandservicesincludinggeneration, embeddednetworksandenergystoragewillultimatelybe abletodealwiththestabilitychallenges[31],andsothe followingassumesthattheexportofprivategenerationto theSWISwilloccureventually,evenifnotinthenear future.
Clearlybaseloadgenerationfacilitieswillbecome untenabletooperatewellbeforeloadsbecomenegative, asthesetechnologiesbecomeeconomicallyunviableatlow capacityfactors,andinanycaseolderplantscannotbe rampedataratenecessarytoaccommodatetherapid changesinnetworkload[32].Accordingly,duetoprivate exports,networkgenerationwillnecessarilyhavetorelyon largepenetrationofrenewablesandstorage,irrespectiveof emissionspolicies.
3.3Optimalnetworkconfiguration
Thesecondphaseofmodellingexploredarangeofpotential renewablenetworkgenerationandenergystoragesolutions thatarecompatiblewithlargeprivateenergyexports.The modelprojectsthattheannualsystemsupply demand willbeassetoutin Figure17.Themodelcalibrateswell withtheactualSWISnetworkloadsfor2021identifiedin Figure3.
Irrespectiveoftheenergydemandpatternand generationtechnology,itismostef ficienttomatch generationtoloadascloselyaspossible.Thecompatibility ofvariousrenewablegenerationtechnologieswiththe projectednetworkloadcanbeillustratedbycomparing averagehourlygenerationwithnetworkload.Figures18 to21a–21dillustratethisforsolarPV,onshorewind, offshorewindandwavetechnologies,withgeneration capacitymatchedtotheprojected2050loadforaverage JanuaryandJulydays(i.e.totalgenerationequalsload forthatday).
Giventhediurnalshapeofthefuturenetworkload, largescalesolarisnotideal,merelyaddingtoexcess generationduringthemiddleoftheday.InWA,onshore windinfacthasthebestdiurnalprofile,asgeneration outputistypicallylowerinthemiddleoftheday.The

Fig.16. (a)ProjectednetworkloadinJan2021.(b)ProjectednetworkloadinOct2021.(c)ProjectednetworkloadinJan2030.(d) ProjectednetworkloadinOct2030.(e)ProjectednetworkloadinJan2040.(f)ProjectednetworkloadinOct2040.(g)Projected networkloadinJan2050.(h)ProjectednetworkloadinOct2050.

Fig.17. Systemsupply.

Fig.18. (a)SingleaxissolarPVcfNetworkloadJanday2050.(b)SingleaxissolarPVcfNetworkloadJulday2050.

Fig.19. (a)OnshorewindcfNetworkloadJanday2050.(b)OnshorewindcfNetworkloadJulday2050.

Fig.20. (a)OffshorewindcfNetworkloadJanday2050.(b)OffshorewindcfNetworkloadJulday2050.

Fig.21. (a)WavecfNetworkloadJanday205018.(b)WavecfNetworkloadJulday2050.
modelwasusedtoexploreannualgenerationandstorage optionsandcosts(excludingthecostsoftransmissionand distribution)forthesecombinations.
3.42030Networkconfiguration
Basedonthecostssetoutin Tables1 – 3 themodel producesacon fi gurationofgenerationandstoragethat optimisesforcost,i.e.producesthelowesttotal annualcost.For2030,theoptimalgenerationisaround 4500MWofonshorewind,supplementedwithpumped hydrostorage(PHES)andOCGTs(Case2030-1). Thediurnalsupply-demandcurveforatypicaldayin eachmonthisdepictedin Figure22 a.Itisonlythe OCGTsthatcreategreenho usegasemissionsinthis scenario.
Additionalcasesincludetheassumptionthatonly2400 MWofonshorewind(halfofthe firstcase)isinstalled. Optimisingforcostresultsincomplementingtheonshore
18 Averagehourlydataforeachmonthonlyavailableforwave generation.
windwithwave(Case2030-2) see Figure22bandsingle axisPV(SAPV)(Case2030-3) see Figure22c.The resultsaresummarisedin Table4
3.52040networkconfiguration
Tomatchtheprojectednetworkloadfor2040,themodel againproducesanoptimalconfiguration(Case2040-1) utilisingonshorewind,PHESandOCGTs.Case2040-2 assumesonlyhalfofthatonshorewindisinstalled,givingrise tothenextmostcostoptimalconfigurationinwhichonshore windissupplementedbywave.Asimilarcostoutcomeis achievedwithonshorewindbeingsupplementedbyoffshore windandasmallSAPVcapacity(Case2040-3).
Thediurnalsupply-demandcurveforatypicaldayin eachmonthisdepictedin Figures23a–23c andtheresults aresummarisedin Table6.
3.62050networkconfiguration
By2050theoptimalconfigurationremainspredominantly onshorewind,supplementedbyasmallamountofSAPV togetherwithnetworkstorage(Case2050-1).Shouldonly

Fig.22. (a)Systemsupplyanddemandforanaveragedayineachmonthin2030optimisedforcost onshorewindgeneration,energy storageandOCGTs.(b)Systemsupplyanddemandforanaveragedayineachmonthin2030optimisedforcost onshorewind,wave, energystorageandOCGTs.(c)Systemsupplyanddemandforanaveragedayineachmonthin2050optimisedforcost onshore wind,SAPV,energystorageandOCGTs.

Fig.23. (a)Systemsupplyanddemandforanaveragedayineachmonthin2040optimisedforcost– onshorewindgeneration,energy storageandOCGTs.(b)Systemsupplyanddemandforanaveragedayineachmonthin2040optimisedforcost onshorewind,wave, energystorageandOCGTs,(c)Systemsupplyanddemandforanaveragedayineachmonthin2040optimisedforcost onshore wind,SAPV,energystorageandOCGTs.

Fig.24. (a)Systemsupplyanddemandforanaveragedayineachmonthin2050optimisedforcost– onshorewindgeneration,energy storageandOCGTs.(b)Systemsupplyanddemandforanaveragedayineachmonthin2050optimisedforcost onshorewind,wave, SAPV,energystorageandOCGTs.(c)Systemsupplyanddemandforanaveragedayineachmonthin2050optimisedforcost onshorewind,H2storageandOCGTs.
Table6. 2040networkconfigurations.
Generationcapacity(MW)Case2040-1Case2040-2Case2040-3 Onshorewind624430003000
Offshorewind 1257
Wave3076
SAPV 272
OCGTcapacity145716372093 770177266622
PHES(MWh)129916701327
Curtailment33%26%25%
OCGTcapacityfactor7%13%18%
Emissionsintensity(tCO2-e/MWh)0.030.060.12 Networkcosts($/MWh)$68$95$98
halfoftheonshorewindbeinstalledthenextmostcost optimalconfigurationinvolveswave,similarSAPVand morestorage(Case2050-2).Asimilarcostoutcome(not shown)isachievedwithasmallamountofoffshorewind, muchlargerSAPVcapacity,andmorestorage.
By2050,thecostofhydrogenelectrolysersis projectedtohavefallensigni fi cantly(see Table1 ) andsoanadditional Table1 con fi gurationhasbeen considered.Case2050-3assumesthattheexcess
generationisnotcurtailed,ratherisdeployedto producehydrogenatthesiteoftheOCGTs,whichis thenusedasfuelwhenthosefacilitiesaredeployed.This ‘ free ’ energyreducesthecostofoperatingtheOCGTs byaround80%andturnstheOCGTsintorenewable energygenerators.
Thediurnalsupply-demandcurveforatypicaldayin eachmonthisdepictedin Figures24a–24c andtheresults aresummarisedin Table7
Table7. 2050networkconfigurations.
Case2050-1Case2050-2Case2050-3
Generationcapacity(MW) Onshorewind9833500010,000
13,27113,43812,646
–Curtailment32%25%0% OCGTcapacityfactor7%9%10%
Emissionsintensity(tCO2-e/MWh)0.040.050.00
Networkcosts($/MWh)$65$83$76
Table8. Summaryofresults.
CostoptimisedconfigurationsH2configuration 203020402050(1)2050(2)
Annualnetworkload(GWh)12,64717,28428,38428,384 Generationcapacity(MW) Onshorewind45476244983310,000 SAPV 743
OCGT1310145726952700 585777011327112,700 PHES(MWh)919129915870
Emissionsintensity(tCO2-e/MWh)0.040.030.040.00
Networkcosts$71$68$65$76
Alternateschemecosts$96$95$83 16W.Grace:Renew.EnergyEnviron.Sustain.
3.7Summaryofresults
Theresultsfortheoptimalconfigurationsplusthe2050 hydrogenstorageoptionaresummarisedin Table7 and Figure25.
Theotherconfigurationsinvolvingoffshorewind, SAPVandstoragevariationsaresignificantlymorecostly thantheoptimumsolution,butineachcasenetworkcosts areprojectedtodecreaseintheperiodto2050.
4Discussion
4.1Caveat
Likeallmodellingstudies,thisonereliesonamultitudeof assumptions,mostimportantlythecontinuallyreducing costsofrenewableenergyandenergystorageresultingin continuingincreasesinthenumberandcapacityofBTM systems,andtheassociatedimpactonnetworkloads.Also importantaretheprojectionsofdecreasingcostsatthe networkscale.However,iftheseassumptionsprovetobe optimistic,thegeneral findingswillstillbelargely
applicable,albeitthatthemagnitudesofdemandsand capacitieswillbedifferent.
4.2Optimalrenewablegeneration
Giventhediurnalandseasonalshapeofthefuture networkload(see Figure15),andaprojectedcost reductionofaround20%by2050[27],onshorewindisthe optimalgenerationsolutionfortheSWIS.Despitesolar PVbeingprojectedtohalveincostby2050,themismatch betweengenerationandload(see Figure18)means signifi cantcostlystoragewouldberequired.Oneofthe assumedbenefi tsofoffshorewindisitshighercapacity factoranddiurnal/seasonalconsistencyinoutput[33]. However,thisconsistencyisnotasbenefi cialwhenthe networkloaddropssodramaticallyinthemiddleofthe dayinSummerandSpring(see Figure20).Offshorewind isalsoprojectedtohavethehighestLCOEby2050.There isasimilarproblemforwavetechnologyintermsof generationpattern(see Figure20)despiteitsprojected costdecreaseto2050(see Table1).
Networkcostsfortheoptimalonshorewindconfigurationsarelower(in$2022)thancurrentlyisthecase (∼$85/MWh)by15–25%through2030–50,butthe alternativesinvolvingalowerproportionofonshorewind aremarginallyhigher(13%)until2050.
Giventhebenefitsofdiversifyingweather-related generation,itislikelythattheoptimalnetworkwill involve50-75%onshorewind,supplementedbyoffshore windand/orwave,andsmallerquantitiesofSAPV.
4.3RoleofOCGTs
Theamountofextragenerationand/orstoragerequired withoutOCGTsmeansthattheywillremainimportant generatorsintothefuture,irrespectiveoftheirhighLCOE. Inthesesimulationsthenecessarycapacityfactorfor optimalnetworkperformanceisonlyaround7%,risingtoa maximumof18%forsomeofthealternatives.Itislikely thattheywillremainfuelledbynaturalgasuntilthecostof hydrogenproductionmakesthisalternativefuelcost competitivearound2050.Evenso,theirutilisation,needed mainlyinthewinter,meansthattheoverallnetwork emissionsproducedareminimal,rangingfrom0.04-0.13 tCO2-e/MWhcomparedwiththepresentSWISintensity of0.69tCO2-e/MWh.
4.4Roleofstorage
Energystoragewillbeanimportantcomponentofall futurenetworkswithbatteriessuretoplayanimportant role[34–37],albeitthatitisnotyetclearwhichbattery technologywilldominate[38].Benefitsincludeancillary servicessuchas “peakshaving,improvementinvoltage profileandreductioninpowerlosses” [39].Thisstudy indicatesthatstoragecapacitywillneedtoreacharound 1000MWh/1000MWby2030andincreaseto1600MWh/ 1600MWby2050.Thesimulationshereleadtoa preferenceforPHESasthecheaperalternativetobattery storage.However,thedifferenceincostisrapidly narrowing[27],andforstabilityreasonsitwillbelikely tobebeneficialtohavesomedistributedstorageintheform ofbatterieswithinthenetwork[40],potentiallyinterfacing withprivatestorage.
4.5Roleofhydrogen
Hydrogenproductionisbeingprimarilyconsideredasan alternativefuelforheavytransportandindustrial processes.However,assetouthere,thelargeamountof excessenergyarisingfromBTMexportsandotherwise curtailednetworkgenerationprovidesanopportunityto beneficiallyusethisexcessenergywithintheelectricity network[41,42].Thiswouldbeareasonablysimple mechanismtoincorporateintothemarket,making electrolysersaload ‘calledin’ bythemarketoperator duringperiodsoflow/negativedemandinordertoutilise excessenergywhilemaintainingnetworkstability.The electrolyserswouldbeco-locatedwithandoperatedby OCGTmarketparticipantswhoinanycaserequirehighcapacitytransmissionconnectionstothenetwork.Hydro-
genwouldbestoredonsiteatthesefacilities,removingthe complicationsoftransport,withsufficienthydrogen producedtobalancesupplyanddemandovertheyear[44]. However,itisunlikelythatthisoutcomewillbe commerciallyviableuntilthecostofelectrolysersfalls significantly,projectedtobearound2050[27].
4.6Marketoperations
Sinceelectricitymarketshavebeenderegulatedaroundthe worldinrecentdecades,complexmarketmechanismshave beenestablished,tradingelectricitybetweengenerators andretailersateachtradinginterval[43].InWestern Australia,theSWISoperatesdifferentlytomanymarkets (includingtheNEM)intworespects, firstlythatmost tradingismostlydoneviabilateralcontractsratherthana spotmarket,andsecondlyinrespectoftheexistenceofa ReserveCapacityMechanism(RCM)(see Table4). Intervaltradingcreatescompetitionbetweengenerators, andthismakessensewhenvariablecosts(mainlyfuel)area significantcomponentofthebid.However,thefuturewill bedominatedbyrenewablegeneratorsandenergystorage facilitieswhosevariablecostsareverysmallcomparedto theircapitalcosts.Withvariableloadsandintermittent generationleadingtohighlevelsofcurtailment,itwillbe necessarytopayfacilityownersforthecapacitytheymake available,whetherornottheyarecontributingtonetwork supplyduringanyparticularinterval,otherwiseinvestmentswillbeveryrisky.Inthisstudythenetworkcosts havebeenbasedon$/MWcapacityforgenerationand $/MWhcapacityforenergystorage.TheRCMprovides theopportunitytomovetheWEMmoretowardsa (predominantly)capacitymarketovertime,allocating capacitycreditsforbothgenerationandstorage.Suchan arrangementwillstillensurecompetition,whilereducing investmentrisk.
5Conclusions
Thereducingcostofsmall-scalesolarPVsystems, supportedbytheAustralianGovernment’sRETscheme hasledtoarapidtake-upofprivateBTMgeneration, whichwillcontinueascapitalcostscontinuetofall.In WesternAustralia,despitethealreadyhighpenetration, thereremainmanymorerooftopstoaccommodatesuch systems.Thereducingcostofsmall-scalebatterieswillalso leadtoatake-upofprivateenergystorage,somewhat easing,butnoteliminatingtheimpactontheSWIS network.
Althoughprivateschemesinaggregatereducethe necessarynetworkcapacity,lowandeventuallynegative loadsinthemiddleofthedayareachallengeforsystem plannersandmanagers.AEMOhaveconsistentlyunderestimatedtherateofBTMpenetration,whichmeansthat preparationforconceptualisationandimplementationof thefuturenetworkhasbeentooslow.Althoughaphaseout ofmostoftheSWIScoal-firedpowerstationsisplannedby 2030,itislikelytheywillbetechnicallyandcommercially unviablebeforethen,aswillanyformofbaseloadnetwork generation.

Giventhediurnalandseasonalshapeofthefuture networkload,togetherwithprojectedrenewablegenerationcosts,onshorewindenergywillbethemostcost optimalgenerationsourcefortheSWIS,supplementedby smallercapacityoffshorewind,waveandSAPVfacilities. OCGTswillcontinuetoberequiredtomeetshortterm supply-demanddeficits.
Networkstoragewillbenecessarytoabsorbexcess energyfromBTMimportsandrenewablegeneration,but significantcurtailmentwillstillbenecessarytomatch supplywithdemand.AlthoughPHESisthelowercost option,batterystoragewilllikelyberequiredwithinthe transmission/distributionsystemtobalancelocalsupplydemandandmaintainnetworkstability.Inthelonger term,hydrogenproductionoffersanopportunityto provideazeroemissionfuelsourceforOCGTs.
NetworkgenerationandstoragecostsperMWhof networkloadintothefuturearelikelytobesimilarto existingcostswiththerangeoftechnologiesconsideredin thisstudy.
Themainfocusforfutureworkarisingfromthisstudy relatestothedesignofthewholesaleelectricitymarket, whichisunsuitedtothehighcapital/lowoperatingcost generationandstorageplantthatwilldominatefuture electricitynetworksastheytransitiontonetzero emissions.Theimpactofthefuturemixofprivateand networkgeneration/storageontransmissionanddistributionofelectricityisanothercriticalelementrequiring urgentattention.
References
1.A.Jäger-Waldau,Snapshotofphotovoltaics-February2022, EPJPhotovolt. 13,9(2022)
2.InternationalEnergyAgency,GlobalEnergyandClimate Model(2022).Retrievedfrom: https://www.iea.org/ reports/global-energy-and-climate-model
3.M.Roberts,K.Nagrath,C.Briggs,J.Copper,A.Bruce,J. Mckibben,Howmuchrooftopsolarcanbeinstalledin Australia.ReportfortheCleanEnergyFinanceCorporation andthePropertyCouncilofAustralia,Sydney(2019)
4.B.O’Connell,C.Davies,A.Paver,E.Taylor,T.Veijalainen, R.Ganguli,C.Schaefer,Achievingworld-leadingpenetrationofrenewables:theaustraliannationalelectricitymarket, IEEEPowerEnergyMag. 19,18–28(2021)
5.A.C.Lemay,S.Wagner,B.P.Rand,Currentstatusand futurepotentialofrooftopsolaradoptionintheUnited States,EnergyPolicy 177,113571(2023)
6.E.Zozmann,L.Göke,M.Kendziorski,C.Rodriguezdel Angel,C.vonHirschhausen,J.Winkler,100%renewable energyscenariosforNorthAmericaspatialdistributionand networkconstraints,Energies 14,658(2021)
7.D.Agdas,P.Barooah,OntheeconomicsofrooftopsolarPV adoption,EnergyPolicy 178,113611(2023)
8.R.Chandel,S.S.Chandel,P.Malik,Perspectiveofnew distributedgridconnectedrooftopsolarphotovoltaicpower generationpolicyinterventionsinIndia,EnergyPolicy 168, 113122(2022)
9.S.Comello,S.Reichelstein,Theemergenceofcosteffective batterystorage,Nat.Commun. 10,2038(2019)
10.Q.Hassan,B.Pawela,A.Hasan,M.Jaszczur,Optimization oflarge-scalebatterystoragecapacityinconjunctionwith photovoltaicsystemsformaximumself-sustainability,Energies 15,3845(2022)
11.R.Khezri,A.Mahmoudi,M.H.Haque,Optimalcapacityof solarPVandbatterystorageforAustraliangridconnectedhouseholds,IEEETrans.Ind.Appl. 56,5319–5329(2020)
12.A.Saez-de-Ibarra,E.Martinez-Laserna,D.-I.Stroe,M. Swierczynski,P.Rodriguez,SizingstudyofsecondlifeLi-ion batteriesforenhancingrenewableenergygridintegration, IEEETrans.Ind.Appl. 52,4999–5008(2016)
13.M.M.Symeonidou,C.Zioga,A.M.Papadopoulos,Lifecycle costoptimizationanalysisofbatterystoragesystemfor residentialphotovoltaicpanels,J.CleanerProd. 309,127234 (2021)
14.S.Potrč,L. Čuček,M.Martin,Z.Kravanja,Sustainable renewableenergysupplynetworksoptimization-Thegradual transitiontoarenewableenergysystemwithintheEuropean Unionby2050,Renew.Sustain.EnergyRev. 146,111186 (2021)
15.K.C.Johnson,California’sambitiousgreenhousegaspolicies: aretheyambitiousenough?EnergyPolicy 177,113545 (2023)
16.AEMO,2022WholesaleElectricityMarketElectricity StatementofOpportunities(2022).RetrievedfromPerth: https://aemo.com.au/-/media/files/electricity/wem/plan ning_and_forecasting/esoo/2022/2022-wholesale-electrici ty-market-esoo.pdf?la=en&hash=AF5B0EE73B9AAD4 C0A246F264BC72AB6
17.J.Beyza,J.M.Yusta,Theeffectsofthehighpenetrationof renewableenergiesonthereliabilityandvulnerabilityof interconnectedelectricpowersystems,Reliab.Eng.Syst.Saf. 215,107881(2021)
18.T.J.Hammons,Integratingrenewableenergysourcesinto Europeangrids,Int.J.Electr.PowerEnergySyst. 30,462–475(2008)
19.Statista,SolarPV-statistics&facts(2023).Retrievedfrom: https://www.statista.com/topics/993/solar-pv/#topicOver view
20.W.Grace,ExploringtheDeathSpiral:asystemdynamics modeloftheelectricitynetworkinWesternAustralia,In TransitionTowards100%RenewableEnergy.Springer 2018),pp.157–170
21.A.Blakers,M.Stocks,B.Lu,C.Cheng,Areviewofpumped hydroenergystorage,Progr.Energy 3,022003(2021)
22.Z.Csereklyei,A.Kallies,A.D.Valdivia,Thestatusofand opportunitiesforutility-scalebatterystorageinAustralia:a regulatoryandmarketperspective,UtilitiesPolicy 73, 101313(2021)
23.AustralianEnergyMarketOperator,2022IntegratedSystem PlanfortheNationalElectricityMarket(2022)
24.P.W.Graham,L.Havas,Electricvehicleprojections2021 (2021).Retrievedfrom: https://aemo.com.au/-/media/files/ electricity/nem/planning_and_forecasting/inputs-assump tions-methodologies/2021/csiro-ev-forecast-report.pdf
25.J.Koskela,A.Rautiainen,P.Järventausta,Usingelectrical energystorageinresidentialbuildings-Sizingofbatteryand photovoltaicpanelsbasedonelectricitycostoptimization, Appl.Energy 239,1175–1189(2019)
26.M.G.Hughes,A.D.Heap,National-scalewaveenergy resourceassessmentforAustralia,Renew.Energy 35, 1783–1791(2010)
27.P.Graham,J.Hayward,J.Foster,L.Havas,GenCost202122:Finalreport(2022).Retrievedfrom: https://www.csiro. au/-/media/News-releases/2022/GenCost-2022/Gen Cost2021-22Final_20220708.pdf
28.S.M.Goldfeld,R.Quandt,H.Trotter,Maximizationby improvedquadratichill-climbingandothermethods.PrincetonUniversity,EconometricResearchProgramPrinceton (1968)
29.H.J.J.Yu,Systemcontributionsofresidentialbattery systems:newperspectivesonPVself-consumption,Energy Econ. 96,105151(2021)
30.B.Uzum,A.Onen,H.M.Hasanien,S.M.Muyeen,Rooftop solarPVpenetrationimpactsondistributionnetworkand furthergrowthfactors acomprehensivereview,Electronics 10,55(2021)
31.T.Liu,Y.Song,L.Zhu,D.J.Hill,Stabilityandcontrolof powergrids,Annu.Rev.ControlRobot.AutonomousSyst. 5,689–716(2022)
32.M.A.Gonzalez-Salazar,T.Kirsten,L.Prchlik,Reviewofthe operational flexibilityandemissionsofgas-andcoal-fired powerplantsinafuturewithgrowingrenewables,Renew. Sustain.EnergyRev. 82,1497–1513(2018)
33.H.Díaz,C.G.Soares,Reviewofthecurrentstatus, technologyandfuturetrendsofoffshorewindfarms,Ocean Eng. 209,107381(2020)
34.F.Keck,M.Lenzen,A.Vassallo,M.Li,Theimpactofbattery energystorageforrenewableenergypowergridsinAustralia, Energy 173,647–657(2019)
35.N.Martin,J.Rice,Poweroutages,climateeventsand renewableenergy:reviewingenergystoragepolicyand regulatoryoptionsforAustralia,Renew.Sustain.Energy Rev. 137,110617(2021)
36.Z.Topalović,R.Haas,A.Ajanović,M.Sayer,Prospectsof electricitystorage,Renew.EnergyEnviron.Sustain. 8,2 (2023)
37.H.Zsiborács,N.H.Baranyai,A.Vincze,L.Zentkó,Z. Birkner,K.Máté,G.Pintér,Intermittentrenewableenergy sources:theroleofenergystorageintheeuropeanpower systemof2040,Electronics 8,729(2019)
38.A.Poullikkas,Acomparativeoverviewoflarge-scalebattery systemsforelectricitystorage,Renew.Sustain.EnergyRev. 27,778–788(2013)
39.M.Mahesh,D.VijayaBhaskar,T.NarsaReddy,P.Sanjeevikumar,J.B.Holm-Nielsen,Evaluationofancillaryservicesin distributiongridusinglarge-scalebatteryenergystoragesystems, IETRenew.PowerGener. 14,4216–4222(2020)
40.K.N.Bangash,M.E.A.Farrag,A.H.Osman,Investigationof energystoragebatteriesinstabilityenforcementoflow inertiaactivedistributionnetwork,Technol.Econ.Smart GridsSustain.Energy 4,1(2019)
41.C.Acar,I.Dincer,Reviewandevaluationofhydrogen productionoptionsforbetterenvironment,J.CleanerProd. 218,835–849(2019)
42.P.Colbertaldo,S.B.Agustin,S.Campanari,J.Brouwer, ImpactofhydrogenenergystorageonCaliforniaelectric powersystem:towards100%renewableelectricity,Int.J. HydrogenEnergy 44,9558–9576(2019)
43.D.Gan,D.Feng,J.Xie,ElectricityMarketsandPower SystemEconomics,CRCPress(2013)
44.S.E.Hosseini,M.A.Wahid,Hydrogenproductionfrom renewableandsustainableenergyresources:promisinggreen energycarrierforcleandevelopment,Renew.Sustain. EnergyRev. 57,850–866(2016)
Citethisarticleas:WilliamGrace,Optimisinggenerationandenergystorageinthetransitiontonetzeropowernetworks, Renew.EnergyEnviron.Sustain. 8,7(2023)