. Moo,,MG · PROHIBITED
Bentley
WaterGEMS V8 XM Edition continues with Haestad Methods' tradition of pioneering research and innovation, advancing the water modelling technology standard once again.
ELIMINATE PLATFORM RESTRICTIONS
Being anchored to a single platform is cost ly and risky. WaterGEMS V8 XM Edition is the only so luti on that lets everyone work within their favorite platform, sharing a single model file.
SHATTER PERFORMANCE BARRIERS
Designed to support all-inclusive models, WaterGEMS V8 XM Edition gets a new power boost to build, run, edit , and map l arge water distribution models with ease, at recordbreak i ng speeds.
EASIER THAN EVER!
The legendary ease of use of Haestad Methods so l utions is magnified with WaterGEMS V8 X M Edition Enjoy a fresh new stand-alone interface, an improved ArcGIS integration, and an all-new MicroStation platform with dozens of new features and ground-breaking utilities :

• Criticality analysis
• Network trace queries
• Stand -alone Terrain Ex traction
• New isolation valve element
• Variable speed pump batteries
• New hydrant element
• Dynamic SQL-based queries
• Stand-alone GIS demand allocation
• Network segmentation analysis
• Pressure -dependant demands
• Network navigator
• Centralised water use management
• Unit demand engineering librarie s
• Auxiliary fire flow resu lts
Learn more about the award -winning WaterGEMS V8 XM Edition at: www.bentley.com/AWA
Contact us today for more information:
Toll-free (Australia) : 1800 245 005
Toll-free (New Zealand): 0800 444 046 e-mail : anz.marketing@bentley.com
Visit us at Rainwater & Urban Design!
August 21-23, 2007
Sheraton on t h e Park, Sydney BOOTH #9
1mDe : I: l!ll "" "" l!D
OPINION AND INDUSTRY NEWS OPINION
Water Industry Skills - Cause and Effect
DBarnes, President, AWA
The AWA You Want to Have TMollenkopf, CEO, AWA
My Point of View NFletcher, Emeritus Professor of Physics, University of New England
AWA NEWS Includes: RiverBank - Breaking New Ground; Smart WaterMark Working with Water Utilities; Report on the NWC Stakeholder Forum; Climate Activist to Kayak Murray-Darling; Celebrating 'Water for Life' During October
AWA EDUCATION Includes: Young Water Professionals (YWP)
CROSSCURRENT National Issues and Policy, States, New Reports and Papers, Awards, People in the News
AWA MEMBERSHIP NEWS New Members
FEATURES (' · , 1 indicates the paper has been refereed)
Irrigation Versus Ecosystems: What are the Choices? Can we achieve sustainable development of wetlands?
[i) TDS in Sewage: Sources and Trends in Melbourne's West /,, / The impacts of trade waste TDS on recycled water can be reduced ~\./
The environmental impacts ofthe saline outfalls from seawater desalination plants are closely scrutinised wherever they are in the world. The paper on page 67 outlines the biologi,cal testing program used in California In Australia the first big plant was comm issioned in Perth early this year and discharges its concentrate into Cockburn Sound via a 1.5 km pipeline and 40 diffuser ports. The mixing zone is less than 3 ha. There is an ongoing program, the most intensive ofany in the world, to monitor the health ofthe receiving water Our photograph shows the team preparing to launch one of the buoys which transmit physical and meteorological parameters every 30 minutes to the Water Corporations Operations Centre.
Journal of the Australian Water Association Volume 34 No 5 August 2007
PROFESSIONAL
NATIONAL
CALENDAR EVENTS; CONFERENCE REPORTS TECHNICAL
DEVELOPMENT
EVENT
IRRIGATION
CMFin layson
PUMPING & PIPELINES TR Ibrahim, BMeehan, PCarpenter, NCorby Pressure Sewerage Systems: Seminar, April 2007, Melbourne 4 5 6 8 18 20 30 32 34 39 44 A technology attracting a lot of interest Report by Andrew Chapman and Bob Swinton 50 [I] Improved Cytotoxicity Testing of Products in Contact with Drinking Water Amendment of the Australian Standard {AS/NZS 4020) S Fanok, S Froscio, AHumpage 55 CLIMATE CHANGE [El The Enhanced Greenhouse Effect: Threats to Australia's Water Resources· Part 2: Potential Impacts and Solutions Ableak scenario for southern and eastern Australia ABPittock 59 DESALINATION lll Treatment of Wastewaters by RO : Operating Issues - Part 1 Identifying potential membrane foulants ADavey, RSchumann, KHoehn 62 Tolerance of Marine Life to Desalination Plant Discharges Establishing the site-specific tolerable level of salinity NVoutchkov 67 RECYCLED WATER Risk Management: Bovine Johne's Disease and Water Recycling Quantifying and managing the risk of disease transmission TAnderson 71 WATER SUPPLY A State Water Plan For Western Australia Extensive community consultation and 13 government agencies involved MBlais, HForte 75 WATER BUSINESS NEW PRODUCTS AND BUSINESS INFORMATION · SPECIAL FEATURES: SEWER SYSTEMS; SLUDGE MANAGEMENT 80 ADVERTISERS' INDEX 96 OUR COVER
TDS REDUCTION
Journal of the Australian Water Association Water AUGUST 2 007 1
Photo courtesy of the Water Corporation
AWA CONTACT DETAILS
• 'Promoting the sustainable
Alli!UUAM ,I' J .,;:::::,,. management o1 water
POSTAL ADDRESS
PO Box 388, ARTARMON NSW 1570
EMAIL info@owo.osn.au
WEBSITE http://www.owo.osn au
PRESIDENT
David Barnes - president@owo osn.au
CHIEF EXECUTIVE OFFICER
Tom Molle nkopf - tmol lenkopf@owo osn au
CHIEF OPERATIONS OFFICER
Ion Jarmon - ij ormo n@owo .o sn.au
EVENTS
Lindo Phill i ps - 61 2 9495 9914 lphil l ips@owo.osn.au
MEMBERSHIP INFORMATION AND INQUIRIES
Michael Seller - 02 6581 3483 mse ll er@owo.osn.au
MEMBERSHIP RENEWALS AND CHANGES
Membership Team - 1300 361 426 info@owo.osn.au
MEDIA AND MARKETING
Jennifer Sage - jsoge @owo.osn.au
SCIENTIFIC AND TECHNICAL INFORMATION
Dione Wies ner PhD - 61 2 9495 9906 dwiesner@owo.osn.au
WATER EDUCATION NETWORK
Cor in ne Chee seman - 61 2 9495 9907 ccheesmon@owo.osn au
NATIONAL SPECIALIST NETWORK
Louro Evonson-6129495 99 17 levo nson@owo. osn. au
AWA BRANCHES : AUSTRALIAN CAP ITAL TERRITORY and NEW SOUTH WAL ES
Errin Dryden - 61 2 9 495 9908 edryden@owo.osn.au
NORTHERN TERR ITORY
c/ o Ion Jarmon - 61 2 9495 99 1 1 ijormon@owo osn.au
SOUTH AUSTRALIA
Sarah Corey · 6 1 8 8267 1783 so bronc h@owo.osn.au
QUE ENSLAND
Kathy Bou rbon - 61 7 3397 56 44 owoq@owo.osn.au
TASMANIA & VICTORIA BRANCH
c/o Roche l-onn Mortin - 61 3 9235 1416 tosbronch@owo.osn.au vicbronch@owo.osn.au
W ESTERN AUSTRALIA
Coth Miller - 0416 289 075 cmiller@owo.osn.au
INTE RN ATIONA L WATER ASSOC IATI ON, AUST. (IWAA)
c/o Tom Mollenkopf · tmo ll enkopf@owo.osn au
DISCLAIMER
Austra l ian Water Associati on assumes no responsibility for opinion or statements of facts expressed by contributors or advertisers.
COPYRIGHT
AWA Waler Journal is subject to copyright and may not be rep roduced in any format wi thou t wri tten permission of AWA. To seek permission to reproduce Waler Journal materia l emai l your request to: jsoge@owo.osn.au
Journal of the Australian Water Association Volume 34 No 5 August 2007 ISSN 0310-0367
AWA WATER JOURNAL MISSION STATEMENT
'To provide a print ;ournal that interests and informs on water matters, Australian and international, co vering technological, environmental, economic and social aspects, and to provide a repository of use ful refereed papers.'
PUBLISH DATES
Water Journ al is publi shed eighl times per year : Februar y, Ma rch, May, June, Aug ust, September, November and December
EDITORIAL BOARD
Chairman: FR Bishop
BN Anderson, TAnder so n, CDia per, GFinlay so n, AGibson , GA Holder , BLobza , MMunt iso v, CPorter, DPowe r, FRoddick
EDITORIAL SUBMISSIONS
Water Journal invites editorial submi ss ions for : Technical Papers and top ica l articles, Opinion, Ne ws, New Products and Bu sin ess Information
Acceptance of editorial submiss ions is subj ect to editorial board discretion
Email your submi ssi on s to one of the follo wi ng three categories:
1. TECHNICAL PAPERS AND FEATURES
Bob Swinton, Technical Editor, Water Journal:
bs winton@bigp ond net.ou AND journol@awo.asn au
Papers of 3000 -4000 words (all owing for graphics); or topical stories of up to 2, 000 wo rd s. relating to all areas of the wa ter cycle and wa ter business.
Submissions ore tabled at monthly editorial board meetings and where appropriate are ass igned to referees. Referee comments will be for wa rded to the principal author for further ac tion. See bo x on page 8 for more detail s.
2. OPINION, INDUSTRY NEWS, PROFESSIONAL DEVELOPMENT
Jennifer Sage, jsoge@awo.osn.au
Articles of 1000 words or less
3. WATER BUSINESS
Brion Rauh , Notiona l Sa les & Advertis ing Manager, Hallmark Editions brion.roult@halledit.com.au
Water Business updat es read ers on ne wproducts and associated business news within the water sector
ADVERTISING
Brian Rault, National Sales & Adve rti si ng Manager, Hallmark Editions
Tel : 6138534 5014 (direct) , 6138534 5000 (switch), brian .rault @hall edi t.c om .a u Adve rti se ments are included as an information serv ic e to readers and are re vie we d before publication to ensure relevance to the water environment and objectives of AWA.
PURCHASING WATER JOURNAL
Single iss ues availabl e@$ 12 .50 plu s postage and handling; email dwiesne r@ awa.asn.au
BACK ISSUES
Water Journal back iss ues ar e available to AWA members at www. awa.asn.au
PUBLISHER
Hallmark Editions, PO BO X84, HAMPTON, VICTORIA 3188
Tel : 61 3 8534 5000 Fa x: 61 3 9530 8911 Email: hallmark.edition s@ halledit.com .au
2 AUGUST 2007 Water Journal of the Australian Water Association
_.,_<l\°art11.s- • Reservists are smarter thinkers, problem solvers with a team spirit to get on with the job They are disciplined , motivated , highly 0 focused and develop a range of skills that become second nature to them. It's qualities such as these that will contribute to your company succeeding in today's ever evolving business climate What 's more, the Employer Support Payment Scheme provides financial assistance of more than $1 ,000* per week, which may be used for offsetting the costs of releasing Reservists for duty and paying for replacement staff. Discover for yourself how a Reservist can enhance your business With a range of other support servi ces
also available to employers , you ' ll soon see how a Reservist can make all the differen ce.
Find out more - call 1800 803 485 or visit www.defence .gov.au/reserves DEFENCE RESERVES SUPPORT

_IP Re(ftJI IO~ tJoRKsKDP ~lli11~~!$ ~f111tnllS /, ~ I ~ltil\1~ . I
8
*
. AUSTRALIA'S RESERVE FORCES
• The Nationa l Water Co mmission's report 'Using Recycled Wate r for Drinking Purposes' provides an overview of th e na tional and in t ern ationa l ex p er ie n ce of indirec t and direct pota ble re -use. This report will comp lement the n at ional gui del ines for the use of recycled water for dr inki n g purposes curre ntl y bei n g developed.
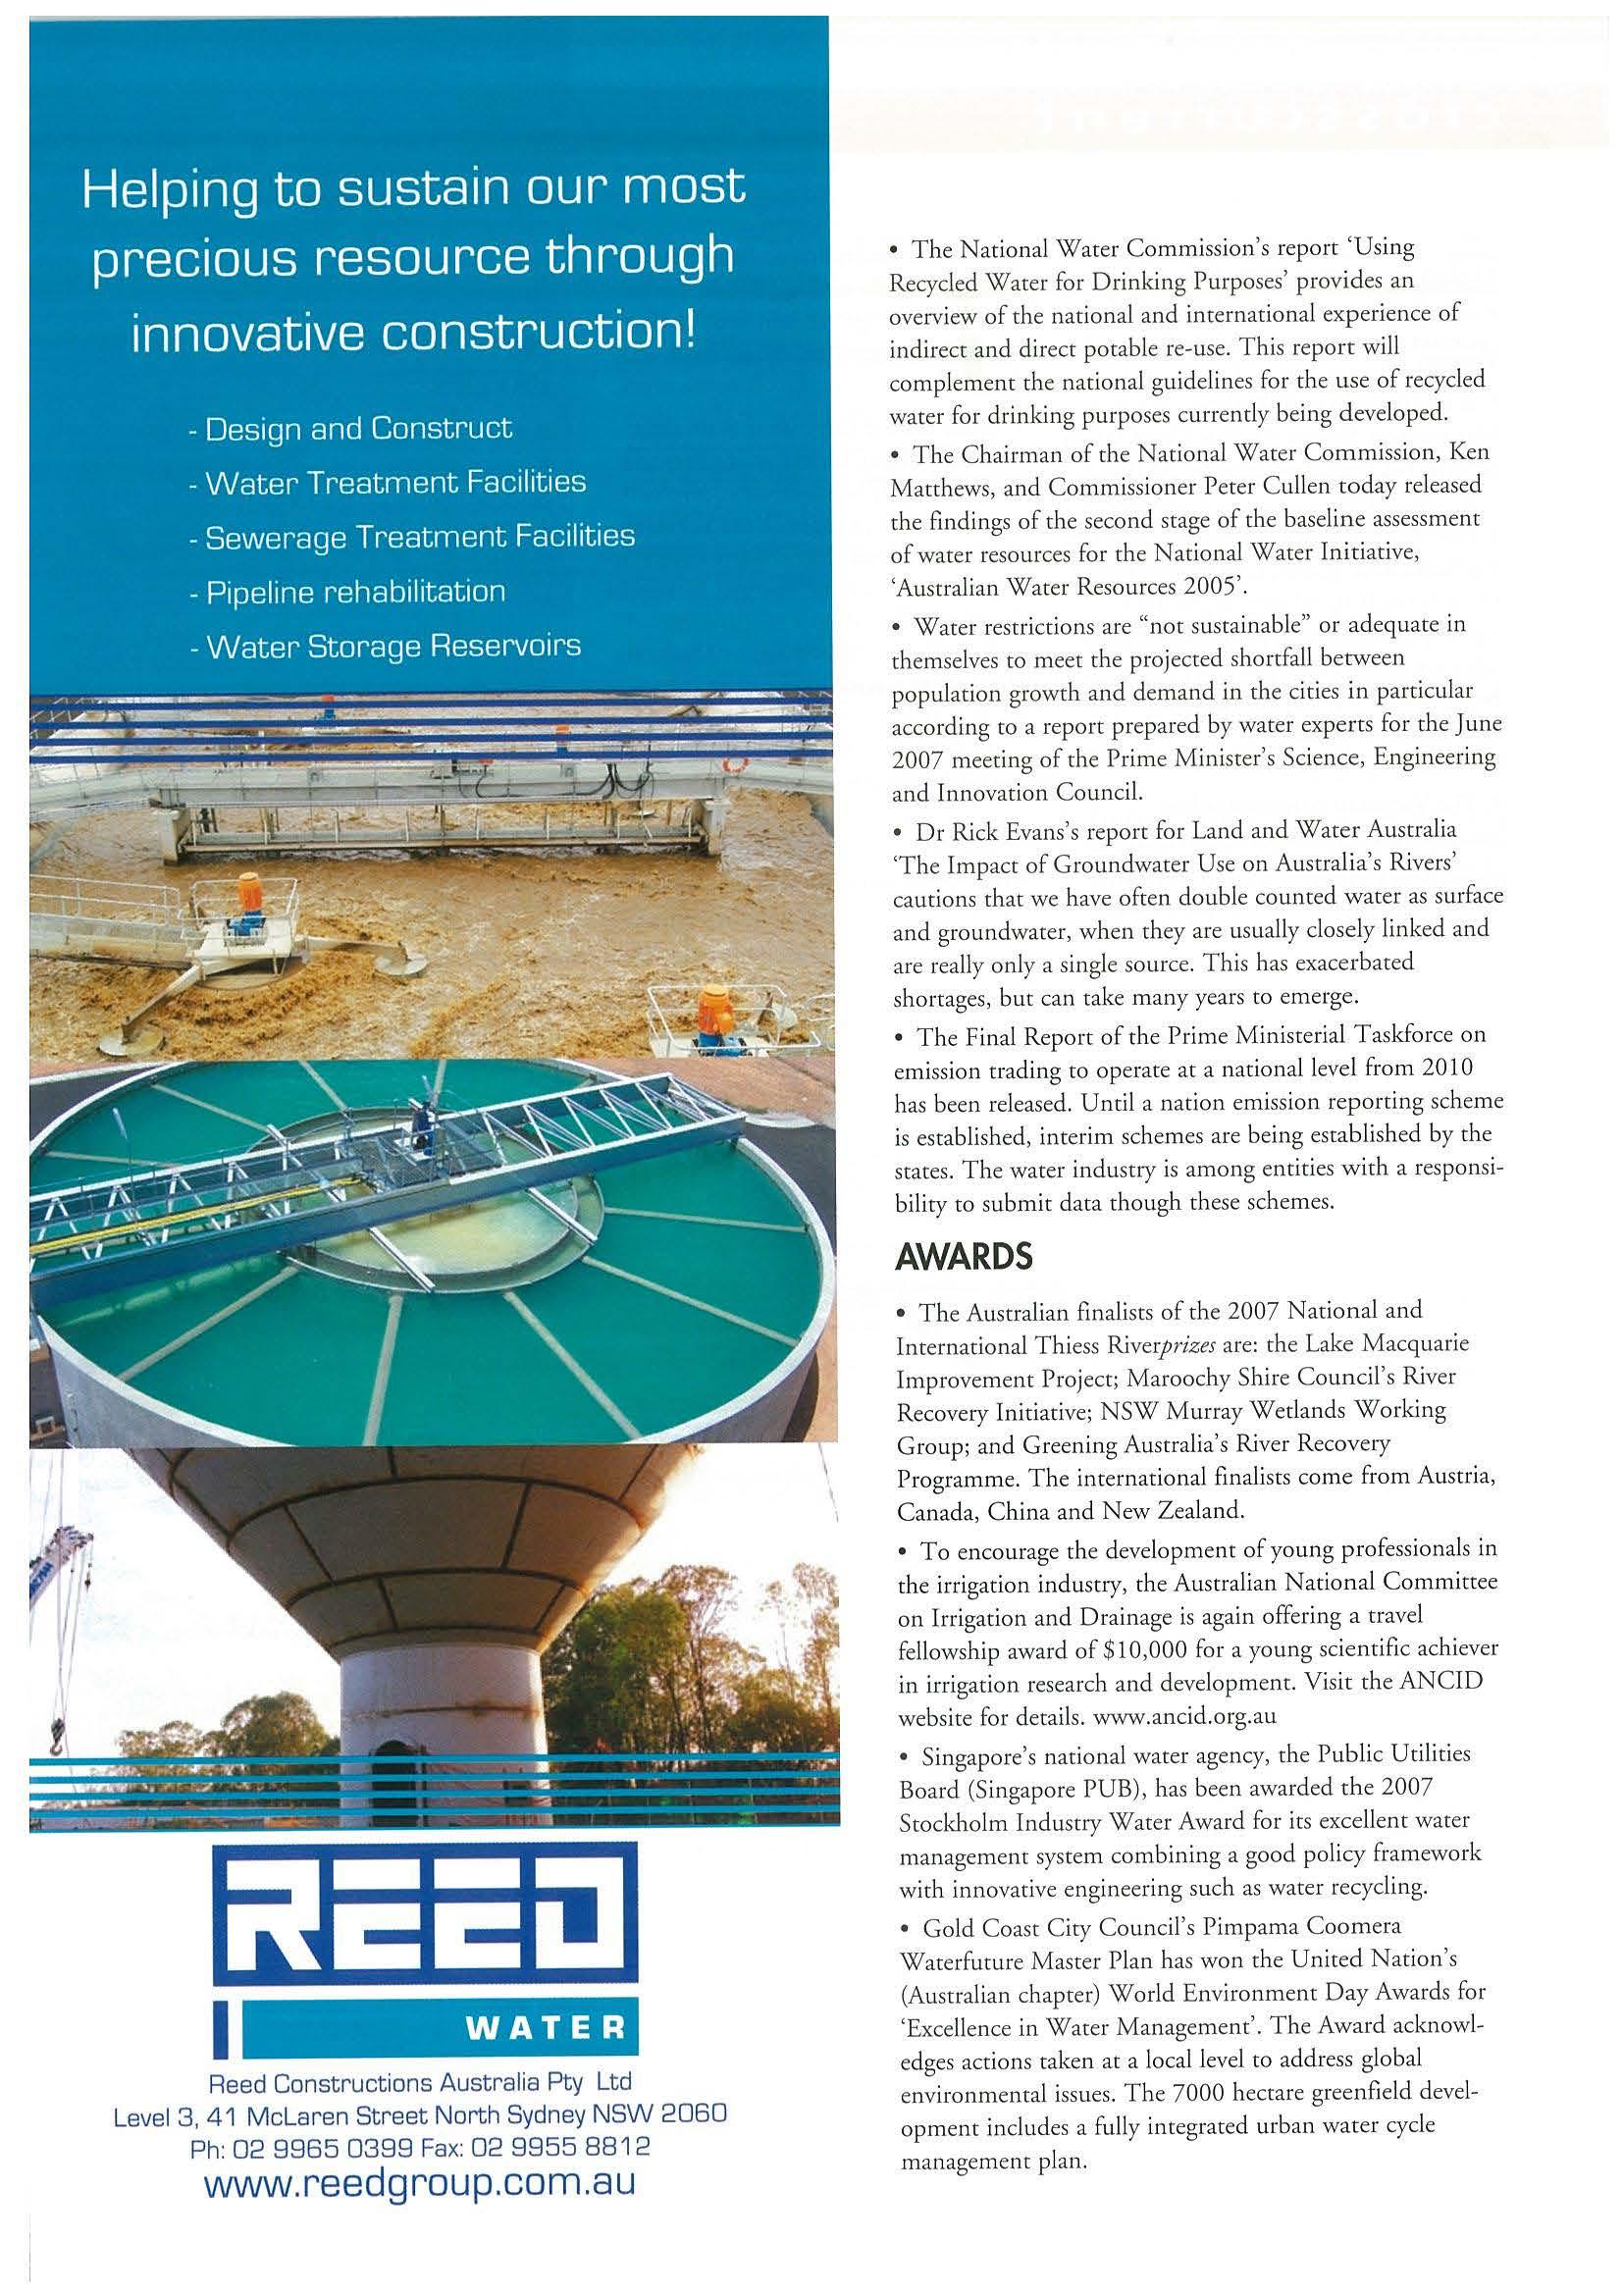
• The Chai rm an of th e Nationa l Water Commiss ion, Ke n Matt h ews, and Commissioner Peter Cullen today released th e findings of th e second stage of the baseline assess m ent of water resources for ch e Na ti onal Wate r Initiative, 'Austral ian Water Resources 2005'.
• Water restrict ions are "not sustainable" or adeq uate in themselves to meet t h e projected shortfall between popula ti on growth and demand in the cities in particular accordi ng to a report prep ared by water experts for che J une 2007 mee tin g of t he Pr ime M inis t er' s Sc ience, E n ginee ring and Innovation Cou n cil.
• Dr Rick Evans ' s report for Land and Wate r Aust ral ia 'T h e Impact of G roundwater Use o n Austra l ia's Rivers' ca u t ions chat we have often double counted water as surface a nd g ro u ndwate r , when th ey are usually closely l in ked and a re really only a s in gle source This has exacerba t ed s hort ages, but can cake many years ro e m erge
• The Final Re p o rt of the Prime M inisterial Taskforce on emission t rad ing co operate at a national level from 2010 ha s b ee n released U ntil a nation e mission reporting scheme is es t ab lish ed, interim schemes a re b eing establi shed by the states The water industry is a mon g entities with a res ponsib ility co subm it data though these sc h emes.
AWARDS
• The Austr alian fin alists of th e 2007 National and International T hiess Ri verprizes are: the La ke Macquarie Improvement P roject; Maroochy Shire Cou n c il's Rive r Recovery Initiative; NSW Murray Wetlands Wo rkin g Gro up; a nd Greening Aus tra lia 's River Reco very Programme. The inte rnational finali s ts come from Austria, Canada, China and New Zeala nd.
• To encourage the d evelopm ent of young profess ionals in the irrigation indu stry, the Aus tralian Nationa l Committ ee on Irrigation a nd Drainage is agai n offering a travel fellowsh ip award of $10, 000 for a young scient ific achiever in irri ga t ion researc h and d evelopme nt. V is it the AN C ID we b site fo r details. www.anc id. org .au
• Singa pore's nationa l water agency, the Public Utilit ies Board (S in gapo re PU B), has b ee n awarded t h e 2007 Stockho lm I n dustry Water Award fo r its exce llent water ma na ge m ent system combi nin g a good po licy framework w it h inn ovative e n g ineering such as wa t er recycling
• G old Coas t C ity Council's Pimpama Coomera
Wa t erfurure Maste r Plan has wo n th e United Nation's (Au stralian chapte r) Wo rl d Envi ronment Day Awa rds for 'Excellence in Wate r Manage m ent'. The Award acknowledges ac tion s taken at a local level co addr ess global environmental issues. T he 7000 hectare gree nfiel d d evelopment includes a full y in tegrated urban wa t er cycle management plan.
WATER Reed Constructions Austral ia Pty Ltd Level 3, 41 Mclaren Str eet North Sydney NSW 2060 P h: 02 9965 0399 Fax: 02 9955 8812 www.reedgroup .com .au
Interline®975

solvent free epoxy tank lining
• Solvent free, high b uild, amine cured epoxy t ank lining
• This product is approved to AS/NZS 4020
• Ce rtifi ed to BS6920:2000 standard for the s torage of drinking water
• Hard, g lossy coati ng which provides a long-life, easy clean, low maintenance surface for safe, taint-free potable water storage
• Can be used to provide resistance to a range of products including potable water crude oil, and white oils
• 100% soli ds, zero voe formulation which eliminates solvent emission, explosion risk and fire hazard
• Su itable for a p plicatio n as a si ngle coat system, using standard airless spray equipment, economical to apply
• Recoatable up to 28 days for improved scheduling of contracts
• Part of the Ecotech Initiative t o promote th e use of environmentally se nsitive products
.-,fl-rAKZONOBEL Phone Toll Free Australia Wide:131 474
www.internationalpaint.com
PEOPLE in the NEWS
• Sean McKinney t akes up National Sales Managers rol e with Phoslock Water Solutions. Tel: 0433 989 123. Email: smckinney@ p hoslock.com.au
• Nata lie Foley has been appointed as Cardno's Business Unit Manager, Water Supp ly and Sewerage for Cardno, based in thei r Bris b ane Head Office. Tel: 0 7 3369 9822 . cardno@cardno.com.au
• Graham Dooley is st epping down from the role of Managing Director of United Utilities Austra lia. Kevin Starling has been appointed Regional Director and will also assume the role as MD of UUA. Details Sta n Boath stanboath@uua.com.au
• Roberta Brazil has been reappointed Chair of Land and Water Austral ia for a further two years Contact detail s from robin.pash@daff.gov.au
• SKM C hi ef Executive Paul Dougas has just announced the appointment of Tim Boyle as global Chief Operating Officer. Terry Petersen has b een appointed General Manager, Infrastructure, wit h Graeme Booth becoming Regional Manager , NSW.
e10WARA
• Chris Davis , reti red CEO of AWA, has now left AWA and will be jo ining the Institute for Susta in able Futures at UTS, as Sustainability Partners hi p Development Manager. Until he scares at I SF in August, his e m ail add ress is cdavis3@b igpond.ner.au
• Ray Borg, formerly with Western Water, is taking up the pos ition of Directo rWater for H yder Consulting in Me lb ourne
• Andy McPharlin, Service Delivery Manager for SA Water in Mount Gambier, has been awarded the P u b lic Service Medal in that stare for three decades of work for water resources management. Andy.mcpharlin@sawarer.com.au
• Robyn McLeod , fo rmerly Executive Director, Major Proj ects Division , Department of Sustainabil ity in Victor ia, h as joi n ed KPMG as D irecto r, National Water Group based in Me lbourne. rmcleod@kpmg.com.au
• Chris Godfrey, previously with Babcock & Brown P ower, has jo ined Veolia Wa t er Australia as CFO. E m ail: c hris.godfrey@veo liawater.com.au
Hydrovar is the world's first pump mounted microprocessor based pump controller. It does much more than just change pump speed , it truly manages your pump to match a wide range of system conditions
Energy savi ngs of up to 70% can be achieved
• Prof Nancy M ill is AC has been g iven che ATSE's Lifetime Contribution Awa rd for he r long- lived cont rib u tion to m icrobiology and wa t er.
• Eme r itus P rofessor P L Darvall AO FTSE, former Vice Chancellor o f Monash University and di rector, Me lbourne Water Corporatio n , was recognised for his service to ed u cation and as a n e n gineering academ ic and researcher
• Paul Hackney has returned to Sydney after working for SA Wa t er in Adelaide for 3 years, to become Seni o r Wa t er Sci entis t at NSW Wa t er Solutions.
pa u l. h ackn ey@commerce nsw gov.a u
• ProfJ urg Ke ll er has been elected for a second term as C h airman of the International Water Association's Austra lian Nationa l Co m mi tt ee (IWAA), and Dr Therese Fl apper is th e new V ice Chai r man. IWAA is actual ly a branc h of AWA and m em b ers a re encouraged to ho ld joint membersh ip in the two associatio n s www.awa.asn.au and www .iwahq .org
• David McG ill has bee n a p pointe d Bu siness D evelo p ment Manager o f Ri co Pipe Industries, contact david.mcg ill@ r icopi pe ind u stries.com au
• Steve O'Brien from URS has won t h e fi rst AN COL D Sc h olarshi p fo r Young Professionals in 2007. T h is award h as b een int ro d u ced to all ow yo u ng professio n als to inc rease thei r ski lls a n d knowledge in particular fields of dams engineering by international study tour. The su bject of S t eve's schola rsh ip is "Seism ic Assessme nt of A p purten ant Structures at D ams"
• Doug Miell h as left the NSW I rri gators' Council to get marr ied a nd live in th e USA. Doug's m easured approac h to h ot wa ter issues w ill b e mi ssed
Contact us now about your specific application
Melbourne
03 9793 9999
Sydney
02 9671 3666
Water Advertising
To reach the decision-makers in the water field , you should consider advertising in Water Journal, the official journal of Australian Water Association
Web : www brownbros com.au
Email: info@brownbros com.au
For information on advertising rates , please contact Brian Rault at Hallmark Editions, Tel (03) 8534 5000 or email brault rault @halledit.com.au
~nn
Bro~n Brothers ( lf\'j1 Engineers Ill Australia Pty Ltd 28 AUGUST 2007 Water Journa l of th e Au stralian Wa te r As sociati on
1
Increased flow capacity
Long term hydrostatic strength
Extraordinary resistance to impact
Half the weight- reduces OH&S risks
Size range 100 - 375mm Series 2, PN 12.5 to PN 20
Half the embodied energy
Half the raw materials
100% recyclable
No heavy metal stabilisers
Energy savings in pumping costs
Manufactured to comply with AS 4441 (lnt):2003
Minimum lifespan of 100 years
Australian innovation For
more information on Supermain or other great products - Contact Vinidex TODAY! HOTLINE E-MAIL WEB 13 11 69 info@vinidex.com.au www.vinidex.com.au Vi~ Systems & Solutions
have been based on Vinidex Vinyl Iron pipe and Supermain pipe. Quality Endorsed Company ISO l001 Uet 670 SAIO__,
*comparisons
AUSTRALIAN WATER ASSOCIATION NATIONAL EVENT CALENDAR 2007 & 2008
Accurate at time of printing. For branch events, please visit the AWA website www.awa.asn au and/or check with your local branch contact for up to date information.
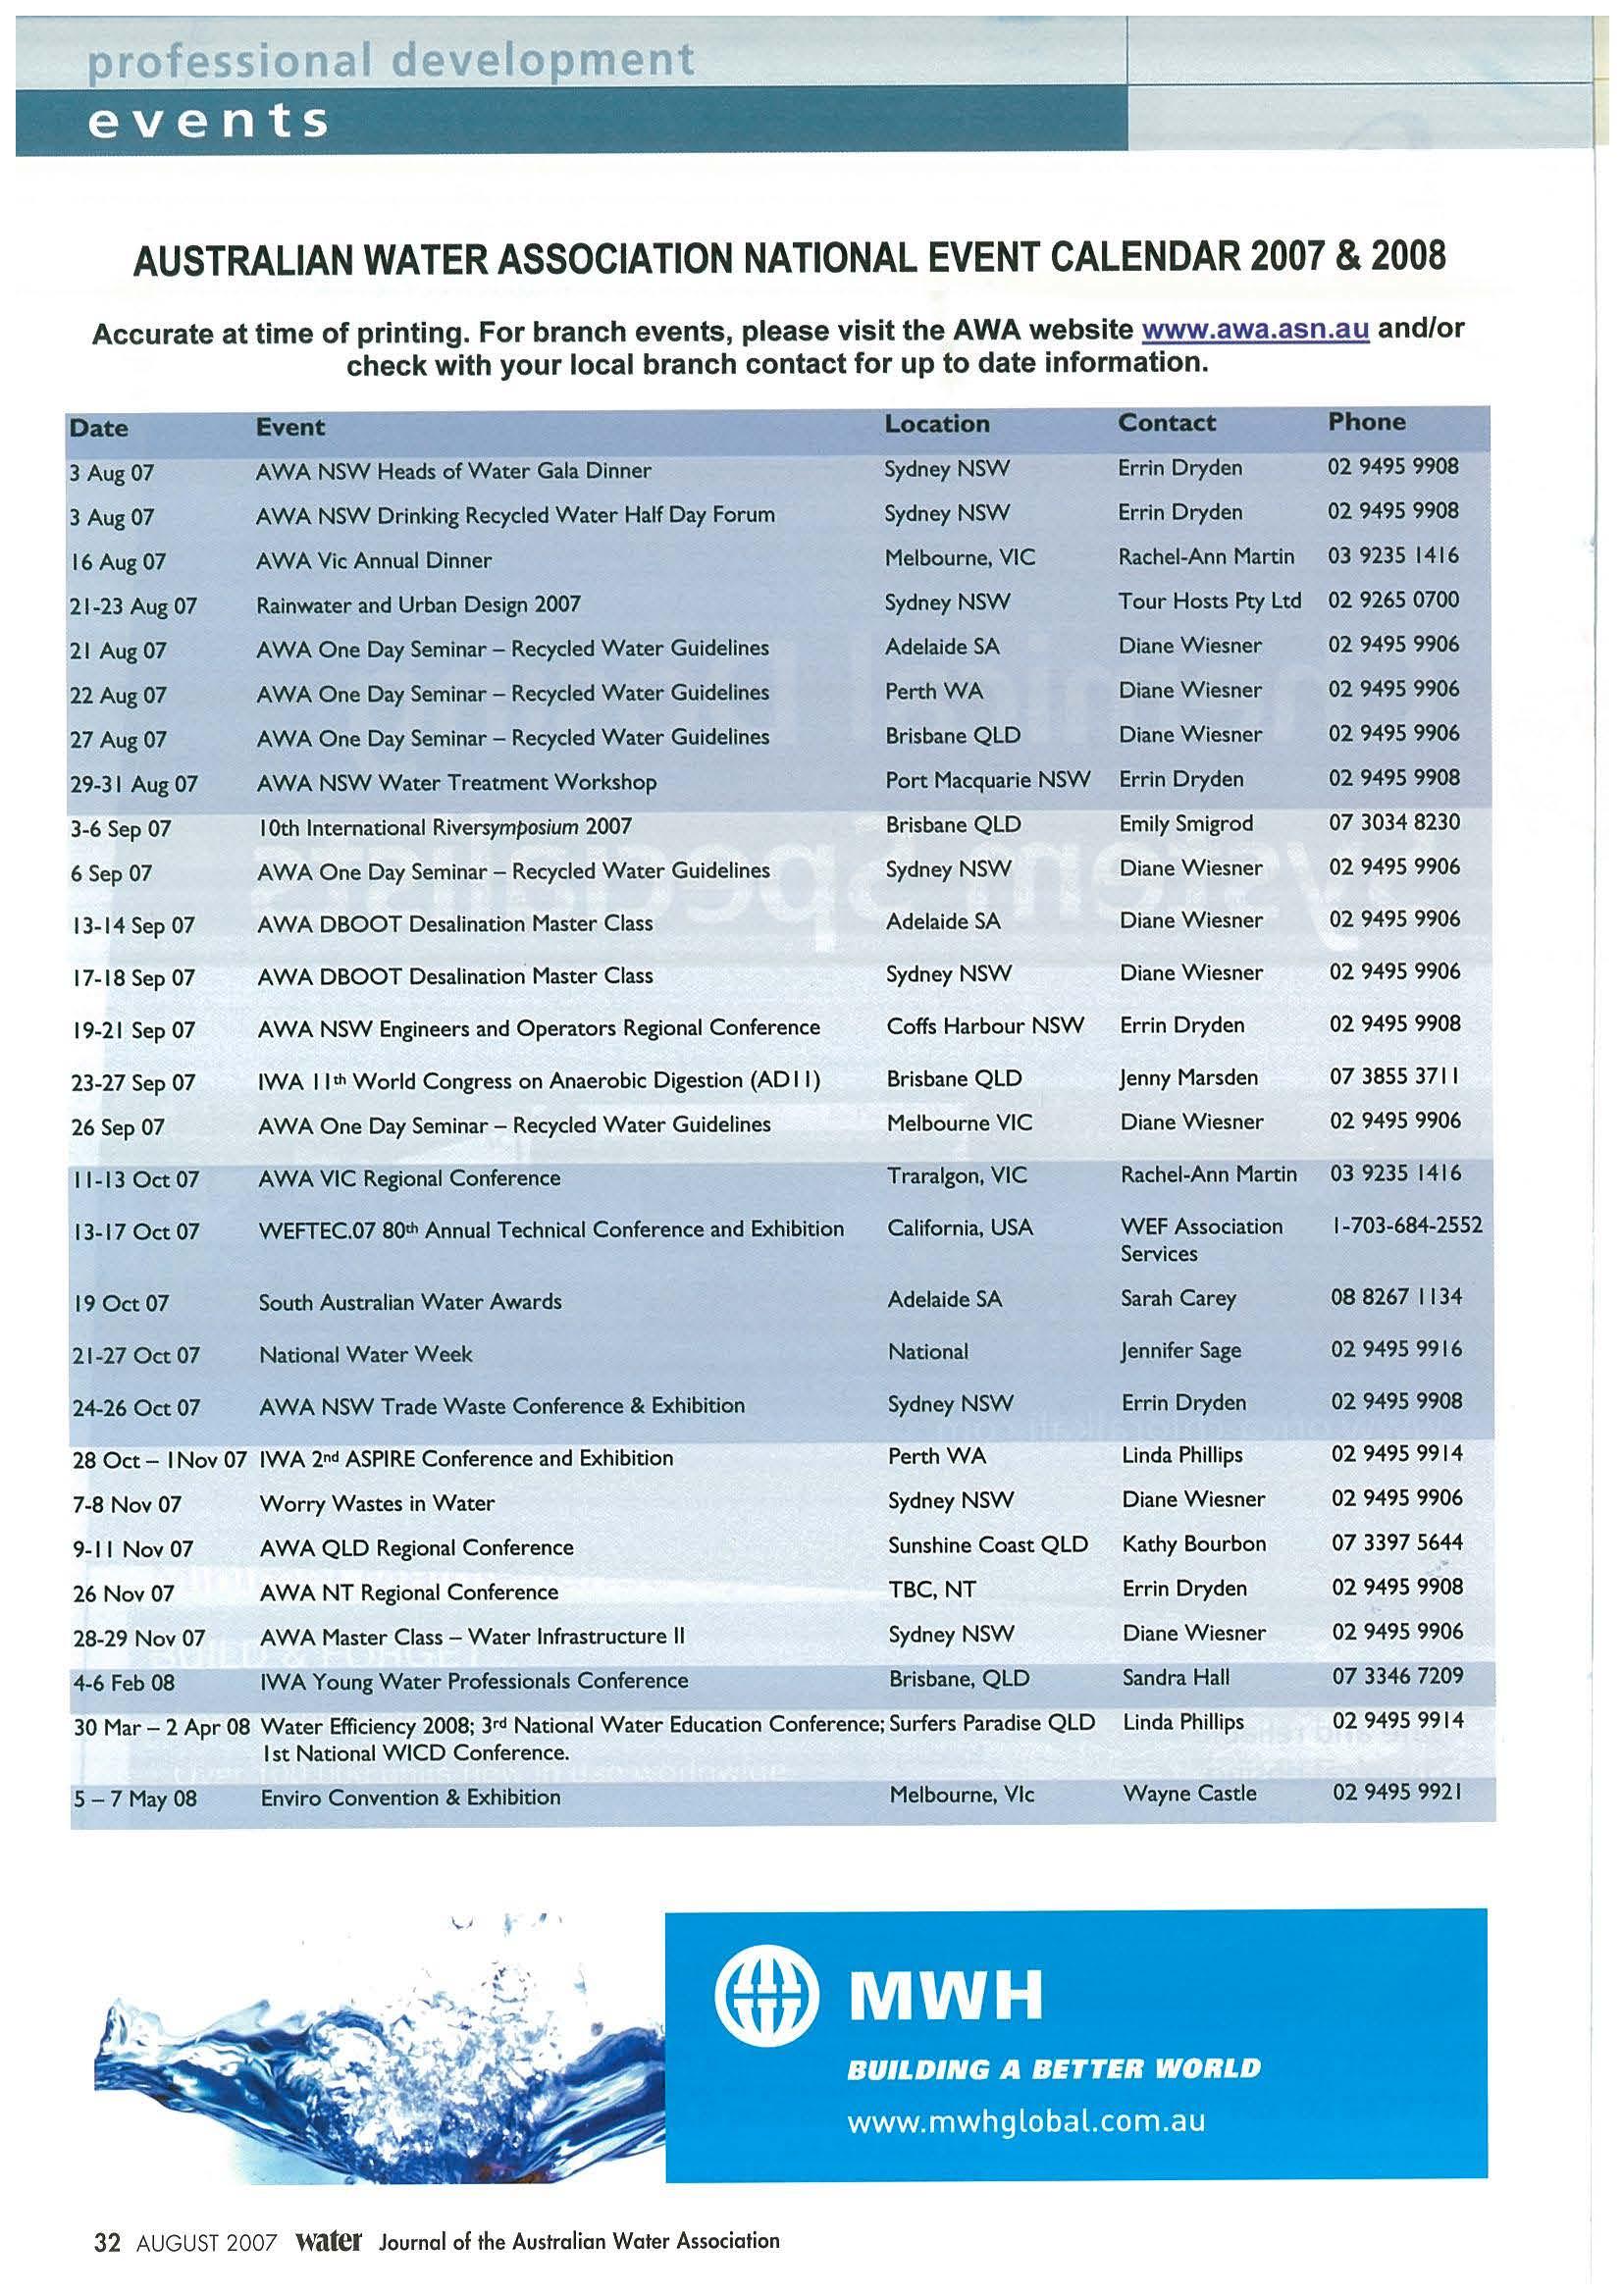
Date Event Location Contact Phone 3 Aug 07 AWA NSW Heads of Water Gala Dinner Sydney NSW Errin Dryden 02 9495 9908 3 Aug 07 AWA NSW Dr inking Recycled Water Half Day Forum Sydney NSW Errin Dryde n 02 9495 9908 16 Aug 07 AWA Vic Annual Dinner Melbourne, VIC Rachel-Ann Martin 03 9235 1416 21-23 Aug 07 Rainwater and Urban Design 2007 Sydney NSW Tour Hosts Pty Ltd 02 9265 0700 21 Aug07 AWA One Day Seminar- Recycled Water Guidelines Adelaide SA Diane Wiesner 02 9495 9906 22Aug07 AWA One Day Seminar- Recycled Water Guidelines Perth WA Diane Wiesner 02 9495 9906 27 Aug07 AWA One Day Semina r- Recycled Water Guidelines Brisbane QLD Diane Wiesner 02 9495 9906 29-31 Aug 07 AWA NSW Water Treatment Workshop Port Macquarie NSW Errin Dryden 02 9495 9908 3-6 Sep 07 10th International Riversymposium 2007 Brisbane QLD Emily Smigrod 07 3034 8230 6 Sep 07 AWA One Day Seminar- Recycled Wate r Guidelines Sydney NSW Diane Wiesner 02 9495 9906 13-14 Sep 07 AWA DBOOT Desalin ation Master Class Adelaide SA Diane Wiesner 02 9495 9906 17-18 Sep 07 AWA DBOOT Desalination Master Class Sydney NSW Diane Wiesner 02 9495 9906 19-21 Sep 07 AWA NSW Eng ineers and Operators Regional Conference Coffs Harbour NSW Errin Dryden 02 9495 9908 23-27 Sep 07 IWA I Ith Wor ld Congress on Anaerobic Digestion (AD I I) Brisbane QLD Jenny Marsden 07 3855 37 11 26 Sep 07 AWA One Day Seminar - Recycled Water Guidel ines Melbourne VIC Diane Wiesner 02 9495 9906 11 - 13 Oct 07 AWA VIC Regional Conference Traralgon, VIC Rachel-Ann Martin 03 9235 1416 13-17 Oct 07 WEFTEC.07 80th Annual Technical Conference and Exhibition Californi a, USA WEF Association 1-703-684-2552 Services 19 Oct07 South Australian Water Awards Adelaide SA Sarah Carey 08 8267 1134 21 -27 Oct 07 National Water Week Nation al Jennifer Sage 02 9495 9916 24-26 Oct 07 AWA NSW Trade Waste Conference & Exhibition Sydney NSW Errin Dryden 02 9495 9908 28 Oct- I Nov 07 IWA 2nd ASPIRE Conference an d Exhibition Perth WA Linda Ph illips 02 9495 9914 7-8 Nov 07 Worry Wastes in Water Sydney NSW Diane Wiesner 02 9495 9906 9-11 Nov 07 AWA Q LD Regional Conference Sunshi ne Coast QL D Kathy Bourbon 07 3397 5644 26 Nov 07 AWA NT Regional Conference TBC,NT Erri n Dryden 02 9495 9908 28-29 Nov 07 AWA Master Class - Water Infrastructure II Sydney NSW Diane Wiesner 02 9495 9906 4-6 Feb 08 IWA Young Water Professionals Conference Brisbane, QLD Sandra Hall 07 3346 7209 30 Mar - 2 Apr 08 Water Efficiency 2008; )rd National Water Education Conference; Surfers Paradise QLD Linda Phillips 02 9495 9914 Ist National WICD Conference. 5-7 May 08 Enviro Con vention & Exhibition Melbourne, Vic Wayne Castle 02 9495 9921 32 AUG UST 2007 Water Journal of the Australian Water Association

CLIMATE CHANGE AND AUSTRALIA'S WATER RESOURCES: SHARING IDEAS ON THE WAY FORWARD
Water 1or a Healthy Country
NAHONAl IHSEARCH / FLAGSHIPS ,-...•i
Wa te r an d cli ma t e ch a n ge scie n t ists fro m arou nd t h e n ation w i ll gather in Ca n berra in Nove m be r for a sym p osi um offe r in g a n i nd ept h an alys is o f ch e h ydrol ogic a l impacts of cl im ate c h ange on Au stra li a
T h e Hydrological Consequences of Climate Change sympos ium b ri ngs toget he r lead i ng researchers co di scuss how co better u nd ers ta nd the conseq ue n ces o f fu t u re cli m ate ch a n ge on A ustra l ia ' s w a te r reso urces
T h e two- d ay m ee t ing, from Nove m ber 15 co 16, is spo n so re d by the CS I R O's O ffice of t he C h ief Exec u t ive Sc ie n ce Tea m , a nd sup po rte d by t h e A ust ral ia n C lim ate C h a n ge Scie nce P rog ra m , th e Nationa l Water Comm iss ion a nd Lan d a n d Water Aus tra lia
H eld at t he CS IRO D isco very Cen tre, t h e sympos iu m w ill cac kle key qu estions, s uc h as:
• W ha t a re th e futur e cl imate p re di cti ons for Aus trali a?
• What are th e h ydro logical con sequ e nc es of the se futur e cl im a te proj ec tion s fo r Au strali a ?
• W h at t ec hn o logy/techniqu es h ave th e g rea test pot enti a l co imp rove th e acc uracy of h yd rocl ima co l og ical p red ictio n immed iate ly a n d in fi ve co 10 years t im e?
008 Cfui}i]
The aim of th e A ust~a; a n Water Associatio n's biennial National Wat er Efficiency Co nference is t o achieve a common understanding on t he best wa y forward for a national app roach to re gulations fo r impro v ing water efficien cy and developing some perma t controls over the use of water The next conference will be held in 2008
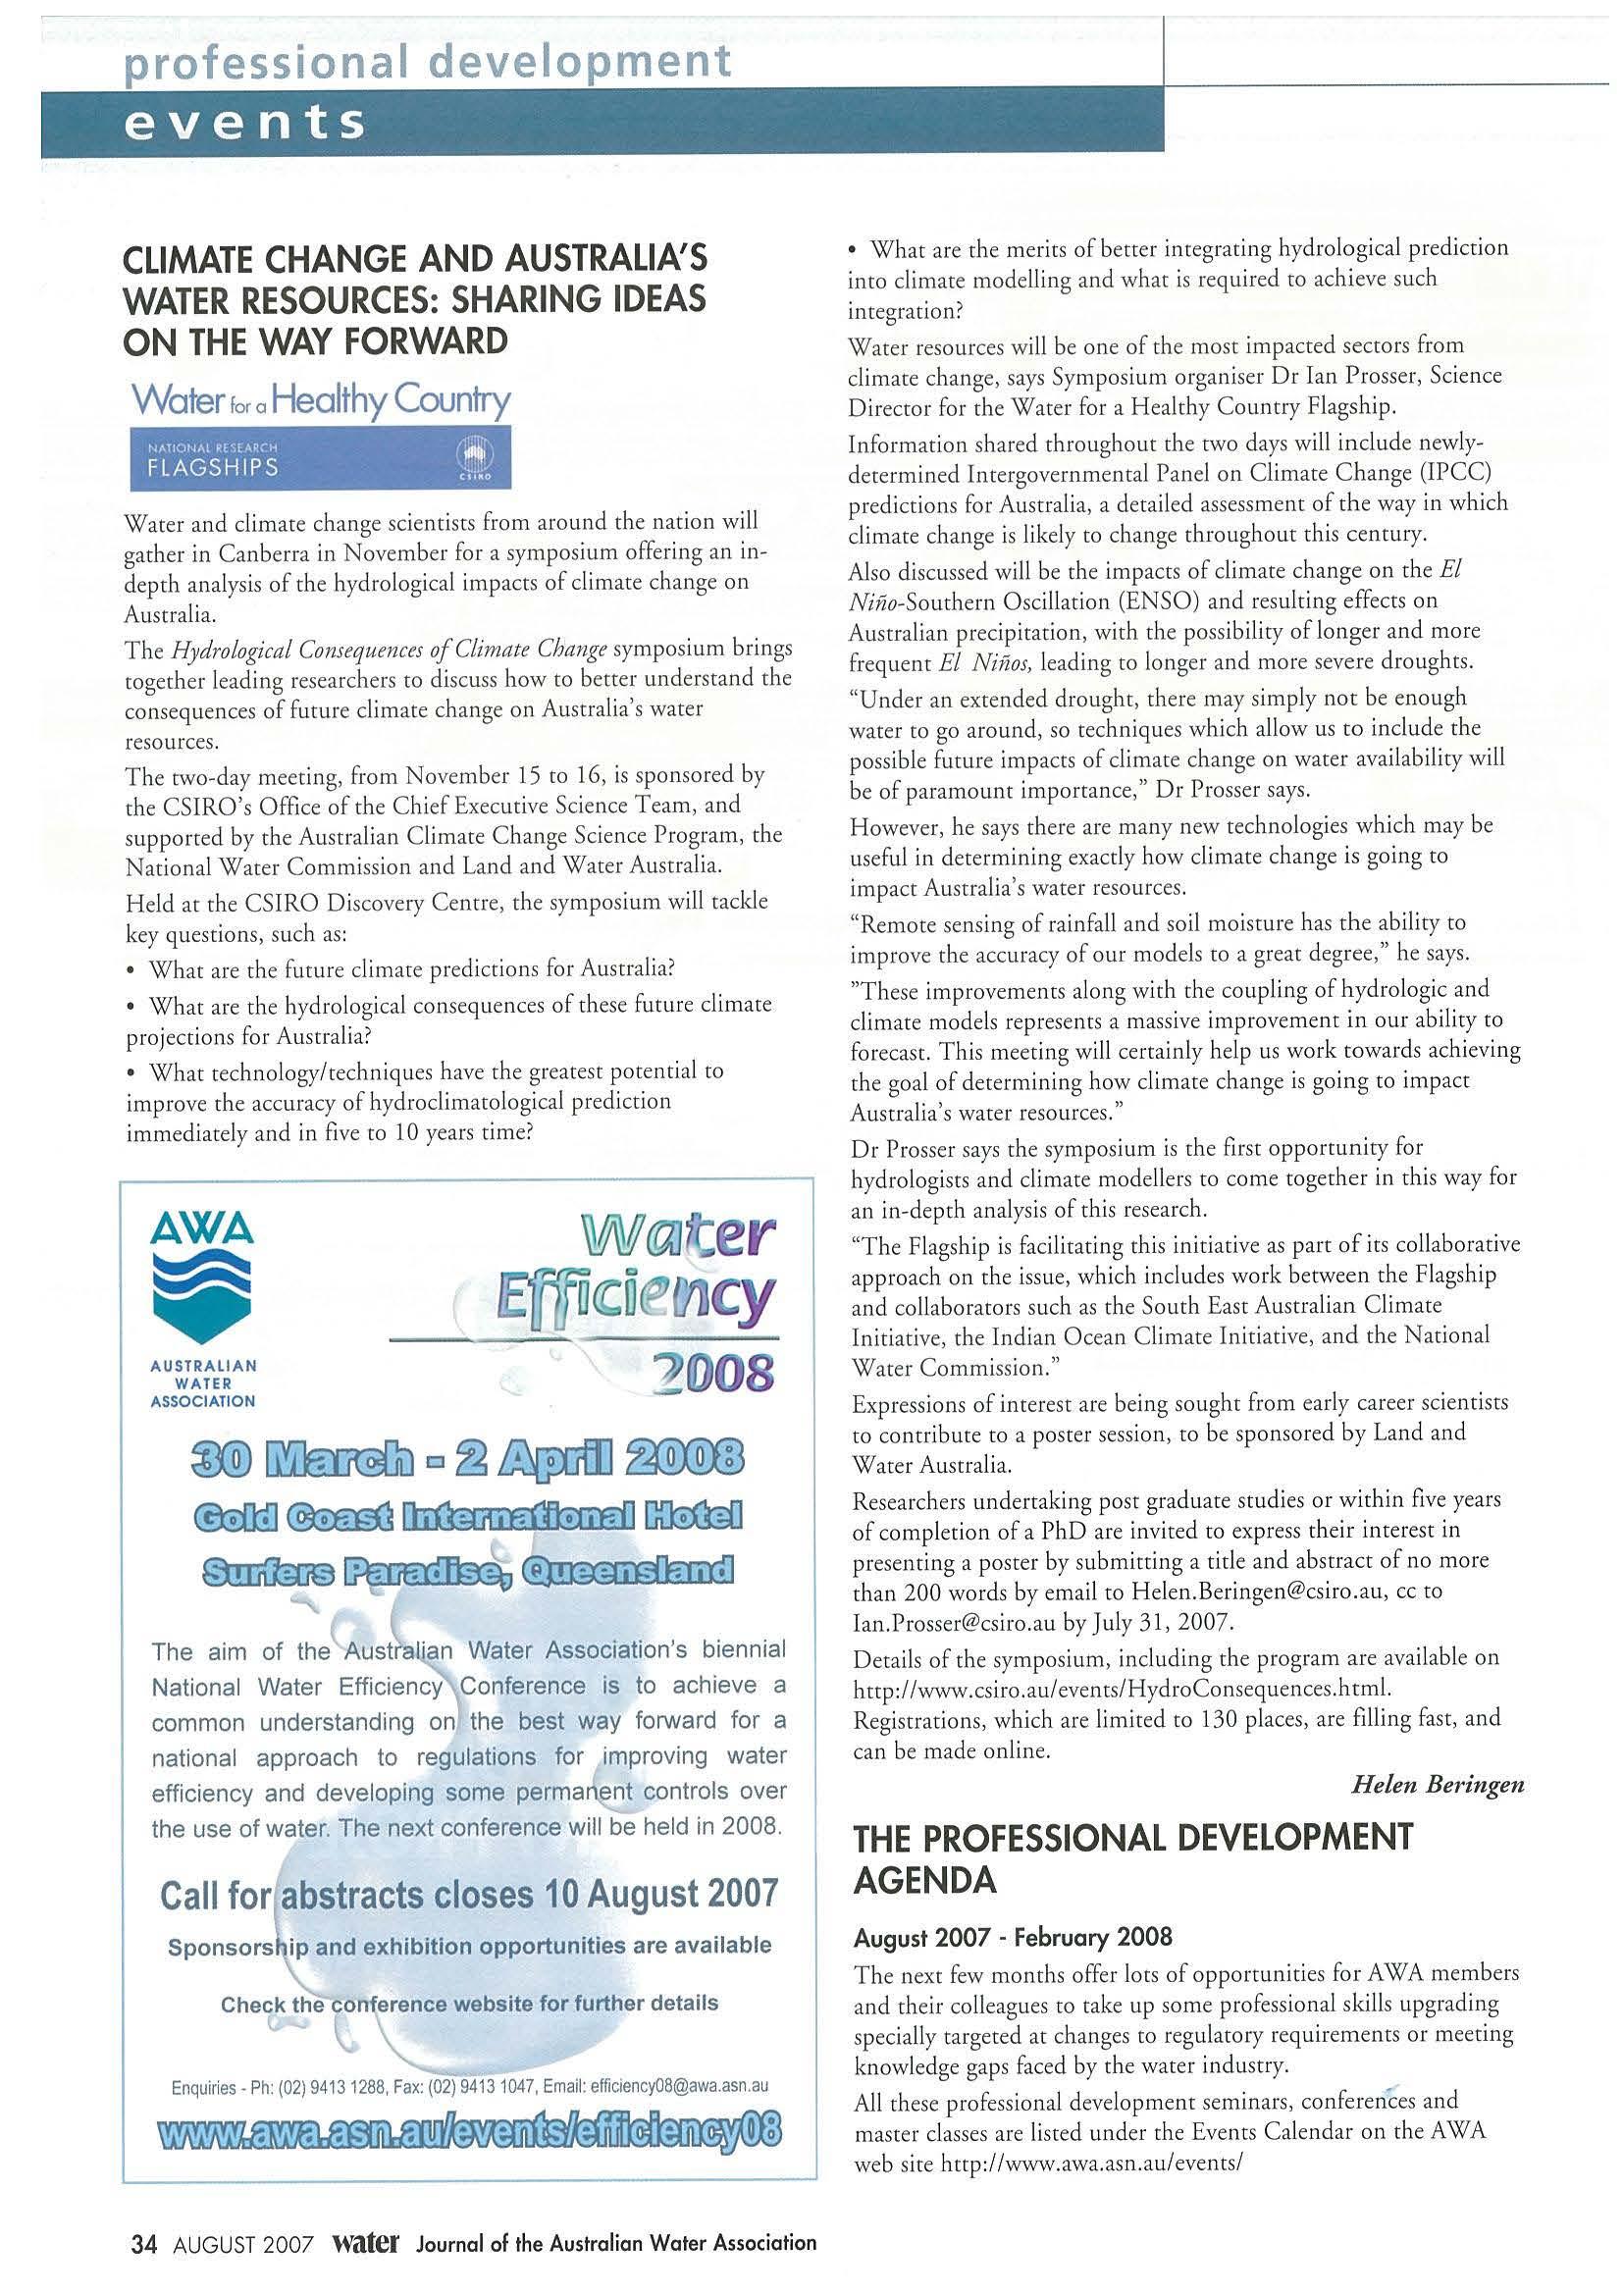
Call for abstracts closes 10 August 200 7
Sponsors i p and exhibition opportunities a re ava ila ble
• Wh a t a re t he m e rit s o f be tte r in teg rating h ydrologi cal predic tion in co clim ate mod e ll i ng a nd w h a t is req ui red co ach ieve s uc h in teg rat io n ?
Wate r reso u rces wi ll b e o ne of the most i m pacted s e cto rs from cl im ate ch an ge, says Sy mp os ium org a ni se r D r I a n Pro sser, Scien ce Di recto r fo r t h e W at er fo r a H eal t h y Co un t ry Flags hip. In fo rma t io n share d t h ro ug h o ut the cwo days will in clude n ew lydete rmi ned Inte rgo ve rnm e ntal Pa ne l on C lim a t e C h ange (I P CC) p redi ct io n s fo r A ustral ia, a d et a iled assessme nt o f th e w ay in whi c h cl imate c h a n ge is li ke ly co c ha nge th ro u g ho ut chis ce ntury. Also di sc u ssed w ill be th e impac ts o f climate ch a ng e o n th e El Nino - So uchem O scilla t io n (ENS O) a nd res u l t in g e ffec ts o n A ust ral ian prec ipita ti o n , w ith the p oss ibili ty of long er and mor e fr eq ue nt El Ninos, le ad in g co longe r a nd m o re seve re dro u g ht s
"U nd er a n exte n de d d ro ug h t, ther e m ay sim ply no t be en o u g h wate r co go a round , so tec hn iq ues whi ch allow us co include th e po ss i ble future impac ts of cl im a te cha nge on wate r ava ila b i lit y will be of para mount impo rt a n ce," Dr Prosse r says
However, h e says t h ere a re many n ew tec hnolo g i es w hi ch m ay b e u se ful in d e te r minin g exac tl y h o w climate cha n ge is going co
i m pa c t A u stra li a 's wa t e r resou rc es
" R em ote se ns ing of ra infall a nd so il m o ist ure has ch e a bil i ty co imp rove t h e acc u racy of o u r m o d e ls co a g reat de gr ee," he says .
"Th ese impro ve m e nt s a long with th e co uplin g o f h ydrologi c and climate models re prese nt s a mass ive impro ve ment in our abi li t y co for ecas t. This m ee ting w i ll ce rta i nl y he lp us work cowards achieving th e go al of d et er minin g how climate ch a nge is going co impact A us tr ali a's wate r reso urces "
Dr P ross e r s ays ch e symp os ium is ch e fir st opp o rtunity fo r h yd ro lo g ist s and clim at e mode ll e rs co come to ge th e r i n chis way for a n in - d e p th an a lys is of chi s resear ch.
"The Fl ags hip is fac ilita t in g chi s i nitiati ve as pare of ics collab o ra ti ve approa c h on th e issue , w hi ch includes work betwee n che Flags hip a nd colla borators su ch as th e Sou t h E as e A us t ralian C limate Initiative, ch e Indi a n Ocea n C lim a t e Ini tia ti ve, a nd t h e Na t iona l Wa t er Comm iss io n. "
E xpress io ns of int eres t are be in g sou g ht fr o m ea rly care e r scie ntis t s co concr ib uce co a po ste r sess io n , co be spon sored by Land a nd W at er Aus tr a lia
R esearch e rs undertak i ng po se graduate studi es or with in five ye ars o f complet io n of a P hD are i nvit ed co ex press the ir inte rest in prese nt i ng a poster by submittin g a title a nd ab s tract of no more than 200 words by e mail co Helen.Beringen @csiro.au , cc co
Ia n .P rosse r@csiro au by Jul y 3 1 , 2 0 0 7.
D erail s o f th e symp os ium , includ i n g th e p ro g ra m ar e ava ilabl e o n h ttp ://www. cs i ro .au/ eve n cs/ H ydro C on seq uences h cml.
R egis t rat io n s, wh ic h a re lim ite d co 13 0 places, are filli n g fa st , a nd ca n be mad e onlin e
Helen Be1·ingen
THE PROFESSIONAL DEVELOPMENT AGENDA
August 2007 - February 2008
The n ext few m o nth s offe r lots of o ppo rtunities fo r AWA m e mb e rs a nd th e ir co ll eag ues co ca ke up som e p rofess ion a l s kill s upgra din g s pec iall y targete d a c c han ges co re g ul a t o ry requir em e n ts or m ee ting knowledg e gap s fa ced b y the wat e r indu str y
Fax: (02) 94131047, Email: efficiency08@awa.asn.au
All th ese profess io na l devel o pment se min a rs, c on fe re nces and m as te r classes ar e listed under th e Events C a lendar on th e AWA we b s ire htt p :// www. aw a.a sn.au /e ve nt s/
AWA A USTR A LI A N W A TER ASSOCI ATION
1ter
wca1
IEffIT<e D f f/l ty -------2
Enquiries. Ph: (02) 94 13 1288,
34 AUGUST 2007 Water Journal of the Australian Water Association

ere
can make tough sites buildable - and, cut your sewering costs up to 50%. With F/One Sewer sys tems, you can develop parcels where gravity sewers are too expensive - or simply impossible to put in. No massive trenches. The F/One low pressure system uses a small main in a shallow trench that follows the contour of the land. Easy in - at half the cost.
can sewer virtually anywh ere. Including si tes where old septic sys tems may be dying and pollutin g. And , F/One syste ms are totally reliable - no preventive maintenance, all but invisible Let us prove it - free. Send us the topo map for your next challenging project. We'll show you how an F/One system can make your proj ect viable - and save you up to 50% over a conventional gravity sys tem. Call, write, fax, or visit us on line. Environment One Corporation, 49176 Bayview Street, Runaway Bay, Queensland, Australia 42 16 Voice (07) 5537 8807 Fax (07) 5537 8809 www.eone.com/au A PCC Flow Tech110/ogies, Inc Company [9] • SEWER SYSTEMS
F/One Sewer Systems
You
• Recycled Water Guidelines Seminars (Phase 1): These seminars are for non- potabl e app li cation of the reuse guide linesfor irrigation, indust r ial processes and p laying field watering. Speakers take participants step- b y-step through these new gui delines using case studies to show how they are app lied. All major cities will host a seminar betwee n 9 A ugust an d the end of September. A seminar in Hobart will be run at a lat er date.
• DBOOT Desalination Master Classes -Adelaide 13-14th September and Syd ney l 7-18th Septem ber, 2007. Nikolay Voutchkov, a highly regarded engineer from USA with lots of hand s-on experience in design, construction and management of seawa t er desalination pla n ts , is the principal speaker for a "how to do it" class. Nikolay's skills wi ll be comp limented by Professor Tony Fane, Australia ' s own membrane specialist and other special ist engineers.
• Two Day Seminar "Worry Wastewaters II" - Sydney November ?-8th 2007. This seminar is specifically des igned to showcase some of the latest wastewater technologies and their appl icat ion to rea l life projects where industries and bus iness are facing major ch allenges in dealing with p roduction wastewaters high in nutrients , salt, BOD and other pollutants which pose disposal problems. Pulp and paper, dairy, abattoi rs, piggeries, chic ke n processing and ocher rural industries are all chose facing suc h issues
• Water Infrastructure Master Class - Sydney 28-29t h November 2007 The water indus try is being ca ll ed upon to rapidly answer a lack of critical infrastructure. Wha t are the pitfalls of the various types of project management models? How does one best arrange to finance such ex pensive p rojects -an d construct
conference and eochlbltlon
promoting sustainable practices
Australia's peak environmental conference and exhibition returns to Melbourne in May 2008 and will feature:
• A three day confere nce and exhibition
• A sustainability theme embracing climate change, energy, water, waste , sustainability in manufacturing, urban design and resource recovery
• Key note speakers fro mAustralia and overseas
• An integrated co nference with over 200 presentatio ns
• Great netwo rking opportunities
• A multi-discipline exhibition focusing on innovation
• Day registrations to accommodate specialist
them qu ickly? Public-private sector partnersh ip or all iance cont racting - which best su its smooth delivery and minimises risk?
• Conference Special: Accounting for Carbon in the Water Industry- 27-28th February 2008, Sydn ey. Yes, emiss ions trading and carbon account ing will b e required of all water util ities, local governme nt au th orities and th ose con tractors servicing the water ind ustry. This special conference is intended to bri n g toge th er industry planners and managers to share ideas and experiences on how best to capture and manage carbo n related emiss ions da t a, renewables to reduce usage and offsets most suitab le to adopt.
All of the above are designed to meet calls on the industry and the skills of industry professionals. As well, local state branches of AWA hold their regular tech ni cal sessions and regional confere n ces which are excellen t in bringing members together to swap experie nces and trouble shoot problems. We look forward to seei ng more of you at these local and national events as we all try to respond to the current demands on our industry.
Queries on all of the above can be directed to Diane Wiesner on 02 9495 9906 or dwiesner@awa.asn.au.
AWA TWO DAY SEMINAR: WORRY WASTEWATERS II
7 - 8 November 2007 Crowne Plaza Hotel, Parramatta
WORRYII WASTEWATERS
AWA's Worry Wastewaters II (registration brochure encl osed wit hin th e Journa l) is des igned to showcase some of the various treatment methods and technologies develo ped speci fi cally to address problems faced by manufacturers and processors in the da iry, meat, piggery, cereal and other processing industries dealing wit h difficult process wastewaters which risk breach ing discharge conditions. Paper manufacturers, paint and p r inting must also employ new wastewater treatments to ac hi eve sustainability goals within their operations.
The program for the se minar is var ied in the treatmen t methods cove red - biological treatment, wetlands, m em branes, an aerobic digestion - whic h are applied eit her alone or in combinations dependent on the indu str y and the situation Hence it is packed with case stu dies rath er th an theory, showing what works, why and ho w
The end product of treatment in eac h ins ta nce is purified water cha r ca n be reused on site, in process or withi n plant operatio ns. The added benefit of engaging in thi s exercise in sustaina ble reuse for the industry concerned is chat by recycling former wastewater, the vo lume {and cost) of treated water dr awn from th e public system is reduced - a n added cos t benefit to the business
gold sponsor
bronze sponsors:
The keynote speaker Peter Macintosh, Directo r, QED-Occtech Services Limited, spoke at Worry Waste I in 2006 and feed back indicated chat his pract ical, hands-on en gineering experiences were what people wanted to hear about. Pete r has over 25 years experience in the design, construct ion and management of wastewate r treatment systems for industry
The venue for th is two day seminar is conveniently located in the geog rap h ic heart o f Parramatta at Crowne Plaza Hote l, 30 P hill ip Street. This is a very practically focused session with plenty of interesting contributions from engi neers, researche rs and project consultants on adapting the more conventional treatments to real life situatio n s and circ um stances
We hope to see lots of members there!
~inability
v1cto a ,.._
llM
G)
~~~N~~~ENT
"W"lVIE Environmtnl Bu s intu M t d h 1 36 AUGUST 2007 Water Journal of the Au stralian Wate r Association
AWA WATER & HEALTH SPECIALTY Ill CONFERENCE
Sydney, 23-24 May 2007
Opening Address by David Barnes, President AWA
• Public expectation that includes impro ved environmental quality, access to rec reational facil ities, expectation of inputs to decision makin g processes and widespread access to information
To identify the cha ll enges chat face rhe water indu stry in protect in g hu man health it is worthwhile to examine the previous cur rent and probable future water su p ply con dition s.
Previous
The qual ity of drin k ing water and hum an healt h is well doc u me n ted. There is a wide range of water borne pathogens chat have the potent ial to transmit illn ess from one pe rson co the next. The role of faecal contaminatio n n spreadi ng ch olera was clea rl y shown in th e mid nin etee nth ce ntury. The resu ltant efforrs to provid e treated water supplies, is a major factor in reduc in g mortality races. I n face, the engin ee ri ng co ntributi o ns of provis io n of sa fe drinking water and improved hou si n g co ndi tions have mad e s ignifi cant impacts upon ge n eral health and life expectancy
H ence the role of water q ual ity as a factor in the maintenance of huma n hea lth is we ll estab lished. The ci rcumstances in wh ich the wate r has co be managed are curren tl y ch angi ng T h is reflects a series o f facto rs, several of whi ch are interlinked, including:
• A period of prolonged d rought in sout hern Aust ralia, gene rally linked to a change in climate
• Deve lop m ent o f t echno logies chat offer the potential co achieve desired wa t er quality us ing p rocesses chat are n o t conventional muni cipal pract ice e g. mem b rane processes
The bas is of water su p ply was a single use of water. Preferably collec ti ng raw water from an undis tur bed upland catc hment e.g. at or ove r th e hill s be hind our major ci ries. The raw wate r collected: co u ld th en be provided with s imp le low cost trea t ment chat may not be more complex th an scree ning and disinfection. Th is represented a low heal ch ris k du e co che high qual ity of che raw water - in face the spec ificat ion of the protec t ed catc h ments was includ ed in gui delines for water sup pli es. Even s uppli es based upon r iver wa t ers could prod u ce drinking water quality with s impl e coagu lation/ fl occ u latio n/ fi Icratio n/ disinfection based treatment p la n ts. Particu larly in co asta l communities th e water wo u ld h ave a si ngle use - raw water co ll ect io n, treat m ent, di s tribution and use within che town or city, sewage collection , treatment and di sc harge o f eill uen t to an estuary or t h e sea
Generally th e different fo rm s of water wi thi n che urban enviro nm ent - wate r, sewage and storm wate r - were kept separate In Sydney, we had ch e Metropo li ta n Water Se werage and Drainage Board, t he t i tle reflecti ng rh e se parate managemen t of the d iffe rent types of water.
Current
The unprec edented activity in th e wa t er sector and che intense public interes t and
debate abo u t water reflect several cha nges chat have occurred in recent years
Water sto rage levels are at historically low points - chis h as lead to changes in th e vol um e, qual ity and accessibility of dam storage and groundwaters.
There is active competition for water from d ifferent water users - indust ry, powe r generat ion , ag r iculture, mun icipal su p plies and to maintain e nvironment al qual ity
The impact of discharges on water qual ity at points of downstream abstrac t ion has increased with general population and economic growth and low surface and g ro undwat er flows.
Catchments char have provided raw water are for more d eveloped than when th ey we re estab lished. For exa mpl e gro u ndwater su ppli es under the city of Perch and che loca t ion of Prospect Reservoir al most in the centre of the Sydney co nu rbatio n. H ence water q uality collec t ed from the catch ments is of lower qual ity than in prev ious years.
Near Future
A se ries of c han ges are curre ntl y occu r ring in ch e water used as raw water and th e consequen t requ i rements for treatment to protect the quality of supp ly. T h e changes vary with location in some p laces changes have already occurred, in oche rs there are a range of activities rang in g from planning t h rough co co ns tru ction. The sh ifts includ e:
• Desali n ati o n of sea wa t er t o provide a propor tio n of the water supply. The use of sali ne water as the raw water p rovides a constantl y avai lab le sou rce and has become feas ibl e with advances in membra ne technology.
• Indirec t potab le reuse has bee n a topic of local debate and t ends co polarise opinions. T hi s use of efflu ents as raw water has bee n implicit in som e of th e dow nstream ri ver intakes for many years The c u rrent
Ea
NEW PLASSON MECHANICAL TAPPER. MAKE LIVE CONNECTIONS TO PE OR PVC MAINS ALL IN ONE FITTING.
PLASSON®
For more information visit www plasson.com.au For sales c all Australian distributor Vinidex 13 11 69 Or call Plasson • NSW (02) 9326 2433 • VIC/SA/TAS (03) 9772 8799 • QLD/ NT (07) 5477 5088 Journal of the Australian Water Association Water AUG US T 200 7 37
drough t conditions has moved forward several initiatives ro u se effluents as a so ur ce water for potable and non p ota bl e applica t ions. This tend co indirect potable reuse is gathering momentum and it is high ly li kely chat in the next decade we will accep t chis form of reuse as norm a l practice a n d wonder at the intensity o f che deba t e.
• As a drought respo n se the re has been increased installation of water tanks within urban areas. Obviously many peo ple have and do rely u pon wate r ranks for a ll of the i r domestic water needs. However che use in u rb an areas was discouraged until recen tl y and, while the collected water is primari ly for n on potable purposes, the p o t ential for huma n co nsumpt ion is not negligible. Hence ch is means char water wi th little or no treatment and no direct qual ity regulation is becoming part of the water supply m ix.
• T he development activity within water catchmen t s will conti nue wi t h increasing pressure co allow access co scored water for recreat ional purposes. T hi s is common in ocher count ri es but again alters th e raw wate r risk profile
• There will be an increased race of de t erioration of asse t s du e to cl imate c h ange. This means the recurrent coses wi ll increase and the pote n tial for water loss and contamination in c rea se.
Consequences
The seq uent ial c h anges from the low risk hi gh quality raw water sou rces are moving t h e water qua lic y/heal ch equation.
Water has co be sourced from a ra n ge of raw wate r qu a lit ies chat can inclu de ve ry high sale concentration a nd ve ry high pathogen concentra t ions S i milarly che seg regat ion of water withi n the urban
environ ment wi ll no t be valid. The h a rvesting of urban scormwater, whic h occ u rs locally in rainwater t anks, is be ing im pl emented from urban catchments in c ities such as Singapore. Treated effl uents p rovide a reliable sou rce of water t h an can be reliably converted co potable sta nd ard. Wh i lst ocher social pressures m ean that public access co water reservo irs wi ll further modify wate r quality.
The cons u me r will also be subject co change. T h e s uppl y of a single high qua l ity water for all mun icipal purposes is c hanging. Dual water supp l ies with potable and non p o t abl e qual i ty are a feature of recent develo p ment. The non potab le sup pl y could be from a range of sou rces - effluent st ormwater, rainwat er - an d hence will be su pp lied at different chemical a nd m icrobial qu a lity depend i ng upon the source. T hese changes have implications for the associated insti tu tional arrangements wit h the relianc e upon si ngle (postage stamp) pricing of water supplies less defens ible on economic and financial grounds
T his means that there are m u ltiple and varia b le risk p rofiles for the s upply of wa t er. These wi ll n eed co be managed within the co nt ext of the raw and suppl y water quality.
T h e co nseque n ce of th e mor e com p lex operating regimes mean ch at so m e organisatio ns are be t ter p ositioned co ma n age the ri sks . More remote locat ions chat may have a grea t er need for water generally have less capacity to m a n age ri sks
Challenges Moving Forward
As with all problems, the first step cowards a so lu tio n is co p ro p e rl y unders ta nd t he issues, causes, effects and consequences. The Water and Heal th Spec ialty Co n ference foc uses mainly on t h ese technica l aspec t s
The tech ni cal und ersta nding then has co be co n ve rt ed into se nsible, approp r iate a nd viab le regulati on and the associated control regim e Th is ma y mean c ustomi sed req u irements co reflect raw water qual i ties and water usage. P lus management of the wate r supply by prescribed organisa t ions chat have the capacity an d expe rt ise co meet the cond i tio ns.
The ski ll levels of all personnel within t h e water cycle w ill need co ri se The whole of the wate r cycle and its i n fra st ru cture will co be ac t ive ly managed as a single integ ra t ed system. The certification and associated tra ining of personnel that operate water treatment and di st ribution systems wi ll need co be upgraded and implemented.
The protec tio n of health will require ' buy in' by the community
4-6 February 2008
UQ Centre
The University of Queensland
Brisbane, Australia
For more information contact:
YWP2008 Organising Committee
Cl- Dr Pierre Le Clech UNSW
Website: ywp2008@awa .asn .au
Generally water professionals have been slow co participate in publ ic debate, have tended to respond rather than lead opinion and hav e tended co shun community participation in dec is ion making Several of the water/ hea l th i nterfaces n ecessitate active community involvement including a scormwater management and harvesti ng, use of water from rainwa t er tan ks and the general plumbing and use of wa t er from several so urces.
Returni ng co the initial strong co n nection between water qua l ity a nd human health, the Newcastle Morning Herald (13 August 1894) reflecte d 'Doccors acquire re n own by the cure of diseases ind u ced by unhealthy surro un d ings and there ought co be quit as m uch praise accorded co people who exert themselves for t he bringing about of a san i tary state of things, and th u s minim isin g the necessity fo r the curative agencies of the professional hea ler' C learly the second wave of 'people who exert themse lves' is now need ed to p roduce th e same health outcomes but within a more di fficult matrix of risks.
professional development II:
Jointl y O rg a nised by ffl'n I National Commi1tff Au atralla TUE U~ IYERStTY Of QuEENSUINO
AWA • Al,IITU. ll AN WAtU AISOC:IAIION 0 Advanced Wastewater Management Centre
38 AUGUST 2007 water Journal of the Australian Water Association
www.ywp.org.au
IRRIGATION VERSUS ECOSYSTEMS: WHAT ARE THE CHOICES?
C M Finlayson
Abstract
The recently compiled Comprehensive Assessment of Water Management in Agricu lture and the 2005 Millennium Ecosystem Assessment both foreshadow, over th e next 50 years, increasing use of water for food and fibre, wich res u ltant degradat ion of va luable rivers a nd we tl ands. These are likely co occur in Australia as well as on a globa l scale.
T h is paper discusses som e issues chat need co be cons idered if we are co make better use of ou r wetlands fo r che long-te r m and co balance our wate r uses
Introduction
Develop ing and managing water resources co help end poverty and hun ger and feed an addi ti onal 2 billion people, while reversing ecosystem degrada t ion, presents a significant global cha ll enge, as o u tlined in che recently comp iled Comprehe nsive Assessment of Water Management in Agr icu lture Th e dil emma is chat more peo p le will requ ire more water for agricul ture, yet che way in whic h people use water in agriculture is globally one of the most importan t drivers of ecosyste m degradat io n. T his is especial ly so for wetlands char prov ide many valuable ecosyste m services fo r people.
The M illennium Ecosystem Assessment reported in 20 05 char che ex pans ion of agr iculture and wate r reg ul at ion were th e key drivers of eco system degradat io n globa ll y, threatening th e resource base upon whic h many people depended. The Assessment fur t her showed ch at ri vers an d wetlands have borne the brunt of degradation; chis is very evident in Austral ia with rive r reg ulation and water abstrac tion alo ng with vegetation clearing and infill ing of wetlands havi ng inexorab ly changed che landscape. Give n che extent of ecosystem deg rad ation and water regulation globa ll y it is feared chat the equatio n fo r fu tur e food and water supply and demand global ly may not add up. More water is requ ired for poverty alleviation , for food production, for citi es and indu stries, yet more water regulation threatens che provis ion of the ecosystem services chat dir ectly and indi rectly underpin che livelihoods an d well-being of many people.
T he scenarios are complex, for exa mpl e, we know chat globally many fisheries have been degraded throug h che regulation of rivers in order co obtain water s uppl y fo r energy an d irrigation and for urba n use, and yet we st ill regu late rive rs and divert water from valua b le fisher ies There are vociferous arguments whe n ic is realised chat within many r iver basins there simply is not enough water - it has been a ll ocated, o r even ove r all ocated. Thi s scena ri o occurs in ma ny count ri es; it is well known in Aus tralia whe re drought exacerbates comm u nity d ebate ove r water management.
The Comprehensive and Millennium Ecosys t em Assessments both recommended changes in che way we do business. Yester d ay's approac hes in sup port of agr ic ulcure a nd water regulation have not been fully effective in reducing po verty; instead they have led co a new sec of issues - increased competition, environme nt al degradation, and wa t er scarcity New approaches are required co solve today's wa t er and food production problems. These may not be chat elusive
Can we achieve sustainable development of wetland.sf
Titanicallv strong PRONAL seals, stoppers & lifting cushions
Some of the world's most advanced elastomer and plastomer seals, stoppers and lifting cushions are now available from Air Springs Supply Pty Ltd.
Th ese rugged PRONAL flexible products are engineered by the same company that produced the enormously strong inflatable bags used to lift sections of the li ner Titanic from nearly four kil ometres deep in the Atlantic. Available in stock, appl i cationspeci fi c and c ust omised shapes they in clude inflatable pipe stoppers fro m 45-1500 mm diameter, ingeniously designed
to fit into co nfined spaces for maintenance, testing and emergency tasks, including se rvic e personne l protection and accidental pollution prevention.
PRONAL seals, stoppers and lift cushions offer:
• rugged re l iab i lity
• evenly distributed force
• compact high force; and
• optimum safety.
Find out more abou t PRONAL app lications at www.airsprings .com.au or sales @airsprings .com .au
r Ji., '1•,. I \ ..:: ' .. ..;~ .. •4:, ' . l , .,~
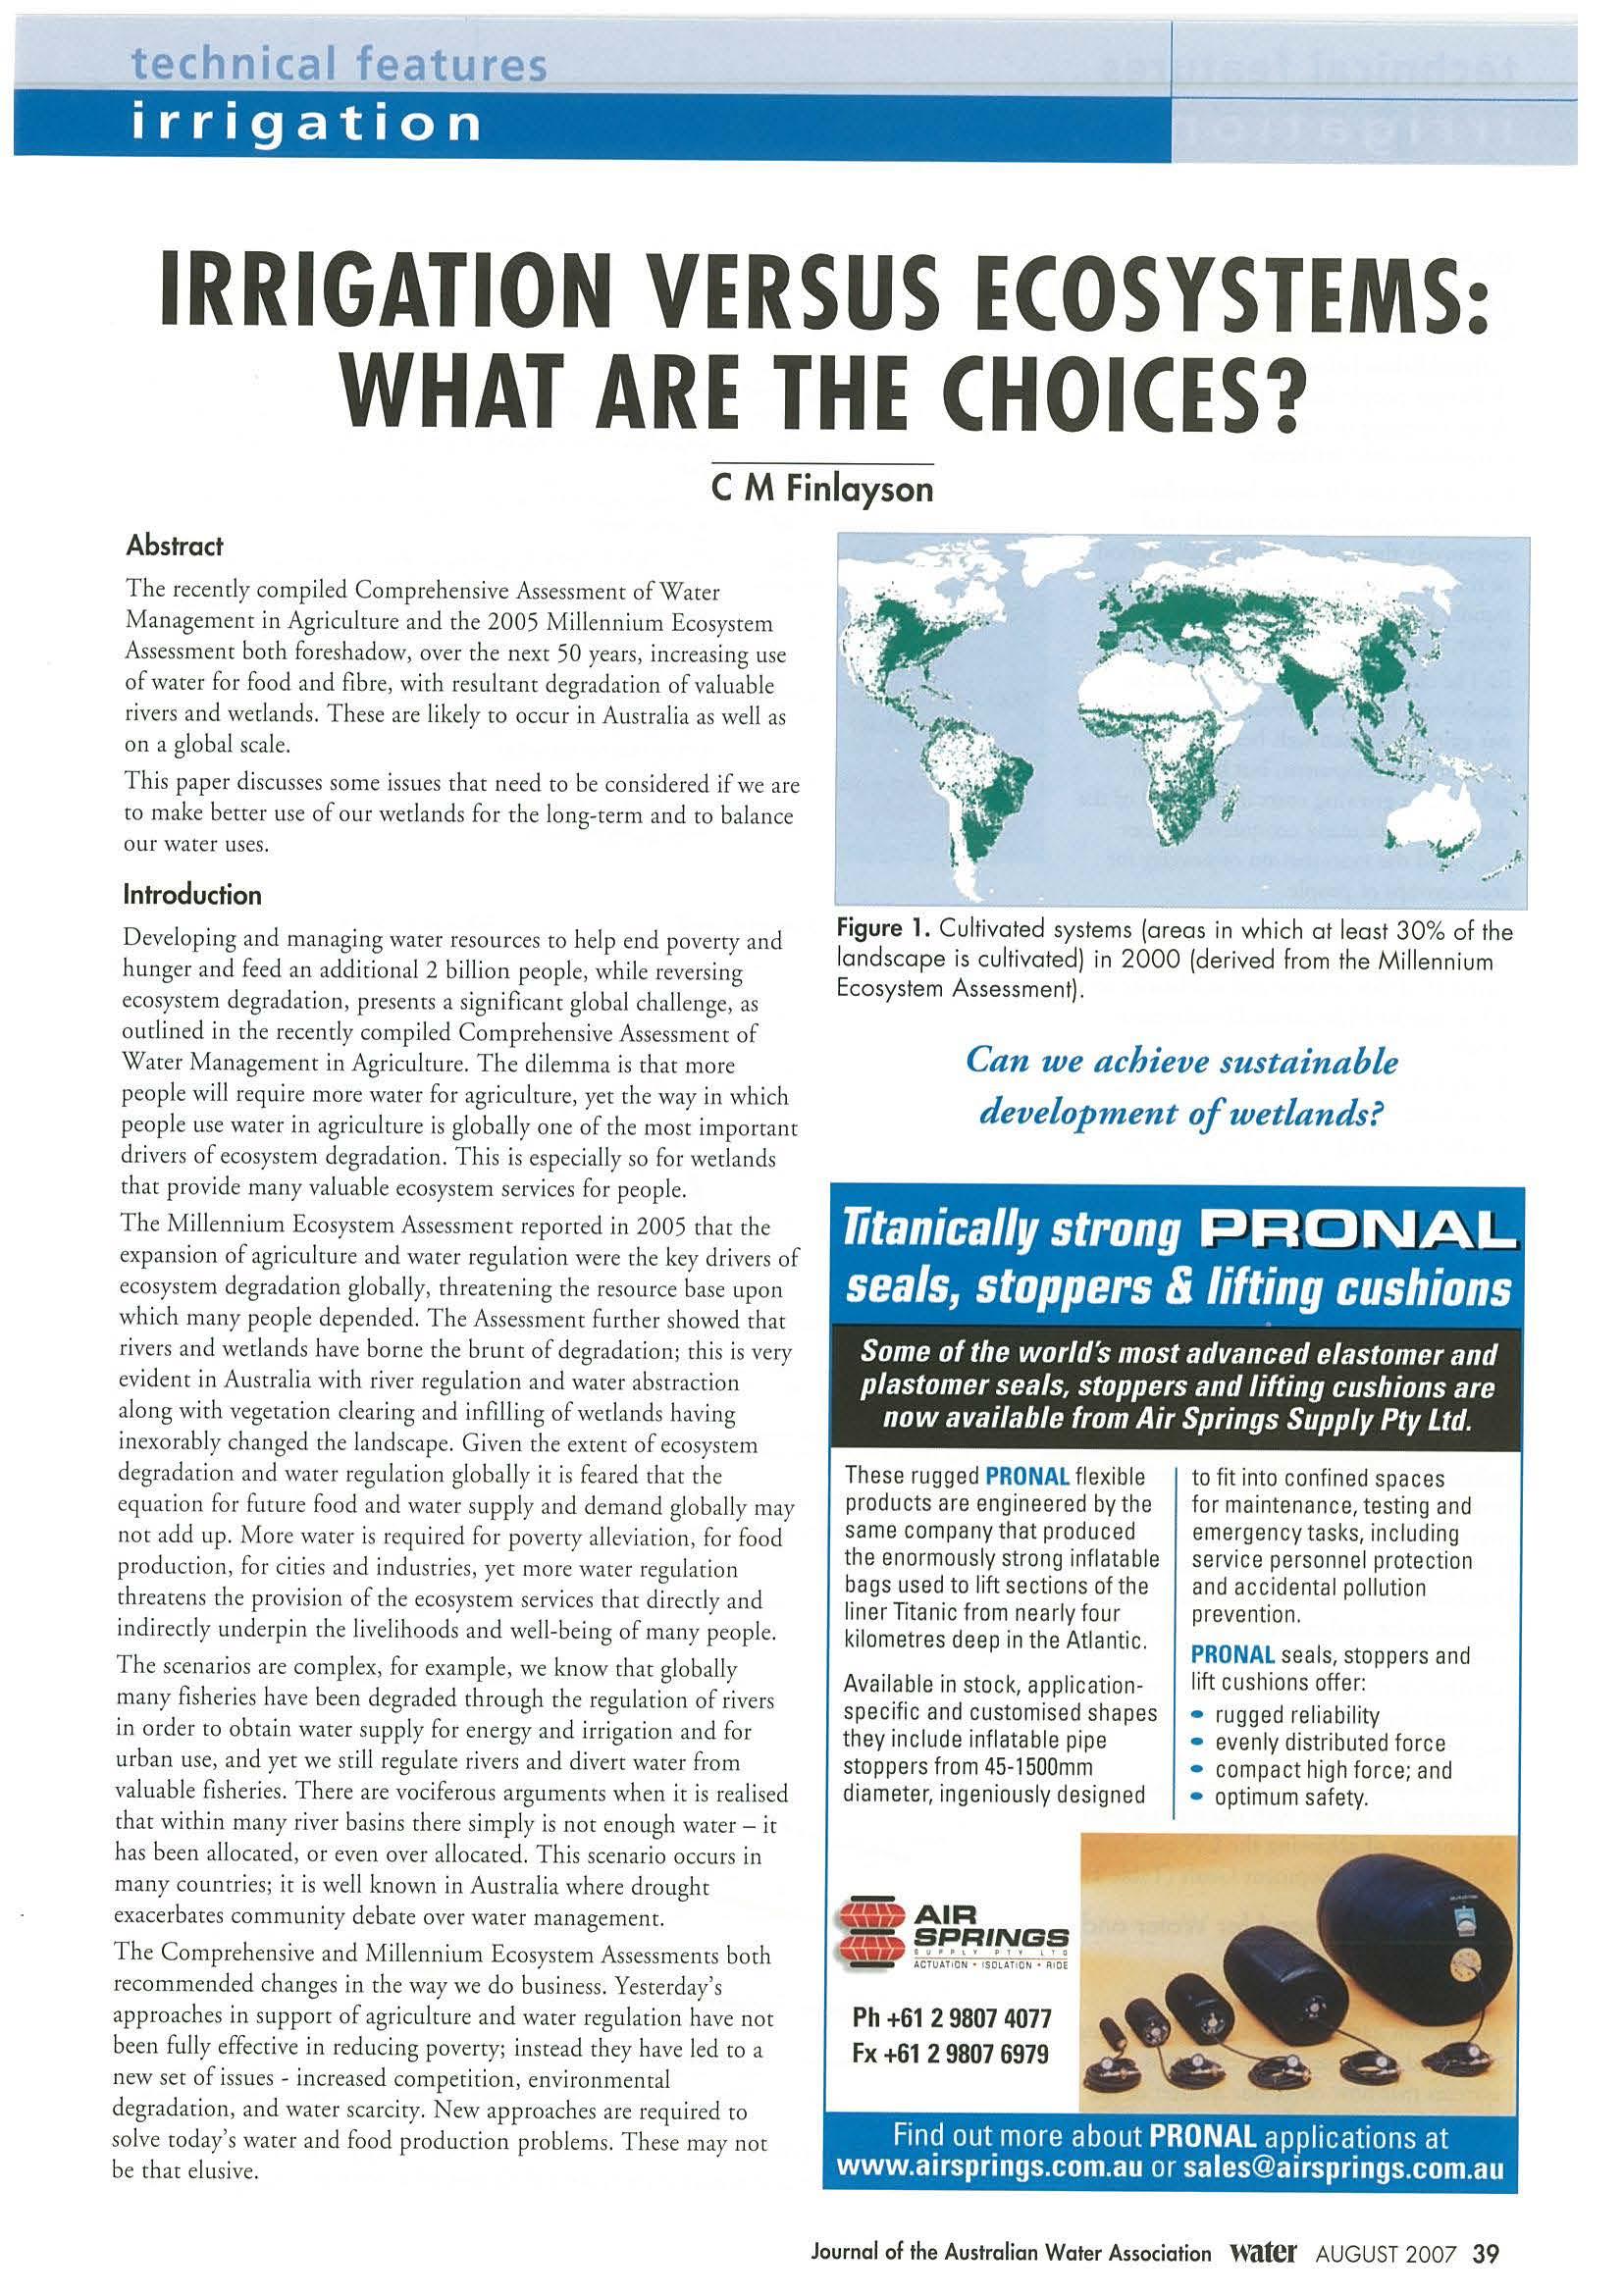
Figure 1. Cu lti vated systems (a reas i n wh i ch at least 30% of t he landscape is cultivated) in 2000 (derived from the Millennium Ecosystem Assessment).
:_ffl) AIR 1 ~ SPRINGS lt. - ACTUU10 N ISOlA T O R1OE
+61 2 9807 4077
+61 2 9807 6979
Ph
Fx
Journal of the Austra lian Water Association water AUGUST 2007 39
Global Assessment of Ecosystems
The key messages developed by che Millennium Ecosystem Assessment are outlined be low before consid ering che cha ll enges people face i n making decisions abo ut i nve sting in water for food, ecosystems and livelihoods.
i) Ove r the past 50 yea rs, humans have changed ecosystems more rap idly and extens ive ly chan in an y comparable period of rime in human hi sco ry , largel y co meet rap i dly grow in g demand s for food , fresh wa t er, timber , fibre and fuel.
i i) The c hang es chat hav e been made co ecosystems h ave concri buced co substant ial n ee gains in hum a n we ll -being and economic developm ent, but have b ee n achieved at growing coses in che form of the degradation of many ecosys t em services and the exace rb ation of poverty for some grou ps of people.
ii i) The degradation of ecosystem services could grow s ignifi ca ntl y wo rse during the firs t half of chis cen tury and is a barrie r co ach i evi n g the Mi ll ennium Development Goals.
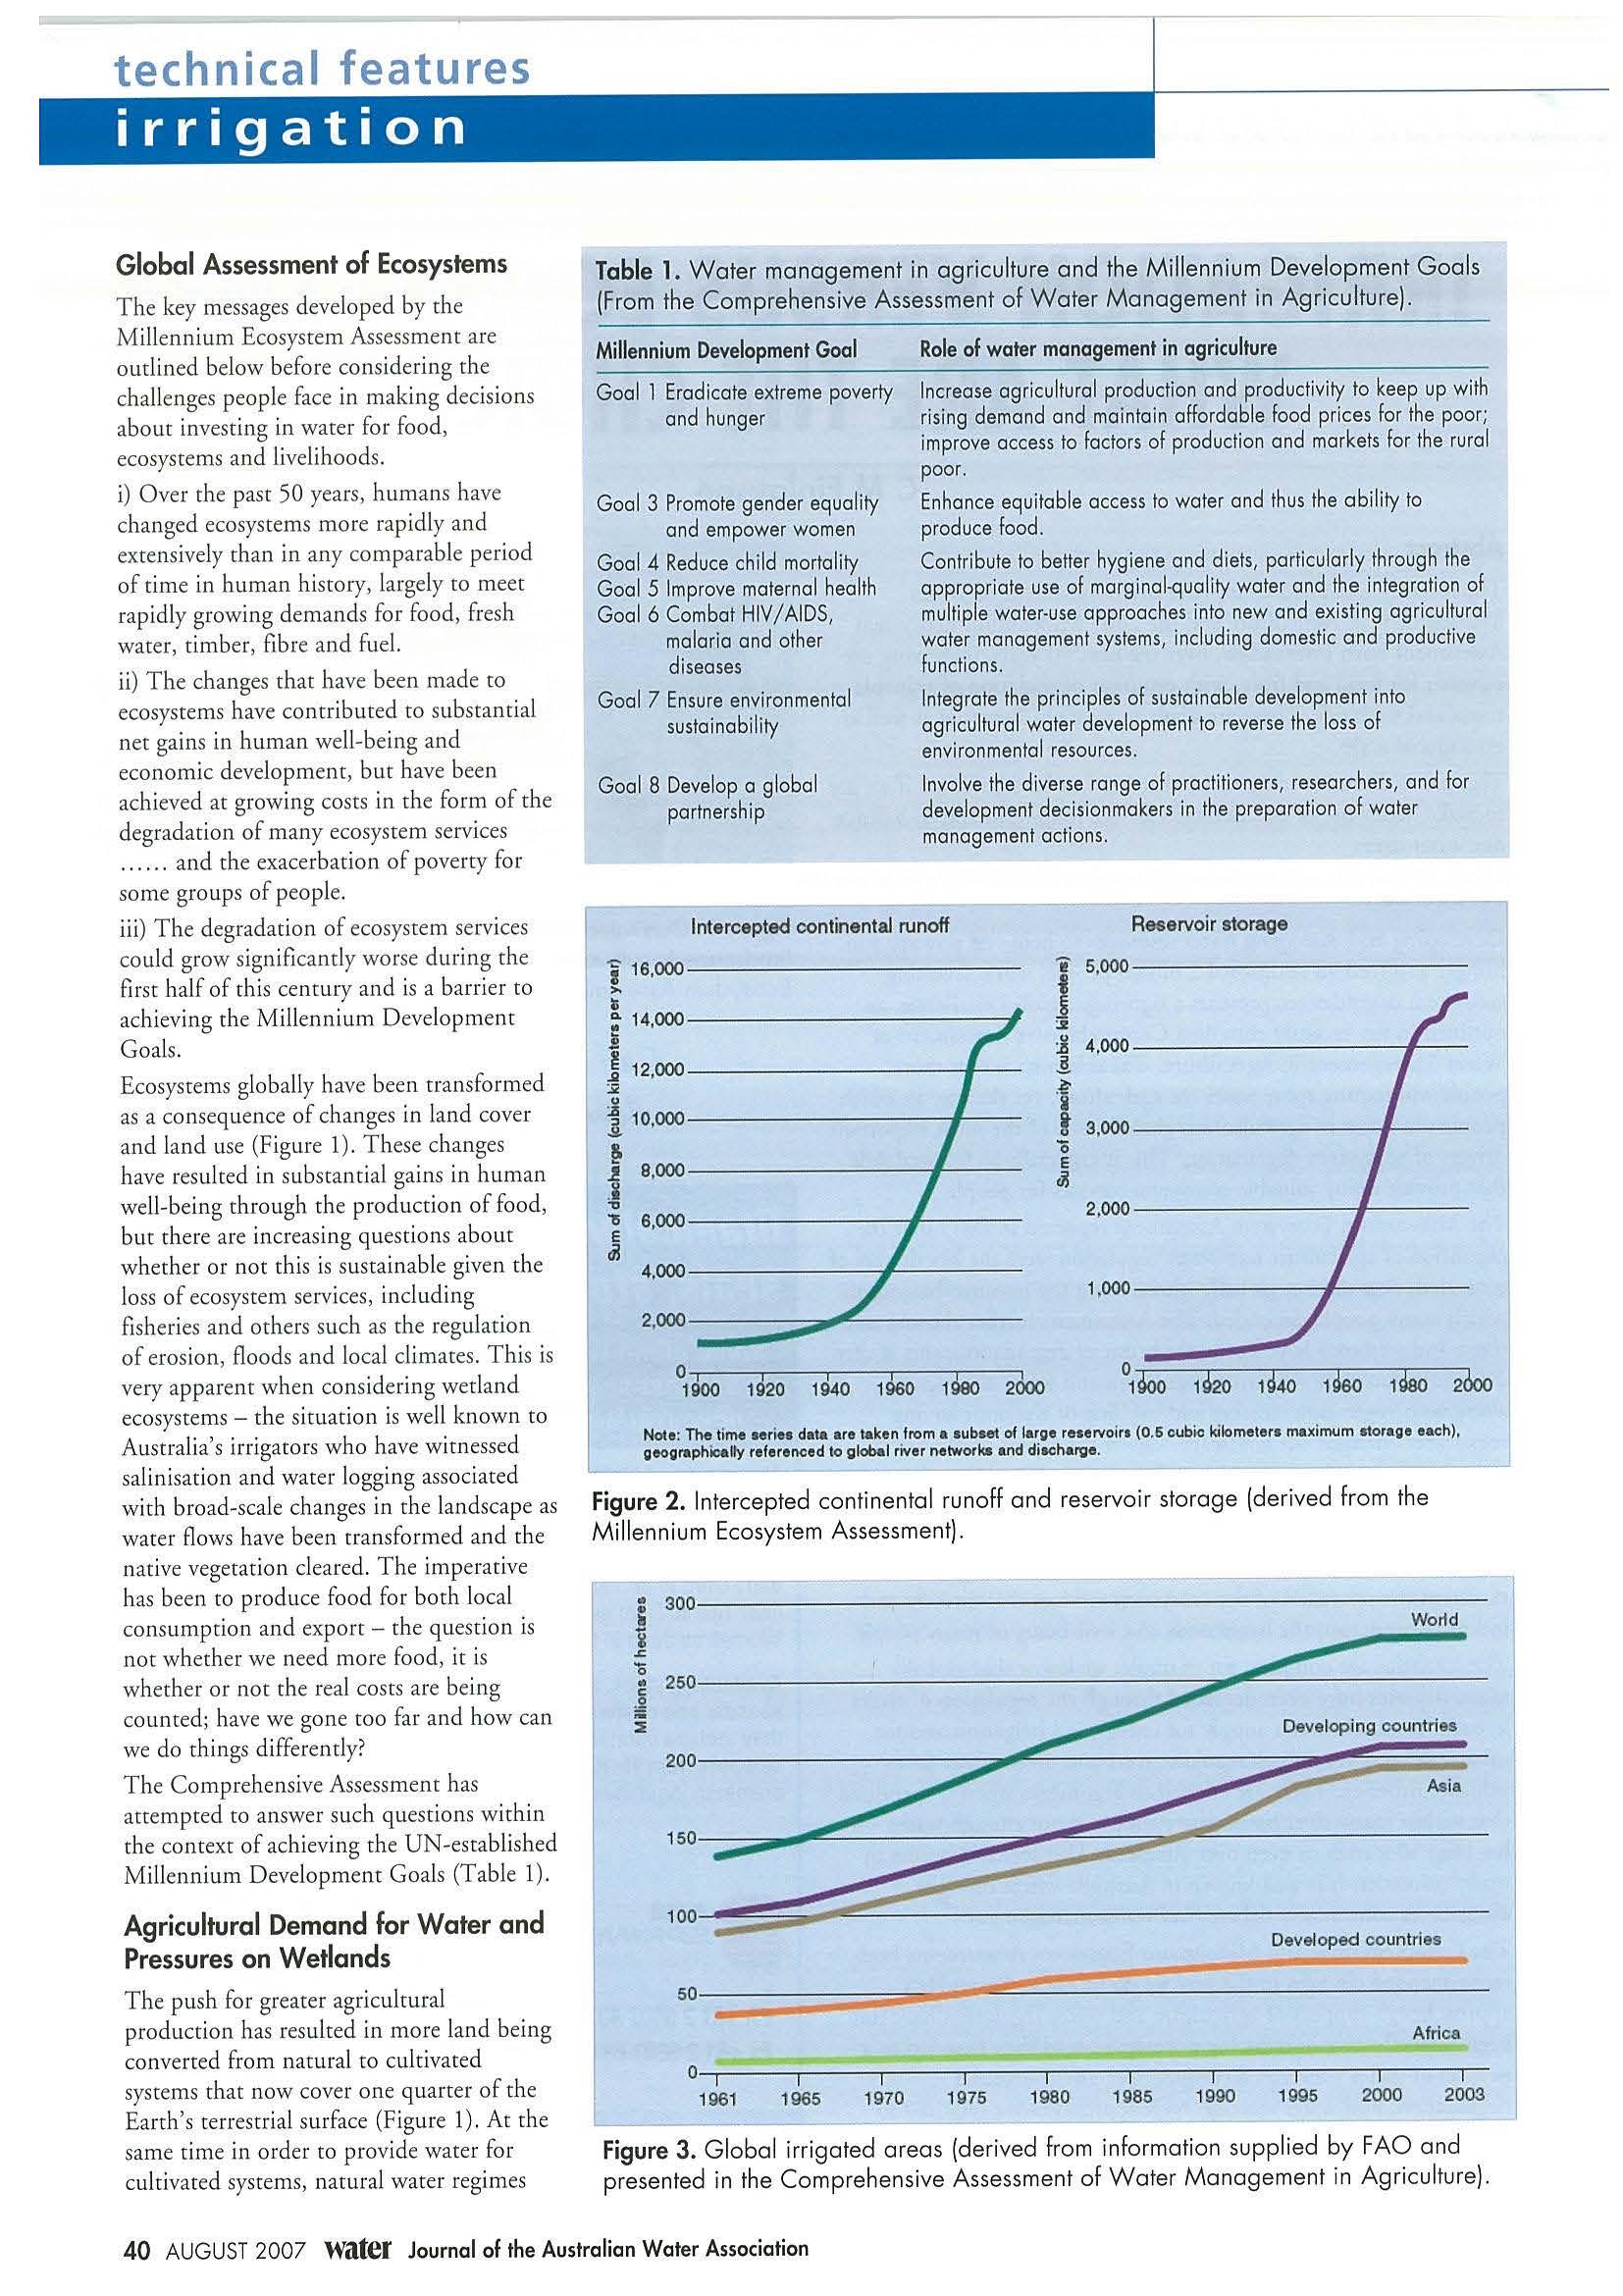
E cosystems globally h ave bee n transformed as a co nseq uen ce of c h a nges in land cove r a n d land use (Figure 1). These changes have resu l ted in substantial ga i ns in human well-being through the production o f food, but there are increasing questions about whether or not ch is is susta i nable g iven the loss of ecosystem services, including fisheri es an d o chers such as che regu lation of erosion, floods and local climates This is very apparent w h en co nside ring wetland ecosys t e ms - che situation is well known co Austra lia's irr igacors who have witnessed sali n isacion and water logging associa t ed with broad-scale ch anges in the lan d sca pe as water flow s hav e been transformed and t h e native vegeta tion clea red. The i mperative has b een to produce food for bot h lo ca l consum ption a nd ex port - the question is no r whethe r we need more food , it is whether or not the real coses are being cou nt ed; have we gone coo far and how can we do things differently?
The Comprehe ns ive Assessment has attempted co answer such que stions within the context of achieving t h e UN-established Millennium Development Goals (Tab le 1).
Agricultural Dema nd fo r Water and Pressures on Wetland s
The push for greater agricultural production h as resulted in more l a nd being converted from natural co cultivated sys t ems that now cover one quarter of the Eart h 's ter restrial surface (Figure 1) Ac che sa m e time in o rde r co provide water for cultivated systems, natural water regim es
Table 1. Wa ter management i n agricu lture and th e Millenn iu m Development Goals (From the Comprehensive Assessment of Water Management in Agriculture).
Millennium Development Goal
Goal l Eradica te extr eme poverty and hunger
Goal 3 Promote gender equa l ity a nd empower women
Goa l 4 Reduce ch i ld mortality
Goa l 5 Improve mate rn al heal th
Goal 6 Combat H IV/ AIDS, malaria and other diseases
Goel 7 Ensure envir onmental sustainab il ity
Goal 8 Develop a global partnership
Role of wate r management in agriculture
Increase agricultural production and productivity to keep up with rising demand an d maintain affordable food pri ces for the poor; i mprove access to facto r s of production and ma rkets for the rural poor.
Enhance equitable access to water and thus the ability to p roduce food.
Contribute to be tt er hygiene a nd diets , particularly through the appropriate use of marginal-qual ity water and the i ntegration of multiple water-use approaches into new and existing agricultural wa ter management systems, i ncluding domestic and product ive functions.
Integrate the principles of sustainable deve lopment into agricultur al water development to reverse the loss of environmen tal resou r ces.
Involve the diverse range of practitioners , resea r che r s, a nd for development d ecisionmakers in the prepara tion of water management acti ons
Intercepted continental ru noff Reservoir storage
Note: The time Nrtea data are taken fro m a aubset of large reservoirs (0.6 cubic kilometers maximum storage each), geo graphically reference d to global river networks and di ocharge.
Figu re 2 Inte rcepted co ntine nta l runoff a nd reservoir sto rage (derived from th e M ill e nni um Ecosyste m Assessme nt)
Figu re 3 G lo ba l irr igated areas (de r ived from info rmation sup pl ied by FAO and prese nte d i n the Compre hensive Assessment of Wa ter Ma nagemen t i n Ag r icultu re ).
s 16,000->, & i 14,000 j _g 12,000-- - '--:;; j .i 10,000------ - -#.! 8,000-----------~ .,, 'lS 6,000------ -1E ci! o~-~--~-~--~-~ 1900 11120 1940 1960 1980 2000
.. 300 ; y .<: Worl d 0 . 260 C i 200 Asia 150 Developed co untries Africa 0-..---~------.---,----~--~---.---~------,,----,-1961 1 965 1970 1975 1980 1986 1990 1995 2000 2003
40 AUGUS T 2007 Water Journal af the Austral ian Water A ss ociation
have also bee n altered. In response to increasing demands for wate r, large n u mbers of reservo irs have been co nstructed (F igure 2); rhe num ber of large dams in rhe world increased fro m 5000 in 195 0 to more than 45,000 at p resent. Reservoi rs now sto re water for 30-40% of irr igated lan d and generate 19% of global elect r icity su p p lies. Reg ulatio n of t he water reg ime to chis ex t ent has caused significant degradatio n of wetlands/ r ivers, bot h inl and a nd coastal. Dams have resulted in rhe fragment ation an d modi fi catio n of aq uatic habitats, d isru p ting wa t er fl ows , alte ring t he flow of matter and energy, and estab lishing bar r ie rs to migrato ry spec ies. An assessment of 227 major river basi n s globa ll y showed 37% were strongly affected by fragmentacion/al cered flows, 23% moder ate ly, and 40% un affec t ed.
In many insta nces the trend for further la nd conversi on and wa t er regulat ion and/or increased food product ion conti n ues , as shown by the t rend for irrigated areas in deve lopi ng co u ntries and glo ball y (F igu re 3) Projected in creases in water wi thdrawa ls for irr igat ion for 2025 range from 4-24% with che lower va lu e be ing d ue to op t im istic projections about inc reases in rain-fed areas and a n ass u mpt ion char increased foo d t rade will play a major role in overcoming demands for more food glo b all y. Prod ucing more foo d also means using mo re wate r, and on pas t trends , co nt in ued en vironmental degradat io n of we tl ands thro ugh furt her conve rsion and/or water regu latio n!
T h e amount of water used for prod ucing a range of food p rod uces has been ca lc ulated by vario us aut h ors a nd desp ite some variability in che figures each person is h eld res ponsi b le for convening 20 0 0-5000 litres of liquid wate r to vapou r each d ay, compared to 2-5 litres for drinking an d 5020 0 lit res fo r ot her ho usehold t asks. T hese fi gures illustra t e the im portance of food prod uction in rh e wate r cycle As consu mp tion patterns co nti n ue to cha nge, with, for exa m ple, increased demand for h igher wate r-d emandi ng gra in-fed meat prod uc es, the de mand for water will intens ify
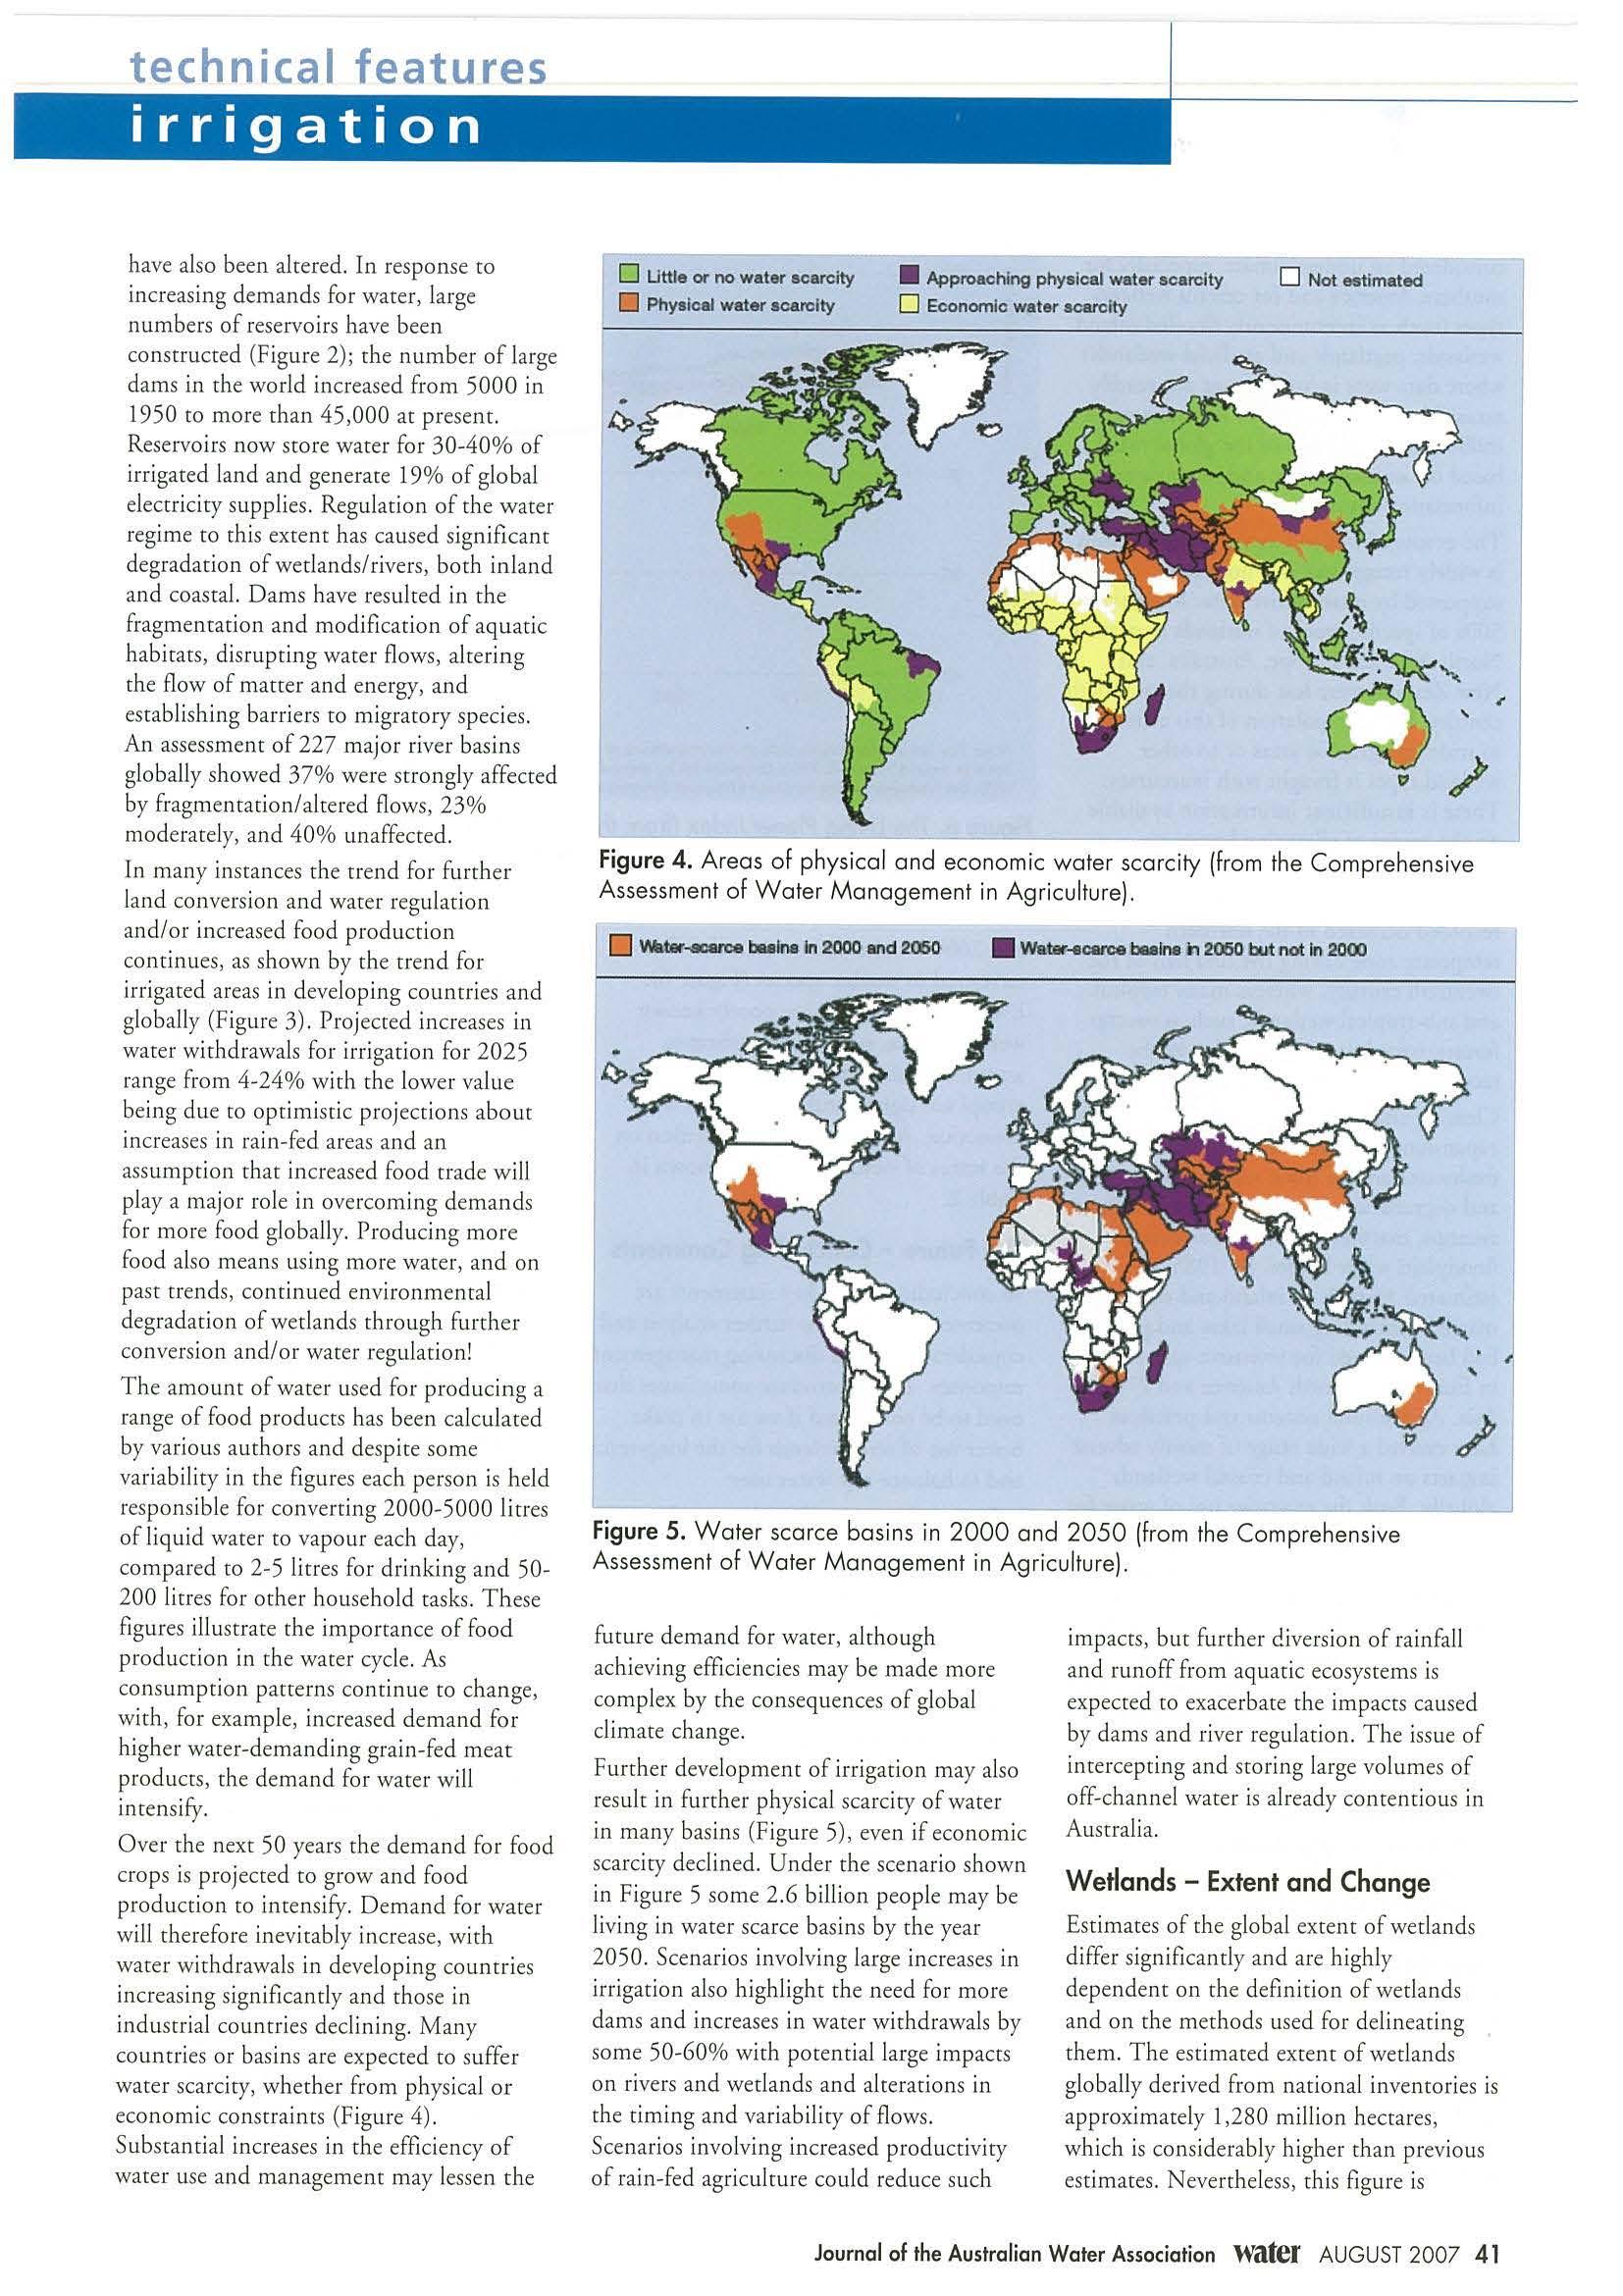
Over t he next 50 years ch e demand for food crops is projected ro grow and food production to inte nsify. De m and for water will t herefore inevitably increase, with wate r withdrawa ls in develo p ing countr ies increasi ng signi fi ca n tly a nd chose in in d ustrial countries d ecl in ing. Ma n y co untr ies or basins are expected to suffe r wa t er sca rcity, whether from physical o r econo m ic cons tr ai nt s (Figure 4)
Subs ta ntial increases in the effi cie ncy of water use and ma nagement may lessen che
D Li ttle or no w ater scarcity
D Ph ysical w a ter scarcity
• App roac h ing physical w a ter scarci ty D Not est im at ed
D Econ omic w ater scarcity
D v.w.- bMin. 1n 2000 and 2050 • w.w-.carce bM lne ;, 2050 but not In 2000
fu tu re dema nd fo r water, althoug h ach ievi ng efficiencies may be made more comp lex by che co nsequences of global climate c ha nge.
Further deve lop ment of irr igation may also res u lt in further physical sca rcity of wate r in many basins (Figu re 5), even if econo mi c sca rcity declined U nder che scena r io show n in Figure 5 some 2.6 billio n people may be living in water sca rce bas ins by che year 2050 Scenarios involving la rge increases in irr igation also hig hlight th e need for more dams and increases in water wi thd rawals by some 50 -60% with potential large impacts on rivers an d wetlands and alte rat ions in the ri ming and va riabi li ty of flows. Scenarios invo lving increased prod uct ivity of rain-fed ag r icu lture could reduce such
impacts, bur further d iversion of rai n fall and runoff fr o m aquatic ecosystems is expected to exacer bate rhe imp ac t s ca used by dams and river regu lation. The issue of in t ercepting an d stori ng la rge vo lumes of off-c hann el water is already contentious in Australia.
Wetlands - Extent and Change
Estimates o f rhe global extent of wetla nds d iffer sign ifica n tly and are high ly dependent on the definition of wetlands and on the methods used for deli neating chem. The estimated extent of we cl ands glo ball y derived from national inventories is appro ximately 1,28 0 mi ll io n hect ares, wh ich is considerably h igher th an previous es t imates. Neve rt he less, this figu re is
technical features
Figure 4. A reas of ph y si ca l and eco no mic w ater scarci ty (from the Co mpre he nsi ve A ssessment o f Wate r Manag em ent i n Agri c ul tu re)
Figure 5 . W a ter scarce ba sins in 2000 an d 205 0 (fr om th e Co mprehen sive A sse ss ment o f Wa ter Ma nag eme nt i n Agri c ultu re).
Journal of the Australian Water Association Water AUGUST 200 7 41
considered an under estimate, especially for southern America and for certain wetland types (s uch as intermittently flo oded inland wetlands, peatlands a nd art ificia l wetla nd s) where data were incomplete or n ot readi ly accessible The estimate for Australia of 24 mi ll ion hectares (<2% of the global total) is based on an incomplete and in consis t en t information source.
T h e ex t ent of wetland loss and degradation is widely recognised, but not often sup ported by quantitative data. More tha n 50% of specific types of we tl ands in p a r ts of North Ame ric a, Europe, Australia, and New Zealand were lost du r ing che twentieth cent ury, bu c ex trapolation of th is es timate to wider geographic areas or to ocher wetland types is fraug ht with ina ccuracy There is insufficient in formation available on t h e extent of all wetland types to document the extent of wecland loss g lobally Much of the loss t hat has bee n recorded occurred in the northern tempera t e zone during the first half o f the twent ieth century, whereas many trop ica l and su b -tropical wetlands, suc h as swam p forests, were lost or degraded over the second half of the ce ntury.
Cleari n g and drainage, often for agricultural expansio n , and inc reased wit hdrawa l of freshwater are the main reasons for the l oss a nd d egradat ion o f inland we tl a nds such as swamps, marshes, rivers, and associated flood plain water bodies. By 1985, an estima t ed 56-65% of inland a nd coastal marshes (includi ng small lakes and ponds) had been drained for intensive agriculture in E uro pe a nd North America and 27% in Asia. Agr iculcural systems and practices h ave exerted a w ide range of mostly adve rse impacts on inland and co astal wetlands globally. Both the extensive use of water for irrigat ion a nd excess ive nutrient loading associated with the use of nitrogen and phosphorus in ferti l isers have resulted in a decline i n the delivery of services such as freshwater and some fish species. The introduction of invasive alien species is now co ns idered to be a m ajor cause of extinctio n of native freshwate r species
There is also evidence o f a rap id and cont inuin g widespread
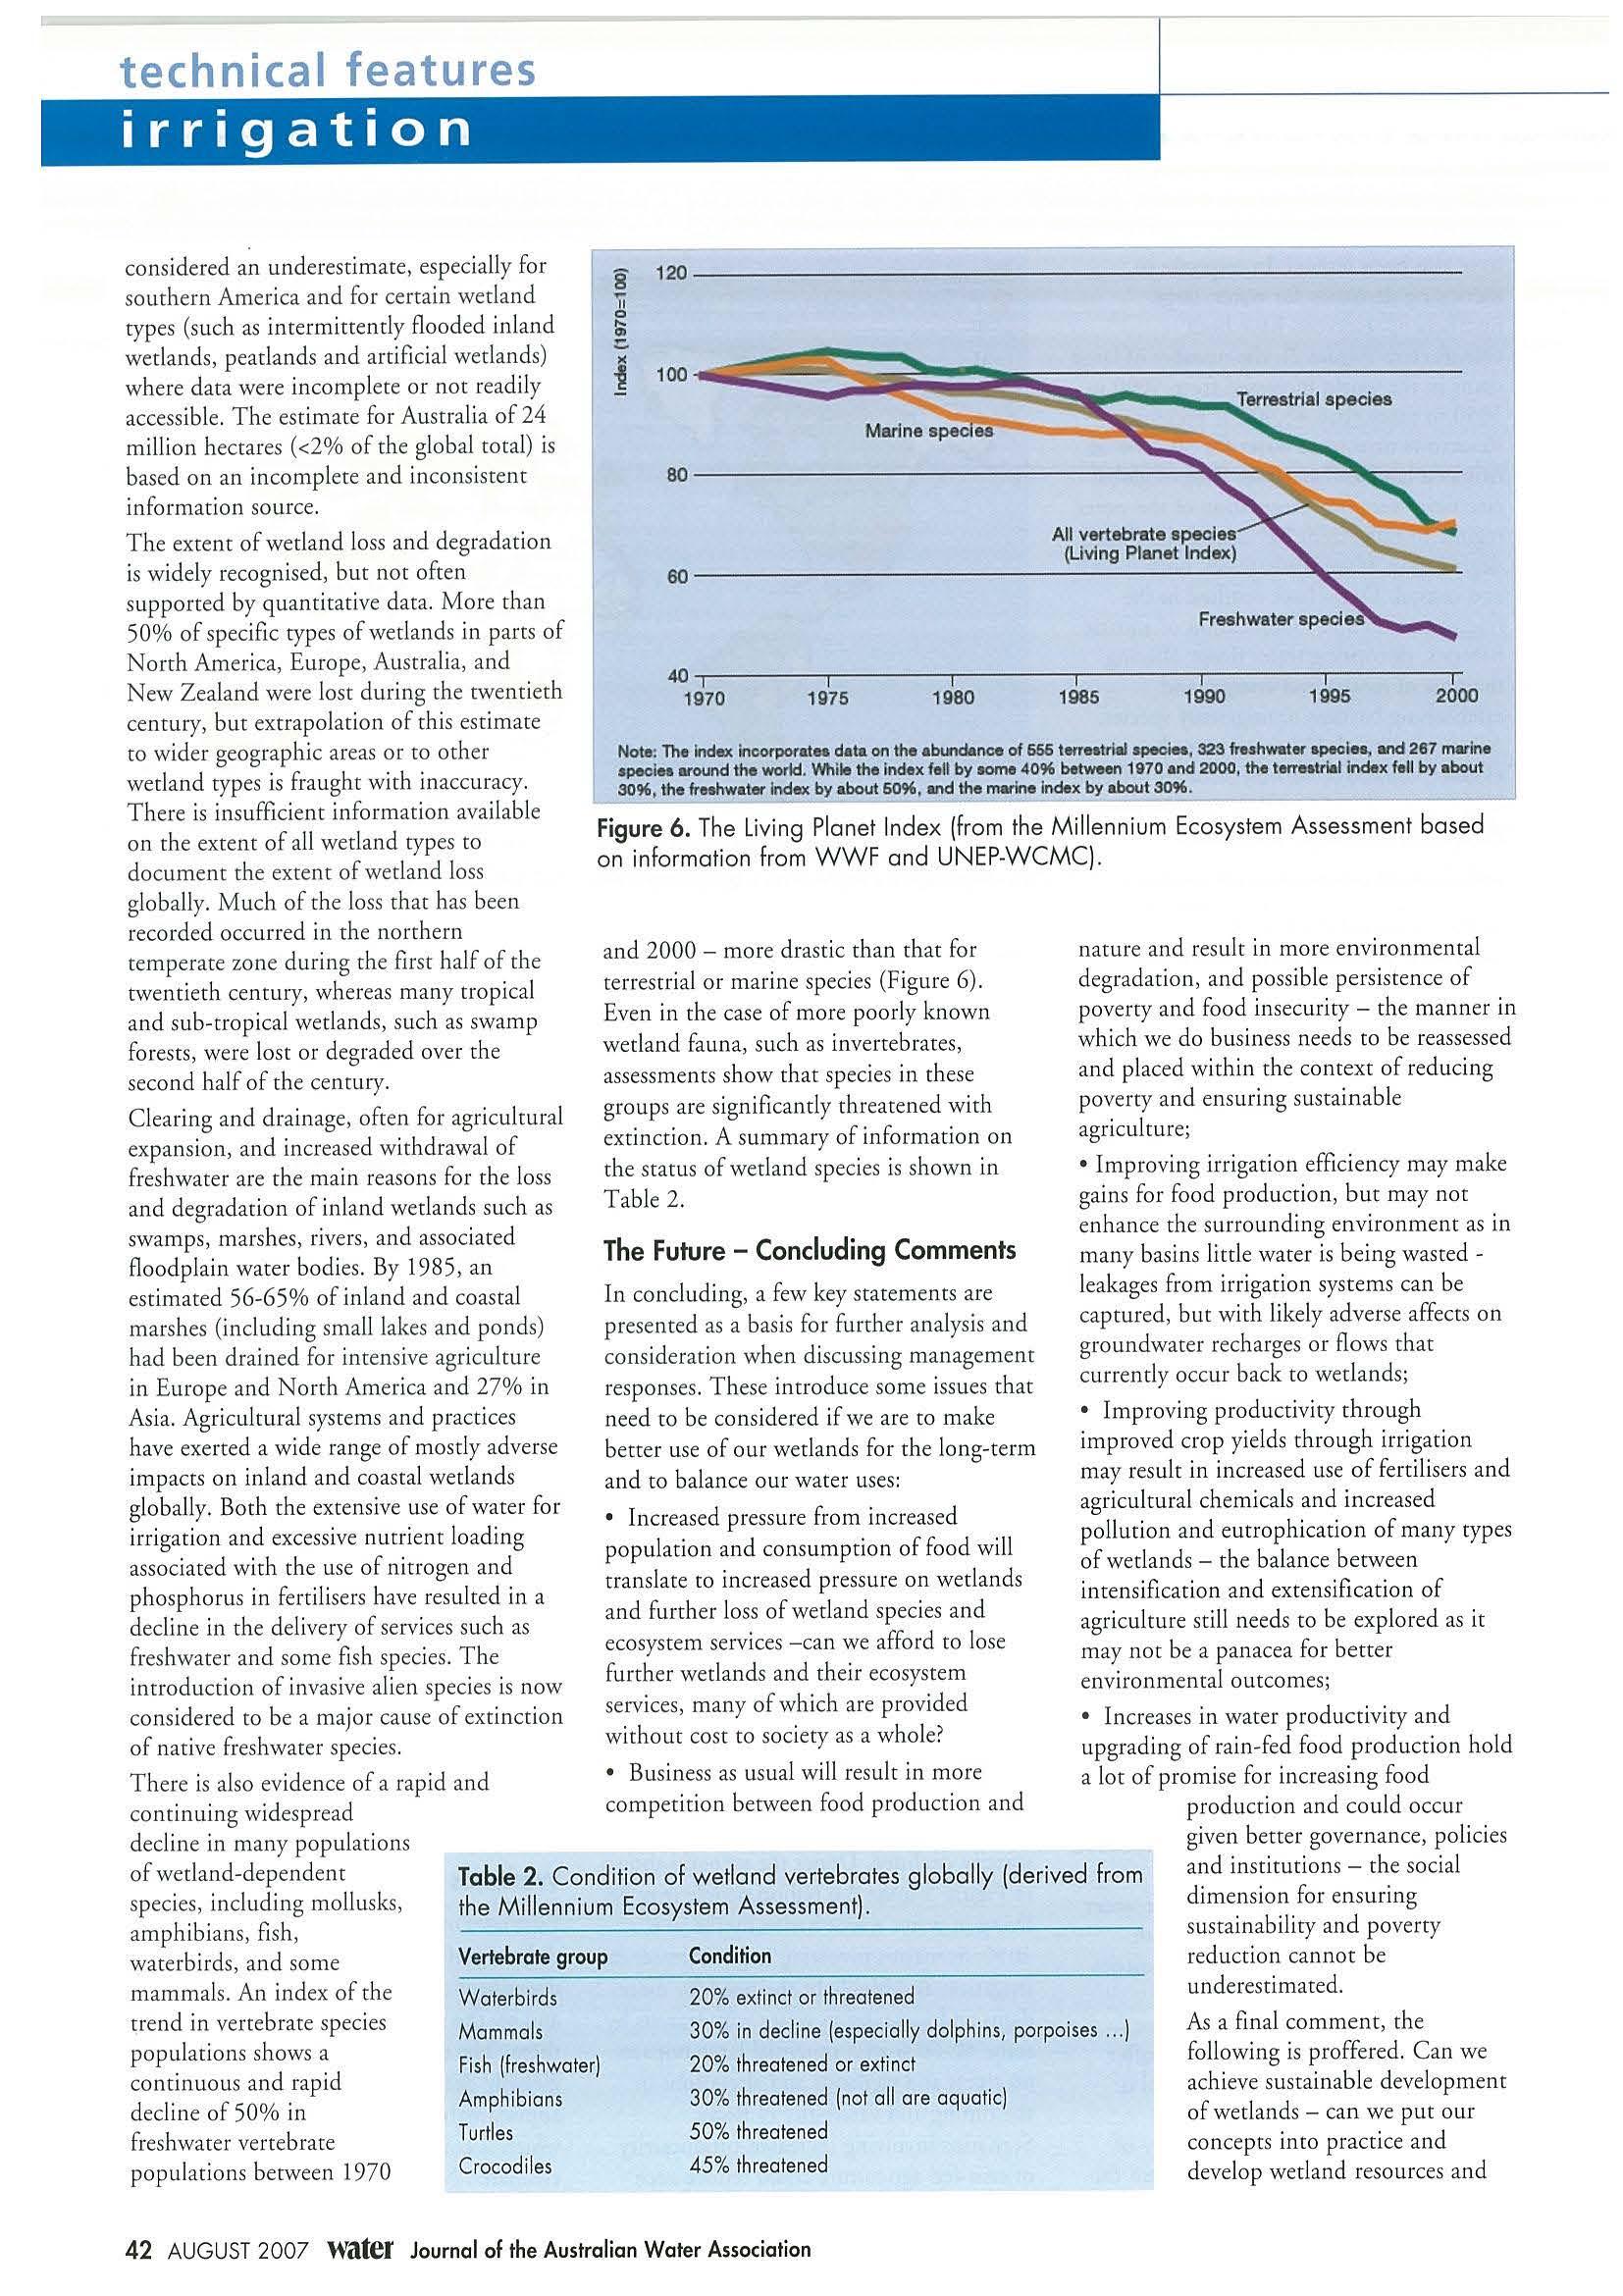
decline in many populat ions of wetland-dependent species, including mo ll usks, amphibians, fis h , waterb ir ds, and some mammals An index of the trend in vertebrate species populations shows a continuous and rapid decline of 50% in freshwate r vertebrate populations between 1970
Figure 6.
and 200 0 - more drastic than chat fo r terrestrial or marine species (Figu re 6). Even in the case of more poorly known wetland fauna, suc h as invertebrates, assessments sho w chat species in these groups are significan tl y th reatened with extinction. A summary of information on the status of we tl and species is shown in Table 2.
The Future - Concluding Comments
In concluding, a few key statements are presented as a bas is for further analysis and conside rat ion whe n discuss i ng management responses. These in troduce some issues chat need co be considered i f we are t o make better use of our we tlands for che long-term and to balance our water uses:
• I ncreased pressure from increased population and co n sumption of food will translate to increased pressure on wetlands and further loss of wetland spec ies and ecosystem services -can we affo rd to lose further wetlands and the ir ecosyste m services, many of which are provided witho ut cost to society as a whole?
• Business as usual will resul t in more competition between food production and
nature and result in more env ironmental degradation, and possible pe rsistence of poverty and food insecurity - the manner in which we do business needs to be reas sessed and placed w ithin the context o f reducing poverty and en suring sustai n ab le ag r iculture;
• I mproving irrigation effic iency m ay make gains for food product ion, but may not en han ce the surrounding env i ronment as in many basins little water is being was t edleakages from irrigation syste m s can be captured, but with likely adverse affects on gro undwater recharges or flows chat currently occur back to wetlands;
• Improving p rod uctivity through improved crop yie lds through irrigation may result in increas ed use of fert ilisers and ag ricultural chem icals and increased poll ution and eucrophicacion of many ty p es of weclands - the balance between in tensificat ion and extensification of ag riculture still needs to be ex plore d as it may not be a panacea for better environmental outcomes;
• Increases in water productivity and upgrading of rain-fed food prod uc ti on hold a lot of promise for increas i ng food production and cou ld occur
given better governance, policies and institutio n s - che social dimension for en suring
sustainability and poverty red u ct ion canno t be underestimated.
As a final comment, the followi ng is proffered Can we achieve sus t ainable deve lopment of wetla n ds - ca n we put our co ncepts into pract ice and develop wetland resources a nd
technical features
8 120---------------------------" 0 :;; l:j 100 Marine species 40.------,,------.-----.-----,-----~---~ 1970 1975 1980 1985 1990 1995 2000
------------J
Note: The Index incorporatn data on the abundance of 656 te,rntrill 1pecin, 323 lre1hwater apecln, and 287 marine 1pecin around the world. Wh ile the Index fell by aome 4096 between 1970 and 2000, the t errntrial Index fell by about 3096, the frnhwatw index by about 6096, and the marine Index by abou t S()9(,_._
Th e Li ving Pl a net Index (from the Millennium Ecosys tem Assessment based on in formation from WW F and UNEP-WCMC)
Table 2. Condition of we tl and vertebrate s g lobally (derived from the Millennium Ecosystem Assessment).
Vertebrate group Condition
Waterbirds Mammals Fish (freshwater) Amphibians Turtles Crocod iles 20% extinct or threatened 30% in decline (especially dolphins , porpoises ) 20% th reatened or extinct 30% threatened (not all are aqua tic) 50% threatened 45% threatened 42 AUGUST 2007 Water Journal of the Australian Water Association
conserve rh em ar rhe sa me rime? Is ir poss ible to develop wetlands wi tho ut furth e r running down the resource and rh e very p rocesses and i nt erac t io n s ch ar s upp ort t he wetland ? An integ rate d approac h is ne ed ed for managi n g la n d, wate r , a nd ecosystems.
Muc h of th e di sc u ssion above re late s ro a global sce nario of increased p ressure on water reso urces an d bala nc ing societal o u tco m es. A u st ra l ia is nor immune to chis pressure - w e face rh em when mak ing c hoices about the a llo cation of our water as demand from u rban uses increases and cl i mate va ri abil i ty an d drought imposes more s tre ss on o ur wa t er reso urces and infrastructure. As a major food exporting c ountry our c h o ices wi ll have inte rnational ramifi cat ions and will b e influenced by international co nditi ons.
The Author
Dr Max Finlayson (e m ail m.finla yso n @cgia r. o rg) is a Pri ncipal R esea rcher in We tl a nd Ecolo gy and T h e m e Lead e r for Wate r Ma n agement and rh e E n viron m ent a r th e Internacional Water Management In srirure (IWMI) based i n Co lo mb o, Sri Lanka He is c urr entl y Pre sid e nt of W e tland Inte rn ar io nal's S upervi sory Counc il and past-Chai r o f th e R amsar W e tland C on ve nt ion 's Sc ient ific a nd T ec hnica l R ev iew Pan el. H e h as bee n i nvolved wi th seve ra l global assessme nts, e.g. The Mi ll e nium Ec o sys t e m Assess m e n t, rh e Thi rd Assess m e n t Report on C limate Change, and mo s t rec ently rhe C ompre he ns ive Assessment of Water
Man age m ent in Agriculture. Previou sly he was Directo r of rh e Env ironm ent a l Re sea rch Inst it u te of rhe Sup e rvis ing Scie nti st wit h the F ederal D e partment of Environment a nd H e rit age , in D a rwin , NT. In la te 200 7 h e mo ves to C harl es Srurr Un ive rsi ty in AJbury, NSW, as Professo r for Eco logy and Biod ive rs ity.
Bibliography
Balmford, A , A. Bruner, P. Coop er, R Cosranza , S Farber, R. E Green, and othe r s. 2002 Econo m ic Reasons for C onserv in g Wild Nature." Science 297, 950-53.
Falkenmark, M , Fi nlayson, C.M & Gordo n , L. (coordi n at ing lead a uthor s) 2007. Agriculture, water, and ecosystems : a vo idin g the costs of going too far. In Molde n , D. (e d. ), Water for food, wate r for life: a comprehensive assess men t o f water management in agr ic ul ture. Earthscan, London, UK, pp. 234-277.
Fin layson, C.M & D'Cruz, R. (coo rdin ati ng lead auth o rs) 2 005 Inl and water sys te m s. In Millennium Ecosystem Assessment, Volume 2 Condi tions and Trends I sland Press, Washington DC, USA
Finl ayson, C. M , D'C ru z, R. & Davidson, N.J (c oordin a tin g lea d auth ors) 2005. Ecosystem services and human well-being: water and wetlands synthesis World R esources Institute, W ash ington DC, USA.
Kura, Y., C. Revenga , E. Hoshino , a n d G Moc k. 2004. Fishing/or Answers World R esources Institute, Washingt on D C. Millen nium Ecosystem Assessme n t. 2003. Ecosystems and Human Wellbeing: A Framework for Assessment Is la nd Press, Was hin gton D C. Millennium Ecosyste m Assessme nt 2005. Millennium Ecosystem Assessment Synthesis Report. Island Press, Washington D C. Mol d en, D. (ed.), 20 07. Water fo r food , water for life : a comprehensive assessme nt o f water m anagement in agric ulture. Earthscan, London, UK.
Foley, ] .A., D e Fries, R., Asner, G.P., Barford , C., Bona n, G , Carpenter and others 2005 G lobal consequen ces of land use Science 30 9 , 570-574.
Revenga, C., J. Brunn er, N . H en ni ge r , K. Kassem, and R. Payne r. 2000 Pilot Analysis of Global Ecosystems, Freshwater Systems Worl d Resources I n st itu t e, W as hin gto n , D C.
Journal of th e Au stralian Water Association Water AUGUST 2007 4 3
TDS IN SEWAGE: SOURCES AND TRENDS IN MELBOURNE'S WEST
 T R Ibrahim, B Meehan, P Carpenter, N Corby
Abstract
A significant impediment to re use of recycl ed wast ewat er in weste rn Melbourne is th e high To tal Di sso lved Solid s (TDS) co ncent r atio n i n the sewage fl owing into t h e Wes t ern Treatmen t Plant (WT P ) at Wer r ib ee There are three so ur ces of TDS in the western sewer system; trade waste inputs (industrial processing and ne u tralisation), dom est ic inputs and infilcracion from gro undwater sources T h is paper prese nts an inves t igation of the TDS characteristics for the influent at WTP a nd of a sa mpl e of dom est ic wastewater catchment from a resi de ntia l sewer. The average fl ow-we igh ted TDS concentration at WTP was 913 mg/ L and average flowwe ighted TDS conce ntration in t he domestic sewer lin e was 3 19 mg/L. The average tot a l load calculated a t WTP was det er min ed to be 444 ton nes/day bu t it was est imate d chat th e TD S load at WTP from C ity West Water re sidential c ustom e rs was only ab out 37 ton n es/day. The paper s ugge sts two stra t eg ies for reducti o n o f trade wa ste TDS: use of bufferi n g cap acity to re du ce ne utra lis a t ion i mpacts and di ve rs ion of peaks
Introduction
Water reclamation, recycling and reuse a re now recognis e d as key components of water and wast ewater management in all areas of Austra lia. In li ght of the lase 8 yea rs o f drought the vu ln erab ility of Victoria's water reso urces h as bee n brou gh t sh a rply into focus In response, the Victorian Government set a targe t to recycle 20% of Mel bourne's treated effl u e nt by 2010 (D SE 2003).
Melbourne is a c ity of ove r 3 mi ll ion people (ABS 200 4-0 5) and cu r rentl y co n su m es 48 0 ,000 ML of potabl e water p er year (D SE 2004, MWC 2003) Residentia l us e acco unt s for 60% and industry accounts for 28% (MWC Nov 2003, MWC 2003).
Melbourne produces ap p roximately 350,000 ML per year of domestic a nd indu st rial wastewa t er (MWC Nov 20 0 3).
The re are thr ee retai l water compa nies i n
Melbourne . City West Water (CWW), Yarra Valley Water (YVW) and South Ease Water (SEW) and one wholesaler:
Melbourne Water Corporation (MWC)
City Wes t Wa t er is respons ibl e fo r the larger proportion of indus t r ies located in Melbourne. and co nsequ e n tl y is responsible for th e la rges t perce nt age of trade waste being discharged into the sewer syste m , rhe majo r ity of w hi ch is discharged to ch e Melb ourne Wate r's West e rn Treatment Plane (WTP) (c a 500 ML/ d )
T he Western T reat men t Plane's sewage treatment process is by a huge lagoon system and cu rrently some effl u e nt is used on-s ite for irrigation , and a p ro porti on further treated and exported as re cycled wa ter, for horti cultur al, recreational a nd domestic customers. (Po on et al 2 0 06).The balance is discharged into four separate ou tl ets in to Pore Phill ip Bay unde r strict Environ m e ntal Protec t ion Aut h ority (E PA) li cense ag reements
O n e of the major factors lim i ting t he reuse of recycled water is th e conce ntrat ion of Total Disso lved So lids (TDS ) As a result, th e Victorian Gove rnm ent, CWW and MWC have developed t he Sa li nity Reduc tion Strat egy, w hi ch was introduced with th e a i m of reducing the sale co nte nt in recycled water by 40% by 200 9 (DSE 2004).
TD S is a m eas ure of the coral a m ount of d isso lved sol id s i n wa t er. I t is t h e co mbin e d content of all sol ubl e in organic a nd organic
su b sta nces whic h are p resent i n a mole c ular o r ionised form. Inorganic compo und s include su lfates, p h osphates, chlorides, fluorid e, bica rbonates, carbonates a nd ni t rates of ca lcium , sodium, magnesium , potass ium and aluminium. The organic compou nd s in clude organ ic sales, humic and ful vic ac ids, a nd sugars. Orga n ic TDS is largely b roken down by conventional wastewater t reat m e nt p rocesses. Therefore che contrib u t ion chat organic TDS ha s on the tot a l TDS in the efflue nt is re latively small (TWACC 20 04).
Essent ially there are three sou rces of TD S in the western se wer system: tra de was te inputs (indust rial process in g and neutra lisation), dom es ti c/commercial inputs and i nfil tr at ion fro m groundwate r sources. I c h as been es t imated th a t industries contr ibute between 40-50% of t hi s TDS (DSE 200 4), b u t wi th limited data ava ilab le o n sewage character ist ics t he re was a clea r n eed co obtain accurate inflow data on the western Melbo u rne sewage sys te m in o rd e r co be able co i n vestigate st rateg ies to m a n age t h e amount of TD S entering th e se wage sys t em through these three so urces.
Estimation of Inputs
An inte n sive sam pli ng progra m was conducted co chara ct erise raw sewage inputs at WTP A sam pling site imme diat ely prior co t h e first lagoon was chosen co collect raw sewage hourl y for two weeks betwe en 1 6t h co 23 rd o f March 2005 and 4th co 11th of May 2005. Two composite s amplers were
~fereed paper
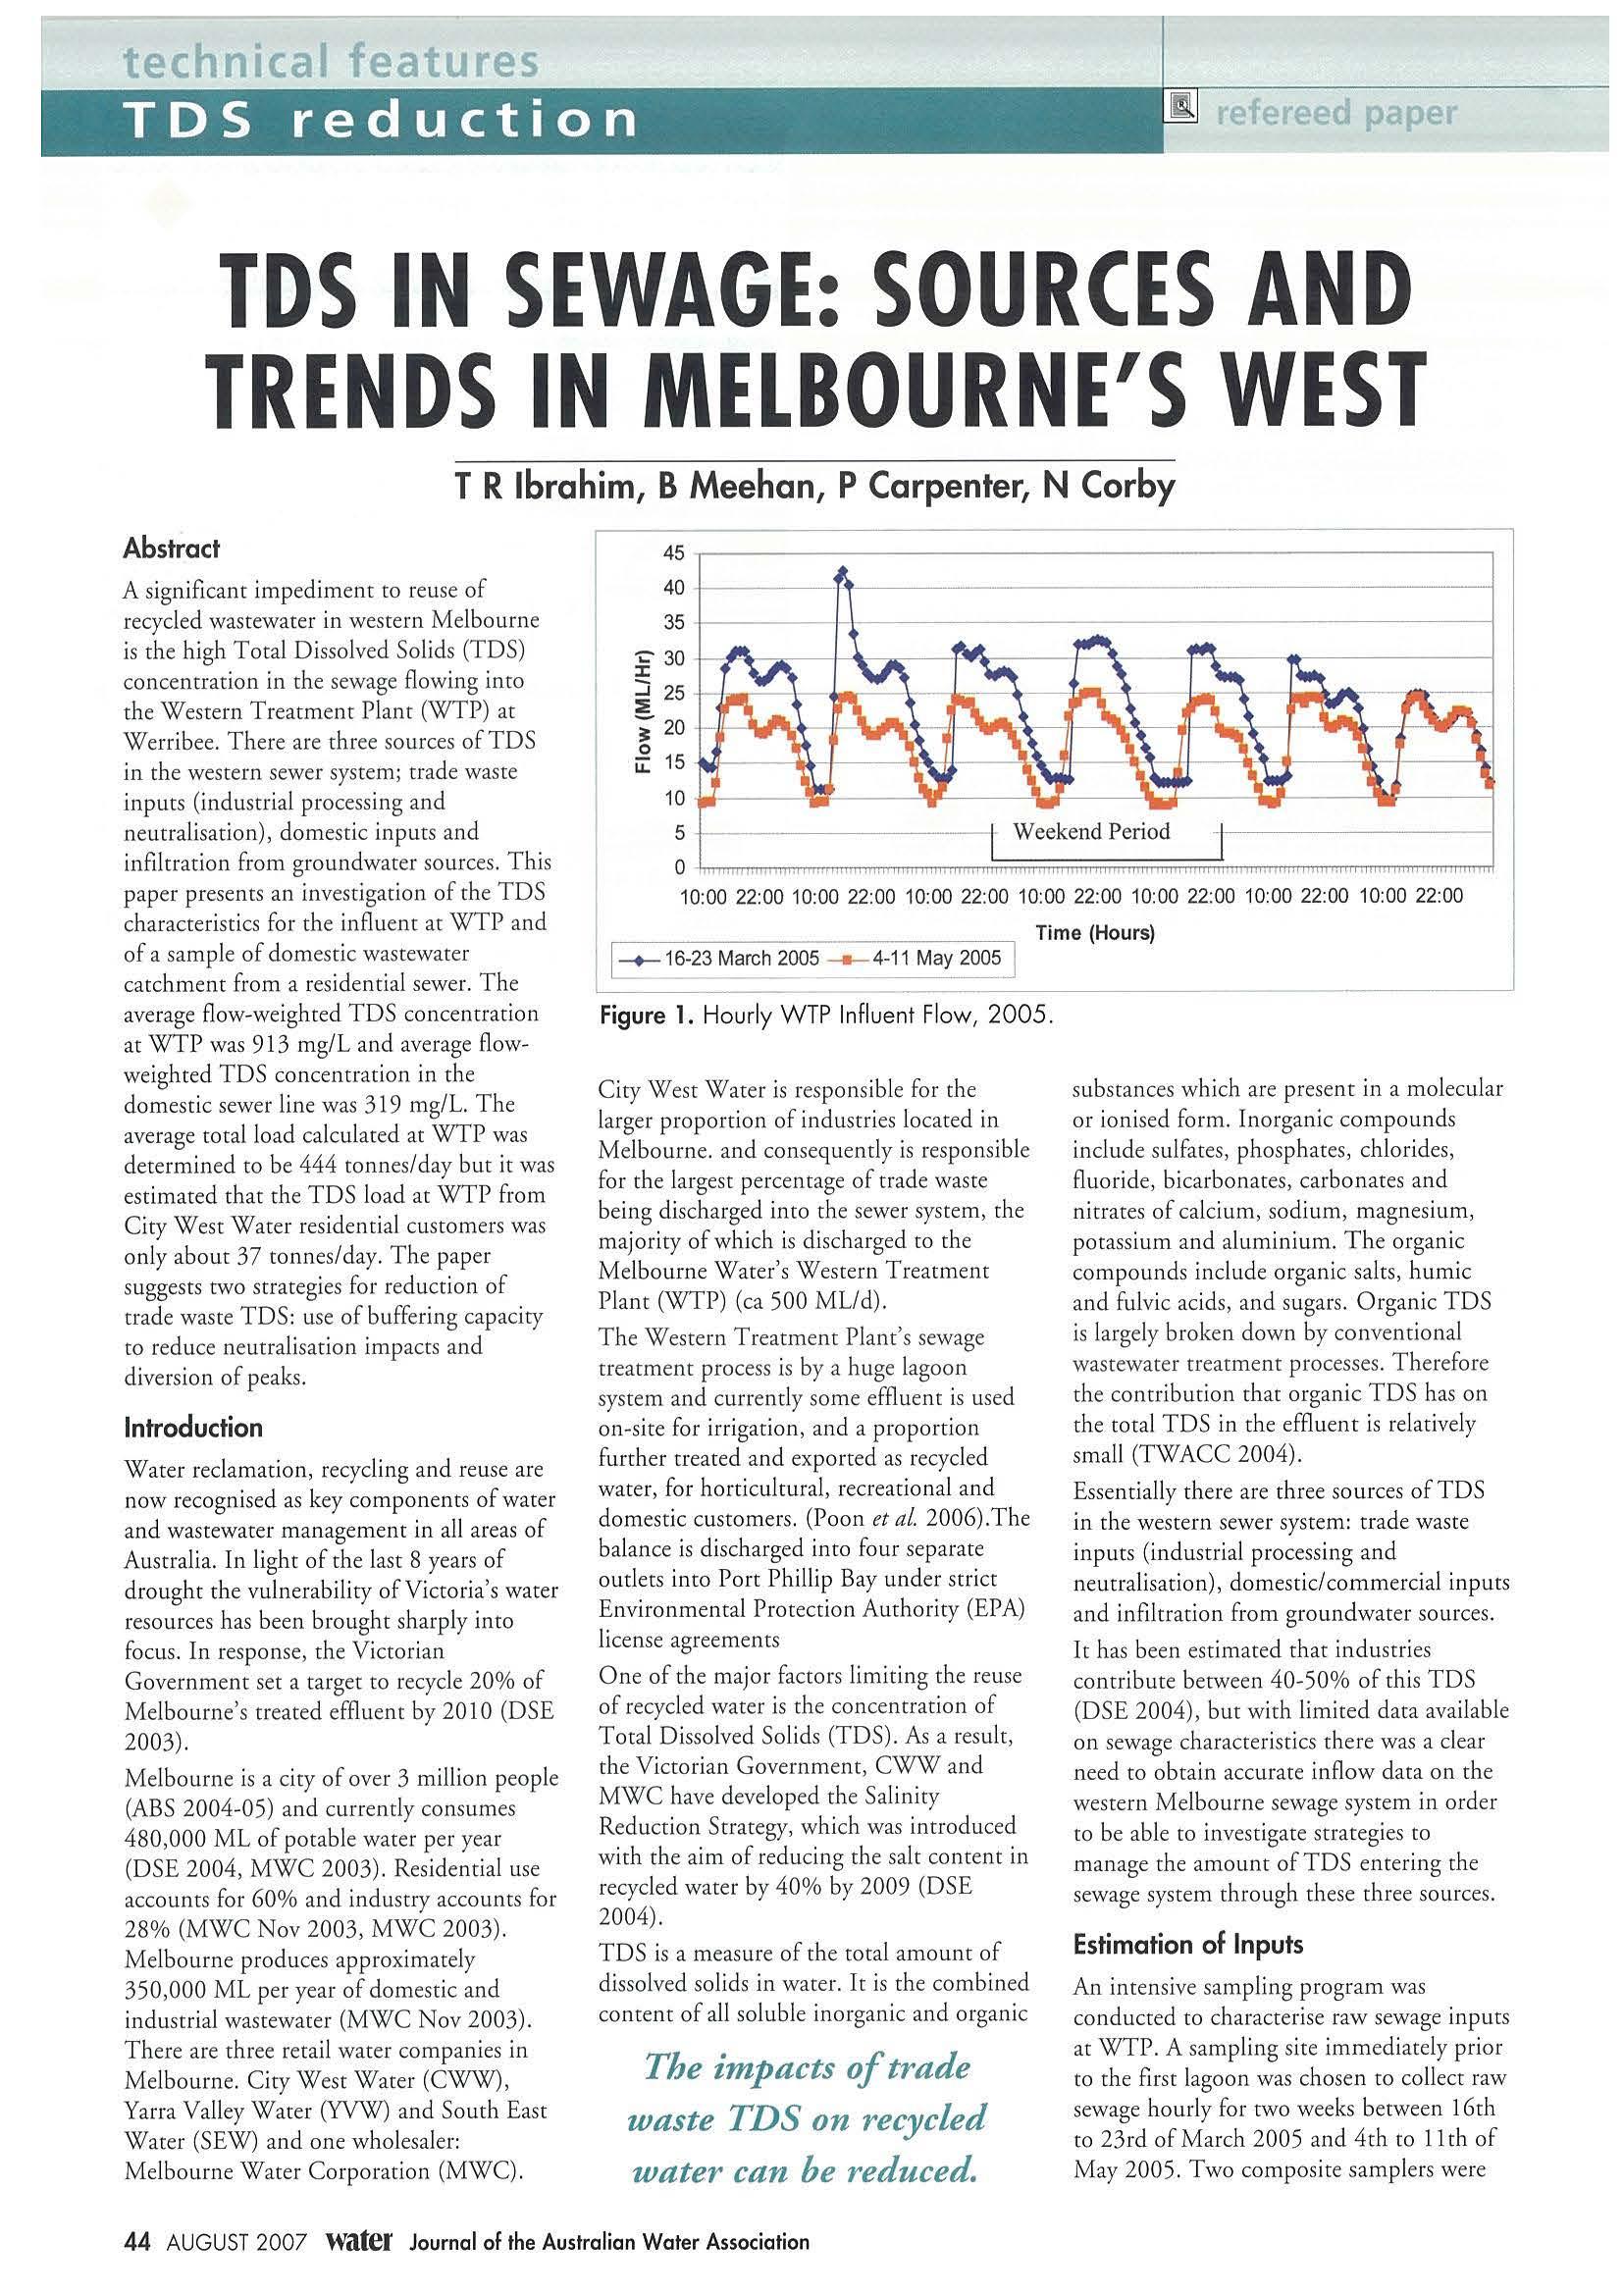
45 ,----------------------------~ 40 t- 1~ ------1 35 ¥ 30 1-,n,-..,---:J 25 ::!!: i 20 H t-''W",._+ 0 U::: 15 10 -w- tiif5 0 .J,,...,,.rrmn,,,..,,,,,,.,,.,,,r-rn,,.,.,,..,mm,-m,m,~;::;;;;:;:;;;;;:;;:;;;;;:;;;:;:;;;;;;;;;;;;;:;;:;;:;;.,.,,.,,,,,.,--nm,...,,,.,,~===.,J 10:00 22:00 10: 00 22: 00 10:00 22:00 10:00 22:00 10:00 22:00 10:00 22:00 10:00 22:00 Time (Hours) [ -+- 16-23 March 2005 -= 4-11 May 2005J
Figure 1. Ho urly W TP Influent Flow, 2005.
The impacts of trade waste TDS on recycled water can be reduced.
44 AUGUST 2007 water Journal of the Austra lian Water Association
used each consisting of 24 one litre collection bottles. Samp lers were set at 10:00am and run for 24-hours. 250 mL was taken every 15 minu t es during a 1-hour period, giving a 1-hour composite sample of one-litre. Forry-fou r parameters were ana lysed wh ich included standard wastewate r parameters such as pH, acidity, al kalin ity, tota l dissolved solids, ammonia, sulphide and a suite of heavy metals. All parame t ers ex pect pH and elec tr ical conductivity were determi ned in a NATA regis t ered laboratory according to st andard methods fo r analys is of wastewater (Clesceri et al. 1999) A permanent flow monitor installed on t he mai n trunk sewer was used to obtain the flow races.
In general, th e flow of was t ewa t er ente r ing the Western Treatme n t Plant t ends to follow a diurnal patte rn as shown in Figu re 1. T he flow is low d u ring the early par e of che mo rn ing. Aro u nd 2.00 pm it inc reases sharply and peaks between 3.00-6. 0 0 pm. Since ic cakes ap proximately 8-12 hou rs (MWC 2002) for the sewage to flow to che WTP ic is co nsistent with dai ly domest ic rou t ines (i.e. morning showers, fl ush in g of to ilets and lau nd ry). Boch sam p ling wee ks had minimal rainfall , therefore there was li t tle or no impact from rainfa ll on the actual flow from domest ic and industrial sources. T he average da ily flow into the WTP ove r the two-week sam pling d u ra ti on was 486 ML/day
Over the diurnal period the TDS diffe red considerably as shown in Figure 2. Fluctuat ions over th e day are shown, with the h ighes t recorded concentrat ion at 1800 mg/L an d the lowest at 300 mg/L. The average dai ly flow-weigh t ed conce n trat ion over che two-week samp li ng program was 913 mg/L. The EPA G u idelines fo r Was t ewater Reuse recomme nd chat (E PA 1996 ), " it is desirable that t he total disso lved sol ids of the wastewater are less than 1000 mg/L an d preferably less than 500 mg/L." As shown in Figure 2 the levels ente r ing WTP are generally greater cha n 500 mg/L and often greater cha n 1000 mg/L.
T he TDS loads p resented in Figu re 3 were calcu lated us ing the measured flow rate and the ho u rly composite TDS co ncentratio ns
The TDS load varies considera b ly th roug hout che day and s hows the same diurnal t rends as t he co ncentration (Figure ji o'{ 2). Based on che observarions a poss ib le ,Ll\' ' \ expla nat ion of these tre nds and distinc t ive
load peaks cou ld be d ue to accumulat ion of
high TDS ind ustrial effluents in t he sewer system d uring low flow periods and th en at times of high flow t hese su bstances flus h dow n the sewer system ca using h igh concentration spikes at WT P. The average
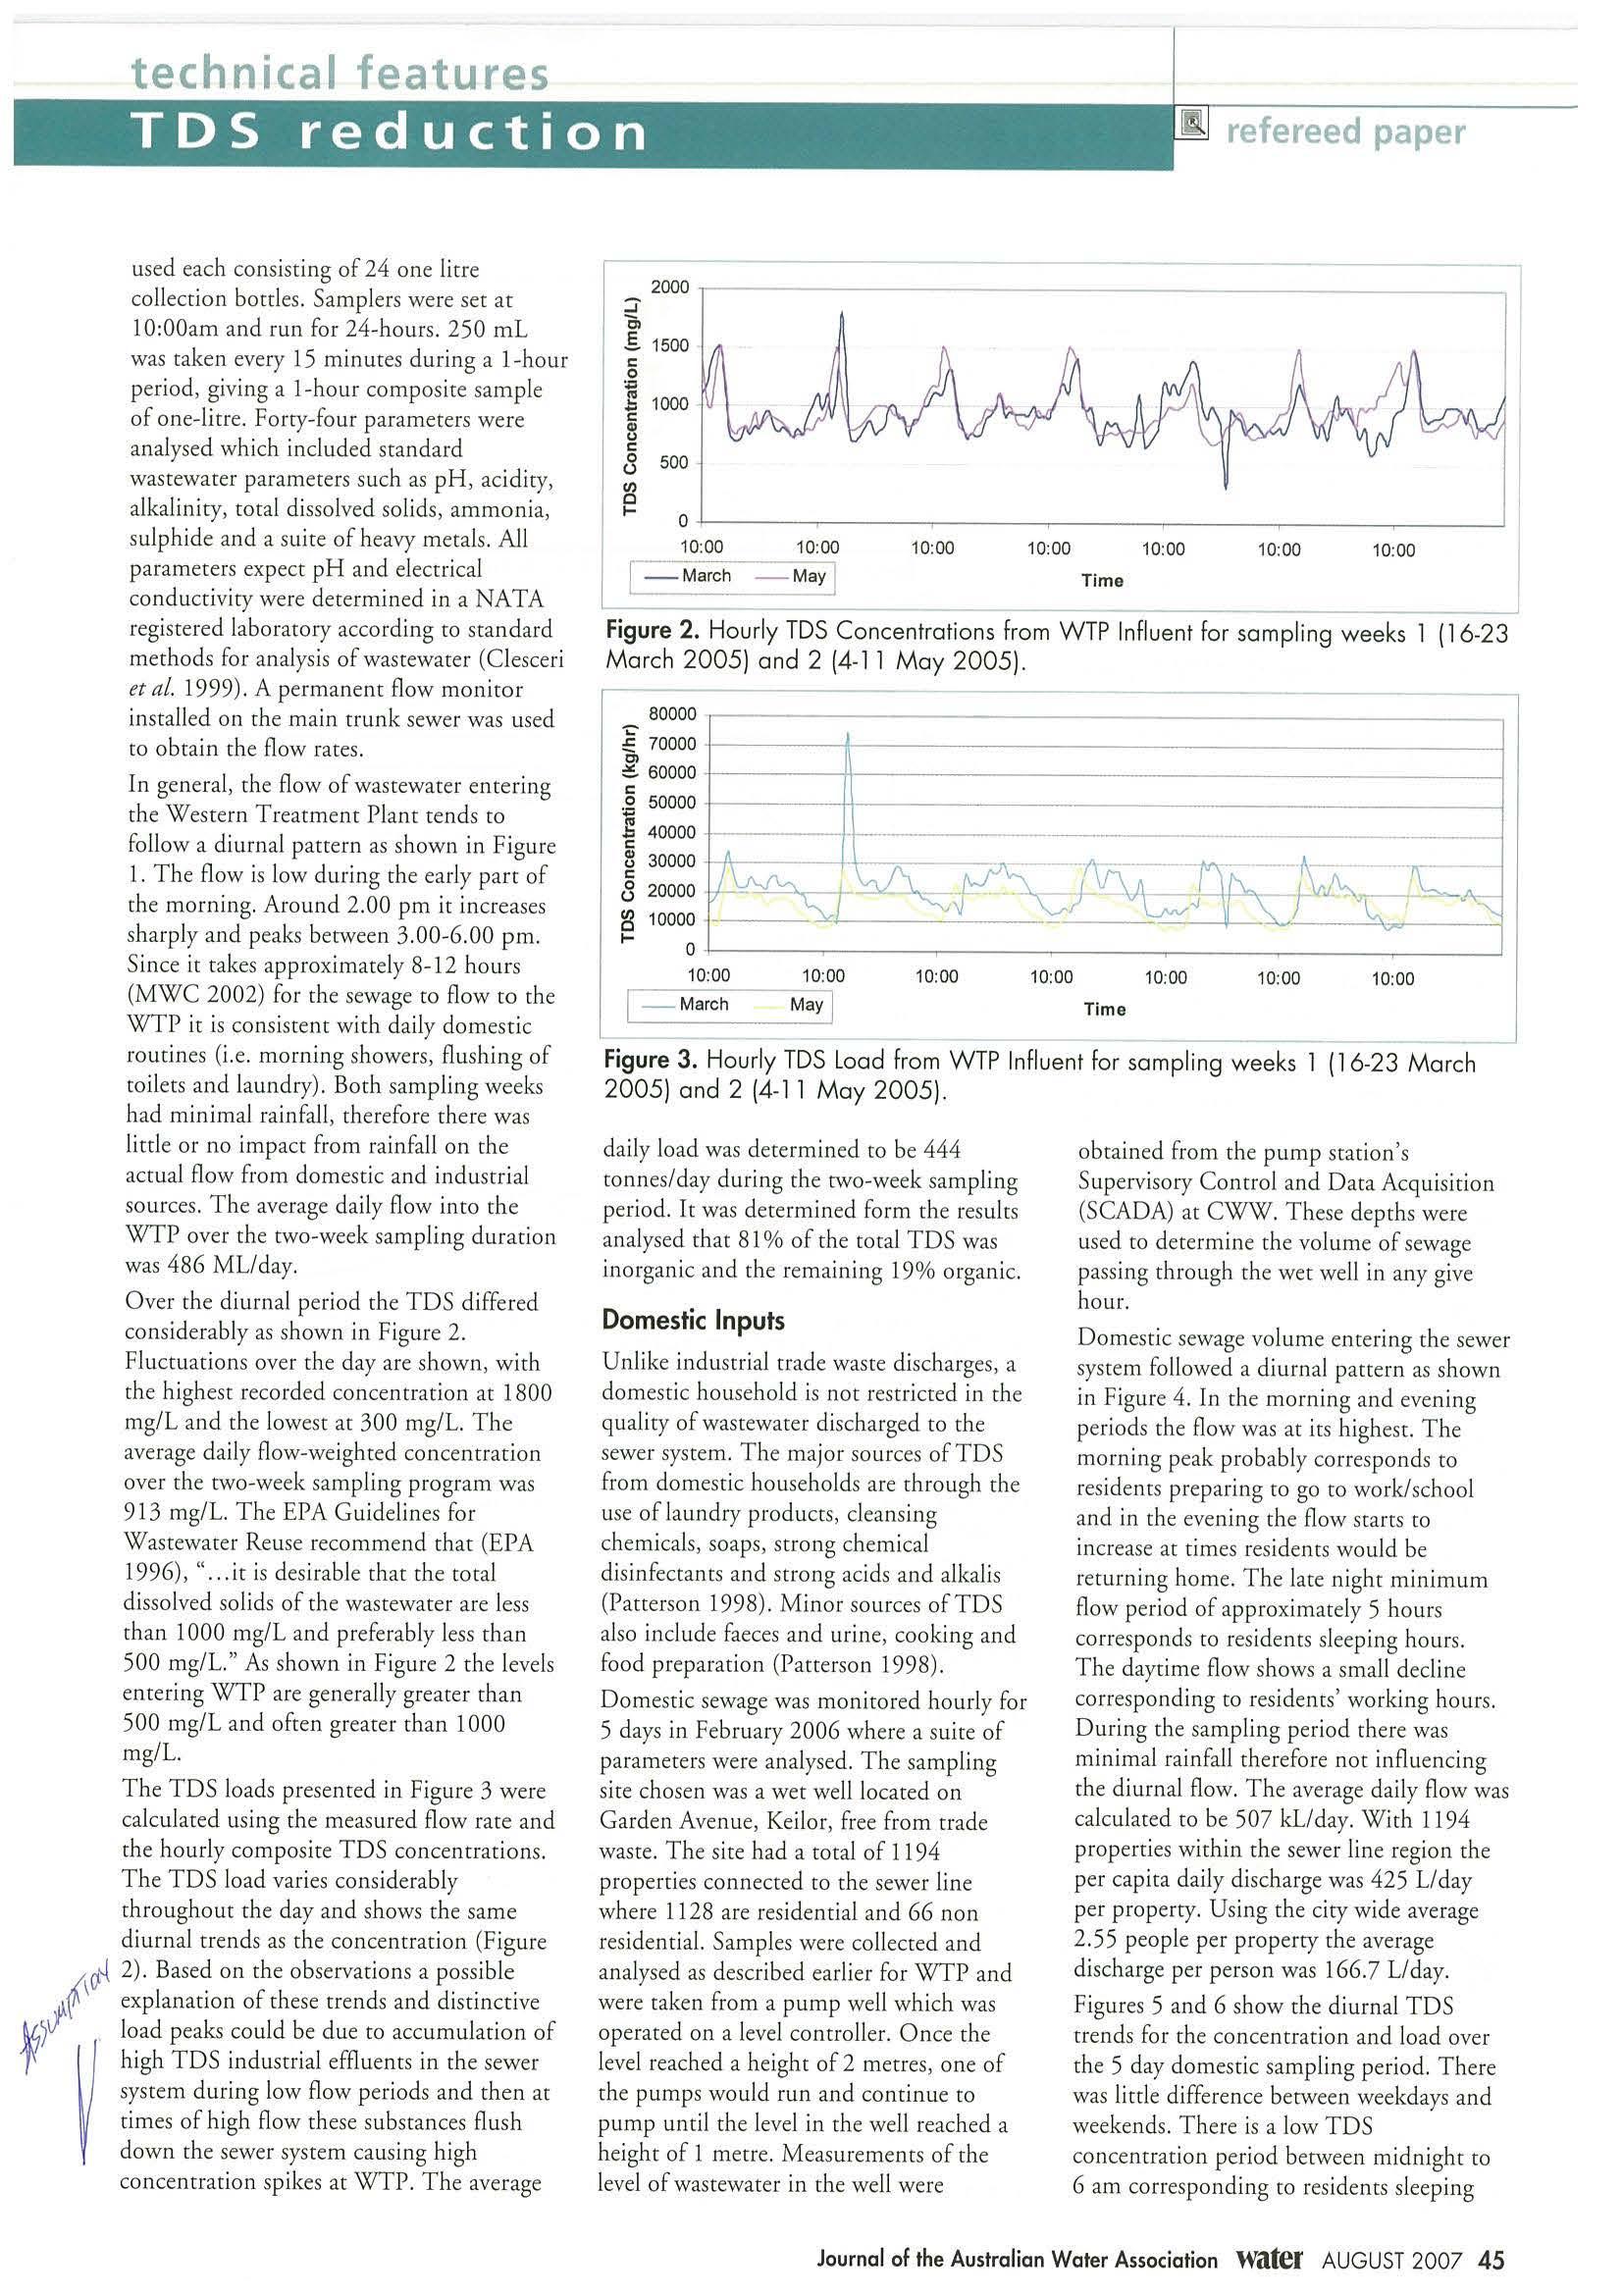
daily load was de t ermined to be 444 tonnes/day during the two-week sampl ing period. It was determ ined form the resu lts ana lysed chat 81 % of th e total TDS was inorga n ic and the rema ining 19% organic.
Domestic Inputs
U nlike industrial t rade waste d ischarges, a domestic ho use ho ld is not restricted in the qua lity of wastewater discharge d to che sewer system. T he major sources of TDS from domestic households are through the use of laund ry prod uces, cleansing chemicals , soaps, strong chemical d isi n fectants and strong acids and alkal is ( Patte rson 1998). Mino r so u rces ofTDS also includ e faeces and uri ne, coo king an d food preparation (Patterson 1998).
Domestic sewage was monitored hourly for 5 days in February 2006 where a su ite of parameters were analyse d The samp li ng site chosen was a wee well located o n Garden Aven ue, Ke ilor, free from trade waste. T he site had a total of 1194 properties connec t ed to che sewer line where 1128 are residential and 66 non residenc ial. Sam ples were co ll ected and ana lysed as described earlier for WTP and were taken from a pu mp we ll which was operated o n a leve l concroller. Once the level reached a heigh t of 2 met res, one of t he p u mps would run and continue co pump until the level in the we ll reac hed a height of 1 metre. Measurements of the level of wastewate r in the well we re
obtained from the pu mp station ' s Superviso ry Control an d Data Acquisition (SCADA) at CWW These depths were used co dete r mine th e volume of sewage passing through the wee well in any give hour.
Domest ic sewage vo lume entering the sewer system fo ll owed a diurnal pattern as show n in Figure 4. In the morning and eveni ng periods the flow was at its highest. The morning peak p ro bably corresponds co resi d ents preparing to go to work/school and in the even ing the flow st arts co increase at ti mes res idents wo u ld be returni ng home. The lace nigh t min imum flow period of approximate ly 5 hours corresponds co residents sleeping hours. The daytime fl ow shows a small decline cor responding to residents' wor king hours. During the sampling pe r iod there was minimal rainfaJI the refore not influencing the di u rnal flow. The average d aily fl ow was calculated co be 507 kl/day. With 1 194 properties with in th e sewer line region th e per cap ita dai ly discha rge was 425 L/day per pro perty. Usi ng the city wide average 2.5 5 people per property che average d ischarge per person was 166.7 L/ d ay.
Figures 5 an d 6 s how the di u rna l TDS tre nds for the concentration and load over t he 5 day domestic sampli ng period. There was little d ifference be t ween weekdays and weeke nd s. There is a low T DS concencracion period between midnight to 6 am correspond ing co residencs slee p ing
technical features
V,i)V
1
::, Cl .§. 1500 C 0 ., J;:: 1000 C :'l C 8 500 I10:00 10:00 refereed paper 10:00 10: 00 10:00 10:00 10:00 Tim e
80000 r------- ~"F 70000 1------1----------- ---------------j "' :!!.. 60000 +------+1--- ----------------------1 C o 50000 1 1-1! 40000 C 30000 C 8 20000 :g 10000 I- 01----------- - ------' 10:00 10:00 May ] 10:00 10:00 10:00 10:00 10:00 Tim e
Figure 2. Ho urly TDS Co nce ntrations fro m W TP Infl uent for sampling weeks l ( 16-23 Marc h 2005) an d 2 (4 - 1 1 May 2005).
Figure 3 . Hourly TDS Load fr o m W TP Infl uen t for sampling we eks l ( 16-23 Ma rch 2005 ) and 2 (4- 11 M ay 2005).
Journal of th e Australian Water Association Water AUGUST 2007 45
hours. The average daily flow-we ighte d concentration was 3 19 mg/L a nd average da il y l oad was 162 kg/day. The percen t age of inorganic and organic TD S i n th e domestic wastewater dete rmined from the results analyse d we re 72% inorganic a nd 28% o rga ni c.
The ave rage TDS load calc ul ated per resident ial prope rty in the sam pled area was 135 g/day. Based o n the load calcu lated per property in the sa mpled area, rimes rh e tota l of CWW res idential p ro p ertie s, the extrapolation est ima t es a di sc h a rge o f 37 to nn es/day ofTDS into th e WTP. Fi gure 7 illustrates rhe percentage o f CWW resi de nti a l TD S lo ad entering WTP, only 8 3% of th e total.
TDS Reduction Stra tegi es
Buffering
Trade waste indu stries ha ve spe cific discharge guid e lines. The a ll owab le pH discharge range is between pH val ues of 6 and 10. These dis charge limits were set to preve nt risks to the public, workers, sewer infrastructure and the e nvironment. In 1 995 the Trade Waste Acce ptance Advisory c ommittee (TWMC) reviewed t he c urrent discharge lim i ts to sewe r. In the abse n ce of a driver for c hange it was recommended that no change would be made (TWMC 1995). Th eoret ic a lly, broaden ing pH disc h a rge limits could increase the in-sewer evol ut ion of ammonia or h ydro gen sulphid e.
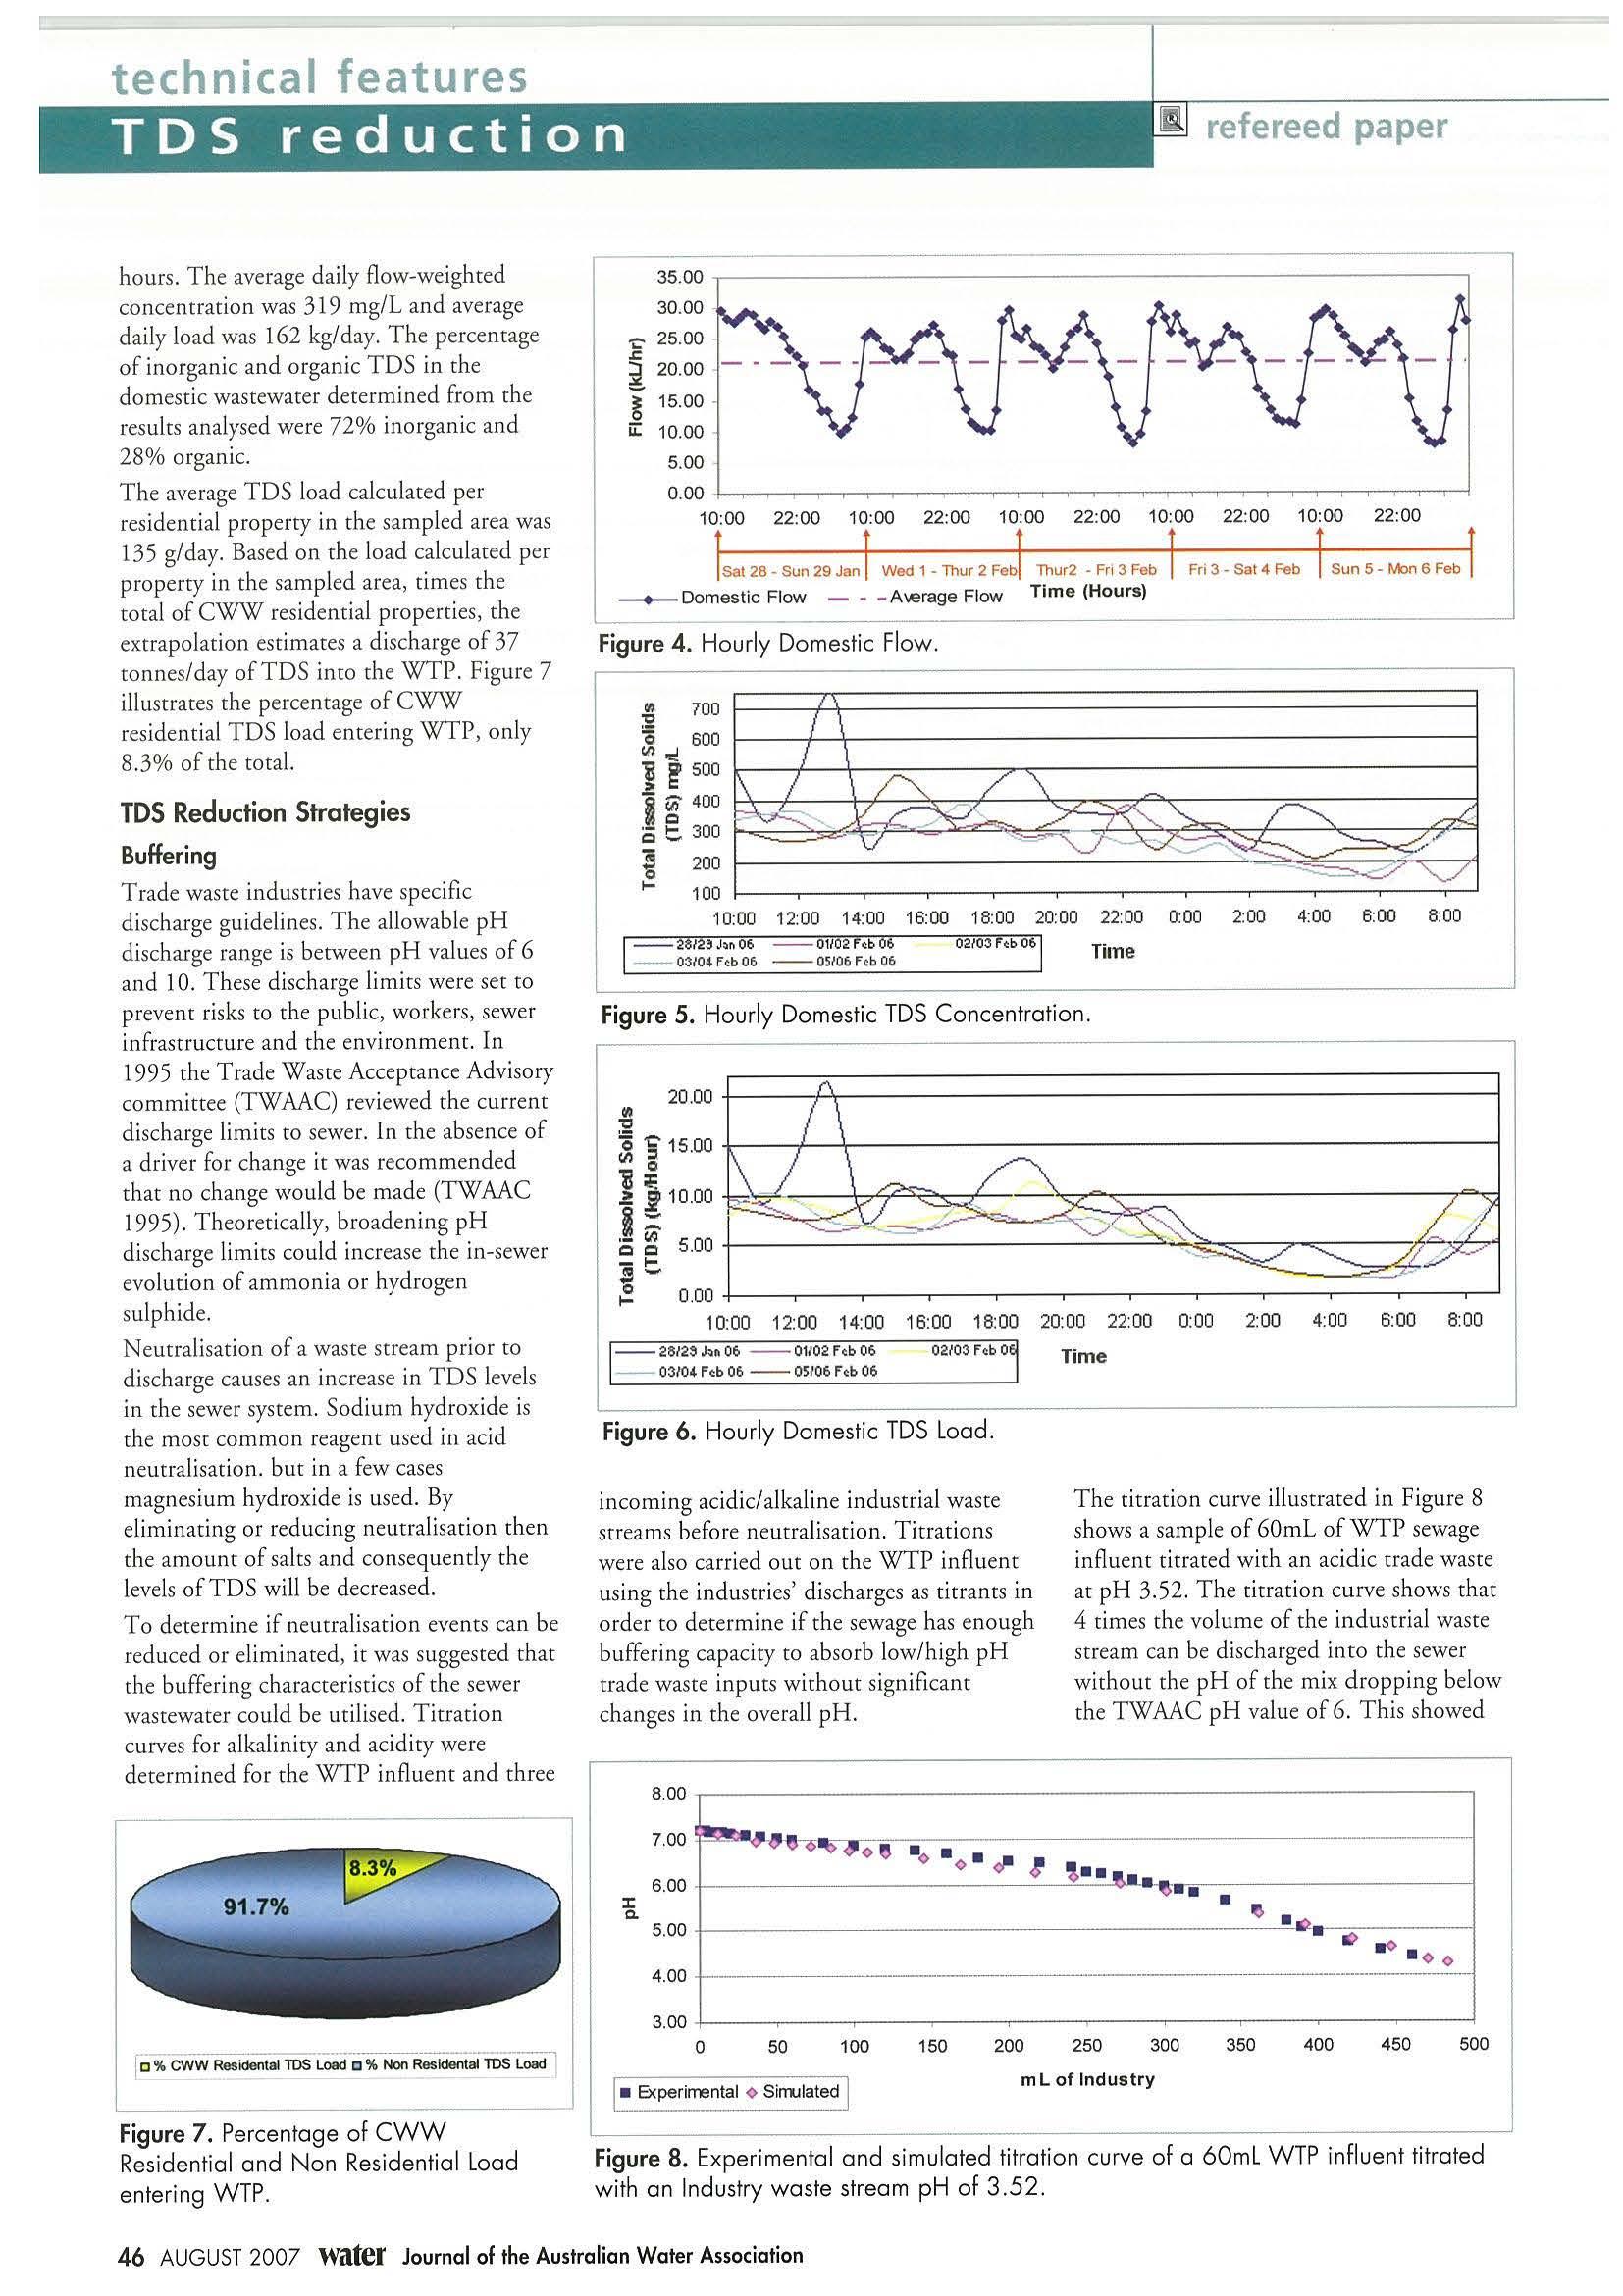
Ne u tralisati on of a waste strea m prior to discharge ca uses an increase in TDS levels in the sewer system Sod ium hydro x ide is t h e mos t common reagent used in aci d n eutralisation. bur in a few cases magnes ium hydro xide is used. By eliminating or reduci n g n e utralisation th en th e amount of sa lts and co nseque ntly the le vels ofTDS wi ll be dec rease d
To d ete rmin e if neutralisation even t s can be reduced or e limi nated, it was suggested char the buffering characteristi cs of the sewer wastewater could be util ised. Tit ration curves for alkalinity and acidity were d eter m ined for the WTP influent and th ree
incom i ng acidic/alkaline industrial wast e streams before neutra lisat ion. Ti rrarions were also carried our on t he W T P influent u sing the indu stries ' discha rges as ritrant s in order to determine if the sewage has e nough buffering capacit y to absorb low/high pH t rad e waste inpu t s witho u t significant cha nges in the ove rall pH.
The titration curve illust rated in Figure 8 s hows a sa mpl e of 60mL of WT P sewage influent t itrated with an acidic trade waste at pH 3.52 The t it rat ion cu rve shows that 4 rimes th e volume of the industrial waste strea m can be discharged into the sewe r without the p H of the mi x dropping be low th e TWMC pH va lu e of 6. This showed
features TDS
refereed paper
technical
reduction
C
"' cww Residoo lal TOS Load C "' Non Residootal TOS L~
W TP r 35 00 30.00 -;::- 25.00 r. 20.00 15.00 u:: 10.00 5 00 0.00 10 :00 22:00 10:00 22:00 10:00 22:00 10:00 22:00 10:00 22:00 sat 28 - Sun 29 Jan Woo 1 - Thur 2 Feb Thur2 - Fr, 3 Feb fr, 3 - Sat 4 Feb S un 5 - Mon 6 Feb --+-- Domest ic Flow - • - A-.erage Flow T ime (Ho u rs) Figu re 4. Hourly Domestic Flow. "' 700 :5! o 600 1----1--->.-------- -------------~ V) "' j 500 l en 400 1:3;::-:::_c---tr:::=~""/----',;;::;z:::s~"-s;:- 7 :::::::::- ---~ 0 300 t------==? ..z::;~:;=,:--.,,,,....::1c:2='>;=~ 200 I-------::::________::::::::_ _::::___::__:'.::::::;~~;:::::::;:::;.--:~ 1- 100 !------~------~------~--~-~--~~ 10:00 12:00 14:00 16:00 18:00 20:00 22:00 0: 00 2:00 4:00 6:00 8:00 02103 cb 06 Time Figure 5 H ou r ly Domes tic TD S Co ncentra tion. 20 .00 +---+1------ ----l "' "0 5 15.00 +----,'---+----- ---1 i~ J 10.00 ii ::: o s.oo +------- -------=c....,,.~~=---:r-s:: n'=-s~,-, -Ii1- 0.00 +--~ -----------~-~---,---~---_J 10:00 12:00 14:00 16: 00 18:00 20:00 22:00 0:00 2:00 4:00 6:00 8:00 - - 25/2~ J,• 06 Ot/02 F ,b 06 02103 F,b 0 03/04Fcb06 - - 05/06Fcb06 Figu re 6 . Hou rl y Dom e stic TD S Load.
Figure 7 Pe rce ntage o f CWW Reside nti a l and Non Residential Load en teri ng
8 .00 7.00 6.00 i~-~eo 1111> o e • o • o • ! :c Q. 5.00 4.00 3 00 0 50 100 150 200 Time
'!•• ·--v-• • -~ - p .o • o o 250 300 350 400 450 500 I• Experimental o Simulated j m L of Industry
46 AUGUST 2007 Water Journal of the Aust ralian Wate r Association
Figu re 8. Ex peri me nta l and sim ula ted ti tration curve of a 60m l W TP influent ti trated wi th a n Ind ustry was te str eam pH of 3 5 2.
th at th e sewe r syste m has the capaci ty to abso rb untreated aci d ic inputs wit h little ch a n ge in the overall sewer pH. Also shown in Figure 8 is a si mu late d t itrat io n curve to ge t h e r w ith the actual ex p erim ental titration curve of industry wa stewa t er into the average WTP influent. The sim u la ted titrat ion curve was calcul at ed from the individual ac id i ty/alkalinity t i tratio n curves of t h e WTP influe nt and th e ind u stry waste st rea m p r ior to ne u tra lisation an d s u bsequent discharge T h e ex p er i m ental an d s imulated c u rves closely fo ll ow t h e sa me trend w h ich d emon strates th at t he mod e l ca n be u sed to m a nage indu st rial d isc harge co nd i tions for untreated was t ewa t er while maintai n ing sewe r p H leve ls. This ex p er im ent was b ased on the ch a racter isti cs of the influent from WTP Ir s hould b e n oted , h owever, that the characte r ist ics o f i ndiv idual sewe rs from in d u st rial zo n es through out Mel b ourn e's Western Sewage Sys te m are c u r rently u n k n ow n. T he refore, f urth er da t a at different rimes of th e day and differe n t day s of t h e week is requ ired.
Diversion
Ano th er poss ib le stra t egy fo r the reduction of TD S is t he d iversion o f th e sewage flo w at WTP at the h ig hest TDS per iods. As shown in Figure 9 t h ere is a di sti nctive peak of h igh TDS lo ad an d t he majo r inorgani c ions during t h e mi d to la t e afternoon.
During the 15 0 0 co 18.00 p e r iod a n ave rage of 22% of dail y TD S loads was re co rded dur ing the two wee k sa m p ling period.
A dive rsio n strategy at WTP co a s uit a bl e sac ri fi cial la n d s it e, or to a separate lago o n syste m , cou ld res u lt in a s ign ificant re du ction in t he TDS of trea t ed effl uent sc h ed uled for re- use. Onli n e monitori n g of elec t ri cal co nduct ivi ty (EC) co ul d b e us e d to d ete rmi ne h ig h a nd low TDS fl ows a nd be used co manage th e d ive rsion. In a ddit io n, i ndustri es wit h high T D S di sc h arges co ul d be reg ulated co di scha rge at ce rtain rim es thus en h a ncing th e percentage
of TDS occ u rring during the peak period furth er reducing the final T D S load in re cycled wate r.
Conclusion
T h e s uitabil i ty of wastewa t er reuse o ptio ns nor on ly depends on economic factors, locatio n a nd volume ava i lable, but m ore importan tl y on th e chemi c al and b iological p ro p e rtie s in the was tewater. C urr en tl y the reuse of efflue nt at WTP is restr icted by the hi g h TDS leve ls especially sodi um salts present in th e wastewater.
T h e re su lts presen t ed in this paper show that the average d a il y TDS fl ow- we ighted concent ration at WTP was 9 13 mg/La nd the average d ai ly TDS load was 444 tonnes/ d ay ove r the two sa mpl i ng p e r iods . The domestic average daily TDS flo w-we ighted conce ntrat io n was 319 m g/ L a nd th e average daily TDS load from a sa mple catc h ment w as 162 kg/day over the sampl in g p e r iod. Thi s ext rapolates to a to tal for h ouse holds i n the CWW res ident ia l are a of abou t 37 tonnes/d ay o f TDS.
Two s trateg ies have been desc rib ed to redu ce th e a m ou nt ofTDS i n the in fl uent a t WTP The m od el use d co genera t e the s imu lat ion descr ib ed abo ve has th e po t en t ial to m a nage industrial di sc har ge condit io ns for wastewater w ith o u t si g nifi ca nt c ha nge to the overall sewer p H. By a l tering the p H discharge limits trad e waste custo mers co u ld red u ce the amount of n eut ral isat ion ch e m ica ls used t o correct the p H , thu s red uc in g the amo u nt ofTDS ente ring th e sewer syste m. The d ivers io n s t rategy a t WTP cou ld be further i nv es t igated as e i ther a sho rt-t erm red u c ti o n o pt io n unti l oc her T DS red uc t ion m easu res at sou rce b egin co rake effect, or even a permanent sys t e m .
Acknowledgments
We would like co t h a n k the conti n u o us su pport from C i ty West Wate r , th e Sc h oo l of Applied Sciences RMIT a nd Melbourne Water.
T h is proj ect was undertaken as a Ph D st udy, o n e of a number of stud e nt pro j ects
invo lving the Memorandum of Un d erstanding between RMIT University and City West Water. Refer co Meehan, B (2 00 5) Water 3 1, No 8, December 2005, pp 31 - 34
The Authors
Trisha R Ibrahim is a PhD st udent under Associate Professor Barry Meehan and Dr Peter Carpenter a t the School of A p p lied Sc iences, RMIT University, GPO Box 247 Mel b ourne 3001 A ustrali a, t r isha.Ib rah im @r m ic.edu au, barry m ee h an@r mit. ed u au, perer.carpenter@rmit.ed u. au Nigel Corby is C leaner Prod u ct ion Consu l tant a t City Wes t Wa t er, Loc ked Bag 350, Su nshi ne 3 0 20 Austra l ia, ncorby@cirywestwarer. com .au.
References
AB S. (2004- 05). Regional Population Growth Australia (32 18.0 ) Canberra: Au stra lian Bureau of Statistics.
Clesce r i, L. S., A. E. Green b erg, and A D. Eaton (ed.) 1999. Sta ndard metho d s fo r the exam in ation of water and wastewater, 20th ed American Pu bli c H ealt h Associa t ion, Wash ington, D.C.
DSE. (2003). Green Paper/or Discussion: Securing our Water Future Ease Mel bou rne (VI C): Depar t ment of Susta inability and E n viron m ent.
DSE. (2 004 ) Victorian Government White Paper: Securing our Water Future Together. East Melb ourne (VIC) : D ep artm ent of Sustainability a n d Environment.
EPA. (1996). Guidelines for Wastewater Reuse: Publication 464: Environment Protectio n Autho r ity Victoria.
MWC. (2 002). Western Treatment Explorer. Melbou rn e (VIC) : Mel b ourne Water Corpora t ion www.melbournewater.com.au
MWC. (Novembe r 2003). Environment Improvement Plan, Western Treatment Plant. M e lbourne (VIC): Melbourn e Water Corporatio n
MWC. (2003) Recycled Water Handbook. Melbo u rne (VI C) : Me lbou rn e Water Corp orat ion.
Patterson , R .A. 1998. Ho usehold Solut ions to End-of-line Re-use Problems In Proceedings 11 t I nternational Wate r Services Associa t ion - As ia Pacific Regio n al Conference " I ntegrat ing the Urban Water Cycle" Sydney. 1st- 5th Nove m ber, 1998 pp 578-585.
Poon, P., K. Keegan, et al. (Se ptember 2006) "UV Di sinfection for Class A Water Recycling." Water: 56-60.
TWAAC. ( 1995 ). Recommendations on Temperatttre and p H for Trade Waste
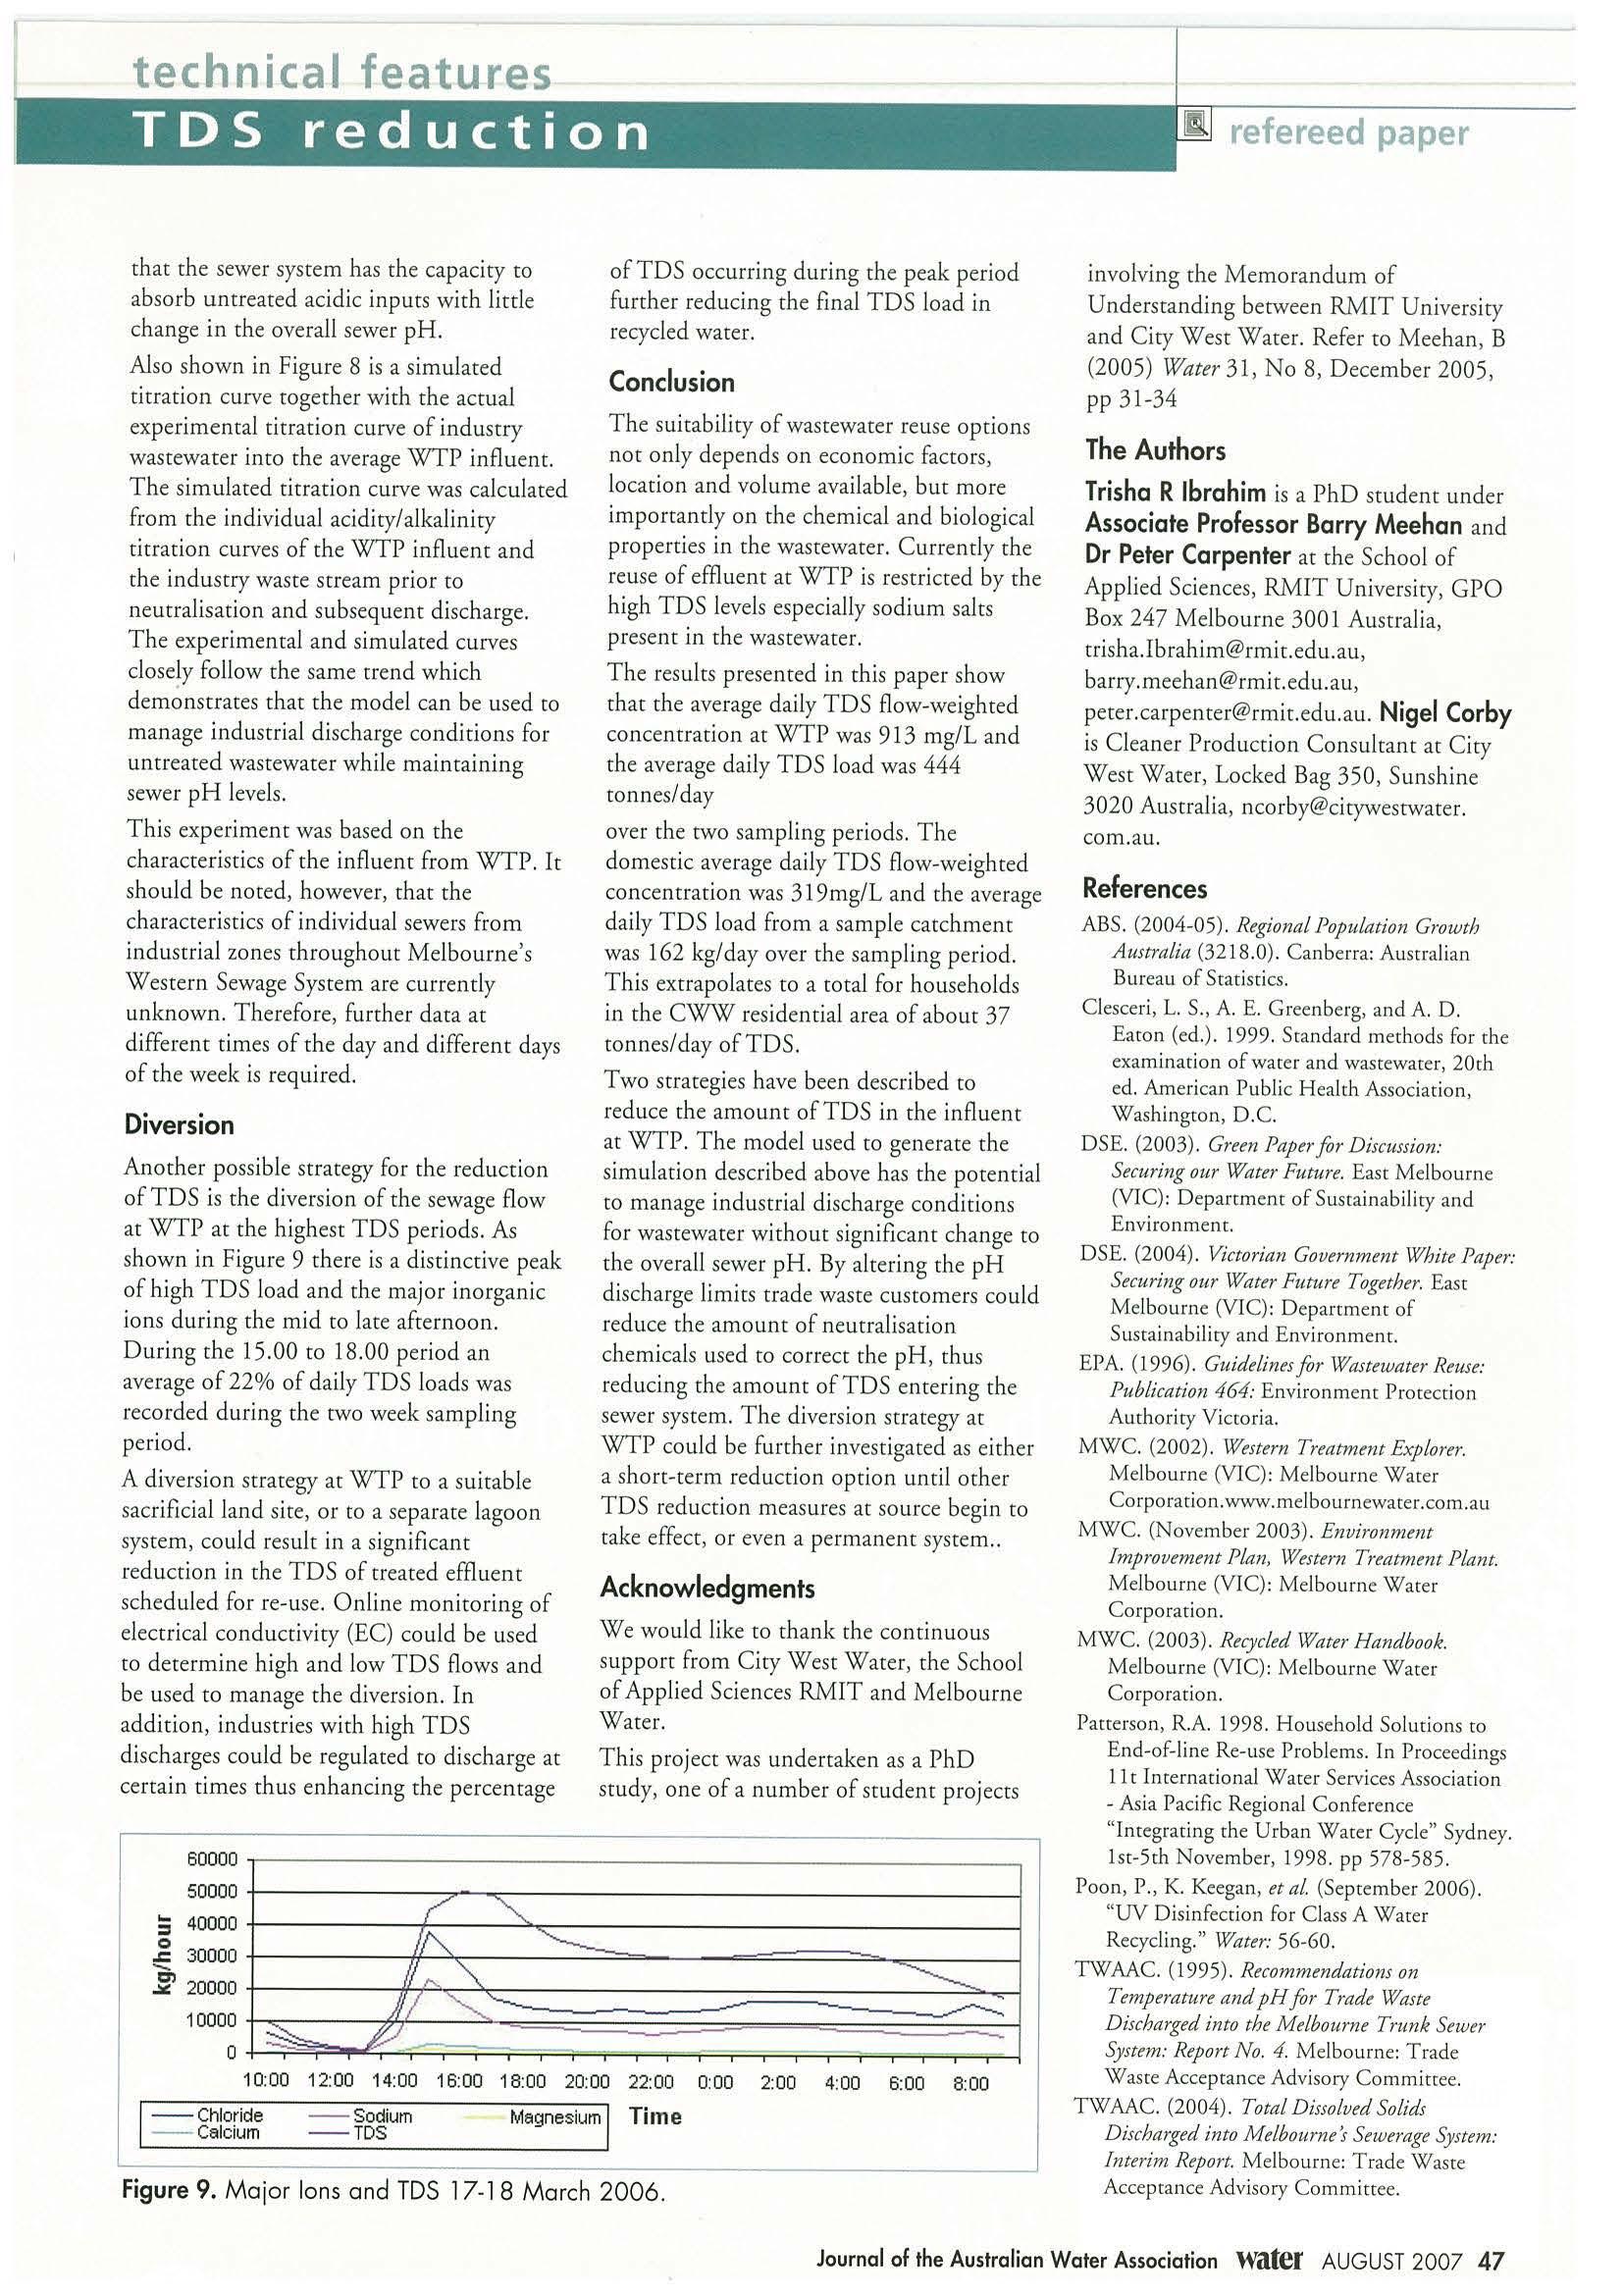
Discharged into the M elbo11rne Trunk Sewer System: Rep ott No. 4. Melbourne : T rade Wasre Acceptance Advisory Commi ttee.
TWAAC. (2004) Total Dissolved Solids
Discharged into Melbo11rne's Sewerage System: Interim Rep ort. Melbourne: Trad e Waste Acceptance Adv isory Committee.
technical features
60000 -------------------------------, 50 000 +-------...,...-~---------------------l :i 4 0000 +- -f __,...,,,.- - --l ,E 30000 +-- -ll-_::,..--____::::::=~ --~=====........,,,- - -1 20000 1000 0 0 .j....::;,:§~~~~;=;:=:r=-;;=;==;;==;F=,-=-=,;==,c==,c==,c~==,-=-;-=-;-=-;-....j 10:00 12: 00 14:00 16:00 18:00 20:00 22 :00 0:00 2:0 0 4:00 6: 00 8:00 --Chloride Calcium Sodium - TDS Magnesium Time
1
Figure 9. Ma jo r Io ns and TDS 17-
8 March 2006.
Journal of the Australian Water Association Water AUGUST 2007 47

Water Technologies
Closing the door on wasted water
Si emens is putting was tewater back to work to secure the water future o f our co mmunity and industry With innovat i ve recyc l ing technologies t h at he lp convert wastewater i n to u sable water, you can close the door on money and re sources flushed down the drain.
Our Memco r ultrafiltration memb rane systems play a v ital role in purifying was te water across Australia. Ou r ins tal l ed base has the capacity to fi l l Sydney harbour within three years with purified water. When yo u are looking for smarter solutions fo r your water qual ity chal len ges, look t o Siemens - home to the world's most respected names in wate r technology like Memco r, Wallace & Tiernan , Envirex, Davis, Zimpro and more.
Siemens. Taking care of the wor ld 's water. And yours
www.siemens.eom.au/water
SIEMENS
PRESSURE SEWERAGE SYSTEMS Seminar,
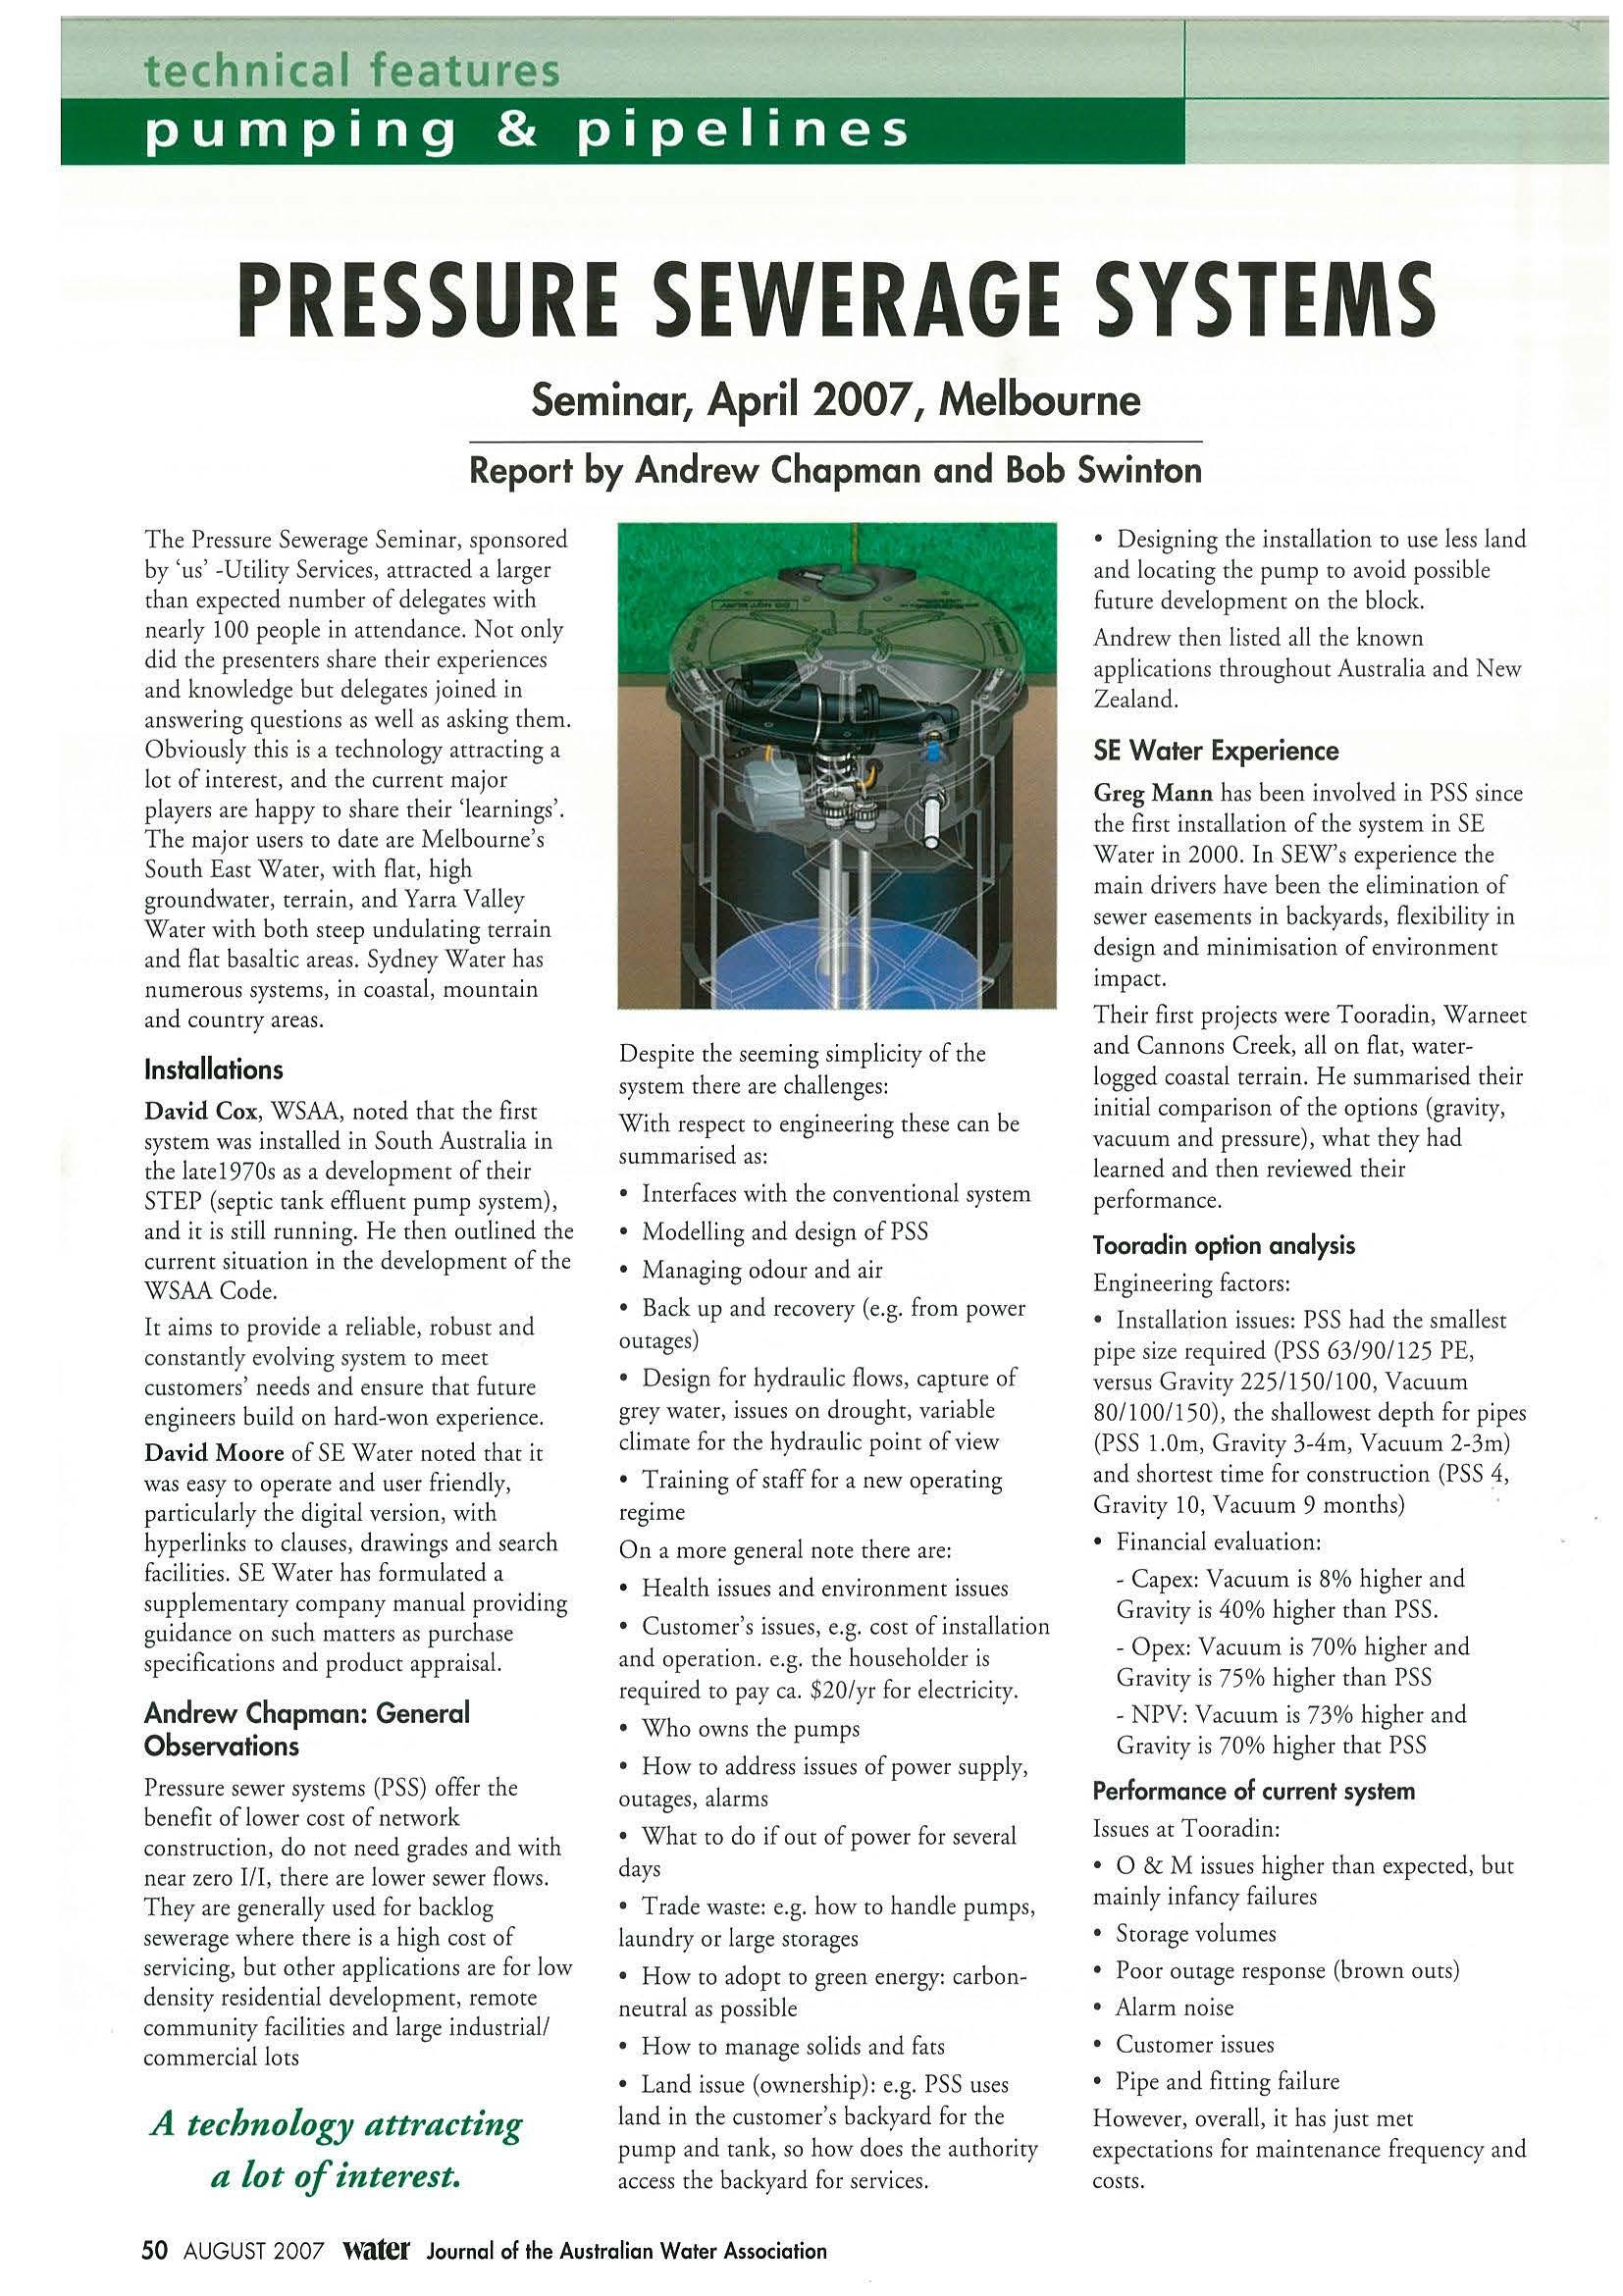
April 2007, Melbourne
Report by Andrew Chapman and Bob Swinton
The P ressu re Sewerage Seminar, sponsored by ' us' -Util ity Services, attracted a large r th an expected number of delegates w ith nearly 100 people in attenda n ce. Nor only did th e p resenters share their experiences and knowledge bur delegates j oined in answering questions as well as aski ng them. O bvio usly ch is is a technology attracting a lot of interest, and rhe cur rent major playe rs are happy to share the ir 'learn ings'. The major users to dare are Mel bourne's So uth East Water, with fla t , high groundwater, terrain, and Yarra Valley Water w i th both steep undulating ter rain and fl at basal tic areas. Sydney Water has num erous systems, in coasta l, mounta in and country areas.
Installations
David Cox, WSAA, noted char rhe first sys t em was insta ll ed in South Austra lia in the lare l 970s as a development of their STEP (sept ic rank effluent pump system), and ir is still running. He then outlined the current situation in the developme nt of the WSAACode.
It aims to provide a reliable, robust and constantly evolving system to meet customers' needs and ensure that future en gi n eers build on hard -won ex p e rience. David Moore of SE Water noted that it was eas y to operate and user friendly, particula rl y the digita l versi on , with hyperlinks to clauses, drawings and searc h faci lities. SE Water has formulated a supp lementa ry company manual providing gui dan ce on s uch matters as purchase specificat ions and product appraisa l.
Andrew Chapman: General Observations
Pressu re sewer systems (P SS) offer rhe benefit of lower cost of network constructio n, do not need grades a nd with n ear zero I/I, there are lower sewer fl ows. Th ey are gene rally used for b acklog sewerage w her e there is a high cost of servici ng, but other app lications are for low density residential development, remote community faci lities and large industrial/ commercial lots
A technology attracting a lot of interest.
Despite the see ming simplici ty of t he system rhere are challenges: With respect to engineering these can be summa ri sed as:
• I nterfaces with the conventional system
• Mode llin g and design of PSS
• Ma n aging odour and ai r
• Back up and recove ry (e.g. from power outages)
• Design for hydra uli c flows, captu re of grey water, issues on drought, variab le climate for the hydraulic p o int of view
• Train in g of staff for a new o peratin g reg i me
On a more genera l note there a re :
• H ealrh issues and environment issues
• Customer's issues, e.g. cost of installation and operation e.g. rhe householder is required to pay ca. $20/yr for electricity.
• Who owns the pumps
• H ow to address issues of power supply, outages, a larms
• What to do if our of power for several days
• Trade waste: e.g. how to h a ndl e pumps, laundry or large storages
• How co a dopt to gree n energy: carbonneut ra l as possible
• How to manage solids an d fats
• Land issue (ownership) : e.g. PSS uses land in the custo m er 's backyard fo r the pump and rank, so how does the authority access the backyard for services.
• Designing the ins t allation to use less land a nd locating the p ump t o avoid possi ble fu tu re d evelopme n t on the block.
Andrew then listed a ll the known app li ca t ions throug h out Australia and New Zealand.
SE Water Experience
Greg Mann has been involved in PSS si n ce the first install ation of the system in SE Water in 2000. In SEW's ex perience the ma in drivers have been the elimination of sewer easements in backyards, flexibility in design and minimisation of env ironment impact.
The ir first projects were Tooradin, Warneet and Cannons Creek, all on fla t , waterlogged coastal terrain. He summari sed their ini t ial comparison of the options (gravity, vacu um a nd p ressure), what the y h ad learned and then reviewed their performance.
Tooradin option analysis
Engineering factors:
• I nsta ll ation issues: PSS had the smallest pipe size required (PSS 63/90/125 PE , versus Gravity 225/150/1 00 , Vacuum 80/100/ 1 50), the shallowest depth for pipes (P SS I.Om, Gravi ty 3 -4 m, Vac u um 2-3m) and s hortest time for construct ion (PSS 4, Gravity 10, Vacuum 9 months)
• Financial eva lua t ion:
- Ca pex : Vacuum is 8% hi gher and Gravity is 40% higher than PSS.
- Opex: Vacuum is 70% higher and Grav i ty is 75% higher than PSS
- NPV: Vacu um is 73% higher and Gravity is 70% higher that PSS
Performance of current system
Issues at T ooradi n:
• 0 & M issues higher than expected, but mainly infancy failures
• Storage vol umes
• Poor outage response (brown ou ts)
• A larm noise
• Customer issues
• Pipe and fitting fai lur e However, overa ll, it has just met expectations for maintenance frequency and costs.
technical features pumping
& pipelines
50 AUGUST 2007 Water Journal of the Australian Water Association
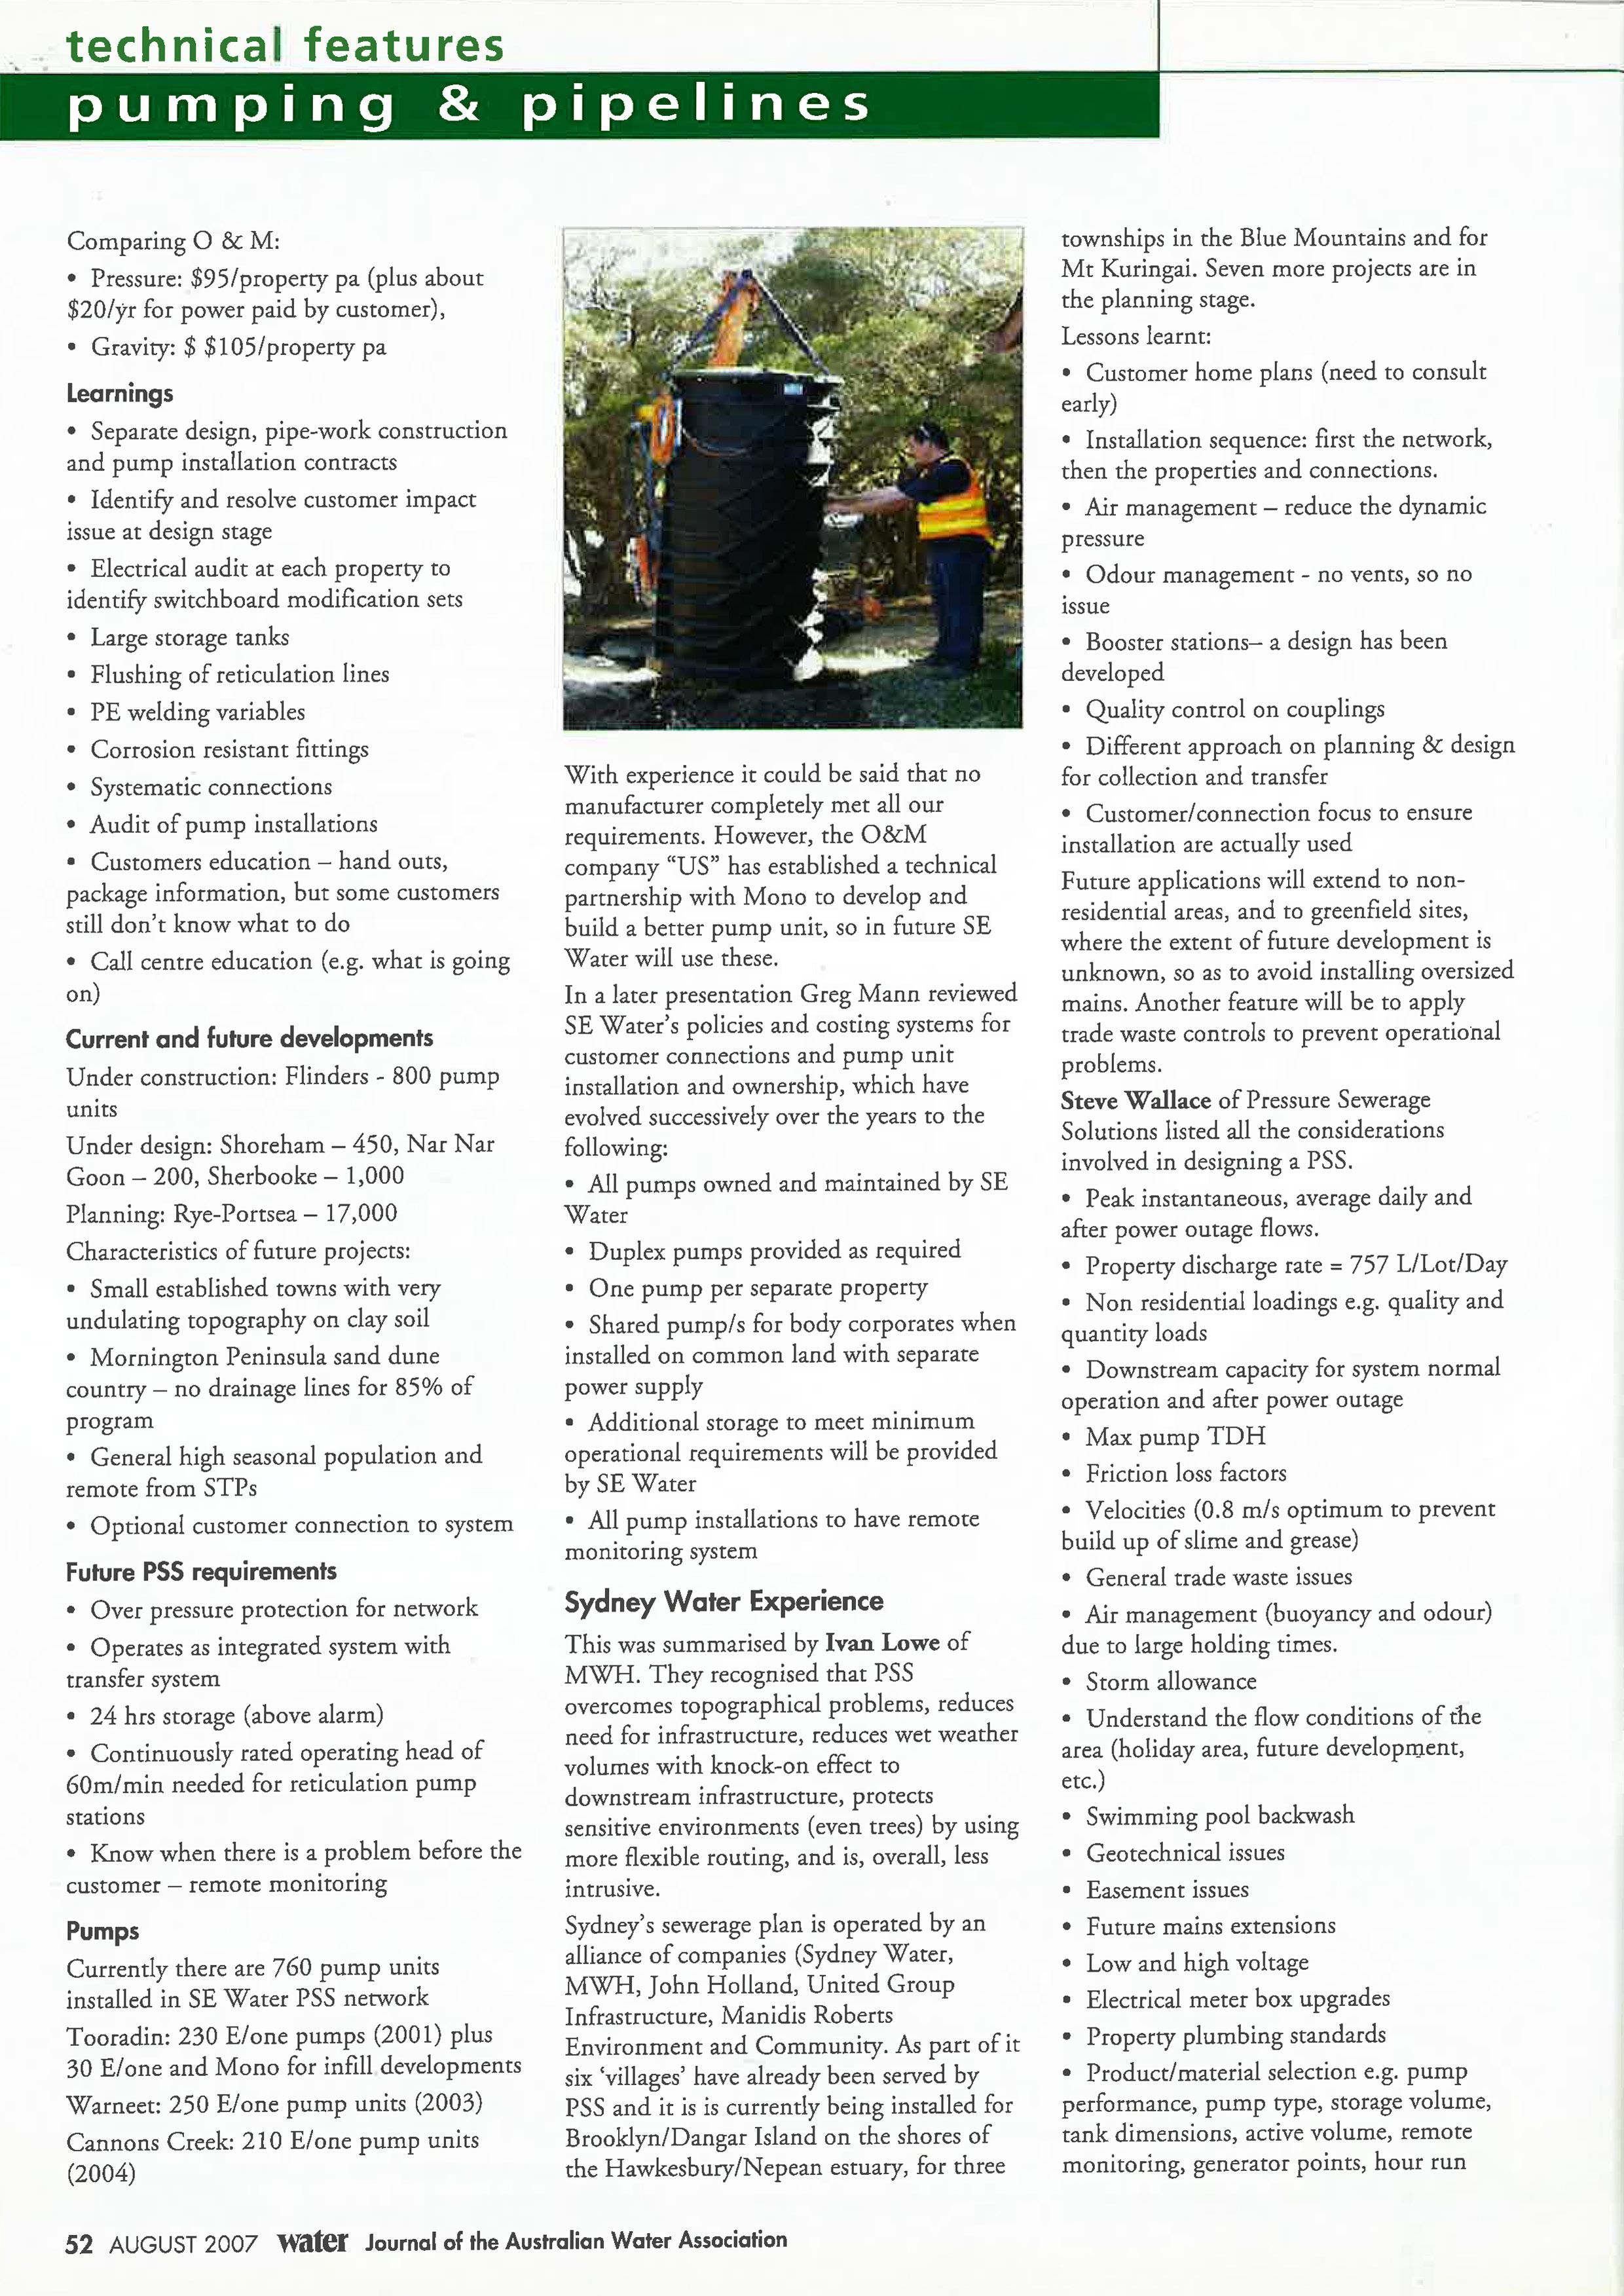
Big on Performance, Big on Specifications. Meet the
New Goulds GSC
Series Split Case.
The Goulds GSC Series Split Case pumps are of hor i zo n tal double suction design offering numerous design features to meet the needs of today's challenging pumping app li cat ions
These pumps cover an impressive performance range with flows up to 1800m3/ hr and heads to 150m prov i ding a wider solut ion for pumping app li cations
Using the latest 3 - D CAD and Flu i d Dynamics computing in their design, the Goulds GSC offers many advanced features - high efficienc i es , low pulsation impellers , low NPSHr, rugged construction, compact footprint, replaceable wear rings and shaft sleeves, robust bearings and shaft , with options on sealing, flanges, materials and drive from ei the r side
The Goulds GSC is an ideal selection for clean water pumping applicat i ons in water supp ly, agriculture , bu ilding services, general commercial industry and fire fighting
www.i tt.com
Lowara and Goulds Master Distributors : Victoria & Tasmania
Brown Brothers Eng i neers
(03) 9793 9999
New South Wales
Bro w n Brothers Engineers
( 0 2) 9761 3666
Sth Aust & Nthn Territory
WBS Pump
( 08 ) 8344 9927
Queensland
Bro w n Brothers Enginee rs
(0 7) 3200 6488
Western Australia
Applied Pump Te c hnolog i es
(08) 9451 3800
New Zealand
Bro w n Brothers Engineers
64 (3 ) 365 0279
~ GOULDS PUMPS
The " ITT Enoi~ Blocks" svmbot: and "'Encun ttred for life"' are reofStered tr~ Jlcs of ITT lndustnes C 2006 ITT Engineered for life
meter, time delay relay on alarm circuit, trafficable location , vandal resistance, flashing light, stator selec tion
• Design tools for prope rty audits, customer managem e nt and database system, street main se touts, hydra ulic analysis software, servi ce hi story database, after PC service s tru c ture
• Project m anagem e nt & d es ign s kill s are differe nt from gravity sewe rage sys tem eng in ee ring, e.g. i nten sive co mmunity interface for on-property works is esse ntial
• Establishment of co rr ect loading parameters is esse ntial
• T h e hyd raulic analys is mu se be d eveloped for the syste m parameters . DON'T use a generic solution. Australian and US co nditions are differe nt and therefore design parameters mu st be different
• Understanding of how a press ure sewer system actual ly perform s and where the performance boundaries real ly are is viral d a ta to feed into the design process.
In summary the main point made was char each s ituation is unique and rh e des ig ner mus t d etermin e whether press ure sewer actually is the right solution.
He was backed up by Steven French of SE Water, who stated that PSS has some lim itations and risks which n eed co be carefully addressed during planning/design. His very d etailed presentation covered hydraulic modell ing, flow and pressure profiles , selection of the correct pump and co ntrol systems, downstream infrastructure su ch as bypasses, booster sta t ion wells, and em ergen cy valve place ment. He noted that si multaneous recove ry after a power outage could lead to instantan eous overload , both electrical and h ydraulic One solution was to install different timers on individual pumps to stagger their re-scares
Normal Flows Vs Power Outage Recovery
Shem Macdonald ofYarra Valley wate r has been involved with a large gre e n-fields devel opment o n a flat basaltic area north of Melbourne.
H e di sc ussed what benefits, if an y, there were for lo oping in press ure sewe r networks. The following we re observations m ade , u sing a hydraulic modelling e xample : Benefits of loo ping:
• Greater scope to reduce pipe sizespossible CAPEX reductions
• Greater operational flexibility - can divert flows following bursts or blockages
• Lower maximum and average system pressures
• Energy sav ings as less h ead pumped
• Life ex pectancy of pump possibly increased?
Disadvantages of looping:
• Two way flows?
• May lead to accumulation of fats/sediment in low flow sections of pipe ?
• Longer detention tim es
• Additional costs -shut valves, loop pip e lengths
In summ ary, a case b y case assess me nt was strongl y reco mm end ed. W hat ma y work for o ne area may not necessar ily wo rk for ano ther.
Steven Theodorlis of MWH focused on the modelling process, making a n interesting point in the adv antages and di sadv a nt ages of ap plyi ng water modelling software in co mparison to sewe r mod e lling software
Water modelling packages a re adequate for press ure sewer, as the y are fast, an d provide robu st results for press ure sewe r sys te ms a nd pump operation. Howeve r, water modelling pac kages ca n ' t model gravity co mponents, or inflow/ infiltration
Sewer/Drainage hydraulic modelling packages do a llow fo r i nflow/ infilrracion; ho wever, they are generally slo we r, subject co instabilities.
In s ummary, if press ure sewer sys t em s and comb ined systems (combined gravity and pressure) become a more feasible option in the future and become more popular, a modelling package which can cate r for chis would be h ighl y recommended.
Pump Units
Currently there are three m ajo r s uppli ers:
• E-One
• Aquacech (Barnes Pumps)
• Mono
With the expansion o f the marke t , not onl y in Australia but overseas, th ey are all developing better sys tems Locall y, Mono Pumps Au s tralia hav e had the benefit of th e partnershi p with US (U tili ty Services) and Steve Watt, Mono Austral ia Eng i neering Manager, outlined th e d erail s of the control systems which have bee n cooperatively d es igned .
Press ure protection is needed since pumps are capable of producing press ure a bove the ratings of piping and equ ipme nt. Mono has chosen " Current Se nsi n g" over other pump protection m ethod s, such as thermal overload, press ure se nsor, high slip pump. Ir has the advantages of being simple, cost effective, can be integrated to the controller and has proportional control. The senso r is not exposed to sewerage, and it also
provid es motor protect ion. Th e di sadvantages a re che n eed for repeatable pump p erforman ce, but Mono pumps provid e chat consistently.
The sys tem has been i ntegrated wi th a diagnos t ic unit so chat the press ure cur-off p oi nt can eas il y be adjusted. In event of a trip, the pump rema i ns off for five minutes, then cries aga in
Operation and Maintenance
Gary Grogan (S E Water) backed up by a DVD from 'US', summari sed their major iss ue s over the p ast five yea rs.
Maintenan ce iss ues relate to blockages, motor asse mblies, power suppli es and vandalism but overall there have been relatively few issues with PSS system. Most were infancy issues. The introdu ction of th e P SS has res ulted in operation c rews requiring training i n mechanical an d electrical components of the network and che requirement of carrying more equipment to b e able to carry out required re medial works. (US has built a specially equi pped ve hicl e co deal with PSS rather than co nv entional sewer m ai ntenance)
The key message was to reduce the customer interface as mu c h as poss ible with the u se of telemetry and t h e need to educate c usto mers and call cen tre staff. They ex perie n ce man y 'false alarms, particularly afte r pow er outages, so If a customer phones they ask the customer co wait for one-two hours and co phone in again if th e problem persi sts
Th e inclusion of 24 hour storage on each property h as ena bled SE Water co m an age res ponse times and contain mo st co business hours.
Educating staff ha s enabled more information co be p asse d on che customer and ther efore rather than sending a crew our immediately once an alarm is ac tivat ed we can work with the customers ro determine the reason for t he alarm activating and wh eth e r o r not we are required on-site immediately or if the call o ut can wait for a more suitable tim e
Conclusion
As discu ssed above, this is another option for sewerage, which s hould be considered, particularly for waterlogged terrain, steep terrain, environmentally sensitive sites and greenfield developments with unknown potential. Ir is applicable for backlog and infill. It h as its own problems but the WSM Code is endeavouring to systematise design .
technical features
54 AUGUST 2007 water Journal of the Australian Water Association
IMPROVED CYTOTOXICITY TESTING OF PRODUCTS IN CONTACT WITH DRINKING WATER
S Fanok , S Froscio, A Humpage
Abstract
The A ustralian Wate r Qual ity Centre (AWQC) routinely conducts resting in accordance with Australian and New Zealand Standard 4020 'Testing of products for use in co ntact with drinking water'. Cyroroxicity resting is included as part of the Sta nd ard to determine if product extract waters exert detrimental effects against mammalian cells. In thi s study the MIT (-(4, 5 d imeth ylthiazol-2yl]-2, 5-diphenyltecrazolium bromide) assay was evaluated as a quantitative alternative ro microscopy evaluation of cytotoxic results. A good correlation was obtained for analysis of product extract waters by t he rwo methods, with the MIT assay
providing additional certainty for the classification of borderline cytotoxic samples. As a res ult of the data presented rhe Australian Standard was amended in 2005 (AS/NZS 4020:2005) to include the quantitat ive MIT assay format. Use of a new positive control, ni ckel nitrate, was also recommended.
Introduction
Evaluation of a product's suitabi lity for use in contact with d rinking water has been extensively performed ar the Australian Water Quality Centre (AWQC) in accordance with the Australian and New Zealand Standard AS/NZS 4020 'Tes ting of products for use in contact with drinking
water'. A wide range of materials hav e been tested ro the Standard including pipes, fittings and valves (Glasso n , 2002).
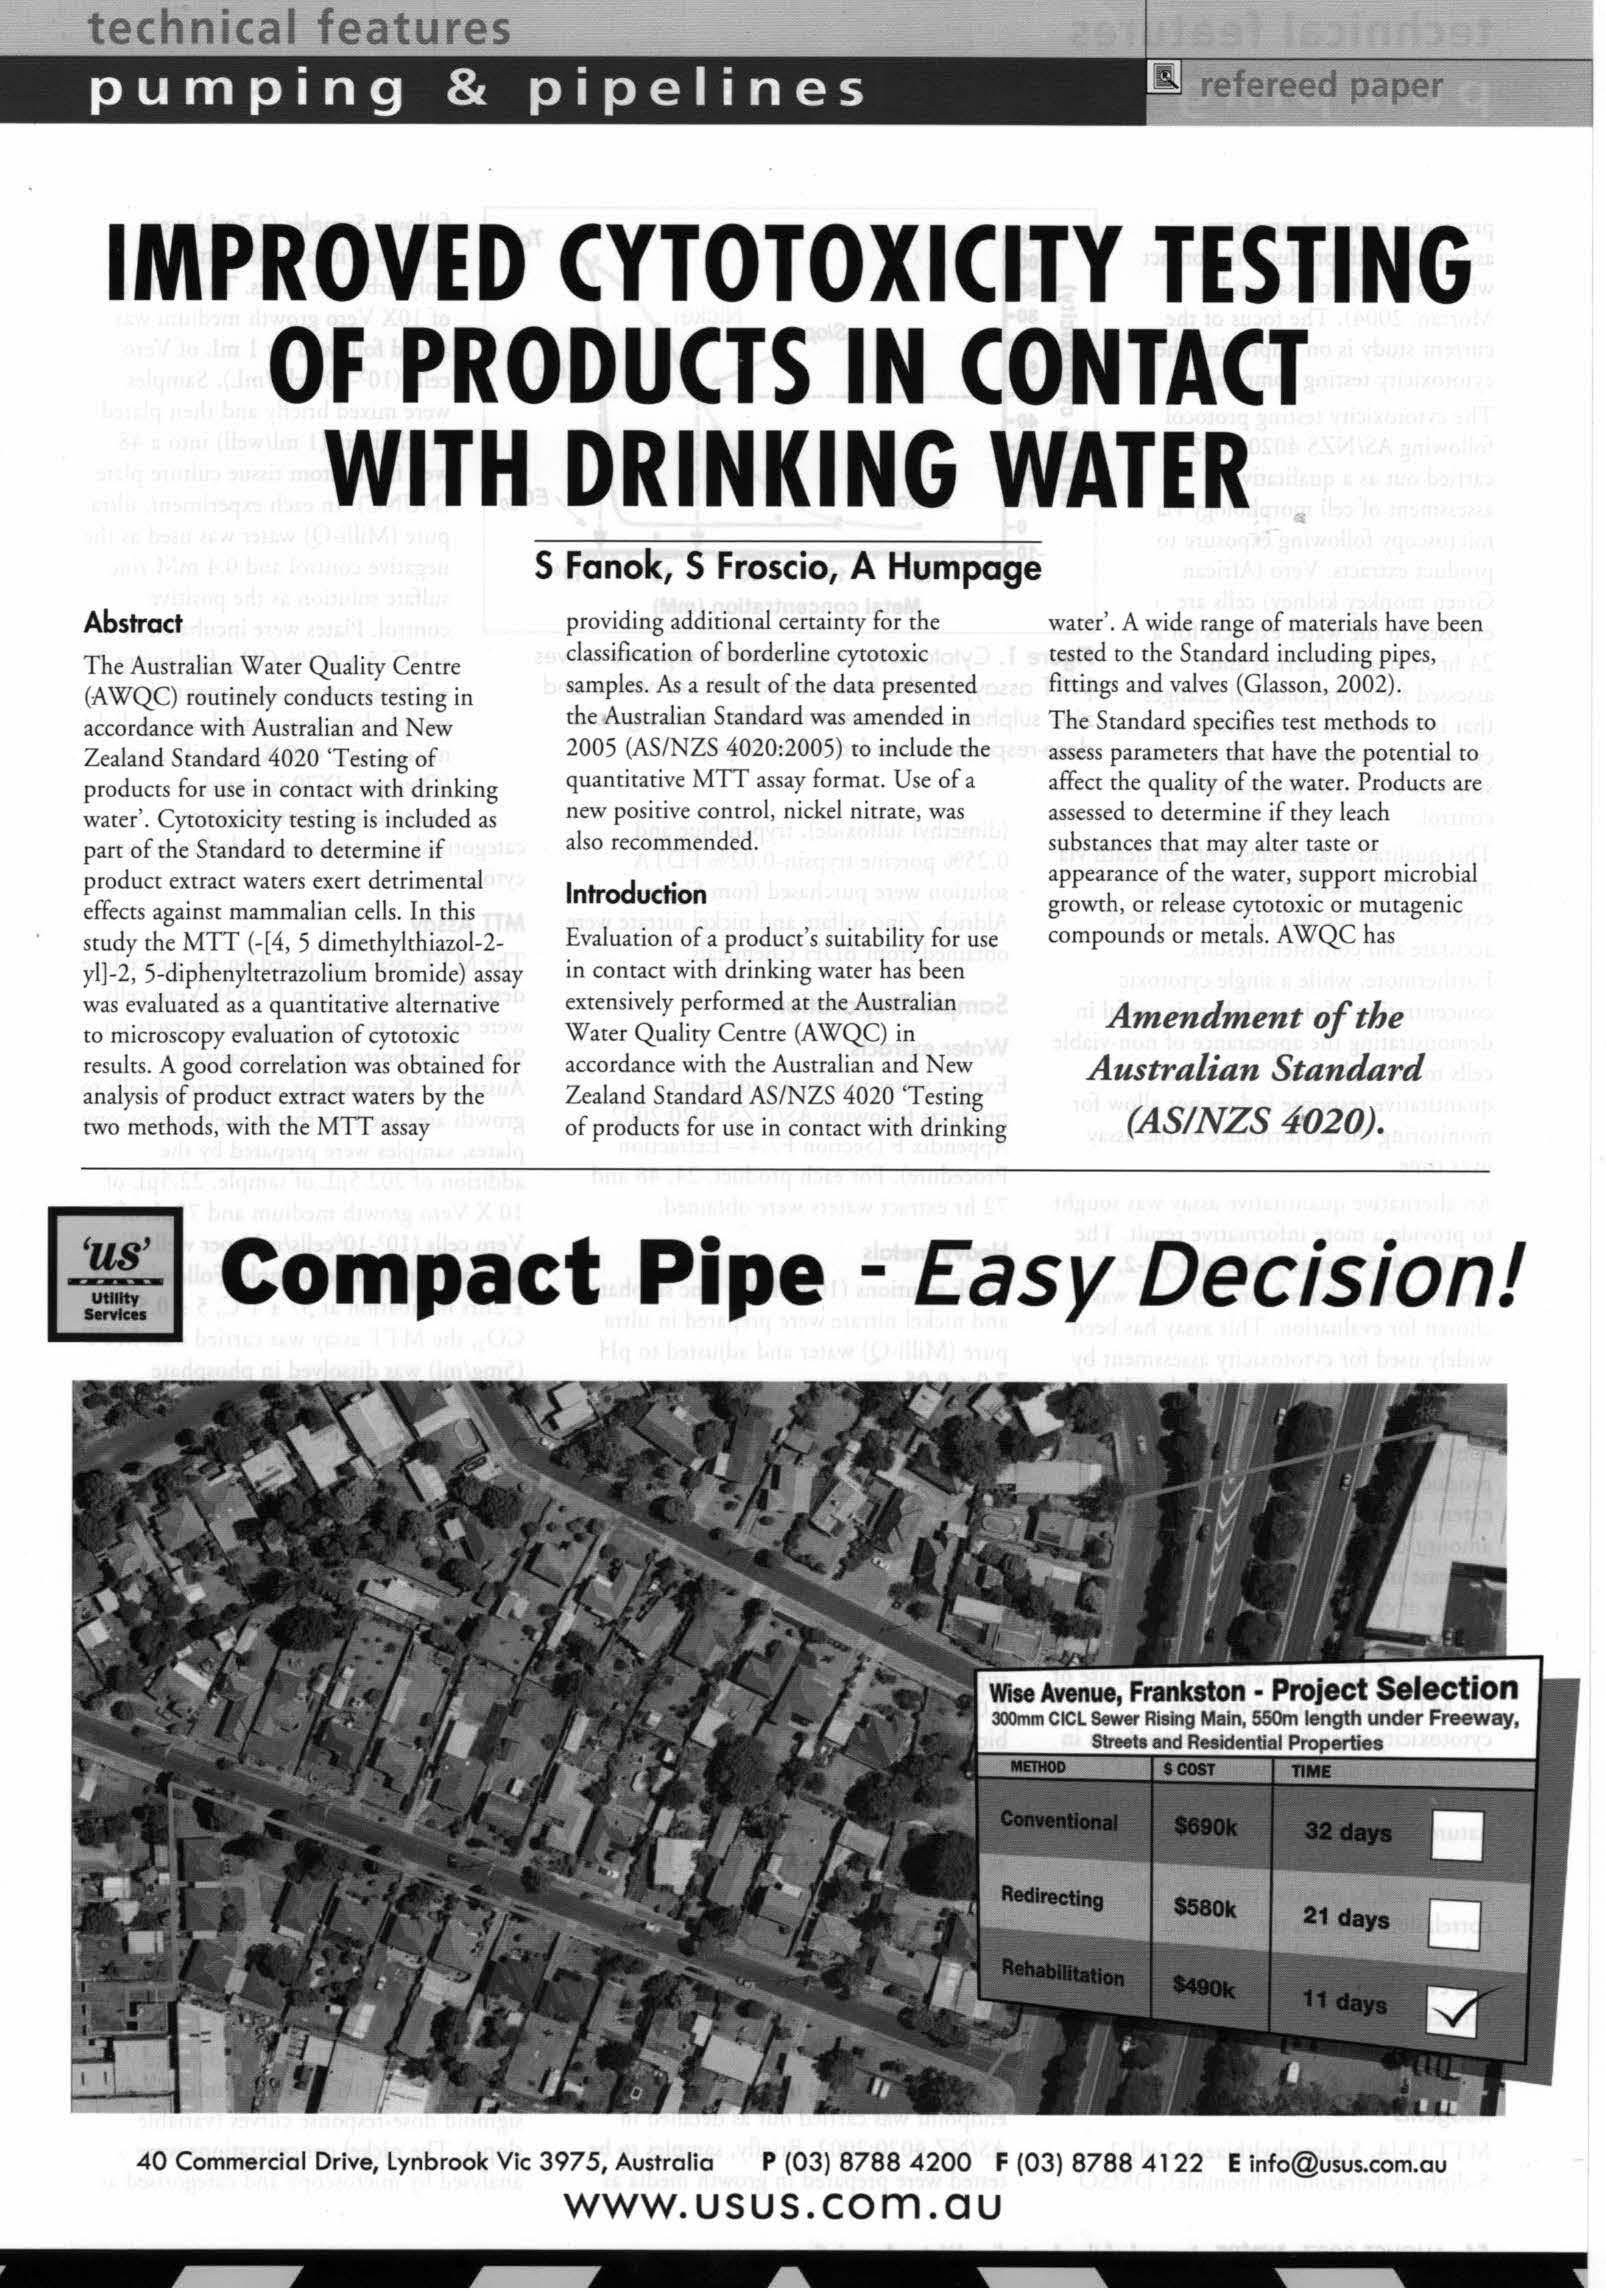
The Standard s pecifies test methods to assess parameters rhar have the potential to affect the quality of the wate r Products are assessed to determin e if they leach substances that may alter taste or appearance of the water, support microbial growth, or re lease cyroroxic or muragenic compounds or metals. AWQC has
Amendment of the Australian Standard (ASINZS 4 02 0).
technical features refereed paper
Compact Pipe - Easy Decision! 4 0 Commercial Drive, Lynbrook Vic 3975, Austr a li a P (0 3) 87 88 4200 F (0 3) 87 88 4122 E info@usus com a u www.usus.com . au
previous ly reported on tastes assoc iated with products in contact with water (Marchesan and Morran , 2004 ). The focus of the current study is o n improving the cytotoxiciry resting component.
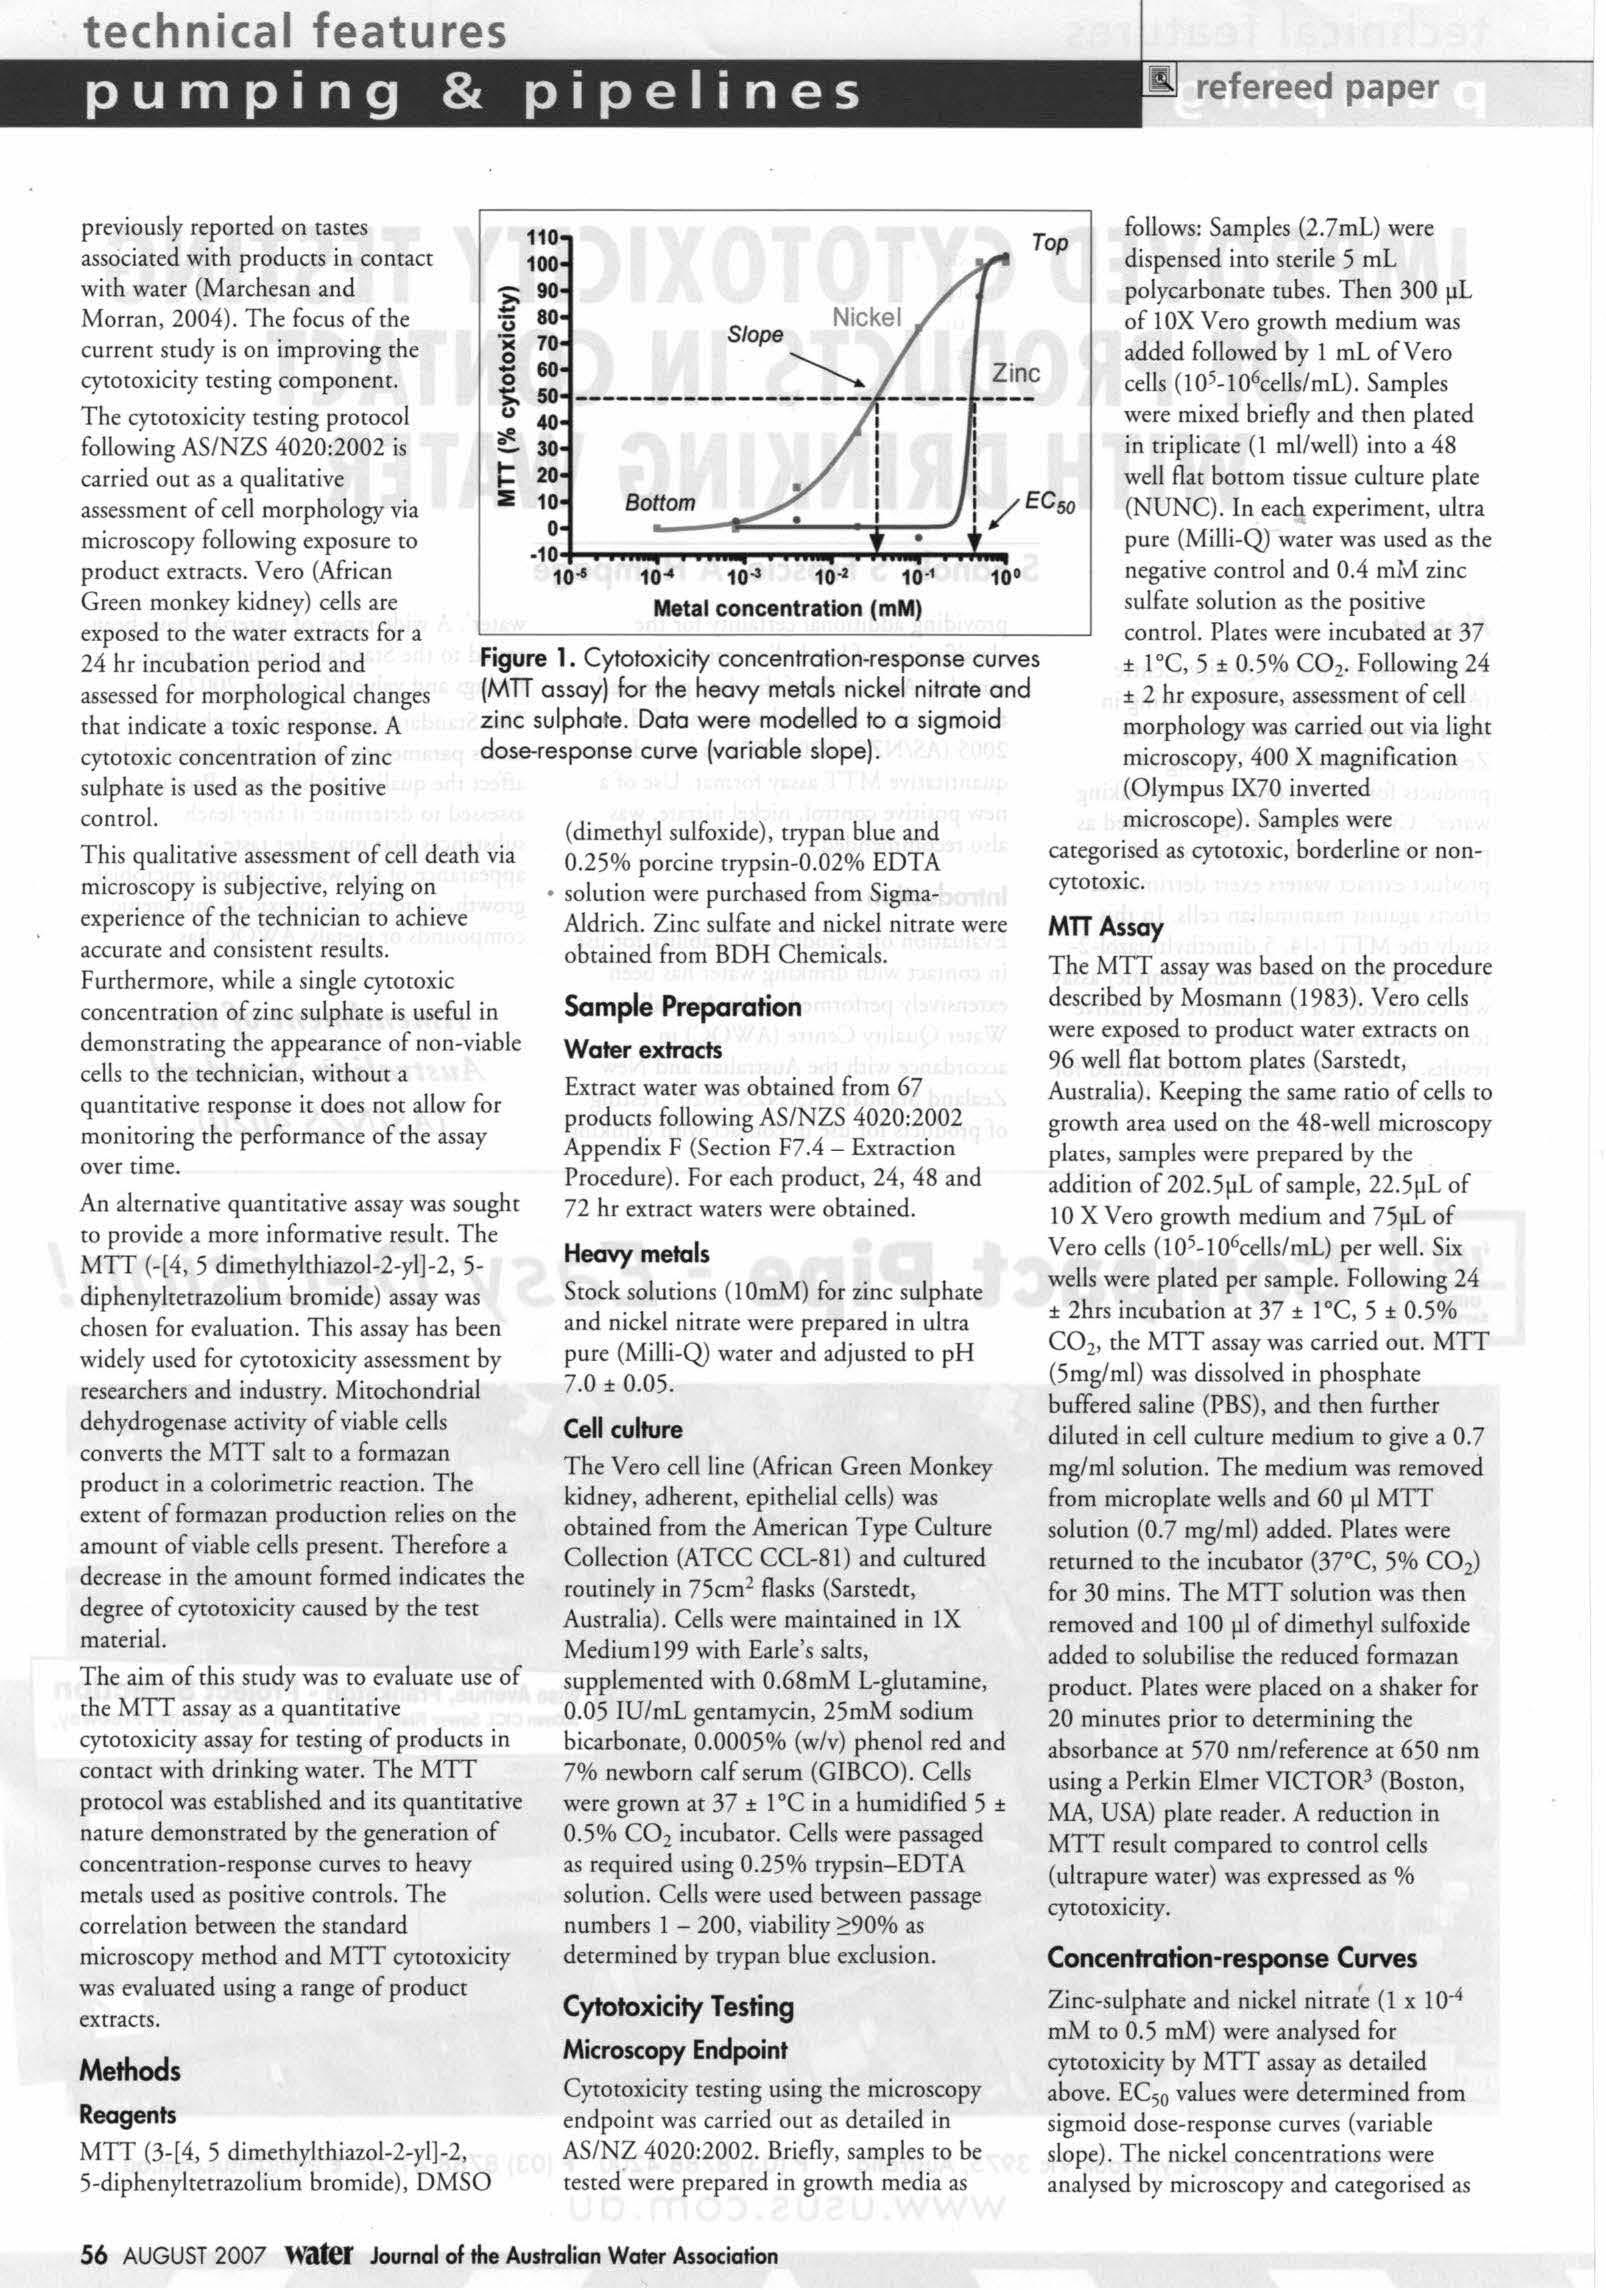
The cytotoxiciry tes ting protocol following AS/NZS 4 020:2002 is carried out as a qualitative assess ment of cell morphology via mi cro sco p y following ex pos ure to product ex tra cts. Ve ro (African
Green monkey kidney) cells a re
exposed to the water ext racts for a 24 hr incubation pe riod and assess ed for morphological changes that indicate a toxic res ponse. A cytotoxic conce ntration of zin c s ulph a te is used as the positive control.
Figure 1. Cytotoxicity concentration-response curves (MTT assay) for the heavy metals nickel nitrate and zinc sulphate. Data were modelled to a sigmoid dose-response curve (variable slope).
This qu ali tative as sessment of cell death via mi crosco py is subje ctiv e, relyi ng on experience of the technician to ach ieve accurate a nd co n sis tent re sults. Furthe rmore, while a si ngle cytotoxic concentratio n of zinc sulph a t e is u seful in d e monstrating th e appearance of non-viabl e cells to the technician, without a quantitative res ponse it d oes no t a llo w for monitoring the performance of the assay over time.
An alternative quantitative assay was sought to prov ide a more informative resu lt. Th e MIT (-(4 , 5 dimeth ylthiazol-2 -y l] -2, 5diphenylrecrazolium bromide) assay was c hosen for eval uation. This assay h as been widel y u sed for cytotoxiciry assess ment by re searchers and industry. Mitochondrial dehydrogenase activity of viable cells co nve ns th e MIT salt to a formazan product in a colorimetric reaction. The extent of formazan production relies on the amount of viable cells present. Therefore a decrease in th e amount formed indicates the degree of cytotoxiciry ca used by the test material.
The aim of this srudy was t o eval uat e us e of the MIT assay as a quantitative cyto coxiciry assay for t es ting of products in contact with drinking water. The MIT protocol was estab lished and its qu a ntitative natur e d emon s trated by the generation of concentration-response curves to heavy metals u sed as positive co ntro ls. The correlation between the standard microscopy method a nd MIT cytotox iciry was evaluated using a range of produce extracts.
Methods
Reagents
MIT (3-(4, 5 dimeth ylthiazol-2-y l]- 2, 5-diphenyltetrazolium brom id e) , DMSO
(dim ethyl sulfoxide), trypan blue and 0.25 % porcine trypsin-0 02 % EDTA • so lution were purchased from SigmaAldrich. Zinc s ulfate and nickel n itrate were obtained from BDH Chem ical s.
Sample Preparation
Water extracts
Ex tract water was obtai ned from 67 produces following AS/NZS 4020:2002 Appendix F (Section F 7.4 - Extraction Procedure). For each product , 24 , 48 and 72 hr ex tract wate rs were obtained.
Heavy metals
Stock sol ut ions ( I0mM) for zinc sulph ate and nickel nitrate were prepared in ulcra pure (M illi-Q) water a nd adjusted to pH
7. 0 ± 0.05
Cell culture
The Vero cell line (African Green Monkey kidney, adh erent, epithelial cells) wa s obtained from the American Type Culture Collection (ATCC CCL-81) and c ultured routinely in 75cm 2 flas ks (Sarstedt, Australia). Cells were maintained in IX Medium 199 with Earle's salts, supp leme nted with 0.68mM L-glutamine, 0.05 IU /m L gentamycin, 25mM sodium bicarbonate, 0.0005% (w/v) phenol red and 7% newborn calf serum (G IBCO ) Cells wer e grown at 37 ± I °C in a humidified 5 ± 0.5% CO 2 incubator. Cel ls were passaged as req uired using 0. 25% trypsin-EDTA solution. Cells we re used between pas sage numb ers I - 200, viability 2:90% as determined by trypan blue exclusion.
Cytotoxicity Testing
Microscopy Endpoint
Cytotoxiciry testing using the microscopy endpoint was carried out as detailed in AS /NZ 4020 :2002. Briefly, sa mples co be tes ted were prepared in growth media as
Top follows: Samples (2.7ml) we re di s pensed into sterile 5 ml polycarbonate rubes. Then 300 µL of !OX Vero growth medium was added followed by I ml of Vero
ce lls ( I05 - I06cell s/ mL) Samples were mixed briefly and then plated in tr iplicate (I ml/well) into a 48 we ll flat bottom ti ss ue culture place (NUNC) In each expe r iment, ultra pure (Milli-Q) water was used as th e negative control and 0.4 mlv'.I zinc sulfate so lution as the p os itive control. Plates were incubated at 37 ± I °C, 5 ± 0.5 % CO2 • Following 24 ± 2 hr ex pos ure, assessment of cell morphology was carri ed out via light microscopy, 400 X magnification (Ol ympu s IX7 0 inverted mi c ro sco p e) Samples we re ca t egorised as cytotoxic, borderline or noncytotoxic.
MTT As say
The MIT as say was based on th e procedure described by Mosmann (I 983). Vero cells were exposed to product wate r ex tracts on 96 well flat bottom plates (S arstedt, Australia). Keeping the same ratio of cells to growth area used o n th e 48-well microsco py pla ces, samplc:s were prepared by che addition of 202 5µ1 of sample , 22.5µL of 10 X Vero growth medium and 75 µ1 of Vero cells (I0 5-I06cells/mL) p er well. Six we lls were placed per sam ple. Following 24 ± 2 hrs incubation at 37 ± 1 c, 5 ± 0 .5% CO 2, the MIT assay was carried out. MIT ( 5mg/ml) was dissolved in phosphate buffered sali ne (PBS ), and then further diluted in cell cu lture medium co give a 0.7 mg/ml solu tion. The medium was removed from mic rop late we lls and 60 µI MIT solution (0.7 mg/ml) added Places were returned co che incubator (37°C, 5% CO2) fo r 30 mins. The MIT solution was then removed and 100 µI of dimethy l sulfox ide added to so lubil ise the reduced formazan produce. Plates were placed on a shaker for 20 minutes prior to determining the absorbance at 570 nm/reference at 650 nm using a Perkin Elmer VICTOR3 (Bosto n , MA, USA) pl ace read er. A reduction in MIT result co mpared to control cells (u ltrapure water) was expressed as % cyroroxi ciry.
Concentration-response Curves
Zinc-sulphate and nickel nirrac~ (1 x I Q-4 mM to 0.5 mM ) were analysed for cytotoxiciry by MIT assay as d etai led above. EC 50 values were determined from sigmoid do se-res ponse c u rves (variable slope). The ni ckel concent ra tio n s were analysed by microsco py and catego rised as
technical features refereed paper
110 100
90 u 80 ,c 70 !:? 60 0 i 50 40 30 20 :IE 10 0 B ottom
-1 0+-...................._I'"""" ._ 10 "' 10 -4 10 ~ 10 -2 10 ·1
Metal concent ration (mM )
56 AUGUST 2007 Water Journal of the Au stral ian Water Associa ti on
cytotoxic, borderline or non -cyototoxic. MIT class ification s were th en defined as follows: cytotox ic MIT >50%, borde rline MIT 20-49%; an d non-cytotoxic MIT <20%.
Testing of Product Extract Waters by Microscopy and MTT assay
The cytotoxic ity of extract water (24, 48 & 72 hr rime points) from 6 7 products was assayed by both micros copy an d MIT methods as detailed above
Data Analysis
G raph Pad PRISM (G raphP ad software, San Diego, California, USA Version 4.00 for Windows) was used for all statistical ana lyses and graphing
Results and Discussion
Nickel nitrate is recommended as a new positive control
The heavy metals zinc s ulphate a nd ni c kel nitrate (l xlO -4 mM to O.5mM) were us ed co gen e r ate concentration-res ponse c urves in the MTT assay As shown in F igure l, th e conce ntration-res pon se curve for the posi ti ve control zinc s ulphat e is ste ep , changing from being cytotoxic to non-cytotoxi c over a ve ry narrow concen tration range. The EC 50 (e ffectiv e concentration required to kill 50% of the cell s) was determ i ned as 0.40 mM. If one cytotoxic concentration (O.4O mM ) is used as a positive co ntrol , it can be see n char a rel ative ly slight operational error in preparatio n of chis concentration cou ld lead to unnecessary re ject ion of the assay resu lt s if a cytotoxic res ult is not see n
Nicke l nitrate , on the other hand, exhibits a broad concentration-response curve over a 3-4 log concentration range. The EC50 was determined as 0.039 mM. Small changes in co n ce ntra tion will not have th e sa m e impact on the cytotoxic response. It is therefore recomm e nded that nickel nitra te be used as an alternative pos itive co ntrol. Use of 3-4 concentrations to ob tain a range of quantitati ve MIT res ults will enable sensitive monitoring of the assay performance over rime
Nickel nitrate evaluation of MTT response compored to microscopy
Ni ckel nitrate was used to demonstrate {a) non-toxi c, (b) borderline a nd (c) cyto toxic res ponses as determined b y microsco py. These class ifications were compared to the MIT re sult categories.
As shown by microsco py , viable cells exhibit an elongated appearance, flatt en ed out to form a mon o layer on the cu lture
vessel {Figure 2 {a)). Non-viable cells are rounded, having lost control of cell st ructure and contact with eac h other. Nore that there are always some dead cells present, even when th e majo rity of the cells are health y. Th is is a potential source of confusion for in ex per ienced operators relying o n visual assessment. The MIT assay res ult was non- cyto toxic (O o/o cytotoxic ity).
An examp le of where uncertainty can ari se is illustrated in Figure 2 (b). This sampl e was classified as borde rline cytotoxic by microsco py, showing an increase in the numb er of non-v iab le (rounded) cells prese nt compared to th e non -cyto toxic result shown in Figure l (a) Ir was sub sequ e ntly ide ntifi ed as bei ng noncytotoxic und e r the MIT classification {l 5% cytotoxicity). It is likel y that thi s con fusion by the mi c ros cop ist was actually ca u sed b y too man y cells being dispen sed into the well.
A cyrotoxic res ult is shown in Figure 2 (c) illustrating destru ction of the cell monol aye r by the t est co mpound. This was quantified as 76% cytotoxicity by th e MIT assay.
Testing of Product Extract Waters by Microscopy and MTT assay
T o d e termine whether MIT assay results correspond with microsco p y observa tion s, res ults were co rrelated for 2 15 product extract wa ters res ted for cytotoxic ity b y both methods (Tabl e I) The samples analyse d included 3 extracts (24, 4 8 , 72 hr ex tracts) from 67 products In addition, so me extracts we re repeated follow ing dilution. Th e average intra sample vari a bili ty of MIT results (coeffi cient of variation on 6 replicates per sample) was 9 17% for thi s data set. Therefo re, the 95% confiden ce inte rval on 50% MIT redu ction was 45.2- 54.8%.
The Pea rson correlation coefficient of the two methods was r = 0.5 4 (p <0 0001 ). This indi ca tes chat the two methods tend to vary togeth er m eas uring the same end result As shown in Table l there we re no res ults classified as cytotoxi c by mi c rosco p y that were d ete rmined to be non- cyto toxic by MIT, an d no results classified as n o ncyto toxi c by micros co p y chat were dete rmin ed to be cytotoxic by MIT. Some var iability in res ults from the two methods comes from the ' borde rline ' classification
Pleuger Submersible Pumps and Motors.
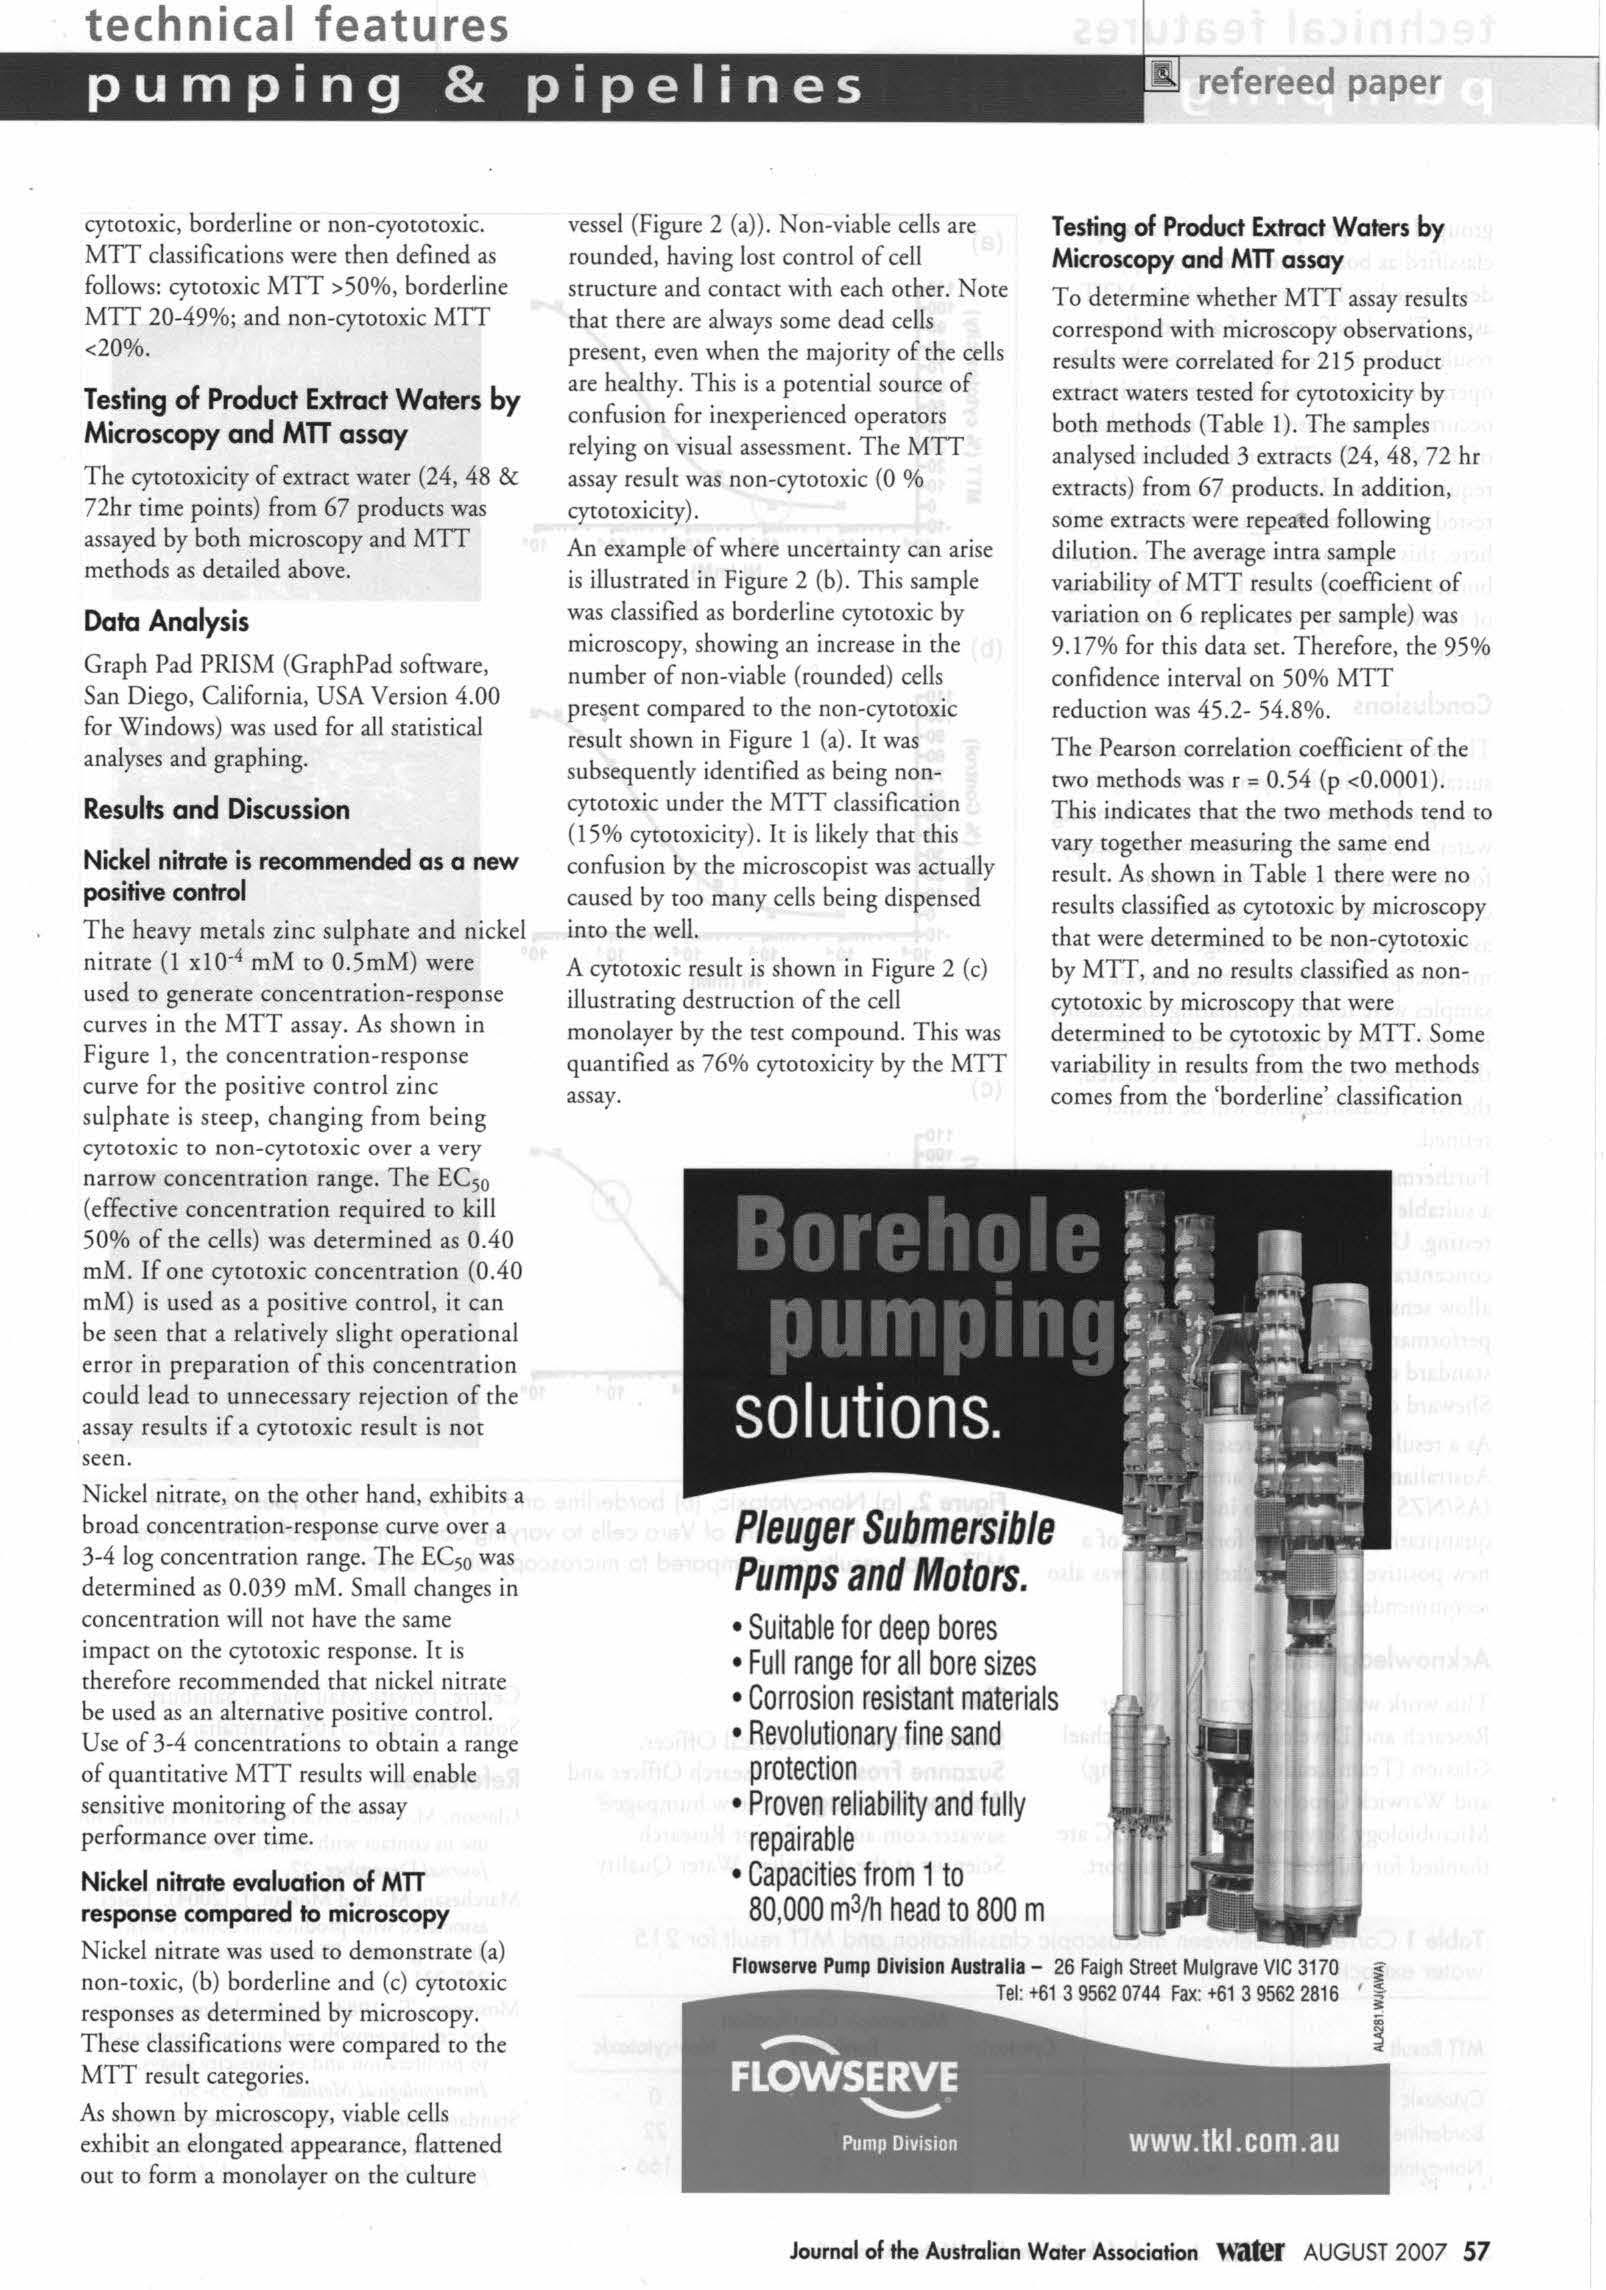
• Suitable for deep bores
• Full range for all bore sizes
• Corrosion resistant materials
• Revolutionary fine sand protection
• Proven reliability and fully repairable
• Capacities from 1to 80 ,000 m3/h head to 800 m
technical features
refereed paper
Flowserve Pump Division Australia - 26 Faigh Street Mulgrave VIC 3170 Tel : +6139562 0744 Fax: +6139562 2816 Journal of the Australian Water Association water AUGUST 2007 57
gro up. In chis group, 12 out of 19 samples cl ass ified as borderline by mi c roscopy were determ ined co be non- cytotoxic by MIT assay. The class ifi cat ion of a borderline result by che microsco pi st occ urs w h en th e operator is un s ure wh ether cycocoxici ty h as occurred or n ot based on th e morphol ogy of ch e Vero cells. The pro to col then requires th e produce ex trac t water co be ret ested co confirm th e resulcs. As illustrated here, chis addi tional work in co nfirmin g a borderline sample co uld be avo id ed b y use of the MIT assay co provid e a qua nt ita ti ve a nswe r
Conclusions
The MIT assay was demonstrated co be a su itab le quancitacive cycocoxicity assay for t esting of products in contact wi th drinking water, wi th good co rre la tion co m icroscop y for d e terminin g cytotoxic and noncycocox ic res ulcs. The quantitative MIT assay h ad a di st i nct advantage over m icroscop y wh e n borderline cytoto xic sam ples we re reseed , eliminating un certainty in res u lts an d avoi d i ng che need co re-cesc che sam ples. As more produces are reseed , che MIT classi fi cations will b e furthe r refined.
F u rthermore, ni ckel nitrate was identified as a s uitab le positi ve control for cycocoxi city testing. Use of chis heavy m etal at 3-4 concentrations in the MIT assay would all ow se ns iti ve monitorin g of the assay p er for m ance over time by the u se of standard quali ty cont rol procedures su c h as Sheward charts.
As a result of the data presented, the Australian S tan da rd was amended i n 2005 (AS/NZS 4020:2005) ro in cl ude the q uan cicacive MIT assay format. U se of a new p osi ti ve control, nic kel n itrate, was a lso reco mm e nd ed.
Acknowledgments
This work was funded by an SA Wate r Research an d D evelopme nt grant Michael G lasso n (Tea m Leader, Produce T esting) and Warwick Grooby (Manager, Microbiology Services) both of AWQC are thanke d for val uab le advice and s upport
Figure 2. (a) Non-cytotoxic, (b) borderline and (c) cytotoxic responses obtained following 24 hr exposure of Vero cells to varying concentrations of nic kel nitrate MTT assay results are compared to mic roscopy observations.
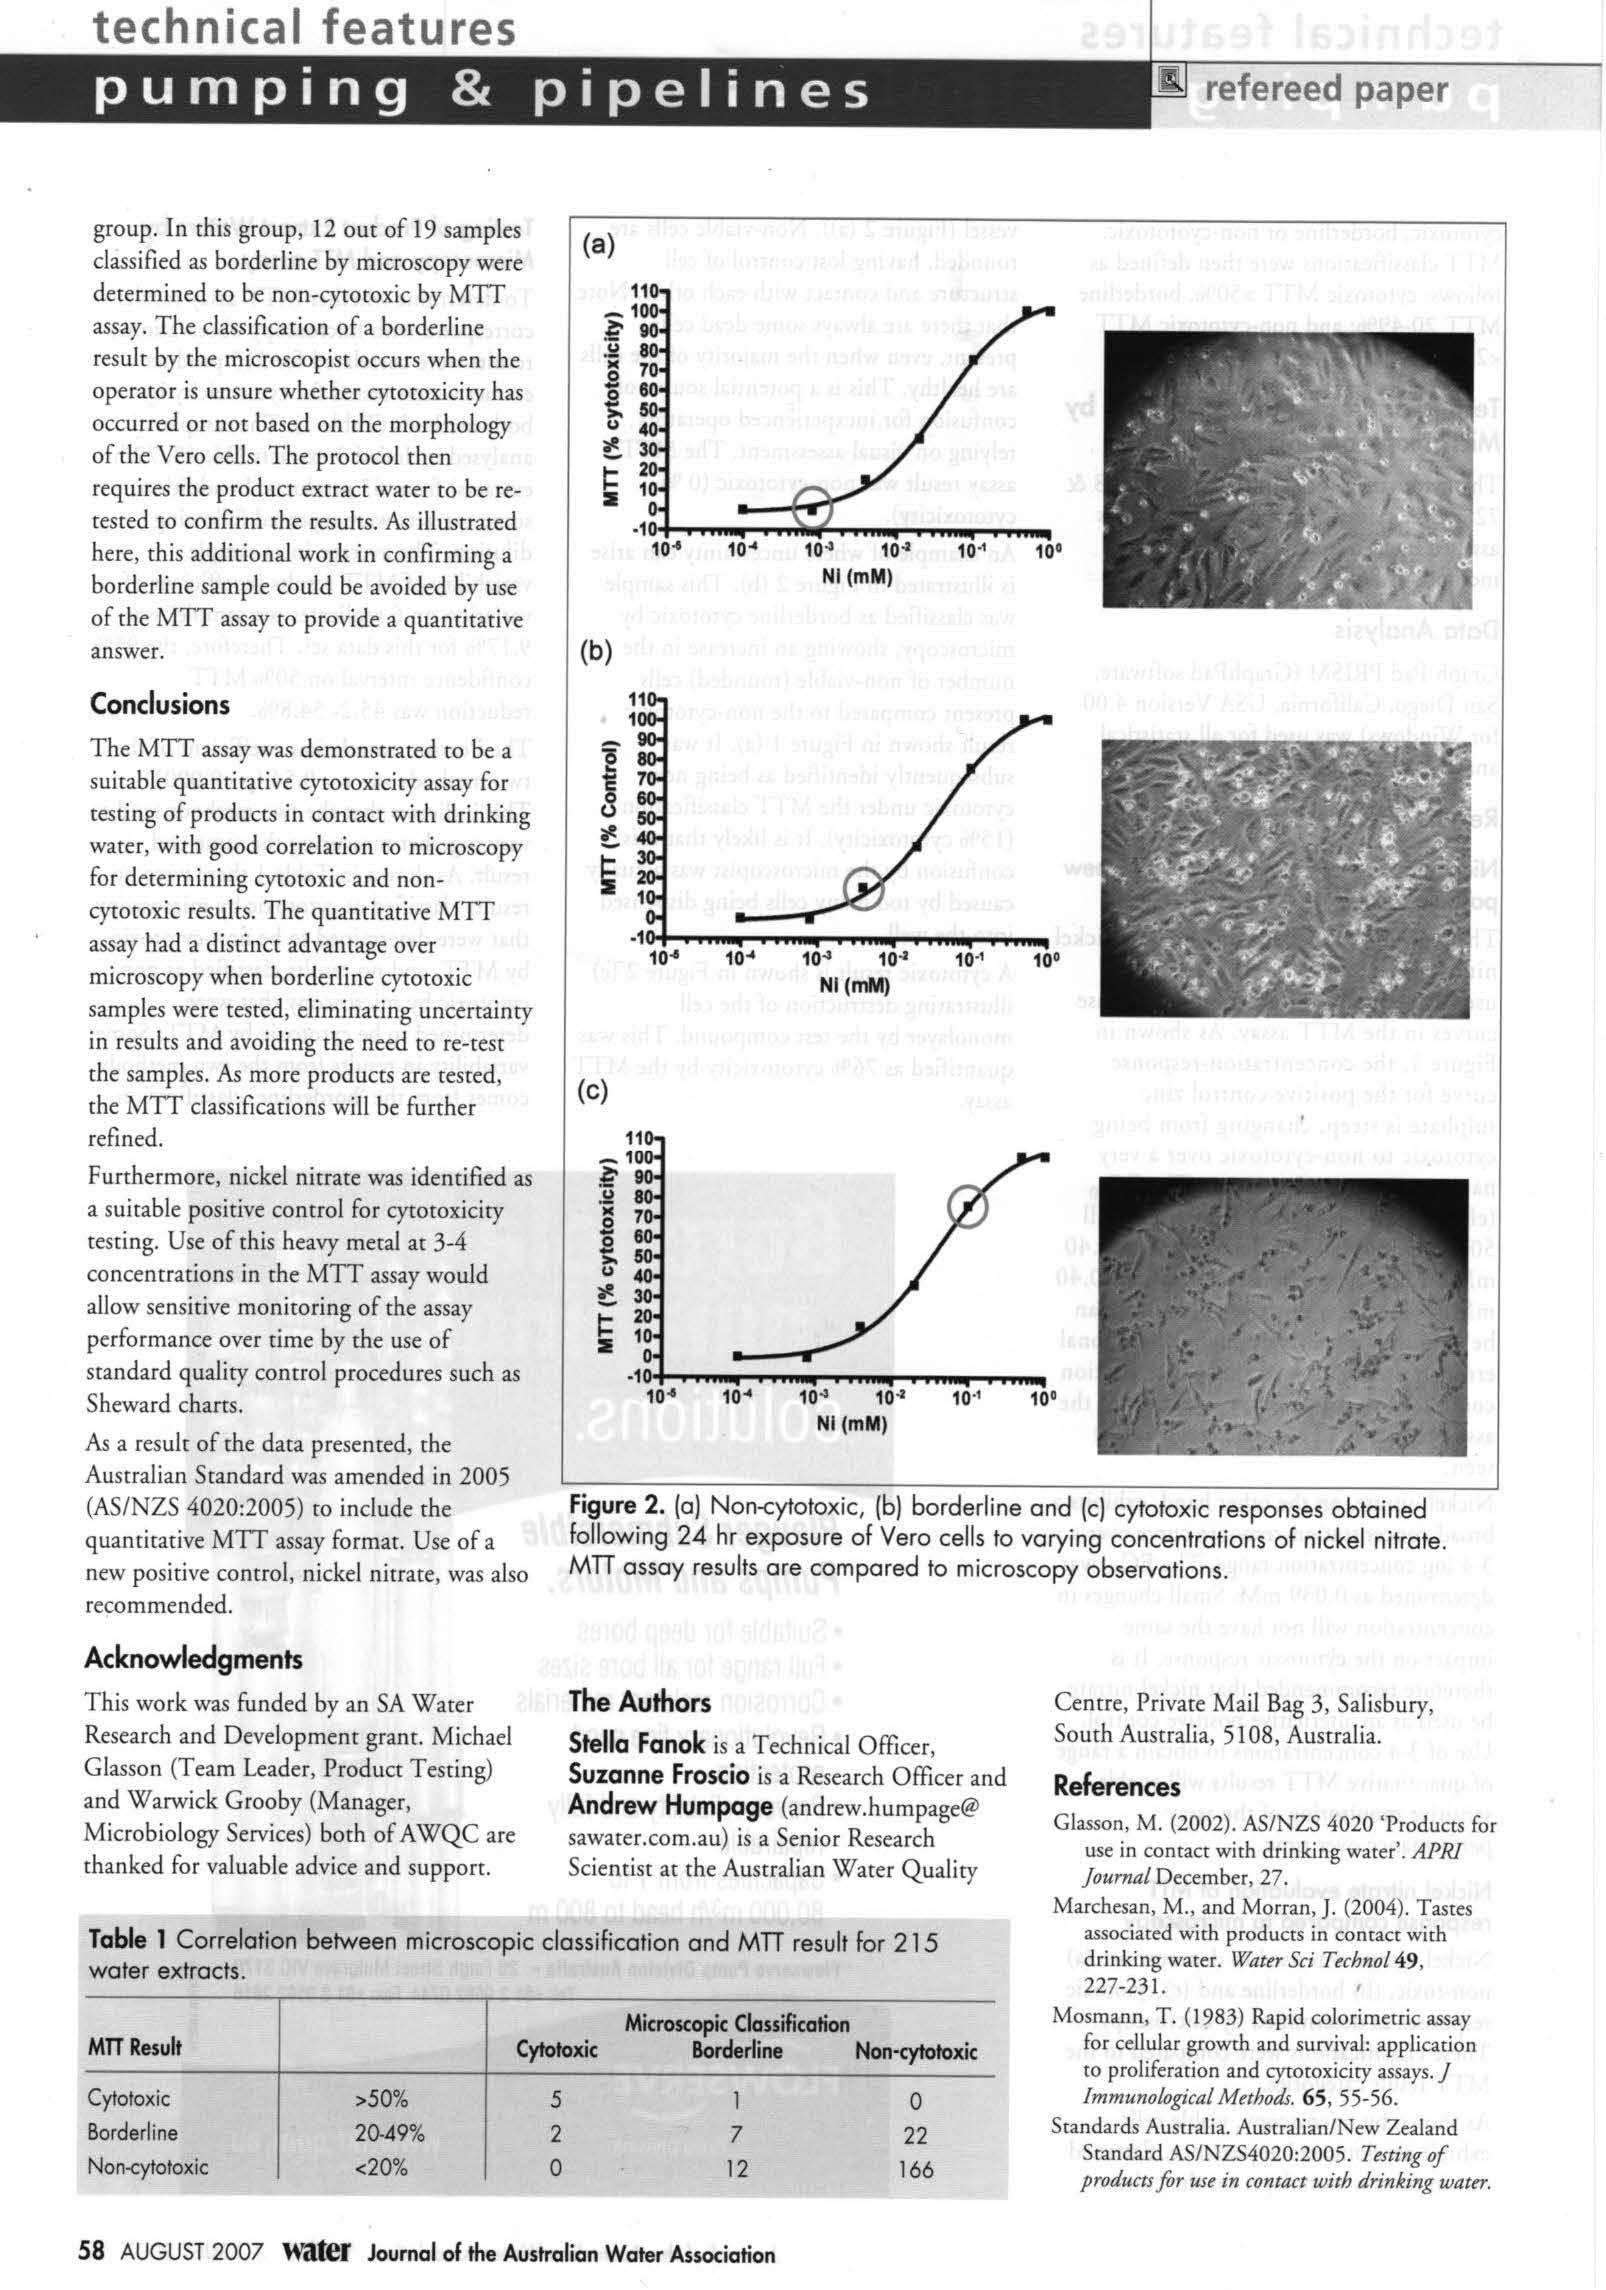
The Authors
Stella Fanok is a T ech nical Officer, Suzanne Froscio is a Research Officer and Andrew Humpoge (a nd rew.h umpage@ sawacer.com.au) is a Se ni or Resea rc h Scie nti s t at the Australian Water Qual ity
Table 1 Correlation between microscopic classificat ion and MTT result for 215 water extracts
Centre, Private Mail Bag 3, Sali sb ury , So u ch Australia, 51 08 , Australia.
References
Glasson, M. (2002). AS/NZS 4020 ' Produces fo r use in contact with drinking wa ter'. APR/ journal December, 27.
Marchesan, M., a nd Morran , J. (2004 ). Tastes associated with produces in co ntact with drinking water. Water Sci Ttchnol 49, 227-2 31.
Mosma nn , T. (1983) Rapid co lorimetr ic assay for cellular growth and survival: app li cation to proliferation and cycocoxiciry assays. J Immunological Mtthods 65 , 55-56. Standards Australia. Au strali an/New Zealand Standard AS/NZS4020:2005. Testing of products for uu in contact with d rinking water.
technical features
(a) 10 (b) I CJ i 10 (c) 11 -10 j! .. s t u :I 10 refereed paper 10 -1 10 10 1 10• Nl(mM) 10-1 10.. 10 1 10° Nl(mM) 10-1 10 10·1 10 ' Nl(mM)
MTT Result Cytotoxic Microscopic Classification Borderline Non-cytotoxic Cytotoxic >50% 5 0 Borderl ine 20.49% 2 7 22 Non<ylotoxic <20% 0 12 166 58 AUGUST 2007 water Journal of the Australian Water Assoc iation
THE ENHANCED GREENHOUSE EFFECT: THREATS TO AUSTRALIA'S WATER RESOURCES .. PART 2: POTENTIAL IMPACTS AND SOLUTIONS
Summary
Climate change may have more severe impacts than earlier projected on rural and urban water supply in Australia, both directly via changes in rainfall and increases in evaporation, and indirectly via changes in wildfires, land cover, soil eros ion, siltation, water quality and sea-level rise impacts on salin isation of coastal aquifers and estuaries. Solutions must include both adaptation and reductions in greenhouse gas em issions both locally and globally. Some hopeful ideas are explored.
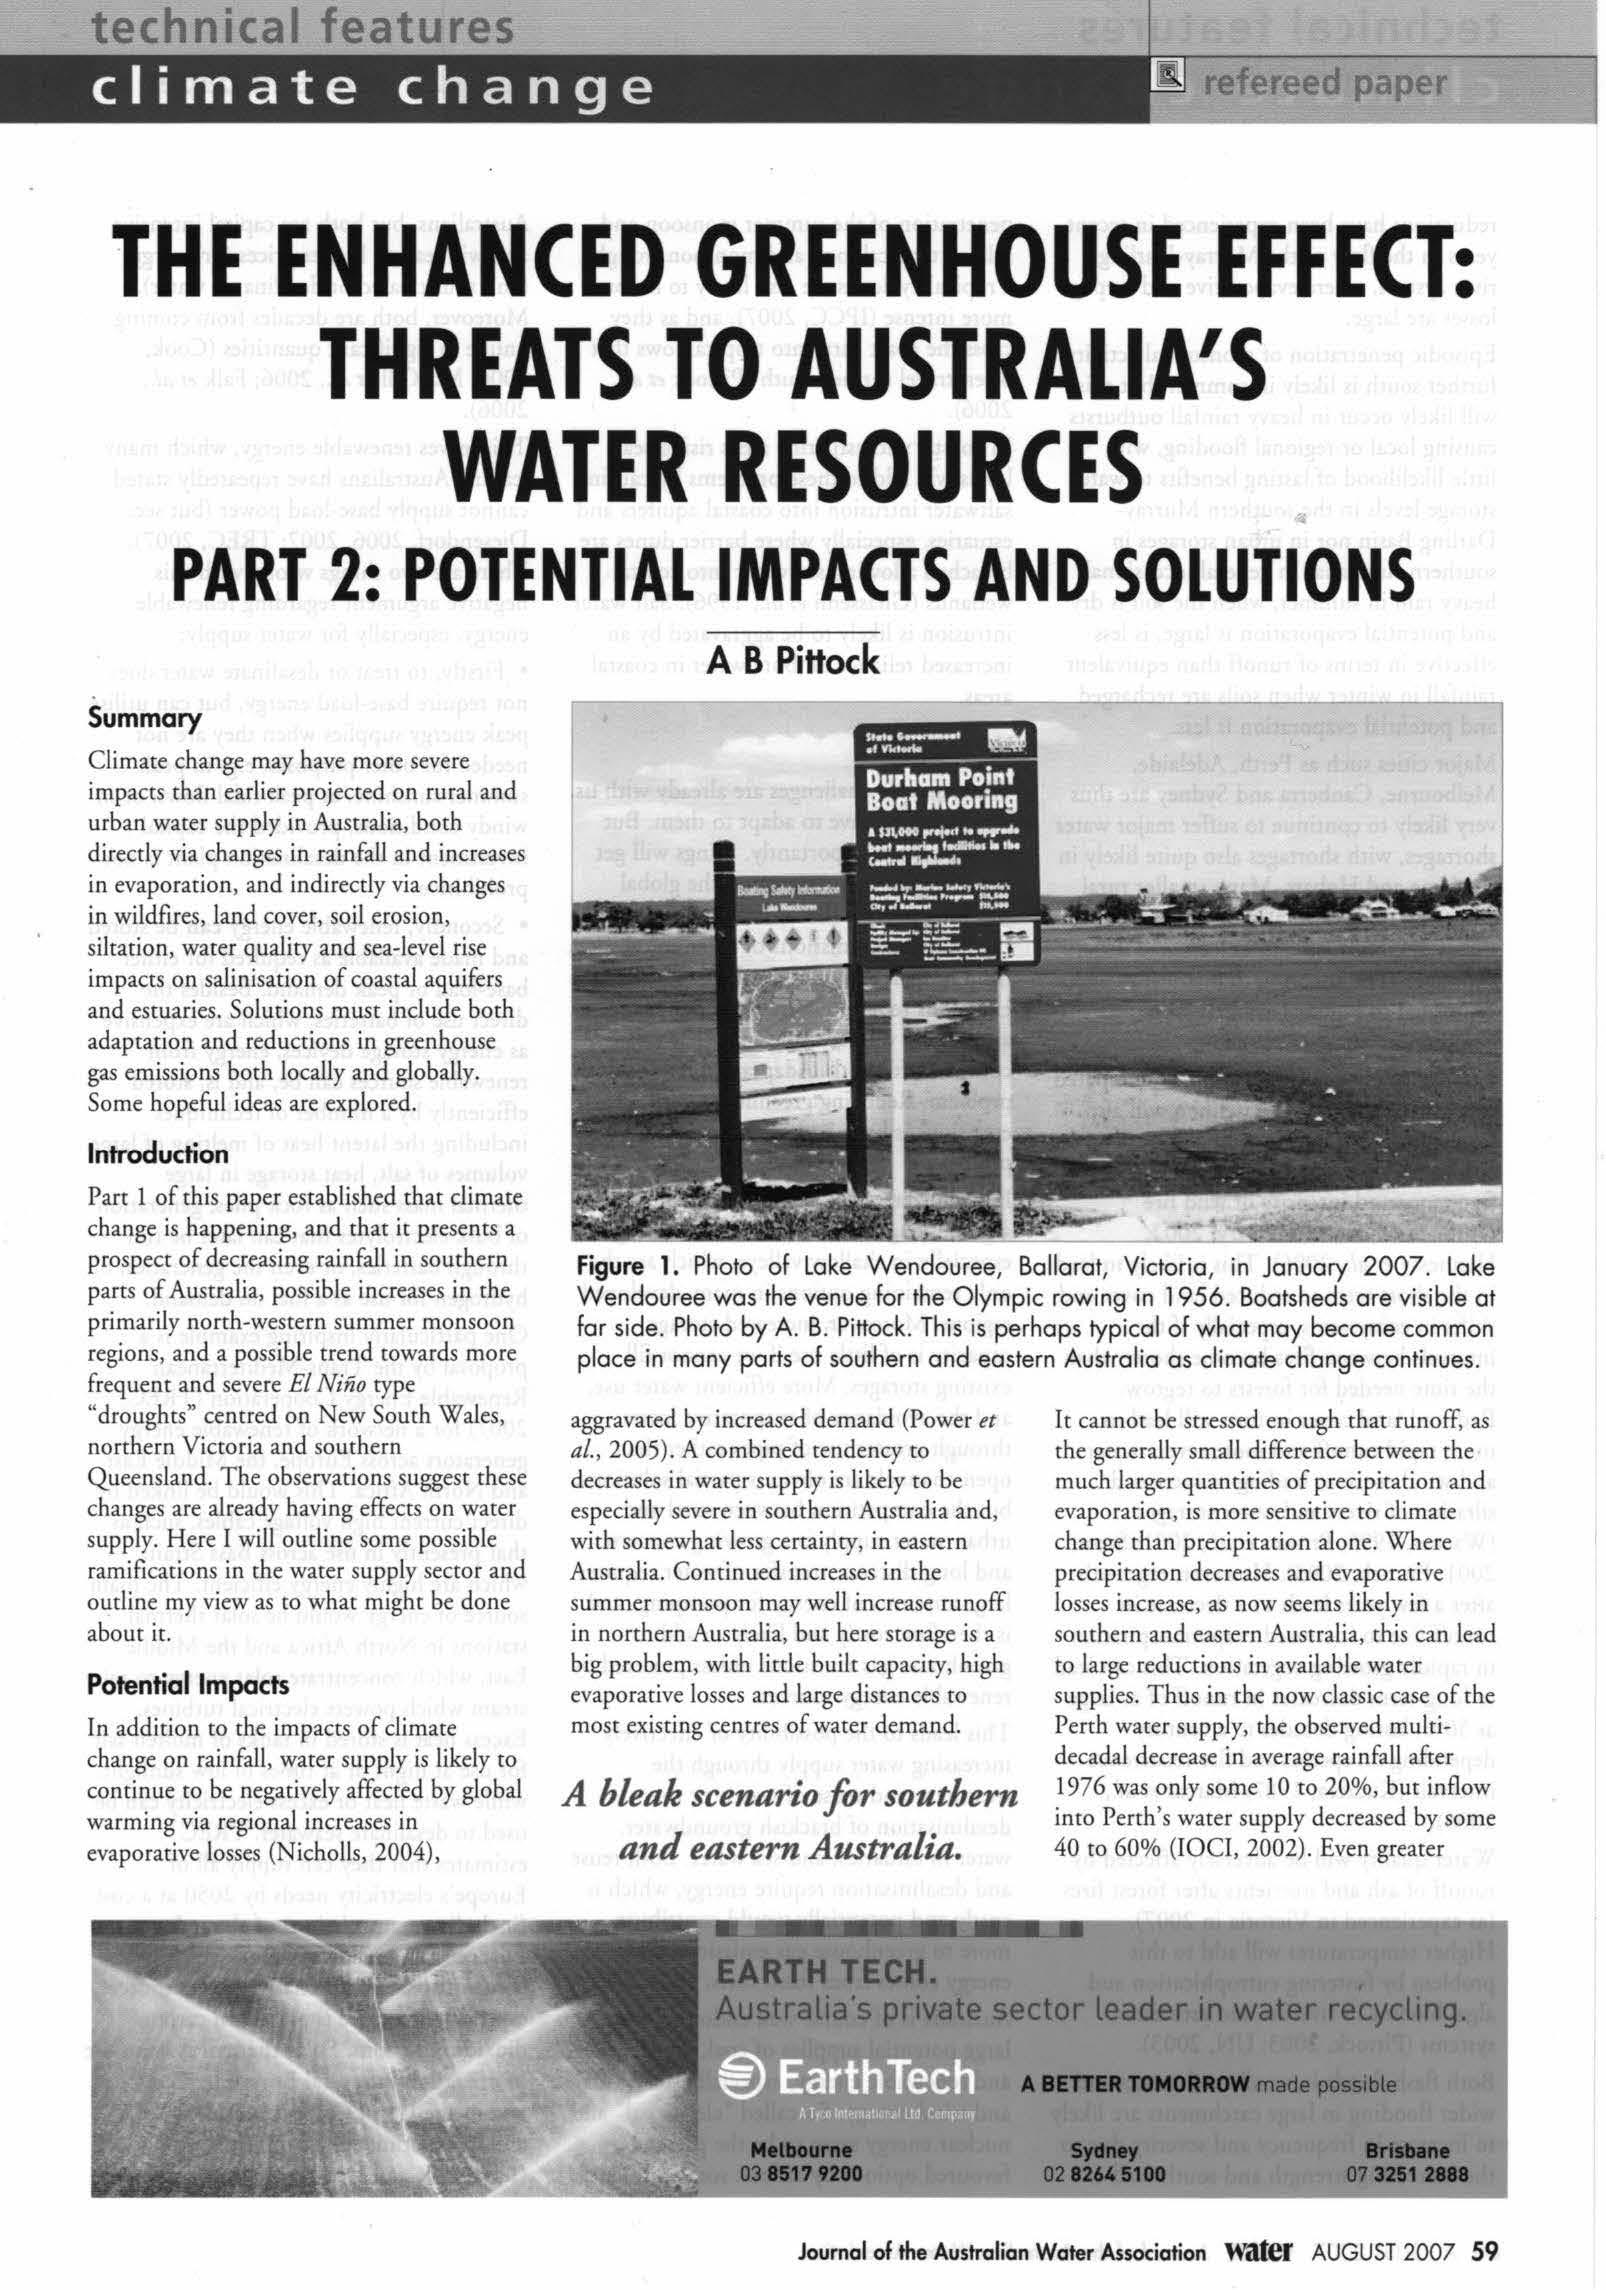
Introduction
Pare 1 of chis paper established chat climate change is happening, and that it presents a prospect of decreasing rainfall in southern parts of Australia, possible increases in the primarily north-western summer monsoon regions, and a possible trend towards more frequent and severe El Nifio type "droughts" centred on New South Wales, northern Victoria and southern Queensland. The observations suggest these changes are already having effects on water supply. Here I will outline some possible ramifications in the water supply sector and outline my view as to what might be done about it
Potential Impacts
In addition to the impacts of climate change on rainfall, water supp ly is likely to continue to be negatively affected by global warming via regional increases in evaporative losses (Nicholls, 2004),
aggravated by increased demand (Power et al., 2005). A comb in ed tendency to decreases in water supply is likely co be especially severe in southern Australia and , with somewhat less certainty, in eastern Australia. Continued increases in the summer monsoon may well increase runoff in northern Australia, bur here storage is a b ig problem, with little built capacity, high evaporative losses and large distances to most existing centres of water demand
It cannot be stressed enough chat runoff, as the generally small difference between the much larger quantities of precipitation and evaporation, is more sensitive to climate change than precipitation alone. Where precipitation decreases and evaporative losses increase, as now seems likely in southern and eastern Australia, this can lead to large reductions in available water supplies. Thus in the now classic case of the Perth water supply, the observed multidecadal decrease in ave rage rainfall after 1976 was on ly some 10 to 20%, but inflow into Perth ' s water supply decreased by some 40 to 60% (IOCI, 2002) Even greater
technical features refereed paper
AB Pittock
Figure 1. Photo of Lake Wendouree, Ballarat, Victoria, in January 2007. Lake Wendouree was the venue for the Olympic rowing in 1956 Boatshed s are visible at far side. Photo by A B Pittock. This is perhaps typical of what may become common place in many parts of southern and eastern Australia as climate change continues.
A bleak scenario for southern and eastern Australia.
M1a1 GHIM-
..... 0,1111Journ a l of the Au stra li an Water Association water AUGUST 2007 59
reductions have been experienced in recent years in the flow of the Murray-Darling rive r sys tem , where evaporative and seepage losses are large.
Episodic penetration of monsoonal activity further south is likely in summer, but chis will likely occur in heavy rainfall outbursts causing local or regional flood i ng, w i th little likelihood of lasting benefits to water sto rage levels in the so uth ern MurrayDarling Basin nor in urban storages in sou thern Australia. In general, occasional heavy rain in s ummer, when the soil is dry and potential evaporation is large, is less effective in terms of runoff than equ ivale nt Fainfall in winter when soils are recharged and potential evaporation is less.
Major cities such as Perth, Adelaide, Melbourne, Canberra and Sydney are t hu s very likely co con tinue to suffer major water shortages, with shortages also quite likel y in Brisbane and Hobart. Many smaller rural cities and towns will also be under dire threat of continued and exacerbated water shortages. The situation dramatically illustrated in Figure l is likely to be common place
Continued " drought" conditions (compared to a mid-20th century baseline), will also lead, along with higher temperatures and episodes of low humidity, to an increased frequency and i ntensity of wild fire (Wi lliams et al., 200 l; Cary, 2002, Henness y et al., 2006). This is likely to lead in the short term to reduced land cover and s hifts in ecosystems, especially if the intervals between fires become shorter than the time ne eded for forests to regrow. Reduced land cove r in turn will lead to more rapid runoff and more severe water and wind erosion, leading to increased siltation of rivers and water storages (Warner, 1995; Prosser et al., 2001; Scott, 2001; Pitcock, 2003). Howeve r , regrowth after a few years leads to a decrease in runoff due to increased evapotranspiration in rapidly growing vegetation. This can lead to long-term decreases in runoff of as large as 50%, lasting decades co a century d epending on species and fire recurrence intervals (Kuczera, 1987; Marcar et al., 2006)
Water quality will be adversely affected by runoff of ash and nutrients after forest fires (as experienced in Victoria in 2007). H igher temperatur es will add to chis problem by fostering eutrophication and algal blooms in riverine and estuarine sys tems (Pitcock, 2003; UN, 2003). Both flash floods in sma ll catchments and wider flooding in large catchments are likely to in crease in frequency and seve rity du e to the increasing strength and southward
penetration of the summer monsoon and related tropi cal lows and monsoon trough s. Tropical cyclones are also likely to become more inten se (IPCC, 2007), and as they cross the coast turn into tropical lows that often travel further south (Pitcock et al., 2006).
In coastal and estuarine a reas rising sea levels wi ll add to these problems by causing saltwater intrusion into coastal aquifers and estuaries, especial ly where barrier dun es are breac hed allowing sea water into coastal wetlands (G hassemi et al., 1996). Salt water intrusion is likely to be aggravated by an increased reli a n ce on bore water in coastal areas.
What to Do?
Water supply challenges are already with us. We therefore have to adapt to them. But perhaps more importantly, things will get worse un less we turn around the global warming process that is brought about by the increasing emissions of greenhouse gases from human activities. Both adaptat ion and emissions reductions are urgent challenges, and ideally we need solutions chat will contribute to both. Adaptation is a local problem . Reducing greenhouse gas emissio n s is both a local and global problem
Higher average temperatures provide an argument against increased water storages, especially in shallow valleys , which are the only remaining options in many developed reg ions. Moreover, increased storage capacity is of littl e use if we cannot fill existing sto rages More efficient water use, and the avoidance of evaporative losses through greater use of pipes rather than open channels are obvious partial sol utions, but the com petition between rural and urban water supply is a growing concern and long-distance transfer of water requires large amounts of e n ergy for pumping, and is therefore costly and likely to add to greenhouse gas emissions unless powered by renewable energy sou rce s. This leads to the possibility of effecti vely increasing water supply through the treatment and reuse of water, or the d esal inisation of brackish groundwater, water in estuaries, and sea water. Both reuse a nd desalinisa tion require energy, which is costly and potentiall y would contribute more to greenhouse gas emissions if the energy comes from fossil fu e ls.
Australia is of course well endowed with large potential supp lies of coal, uranium and renewable energy, es pecially solar, tidal and wind ene rgy. So-called "clean coal" and nuclear energy seem to be the present favoured options by at least so me influential
Australians, but both are capi tal intensive and will lead ro higher prices for energy (and thu s treated or desal inated water). Moreover, both are decades from coming online in significant quantities (Cook, 2006; MacGill et al., 2006; Falk et al., 2006).
This leaves renewable energy, which many leading Australians have repeatedly seated cannot supply base-load power (bu t see : Diesendorf, 2006, 2007; TREC, 2007).
There are two things wrong with thi s negative argument regarding ren ewable energy, especial ly for wate r suppl y:
• Firstly, to treat or d esalina te water doe s not require base-load energy, but can utilise peak ene rgy s uppli es when they are not need ed for ocher purposes, e.g. in peak s ummer s un sh ine, at peak tidal flows, or in wi ndy co nditions, provided the capital investment in the desalination plant is not prohibitive
• Secondly, renewable ene rgy can be stored and made available as required for either base-load or peak demand. Besides the direct use of batte ries, which are expensive as energy sto rage devices, energy from renewable sou rces can be, and is, sto red efficiently by a number of techniques including the latent heat of melting of large volumes of sale, heat storage in large thermal mass such as rock piles, generation of bulk electrolytes that can later be run through batteries, or even the generation of hydrogen for us e as a fuel on demand. One particularly inspiring example is a proposal by the Trans-Mediterranean Renewable Energy Cooperation (TREC, 2007) for a network of renewable energy generators across Europe, the Middle East and North Africa. This would b e linked by direct cu rrent high voltage cables, such as that presently in use across Bass Strait, which are highly ene rgy efficient. The main source of ene rgy would be solar thermal stations in North Africa and the Midd le East, which concentrate solar energy to rai se steam which powers electrical turbines. Excess heat is scored in tanks of molten sal t for use at night or at times of low sun light, while waste heat or excess electricity can be used to de sal inate seawater. TREC estimates chat they can supply all of Europe's electricity needs by 2050 ar a cost (including transmission) of about 5 Eurocents per Kilowatt hour , which is competitive with alternative power sou rces , especially if a price is placed on carbon dioxide emissions. Solar-thermal sys tem s are in operation in several European countries and in the US in California and Nevada, and in experimental setups in Australia (Lovegrove and Dennis, 2006).
technical features
60 AUGUST 2007 water Journal of the Australian Water As sociation refereed paper
technical features
Development of such a scheme on a small bur increasing scale in Australia is one hopeful possibility.
Conclus ions
Boch a daptat ion and reductions in greenhouse gas emissions, locally and globally, are needed urgently. Ada ptat ion measures a re essentially local or regional, but should not aggravate rhe global climate change problem, which would be cou nterproductive. The best solutions include increasing water use efficiency, recycling and desalinisation powered by renewable energy s upplies, plus urgent participation in global efforts to reduce emissions Such so lutions do see m possible, but much effort is required in all these areas in the next deca d e if we a re ro have secu re urban and rural water supplies.
Acknowledgments
T han ks are due to the Chief of CSIRO Marine an d Atmospheric Science for continuing my Honorary Fellowship, and to Tim Cowan of CSIRO for he lp with Figures. I a lso wish to th ank Wenju Cai and Ian Smith of CSIRO for their critical comments which have been most helpful.
The Author
Dr Barrie Pittock is an H onorary Fellow CSIRO Marine and Atmospheric Research. He re ti red in 1999 as Leader of the CSIRO Climate Impac ts Group, and was awarded a Public Serv ice Medal. H e is the author of Climate Change: Turning Up the Heat (CS IRO Publishing, 2005) , emai l: bpittock@bigpond .com; barrie.pittock@csiro a u
References
Cary, G.J. (2002) , Importance of changin g climate for fire regimes in Australia. In: Bradstock, RA , J.E Williams and M.A. Gill (eds.), Flammabk Awtralia: The Fire Regim es and Biodiversity ofa
Continent, Cambridge U niversity Press, UK, pp. 26-46.
Cook, P.J. (2 006) , Carbon dioxide capture and storage: research , development and application in Australia. lnternat. J. Environmental Studies, 63 , 731-750
Diesendorf, M. (2 006), Wind power in Australia. lnternat. J. Environmental Studies, 63 , 765776.
Diesendorf, M. (2 007) , Gmnhowe Solutiom with Sustainabk Energy, University of New Sou th Wales Press, Syd n ey
Falk, J. , J. Green and G. Mudd (2006), Australia, urani um and nuclear powe r. lntemat. J. Environmental Studies, 63, 845-858.
Ghassemi, F., K.W.F. Howard and A.J. Jakeman ( 1996), Seawater intrusion in coas tal aquifers and its numerical modelling. In: Environmental Modelling, Zanneti, P. (ed.) , Compu tat ional Mechanics Publications, Southampton, UK, Vol.3, pp.299-328.
Hennessy, K., C. Lucas, N Nic h olls, ) Bathols, R. Suppiah and J. Rickens (2006), Climate change impacts on fire-weather in south-east Australia. Consu ltan cy report for the NSW Greenhouse Office , Vic Depc. Sustainability and Environment, Tas. Dept. of Primary Industries, Water and Environment, and the Australian Greenhouse Office. CSIRO and Bureau of Meteorology, 78 pp.
IPCC (2007), Climate Change 2007: The Physical Basis, Summary far Policymakers. lntergovernmental Panel on Climate Change, Ge n eva (see: http: //www. ipcc.ch)
IOCI (2002) Climate Variability and Change in South West Wes te rn Australia. Indian O cean C lim ate I nitiative, Perth, 36 pp. See: http: //www.wrc. wa.gov.au/ioci/news.hcm.
Kuczera, GA (1987) Prediction of water yield reductions following a bushfire in ash- mixed species eucalypt forest. journal of Hydrology, 94, 215-236
Lovegrove, K, and M. Dennis (20 06), Solar thermal energy sys tems in Australia. lnternat J. Environmental S tudies, 63, 7 91-802
MacGill, I. , R. Passey, and T. Daly (2006), The limited role for carbon captu re and storage (CCS) technologies in a sustainable Australian energy future. lnternat J. Environmental Studies, 63, 751 - 764.
Marcar, N.E., R.G. Be nyon, P J. Polglase, K.1. Paul, S. Theiveyanathan a nd L. Zhang (2 006), Predicting the hydrological impacts of bwhfim and climate change in forested catchments ofthe River Murray Uplands: A Review. CSIRO: Water for a Healthy Country National Research Flagship
Nicholls, N. (2 004), The changing n atu re of Australian droughts , Climatic Change, 63, 323-336.
Pitcock, A.B. (2003). Clil/lilte Change: An Australian Guide to the Science and Potential Impacts, Barrie Pirtock (ed. ). Australian Greenhouse Office, Canberra. See: http://greenhouse.gov au/sc ience/pubs/science -guide.pdf.
Pittock, A.B., D. Abbs, R. Suppiah and R Jon es (20 06). Climatic background to past and future floods in Aust ral ia. I n: Floods in an Arid Climate, Poliani , A. (ed.), Advances in Ecological Research 39, 13-39, Elsevier/ Academic Press.
Power, S.B., 8. Sadler, and N. Nicholls, 2005: The influ e n ce of climate science on wa ter management in WA: lessons for climate scientists. Bulletin American. M et. Soc., 86, 839-844.
Prosse r , J.P., l.D. Rutherford , J M. Olley, W.J. Young, P.J. Wallb rink a nd C.J. Moran, 2001: Large-scale patterns of erosion a nd sediment transport in ri ver networks , with examp les from Australia. Marine and Freshwater Research, 52, 81-99.
Scott, A. (20 01), Water erosion in the M urrayDarling Basin: Learning from the past. CSIRO Land and Water, Tech. Report 43/01, November 2001, 134 pp. TREC (2007), C lean power from th e deserts. Available at http://www.TREC-EUMENA. net.
UN (2003), United Natiom World Water Development Report, World Water Assessment Program. See : http://www.unesco.org/water/ wwap/wwdr/index shcml.
Warner, R.F. (1995), Predicting and managing c hannel change in South east Australia. Catena, 25, 403-418.
Williams, A.J., D.J. Karoly and N. Tapper (2001), The sensitivity of Australian fire danger to climate change. Clima t ic C h ange, 49, 171 -1 91.
refereed paper
H~N~ instruments t el: +61 397 69 0666 fax: +6 1 397 69 0699 ema il: h an na in s@ h annain st.c o m. au www.hannainst .com .au Journal of the Australian Water Association water AUGUST 2007 61
TREATMENT OF WASTEWATERS BY RO: OPERATING ISSUES - PART 1
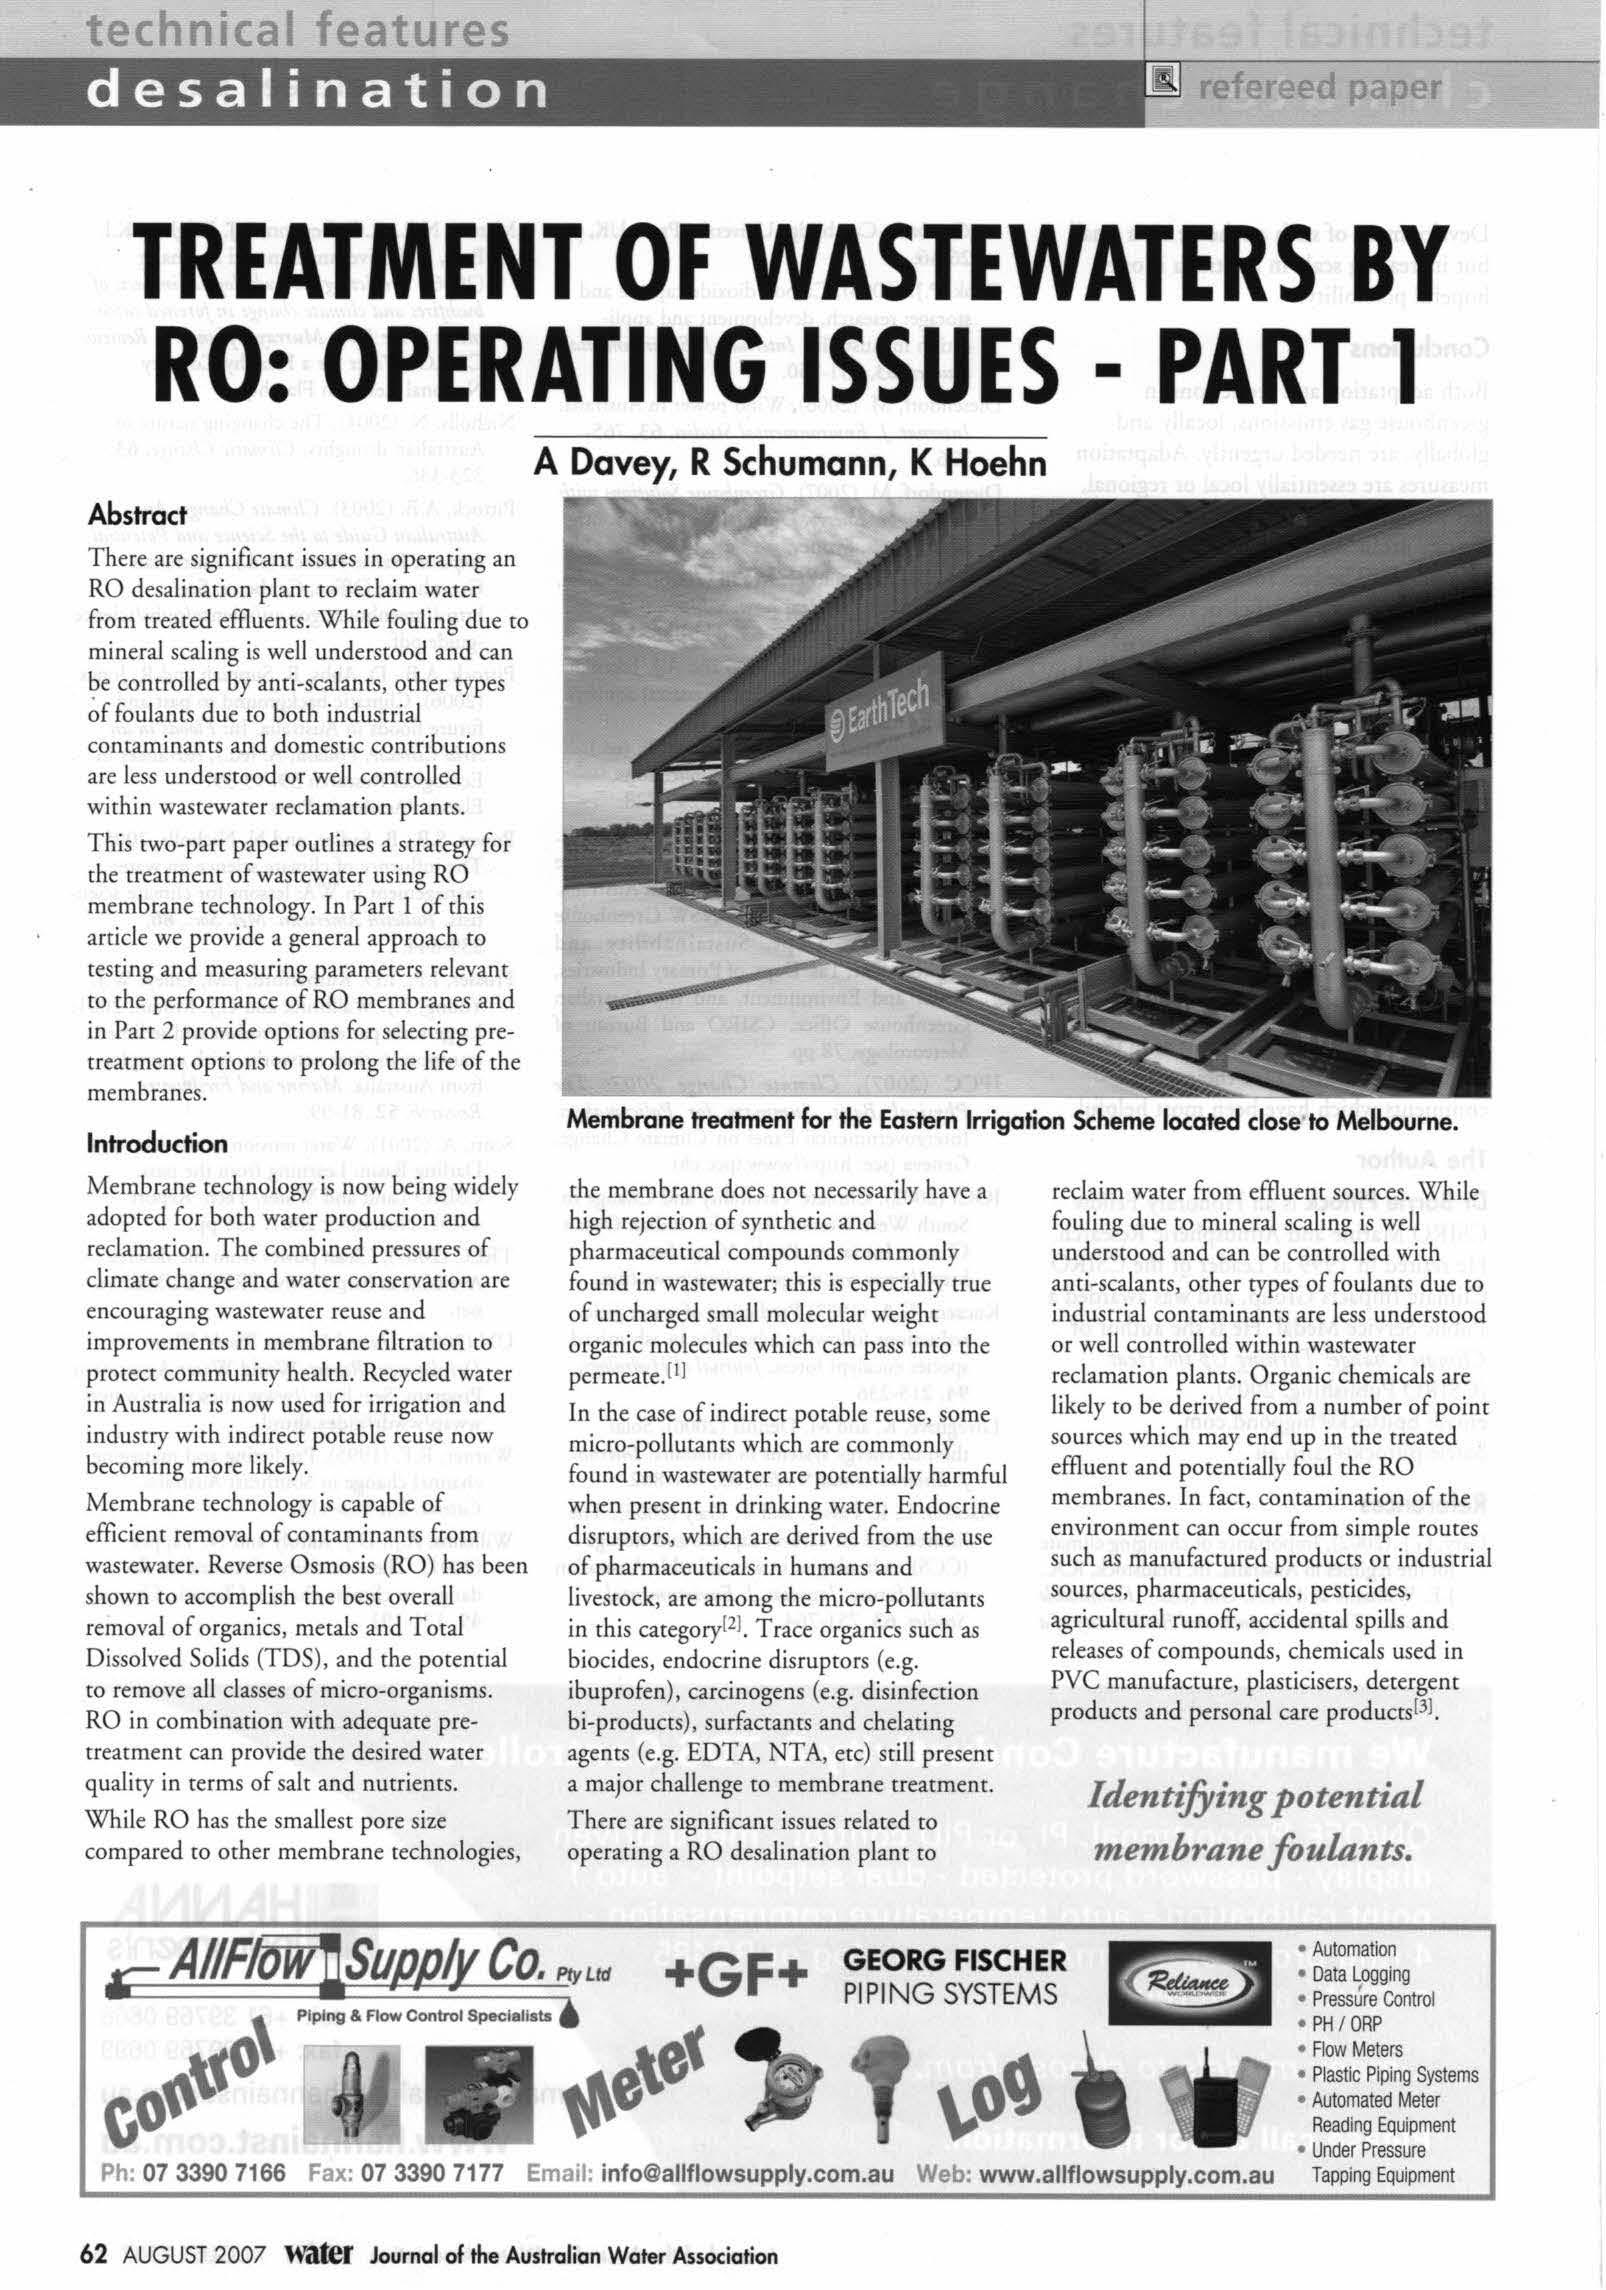 A Davey, R Schumann, K Hoehn
Abstract
There are significant issues in operating an RO desali n ation plant to recla i m water from treated effiuents. While fou ling due to minera l scaling is well understood and can be contro ll ed by anti-sealants, other rypes ~f foulants due to both industrial contaminants and domestic contributions are less understood or well controlled within wastewater reclamation plants. This two -part paper outlines a strategy for the treatm en t of wastewater u si ng RO membrane technology. In Part I of this arti cle we provide a general approach to testing and measu ring parameters relevant to the performance of RO membranes and in Pa re 2 provide options for selecting pretreatment options to prolong the life of the membranes.
Introduction
Membrane te c hnology is now being widely adopted for both water production and re clamation. The combined pressures of cl imate change and water conservation are e ncouraging wastewater reuse and improvements in membrane filtration to protect co mmunity health. Recycl ed wa t er in Australia is now u sed for irrigation and industry with indirect potab le reuse now becoming more likely.
Membrane technology is capable of efficient removal of contaminants from wastewater. Reverse Osmosis (RO ) has been shown to acco mp lis h the best overall removal of organics, metals and Total Di sso lved Solids (T DS), and the pote ntial to remove all classes of micro-o rganisms. RO in co mbination with adeq uate pretreatment can provide the desired water quality in terms of sal t and nutrients. Whi le RO has the s malles t pore size compared to other membrane technologies,
the membran e does not necessa rily have a high rejec ti on of synthetic and pharmaceutical compounds common ly found in wastewater; thi s is especially true of uncharged s mall molecular weight organic mo lec ules which can pass into the permeate. fl I
I n th e case of indirect potable reuse, so me micro-po ll utants which are commonly found in wastewater are potentiall y harmful when presen t in drinking water. Endocrine di s ruptors , which are deri ved from the use of pharmaceuticals in humans a nd livestock , are among the micro-pollutants in thi s category12l . Trace organics s uch as biocides, endocrine di s ruptors (e.g. ibuprofen), carcinogens (e.g. disinfection bi-products), surfactants and chelating agents (e. g. EDTA, NTA, etc) still present a major challenge to membrane t reatment. There are significant issues related to opera t ing a RO desalination plant to
reclaim water from effiuent so urces While fouling due to mineral scaling is well understood and can be controlled with anti-sealants, other types of foulants due to industrial co ntaminants a re less unde rstood or well controlled within wastewater reclamation plants. Organic chemicals are likely to be derived from a number of point sou rces which may end up i n the trea ted effiuent and potentially foul th e RO m e mb ra ne s. In fact, contamination of the environment can occur from simple routes such as manufactured produ cts or industrial so urces, pharmaceuticals, p esticides, agricultural runoff, accidental spills and releases of co mpounds , chemicals used in PVC manufacture , plasticise rs, detergent products and perso nal care products l31
Identifying potential membrane foulants.
Piping & Flow Control Speclellsta
tech ·r~I t:l tures desalination B
Membrane treahnent for the Eastern Irrigation Scheme located close ·to Melbourne.
+GF+ GEORG FISCHER PIP ING SYSTEMS • Automation • Data ~ogging • Pressure Control • PH / ORP f.e\ec • Flow Meters • Plastic Piping Systems • Automated Meter Reading Equipment Ph: 07 3390 7166 Fax: 07 3390 7177 Email: info@allflowsupply.com.au Web: www.allflowsupply.com.au • Under Pressure Tapping Equipment 62 AUGUST 2007 water Journal of the Australian Water Association
Old Technology
Double Header MBR
Heads clog due to non -central air flow
High system stress
Costly maintenance
More cleaning required
Less effective filtration
Technology from KMS
PURON™ MBR
Single Header
• Redu ced Energy Dema nd Centrally located air noules improve aeration efficiency by upto 50%.
• Reduced Capital Costs Simple pre-screening due to low risk of module clogging
• Higher Reliab il ity Minimal maintenance
Head into the future of wastewater treatment with KMS. Choose PURON™ MBR. ll41
2 heads are not always better than one.
KDCH MEMBRANE
SYSTEMS
Th e p rimary g o a l fo r m ost m u ni c ipa l W as t e Water T rea tme nt Plants (WWT Ps) is the p ro t ection of rece iv ing w a t ers from po llut ion (or nu tr ie nt s) and n ot th e re m ova l of indu st ri a l contam i nant s o r refrac to ry orga n ics tha t cau se iss ues w ith m e mb ra ne rrea cm e nrl 41 It is t he re fore necessa ry to cr y to id ent i fy t he co n t amin ants in t h e e fflu e nt to p rov id e so m e wa rnin g about p o t e nti a l fo ulin g iss u es to be fac ed by re ve rse o smo sis
Characterisation o f Tertiary Treated Wastew a te r
T h e re are se ve ra l g roup s of res idu a l o rga n ic c he mi ca ls s uc h as Sy nth e tic Orga n ic
C o m po u nds (SOC), Na tura l O rgan ic
M atrer (NOM) an d Soluble M icro bi a l
P ro d uces (SM P ) ge n era te d d u r in g wastewater crea tm e nt l5l . T he u n ide n ti fi ed bulk of res idu a l cora l o rga ni c ca rbon (TO C) is a lso des ig n a t ed as Effl ue nt Orga ni c m a tt e r (EfO M )
T o prope rl y c ha ract e ri se rhe fo u l ing p o t e nti a l of EfOM it must be c har ac te ri sed ac c o rdi ng to s ize , s t ru ct ure and fu n c t io nali ty and for prac ti cal purposes b y o p e ra tin g an R O pil o t uni t for 3 month s o n the par t icul a r fe ed wa t e r so ur ce Its p o t enti al fo r interac tion w i th th e m e m b ra ne can be d e te rmin ed b y m o lec u la r we ig h t d istribu ti o n , frac t ion a tion a nd fun c ri o na l g roup anal ys is C ertain co nta m i nant s co ntai ned in E fOM whi c h are n ot re m oved in t he pre- t rea rm e nt ste p m ay a d sorb o nt o t h e RO m embra n es w ith drast ic res ult s s uc h as loss o f p lan r p ro du cr io n , excess ive c h e mica l cl eani n g, and re duc e d m e mbran e l i fe . T h e re a re u suall y h ig he r le vels of ch e mical o xyg e n d e m a n d (C OD ) an d nonbiodeg radab le matter in wa sreware rs in co mpari so n with o ch e r wate r t y p es, du e to th e p rese n ce o f E fOM and indu srria l mi c ropollura n ts To red u ce t he e ffec t s of fo u lin g it is ne cessa ry to rem ove deg rad i n g o rg an ic m att e r a nd asce rt a in a rru e indi cati o n o f re fract ionary o rgan ics n o r re m oved in rhe preced i ng WWTP.
H e n ce a ty p ica l app roac h to f ull y c h a ra cterisi n g th e w as rew a rer s h o ul d incl u d e :
• S ilt De ns i ry In dex (S DI) resr in g and d e te rmi na t ion of c oll oi dal frac ti o n s;
• Hi g h Pe r for m an ce S ize Ex clus io n C hrom at og rap h y ( H PS E C) to de te r mi n e t h e m o lecu lar we ig h t d ist ri b u t ion o f o rga ni cs (5 0 to 5 0 , 0 0 0 D a lro n s);
• R ap id Res i n Fract io nat io n to de t e rmin e th e o rg ani c ch a rac te r fra ct io n co n ce n t ra t ion , i ncl u din g humi c a n d fulv ic acid co n te nt a nd h y dr o p h obi c a nd h ydro phili c fra c t ion s ;
Figure 1. GC-MS chromatograms o f DCM extrac t of effl uent adjuste d to p H l l (top) an d p H 2 a fte r addi tio n of dia z om eth an e (botto m). Peaks marked w ith X indicate substa nce fou nd in a b la nk a na lysis.
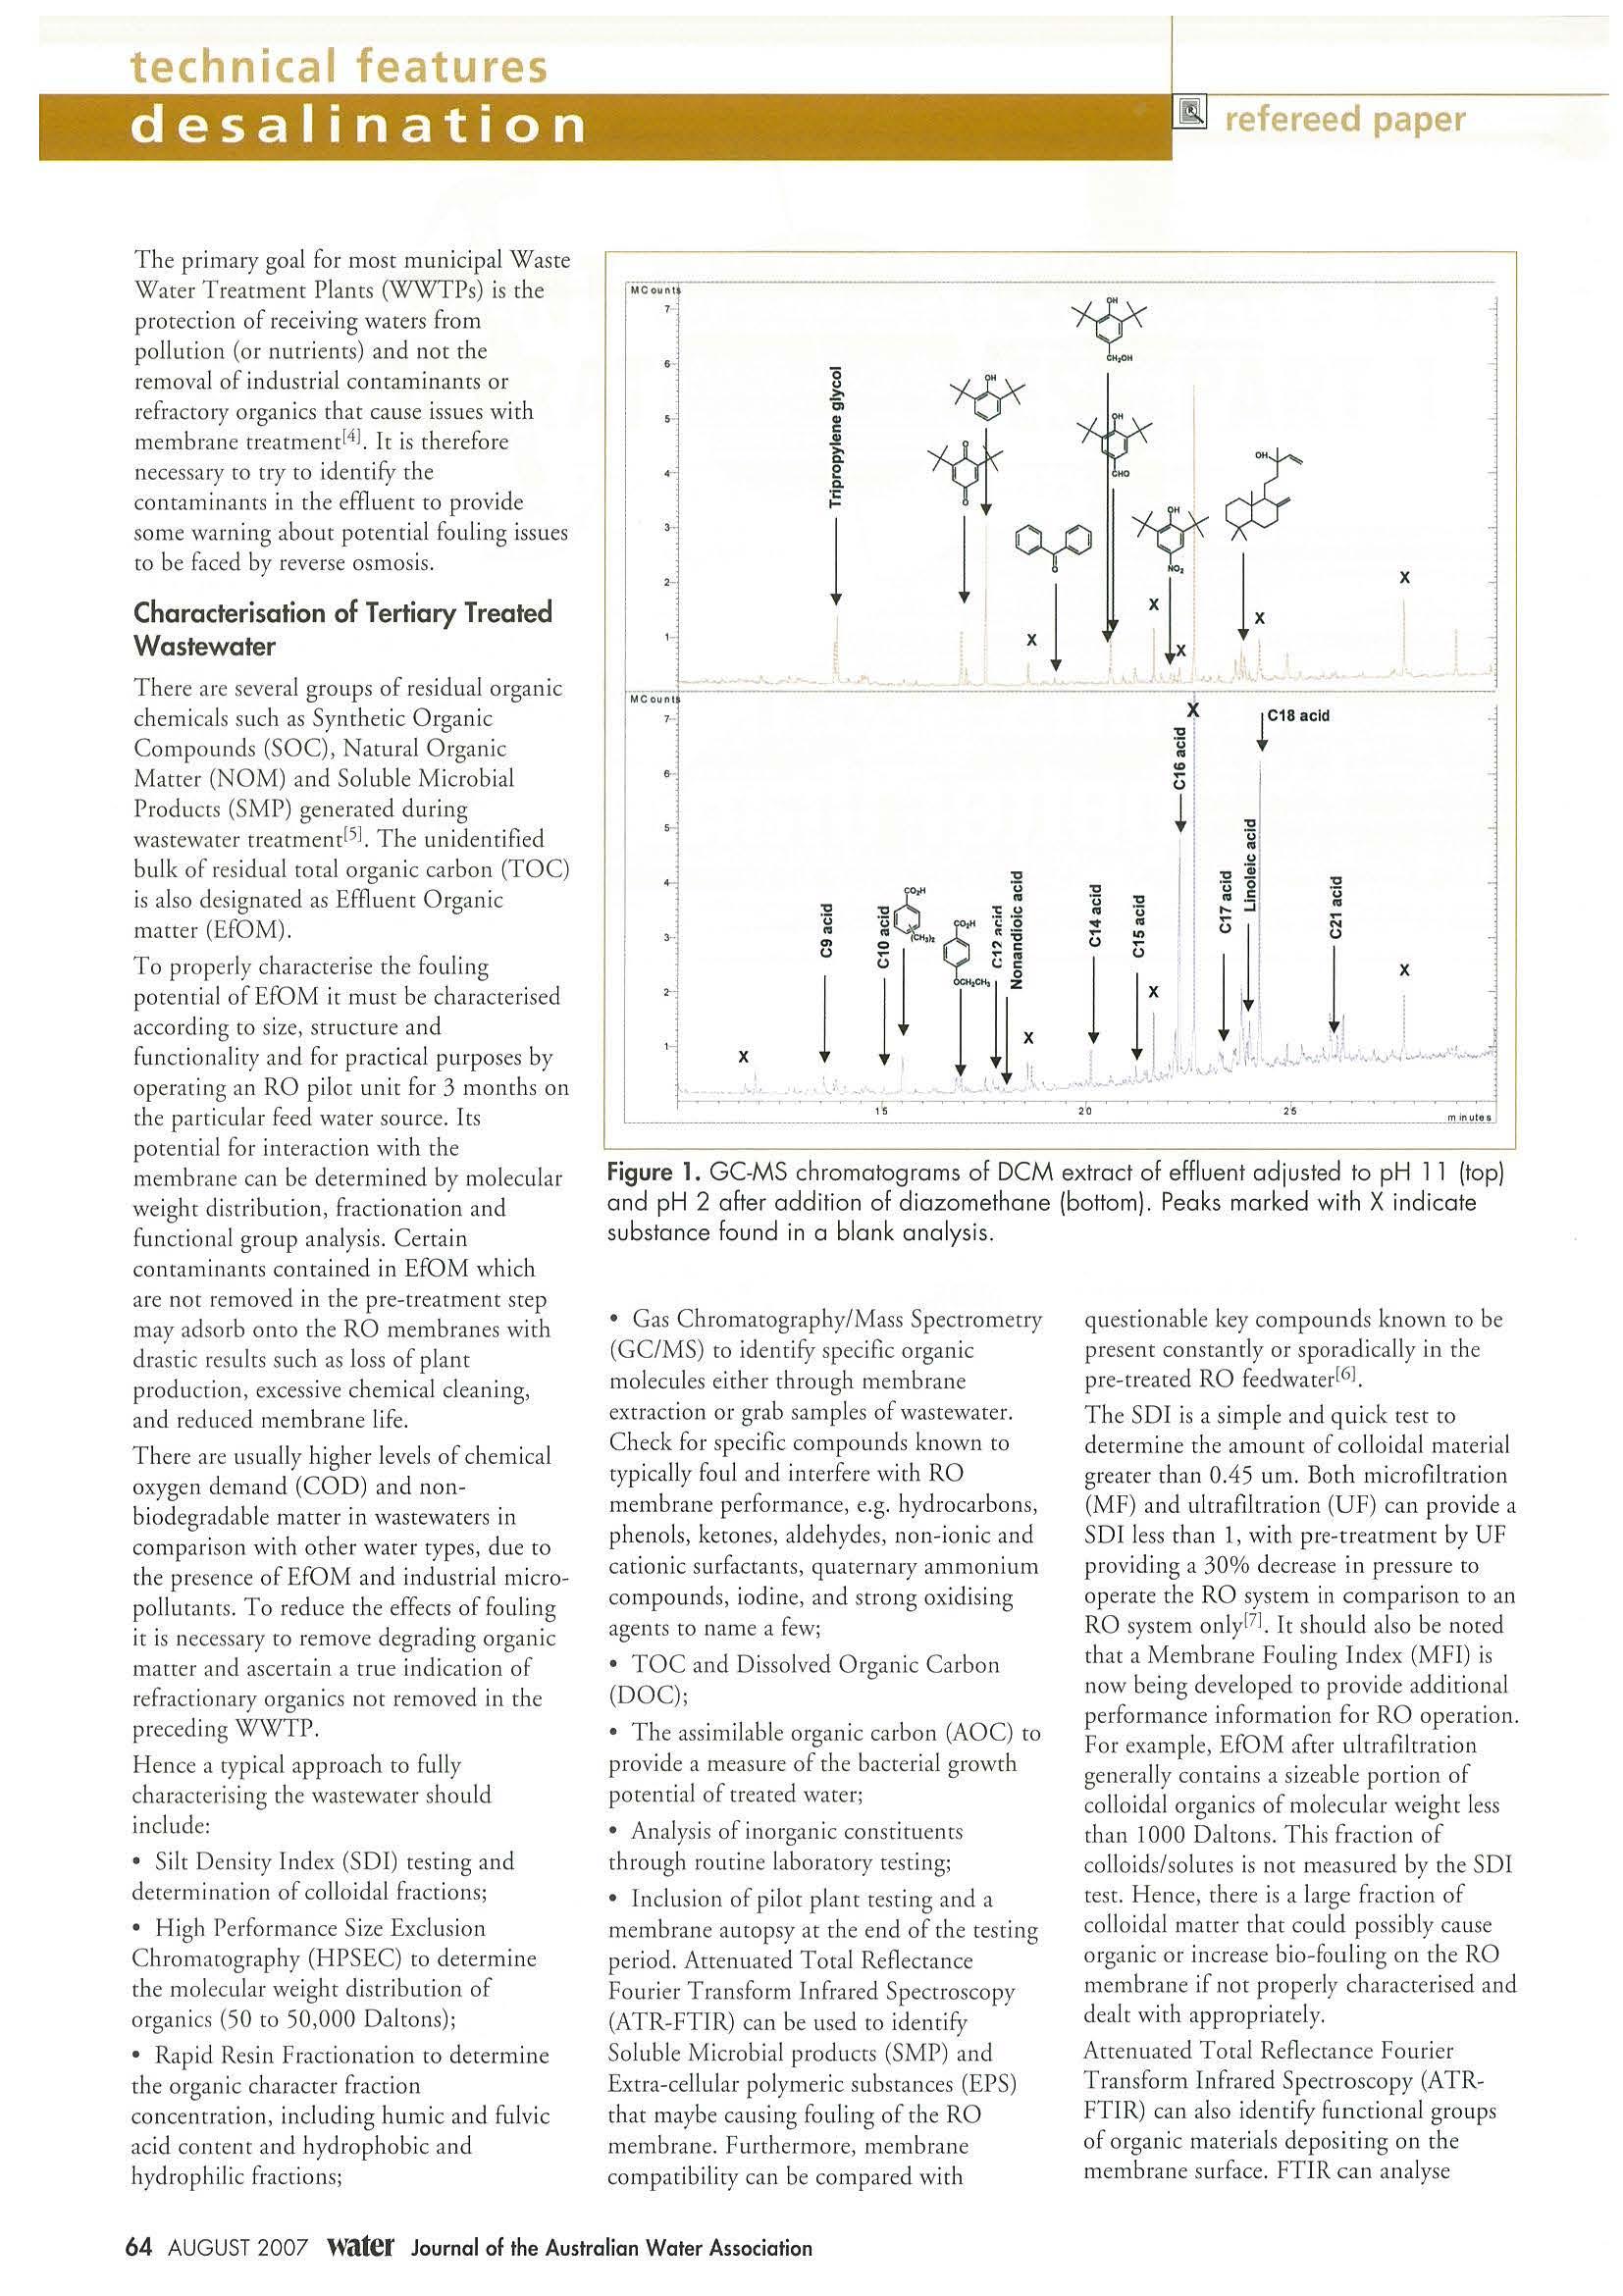
• G as C h ro m a to gr aph y/Mass S p ectrome t ry (GC/MS) to id ent ify speci fi c orga nic m o lec ul es e ithe r t hroug h m e m bra ne ex t rac tion or grab sa mp l es o f w as tewat e r C hec k for sp eci fic co m po u n d s known to ty pica lly fou l a n d i nt er fe re with RO membra n e p er forma n ce, e.g. h ydroca r bon s, p h e no ls , k e ro nes, a ld e h y d es, non - ion ic a n d c a ti o ni c s u rfac ta nt s, qu ate rnary am m on i um c om pounds, io din e, and stro n g oxidis in g age nts to n a m e a few;
• TOC a n d D isso lved O rga n ic Car bo n ( D OC);
• T he ass im i la ble o rg a n ic carb o n (A O C) t o pro v ide a meas ur e o f th e b ac te ria l g row th pote nti a l of treated wa rer;
• An alys is of in o rgan ic co ns ti tu e nt s throu g h ro u t in e lab o rato ry re sti n g;
• Inclu s io n of pil ot p la n t tes tin g an d a m em bra ne a u to psy a t t he en d of th e t es tin g pe ri od Att e n ua t ed T ota l R eflec tan ce Fo u r ier T ransfo rm I n frare d S pec troscopy (ATR- FTlR) can be used to ide ntify
So lubl e M icro bia l produ c t s (S M P) a nd Ex tra-ce llular p o ly m e ri c sub stances ( E P S) th a t m ayb e cau s in g foul i n g of th e RO m e mbrane Furthe rm o re , m embra n e co mparib il icy can be co mpar e d w ith
qu esti ona b le key com pound s k n ow n to be p r ese nt c ons t a ntl y o r s po ra d ica ll y in t he p re-t rea t ed RO fee dwa terl6J
Th e SDI is a s i mp le a n d q u ick res r to d e te rm in e t h e amou n t o f c oll o ida l m at er ia l gr earer rhan 0 .45 um Boc h mic rofi l rra cio n ( M F) a n d ulcra fil cracion (UF ) ca n prov ide a SDI less than l, w i th pre- tr eatm e n t b y UF pro v idi n g a 3 0% de c rease i n pres sure to o p e rate th e RO sys te m in co mp a ri so n to an RO sys t e m o n ly l7l. It s hould a lso be not ed t h a t a Membra n e Fou l in g Ind ex ( MF I) is now be in g d evel ope d co pro v id e a ddi t io n al perfo r man ce i n fo rm at io n for R O o p era ri o n For exa mpl e, EfO M a ft er u lrr a fil cra rio n ge nera ll y co ntai ns a sizea bl e porti o n of co ll o idal org a ni cs o f mo lec ul a r we igh t less t h a n l 000 Dal to n s This fra c tion of co llo id s/so lu tes is no t m ea s ure d b y t he SD I tes t H e n ce, t h e re is a l a rge fr act io n of co lloida l m a tt er ch a t co uld p oss ib ly ca use o rga n ic o r in c re ase b io -fo ulin g o n t h e RO me m bra n e i f n o t p ro pe rl y c h a rac t e ri sed an d d ea l r w ith a p p rop r ia tel y
Arre nuac ed T ota l Refl ecta n c e Fo uri e r T ra n sfo rm In fra re d Sp ec tro scop y (ATRFTIR) can also id e n ti fy fu n ct io n al group s of o rga n ic ma te ri a ls d e po siting o n th e m e mbrane s urfa ce FT IR c an an a lyse
technical features
3,_ I M Co"'I7·I 3-l X 1 "' ., C .!! [ C ... j X iC18 a c id J 0 .. " 0 .. X X " -· 20 ___,........... ·--- 25 ......----.~------------------------------~m"'-'~\!~-~
64 AUGUST 2007 Water Journal of the Australian Water Association
functio n al group peaks at wave num b ers of 1540 to 1640 cm- 1 char represent primary or secondary amides often associated with proteins, peaks at 1040 cm- 1 rep resenting po lysaccharides, p roteins and poss ibly bacterial cel l walls, and peaks at 1720 cm- 1 ind icative of carboxyl ic grou ps typical o f h umic and fu lvic acids l81 Soluble proteins can make-up approx imate ly 90% of the EfOM with molecula r weights> 10 kDa. GCMS can be used to characterise low molecular we igh t organic constituents p resent in wastewater. The RO mem b rane supplie r can ofte n p rovide adv ice on partic u lar organic and inorga nic com po un ds char are det r imental to membra ne pe rformance (i.e. hydroca rb ons, so lvents or heavy metals) usua ll y present in the wastewate r as a resu lt of industrial d isc harges. Comparison o f the compounds id entified by GCMS in rhe wastewa t er whi ch is to be crea t ed b y t he RO me m brane and chose compounds identified by the memb ran e manufacturer as potentia ll y derr imenra l, will help in determ in ing wh ich, if a ny, sol uble species present in rh e wastewater co uld be problematic to good me m bra ne performance.
F or exam ple, a recent GCMS chro matogram obta ined from dic h loromerhane extracts o f effl uent created in a membrane b ioreactor identified two majo r o rga nic fractions in the tert ia ry created effl uent (as shown in Figures I and 2). The base- neutra l fract io n (p H 11 extract) indicated che presence of cr ipropylene glycol, and a number of burylaced phenols. T he prese nce of bucylaced phenols in che wastewater is not unexpected as they are fre qu en rly used in comme rcia l prod uces as antioxidants. T he acid fract ion (pH 2 extract) inclu d ed a n umber of saturated fatty aci ds or h yd rolysis p rod uces of lip ids com m o n ly foun d in wastewater. I n addi t ion, two aromat ic acids were also identi fi ed.
Particula r SOC ident ified by GCMS analys is, whic h can also be de tr imental co membra ne perfor m ance in cluded :
• vario u s me t abolites of bucylaced p hen ols;
• 2,4-d imechyl benzoic acids fou nd in p h armaceut ical prod uces;
• rri - propy lene glyco l which is co m monly used in paints a nd industr ial co atings; a n d
• benzy l alcohol used in the productio n of plas ti cs.
Ma ny of rhe industri al compo un ds ide ntifi ed are hydrophobic in nature which may adsorb and form a waxy coat ing o n the RO memb ra ne surface. Such coat in gs are ha rd to remove throug h chemical cleaning
In chis particular case, whi le mem b ra ne
bio-reacco rs may be an accep t able form of p re-treatment for wastewate r desa lination (and it depends on the source of wastewater) there sti ll appears co be a signi fi cant portion of compoun ds char are passing direcrly through the filter onto the reverse osmosis membrane.
Selection of the RO Membrane
T he most commercially ava ilable membrane con fi gura t ion is rh e spiral wound polyamide based chin film composite reve rse osmosis element. The mem b rane ac es as a mo lecu lar filter char rypica ll y re m oves 95 ro >99% of disso lved inorga nic ions The spi ra l wo u nd m em b rane has a chin dense surface on o ne side which ac es as a sem i-permeab le barrier while che ot he r ac es as a s upport laye r. Reverse osmosis wo r ks through che application of an external press u re grea t er th an os mo ti c p ress u re co cause wate r co flow throug h a semi- permeab le membrane from th e high sali nity side co the low sa lin iry side of th e membrane. There are a large n umber of choices for selec t ing an RO eleme nt for wastewa t er
creacmenr These include evaluating membrane types, membrane surface charge, fou ling resistance, feed channe l spacer thick ness, active membrane area in the elemen t and element co nstructio n , feed pressure requ irements and re jection levels of dissolve d ions and organics. Low Fou ling o r Fou ling Resistant Membranes offer significant advantages in long term flux sta b ility wh en compared co conventional
Thin Film Compos ite (TFC) membranes
Pil ot plane resting of reverse osmosis membranes is t he on ly way co find the op tim u m choice.
Typica lly, acceptable wastewater limi t s for desalination a re 3 pp m ofTOC (Toca! Orga n ic Carbon as C), 6 ppm of BOD (Biological Oxygen Demand as 02) or~ 10 ppm of COD (Chemical Oxyge n De m and as 02). The actual co ncentrations cha t are still acce p rable for sustai nable operat ion of th e RO memb ra nes ca n vary sig n ificanrly depending on the nature of che consri ru enrs ch ar actua ll y make u p th e TOC, COD and BOD.
To maxi m ise the efficie ncy and life of a RO system, effective pre- t reatme n t of the RO
technical features
View a demonstration of ROCI at Stand 17, Victorian Wat.er Industry Engineers & Operators Bendigo Exhibition Centre, September 4-6th Email : sage@sagetechnologycom.au www sagetechnology.com.au SAGE TECHNOLOGY Journal of the Australian Water Association water AUGUS T 2007 65
feedwate r a long w ith selection of approp r ia te operati ng flux is requi red to minimise fou l i ng, scaling a nd degrada tion of mem branes ove r thei r operati ng life ti me. The rate of m em brane surface fou l ing is a funct io n of pe rmeate fl ux rate, measured as L/m 2/ h (li tres per sq uar e metre of membrane area per hou r). The lower the flux rate, the lowe r the rate of fouli n g and at h igher flux rates the rate of fou li ng will in c rease steadi ly up to a cr itical flux rate above w hi ch fo u ling w ill inc rease ex ponentially. The rela t ionship o f foul i n g rat e to the flux ca n us ually b e demonstrated bo th dur ing p ilo t t esti ng a nd full scale p lant opera tion The increase in fou ling ra ce w ith highe r flux is a resulc of high er concentrations of organics an d ocher fou lants at the mem bran e su rface a nd highe r dr ag force pe rpe nd icula r to membrane su rface. A high e r c ro ss flow veloc i ry (fee d -b r i ne flow) parallel to the membrane su rface us uall y helps to lower rhe rate of fouli ng. Foulants a re flushed away from th e membrane s urface b y the highe r she aring action Higher area membrane ele m e nts allow for th e use of fewe r pressu re vesse ls and h igher feed a nd conce ntrate flows. H ence, foul ing is known to increase as cross flow dec reases , flux inc reases and concent ration of the foulant incre ases. C ritical flux is al so an impo rt ant parame t er because th is is th e po i nt a t w h ich d epo sition of p art ic ulate s, m icro-orga n isms a nd p rec ipitation of spec ies of lim i te d so lubil iry c omm ences for a given feed an d cro ss- fl o w ve lociryl91
Summary
There ar e sign ificant iss ues related to opera ti ng a RO desa l inat io n p la nt to re clai m w ater from effluent sources. W h ile fou lin g du e to min e ral scali ng is we ll understood a nd can b e controlled with a ntiscalants, other rypes of foulants rypically found i n created effluents ar e less un d erstood o r well controlled within wastewater re clamation p lants. The identificatio n o f t hese contam inants i n the wastewater and us e o f p rope r analyti cal techni qu es to charac t erise the m are relevant to th e performance of the RO membrane for desa li nat ion. The ch o ice of the membr a ne rype , active membran e a rea etc., is also important i n optim ising des a li n ation performance. F i nally dete rmining t h e optimum per m eate flux race to min imise fou l ing wh ile still m a intaining accep t ab le produ c t water generation ra t es is c ritical to the succ essfu l d esal i nation of trea te d effluent w i th R O membranes
W ith d ifficu lt wastewa ter it is necessary to review th e risks of opera t ing che reve rse osm osis afte r pre-treatment. Some organ ic
and i ndus tri al com poun ds are not re mo ved effectively by the b iological wastew ater t rea t m ent, te rt iary filcration or che mica l addi tion Carefu l des ig n of pre-treatment is necessary to minim ise RO foul i ng from colloidal, o rgan ic and biological foulants. In part 2 o f this a rti cle we w i ll d isc uss op tion s for adequa t e pre- tr eat men t.
The Authors
Anthony Davey is the Techn ica l Ma n ager IMD, Ea rth Tec h , Melb o urn e Austra lia (anchony.davey@earthtech.com au); Russell Schumann is a Senio r Resea rch Fellow wi th Levay & Co Env ironmental Se rvices in th e Ian Wa rk R esea rch I nst itu te at th e Universiry o f So u th A u stral ia (Russe ll. Schumann@ un isa.edu.a u); and Kai·Uwe Hoehn is a Se ni or Account Manager for Dow Water Solutions - Dow C h em ical (Au stral ia) Limi te d , based in Sydney (kuhoeh n@d ow.com).
References
[
l ) DOW Tech ni cal Fact Sheet "Est imated Pe rce nt Reject ion of Various So lutes by FILMTEC Membranes" - Form No. 609002 40-204
[2) Falconer I.R., Chapman H.F. , Moore M., Ranmuchugala G., " E n do crine-Disrup ting Compounds: A Review of Their Chall enge to Sustainable an d Safe W ate r Supply and Wate r Reuse" (2006)
[3) Petrovic M , Go n za lez S., Barcelo D. , "Analysis and removal of emerging co nt aminants in was t ewate r and drinking wa ter", Trends in Analytical Chemistry, Vo l. 22, No.10 (200 3), pg 685 - 696
[4) Davey A, Schumann R. and D avey, D., " Cha r acterising Was t ewate r fo r Ulrrafilrrarion", Water, Vo l 33 No 4 , (2006). pg5 7-61
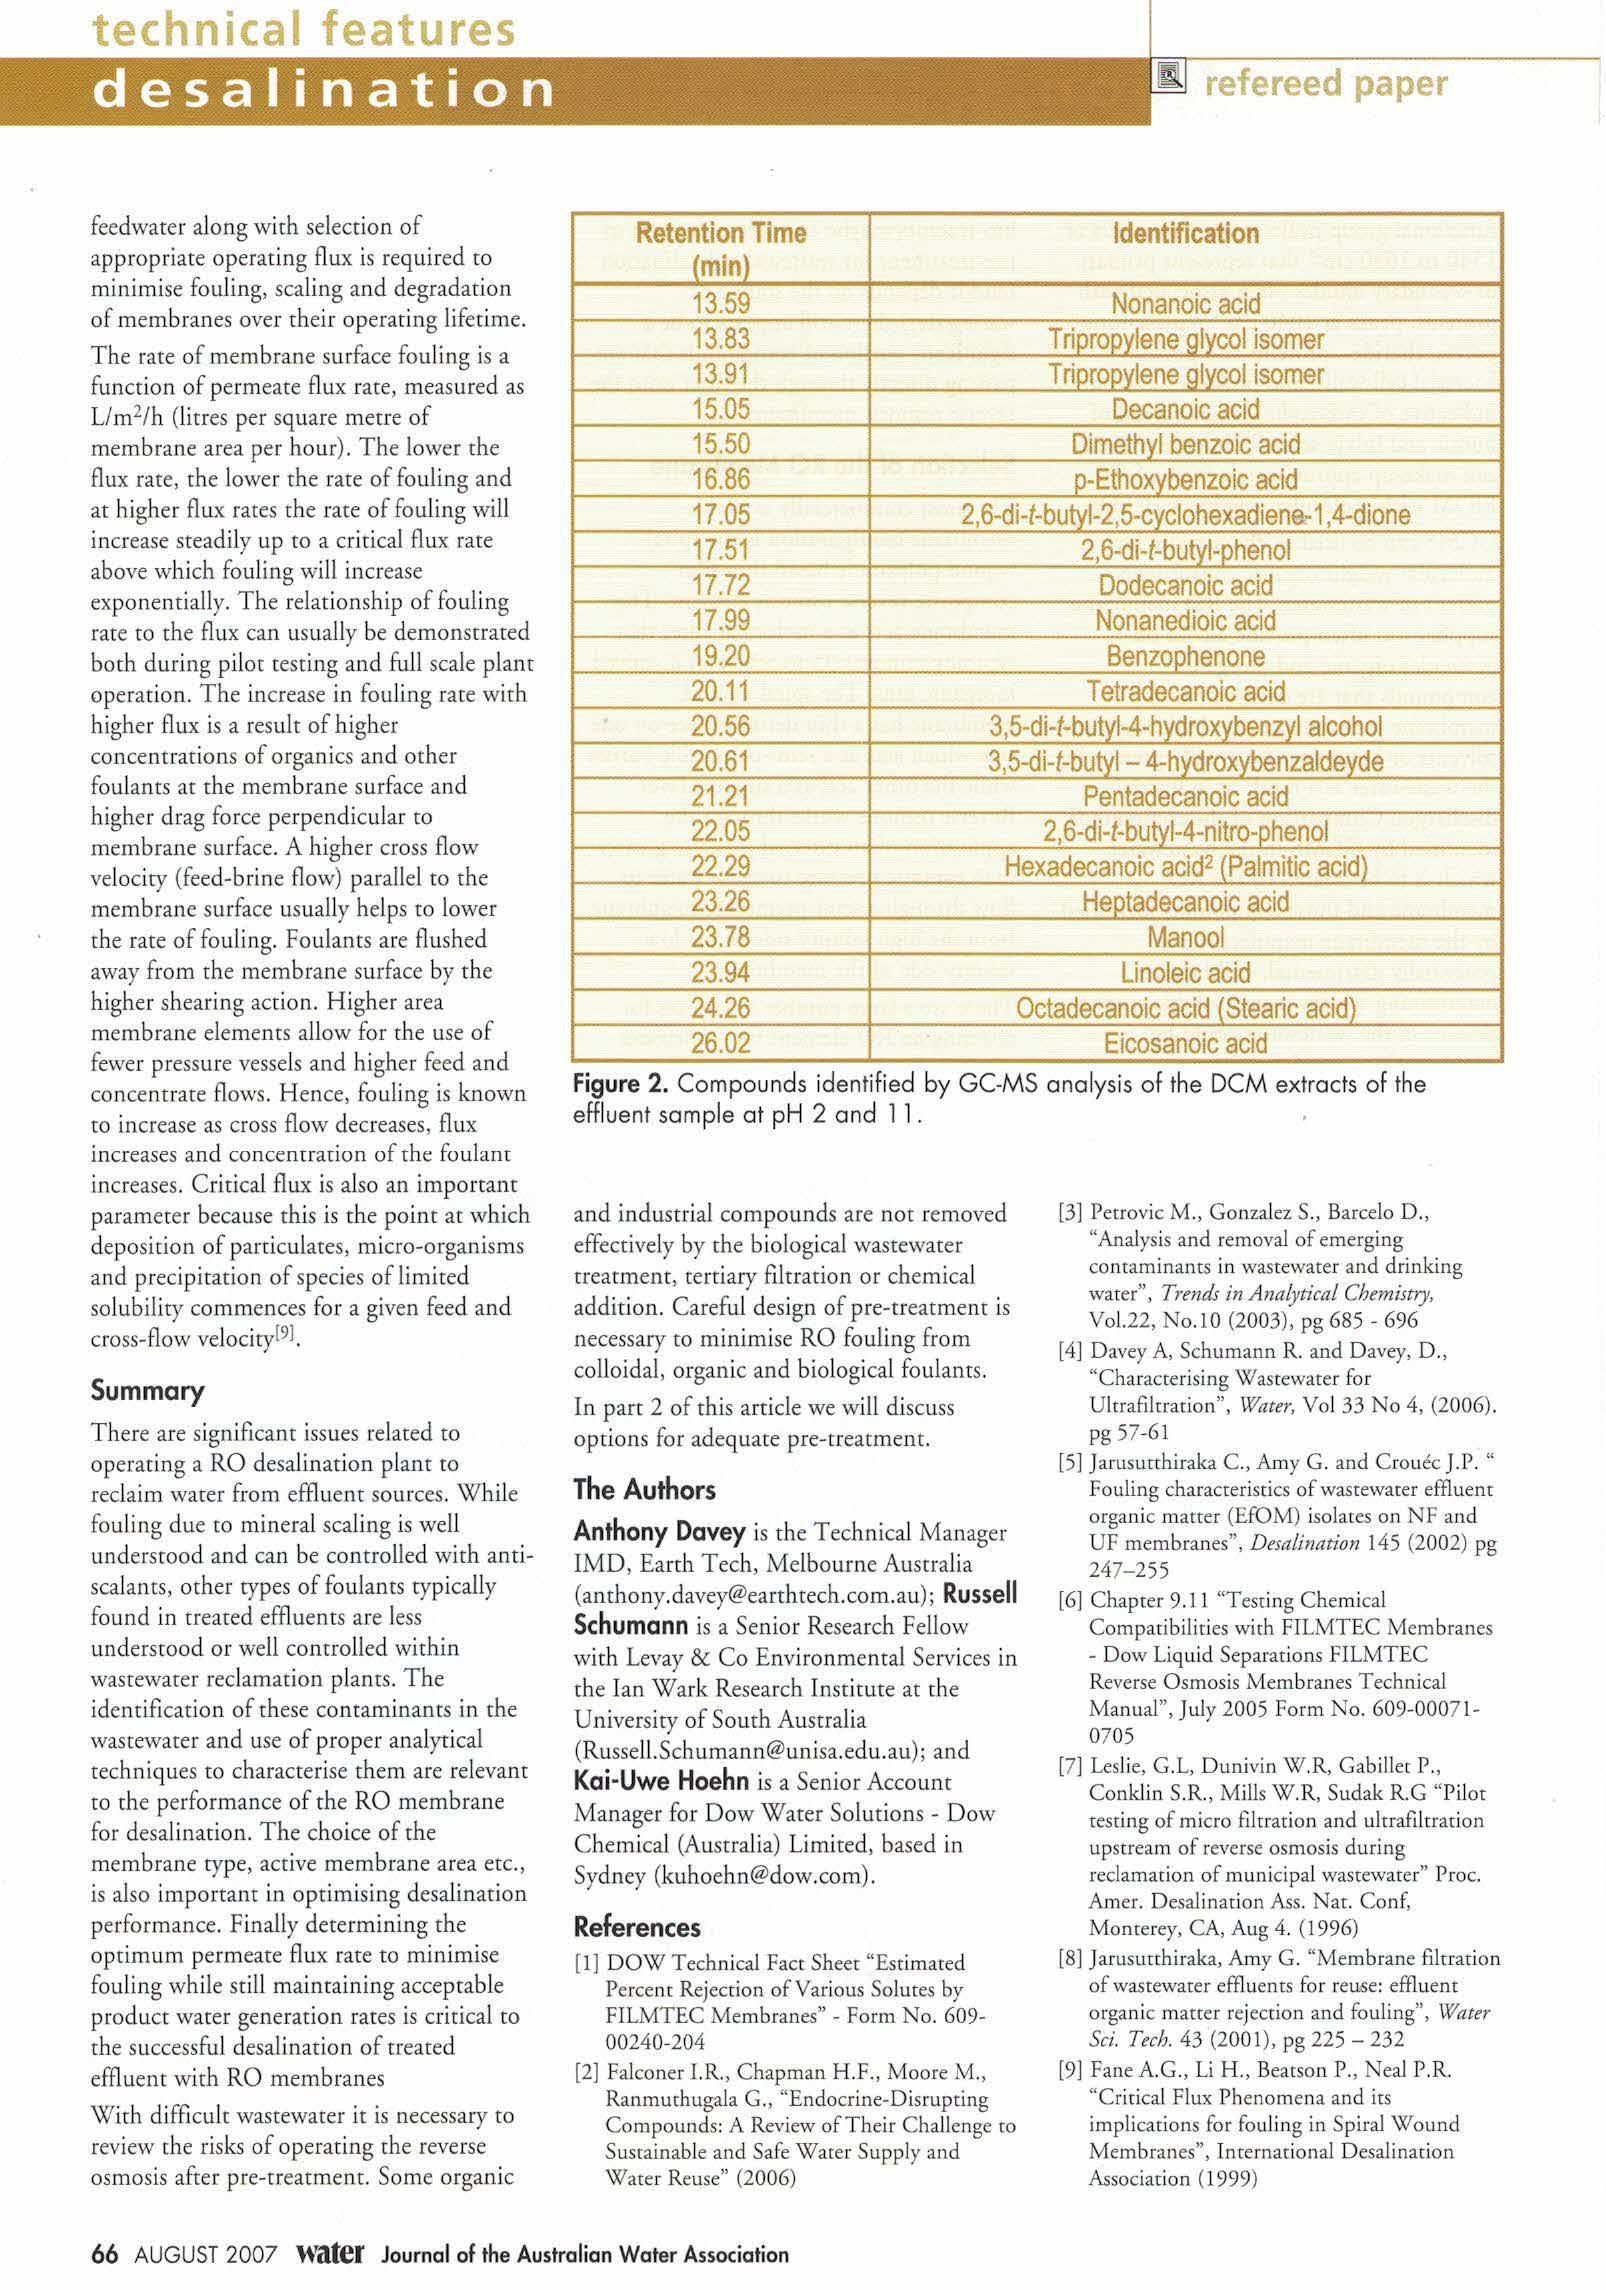
[5) J arusutthiraka C. , A m y G. and C rou ec J.P. " Fouling characteris t ics of wastewater effiuent orga ni c m att er (EfOM) isola res o n NF and UF membra n es", Desalination 145 (2002 ) pg 247-255
[6] Chapter 9.1 1 "Test in g Che mi cal Compar ibilir ies wirh FI LMT EC Membranes - Dow Liq uid Sepa rat io n s FI LMT EC
Reverse Osmosis Mem b ran es Technical Manual ", July 2005 Form No. 609- 000 7 10 705
[7] Les li e, G.L, D un ivin W.R. Gabille r P. , Con kli n S.R., M ills W.R, Sudak R.G " Pi lot rest in g of m icro filt ratio n a nd ulrrafi ltrat ion ups trea m o f reverse osmosis during reclama t ion of muni cipal wastewater" Proc A m er. Des alinat ion Ass Nae. C onf, Monter ey, CA, Aug 4. (1996)
[8) J arusutthiraka, A my G "Membr ane filtratio n of wastewat e r effi u enrs fo r r euse: effi u enr orga n ic m atter rej ect ion and fouling" , Water Sci. Tech. 43 (200 1), pg 225 - 232
[9] Fane A.G., Li H. , Beatso n P. , ea! P .R. "Cri t ical Flux Ph eno me n a an d its implications for fo ul in g in Spiral Woun d Membranes ", I nternational D esalination Associat ion (1999 )
technical
features
Retention Time Identification (min) 13.59 Nonanoic acid 13.83 Trioroovlene alvcol isomer 13.91 Trioroovlene alvcol isomer 15.05 Decanoic acid 15.50 Dimethyl benzoic acid 16.86 o-Ethoxvbenzoic acid 17.05 2,6-di-t-butvl-2,5-cvclohexadiene- 1,4-dione 17.51 2,6-di-t-butvl-phenol 17.72 Dodecanoic acid 17.99 Nonanedioic acid 19.20 Benzoohenone 20.11 Tetradecanoic acid 20.56 3,5-di-t-butyl-4-hydroxybenzyl alcohol 20.61 3,5~i-t-butvl - 4-hydroxybenzaldeyde 21.21 Pentadecanoic acid 22.05 2,6-di-t-butvl-4-nitro-phenol 22.29 Hexadecanoic acid2 (Palmitic acid) 23.26 Heotadecanoic acid 23.78 Manool 23.94 Linoleic acid 24.26 Octadecanoic acid (Stearic acid) 26.02 Eicosanoic acid
Figure 2. Co mpound s identified by GC-MS analysis o f the DCM extrac ts o f the effl uent sam ple at p H 2 and 1 1
66 AUGUST 2007 Water Jo urna l of the Australian Water Assoc ia tion
TOLERANCE OF MARINE LIFE TO DESALINATION PLANT DISCHARGES
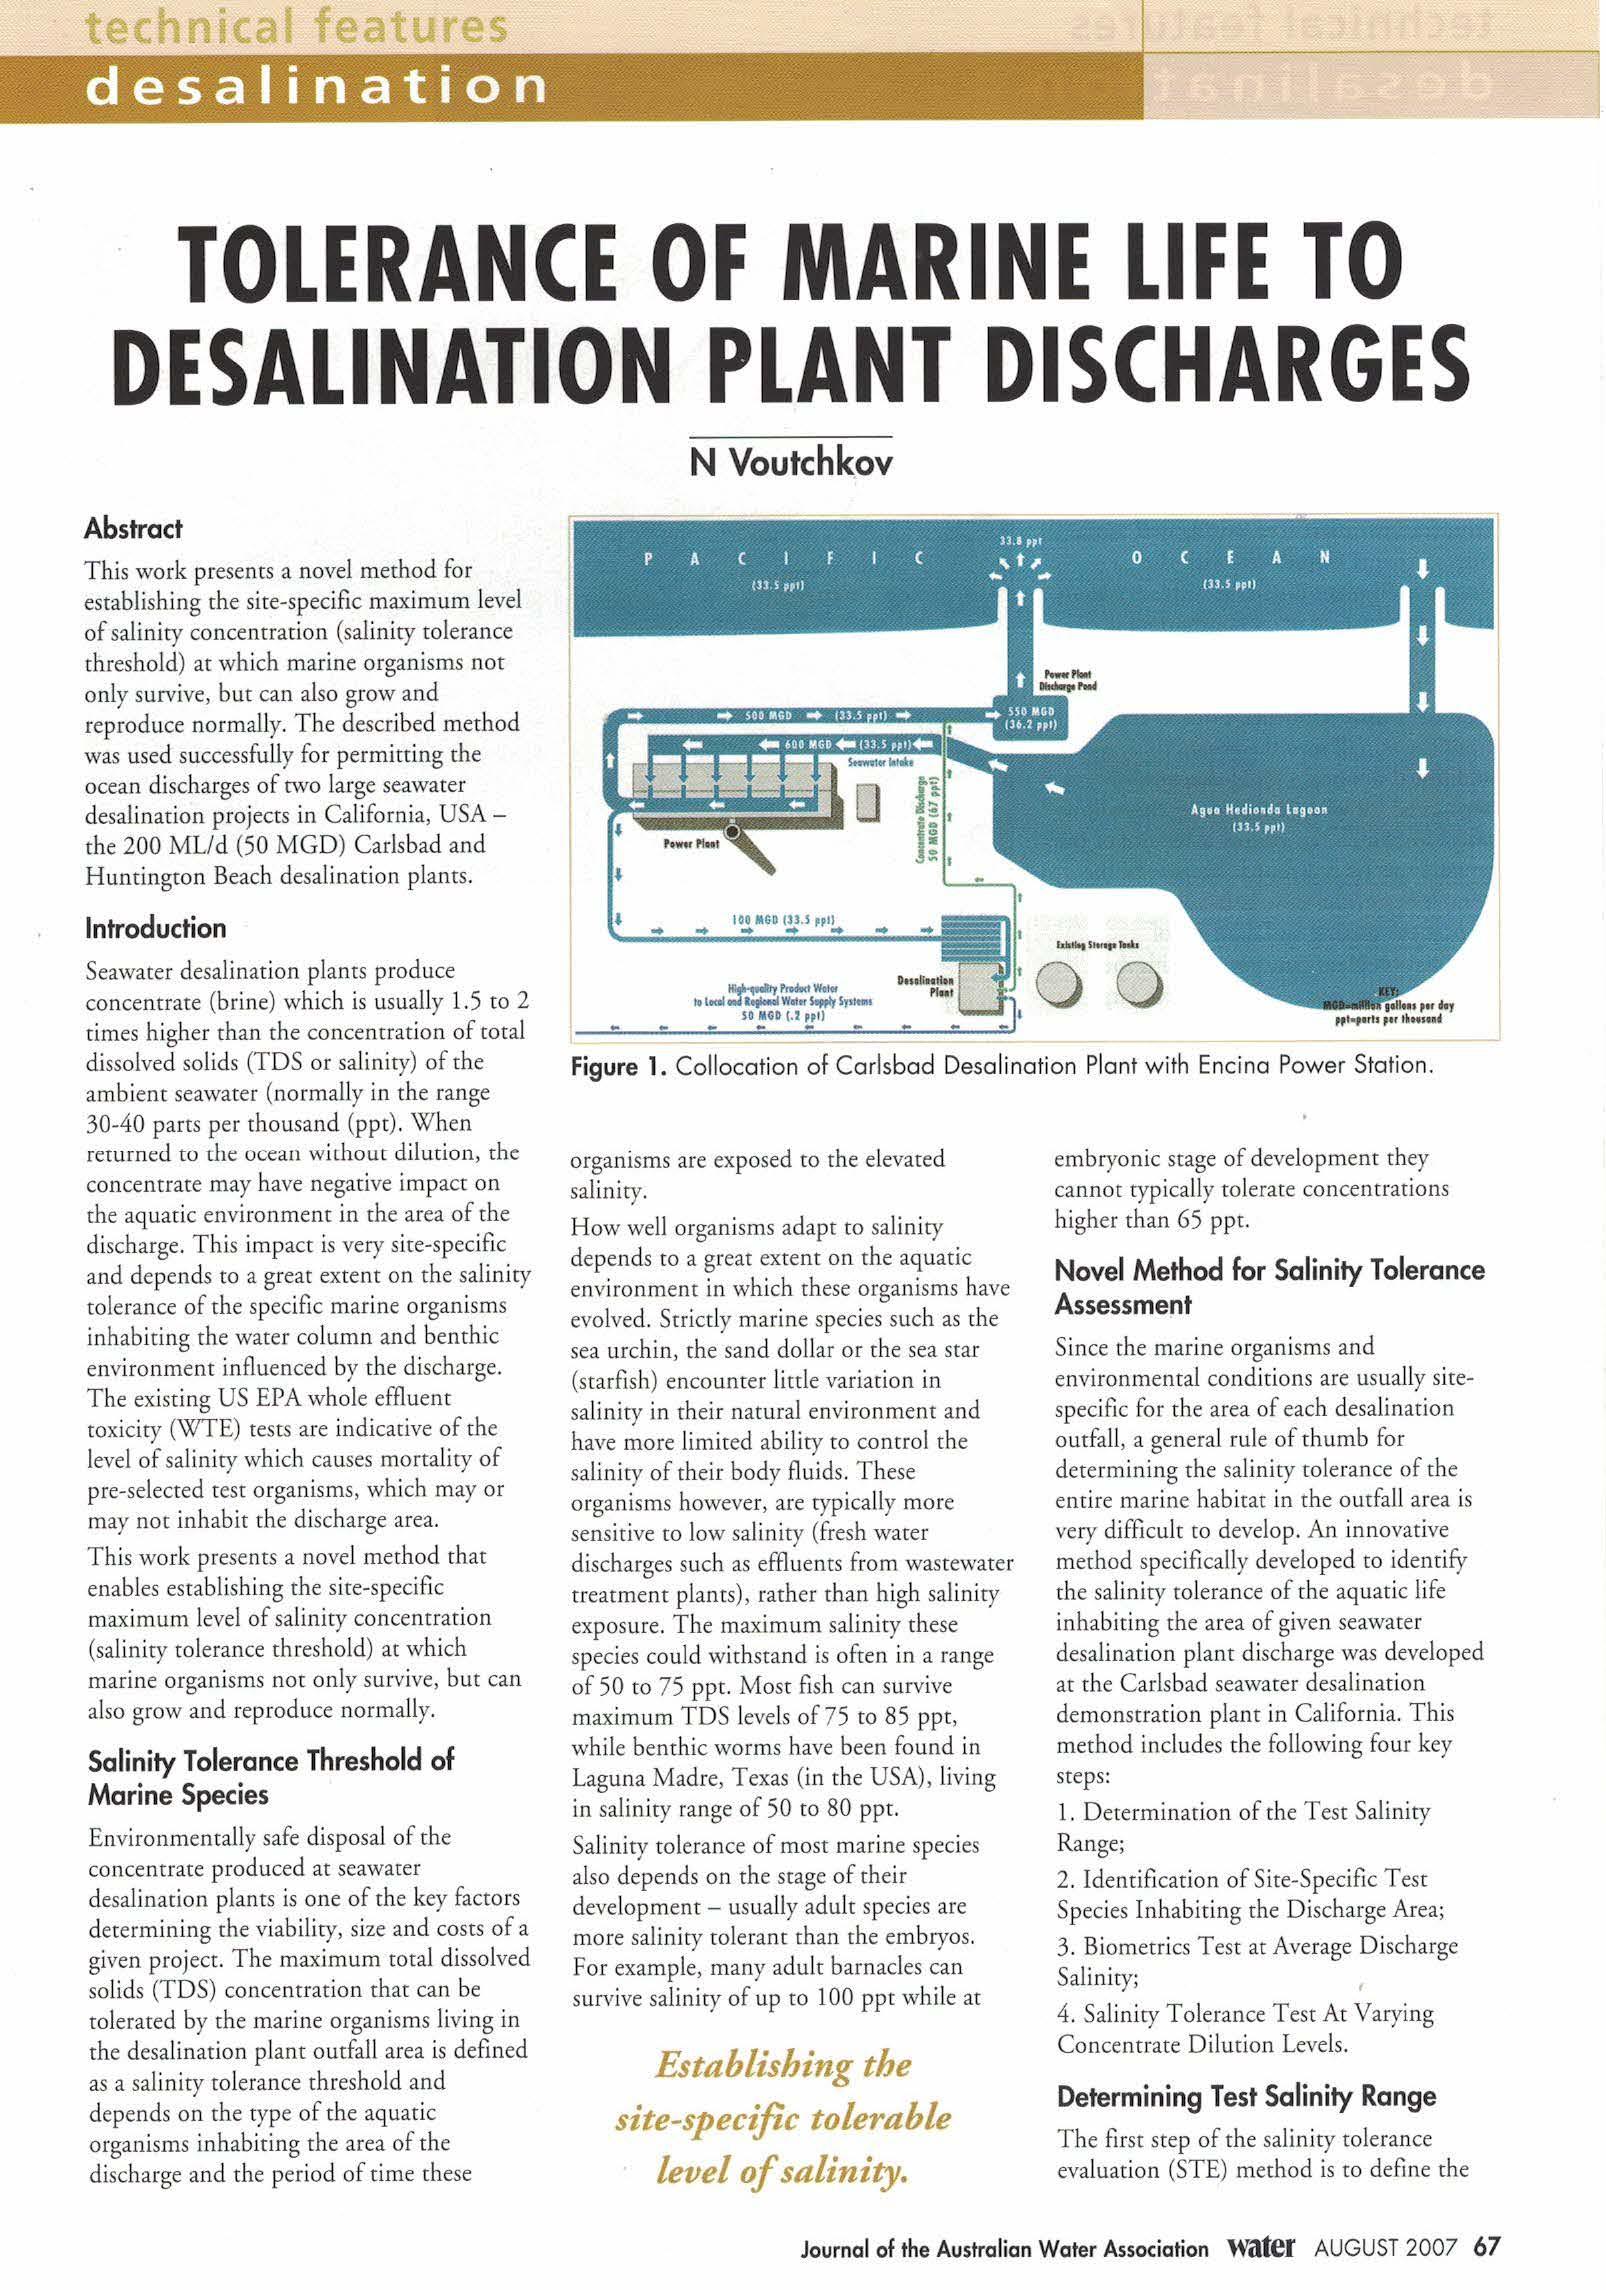
Abstract
This work prese nt s a novel method for establish ing the si t e-specifi c maximum level of sali n ity conce n tra t ion (sal in i ty tol erance threshold) at wh ich ma ri ne orga n is m s no t only survi ve, b u r c an also grow and re prod uce normally. The de scribed me tho d was used su ccessfu lly fo r permi tt ing the ocean d isc h arges of two la rge seawa t er d esal in ation projec t s in Cali fornia, USAt he 20 0 ML/ d (50 MGD ) Carlsba d an d Huntingto n Beach desal in a t io n pla nt s
Introduction
Seawater desalina ti on pl a ne s prod uc e co n ce ntrate (bri ne) whi c h is u suall y 1.5 to 2 ri mes h ig h e r t h a n the co n ce n trat io n of total dissolve d so l id s (T D S or salin ity) of the a mbi e nt seaw a t er ( normall y i n th e range 30-40 parts p er thou sa nd (p p r) W h e n ret u rnc:: <l tu rhe oce a n wi thou t dilurion , the conce nt rate may h av e nega t ive imp act on the a qu a ti c env ironme nt in the a rea of the d ischarge Thi s impac t is very si re-s pe c ific a nd d ep end s to a g rea t ex tent o n the salin ity to le ra nce of t he sp ec ific m ar i n e o rga n isms in hab iti ng the wate r co l um n a nd b enchic e nv i ro n m e nt influenced by the discharge.
T he existing US EPA w hol e effiuent toxi c i ty (WT E) tescs a re indicative of the level of sal in ity whi c h ca uses m ortal ity of pre-selected t est o rganis m s, wh ic h m ay o r m ay not in h abit th e d isch arg e area
T h is wo rk presents a novel m e thod that ena bles e st ab l ish in g the s i te-s peci fi c m ax imum level of sal i nity conce n tra ti on (sal in i ty tole ra nce th res hol d ) at w hi ch marine organ isms n o t only su rvive, b u t ca n also grow and re produce n or m ally
Salinity Tolerance Thre shold of Marine Species
E nviron m entally safe d isp os al o f th e conce ntrate p roduced at seawater d esali n at ion p lanes is one o f th e key fac t o rs d et er mi n ing the viab i lity, s ize a nd co sts of a given project. The maxi mum total di ssolved so lid s (T D S) co nce ntra t ion th at c a n b e tol era ted by t he marine organi sm s l iv in g i n th e desa li nat io n p lane o u t fal l a rea is de fin ed a s a sal i n ity to lera nc e th res ho ld and d epends o n th e type of th e aquat ic organism s in h ab iti ng the are a o f the disc h a rge a nd the per io d o f rime th ese
orga ni sms are ex posed to t he elevated sal i n ity
H ow well orga n ism s adapt to sal in ity d ep e nd s to a g reat ex ten t o n t he aqu atic e nvi ro nm ent in wh ic h these orga n is m s have evo lved. Strictl y ma rine spec ies su ch as th e sea urchin, th e sa nd doll ar o r th e sea sta r (s t ar fis h) encoun t er l ittle vari at io n in sa lin ity i n t hei r n at ural env i ronment and h ave more lim ited ab ility to con tro l the salinity of t h ei r body flui ds. These o rga n isms howeve r, are typica lly more sensitive to low sal in ity (fr esh water discharges su c h as effluents from was t ewa te r treatment planes) , rath er than h ig h sal i n i ty expos ur e The m axi mum sal i nity th ese specie s c ou ld withsta nd is o ften i n a ra nge of 50 to 75 ppr. Mos t fis h ca n su rvive m ax imum TD S levels of 75 to 85 p p r, whil e ben th ic w or m s have b een fo und i n Laguna Mad re, Texas (i n the USA), l iv ing in salin it y ra nge of 50 to 80 pp r.
Sali ni ty toler a nc e of most m ar ine sp eci es also depends o n the stage of their d eve lop m en t -usu a lly adu lt spec ies are mo re sali ni ty tole ra nt t han the em b ryos. Fo r ex a mple, man y ad u lt barnacl es can s u rv ive sal inity o f up to 10 0 pp r w h ile a t
e m bryon ic stage of d evelopm ent t h ey ca nno t t ypically to lera t e concen trations high er than 65 p p r.
Novel Method for Sa linity Tolerance
Assessment
Si n ce th e m ar ine o rgan isms a nd e nviron m en t al cond itions are us ua ll y s itespec ific for th e area of each d esa li nation o u tfa ll, a ge ne ral rul e of thu mb for dete rmin i ng t he sal inity tole ra nce of t h e ent ire mar ine hab itat in t h e o u tfal l ar ea is very di ffi cu lt to d evel o p. A n in nov a tive m ethod sp ecifically develope d to id enti fy th e sa li nity to lera n ce of th e aqu a t ic life i n hab iti ng the a rea of give n seawa t er desalina ti on p lant d isc har ge was d evel oped at th e Carls b a d seawa t er desali n a t ion d e m onstra ti on plane in Cal ifo rnia. Th is method includ es th e following fo u r key s teps:
1 De te rmi n at ion o f th e T est Salinity
Range ;
2 Ide ntifi cation of Site-Specific T es t S pecies In h a b i t in g the D isch arge Ar ea;
3. Bi o metr ics Test at Ave rage D ischarge Salin ity;
4 Sal in i ty T oleran ce T est A t Varyi ng
Concent rate Dilutio n Levels.
Determining Test Salinity Range
T h e fir st st ep of the sali n it y tol e ra nce eva l ua t io n (S T E) m ethod is to defi n e th e
technical features desalination
N
..
Voutchkov
IH MGI tU S ppl ) .. .. .. .. ..
Figure 1. Collocati o n o f Carlsbad Desa li na ti o n Pla nt with Encino Power Station.
Establishing the site-specific tolerable level of salinity.
Journa l of the Austra lian Water As sociation Water AUGUST 2007 67
m i n i mum a n d m axi mum T DS co n ce nt ra t io n s t hat are projected to occ u r i n the a rea of t he d ischa rge a ft e r t he st art u p o f p lant o perat io n s. T h is sal i nity ra nge shou ld be estab lis he d ta kin g u n d er consid era ti on th e effect of m ixi n g a nd asso c iate d d il u tion in th e area of th e disch arge as a res u l t of th e site-s p ecific n at u ra l h ydrodynamic forces i n the o cea n (currents, w inds, ti d al m o vements, te m pe ratu re differe n ces, et c) as well as the m ixing e n ergy i n trod uced with t h e desal i nation p lant d isch a rge d iffuse r sys te m. If the d esa lin atio n pl a n t c o n ce nt rate is d il ute d wir h a n o th e r d ischa rge (i.e. cooling water fro m power p la nt o r wastewate r treat m e nt p la nt effiuent), p r ior to t h e ex it fro m t h e o u t fall i n to t h e ocea n , ch is a ddi tion al dilu tion s hould also be accoun ted for when esta b l ish i ng the sali ni ty ra nge for wh ich the sal in i ty tolera n ce of the a q ua ri c specie s is assessed Beca use o f the co m p lexi ty of t h e va rious facrors that im p act the m ix i ng a n d d il u ti o n o f d esal in ation p la nt c once nt rate wit h th e am bie n t ocea n wate r, especia lly for lar ge projects (i.e projects wi th d isch a rge vo lum e o f 1 MGD o r higher), rh e actu al sal i n ity range tha t wou ld occu r i n t he area of th e d ischa rge is recomme nded co be d e ler m ined based on h ydrodyn amic mo delling.
As a m i nimum, th e sal i n ity rest co n ce n t rations recomme nded co be used a re : rh e T D S c on ce nt rati o n at t he mid dle of the wa ter colu m n a n d t h e m id d le of t h e zo ne of in i tial d il u t ion (Z ID); rh e m axi mum seabed sal in i ty c o n ce ntra ti o n at the ed ge o f the Z ID The ZID is d efi n ed as the a rea of rh e ocea n wit h in 1, 0 0 0 fr fro m the poi nt of t he d esal i nation p la nt d isc harge.
Iden tify ing Test Species
T he pur pose of rh e seco nd step o f rh e STE m ethod is to id ent ify the mo st se ns itive, si te -specific species ch at wou ld be in d icative o f t he sal in ity to le ran ce of t he aqu atic flora a nd fau n a i n th e a rea of th e des a li n a tion p lant d isc ha rge These spe c ies are used for the Bi om e rr ics a n d Sal i nity T olera nc e T esrs. A r le a st t h ree species a re reco mm e nd ed to be se lected for the tes t s: one rep resentat ive for th e fis h pop u lat ion i n the area, o n e fo r the inve rt eb ra t e po pu lation a nd on e for ma cro-algal p opu lation (i.e. kelp, red alga, ere), if s uc h species arc prese n t a nd occ u r in s ig n ifi ca nt n u m bers. The selec ti on of the speci fi c rest species sh ou ld b e com ple ted by an expert ma ri n e b io logist who is very fam ili a r w it h rh e si te-specific a qu a t ic fl ora and fau n a in rhe are a o f t he d esa l ina t i on p la nt d isc h arge. The tes t species shou ld be selected based
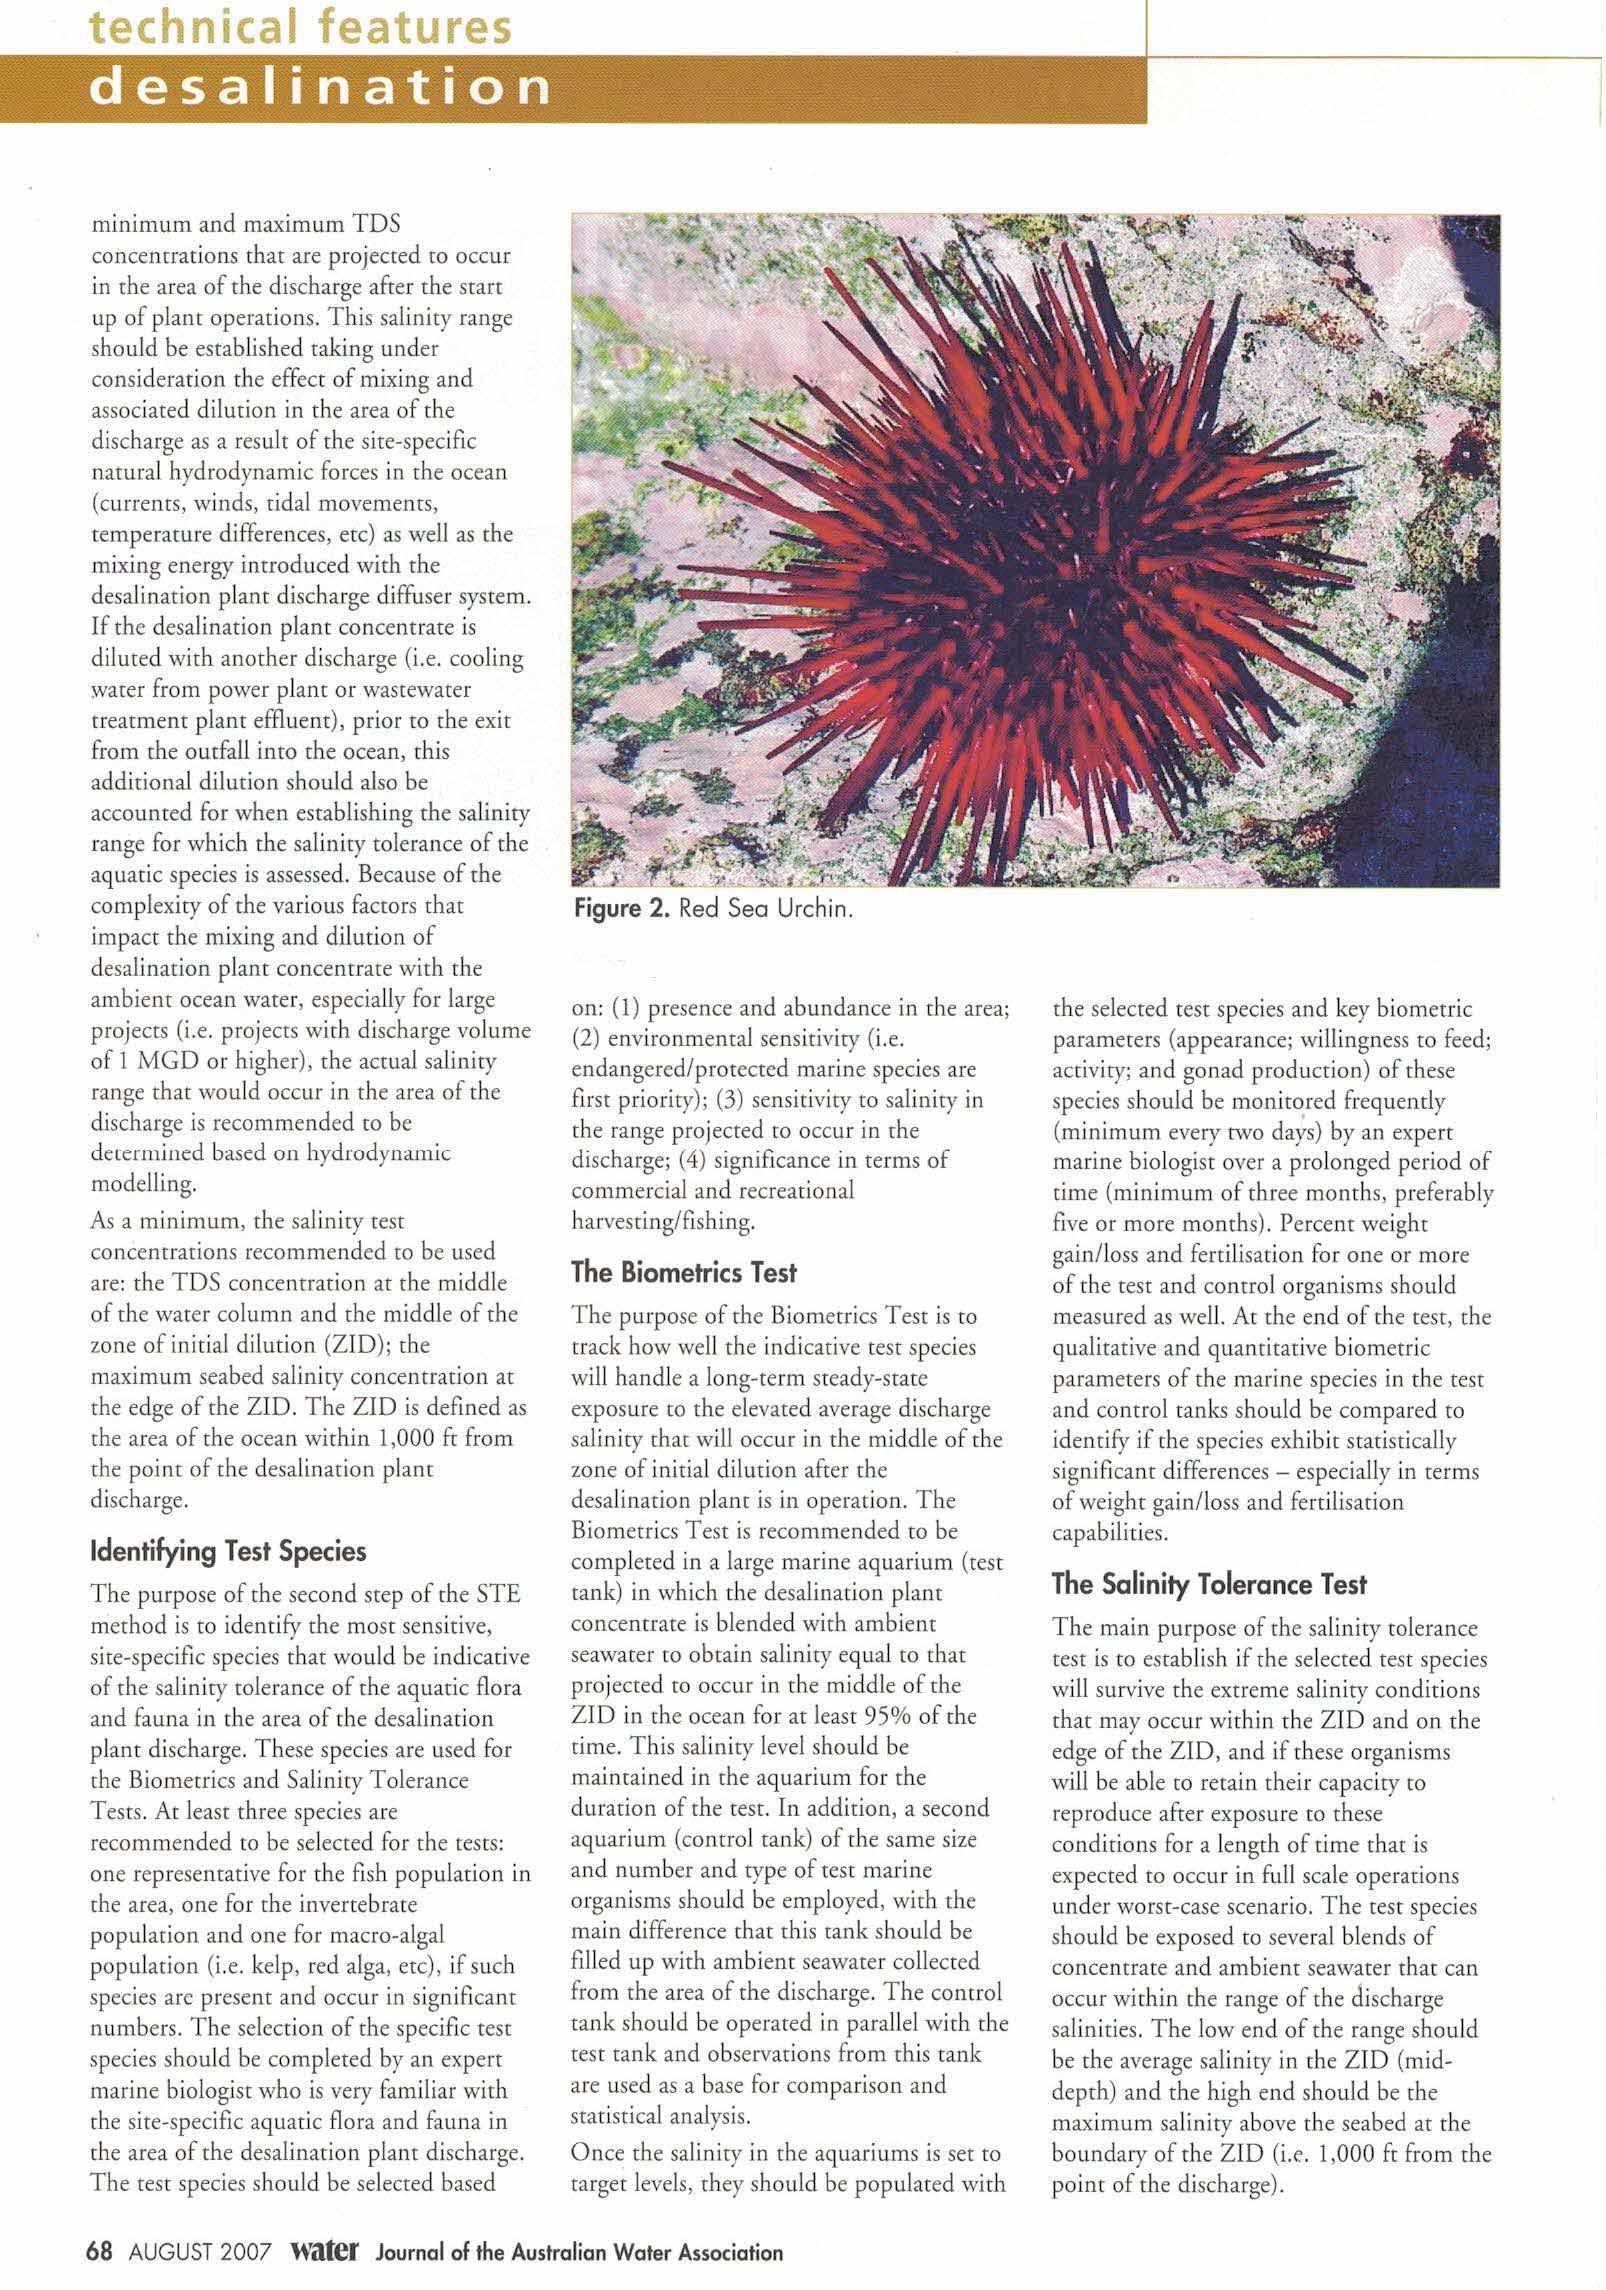
o n : (1) prese n ce and abu nda nce in th e are a; (2) e nv ironmental se ns itiv i ry (i.e. enda ngered/ p rot ected ma ri ne s pec ies are fi rst p ri ority); (3) se n si ti vity to sal i n ity in th e ra n ge p ro j ected to occu r i n the discharge; (4) sig n ifi cance i n te rm s of co mm e rcial a nd recrea t ion al h a rves t i ng/fis h i ng.
The Bio metrics Test
The p u rp ose of the Biom etr ics Test is co track how we ll t he i nd icative rest sp ecies wi ll ha nd le a l ong-te rm ste ady-s ta t e expos u re co t he elevated average di sc h a rge sali n it y cha r w ill o ccu r i n the mi d d le o f th e zo n e o f i nitia l d il u tion after the d esalin ation p la nt is in o peratio n . T h e Biometrics Tes t is recomme nded co be co m p leted i n a large ma ri ne aqu a ri u m (res t ta nk) in w h ic h th e desal ina ti on p la nt conce n t rat e is b lended with ambie n t seawa ter co o bta in sal in ity e qu al to t ha t proj ected to o cc ur in th e m id d le of the Z ID in the o cea n for a t leas t 9 5% o f the rim e. T h is sal i n i ty level sh ou ld b e ma intai n ed in the a qu a r i um fo r t h e d u ration o f t h e rest. I n add i t ion, a second aquari um (co nt ro l ta n k) o f th e sa m e s ize a nd n u m b er a nd typ e o f res t m a r i ne o rgan ism s shou ld b e e m p loyed , wit h th e m a i n d iffere nce cha t chis rank sh o u ld be fi ll ed u p w ith am b ient seawate r co llec t ed fr om t h e area of t h e discha rge. T h e co ntrol ta n k sh ou ld b e opera ted i n p a ralle l w it h rh e res t ra n k and o b servations from th is t an k a re used as a b ase fo r co m p a riso n a nd sta ti stical analys is.
O nce rhe salin ity i n the a qu a riu ms is set to tar ge t levels, t hey s hou ld be pop u la t ed wi th
t he selected t est sp ecies a nd key b io m e t ric para m et ers (ap p e ara nce; w ill in g n ess co feed; ac t iv i ty; a nd go n ad pro d uction) of the se species sh o u ld be m on i rored freq ue nrly (m in im u m every two days) b y a n ex p e rt ma ri ne bio logis t o ver a pro lo n ged pe riod o f ri m e (m in i mu m o f th ree m on th s, p referably five or m ore mont hs) Perce n t we ight gai n /l oss a nd ferti l isa ti o n fo r one o r mo re of th e rest and cont ro l o rga n is ms shou ld me as u red as wel l. A r rhe e nd o f th e rest, the q u al i tative a nd q u a nt i tat ive b io met ric p a ra m e te rs of t h e m ari n e species in th e test a nd con trol t an ks sh o uld be co m p are d to id e nt ify if t h e species exh ib it s t atis t ically sign ifi ca nt d iffe re n ces - especially in ter m s o f weig ht gain /lo ss a nd fert il is a ti on capab ili ti es.
Th e Sa linity Tolerance Test
The m a i n p u rpose of the sal i n ity tole ra nce test is co es t a b l is h if the selected tes t species w ill su rviv e the extreme sa li n ity con d iti o n s ch at m ay occ u r w ith in rh e Z I D a nd on th e ed ge o f t h e ZI D , a nd if th ese o rgan ism s w ill be ab le to r etai n t h ei r ca pac i ty to rep rod uce a ft e r exposu re co t h ese cond i ti o n s for a le n g th of t ime ch ar is ex pe c ted co o cc ur i n fu ll scale o p erations u nd er worse-case scen ario The rest species shou ld be ex posed co seve ra l b le nd s o f co nce nt ra t e a nd a mb ie nt seawater ch a r can occu r w i th i n the range of t he discharge sal in i ties The low en d o f the ra nge shou ld be th e average sal i n ity i n th e Z I D (m idd e pth) a nd t h e h ig h e nd s hou ld be t h e
m ax i mu m sa li ni ty abo ve th e seabed at th e bou nda ry of t he Z ID (i.e . 1,0 0 0 ft fr om t h e p o i nt of th e d isc h arge)
technical features
6 8 AUG UST 200 7 Water Journal of th e Au stralian Wa te r Association
Si m ila r to the B iom et rics Test, th is exp er iment i n cl ud es two sets of aq uar iums fo r eac h sal i n ity co n ce ntr a t ion - a series o f rest t anks, o n e fo r each test sal in i ty level, a n d a co ntrol ra n k. The d ur a ti o n o f the Salin ity Tole ra n ce Test sh ou ld b e d et e rm i ned by the lengt h of o cc urr ence of the wors t- case d isc ha rge sal i ni ty scenario. Th is d u ratio n shou ld be establis h ed based on the res u lts fr om the h ydrod yna m ic modell in g o f th e des alin a t io n plant d ischa rge. Usuall y, ex treme sal in ity d isch a r ge c ond itions a re not ex pected to cont in ue for m ore tha n two weeks H owever, if th is is l ike ly i n s p ec i fic c i rc um stances, th an th e length of the study shou ld be exte nde d acco rd ingly. Start ing fr o m t h e low e nd of the sal in ity concen trat ion, indivi d ual rest ra n ks s hould be se t for sa li ni ty i ncre m e n ts of 1, 0 0 0 mg/L unti l the maxim u m t est sal inity concentrat io n is reach ed
Application of the STE Method for the Carlsbad Desalination Project
The STE method d esc ri bed ab ove h ave found prac t ical ap pl icatio n for the 20 0 ML/d (50 MGD) Ca rl sbad seawater desali n a ti on p ro j ect, lo ca ted in So uth e rn Cali forn ia. Th is proj ect i ncludes d i rec t c onn ection of th e desali n a tion pla nt intake a n d d isc h arge facil ities to the di sc h arge outfall of a n adj ace n tly loca t ed coas t al powe r ge n era ti on plant us i ng seawater for on ce-t h ro u g h cooli n g (see F igu re I). T h e powe r p la n t h as a to tal of fi ve po wer generators and depe n d ing on the numb e r of u n its i n opera tion pumps be twee n 8 00 ML/ d a nd 3,28 0 ML/d (20 0 M G D and 82 0 MGD) of cool in g w at e r through the co nd e nsers . The w a rm coo li n g wa t er fro m a ll condense rs is d i rected to a co mmon di sc h a rge t u n nel and lagoo n leading to th e ocea n . T h e fu ll- scale desal ination fa c il ity is p la nn ed to tap to chi s di scha rge t u n nel fo r both d esa lin ation p lan t fee d water a n d for disch argi n g h igh-sal in i ty c once n t ra te d ownstrea m of the intake area
Water c o ll ected fro m one e nd of t he po wer p la nt d isc h arge can a l wo u ld be conveye d to the desalina t io n plant t o pro d uce fr esh w a te r a nd t he conce n trate fr om the des ali n a tion pla nt w ou ld be return ed i nto the sa m e di sc h a rge ca n al , a p pro xi m a tel y 270 m eters d o wn stream fr o m th e poi n t of intake. The d esali n ation p lant concen trate, w h ic h woul d h ave a p p to xi m a tel y two ti m es t h e sa li n ity of the so ur ce seawa t er (68 p p t vs. 33.5 p p t ) wou ld b e bl ended w i th t h e re ma i n ing coolin g wate r d isc h a rge of th e powe r p lant and conveyed to the o cea n for d isposa l.
T h e sal inity range of t he m ixed discharge from t h e Ca rlsbad seawate r d esal ina ti on
Tobie 1. Marin e Speci es Used for th e Ca rl sbad Bio me tr ics Tes t
Scientific Name
Paralichthys califo rn icus
2 Paralabrax clath ra fus
3 Paralabrax nebulifer
4 Hyp soblennius g enii/is
5 Strong ylocen trotus Froncis ca nus
6 Strong ylocentrotus pu rpu ratus
7 Pisaster ochraceus
8 Asterina miniata
9 Parastichapus califo rn icus
10 Cancer productus
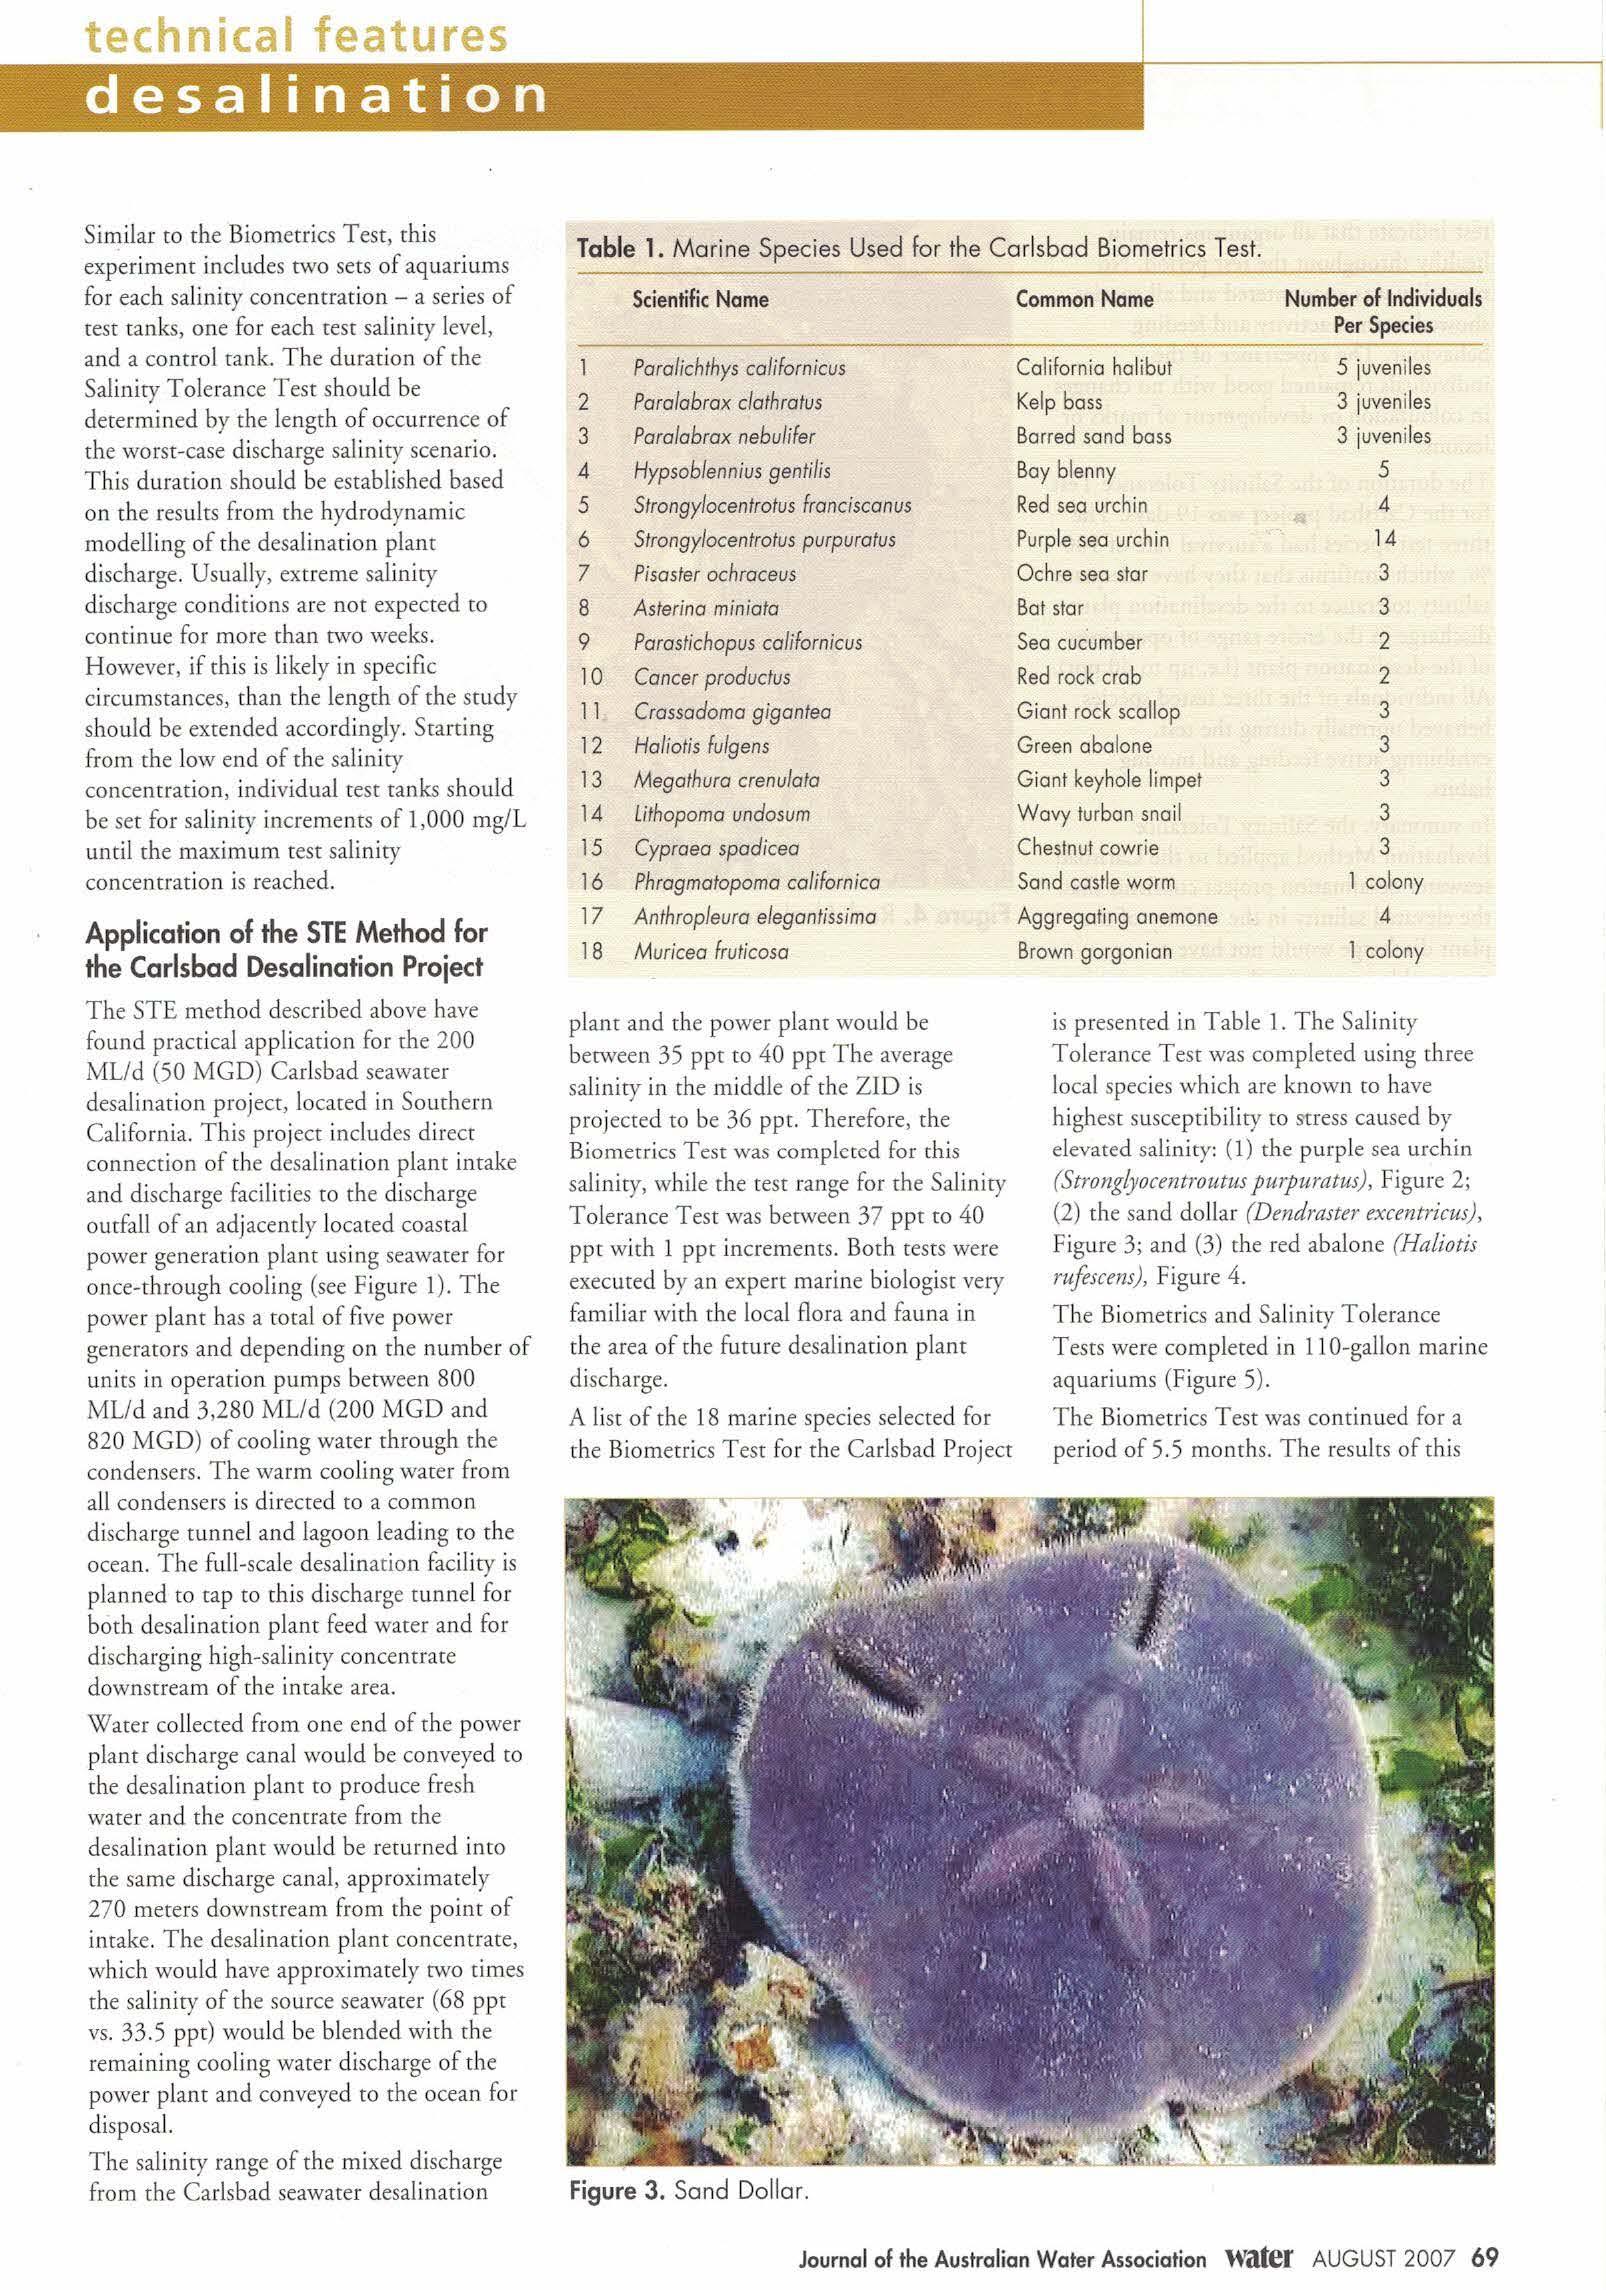
1 1 Crassadoma giganfea
12 Haliofis Fu/gens
13 Megathura crenulata
14 Lith opoma un dasum
15 Cypraea spad icea
16 Phragmalopoma californica
17 Anthropleura eleganlissima
18 Muricea Fruticasa
p lant and th e p ower p lant wou ld b e betwee n 35 p p t to 40 ppr The ave rage sali n ity i n t h e m iddle of th e ZID is proj ected to b e 36 pp t . T h e refore, t h e Biometr ics Test was comple t ed for thi s s ali n ity, w h i le t he t est ra n ge for the Sal in ity T o le ra n ce Tes t was betwee n 37 p p t to 40 pp t w i th 1 ppt incre m e nts. Bot h tes t s were exec ut ed by a n expert mar i n e biolo g ist ve ry fam il iar wi th th e lo cal fl ora a n d fau n a i n th e are a o f t h e future desalina tio n plant discharge.
A l ist of the 18 ma ri n e species selected for th e Bi ome trics T est fo r t he Carlsbad P roject
is p resented i n Table I. The Sal i nity
To lera n ce T est was co m pieced using th ree local s pecies whic h are k now n to h ave h igh es t s usce p tibil i ty to stress caused b y elevated sali ni ty: (1) the pu rp le sea u rc h in (Strongly ocentroutus purpuratus), F igure 2; (2 ) the sand do ll a r (D endraster excen t ricus), F ig u re 3; a n d (3 ) t h e red ab alone (Haliotis rufescens), F igure 4.
The Biome tr ics a nd Sal i nity T ol era n ce T ests were co mp le t ed i n 1 10 - gallon m a rin e aquari u ms ( F igure 5).
The Biome t rics Test was conti nu ed for a per iod of 5.5 month s. T he res u lts of t h is
technical features
Common Nom e Number of
Per Species Cal iforn ia ha libut 5 juveniles Kelp bass 3 juvenile s Barred sand bass 3 juveniles Boy blenny 5 Red sea urch in 4 Purple se a urch i n 14 Oc hre sea star 3 Bot star 3 Seo cucumber 2 Red rock crab 2 G ia nt rock scallop 3 Green aba lone 3 G ian t keyhole lim pe t 3 Wavy turban sna il 3 Chestnu t cowrie 3 Sand cas tle worm 1 colony Aggreg ati ng a nemone 4 Brown gorgonio n 1 colony
Figure 3. Sa nd Do llar.
Individuals
Journal of the Australian Water Association Water AUGUST 2007 69
test indicate that all organisms remain hea l thy throughout the test period. No mortality was encountered a nd all species sh owed normal activity and feed i ng behaviour. The appea rance of the individuals remai n ed goo d with no changes in colouration or deve lopment of marks or lesions
The d u ra ti on of the Salinity To lerance Test for the Ca rl sbad project was 19 days. The th ree t est species had a survival rate of 100 %, wh ich con fi rms that they have ade qu a t e salinity tolerance to the desalination plant discharge in the entire ra n ge of operations of the desa l inat io n plant ( i.e. up to 40 p p t). A ll i ndividua ls of the three t ested species behaved norma lly du rin g the test, exhibiting active feeding and moving habits.
In summary, the Salinity To lera n ce
Evaluation Me th od applied to the Carls b ad seawa t er desalinat ion proj ect confirms that the elevated salinity i n the vic i nity of the plant discharge would not h ave a measurable impact on the marine organ isms in this location an d these organis m s can to lerate the maximum sali nity of 4 0 ppt that could occur in the discharge area under ext reme conditions.
Additional acute and chr onic toxic ity studie s completed subsequently for this project u si ng the United St ates
Environmental P rotection Agency's standard whole effluent toxic i ty (WET ) tes t have confirmed the va l idity of the new STE method. WET t esti ng using Abalone (Ha!iotis ruefescens) showed that the chronic toxicity threshold for these species occurs at TDS concen tratio n s of over 40 ppr. An acute tox icity test comp leted using anot h er standard WET species, the Topsmel t (Atherinops affinis), indicates that the
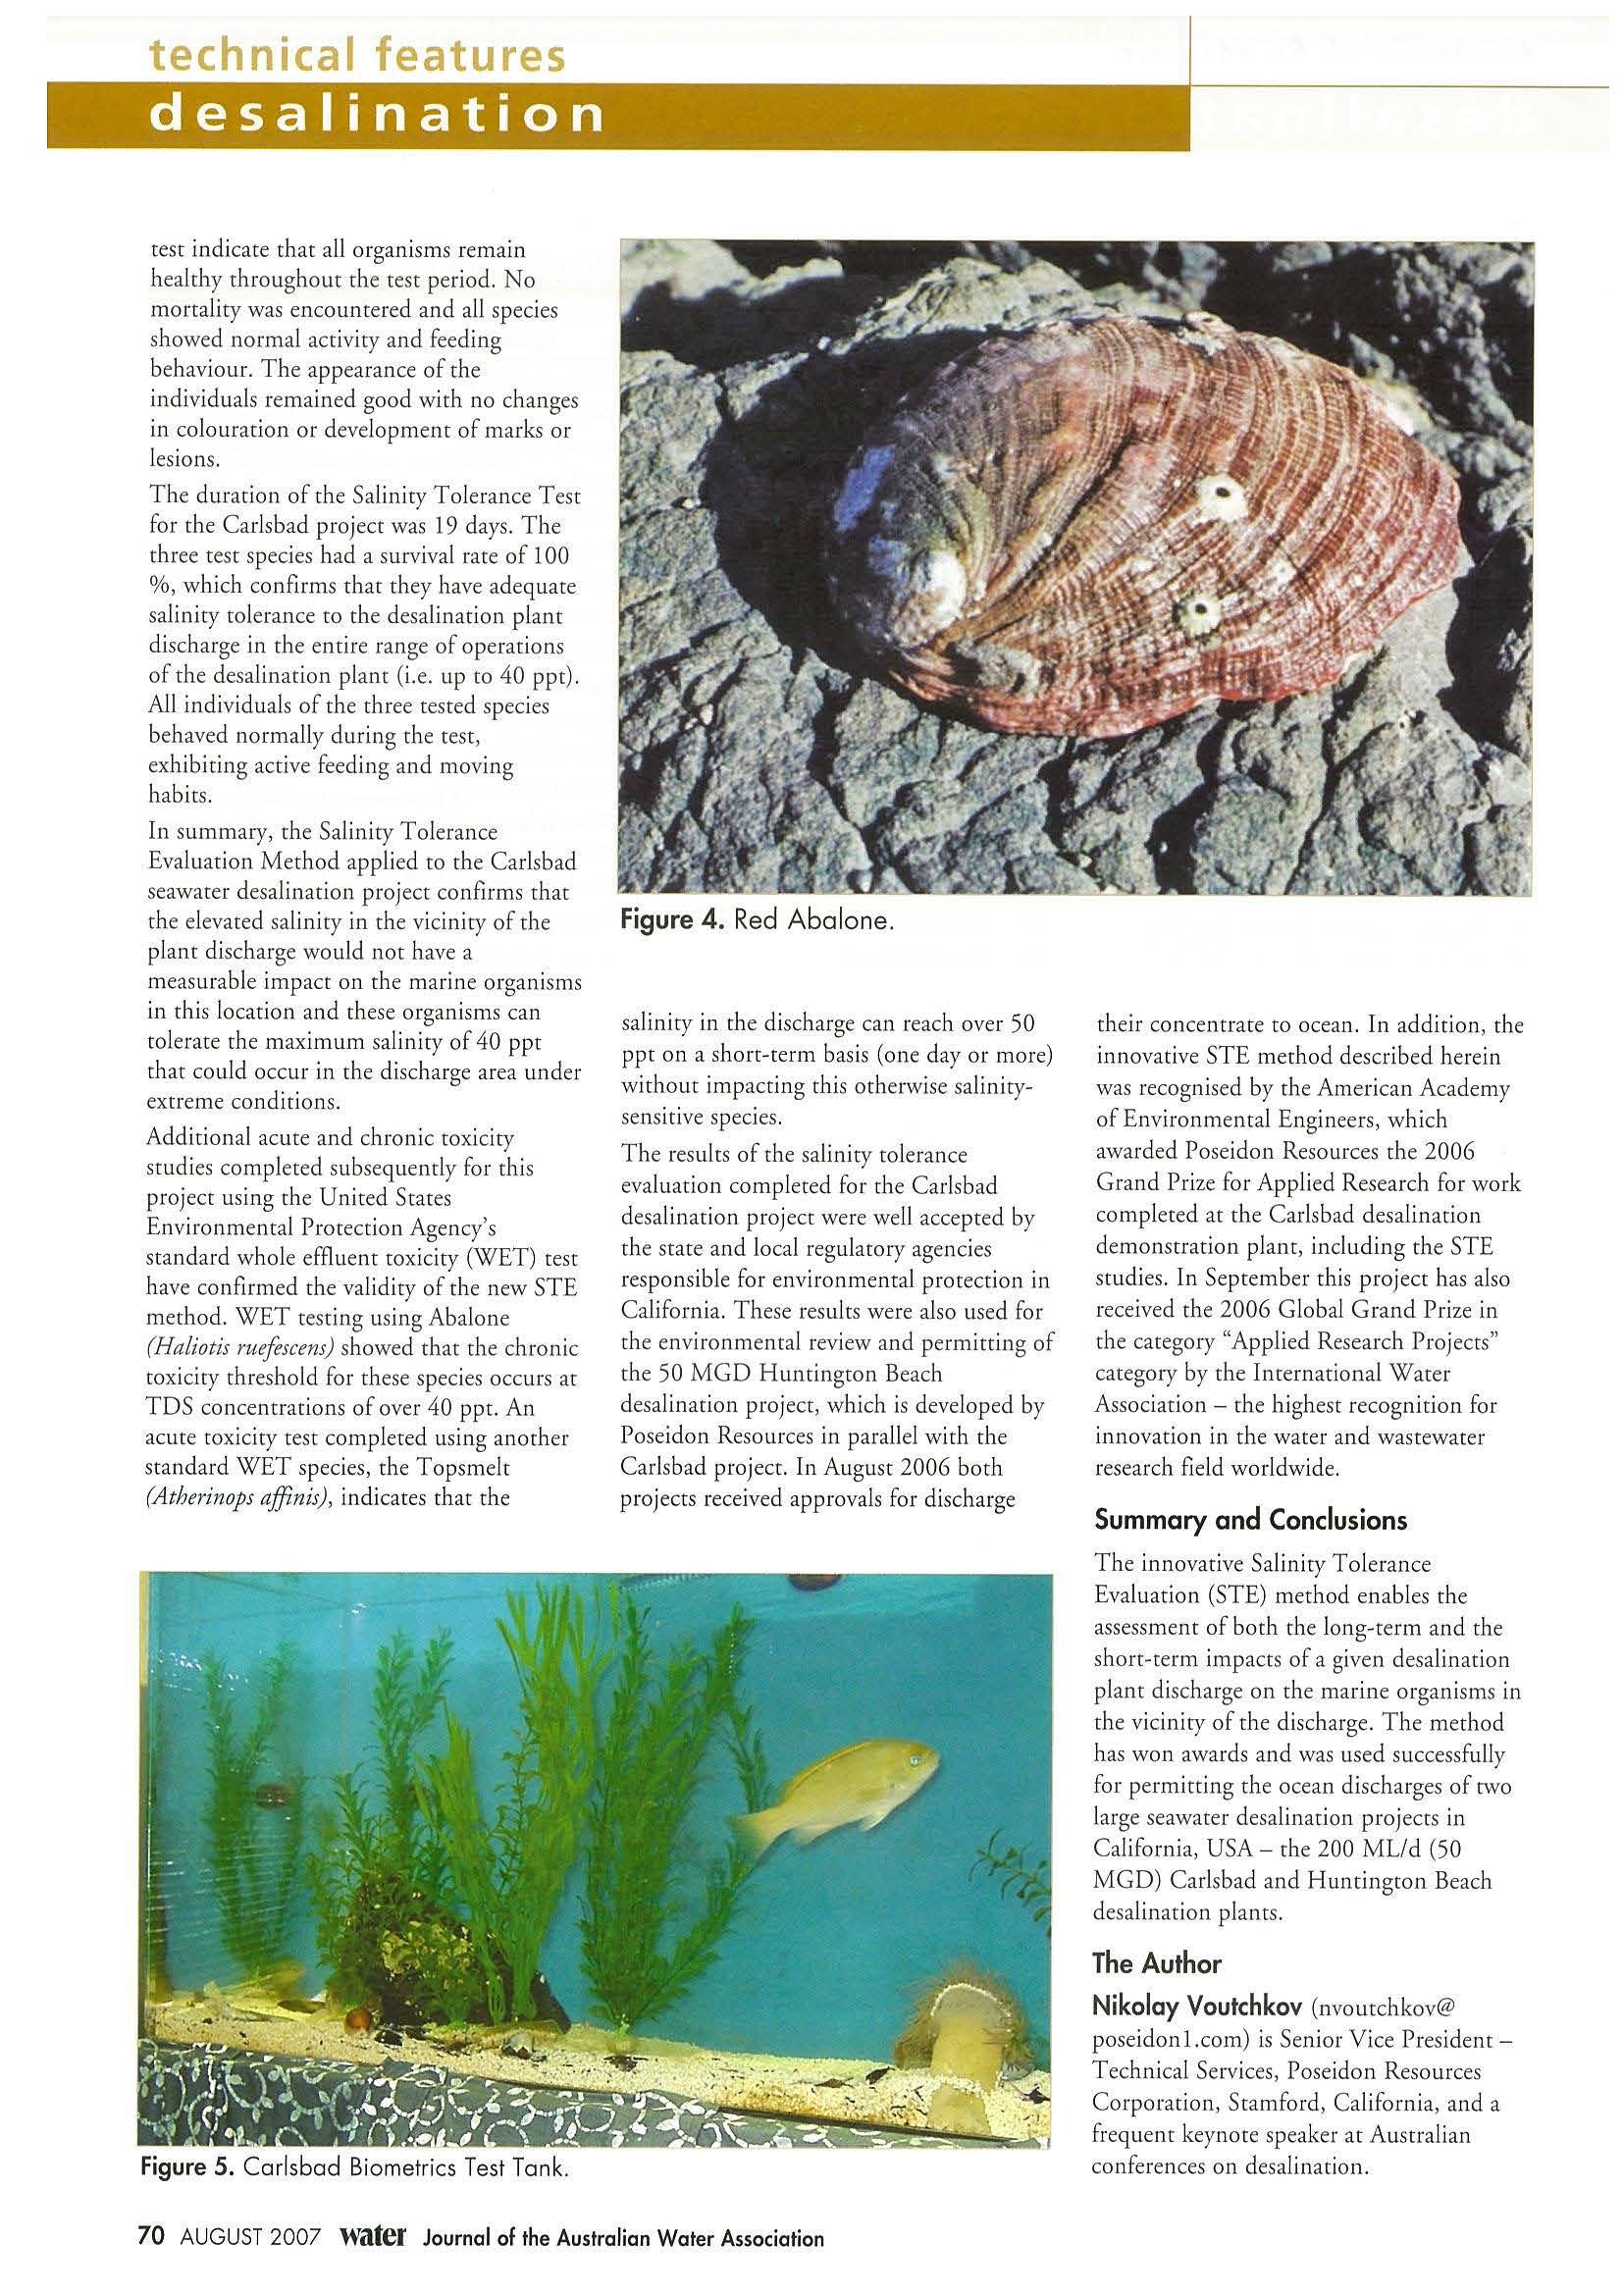
sal i nity in the di sc h a rge ca n reach over 50 ppt on a short-term basis (one day o r more) without i mpacting this otherwise sal initysensit ive species.
The results of t h e sali nit y tolerance evalua ti on comp leted for the Ca rl sbad desalination project were well accepted by t he state and local reg ula tory agencies responsib le for environmenta l p rotect ion in California . These results we re also used for the environmental review a nd permitting of the 50 MGD Huntingto n Beach desa li nation project, which is deve loped by Poseidon Re sourc es in parallel with the Carls b ad proj ect. In August 2006 bot h proje cts received approva ls for discharge
their concentrate to ocean. In add ition, the innovative STE m et hod described he rei n was recognised by the American Academy of Environmental Enginee rs, wh ich awarded Poseidon R esources the 2006 Gran d P r ize for Applied Research for wo rk co m pleted at the Ca rl sbad desalination demonstration p lant, including the STE studi es. In September this project has also received the 2006 Global Gra nd P rize in the category "Appl ied Research P rojec ts" category by the International Water Association - the highest recognition for innovation in t he water and wastewater research field worldw id e
Summary and Conclusions
Th e innovative Sa li n it y To lerance Eva lu ation (STE) me th od enab les the assess m ent of both the long-term and the sh ort-term impacts of a given desalination plant discharge on the marine organisms in the vicinity of the discharge. The method has won awards and was use d su ccessfully for permitting the ocea n discharges of rwo la rge seawater desalina tion projects in Cali fornia, USA - the 200 ML/d (50 MGD) Carls b ad and Huntington Beach desalination p lants
The Author
Nikolay Voutchkov (nvoutc hk ov@
poseidonl.com) is Se ni or V ice P residentTechnical Services, Poseidon R eso ur ces Corporation, Stamford, Ca li fornia, and a frequent keynote speaker at Austra li an con fe rences on desalination.
technical features
Figure 5. Carlsbad Biometrics Test Tank .
Figure 4 Red Aba lone.
70 AUGUST 2007 Water Journal of the Australian Water Association
RISK MANAGEMENT: BOVINE JOHNE'S DISEASE AND WATER RECYCLING
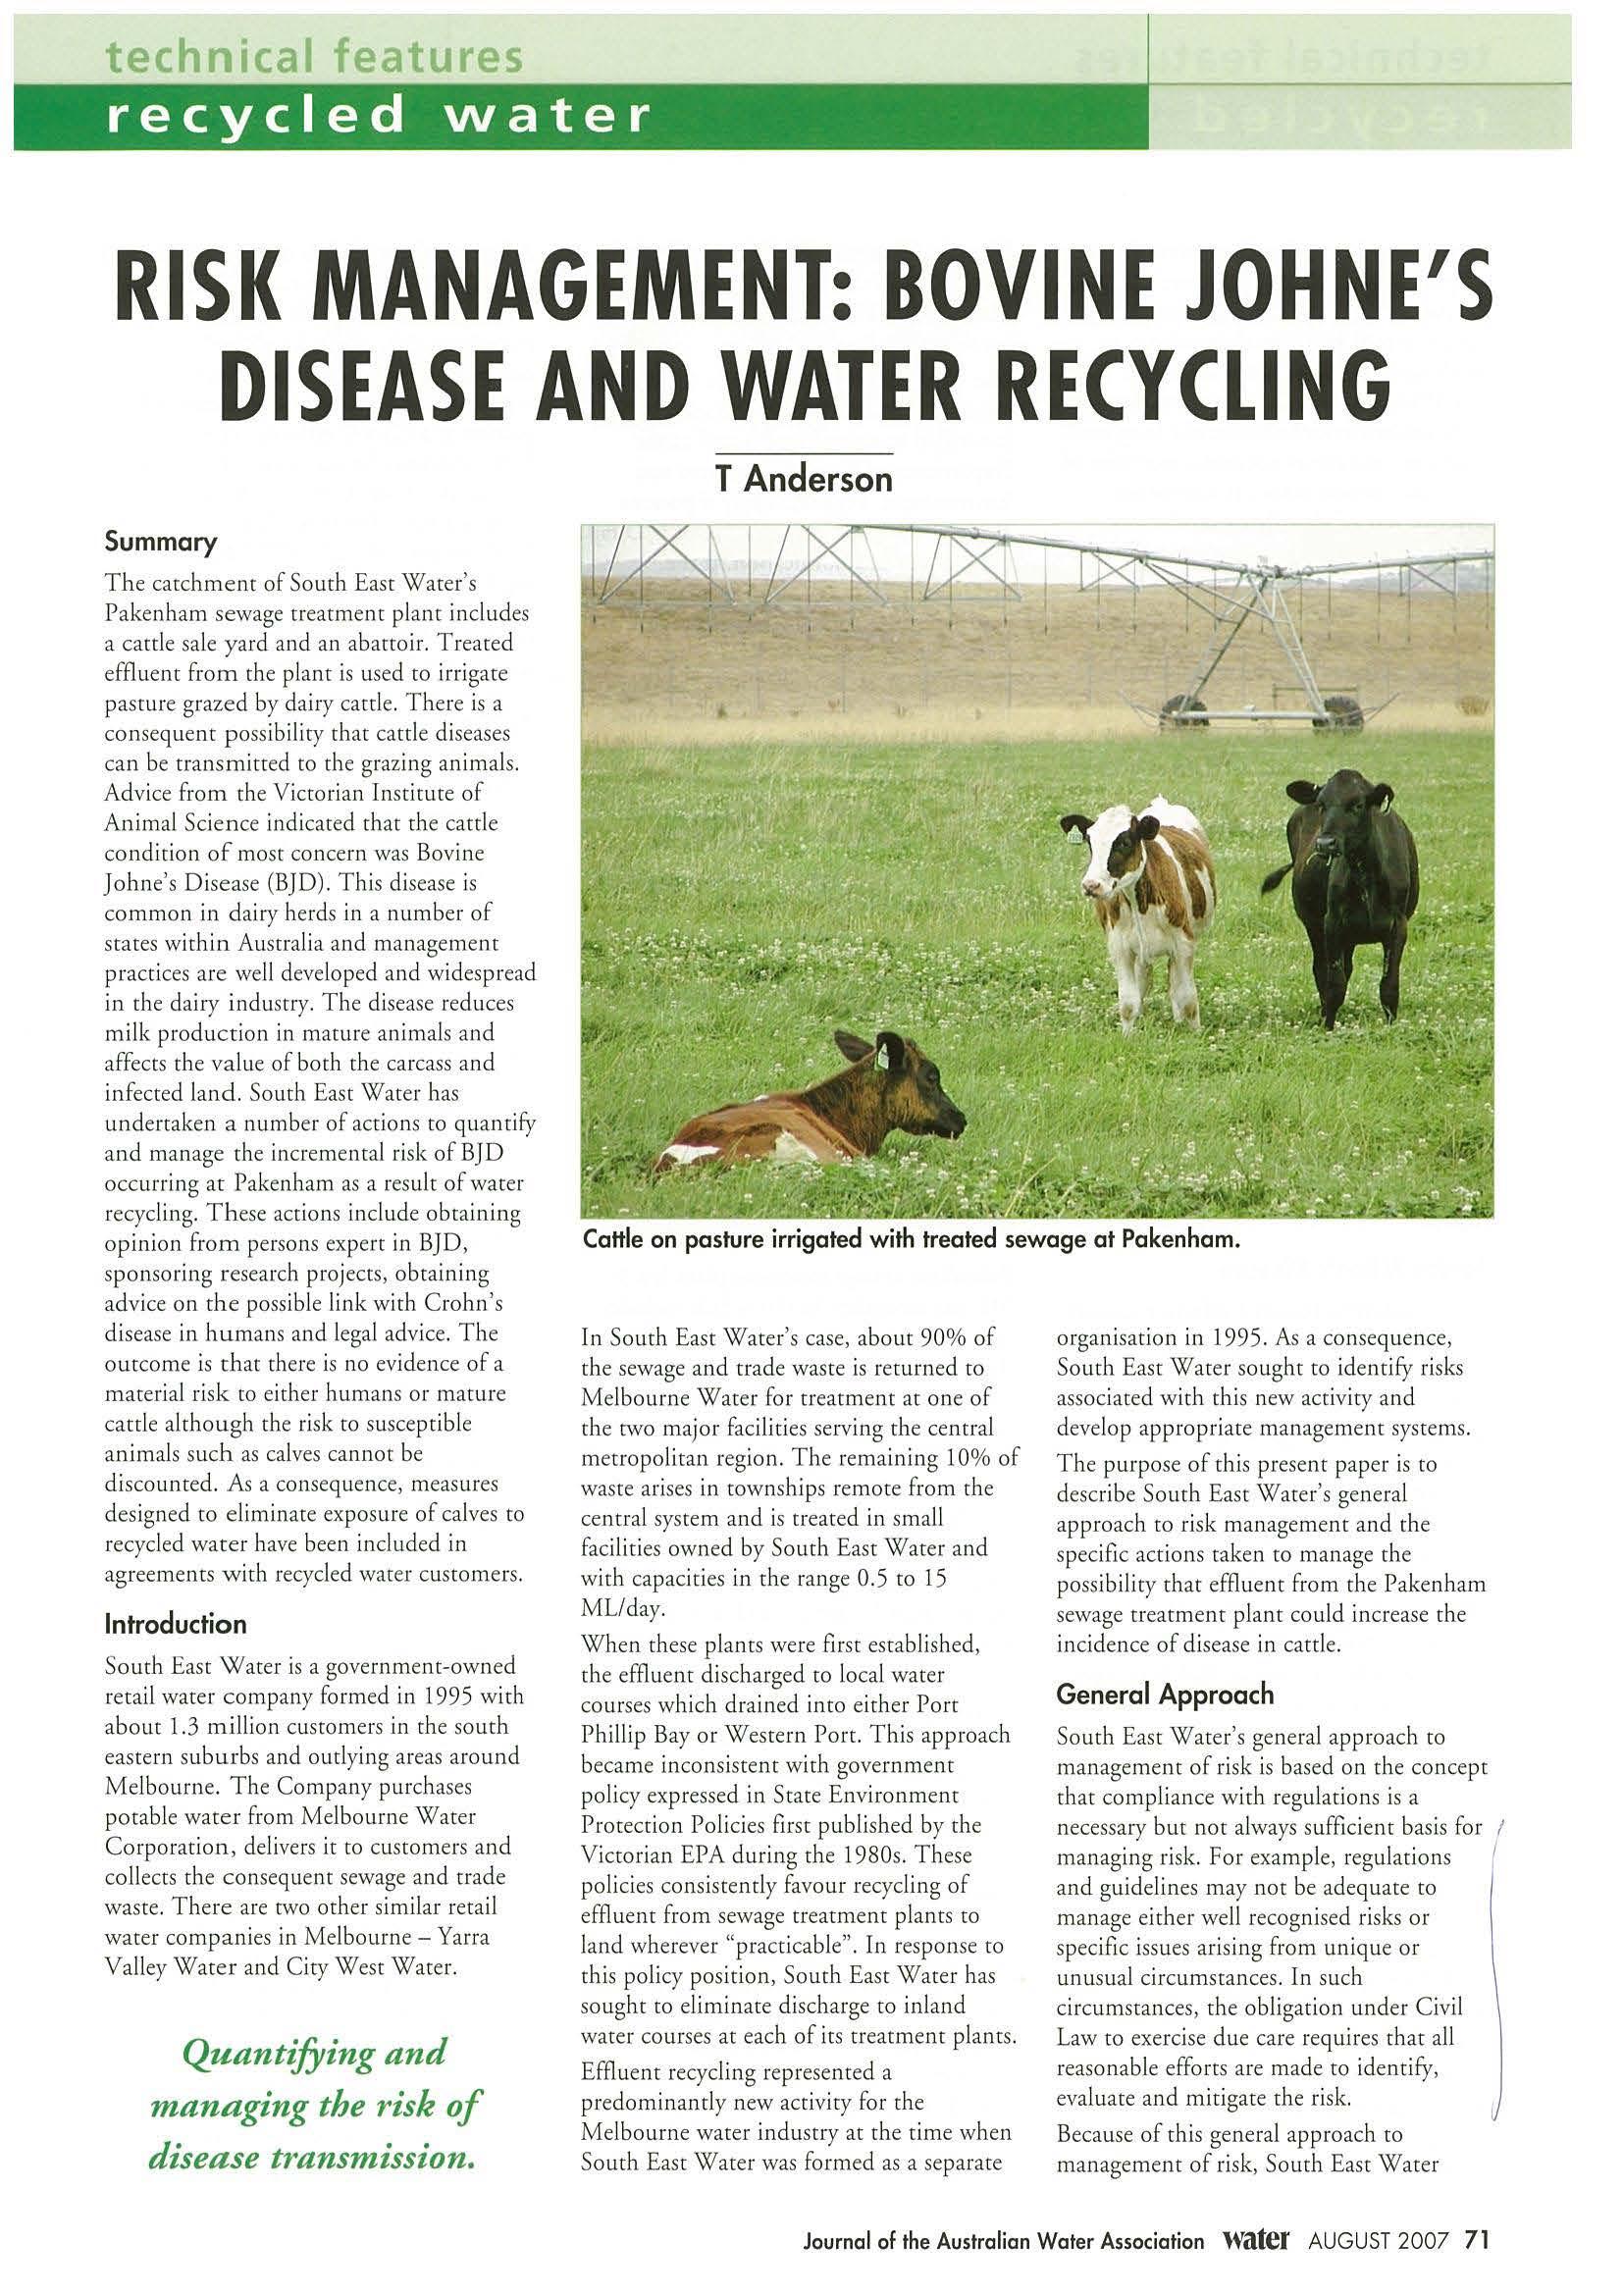 T Anderson
Summary
The catchment of South East Water's Pakenham sewage treatment plane includes a car tie sale yard and an abattoi r. T reared effluent from rhe p lane is used to irriga t e pasrure grazed by dairy ca ttl e . There is a consequent possib ility char cattle diseases can be transmi tt ed to the grazing animals. Advice from the Victor ian Insr irute of An imal Science indicated that t he cattle co nd ition of most conce rn was Bovine Johne's Disease (BJD). T h is disease is common in dairy he rds in a n um ber of scares wit hi n Austra lia and management practices are well developed a nd wides p read in the dai ry industry. The dise ase reduces milk prod uct ion in mature anima ls and a ffects t he value of both the carcass and infected la n d Sou th East Water has u ndertake n a num ber of ac t io ns to q uan t ify a n d manage the inc remenral r isk of BJ D occurr ing at Pakenham as a resul t of wa t er recycling. These actions include obta ining o pi nio n from persons expert in BJ D, sponsori ng research projects, obtaining advice o n th e possib le link with Crohn's d isease in h u mans and legal advice. The o ut come is ch ar the re is no evide nce of a material ri sk to eit her h umans or mature cattle although the risk co susce p tib le animals suc h as calves canno t be d iscounted. As a co nsequence, meas u res designed co eliminate exposure of calves to recycled wa t er have been incl uded in agreements with recycled water cuscomers.
Introduction
South East Water is a gove rn me nt -owned reta il water company formed in 1995 with about 1.3 m i ll ion cuscomers in the sou th easte rn suburbs and outlying areas around Me lbo u rne. The Company purchases po t able water from Me lbourne Water Co rporat ion, de live rs it to customers a nd collects t he consequent sewage and trade waste. There are two ot her sim ilar retail wa t er companies in Melbourne - Yarra Valley Water and City West Wa t er.
Cattle on pasture irrigated with treated sewage at Pakenham
In South East Water's case, about 90% of the sewage and trade was t e is re tu rned to Me lbourne Wa t er for treatme n t at one of the two major fac ilities servi ng the ce n tral metropolita n region. The remain ing 10% of waste arises in townsh ips re mote from rh e central syste m and is treated in small facilities owned by South East Water and with capaci t ies in th e ra nge 0.5 co 15 ML/day .
When these plants were firs t es t ab lished, the effl uenr disc harged co local water courses which drained inco either Port Ph ill ip Bay or Western Pore Th is approac h became inco nsistent with government po licy expressed in Stare E nvironment Protection Pol icies first pub lished b y the Vicco rian EPA d u ring t he 1980s. These po lic ies consistently favour recycling of effluent fro m sewage t reatment plants co land whereve r "practicable" . I n response to th is policy positio n , South East Wate r has sough t to elim inate discharge co inland wa t er courses at each of its treatment planes. Effluent recycli ng rep resented a predomi na n tly new activity for the Me lbou rn e water industry at rhe time when South East Wate r was formed as a separa t e
o rganisa ti on in 1995. As a co nsequence, Sou t h Eas t Wa ter soug h t co identify r isks assoc iate d wit h ch is new activity and d evelop appropriate management systems. The purpose o f rh is present pa per is to describe South Eas t Wa t er' s ge neral approac h to risk manage m ent and rhe speci fi e act ions taken to ma nage the poss ibility chat effluent from the Paken ham sewage treatment pla ne could increase the incidence o f disease in cattle.
General Approach
South Eas t Wa t er's general ap p roac h to ma nage m ent of ris k is based o n the co ncept char comp lia n ce wit h regu lat io ns is a necessary but not a lways sufficient bas is for / ma naging ris k For example, reg u latio ns 1 and guidelines may not be ad eq uate to ma nage either well recog n ised risks or specific issues ar isi ng from u nique or unusual ci rcumsta nces. In s uch c irc u msta nces, the o bligat ion under Civil Law to exercise due care requ ires that all reaso nable efforts are made to identify, eva luate a nd mi t igate the risk.
Because of chis general approach to management of risk, South East Water
technical features recycled water
Quantifying and managing the risk of disease transmission.
Journal of the Australian Water Association Water AUG UST 2007 71
technical features recycled water
init ia ll y sought to identify aspects of proposed water recycling schemes that were unique or unusual. Investigation o f these matte rs was then u nd erta ken using a combin ation of literature so urc es a nd co ns ul ta n c ies. The p ractices a t existing sites with sim i lar c ircumsta n ces a nd a long track record of satisfactory operation were also o f particular interest since this can be an effec ti ve way o f identifyi ng sat isfactory management arra n gements. Thus, the desk top work b ased o n li terature a nd consu lta ncies was supported by vis i ts to recycl ing sites a nd regu lators in A ustralia and also overseas in Israel and USA where there is a long history of water recycling.
A unique aspec t of p roposals to i rr igate pasture grazed by cattle wit h effluent from t he Pakenham sewage treatment plant a rises because of the p rese n ce of ca ttl e waste in th e plant in fl ue nt. T h e possibility that thi s situatio n would i ncrease the probab ility of disease occurring in the grazing h erds was clea rl y an unu sual iss ue which may n ot have been env isaged by the normal regu la tory fr amework Adv ice from the Victorian I nst i tute of An imal Scie n ce, whic h is a bra n ch of the V ictoria n Govern m ent Department of Natura l Resou rces and Environment, indicated t h at the only disease wort h y of deta ile d in vest igat io n was Bovine Johne's Disease (BJD ).
Bovine Johne's Disease
BJD is a chron ic bacterial infection caused by a mycobacterium (M. paratubercolosis) and it is present in abou t 25% of V ictorian dairy herds. The d isease is normally co ntr acted by ca lv es graz ing pasture co nt a mina t ed wi th faecal material fr o m infected cattle and the i ncu b at ion period prior co de velo pment of clini cal sign s is prot racted ( i. e typically 4 to 5 ye ars ) The exposure ri sk is not ins ubstanti a l because a clinicall y affec t ed a nim al typically di sc h a rges about 5xl0 12 bacterium per day. A sub- cli ni cally affec t ed animal di sc h arges a lesser amount of about 8x l 0 6 bacterium per day.
Cl in ica l sig ns associated w i th the disease are pers istent diarr ho ea a nd em aciation. However, ca ttl e remain b ri gh t a nd exhibit a n orma l appetite dur in g t h e initial stages of infection prior co ex hibit ion of cl i nica l signs. The disease is invariably fatal o n ce cl ini cal s ig ns develop but not all infected cattle deve lop clinical symptoms. The reason fo r this difference in response is unknown and there is n o treatment fo r the disease.
Th e incidence of BJD is not un ifo rm throughout Aus t ra lia. Areas where the di sease is particularly p revalent include
Viccoria, Tasmania, So u th Aus tral ia and New So u th Wa les whereas Western Aust ralia an d Northern Ter rito ry are considered to be disease free.
The Viccorian Livestock Disease Control Act requires that the s uspected presence of BJD is noti fied to anim al health staff at t h e Depar tm ent of Natu ral Resources and E nvi ronm ent. Penalties apply if perso ns aware of the suspected prese n ce of BJD fa il to carry out chi s notificat io n. If the p rese n ce of BJD is co nfirme d, then rhe land is regarded as co nt ami nate d. T hi s status remai n s unless t he land is descocked of all susceptib le animals for a period of 12 mont h s. Cli ni cally affected animals must be destroyed on the fa r m or sent to a k nackery.
BJD is of s ign ifica n ce to the dairy industry b ecause milk productio n dro ps in clinically infected animals and the carcass h as no va l ue beca use it must be se nt co a k n ac kery T h ere are also a numb er of indirect effects suc h as a reductio n in the va lu e of co n ta min ated land and constra ints on th e movement o f a nimals.
Mature a nimals are w idely regarded as resistant t o infectio n and the ba sis of all BJD ma n age m ent programs is to isolate cattle less than o n e year old fr om potentially conta minat ed pasture.
Pakenham Sewage Treatment Plant
Pakenham sewage treatment plant is a 5 ML/day secondary fac ili ty whic h includes maturation lagoons a nd c h lori n at io n for disinfection. The plant is located ab out 80 km sout h -eas t of centra l Melbou rn e in a rural area w i th a tra diti o nal emp h as is o n dry land dairy farm ing. The plant serves the cownshi p o f Pakenham as we ll as a s m all industrial zo ne . Two of the s ig ni fi ca n t i ndustr ia l bus in esses d ischar gi ng trade waste inco the Pakenham system in clu d e a ca t tl e saleya rd a nd an export abattoir.
In 1995, So u th Eas t Water committed co recycling 90% of the plant effl u ent co land by the year 2000. Th is comm itment required a plant up gr ad e to accommo d ate expected growt h in flows, a 900 ML storage reservoir to store effluent in winter and an effluent pu mp station and piping sys t em co provide i rri gation water co potential customers These works we re comp leted by 1 998 a t a cost of around $ 13 M. Agreements were also formed w i th a numbe r o f custome rs to recycle effl u ent from the p lant by irri gating land. Inevitably, a number of these c ustomers were dairy fa rm ers because this was the most co mmon farming activity in t he district.
A feature of t h e plant is that i t includ es two parallel process streams and some inflows only rece ive treatment in a n aerated lagoon and maturation ponds for about 20 days b efore ch lori nation (CT o f about 60 mg. mi n/L) and ap pl icat ion directly to da iry pasture as a Class C effluent. T h e Victo ri a n E PA gu ide l ines for use of recycled wate r re qui re that Class C effluent has a median compos i tion of less tha n 1000 E.coli/l00ml, 20 mg/L ofB OD and 30 m g/L of s uspe nd ed sol ids.
Actions Taken by South East Water to Assess the Risk of BJD
Initial assessment
The pre fe rre d a p proach to identification of appro p riate management pract ices for BJ D at Pakenham was to identify a sim ilar si tuat ion e lsewhere with a long hiscory of satisfactory operat ion However, it proved very diffi cult to l ocate an ex isting recycl in g sc h em e w h ere th e risk had b een assessed a nd was be i ng specifi call y m an aged The onl y sim i la r sc h e m e based on ir r iga t ion o f dairy pasture identified worldwide was in a reg ion imme di a t ely to the north of San Francisco.
H owever, a visit to the sire indicated t h at the effl uent was of tertiary quality (i e. the process stream included a particulate filtration ste p after secon da ry trea t m en t) and very highly chl or inated. Add itionally, the possibility chat wate r recycling co u ld increase the incidence o fBJD had not been recogn ised and there were no management practices specifically designed to limit th is possibili ry.
Thus two specifi c furth e r steps were taken co prepare an ini t ial assessment o f t he ri sk due to th e possible presence of BJD in effluent at Pake n ham
The first of these involved see king advice fr om t h e Office of the C h ie f Vete r inary Officer in V ic tori a. The 1996 advice received from this office states that th e risk of a du l t cattle contract in g BJD at Pakenham is "very low co n egli gible".
South East Water a lso e ng aged the Victor ia n Institute of Anima l Sc ience co prepare a desk top evaluation of potential risks associated with BJD at Pakenham.
The i r 1996 report indicated t h at the re was no quantitative data in t he l i terature abo u t the removal of M. paratubercolosis in sewage treatment p la n ts. H oweve r, there are reports in the literature which ind icate that t he bacter ium is very res istant to ch lori nation and an expos ure of up to 2400 mg min/Lis required to ac hi eve complete disinfect ion in "waste water". Furt he rmor e, t h e o rgani sm can surviv e for m ore t han 8 months in moist faeces and for a similar
72 AUGUST 2007 Water Journal of th e Austra lian W ater Ass ociation
technical features recycled water
period in water although ocher studies have demonstrated that the organism does nor survive 100 hou rs of exposure to sunlight. The res istance to the chlorine dose in the recycled water and the protracted survival period in moist conditions indica t e that reduction to safe levels by the treatment process wi ll be essential to reduce the dose of b ac t eria received by grazing a n ima ls.
T h e authors prepared an approximate assessment of the likely dose of the BJD bacte rium assimi lated by cattle graz i ng ir r igated pastu re at Pakenham. Th is assessment assumed:
• O nly su bclinically affected animals contributed waste to the pla n t. The assumed incide nce of suc h an i mals was 0.5% a nd it was also assumed that cattle were only p r esent in the saleyard or abbatoi r fo r o ne day befo re processing.
• Raw sewage concentrations of M. paratubercolosis would be reduced by 1 log (base 10) d u e to "settling" i n t he treatment plant, a further 2 logs due to detent ion in the maturation ponds and a further I log du e to the 5 day withhold i ng pe r iod between cessation of irr igation and comme ncement of grazing at Paken ham.
• Only I 0% of the bacterium applied to pastu re were "available" to ca ttl e because of t h e effects of die off on the past u re.
The concl us i on aris i ng fr om this assessment was that an adu lt animal g razi n g i rr igated pasture at Paken h am would i nges t an average of l orga n ism every 10 0 days. This result allowed the a u thors to con cl ude that the ch ance of ca t tl e infec ti on occurri ng t h rough recycling effluent "is m inima l if r isk management strategies are prope rl y instituted". These strategies have the objective of ensuring that calves less t han I year old are not exposed to M. paratttbercolosis through contact with eit her infec t ed cattle or in fec t ed effl uent
The report also considered che possibil i ty t h at exposu r e to the BJD bacte r ium could cause disease in humans. The o n ly d isease in huma ns w here a possible link with BJD has been postulated is Crohn's Disease. T his conditio n is a chron ic inflammatory bowel d isease that is debi l itating but rarely fa t al. However, the re port ind icated chat a clea r li nk h as not been established between Crohn's disease and BJD.
Refinement of the initial assessment Diseas e in ca ttle
The advice described above was nor based o n qua n ti t ative data on the concentration of the BJD bacteri u m in sewage o r effluen t ac Pakenham and was also limited by t he pauci ty of data about the durabil i ty of the
bacterium on pasture. South East Wa t er initially sought co address chis deficiency by engaging t h e V ictorian Institute of Anima l Science to develop a met h od for enumerating M. paratubercolosis in sewage samples a n d apply ing it to the particular circumstances at Pake n ham. A method was successfully developed after a protracted development period and the 2002 report of chis work indicated char che bacterium was detected in about 1 5% of trade was t e grab samples obtained from th e cattle sale yards. The average va l ue of th ese resu l ts was abo u t 7900 bacce r i u m/L. No sam pl ing of trade waste from the aba tt oi r was u ndertaken because the pre-treatment process u pstream o f the discharge point included a n aera t ed reactor and extensive maturatio n po n ds. Consequently bac t erial n u mbers wou ld be much lower than fo r the sal e yards
Simi lar wo rk at the sewage treatment plant in let only detected the bacterium in 1 of the 565 samp les t ested and fai led to de t ect the organism in a n y of 237 samples of plant effl u e n t. These res u lt s indicate cha r the sensit ivity of the test method was i nadequate to detect t h e low concentrations of M paratubercolosis at bot h locations. To confirm chis explanation, the Institute of Animal Science prepare d an estimate of likely concentratio ns based on rhe trade waste data. These estimates assumed:
• D i lution was rhe o n ly mechanism re d ucing concentratio ns in th e sewerage system and
• There were two mechanisms reducing b acterium n umbers in the t reatment process - sedimenta ti on and die off. The Institute argued chat the bac t erium woul d absorb o n to solids and thus the effect of sedimentation could t h e refore be est i mated b y assuming bacteri um n umbers were proportional to rhe red u ct io n in suspended so l ids concent rations The effect of die o ff was quantified by assumi n g a l i near re lations h ip with ti me and relying on a pub l is hed resu lt w h ich showed chat viab le bacter ium n u mbers in a moist slurry dropped to zero a ft e r 6 mo nt hs
The ou t come was char calcula t ed va l ues averaged about 220 orga n isms/ L at the plant i n let (compared with a limit of detection of 10 0) and about 20 organisms/Lat the plane ou tl et (l imit o f d etection 20). The au th o rs were not able to explain rhe co nsis t ent failure to detect rhe BJD bacteri um at the p lane i n let and o u tle t given chat expected numbe rs were ab o ve or comparable to th e lim i t of detect ion in b o th cases. A n exp l ana t ion favo u re d by the authors was that actual val ues we re lowe r than estima t ed a nd a
value of 5 organisms/L was adopted for the purposes of assessing the probab i li ty of infection in cattle grazing i rrigated pasture. This probability can be quantified ro some extent since typ ical irrigation rates at Pakenham are about 2ML/ha/year, resul ti ng in t he application of say 107 organisms/ h a over an ir riga t ion season if the low ch lori ne doses at Pakenham are assumed to have a negligible effect. It is possible chat a la rge proportion of these organ isms survive for some time given the reported durability o f M. paratubercolosis in moist conditions.
I nte r pretation of this resul t is compl icated by the absence of dose respo nse data fo r ca ttl e bu r the li tera tu re in dica t es that a n o ra l dose of I 00 b ac t erium, repeated once per week over I Oweeks, ca n ca use infec ti o n in lambs. T his caused rh e au th ors to c on cl ud e char rhe possib ility chat effluent from Paken h am could cause in fec t ion i n s usceptible animals "cou ld not be ruled ou r" Howeve r , t he expected incidence o f M. paratubercolosis on i rr igated la n d is low compared w ith expected levels on land grazed by cl i n ica ll y affec t ed animals, which can de p osit u p to 10 12 orga n isms per day. le is therefo re likely char there is no ma t erial increase in t he probability of ill n ess in mature cattle which are generally regarded as res istant to i nfection.
The key aspects of rhe ana lysis above a re th e constraints imposed by the l imit of detection i n p la n t efflue n t a nd the absence of dose response da t a fo r cal ves. The analysis also failed to a ll ow fo r the effects of chlorination, effluent storage a nd d ie off on pasture b ut these limitations a re probably less significant given the results of previous work re ported i n the l i te rature.
Disc ussion with the au th o rs i ndicated that furt h er quantification of t he actua l conce nt ratio n of M. paratubercolosis in effluent wo u ld require res t ing of impractica ll y large volumes to improve the de t ection lim i t.
A su bsequent consu l tancy w i th the Victor ian Institute of Anima l Scie n ce indica t ed tha t the in fectio us dose for BJD has not been determ i ned for cattle or calves and is not a priority researc h area in th e shore term.
T h e probab il ity of a BJD outbreak in a dai ry herd was furt h er assessed by providing the 2 0 02 report from the Victorian Inst i tute of Animal Science to the Office of the Chief Veterinary Office r. The Office s u bsequen tl y indica t ed chat "our assessment has no t cha nged" from that i n 1996 which indicated that th e "risks are low to neg l igib le".
Journal of the Au stralian Wat er Association Water AUGUST 2007 73
Disease in humans
Consu ltants Ausvet were a lso ap p roached to provide an assessment of the l ikel ihood that M paratubercoiosis causes disease in humans Au svet has an ongo in g associa tion with national John e's Di sease programs an d a lso so ug h t specialise advice from an Associate Professor in che Department of Med ici n e at the U ni ve rsity of Syd ney.
The Ausvet report co nclude d t hat the only h um a n disease for w hi ch the BJD mycobaccerium "has been p rop osed as an important causal factor at a pop ul at ion level is Crohn's disease", which is p resent in the Australian population at a p reva lence of ab o ut 50 cases pe r 100, 0 00 p eo pl e.
The Ausvec report indicates char ch a t there h as been exten sive rese arc h wo rl dwide seeking to reso lve the poss ibil ity of a causa l link between BJD and Cro hn 's d isease.
Th is research receive d renewed imp etus fo ll owing isolation of che BJD mycobacceri u m fr om a s mall n u mber of patients w ith Crohn's disease in the USA in 1984. The re ha ve b een a number of studie s, however, whi ch provide ev idence aga i n st a n associat io n betwee n the two co ndi t ions For examp le , epide mi ology st udi es do nor dem onstrate a h ig h er in ciden ce of Cro h n's disease in farm wo rkers w ith a high exposure to potentially infected an imals a nd faeces Fur thermore, simila r studi es d o not show a co rrela tio n between che preva len ce of th e two cond itio n s Fo r exa mpl e, che in ciden ce of Crohn's d isease is high in Swed en but BJD is rare.
The overall body of research has been su mm a r ise d i n numb er o f reviews over the lase decade. The fo ll owing co nclu s ion reached by th e Austral ia n Government's D epartment of H ea lth and Age i ng in mid 2003 is typical of che findings of th ese rev iews: "Al though ch e ca use o f Crohn's d isease is s till uncertain , the r e is no sub sta ntiated causal link betwee n John e's disease and Cro hn 's d isease".
The Ausvec report also i ndic ated char Ausvec h ad n or b een ab le co ident ify any Government o r ind ustry warning issued to fa rm e rs specifically conce rnin g occupational h ea lth and safety a nd BJD in Australia
Risk Mitigation
Legal advice
South East Water receive d advice fro m lawyers Blake D awso n Wa ld ron (BD W) in 2003 c once rning che pote ntial liability associated with suppl y of irrigati on water poss ibl y c ontaining M. paratub ercoiosis. T h is advi ce indicates char the m ost significant ris ks are liabi l ity for act ions in neg ligenc e a nd for mis leading a nd deceptive co nduce.
Negligence
The BDW report indicates chat a success ful action in n egl igence wo uld require a demonstration, on the ba la nce of probabi l ities, chat BJD was cause d by exposure to irrigatio n wa t er and not from so m e oche r so ur ce
If ca usatio n was demonstrated, chen So uth East Water would become li ab le due co a b reach of its d u ty of ca re if i t could be proven chat the infection occurred beca use of an ace or omissi on w hi ch So u t h Ease Wate r s hou ld have fo reseen a nd char Sou th Ease Water fai led to d o what a reasonable pe rson wou ld have d o n e co prevent such an act or omission. In suc h a case, South Eas e Water would be li able for all loss which is che reasonabl y foreseeab le res ul t of its n egl igence.
Misleading and de cep tive conduct
The BD W report indicates chat the d efi nition o f mi s leading and d eceptive con du ce in ch e Trade Practices Act (TPA) in clud es a corporation fa lsely represent in g chat go ods are of a par ti cu lar stan dard Contravention of th ese requirements allo ws a plaint iff co seek damages and oc h er remedies pro vi ded by the T PA. Additionally, a defendant m ay be fin ed u p co $ 1.1 million per contra ve ntion.
Risk mitigation actions
As a conse qu ence of the work descr ib e d above, South East Water undertook a range of actio ns co m a n age the risk posed by the poss ibl e prese n ce o f M. paratubercolosis in effluent at Pakenham. T h ese actio n s included:
• Recycled water agreements. Recycled water a gre em e nts we re mod ified to include a number of spec ific req uir ements co isola te calves from recycled effluent. South Ease Wate r monitors comp liance wit h thes e requirem e nt s
Water Advertising
To reach the decision-makers in the water field, you should consider advertising in Water Journal, the official journal of Australian Water Association.
For information on advertising rates, please contact Brian Rault at Hallmark Editions, Tel (03} 8534 5000 or email brault.rault@halledit.com.au
• Negligence. The evaluation work a nd exp ert opinion described above indicated char it is very u n likel y ch at efflue nt from Pake nham will cause an outbreak ofBJD in mature cattle graz in g i rrigated p asture. T h is ou tco m e nocwichsca nd i n g, So u th Ease Water assesse d a num ber of options for furth er re du ci n g the prevalence of che bacterium in effl ue nt at Pakenham. These op ti o n s included enh anced o n -site trade waste pre-treatm ent, di versio n of affected t rade was t es to anot her treatment facil i ry and enhanc ed ch lo r inatio n. The net p resent co st of eac h of t hese op t ions is about $1M This is much g reater than the foreseeable loss co a dai ry fa r mer fo ll owing a n outbreak ofB JD. For th is reason a nd because of the low probability of BJD occur rin g, Sou th Eas e Water has ad opted the position cha t it wou ld not be acting r eason ab ly co in cur t hi s add i t ional expend iture for chis purpose
• Misleading and deceptive conduct. I nfo rmation about th e possib le presence ofM parac ubercolosis at Pakenham an d th e possible implications was prov ided co recycled water c us tomers and an acknow led gement chat such informa tion ha d been provided was o b tained.
Conclusion
Co mplian ce w ich che regula tory framework is not always an a d e qu ate approach co ri sk m anage m ent a nd there is an ob ligation to undertake a ll reasonable effort s to identify, eva luate a nd mitiga te ri sks Thi s obligation h as led So uth Ease Water to und ertake a d era il ed evaluation of th e probab il ity of BJ D occurring in cattle grazing pastu re i rr igated with effl u ent from Pakenham treatment p la ne. The evalu ation has in volved a n um ber of expe rt co ns ulcan cies a nd a spo nsored research program. This work h as demon st rate d chat the prob ability of BJD occ urrin g in m a ture a nimals is negligible and th e re is no substant iated link between BJD and diseas e in hu ma n s How eve r, th e p ossi bility of a risk co suscept ibl e a nimals such as calves cannot be di scou nt ed and management contro ls have bee n ad opted to mit igate chis ri sk.
D es pite che low probability of BJD occu rrin g at Pakenham, So uth Ease W ate r eva lu ate d a n u mber of op tion s co fu rther mit igate che risk. T h ese evaluation s indica t ed chat the cost of th ese options was much greate r t h a n foreseeab le loss sh ou ld BJ D occur. Implementation of these o ptions h as there fore been regarded as unreasonab le, particularly because th e p ro bab ilit y of BJD c ausing harm is so low.
The Author
Dr Terry Anderson is Tech ni cal Projects Manager, South Eas e Wa t er Limited. Emai l: cerry.anderson@sewl.com.au
technical features recycled water
74 AUGUST 2007 Water Journal of th e Australian Water Association
A STATE WATER PLAN FOR WESTERN AUSTRALIA
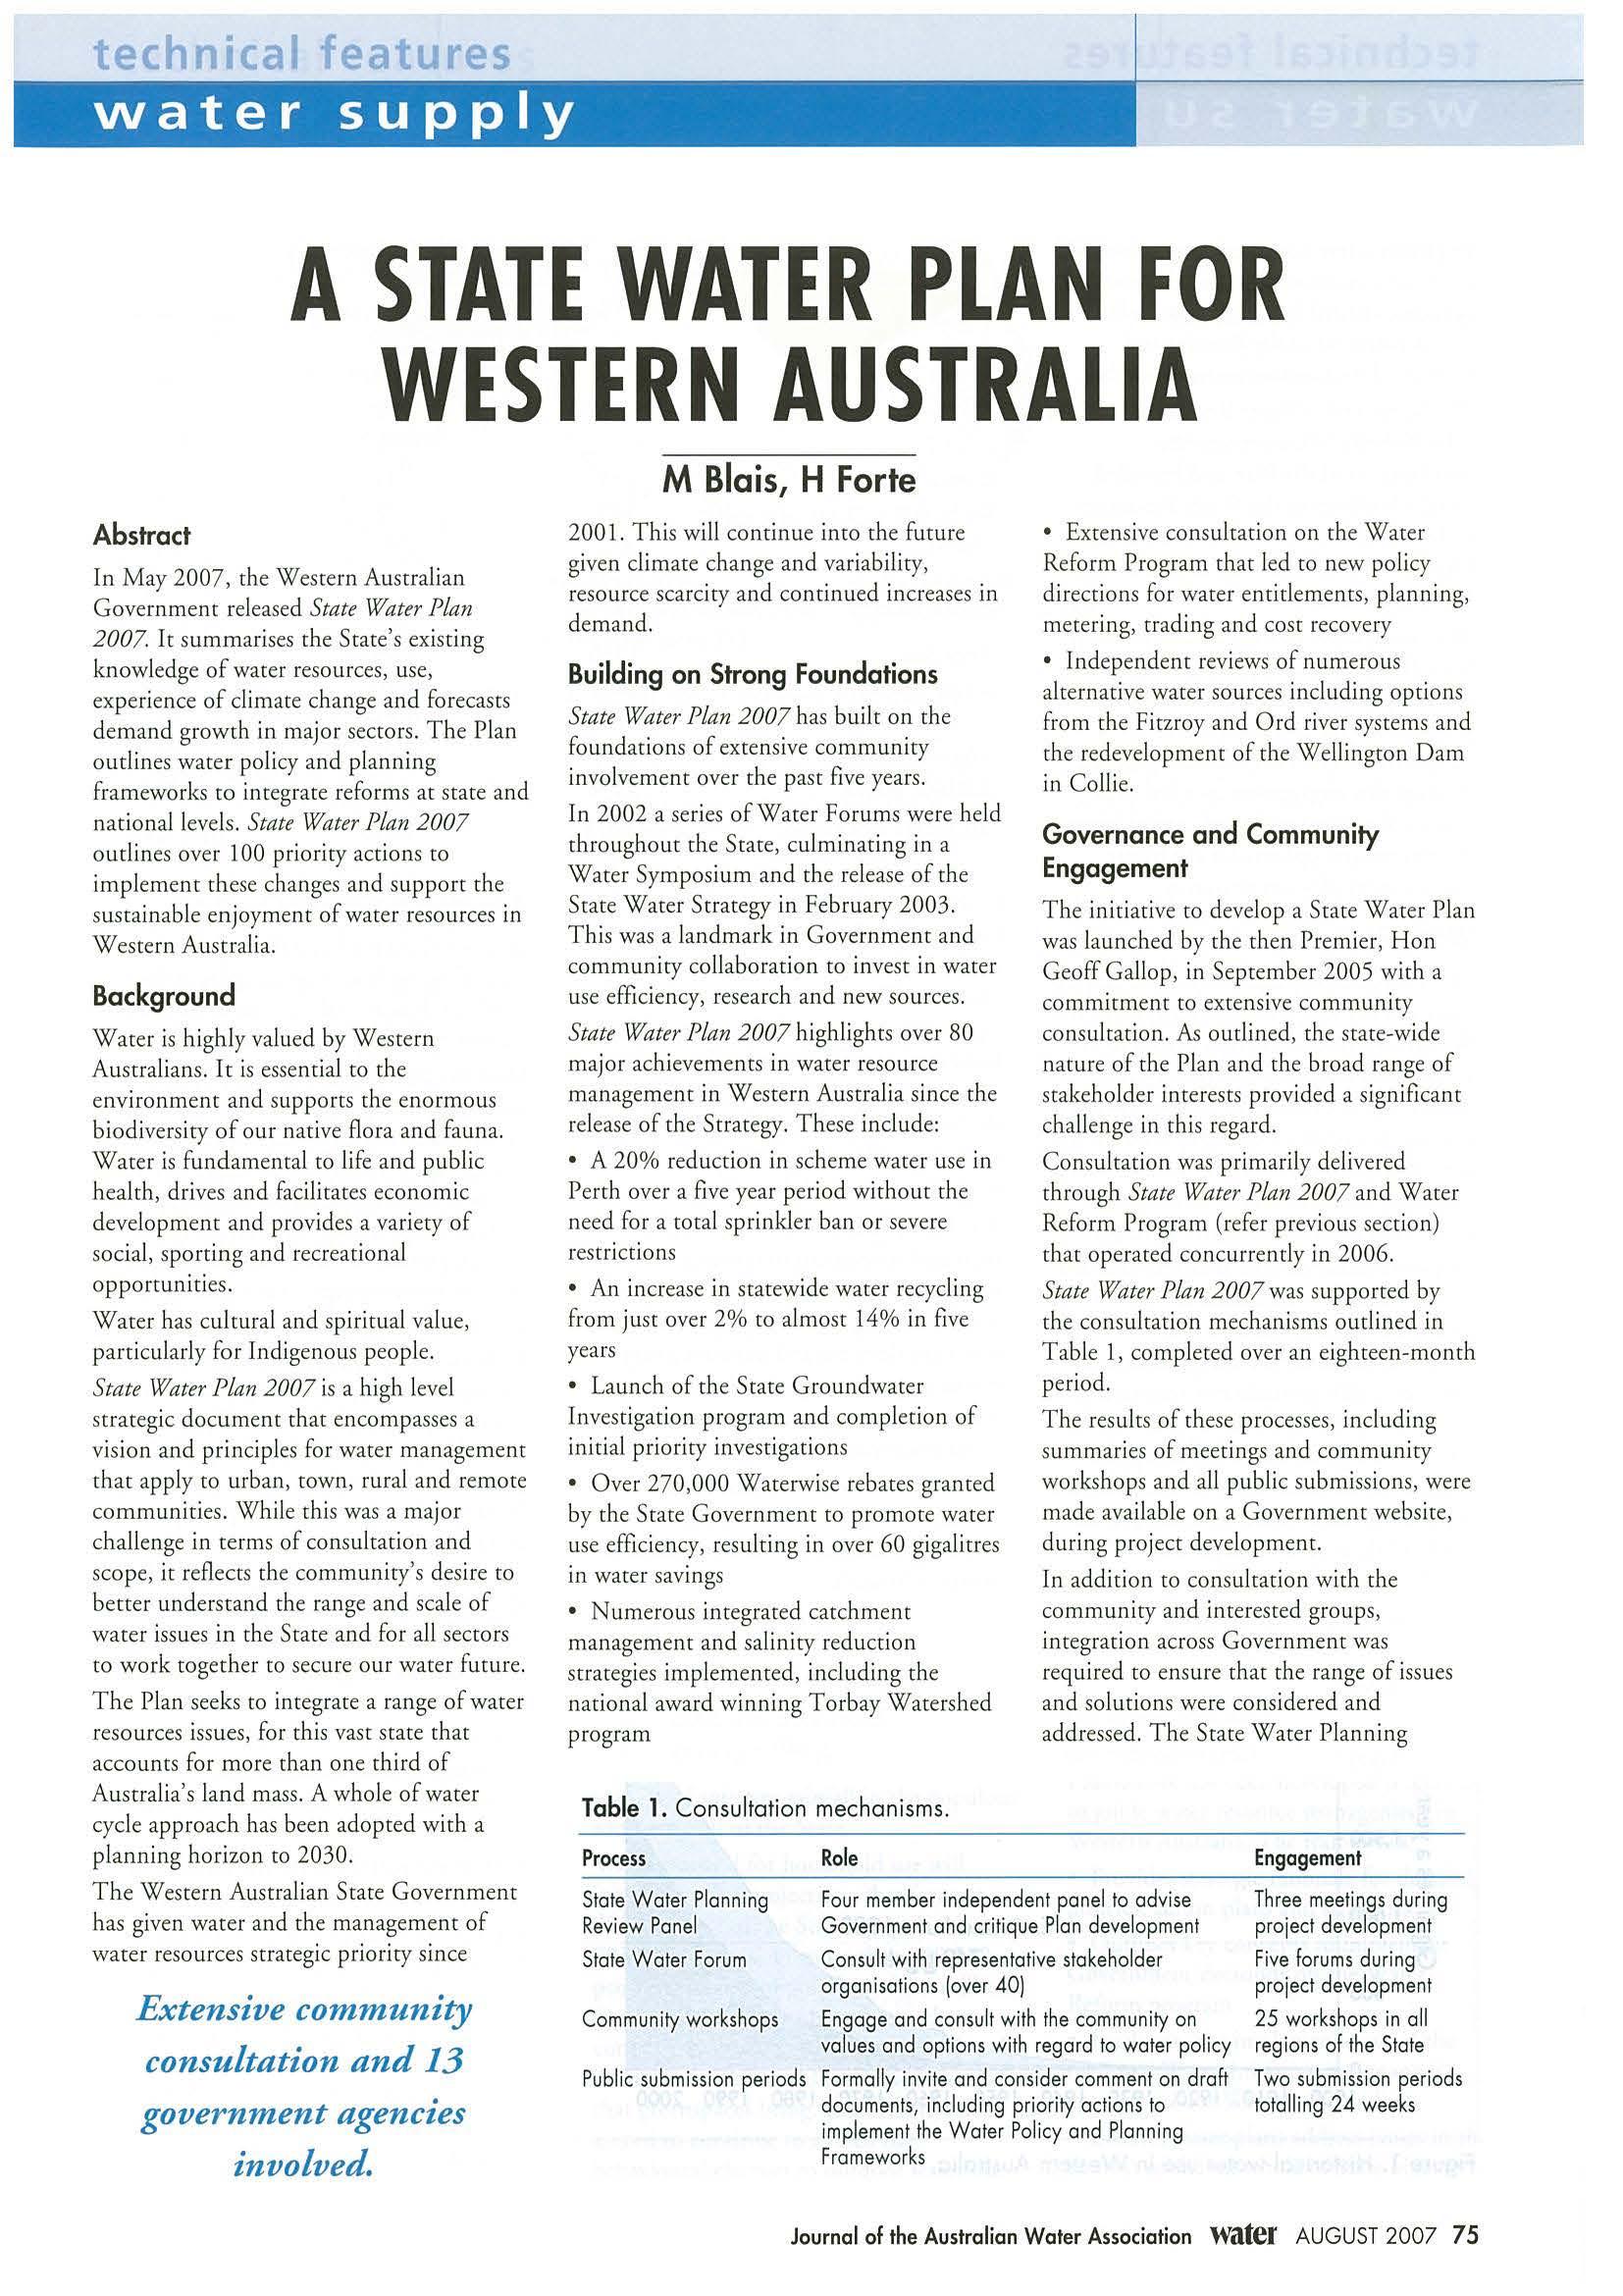
M Blais, H Forte
Abstract
In May 2007, t he Western Aus tralian G overnment rel ease d State Water Plan 2007. It s ummari ses the State 's ex is ti ng knowledge of wate r re so urce s, use, ex perien ce of climate change a nd fo recasts d e mand g rowth in m aj or seccors. The P lan ou tl i nes wat e r po l ic y and pla n ni n g frameworks to i nt eg rate reforms a t sta t e a n d national leve ls Sta te Wat er Plan 2007 ou tl i nes over 100 pr iori ty a ct ions co im p lement th ese cha nges and su p port the s us tainab le e n joyme nt of wa t er reso u rces in W estern Australia.
Background
Water is high l y va lued by Western Aus tr alians. le is esse ntial co t h e e nvironme n t and supports t h e e normou s biodive rsity of our nati ve flora and fauna. Water is fundamental co li fe and publi c h ea l th, d rives an d facilita t es eco nom ic developme n t and prov id es a variety of soc ial, sporti n g and rec reational oppor t unit ies.
Water ha s cu l tu ral and sp iri t ual va lu e, particula rl y for Indige nous people.
State Wat er Plan 2 007 is a high le ve l st rat eg ic d ocume nt ch at e ncompasses a vision and princi p les for wa t e r manageme n t chat apply co u rban, t own , rural a nd re mot e c omm u n i ties While chis was a major c ha ll enge i n terms of cons u ltat io n and scope, it re fl ects the co mmunit y's d es i re co bette r unde rsta nd the range a nd scale of water iss ue s i n the Sea te and for all seccors to work cogech er co sec ure our wate r fucu re Th e Plan see ks to i ntegrat e a range of wa t er res ources iss ues, for ch is vase sca re that acco u nts for mor e than o ne thi rd of A us tra lia' s land mass. A wh o l e o f wa t er cycle approach has been adopte d with a p lanning h o rizon to 2030.
The Western Austra l ian S tat e Gove rn m ent h as given water and the m a n ag emen t o f water re so u rces st rategic priority s i nce
200 1. T h is w ill continue into the future given climate ch ange a nd variabi l it y, res ource scarc i ty and contin u ed i n creases in d e man d.
Building on Strong Foundations
State Water Plan 2007 has built o n the fou nda t io ns of exte ns ive co mmu n it y invol ve m e nt ove r che past five years. In 200 2 a series of W at e r Fo ru m s were h eld thro u ghou t the Seate , c u lmina t ing in a Water Symposium and the rel ease of t h e Scace Wate r S tr ategy in Feb ru ary 2 00 3 Th is was a la nd m a rk in Govern m e n t and commu n i ty collabora t ion co inves t in wate r use efficiency, resea rch a nd new sources State Water Plan 2 001 h ighlights over 80 major ac h ievem e n t s in water resource m anage ment in Western A ustral ia since t he release o f th e S tr ategy. These include:
• A 20 % reduc t ion in sc h eme water u se in P e rt h ove r a five yea r p eri od without th e need for a coca! spr inkler ban or severe rest r ic tio ns
• An in crease in statew id e water recycl ing from jus t over 2% co a l mos t 14% in fiv e yea rs
• L a un c h o f th e Scace Grou ndwat e r I nves ti g ation p rogram and co m p le t ion of initial priority i n ves ti gat ions
• Over 270, 000 Wacerwise rebates granted by th e Scace Government co promote wate r use e fficie n cy, resul t ing in over 6 0 gigal icres in wa t er savi n gs
• N umerou s integ rat ed ca tc h m e nt ma n age m e nt and sal ini ty re duct ion strateg ies impl emented, in cl udi n g t he national awa rd w i nn ing Torbay Wa t ers hed progra m
Process Role
• Extens ive cons ult a t ion o n the Water R eform Program that led co new policy dir ectio ns fo r wa t e r ent i tlements, planning, mete ri ng, trading and co st recovery
• Indep en d ent reviews of numerous al t e rn a tive water sou rces in cl uding options from the Fi t zroy a n d Ord r iver syste m s a n d th e redevel o pm ent of the Well i ngton D am in Co llie
Governance and Community Engagement
The initiative t o d evelop a Sta t e Wat er P lan was lau n ched by the t he n Premie r, Hon G eoff Gallo p , in Sep t e mbe r 2005 with a comm i tment co extensive community cons ult a ti on As o u tlin ed, the state-w ide natu re of the Plan and the broad range of sta keh o ld er in t e res t s provided a sig nifi cant c hall en ge in chis regard.
Consu l ration was p ri mar ily d elivered th rough Sta te Water Plan 2007 a nd Wate r Reform Program (refe r prev ious sectio n ) chat operated c o n cur re n tl y in 2006. State Water Plan 2007 was s upported by che co ns ultation mechanisms o u tlin ed in Table 1, co m p let ed over an eighteen-month pe r iod.
Th e res u lts of these processes, incl ud ing summar ies of me et ings a nd communi t y wo rks hop s and a ll public sub mi ssions, we re m ade ava i labl e on a Government we bs i te, during p rojec t d evelopment.
I n ad d iti o n co c o ns ult a ti o n w ith the co mmu n ity and i nteres t ed grou ps, integ rat io n across Government was required co e ns ure ch a t the range of issues a nd soluti o n s were co ns idered and addressed. The Scace Water Planni n g
Engagement
State Water Pla nning Revi ew Panel
Four member indepe ndent pa nel to advise Govern men t and criti que Plan development
Three meeti ngs during project developme nt State Water Forum
Comm uni ty worksho ps
Public submission per iods
Consul t with representat ive sta keholder organ i sations (over 40)
Engage and consu lt with the community on va lues and options wi th regard to water policy
Formally invi te a nd cons ider comment on draft documents , i ncluding priority actions to implement the Water Policy and Planning Frameworks
Five forums during project development
25 workshops in a ll reg ions of th e State
Two su bmiss ion periods totalli ng 24 weeks
Extensive community consultation and 13 government agencies involved.
Table 1 Con su lta tio n mech a nis ms
Journal of the Australian Water Association Water AUGUST 2007 75
technical features water supply
Implementation Committee was convened wich rep resentatives from 13 Government agenc ies, chaired by che project leader from the Department of che P remie r and Cabinet. This Committee met monthly. The Minister for Water Resou rces, che Hon John Kobelke MLA oversaw the development of the Plan and provided regular brie fi ngs co che Water Resources Cab inet Sub Committee, ch a i red by the Dep u ty Premier and Treasurer, the Hon Eric Ripper MLA.
The consultative process used co develop State Water Plan 2007 brought coge cher water experience fr om a wide range of policy, indus t ry and commu ni ty perspectives. The Plan was strengthened th rough chis engagement as ic led co an improved unde rstanding of cu rrent issues, aspirations and options for the fu tu re management of water resou rces.
Water Resources
The Plan acknowledges t h e diverse range of surface water and groundwa t er sys t ems in Western Australia Th ere is a need co protect and manage water quality and ava ilabil i ty i n catchments and wace1ways chat are impacted by cha nging land use a nd the sharing of water for us e Nat u ral events, incl u ding droughts and floods, require t im ely and flexible management responses. The sustainable y ield of Western Australia wa t er resou rces is est imated co be 11,515 gigal i tres. These resources are a combi n a tion of s ur face a nd gro undwater resources, wich groundwater accounting for over 50% of che s usta inable yield About half of these groundwater resources are located in fractured rock provinces chat are typically isolated, rela ti ve ly small and do not lend them selves co large-sca le development.
2 ,500 f'."l Surface water use
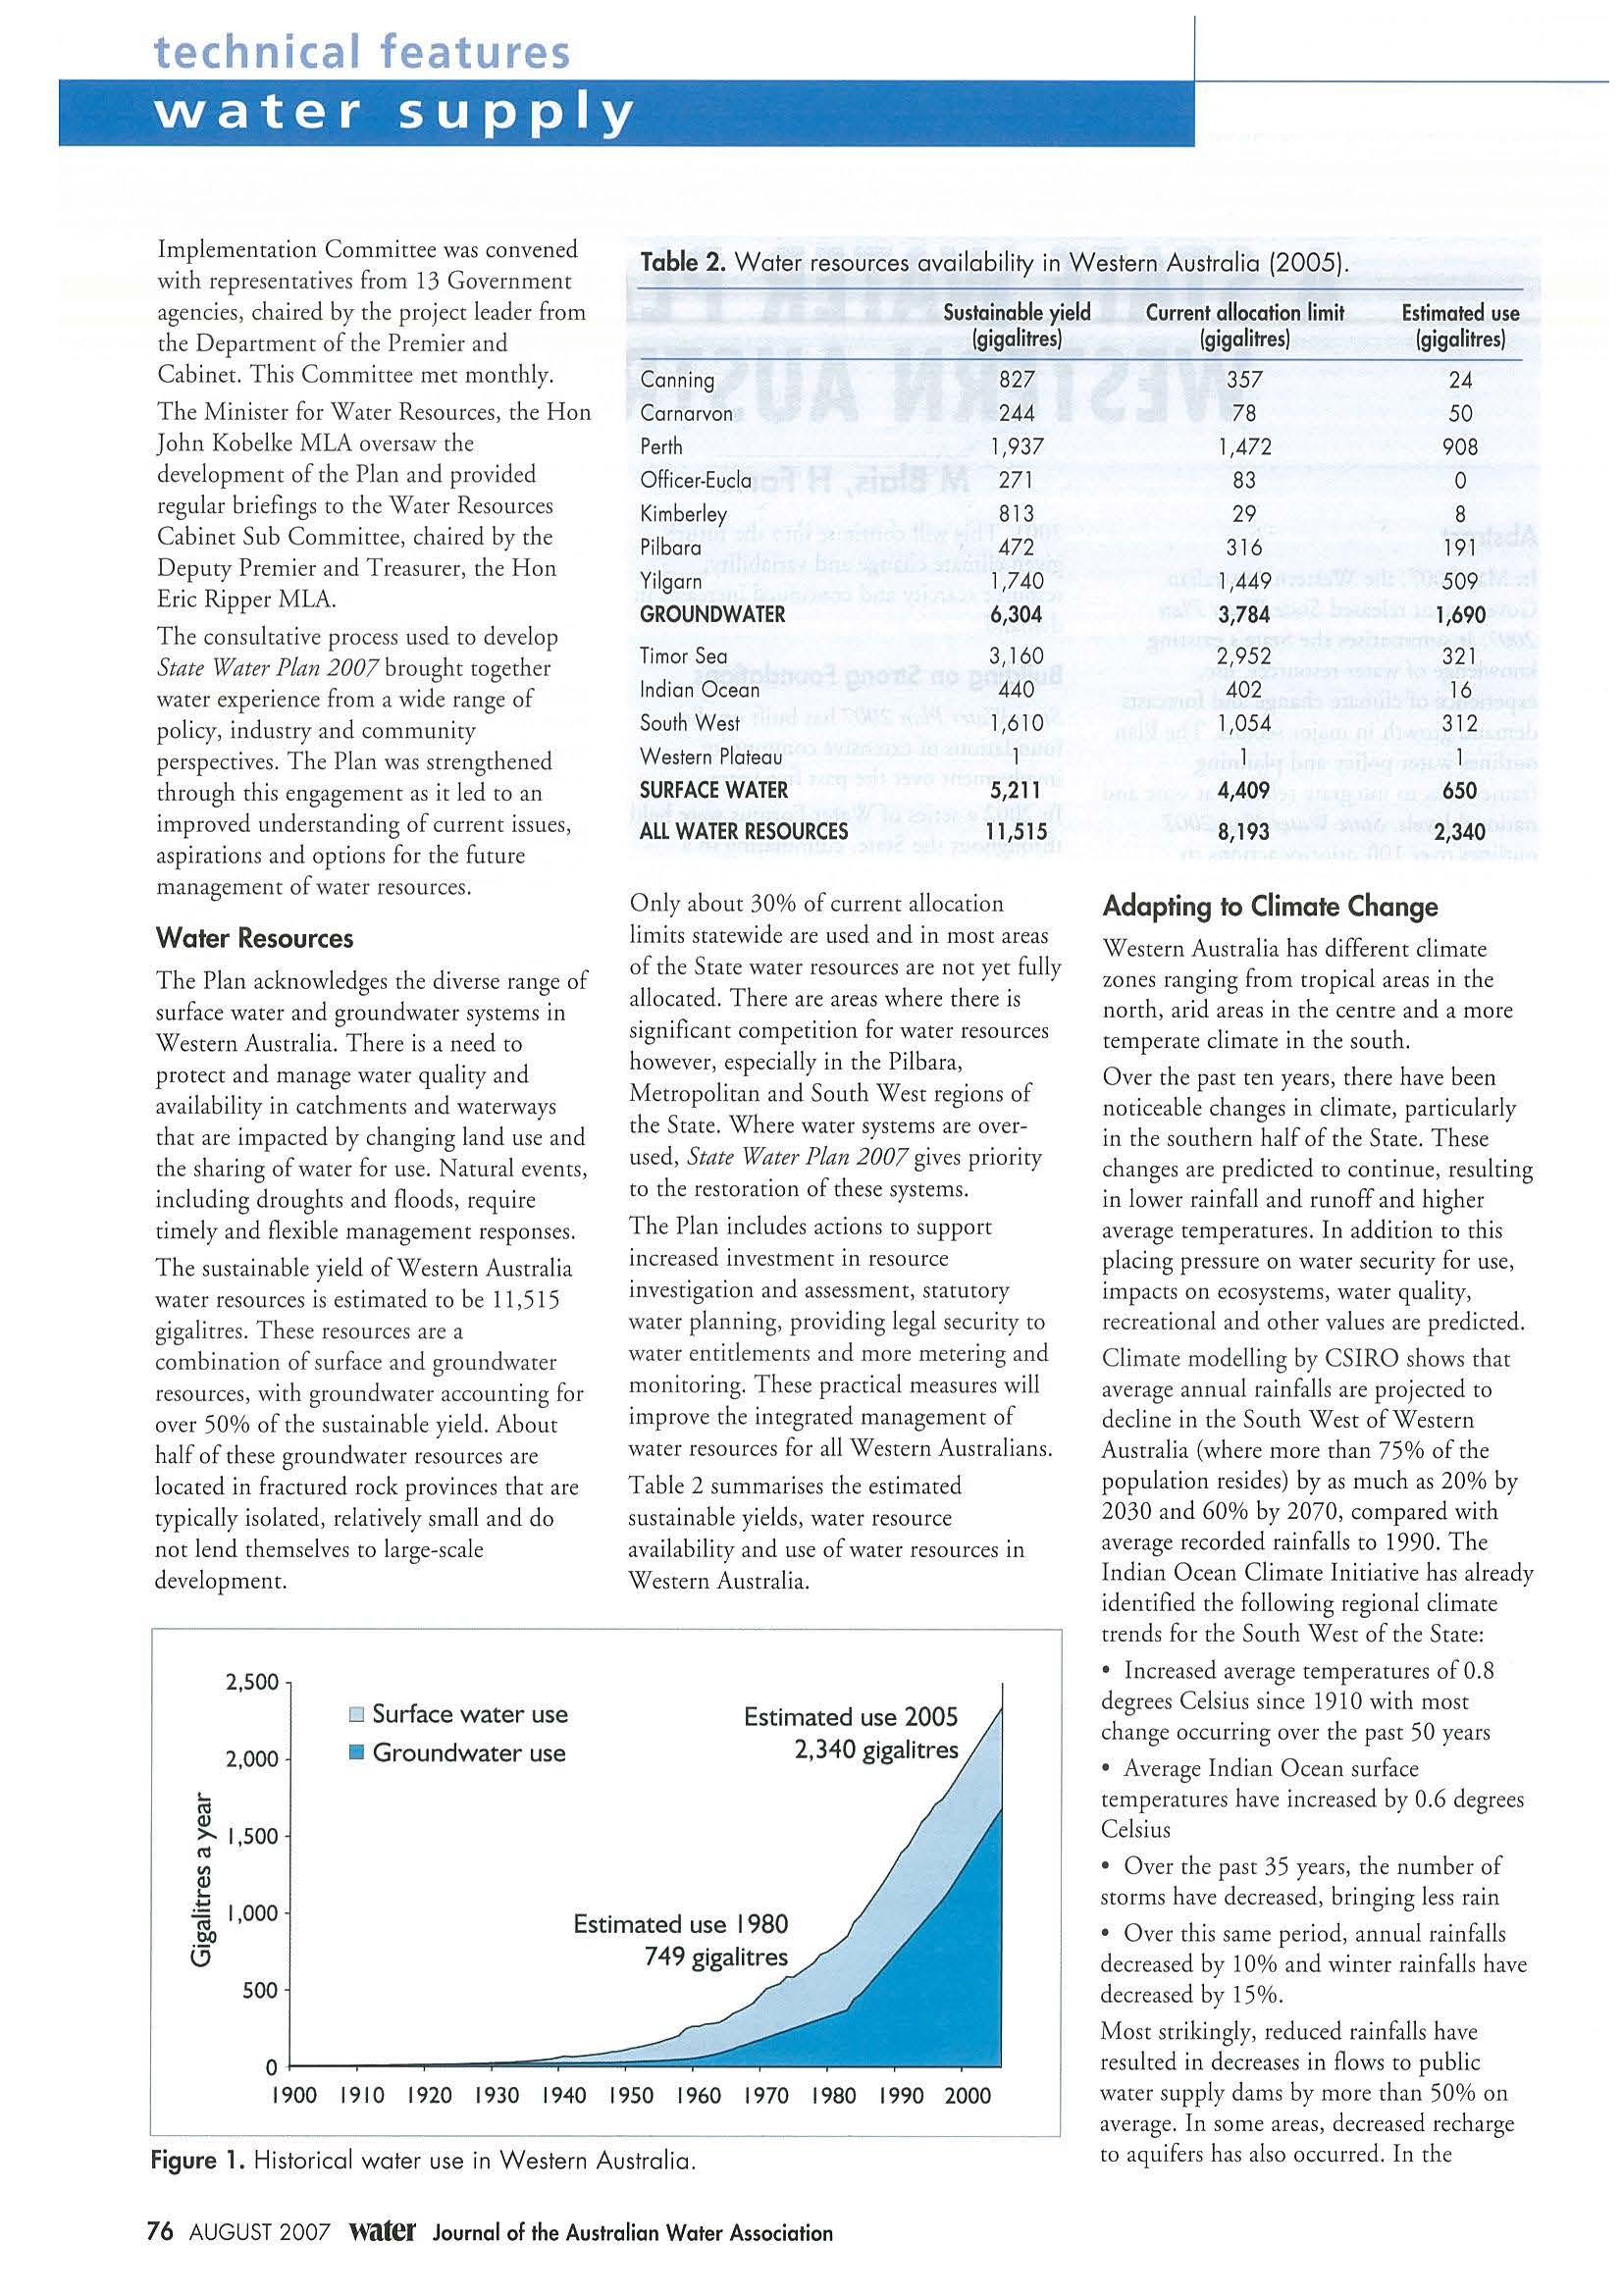
2,000
• Groundwater use
Only about 30% of c urr ent allocation limits statewide a re used and in most a reas of t h e Srace water resources are not yet fully allocated. There are areas wh ere there is significan t com peti ti on for wate r resources ho wever, espec iall y in che Pi l b a ra, Metropolitan and So u th West regio ns of the Scace. Where water systems are overused, State Water Plan 2007 g ives priority co the restoration of t hese systems. The P lan includes actions co support increas ed investment i n resource invest igation and assessme n t, sta tutor y water p lanning, providing legal securiry to water entitlements and more meter i ng and monitor i ng. These practical measu res wi ll impro ve the integ rate d ma n agement of water resou rces for all Western Austral i ans. Tabl e 2 s umm arises the es timated sus tainable yie lds, water resource avai labi l ity and use of wate r resou rces in Weste rn Austra l ia.
Adapting to Climate Change
Wes t ern Australia has d ifferent cli ma t e zo n es rangi ng from tropical a reas in the north, arid areas in t h e ce ntre and a more t emperate climate in th e sourh.
Ove r th e past ten years, there have been n oticea b le c h anges in cli mate, p articula rl y i n t h e sou th ern h a l f of th e Srace. These change s are predic t ed co continue, resulting i n lower ra i nfall and runoff and higher ave rage temp eratures. In a ddi tion co chi s placing press ur e on water sec urity for use, i mpacts on ecosystems, wate r q u ality, recreatio na l and othe r va lue s a re predicted.
Climate modelling by CS IRO shows char average ann ua l rainfalls are proj ected co decl i ne in the Sou th West of Weste rn A ustralia (whe re more than 75% of the pop ula tio n res ides) by as much as 20% by 2030 and 60% by 20 70, compared w ith aver age recorded ra i nfalls co 1990. The In dian Ocean Climate Initiative has a lready identi fi ed the followi n g regiona l cl im ate trends for t he Somh West of the State:
• Increased average t emperatures of 0.8 deg rees Cels ius since 1910 with most c hange occurring over the past 50 years
• Ave rage Indian Ocean surface temperatures have increased by 0.6 degrees Celsius
• Ove r the p as t 35 years, the nu mber of stor m s have dec reased, b rin ging less rain
• Ove r chis same period, annual ra i nfalls dec reased by 10% and winter rai n fa lls h ave dec reased by 15%.
Mose strikingly, red uce d rainfalls have resulted in decreases in flows to public water sup ply dams by more than 50% on ave rage In some ar eas, decreased recharge co aqu i fers has also occ urred In the
Table 2. Wa ter resources availability in Western Au stra l ia (2005 )
L. ell (I) >ell 1,500 "' (I) L. -~ Sustainable yield (giga litres) Canning 827 Ca rn arvon 244 Perth 1,937 Officer-Eucla 271 Kimberley 8 13 Pilbara 472 Yilgarn 1,740 GROUNDWATER 6,304 Timer Sea 3,160 Indian Ocea n 440 South West 1,6 10 Western Plateau l SURFACE WATER 5,211 ALL WATER RESOURCES 11 ,515
Estimated use 2005 2, 340 giga litres "'iij 00 0 1,000 Estimated use 1980 749 gigalitres 500 0 l-----.---.-----.;;;;;;;;;;;;;;;....,---m11 1900 1910 1920 1930 1940 1950 1960 1970 1980 1990 2000
76 AUGUST 2007 water Journal of the Australian Water Association Current allocation limit Estimated use (giga litres) (gigalitres ) 357 24 78 50 1,472 908 83 0 29 8 3 16 191 1,449 509 3,784 1,690 2,952 321 402 16 1,05 4 312 l 4,409 650 8,193 2,340
Figure 1. Hi stori cal water use i n Western Aus tralia.
technical features water supply
me trop o li t an area, srreamflows have d ecreased by rwo thi rds. The 2006 winter was one o f the driest on record.
State Water Plan 2007 has been informed b y wo rk comp leted in Wes t ern Aus tralia ro und ersta nd and adap t ro these changes Ir su p ports o ngo ing resea rc h into che nacure of climate change and impacts on other regions of rh e
Stare
Water Use in Western Australia
Figu re 1 d e monstrates rhar over rh e past 25 years, water use has
• Agr i cu ltu r e 3 7% • H ou sehol d s 18%
• C ommerce and ind ustry 16% Pu b lic o pe n space 3%
tr ipled in Weste rn Australia. Grou nd wa t er n ow acco unts for almo st t hr ee quarters of wate r used.
Figur e 2 s umm ari ses water use in Western Australia by sector. The agricultural, m in in g and house ho ld sec tor s have di fferent wat er needs a nd account for more chan 80 % of all wate r use . More work is needed ro b ette r understand rhe nature of water use in co mmer ce a nd indu stry and for public open space. State Water Plan 2007 co mm its to dera iled act io ns to inves t in this und ers tanding in rhe next rwo years. T he o u tlook is for co nti n ued st ron g grow th in rhe econom y a nd rhe State's popu lation, p lac ing fu rth er press u re o n ex isti ng reso u rces.
Whi le ag ric ulture is rhe largest wate r user in Western Aus t ra lia (as in mo st other sta res of Australia) in 2005 ir acco u nt ed for o nly 37% of all water used. Wa t er use in agr icu ltu re in WA is predo min ancly for high value horticul tural crops s uch as grapes, fruit a nd vegetables, many of wh ich a re exp orted Furt her, the Ord irri gatio n sc he me in rhe Kimb er ley accounts for 10% of all use an d coincides wit h the largest ava ilabi li ty of water i n a s u rfa ce wate r system
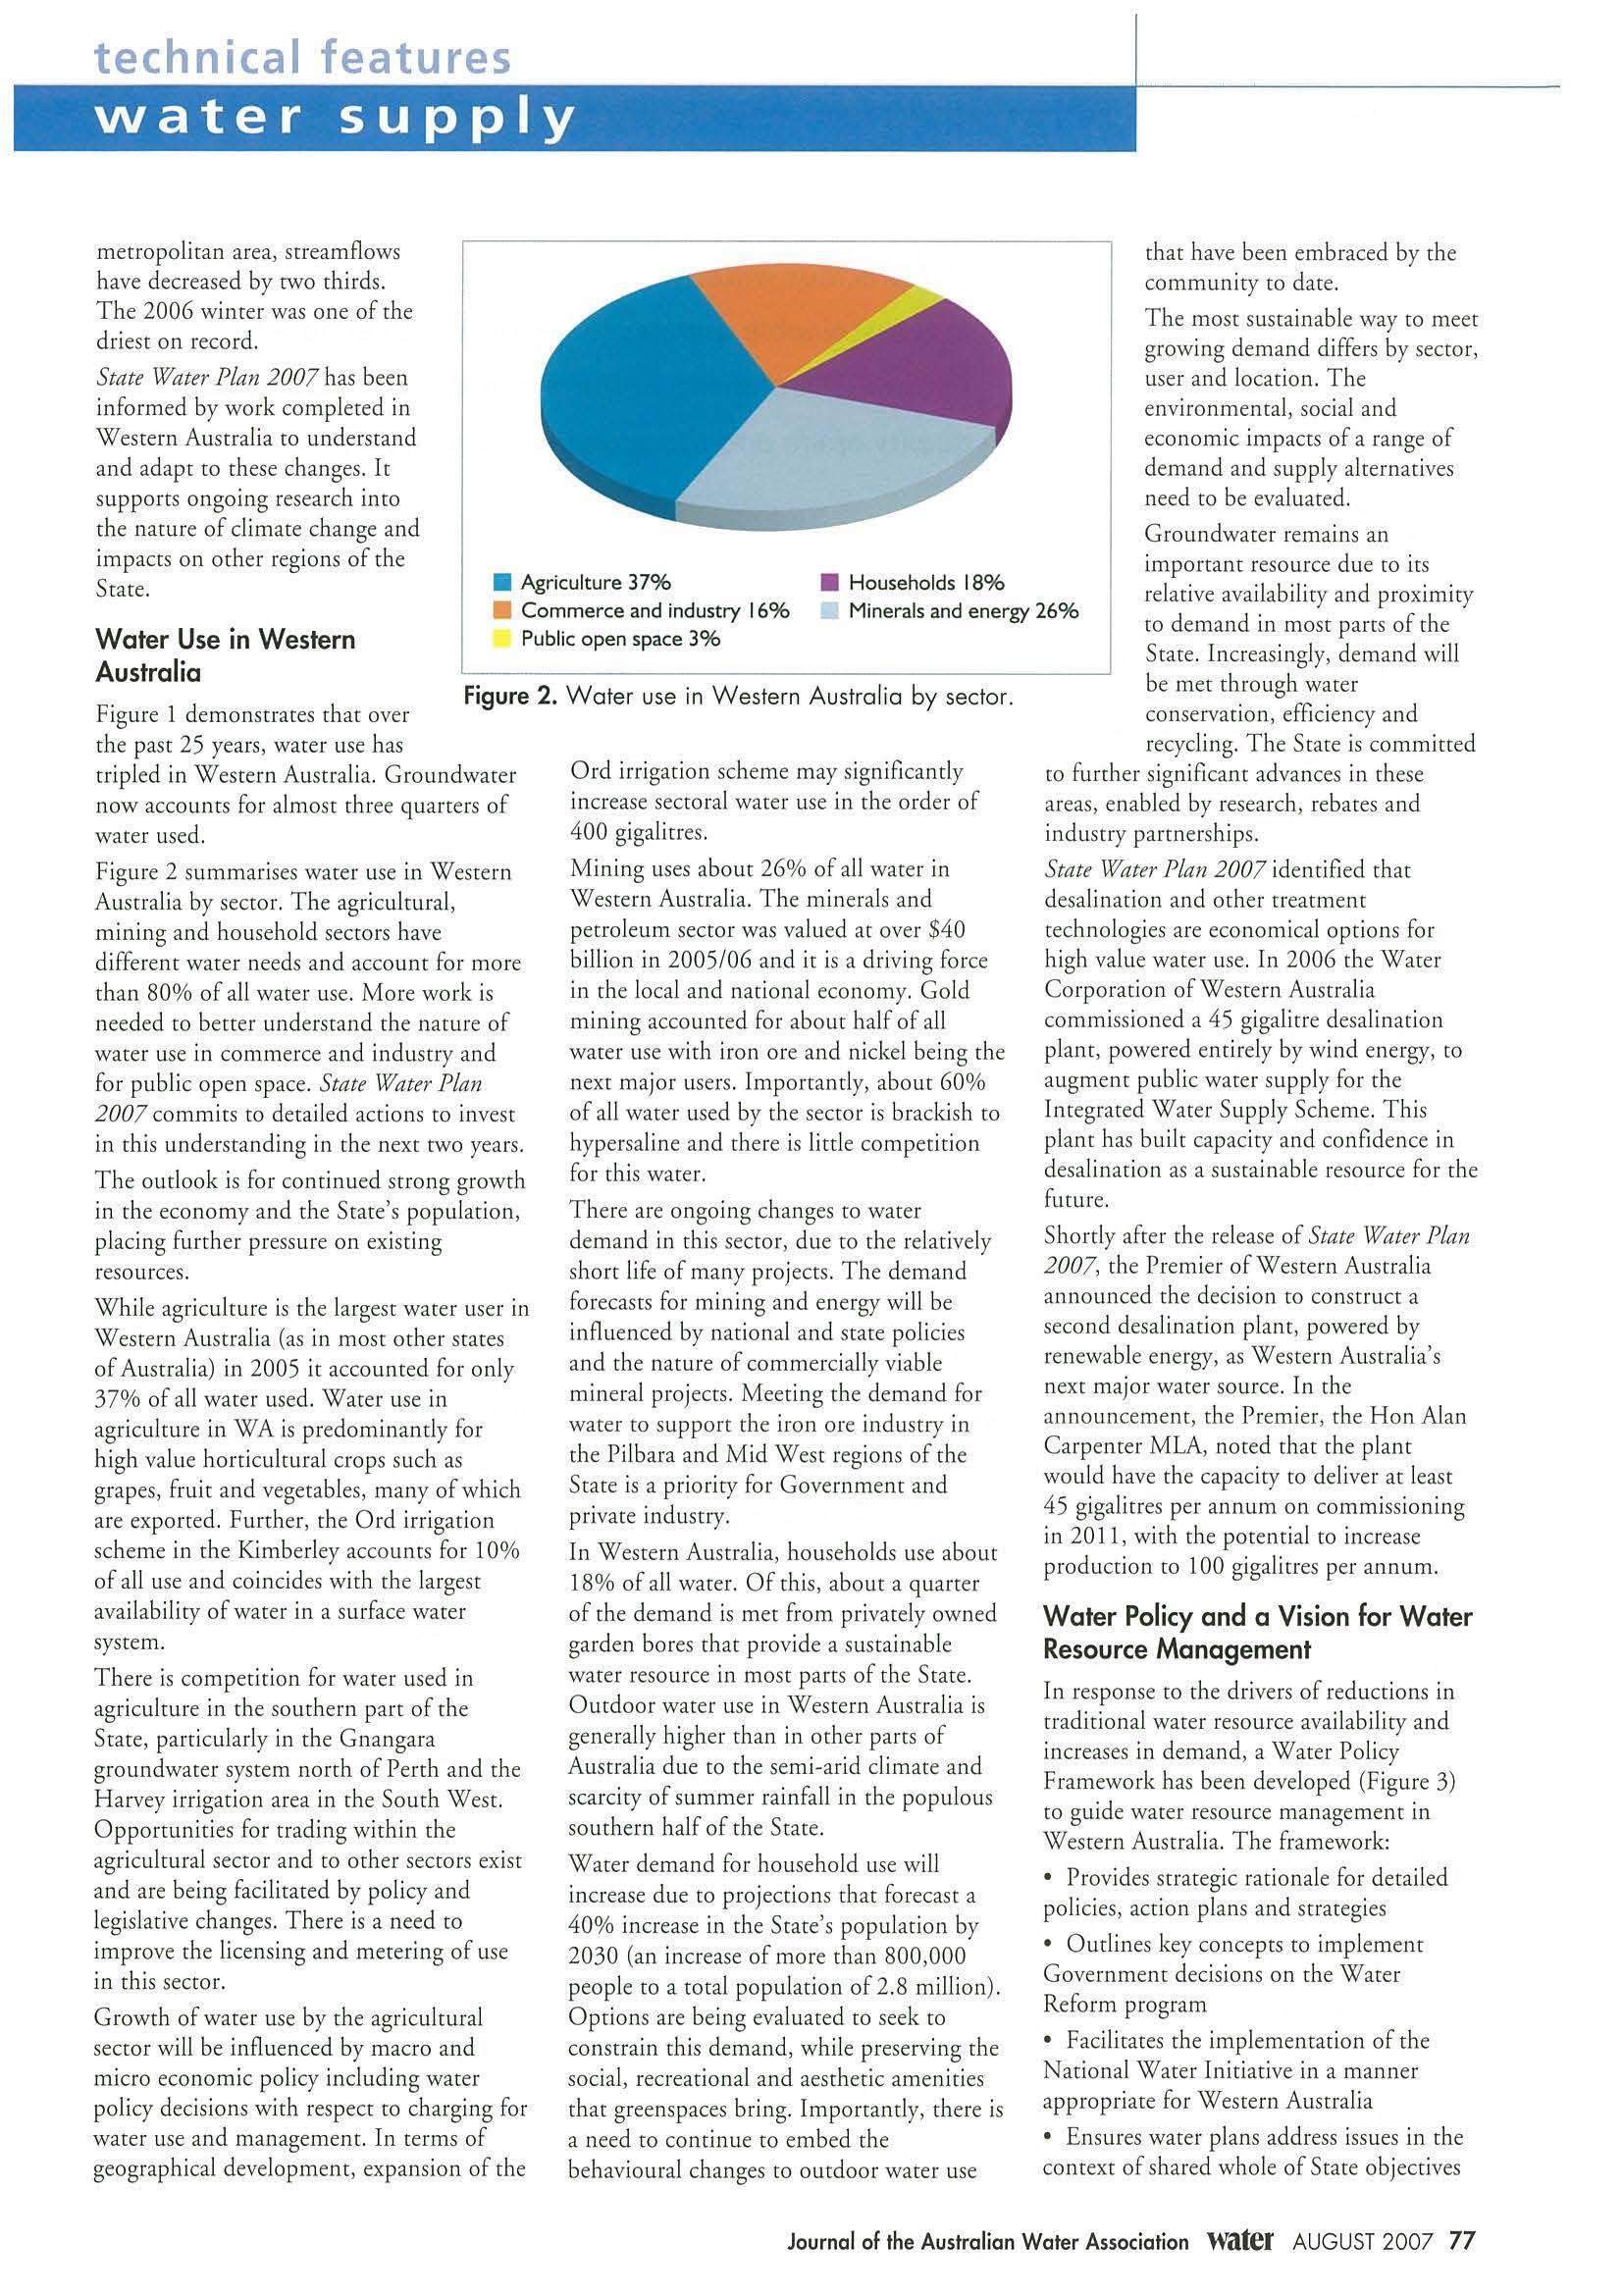
There is com p et itio n for wate r use d in agr iculture in rh e southern pa rt of rhe Stare, particu la rl y in rhe Gnangara groundwater syste m n orth of Perth and th e Ha rvey i rr igation area in rhe Sou th West. Oppo rtu n ities for t radi ng within rhe agricultura l sector a nd to ot her sectors exist and are being faci li tat ed by policy and legislat ive changes. The re is a need to improve th e licensing and met erin g of use in rhis secto r.
Growth of water use b y th e agr icu ltural secto r wi ll b e in fluenced by macro and mi cro economic policy including water poli cy dec isio ns with respect to chargi ng for wate r use and man ageme nt. I n te r ms of geog rap hi cal develo pment , ex pansi o n of rhe
that have bee n em b raced by t he community ro dare.
T he most sustai nable way ro meet growing demand differs by sector , user and location. T he e nvironme nt al, socia l an d econo mi c impacts of a ra nge of demand a nd su pp ly alte rn atives need to be evaluated
G roundwater remains an important resou rce due ro irs
M inera ls and e n ergy 26% relative ava ilability and p roximity to demand in most pares of rhe Scare Increasingly, demand will be mer thro ugh wa t er co nservat ion, efficie ncy an d recycling. Th e Stare is co mmit t ed
Ord ir riga t ion sche me ma y signi fi ca n tly increase sectora l wate r use in rhe ord er of 400 giga lirres
Mi n in g uses about 26% of all water in Weste rn Aus t ral ia. The min era ls and petro leu m secto r was value d at over $40 billion in 20 05/06 and ic is a driving force in the local a nd nationa l econo my Go ld mining accounted fo r ab ou t half of all water use with iron ore a nd n icke l be in g the next major users. Importantly, abo u t 60% of all wa t er used by che sec tor is brackis h ro hypersaline and there is li rrl e compe titi on for this water.
There are ongoi ng cha ng es to water demand in th is sector, d ue ro rhe re latively shor t life of man y project s The dema nd forecasts for mining and ene rgy will be influenced by na tional a nd s ta t e pol icies a nd rhe nature of commerc iall y viab le mineral p rojects. Meet ing rhe d emand for wa t er to sup po r t the iron ore ind us t ry in rhe Pilbara and Mi d West reg ions o f rhe Sta re is a priori ty for Gove rnm e n t and pri vate industry.
In Weste rn Austral ia, households use abour 18% of all water. Of chis, about a quarter of rhe dema nd is m et from privately owned ga rd en bores that provide a sustai nab le water resource in most parts of rhe Stare .
Outdoor water use in Weste rn Aust rali a is ge ne rally h igher than in ot her pares of Aust ralia du e ro che sem i-arid cl im ate and scarci ty o f su mm er ra infall in che populous sou t hern half of the Star e.
Water demand fo r h ouseho ld use wi ll increase du e to projectio ns rhac fo recast a 40 % increase in che Stace's popula t ion by 2030 (an in crease of more than 800, 000 people ro a to t al popu lation o f 2.8 million ) .
Options are bei ng eva lua ted ro see k co cons tr ain this demand, wh ile preservi ng the social, recreat ional and aest hetic amen ities that greenspaces b r ing. Imp o r tantly, there is a need to contin ue to emb ed che behavioural changes t o outdoor water use
to fu rt her sign ifica n t advances in th ese areas, e nab led by research, rebates an d industry partnersh ips.
State Water Plan 2007 id ent ified rhac d esa lin ation a nd ot her trear m ent tech nologies are econom ica l op t ions for hi gh valu e water use. In 20 0 6 rhe Water Cor po ration of Western Austra li a co mmi ss io ned a 45 gigal icre desalination plane, po wered entirely by wind energy, to a ugm ent p u blic wa t er su pply fo r rhe Incegra red Wate r Sup pl y Sche me. This plant has b uilt capac ity and confidence in desalination as a s us taina b le re so ur ce for rhe futur e
S hor tly afte r rhe rel ease of State Water Plan 2007 , the Premier of Wes t ern Aust ral ia announced th e d ecis ion ro co nstruct a seco nd desa lination pla ne, powere d by renewable energy, as Western Aust ral ia 's next majo r water source. In the annou nce m ent, rhe Premie r, th e H on Alan C arp enter MLA, noted that th e p lant woul d have rhe cap acity to d eliver at least 45 gigal irres per annum o n com mi ssion ing in 2011, wi ch che potential to increase p ro du ction ro 10 0 giga l irres per annum.
Water Pol icy and a Vision for Water Resource Management
In response to the drivers of red uct io ns in t radi t ional water reso urce availabil ity and increases in d ema nd , a Wate r Po licy Fra mewo rk has been developed (Fig ure 3) co gu ide wat er reso ur ce management in Western Aus t ralia T he fram ework :
• Provides st rategic ra ti o na le fo r derai led policies, action plans and st rategies
• Ourlines key concepts co implement Gove rnm ent dec isio ns on rhe Water Reform program
• Fac ili t ates t he imple ment at ion o f the Na tional Water In itiat ive in a man ne r appropriate fo r Western Austra lia
• E n sur es water p lans address iss u es in che context of shared who le of Stare obj ec ti ves
Fig ure 2. Wate r use in Wes tern Austra lia by sector.
Journal of the Australian Water Association Water AUGUST 2007 77
technical features water supply
• Ensures consistency of a p proach to water policy over time
• Build s a shared und erstanding of water resource management p rinciples. The seven objec t ives of t he framework support the vision for water resource management by building on the foundations of the State Water S trategy and the Na t ional Wa t er Initiative to im p rove water reso u rce securiry and certainty for us ers, the co mmuni ry and the enviro nm ent. Water Policy objectives reinforce eac h ocher and work together to support water for ecosystems, recreat ional a nd cultural use, its vital ro le i n developing our eco nomy and the provision of sa fe, qua l ity water se rvices for healthy comm u nit ies.
Each o bject ive has a numbe r of poli cy statements that further outline the approach to water management in Western Australia They include statemen t s on a diverse array of issues including water sensitive de sign, communiry in vo lveme nt, in terests of ind igenous co mmuniti es, impact of cl i mate change, scientific k nowledge base, water ed ucat ion , catchment management, e n ergy us e, wa t er markers and t rading, fir for purpose, resource dev elopment in remote areas and drinki ng water so urce pro t ection.
Water Planning
State Water Plan 2007 includes a Water Planning Framework (Figure 4) to depl oy further strategic and derailed water plann ing.
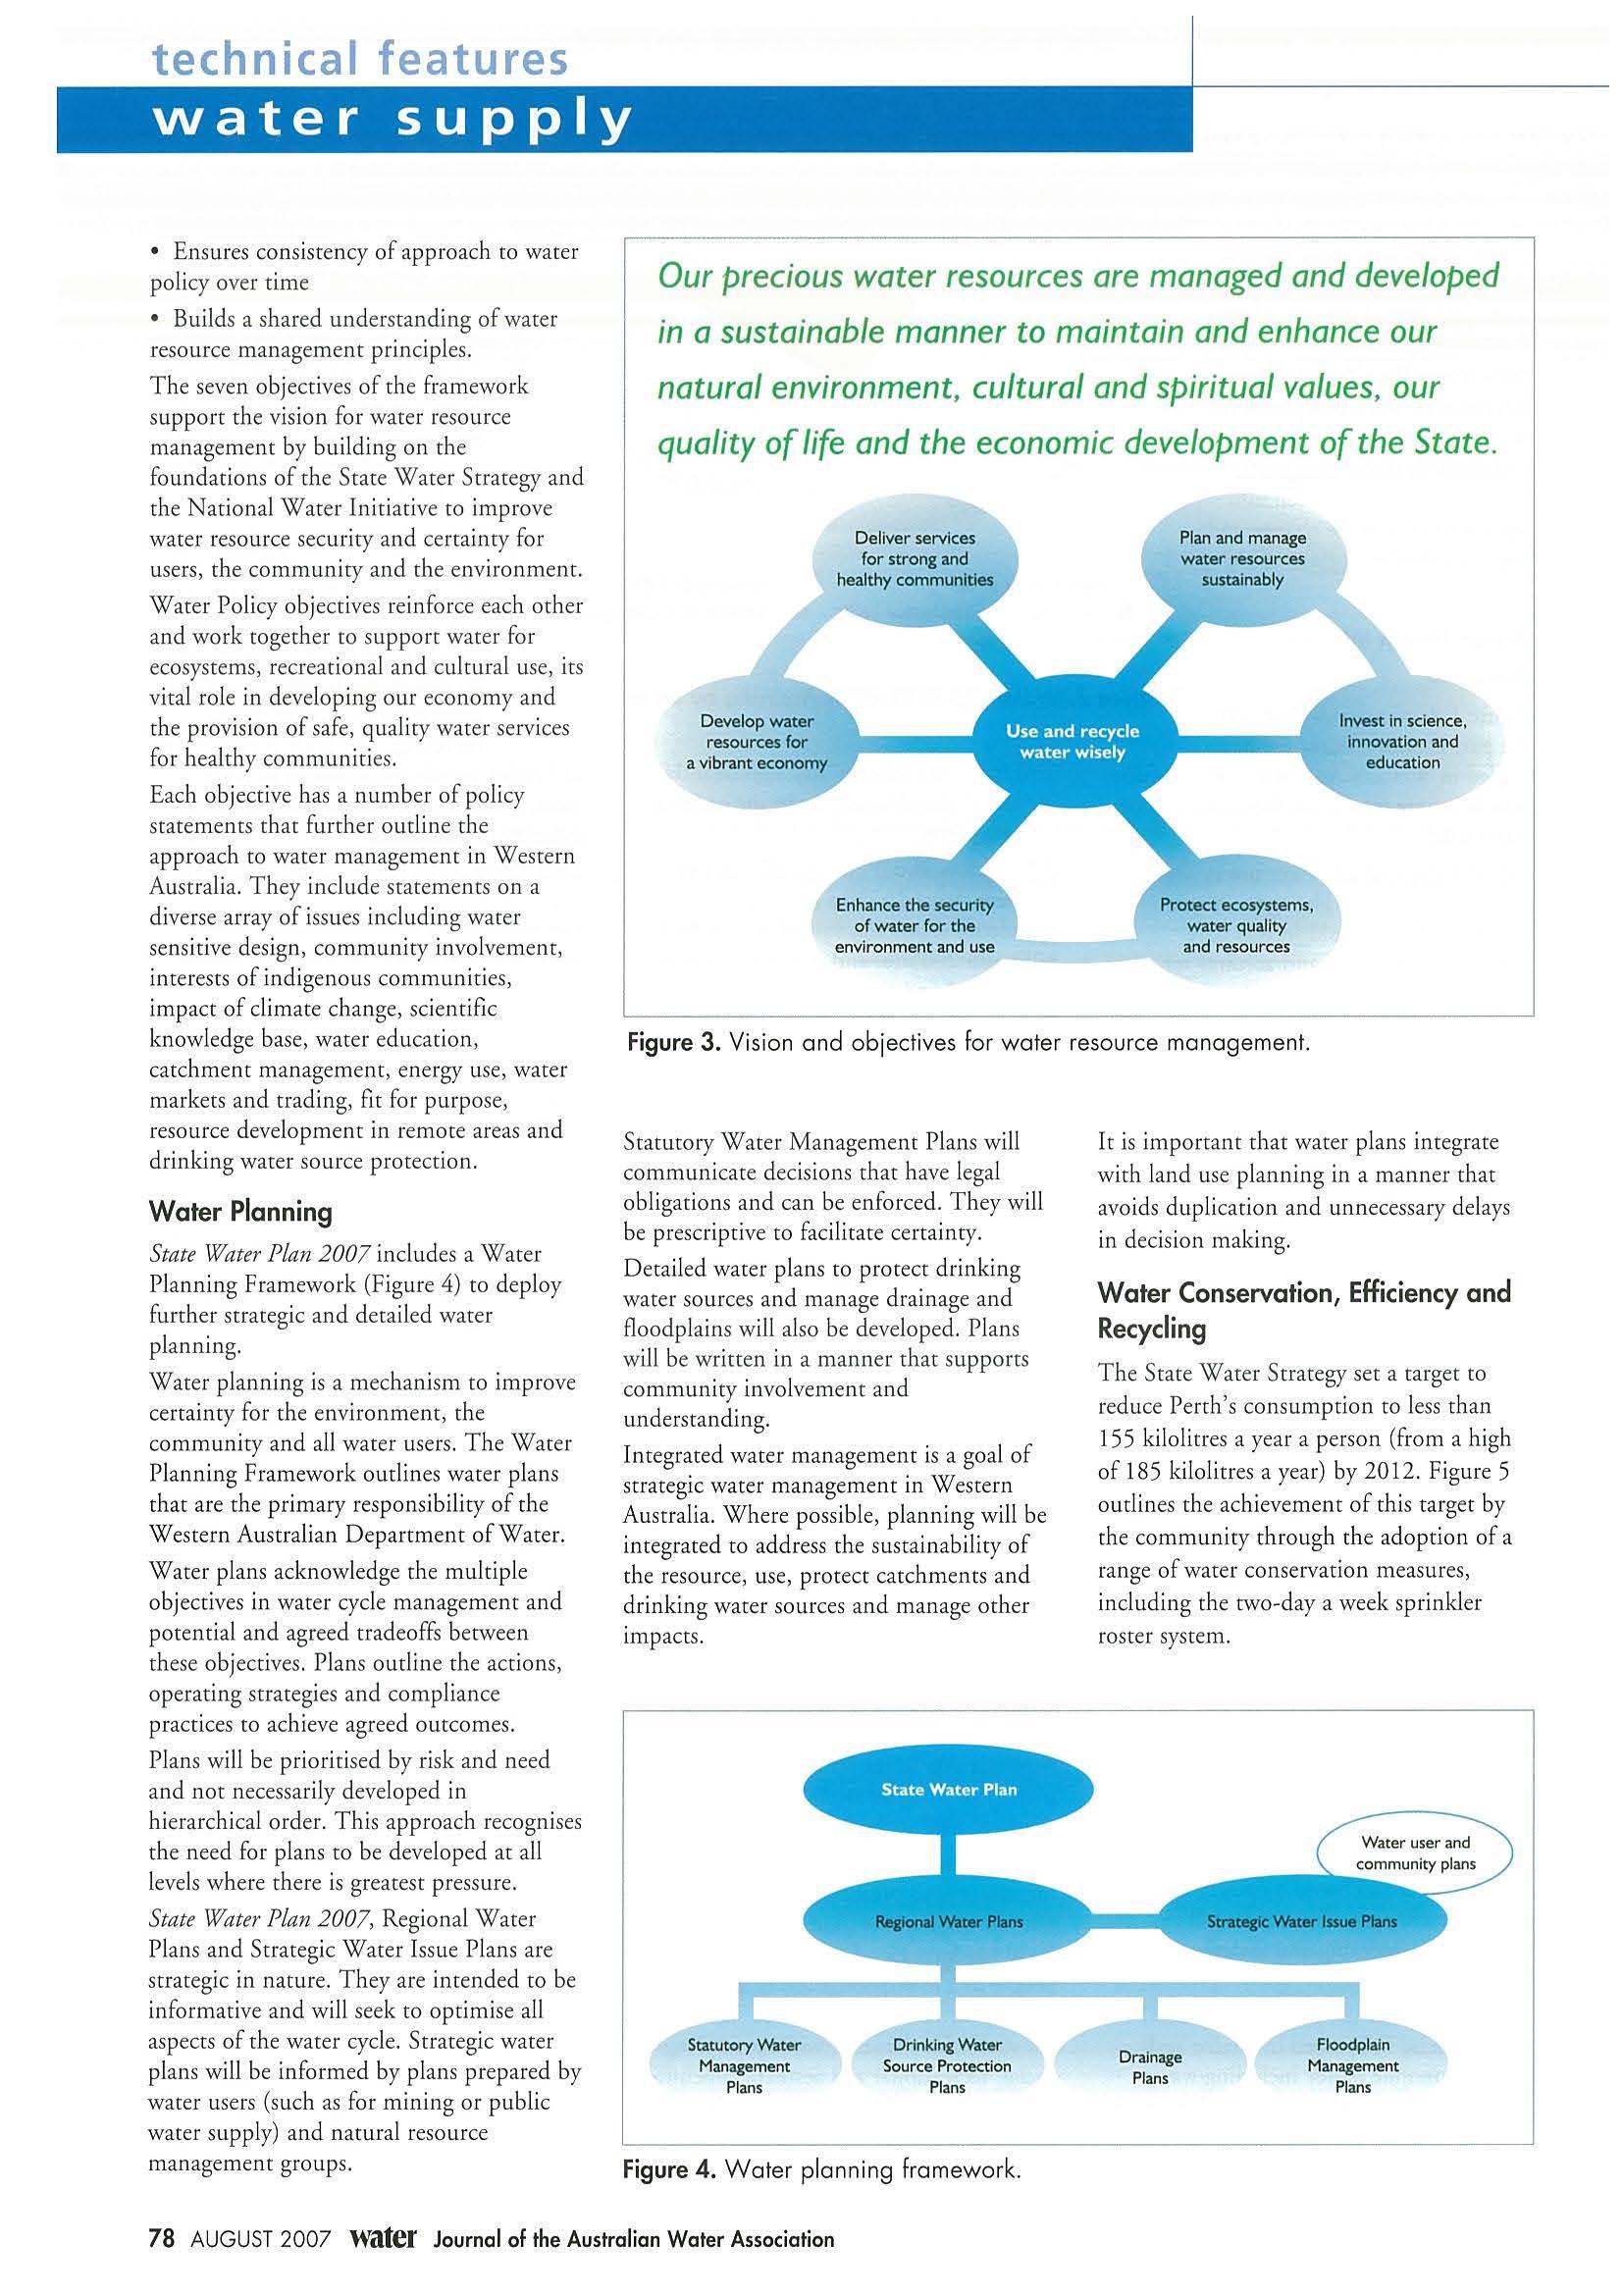
Wate r planning is a mechanism to im p rove certainty for the enviro nm ent, the commun ity a n d a ll wat er users The Water Planning F ramework ou tlin es water plans rhac are che pr imary respo nsibi li ry of the Western Australian Department of Wa t er. Water p la n s ack nowle d ge t h e m ult iple o b jectives in water cycle manag e ment and pot ential and agreed cradeoffs between these objec ti ves. Plans outline the ac ti ons, ope rati ng strategies and co mplian ce p ractices to achieve agreed outcomes. Plans w ill be prioritised by risk and need and n ot ne cessar ily dev eloped in hi erarchi cal order. Th is approa ch recognises the need for plans to be developed at all levels whe re there is greatest press ur e.
State Water Plan 2007, Regional Water Plan s and St rategic Water Iss u e Plans are strategic in n atu re. They are inte nd ed to be informative and will seek to op ti mise all as pects o f che water cycle. St rategic water pla ns wi ll be i nformed by p la ns p re p a red by water users (such as for mining or public water supply) a nd n atura l resou rce management groups.
Our precious water resources are managed and developed in a sustainable manner to maintain and enhance our natural environment , cultural and spiritual values , our quality of life and the economic development of the State .
Statutory Water Management Pl ans will communicate decis io ns cha t have lega l obl igati ons a nd ca n be enforced. They will be prescriptive to facilitate certainry.
Derailed water plans to protect drinking water so urc es and ma nage drainage and floodpla i ns wi ll a lso be developed. Plans wi ll be written in a manner chat supports community involvement a nd understand in g.
Incegraced water ma nagement is a goal of strategi c water management in Western Australia. Where poss ible , planning w ill be int eg rat ed to address the susca inabilic y of the resource, us e, prot ec t catchments and drink i ng water sources a nd manage ocher impa ct s .
Ir is im portant char wa t er plans integrate with land use planning in a mann er that avo ids dup li cation and unnecessary delays in decision making.
Water Conservation, Efficiency and Recycling
The Sca ce Wa t er Strat egy set a target to reduce Perch's co ns ump tion to less th a n 155 ki lolitres a year a person (from a high o f 185 kilolitres a year) by 2012 F igur e 5 outlines che achievement of this target by the commu nit y th rou g h che adoption of a range of water conservation measures, in cluding the two-day a week sprinkler roster system.
Deliver services for strong and healthy communities environment and use P lan and manage water resources sustainably Protect ecosystems, water quality and resources
Figure 3. Vis i on and objec tives fo r water re sou rce management.
Statutory
Pl
Drinking
Water Management
ans
Water Source Protection Plans
Figure 4. Water planning framework.
D
Plans Floodplain M anagement Plans 7 8 AUG UST 2007 Water Jou rnal of th e Australian Wat er Ass oci a tion
rainage
Now rh ar rh is ra rge r h as bee n ach ieved, G o vernm ent h as rev iew ed wate r effic iency o pportuniti es and se r new ra rge rs fo r eac h sec to r ( F igure 6) Imp orta ntl y, rhe Scare Go ve rn me nt is see ki ng ro conserve water in a ll are as o f Wes t ern Au stra lia, nor j u st in Perc h
Th e S t a re W a t e r S rra regy se r a ta rge t t o recycle 20% of a ll wasre w a rer by 2012 Pro g r ess on thi s ra rger is be in g m ad e w irh cora l w as rewa ce r recycl in g now o v e r 13%. T h is ra rge r is b e in g ret a ine d and st ren gt h e n ed. T he lo ng-te rm go a l is fo r w as ce wa rer re c ycl in g in Wes t ern Aus tr a li a ro exce ed 3 0 % A S cac e W a t e r R ecycl i n g an d C o nse rvat i o n St ra teg y w ill b e d eve lo pe d to e ngage wi t h ch e c ommuni ty ro ex p lo re o p t i o n s to ach i eve t h ese ca rge rs.
Priority Actions
2007-2011
Sta te Water Plan 200 7 o utlin es prio r i ty ac tion s fo r i mp le me nta ti o n t ha t al ig n ro t he o bjectives and c u r re nt foc us of w a te r reso u rce ma n a ge m e nt in Wes t ern A us t ralia (T ab le 3) These ac t ions wi ll be pro g ressi ve ly d e l ive red over fi ve years b y n in e le ad G o ve rnm e nt agenc ies State Water Plan 2 007 co n ta ins m o re i nfor m a t io n on t h ese p r iori t ies Go ve rnm e nt will co o rdin a t e che im p le m ent at io n of State Water Plan 20 07 and p u blicl y re po rt o n p rogress Sig n i fi c ant reso urces h ave b ee n committe d co fu nd o n go i ng i mpro ve m en t s i n water reso urce ma n age m e n t in Wes t ern Au stra lia
Wate r Conservation
Agncu lture
Mine rals and energy
Com merce and ind ustry
House hold use - Perth
House hol d use - regiona l a reas
Pu bli c o pen space
Water Re cycling
By 20I2
Long-term
Legislative Program
The W es te rn A ustrali a n D ep a rt me n t of Wa t er is spea r h eadin g a pro g ra m co m o d e rni se a nd co n so l id at e wa te r r eso u rce m a nag eme n t and wa t er se r vic e s leg isla t io n. T hi s wid e -ra ng in g refo rm p rog ram is
Pr ior ity Actio n 2007 - 20 I I
20% improvement in water use effic ie ncy
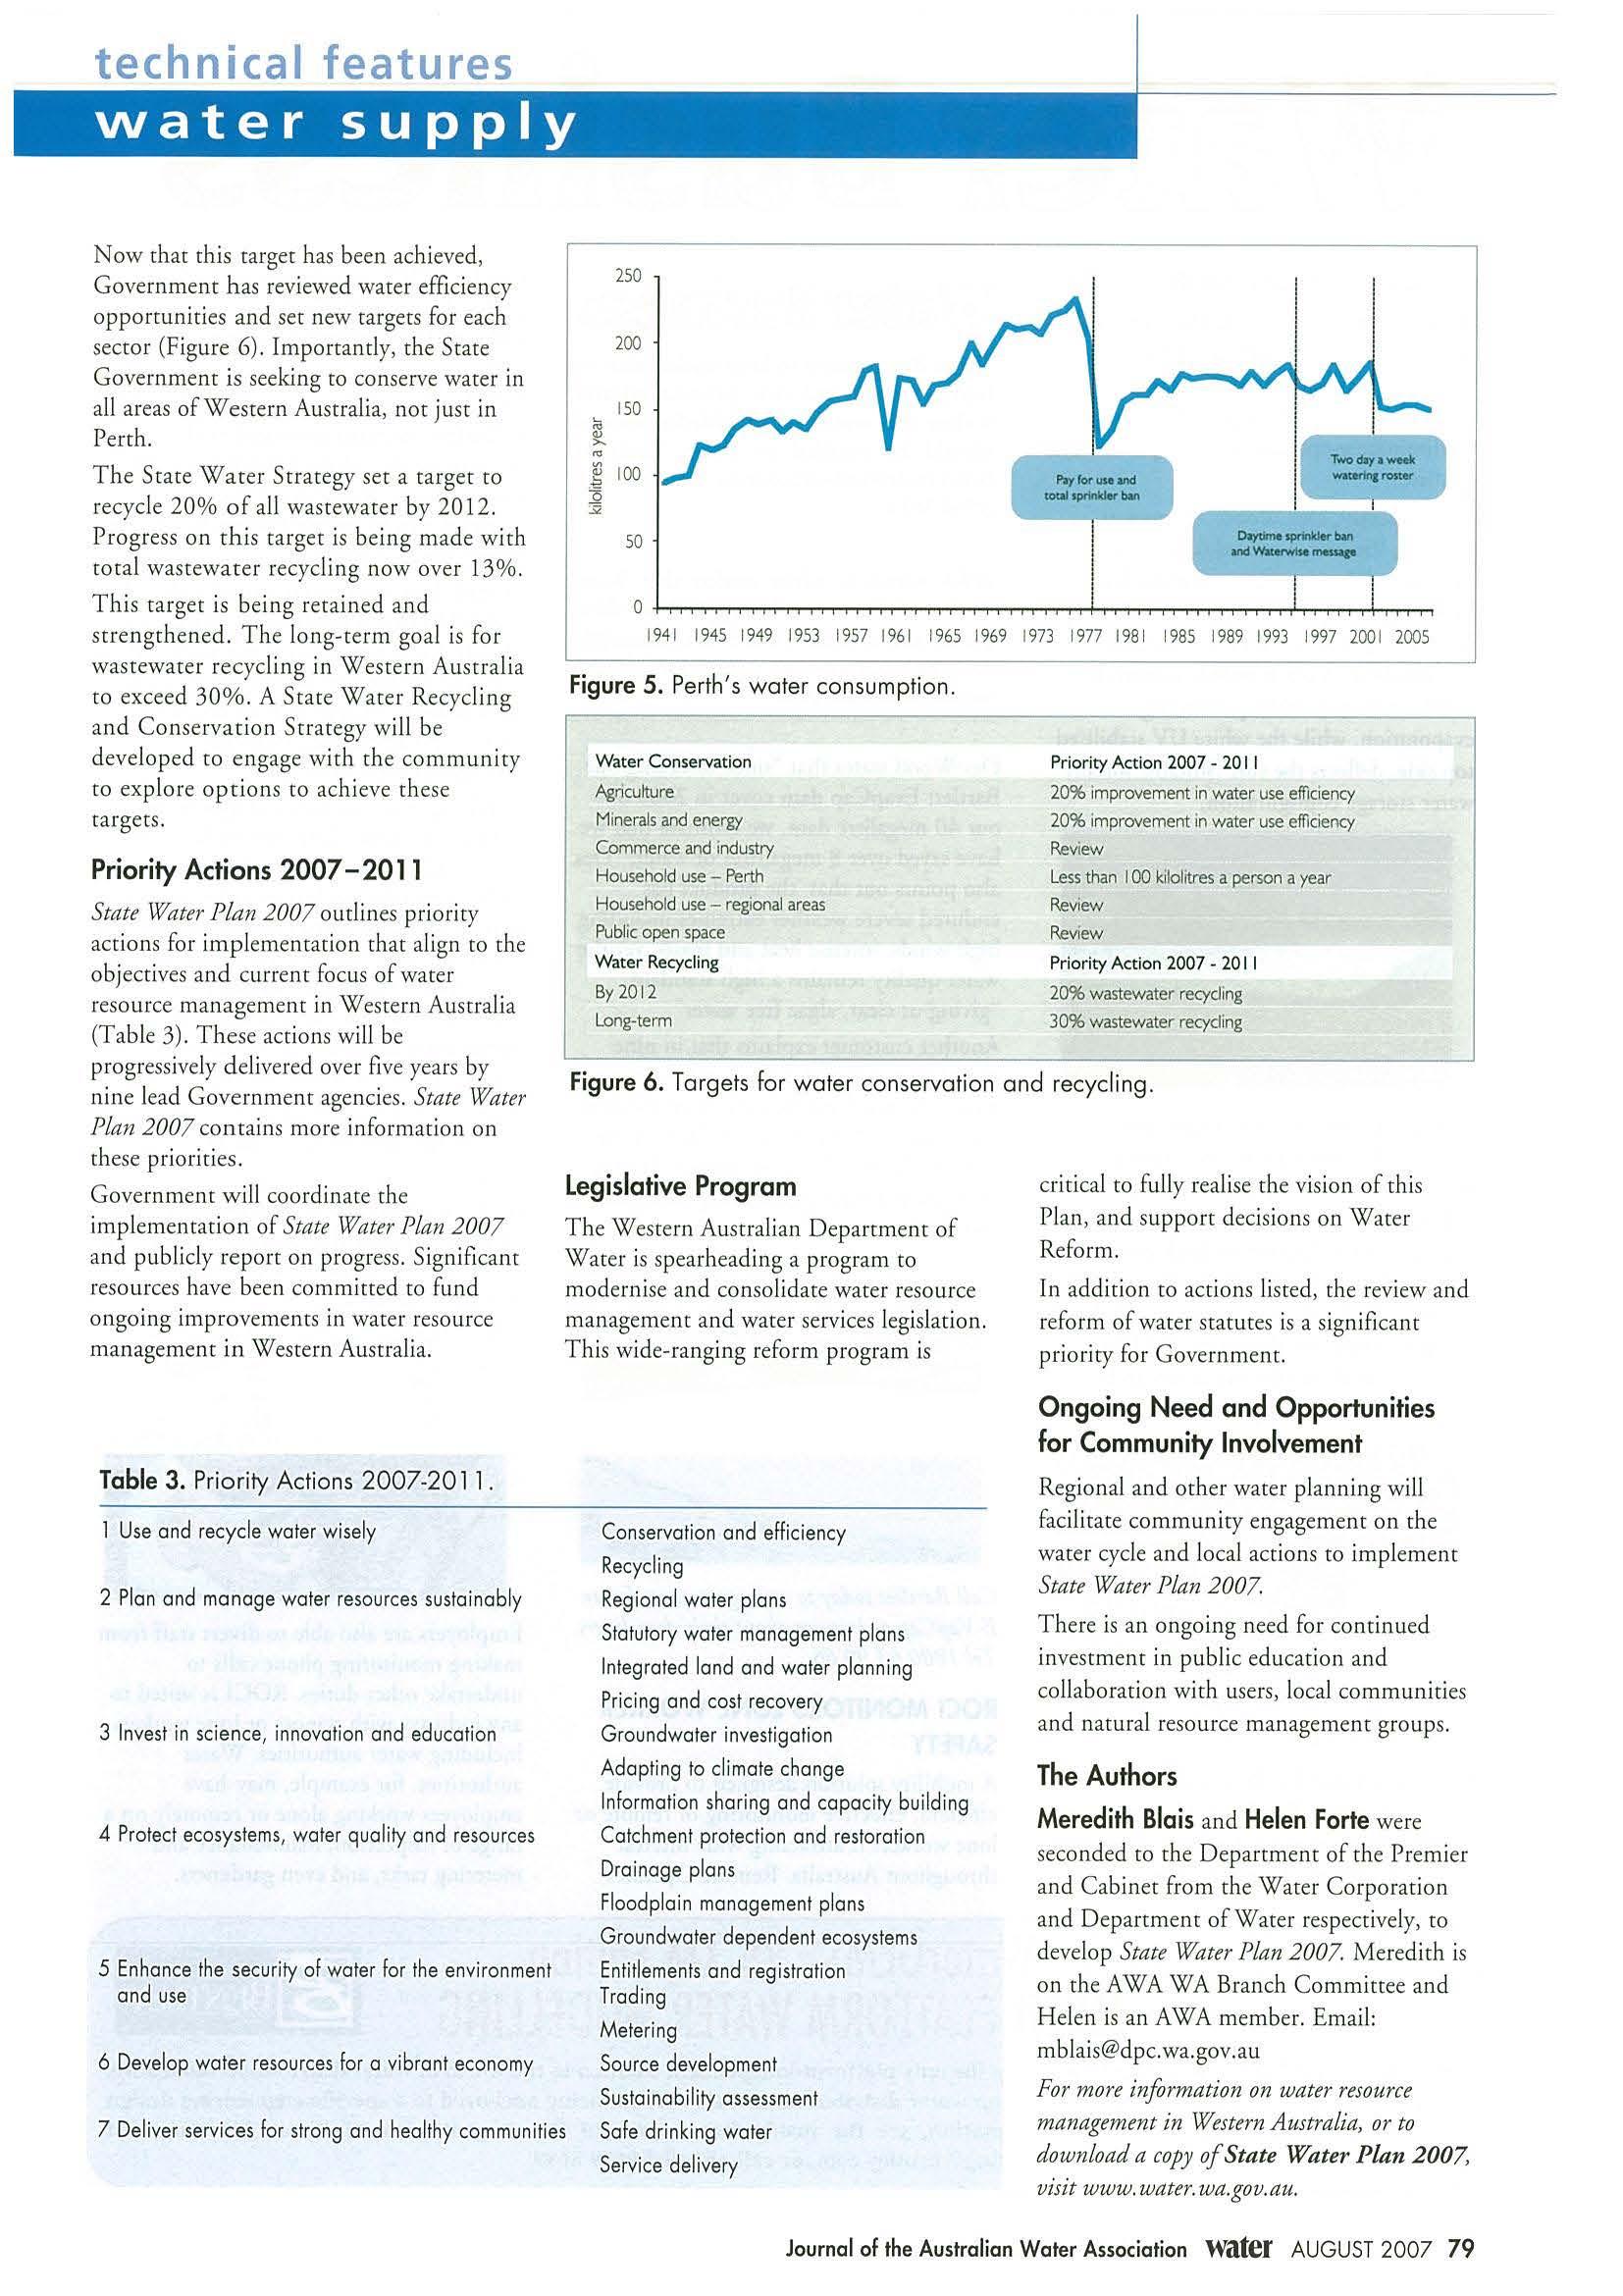
20% improvement in w ater use efficiency
Review
Less tha n I00 ki lolitres a person a year
ReVJew
Revi ew
Priority Action 2007 - 20 I I
20% wastewater recyding
30% wastewater recycling
c r it ical co fu lly rea l ise rh e v is io n of chi s P la n, an d sup port dec is ions o n W ate r
R efo r m
I n a d di t io n ro act io ns li sted , che rev iew a nd refor m of wate r sta tu tes is a signi fica nt p ri o ri ty for G o ve rnm e n t.
Ongoing Need and Opportunities for Community Involvement
Table 3 Pr iori ty Actions 2007-20 11
1 Use and recycl e wa ter wisel y
2 Pla n and manag e w a ter res o urces su sta i nab ly
Con servati on and efficiency
Recycli ng
Regi o nal water plans
Statuto ry w a ter ma nagement plans
Integrated land a nd water planni ng
Pri ci ng and cost re covery
R eg io nal and o ch e r wat e r pl a nnin g w ill fac il i ta t e co mmuni t y e n gage m ent o n th e wa t er cycle an d local ac tion s co impl e m e n t Sta te Water Plan 2001.
T h ere is a n on g oing need for con t in ued i n vest m e n t in pu b l ic edu ca ti o n an d collaborat ion w ith use rs, loca l c omm u ni ti es and n atu ral reso ur ce man age m en t grou ps
3 Invest i n sci ence , in nov ati on and educat ion
4 Pro tect ecosys tem s, w a ter qua lity and res o ur ces
Gro undwater i nvestigation
Adapt i ng to cl i mate change
Info rmat ion sh a ri ng and capac ity b uilding
Catchm ent p rotectio n a nd resto rati on
Dra inage p lan s
Floodp la i n ma nag ement p la ns
G ro undwater dependen t eco systems
The Authors
5 Enha nce the secur ity o f water fo r the envi ro nmen t and use
6 Develop wa ter reso ur ce s for a v i brant economy
Entitlements and reg i strat ion
Trading Meteri ng
Source development
Su sta i nab i lity assessment
Safe dri nking w ate r
Se rv ice delive ry
Meredith Blais a nd Helen Forte we re seconded co th e D ep a rt me nt of th e Pre mi er a nd Ca bi n et from rh e Water Cor p o ra ti on a nd De pa rt m e nt o f W ate r res pect ive ly , co d evelop State Wa t er Plan 2 00 1. Mered it h is o n rh e AWA WA B ra n ch C omm i tt ee a n d H ele n is a n AW A m e mb er. E m a i l: m b la is@dp c wa go v a u
For more informa t ion on water resource managem ent in Western A ustralia, or t o download a copy of State Water Plan 2 0 07, visit www.water.wa.gov.au
technical features
250 200 150 .. f 100 so 194 1 1945 1949 1953 1957 1961 1965 1969 1973 1977 198 1 1985 1989 1993 1997 2001 2005
Figure 5. Per t h ' s wate r co nsum ptio n
Figure 6. Ta rgets fo r wa ter co n serva t ion and recyclin g.
7 Deliver se rv ices fo r stro ng and hea l th y communities
Journa l of the Australian Wate r A ssociation Water AUGUST 2 0 07 79
PUTTING A LI D ON EVAPORATION
Ball a rac com pany, C.E. Bar clerr, has been purring a lid on eva p o ration with the EVa p Cap ™. F ro m vineyards to waln u t cro p s, fa r mers are re lyi ng o n t h e E-Va p Cap to elimi nate eva p oration and improve water qual i ty.
O n ly recencly, Des Wood, a farmer at Donald, Victo r ia, received funding to i nstall t h e l id on a storage dam o n his property. E-VapCap is a p ate n ted fl oa ti ng cover of li ght impe rvious, UV treated polyethylene. A black b u bble u nd ers ide e nables fl otat io n wh i le preven ti ng evapora t ion, w h ile t he white UV stab ilised top side, deflec t s the sun. Su ita bl e for a n y water storage config u ratio n ,
Water Business aims to keep readers alert to business news and new p roduct rel eases within the water secto r. Med ia releases should be ema il ed to Brian Rau l c at brian.rault@halledic.com au or Tel (03) 8534 5 01 4.
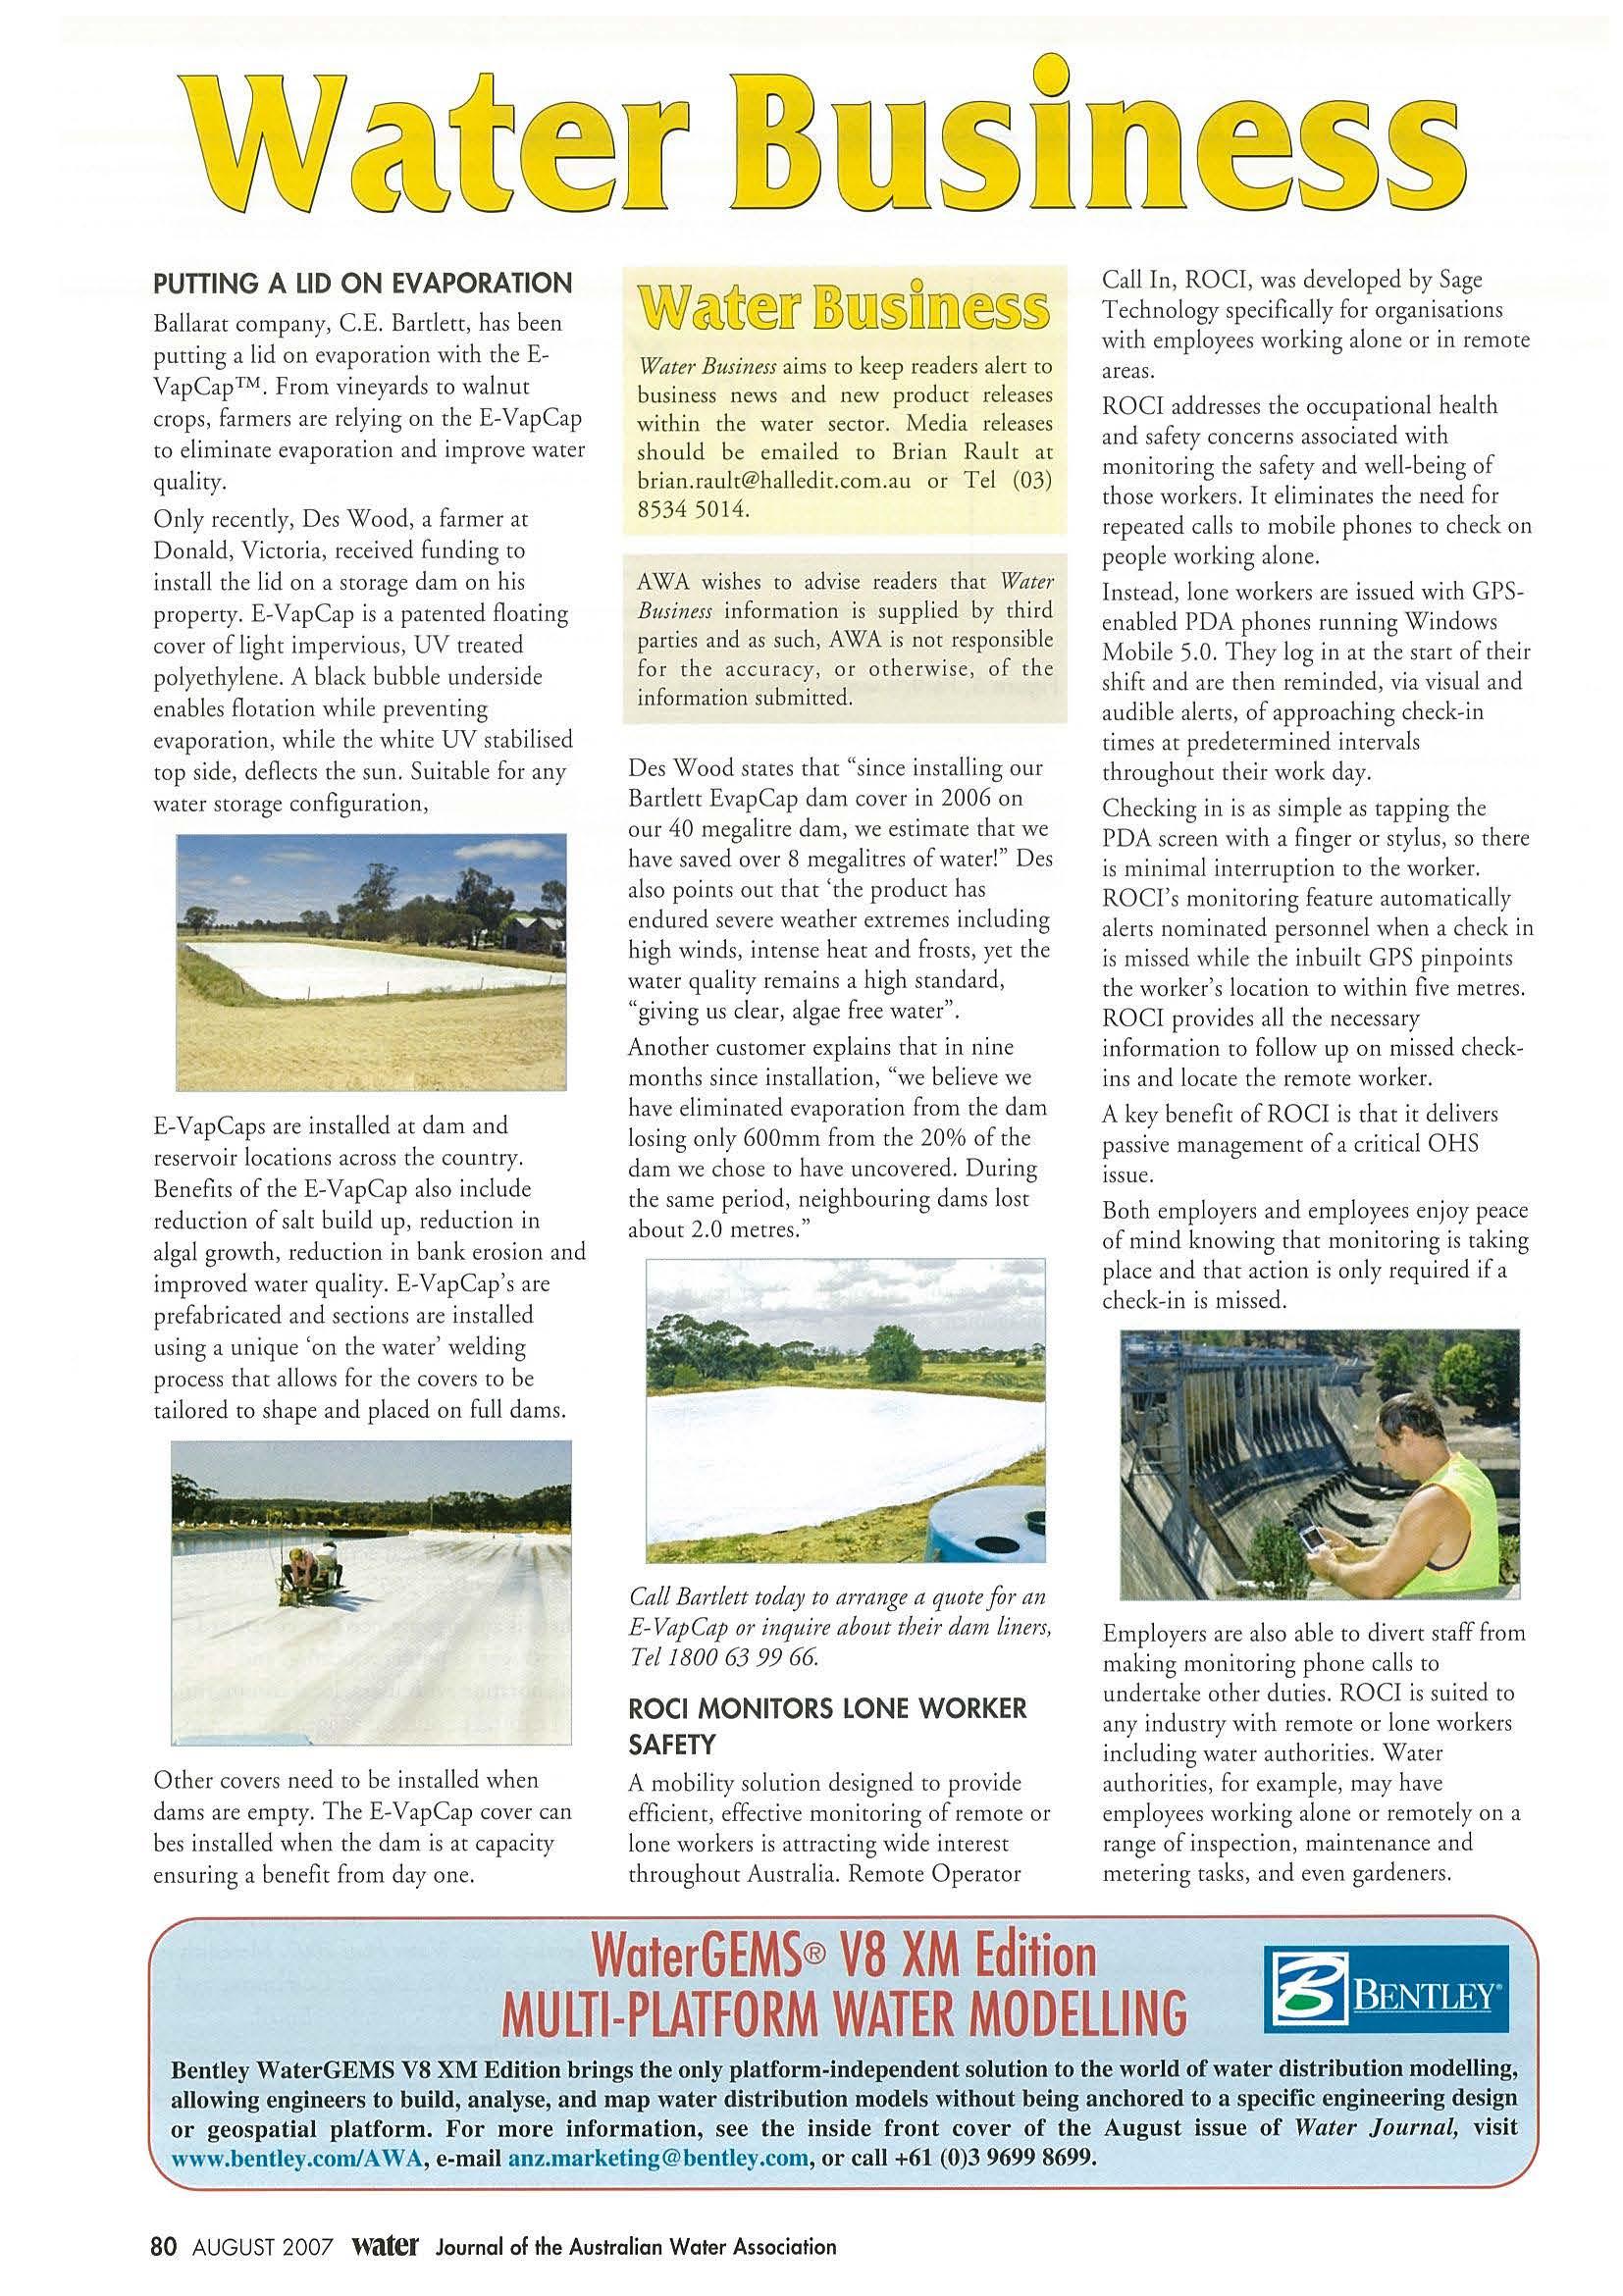
AWA wishes co advise reade rs th at Water Business info r ma ti on is su pplied by t hird parties and as such, AWA is no r respo nsib le fo r the accuracy , or ot h erw i se, of the information su bmitted
Des Wood states chat "since insta ll ing our Bartlett Eva p Cap dam cover i n 2006 on o u r 40 megalitre da m , we est im ate chat we have saved over 8 mega li tres of wate r! " Des also po ints out t h at ' the p ro duce has endured severe wea ther extremes includ i ng high winds, inc e nse heat and frosts, yet the wa t er q ual ity re m a ins a h igh stand ard, "givi ng us clea r, al gae free wate r".
Call In, ROCI, was developed by Sage Tec h nology specifically for orga nisa ri ons with employees worki n g alone or in remote areas.
ROCI addresses t h e occu p ational health and safery concerns associa t ed w it h mon i toring the safery and well - being o f cho se workers le eli m inates the need for repeated calls to mobi l e p hones to check on people working alone.
Instead , lone wo r kers are issued wirh GPSen ab led PDA phones ru n ning Windows Mobile 5. 0 They log in a t t h e scare of their sh ift and are then rem in d e d , via visual and aud ible alerts, of approaching c heck- i n t imes at p redetermined intervals throug h out thei r work day.
Checking in is as simple as ta p ping t h e PDA sc reen with a fi nger or st ylus, so t here is minima l interruption to the worker.
E -VapCa ps are installed at da m a nd reservo ir locat ions across th e country
Be n efits of th e E-VapCap a lso i nclude reduct ion of sale bu ild up, red u ct io n in a lga l growt h , reduc tion i n bank eros io n a nd im p roved water q ua li ty. E -Va p Cap's are prefabricated and sectio ns are ins t alled using a u n ique 'on the wate r ' we l ding process th a t a ll ows fo r the covers to be tailored to sh a pe a nd p laced on fu ll dams.
Anot h er customer ex pl ai ns t h at in n i ne mo n ths sin ce in stallation, "we bel ieve we have el imi n ated eva po rat i on fro m the d a m lo sin g o n ly 6 0 0mm fr om th e 20% o f th e dam we chose to h ave u ncovered D u ring che sa m e per io d , n e ig h bouring dams lo se about 2 0 metres."
ROC I' s monitori ng featu r e a u tomatically aler t s no m i nated personnel when a check i n is missed while the inbuil t GPS p in points t he worke r's locatio n to wi thi n five metres ROCI provides a ll the nec essa ry in for m a ti on to follo w u p on m issed checkins and locate the remote worker.
A key be nefit of ROCI is chat ir d elivers pass ive m anagement of a cri tica l OHS issue
B oc h employers an d em pl oyees enjoy peace of mi n d know i ng chat m onito rin g is caking pl ace a nd ch a t act ion is o nl y requ i re d i f a check-in is misse d.
Other covers need to be insta ll ed w he n dams are e m pty. The E -VapCa p cove r ca n b es insta ll ed whe n the da m is a t capac ity e n s u ring a benefit from day one.
Cali Bartlett today to arrange a quote for an E- VapCap or inquire abou t their dam liners, Tel 1800 63 99 66.
ROCI MONITORS LONE WORKER SAFETY
A mob il it y solution designed to prov ide efficient, effective mon itor ing of remote o r lone worke rs is attrac t ing w ide inte rest th rou ghout Austral ia. Remote O perator
Employe rs are also able to divert staff fr om making monitoring pho ne ca lls to u n derta ke other duties. ROC I is suited to any ind ustry with remo te o r lone workers i n cludi n g water a u tho riti es. Water au th orit ies, for example, may h ave emp loyees work ing alone o r remotely on a ra nge of in spec ti on, ma intenance and m eteri ng cas ks, a nd even ga rde n ers
WaterG EMS®VB XM Edition MULTI-PLATFORM WATER MODELLING ~ BENTLEY"
80 AUG UST 20 0 7 Water Journal of the Australian Water Association
Bentley WaterGEMS V8 XM Edition brings the only platform-independent solution to the world of wate r distribution modelling, allowing engineers to build, analyse, and map water distribution models without being anchored to a specific engineering design or geospatial platform. For more information, see the inside front cover of the August issue of Water Journal, visit www.bentley.com/A WA, e-mail anz.marketing @bentley.com, or call +61 (0)3 9699 8699.
