Lighting and integrated design lab
Whole Building Design
Submitted by: Awatans Tripathi
PBE21071 Instructors Prof. Rajan Rawal Prof. Minu Agarwal CEPT University
November 18, 2022
List of Figures
Figure 1 SARI Building Source: Google maps..............................................................................................................8
Figure 2 Vertical greening system 8
Figure 3 Exercise procedure 9
Figure 4 Exercise procedure 9
Figure 5 Thermal zoning .............................................................................................................................................11
Figure 6 Electricity consumption 12
Figure 7 Cooling loads ................................................................................................................................................12
Figure 8 Temperature & Rh 13
Figure 9 Climate summary Surat.................................................................................................................................14
Figure 10 a, b Wind parameters from Jan May 14
Figure 11 a, b Wind parameters from Jun Sep............................................................................................................15
Figure 12a, b Wind parameters from Oct Dec 15
Figure 13 Natural ventilation feasibility......................................................................................................................16
Figure 15 Solar radiation Jan May 17
Figure 14 Solar radiation Jun Sep ...............................................................................................................................17
Figure 16 Solar radiation Oct Dec 17
Figure 17 ECBC standard case East facade.................................................................................................................19
Figure 18 Daylight proposed case East facade 19
Figure 19 Window section followed for East facade...................................................................................................19
Figure 20 Load distribution chart 20
Figure 21 Surface temperature difference Walls.........................................................................................................20
Figure 22 Reduction in cooling loads via window conduction 21
Figure 23 Surface temperature difference Roof 22
Figure 24 Surface temperatures Roof 23
Figure 25 Energy Consumption Lighting controls 23
Figure 26 EPI reduction of all ECMs 24
Figure 27 Cooling load reductions 25
Figure 28 Comfort band for NV and MM ...................................................................................................................26
Figure 29 Unmet hours in NV zones 27
Figure 31 Heatmap showing window opening pattern ................................................................................................28
Figure 30 Heatmap showing comfortable hours 28
Figure 32 Heatmap showing window opening ............................................................................................................29
Figure 33 Heatmap showing AC operation 29
Figure 34 Comfortable hours in MM mode.................................................................................................................30
Figure 35 EPI analysis 30
Figure 36 Proposed Operational zoning ......................................................................................................................31
Figure 37 Chiller CoP v/s PLR 32
Figure 38 Water v/s air cooled performance...............................................................................................................33
Figure 39 Part load study 33
Figure 40 Comparison of water & air cooled VRF system .........................................................................................34
Figure 41 Performance of air cooled vs. water cooled VRF 34
Figure 42 HVAC system summary..............................................................................................................................35
Figure 43 Elements contributing to cost 37
Figure 44 Costs & savings Wall U values ..................................................................................................................39
Figure 45 Simple payback Wall U values 39
Figure 46 Costs & savings Roof strategies 40
Figure 47 Simple payback Roof strategies 40
Figure 48 Costs & savings Window strategies 41
Figure 49 Simple Payback Window U values 41
Figure 50 Costs & savings Lighting controls 42
Figure 51 Savings & investments lightings controls...................................................................................................42
Figure 52 Summary of performance optimization 43
Figure 53 Option 3,4....................................................................................................................................................49
Page 4 of 53
Awatans Tripathi PBE21071 | MTech. Building Energy Performance | FT | CEPT University
List of Tables
Table 1 Weather data files 10
Table 2 Model inputs 11
Table 3 Daylight metrics .............................................................................................................................................19
Table 4 System configuration & EPI 31
Table 5 Solar PV potential 36
Table 6 Lumpsum costing for ECBC standard case 38
Table 7 Cost breakdown of ECMs...............................................................................................................................43
Table 8 Model inputs for simulation 45
Table 9 EPI comparison ..............................................................................................................................................46
List of Annexure figures
Annex. Figure 1 TMY data comparison 48 Annex. Figure 2 Climate summary Surat..................................................................................................................48 Annex. Figure 3 East facade iterations 49 Annex. Figure 4 West facade iterations......................................................................................................................49 Annex. Figure 5 Heatmap showing window opening pattern 50 Annex. Figure 6 Heatmap showing comfortable hours ..............................................................................................50 Annex. Figure 7 Heatmap showing window opening pattern 51 Annex. Figure 8 Heatmap showing AC operation......................................................................................................51 Annex. Figure 9 % reduction in cooling EPI Wall U values 52 Annex. Figure 10 % reduction in cooling EPI Roof U values...................................................................................52 Annex. Figure 11 % reduction in cooling EPI Window U values 53 Annex. Figure 12 % reduction in lighting EPI lighting controls 53
Awatans Tripathi PBE21071 | MTech. Building Energy Performance | FT | CEPT University
List of units
Metric Unit Expression
Electricity kWh Kilo watt hour
Loads kW or W Kilo watt/Watt
Energy Performance Index kWh/m2/yr Kilo watt hour per meter square per year
Temperature ⁰C Degrees Celsius
Relative humidity % Percentage
Solar radiation W/m2 Watt per meter square Co efficient of performance W/W (unit less)
Visible light transmittance % Percentage
Solar heat gain coefficient % Percentage/Fraction
Spatial daylight autonomy % Percentage
Useful daylight illuminance % Percentage
Annual sunlight exposure % Percentage
Daylight glare potential % Percentage
U value W/m2K Watt per meter square Kelvin Solar reflective index % Percentage/Fraction
Part load ratio % Percentage/Fraction
List of abbreviations
EPI: Energy performance index
CoP: Coefficient of performance
PLR: Part load ratio
SRI: Solar reflective index
VLT: Visible light transmittance
SHGC: Solar heat gain coefficient
sDA: Spatial daylight autonomy
UDI: Useful daylight illuminance
ASE: Annual sunlight exposure
DGP: Daylight glare potential
PLR: Part load ratio
DBT: Dry bulb temperature
Rh: Relative humidity
NV: Natural ventilation
MM: Mixed mode PV: Photovoltaic
VGS: Vertical greening system
TMY: Typical meteorological year
Awatans Tripathi PBE21071 | MTech. Building Energy Performance | FT | CEPT University
1 Executive summary
This report has been prepared for the SARI building in Ahmedabad, Gujarat. This report is part of a process toward understanding the various aspects of building physics and optimizing its performance. The specific objective of this report is to evaluate annual energy consumption and apply various energy conservation measures for ECBC compliance and maximum energy efficiency. The building was analyzed using hourly energy simulations to evaluate the occupants' performance in terms of energy consumption, visual comfort, and thermal comfort. The purpose of this report is to present the performance of the design building in comparison to a baseline case building as per ECBC. An overall budget of 7.5% of the initial capital cost of building construction was provided for the energy conservation measures, owing to a payback period of not more than three years. The following nomenclature has been used throughout the report for referring to various stages of design:
• ECBC standard case: Built as usual with inputs from the site visit.
• Daylight proposed case: Daylight optimized model with changes in façade.
• Final proposed case: All energy conservation measures applied with all optimizations done. The façade design had been optimized for daylight penetration and minimum glare, which helped reduce the usage of lighting in the building. It is observed from the analysis that the maximum impact on the EPI of the building is due to the application of lighting controls in all the spaces. The provision of adaptive setpoints rather than following the standard 24⁰C approach throughout the year helped significantly reduce the EPI further. The HVAC has been optimized by adding a water cooled condenser as a cooling tower to enhance performance. High SRI paint helps reflect the incident radiation during the day. Finally, solar panels (22.6kW) have been provided over 28% of the available roof area (808.76 m2) Thus, combining all four abovementioned measures helped achieve an overall reduction of 39.12% from the daylight proposed case, all within the provided budget with a simple payback period of not more than two years and seven months. The table below summarises the outcomes of the findings and proposal:
Awatans Tripathi PBE21071 | MTech. Building Energy Performance | FT | CEPT University
2 Introduction
This exercise for the simulation module has been conducted for a commercial building in Ahmedabad, Gujarat, to assess the performance in terms of electricity consumption. Although, for differentiation, each student has been assigned a different city, resulting in a different weather file for all simulations. The city assigned in this report is Surat, Gujarat.
2.1 SARI Building, Ahmedabad
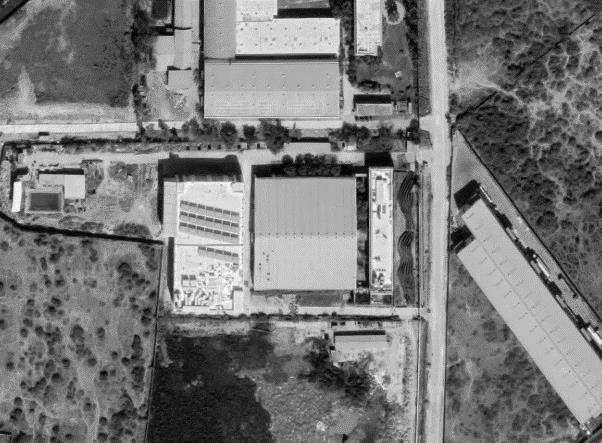
The office complex was conceived, designed, and built as an energy efficient and environment friendly facility which would naturally meet LEED and other certification requirements. The program brief for the office building includes spaces for housing the IT facility, the office of the Resident Director, the Operation Head's room, a library space, store rooms, conference and meeting rooms, and the reception and waiting areas, in addition to open office spaces. Figure 1 shows the building orientation with the longer axis along the east west. The building is LEED gold certified and therefore exhibits a unique feature in the form of a vertical greening system (VGS) (which was considered while preparing the energy model for the same). Figure 2 shows the organically growing creepers on structural support in front of the façade, helping minimize the solar and heat gains.
2.2 Methodology of exercise
Figure 3 describes the overarching methodology that has been adopted throughout the time assigned for the exercise. The first part of the exercise dealt with daylight optimization strategies, including changes in the VGS and distribution of windows on east and west facades. This helped in optimizing the following:
• Daylight penetration inside the spaces.

• Creation of views with minimization of glare inside the spaces.
Awatans Tripathi PBE21071 | MTech. Building Energy Performance | FT | CEPT University
The second part of the exercise dealt with optimizing the thermal performance of the building, which is the main focus of this report. This included envelope optimization, HVAC optimization, and the addition of active measures to reduce heat gains and reduce electricity consumption.
Prepare 3 D geometry of the ECBC standard case
Prepare daylight model: ECBC standard case
Optimize design for daylight Arrive at Final design
Prepare energy model of the ECBC standard case. (According to selected climate)


Prepare energy model for Daylight proposed case
Simulating and debugging the model. Calculating EPI
Apply ECMs
LCCA of ECMs
Optimize thermal performance by applying ECMs. Analyse the cost effectiveness
Final design: Optimal for Thermal and daylight performance
Thus, after conducting several feasibility checks, sensitivity analyses, and optimizations of all the ECMs proposed, a final iteration with the combination of 2 ECMs with the addition of a solar PV array was proposed. This resulted in achieving a significant reduction in EPI. The detailed approach has been described in the following sections of the report.
Awatans Tripathi PBE21071 | MTech. Building Energy Performance | FT | CEPT University
3 Energy modeling
This section describes the procedure for creating the energy model for simulations.
3.1 Selection of weather file
Table 1 shows the available weather files for Surat. A comparative analysis of all the weather files was conducted for temperature and humidity values. Item number 1 is the weather file acquired by ISHRAE in 2014. Item numbers 2 & 3 depict the weather data compilation by selecting the years between 2004 2018 and 2007 2021, respectively. Therefore Item 3 will be preferred over item 2. All four available files are generated from the same weather station, denoted by the serial number 428400'.
Table
1
Sr. No. File name
1
2
3
Weather data files
Year of generation/time of compilation
IND_GJ_Surat.428400_ISHRAE2014 2014
IND_GJ_Surat.428400_TMYx.2004 2018. 2014 2018
IND_GJ_Surat.428400_TMYx.2007 2021 2017 2021
4 IND_GJ_Surat.428400_TMYx
• Data were compared for all four weather files by plotting the relation (ANNEX. A) between temperature and relative humidity. It was concluded that item number 3 would be selected for simulations. A typical meteorological year (TMY) is a set of meteorological data with data values for every hour in a year for a given geographical location. The data are selected from hourly data in a more extended period (typically ten years or more).
3.2 Thermal zoning
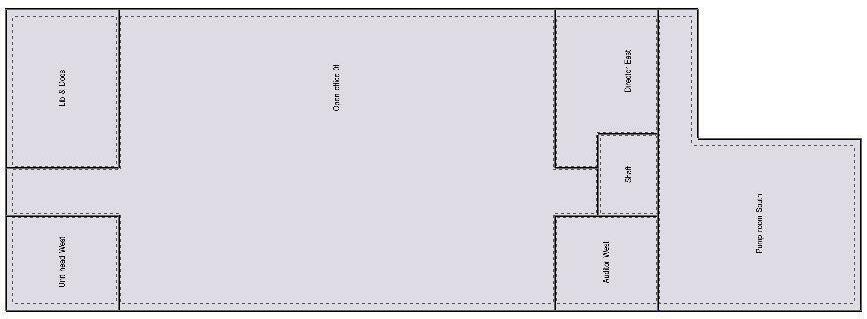
Ground floor: The zones have been created pertaining to the space typologies. The toilets have been kept separate. The conference room is thought to be in a different space typology based on occupancy. The reception is kept separate to keep provisions for a MM operation in this space. All individual cabins and rooms have been divided into separate zones to provide individual control of these spaces.
First floor: The first floor layout is reasonably simple regarding floor space division. Two central open offices,toilets,anda conferenceroom havebeenassigned aseparatethermal zone each. The assignedzones are majorly based on the following:
Awatans Tripathi PBE21071 | MTech. Building Energy Performance | FT | CEPT University
N
• Façade conditions: if the façade is exposed to outside/characteristics of exposure.
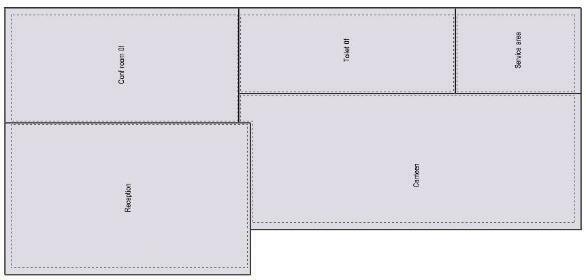

• The function of the space
• System controls
Conf room 1f
Conf room 0f
Toilets 1f Toilets 0f
Reception Canteen
Service area
Corridor
Open office South
Open office 0f
Open office North Lib& docs Unit head west Auditor West
Director East Pump room
First floor Ground floor
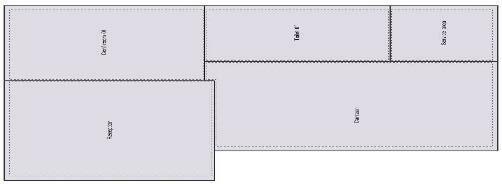
Figure 5 Thermal zoning
3.3 Model Inputs ECBC standard case
Table 2 shows the inputs provided to the energy model to simulate the ECBC standard case Table 2 Model inputs
Category Model inputs


Location
Walls
Surat, Hot and Dry
U value: 0.4 W/m2K
Windows U value: 3 W/m2K; SHGC: 0.27 Non north; SHGC: 0.5 North
Roof U value: 0.33 W/m2K
HVAC system
VRF system, air cooled, no DOAS. 24oC setpoint for the whole year
Lighting power density 9.5 W/m2
Equipment power density 11.7 W/m2
Operation & occupancy schedule 9 AM 6 PM
3.3.1 Results ECBC standard case
The simulation results report an EPI value of 113.8 kWh/m2/yr. Figure 6 shows the electrical load distribution of different components of the building. All three components contributed almost equally
11 of 53
Awatans Tripathi PBE21071 | MTech. Building Energy Performance | FT | CEPT University
towards the EPI from November to February. The cooling consumption increases during the summer as expected.
Component electricity consumption (monthly)
0 2000 4000 6000 8000 10000 12000 14000 16000 18000
Electricity consumption (kWh) Months
Jan Feb Mar Apr May Jun Jul Aug Sep Oct Nov Dec
Figure 6 Electricity consumption
Following the analysis above, the climate analysis has been carried out in thefollowing sections, describing the impact of each physical attribute that affects the comfort and energy consumption of the building.
Peak cooling load (kW)
Interior Lighting Cooling Interior Equipment 6.43 4.30 1.14 2.60 0.96
Zone wise cooling loads
16.89 1.18 0.93 1.41 0.87 5.75
17.65 3.40 1.88
23.95 0 5 10 15 20 25
Figure 7 Cooling loads
Figure 7 shows the zone wise cooling load distribution. The open office areas on both floors have the maximum cooling loads out of all the zones. The HVAC system tonnage comes out to be 39.7 TR.
Page 12 of 53
Awatans Tripathi PBE21071 | MTech. Building Energy Performance | FT | CEPT University
4 Climate analysis
4.1 Surat, Gujarat
The city is located in western India, in the state of Gujarat, at 21 degrees north latitude, and on the banks oftheTaptiRiver.Althoughthecityliesin ahotanddryclimatezone,thehumiditylevelsare higher (above 70%) throughout the year.
4.2 Temperature and humidity
45
40
Dry Bulb Temperature (⁰C)
35
30
25
20
15
10
5
High diurnal variation (~15⁰C).
Moderate diurnal variation (~7⁰C). During the summer months. This time of the year will have higher latent loads since Rh is high during this time of the year.
0 10 20 30 40 50 60 70 80 90 100 0
Hours of the year (8760 hrs)
Figure 8 Temperature & Rh
Relatice Humidity (%)
• The city of Surat lies in the Hot and dry climate zone as per ECBC. The city is close to the coastal region and experiences high relative humidity.
• There is a high (~15⁰C) diurnal variation during the winter months and high humidity levels Though the temperature does not drop below 14⁰C throughout the year, it is still recommended that the warmth of the space be maintained in the winter by isolating the space from the environment at night.
• For the summer months, the adaptive setpoint ranges from 26.61⁰C to 25.7⁰C. The DBT ranges from 26 ⁰C to 32 ⁰C. However, the Rh is high outside. Therefore it is recommended to keep the windows closed at night since the latent loads will increase.
• High ambient temperature leads to high conductive gains. Therefore, U values of the roof, windows, and walls will play a significant role in heat gains and losses through the Envelope. Adding insulation to the construction assemblies will help reduce cooling consumption.
Awatans Tripathi PBE21071 | MTech. Building Energy Performance | FT | CEPT University
Figure 9 shows the overall summary of the climate of Surat. A significant number of hours require dehumidification (0 hrs) since humidity is beyond 70% levels. There are comfortable periods throughout the year, which convey that windows can be opened and natural ventilation can be used as a comfort providing measure. This is possible for the weeks lying in January till mid of February and, similarly, November to December As expected, the months between April and July require only sensible cooling most of the time. There are significantly fewer (0 hrs) that require cooling and humidification. Refer to ANNEXURE A, Annex. Figure 2 for a detailed breakdown of hours of each category.
4.3 Wind patterns

Wind speed Humidity
9a 9b
Figure 10 a, b Wind parameters from Jan May
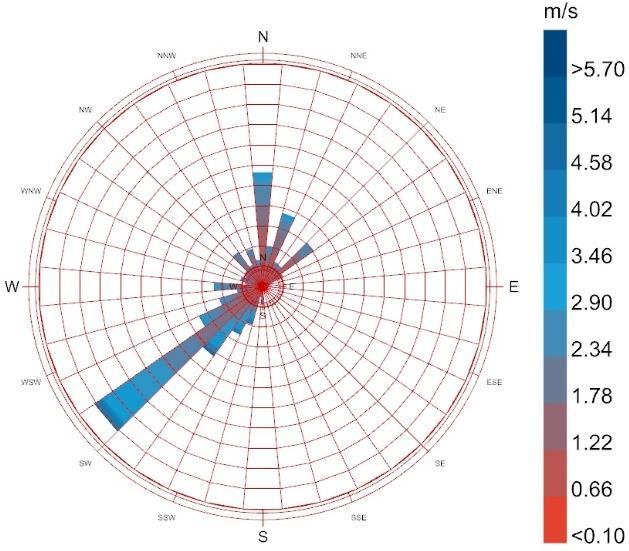
• The winds are low in speed and humid as winter passes and spring starts. The workshop building on the west will be a significant blockage for these winds.
Awatans Tripathi PBE21071 | MTech. Building Energy Performance | FT | CEPT University
• There is a potential to harness the wind for NV for western spaces since the wind speeds are sufficient. On the other hand, the winds will bring moisture which will increase the latent loads of the space.
Wind speed Humidity
10a 10b
Figure 11 a, b Wind parameters from Jun Sep


• Figure 10a, b shows the wind pattern, similar to what it was for Jan May. The monsoon winds are highly humid and will increase the latent loads significantly for a MM space.
Wind speed Humidity 11a 11b
Figure 12a, b Wind parameters from Oct Dec
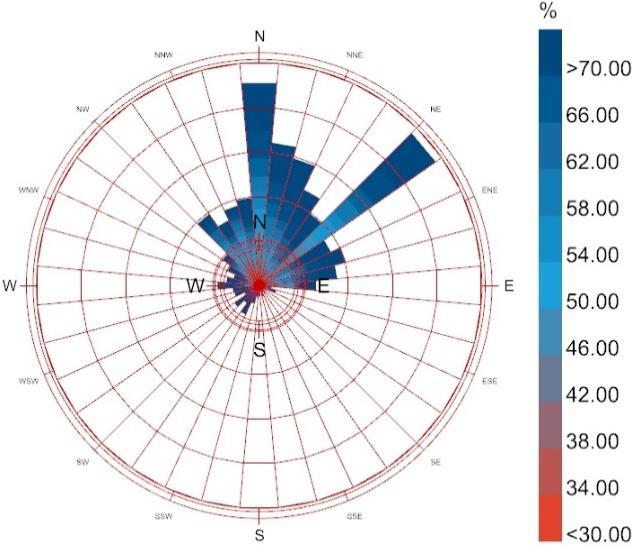
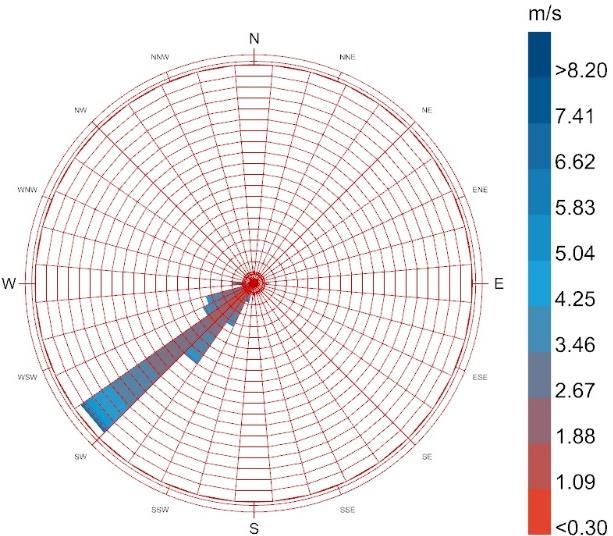
• Figure 11a, b shows the wind pattern for Oct Dec. The wind reverses its direction from October There is a chance to incorporate NV in these months since the humidity for a significant frequency of winds is in the comfort band.
Awatans Tripathi PBE21071 | MTech. Building Energy Performance | FT | CEPT University
• The VGS will act as a wind barrier for the eastern spaces. However, the North open office, conference room on the 1st floor & reception on the ground floor can be exposed to these, in these months.
4.4 Natural Ventilation
• Figure 13 shows the potential for natural ventilation based on the adaptive comfort band of the outside DBT and relative humidity (30%-70%). A total of 1784 hours lie in the comfort limits.
• During the winters, according to the climatic conditions, for the better part of weeks 1 4 and 47 52, there is potential to open the windows, resulting in ambient conditions to take care of the zone comfort levels.
• Apartfromtheweeksmentionedabove,eitherthetemperatureorthehumidityisout ofrangewhich will increase the cooling loads inside the zones. Therefore, there is potential to operate the building under temporal MM operation.
123456789101112131415161718192021222324252627282930313233343536373839404142434445464748495051525354555657585960616263646566676869707172737475767778798081828384858687888990919293949596979899100101102103104105106107108109110111112113114115116117118119120121122123124125126127128129130131132133134135136137138139140141142143144145146147148149150151152153154155156157158159160161162163164165166167168169170171172173174175176177178179180181182183184185186187188189190191192193194195196197198199200201202203204205206207208209210211212213214215216217218219220221222223224225226227228229230231232233234235236237238239240241242243244245246247248249250251252253254255256257258259260261262263264265266267268269270271272273274275276277278279280281282283284285286287288289290291292293294295296297298299300301302303304305306307308309310311312313314315316317318319320321322323324325326327328329330331332333334335336337338339340341342343344345346347348349350351352353354355356357358359360361362363364365

Figure 13 Natural ventilation feasibility
Awatans Tripathi PBE21071 | MTech. Building Energy Performance | FT | CEPT University
4.5 Solar radiation
• During the months of Jan May, the radiation from the South and East is relatively higher. The easternVGSishelpingcutoffthedirectradiationinthewallsandwindows.Totalincidentradiation of 935.68 kWh/m2 can be harnessed on the roof.
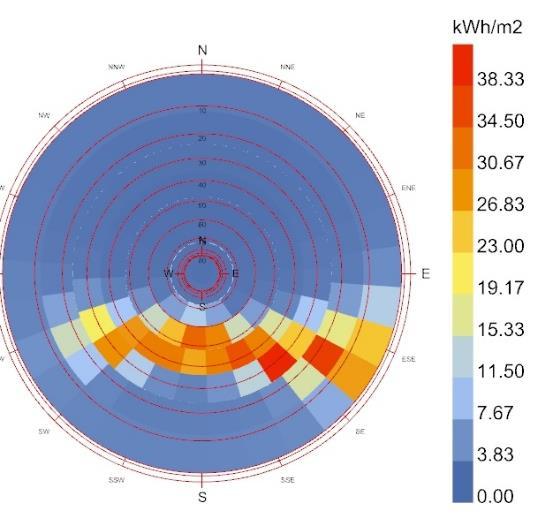


• The months of June to Sept experience monsoons; hence, a dense sky cover for most of the months is expected. The solar PV generation potential during these months is relatively lower. Total incident radiation of 532.83 kWh/m2 can be harnessed on the roof.
• The months through Oct Dec experience a lower sun angle and, therefore, lower solar radiation than June Sept Total incident radiation of 435.37 kWh/m2 can be harnessed on the roof.
• Surat being in a hot and dry climate zone and close to the equator makes it susceptible to higher direct solar radiation on the Envelope. Therefore, the East VGS proves beneficial in cutting off solar radiation on the entire east façade.
Awatans Tripathi PBE21071 | MTech. Building Energy Performance | FT | CEPT University
5 Envelope optimization
From the climate analysis, various strategies have been devised that could be applied to the building to increase the performance in terms of reducing the EPI. This section discusses the ECMs derived based on present conditions (outdoor conditions and indoor conditions) and their impacts on the EPI of the building.
All the ECMs after section 5.2.1 are applied to the daylight proposed case.
5.1 Methodology
• The energyconservation measures are dividedinto Envelopeoptimization and HVAC optimization strategies
• Each ECM is tested individually on the energy model to check the impact on the EPI reduction.
• Finally, a combination of 2 ECMs is selected. This energy model with the ECMs applied is further used for selecting and optimizing HVAC systems.
5.2 Energy conservation measures
An energy conservation measure is a strategy (passive or active) that helps reduce the energy consumption of the building. The forthcoming sections describe the effects of ECMs when applied one at a time.
5.2.1 Daylight optimization
This section deals with observing and optimizing the daylight metrics for the SARI building under study. To increase daylight optimization, the two main long facades, East and West, were studied and modified to increase daylight penetration into the spaces. Figure16 shows the ECBC standard case East façade with absolute blockage due to the VGS. Therefore, after a few iterations, The VGS was modified, as shown in Figure 17. This helpedthe sunlight penetrate the open office, conference room,andoffice cabin. Forfurther details related to intermediate iterations, refer to ANNEXURE A
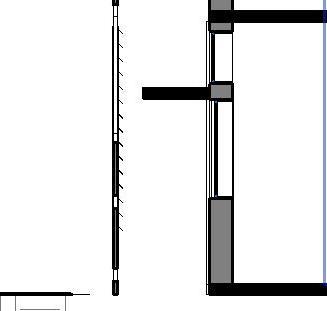
Figure 19 shows the typical section followed for the east façade. A light shelf was added to bounce the light towards the ceiling, which has been proposed to be painted white with a reflectance value of 75%. This resulted in a deeper distribution of ambient light into the spaces. The puncture on the VGS was placed at optimum height to cater to views and daylight.
Table 3 shows the daylight metrics achieved along with the strategies mentioned Option 4 was selected as the most optimal case, upon which further simulations have been carried out.
Awatans Tripathi PBE21071 | MTech. Building Energy Performance | FT | CEPT University
Figure 17 ECBC standard case East facade

Figure 18 Daylight proposed case East facade
Daylight Window
Light shelf (75% reflectance)


Louvers View Window
Figure 19 Window section followed for East facade

Table 3 Daylight metrics
Case sDA uDI ASE
Base 44.27% 31.04% 5.26% Option 1(façade puncture at top + west window) 69.38% 28.92% 18.07%
Option 2 (façade puncture at bottom + west window) 71.59% 46.14% 6.87%
Option 3 (East façade puncture at eye level with light shelves on East and West facades) 83.24% 62.25% 1.26%
Option 4 (Option 3 + high reflectance on wall and ceiling) 95.59% 68.47% 1.26%
Awatans Tripathi PBE21071 | MTech. Building Energy Performance | FT | CEPT University
5.2.2 Cooling load distribution
Figure 20 Load distribution chart
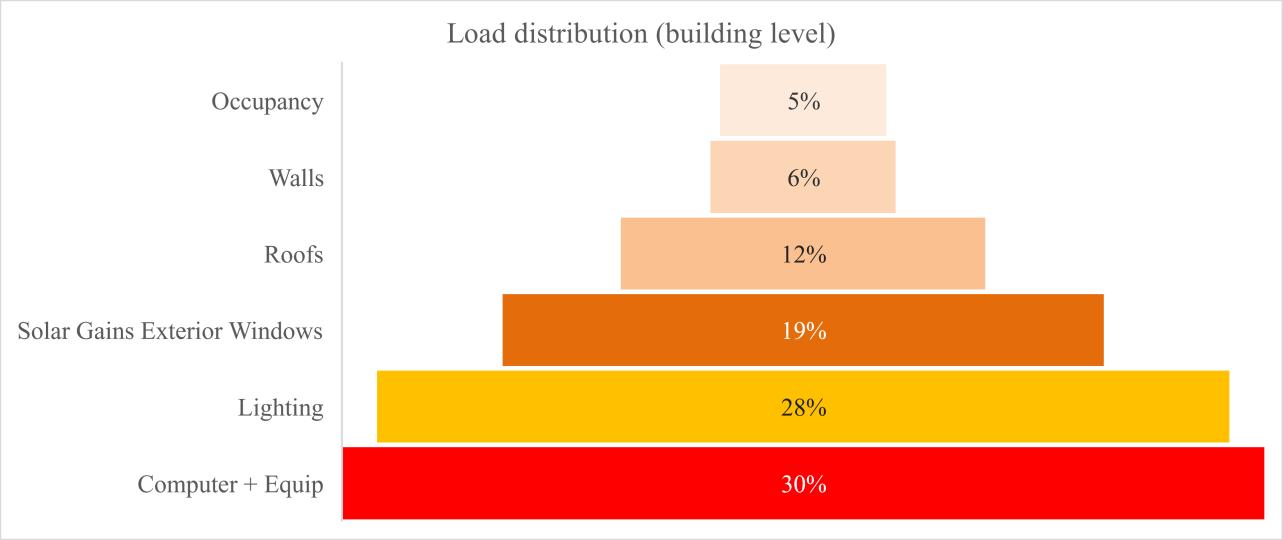
Figure 20 shows the loads incurred due to various components. Lighting and computer& equipment contribute most to the cooling loads of the space. The windows contribute 19% to the loads. The Envelope and roof contribute 37% to the total cooling loads. Therefore, scope exists for optimizing the Envelope, roof, and lighting. The loads due to computers and equipment cannot be modified since the information input into the energy model is based on on site visits and will remain constant.
5.2.3 Wall U value
It is expected to reduce the conductive heat gains via walls through this strategy. This, in turn, will result in a decrease in cooling loads which will finally result in reduced EPI. Figure 21 shows the difference in externalandinternal surfacetemperatureswithoutside DBT,showingthat thelowertheU value,thehigher the difference in surface temperatures.
Impact on surface temperatures (summer design week)(Conf. room 0f east wall)
Delta T(⁰C)
Outside DBT (⁰C)
Figure 21 Surface temperature difference Walls
0.1 W/m2K 0.2 W/m2K 0.3 W/m2K 0.4 W/m2K
Awatans Tripathi PBE21071 | MTech. Building Energy Performance | FT | CEPT University
The EPI reduction is as observed from the simulation model:
• EPIDaylight proposed case (wall U value 0.4)= 123.58 kWh/m2/yr
• EPIWall U value 0.3 = 122.35 kWh/m2/yr
• EPI Wall U value 0.2 = 120.08 kWh/m2/yr
• EPI Wall U value 0.1 = 113.81 kWh/m2/yr
There is a maximum reduction of 7.7% in the EPI if we change the U value from 0.4 to 0.1. The feasibility of this ECMis further checked under section 9 based on the investment cost and payback period it provides. Refer to ANNEXURE C for the cooling EPI reduction analysis
5.2.4 Window U value
It is expected to reduce the conductive heat gains via windows through this strategy. This, in turn, will result in a decrease in cooling loads which will finally result in reduced EPI. Figure 22 shows the impact of the change in the U value of windows on the cooling loads for all window assemblies tested.
Total cooling load (kW)
1280
1270
Impact of solar gains on cooling loads (summer design week) (Open office north 1f) 1.3% 1.2%
1260
1250
1240
1282.58 1265.07 1249.02 1230
1290 U-value 3 U-value 2.5 U-value 1.7
Figure
22 Reduction in cooling loads via window conduction
The EPI reduction is as observed from the simulation model:
• EPIDaylight proposed case (window U value 3)= 123.58 kWh/m2/yr
• EPI window U value 2.5= 123.41 kWh/m2/yr
• EPI window U value 1.7= 123.1 kWh/m2/yr
There is a maximum reduction of less than 1% in the EPI if we change the U value from 3 to 1.7. The feasibility of this ECM is further checked under section 9 based on the investment cost and payback period it provides. Refer to ANNEXURE C for the cooling EPI reduction analysis
Page 21 of 53
Awatans Tripathi PBE21071 | MTech. Building Energy Performance | FT | CEPT University
5.2.5 Roof properties
5.2.5.1
Roof U values
It is expected to reduce the conductive heat gains via the roof through this strategy. This, in turn, will result in a decrease in cooling loads which will finally result in reduced EPI. Figure 23 shows the impact of the change of the U value of windows on the cooling loads for all window assemblies tested.
Impact on surface temperatures (summer design week)(Open office 1f roof)
Delta T (⁰C)
60
50
40
30
20
10
Higher Delta T with lower U value
0.3 W/m2K 0.2 W/m2K 0.1 W/m2K
0
70 20 25 30 35 40 45
-10
-20
Outdoor DBT (⁰C)
Figure 23 Surface temperature difference Roof
The EPI reduction is as observed from the simulation model:
• EPIDaylight proposed case (roof U value 0.3)= 123.58 kWh/m2/yr
• EPI roof U value 0.2= 122.46 kWh/m2/yr
• EPI roof U value 0.1= 121.84 kWh/m2/yr There is a maximum reduction of 1.4% in the EPI if we change the U value from 0.3 to 0.1. The feasibility of this ECMis further checked under section 9 based on the investment cost and payback period it provides. Refer to ANNEXURE C for the cooling EPI reduction analysis
5.2.5.2 Roof surface SRI
The horizontal surface of the roof is responsible for high conductive heat gains. Therefore, to minimize gains through solar incident radiation, a high SRI paint is proposed to help bounce off the sunlight and gains, ultimately maintaining a lower surface temperature than the usual finish.
Awatans Tripathi PBE21071 | MTech. Building Energy Performance | FT | CEPT University
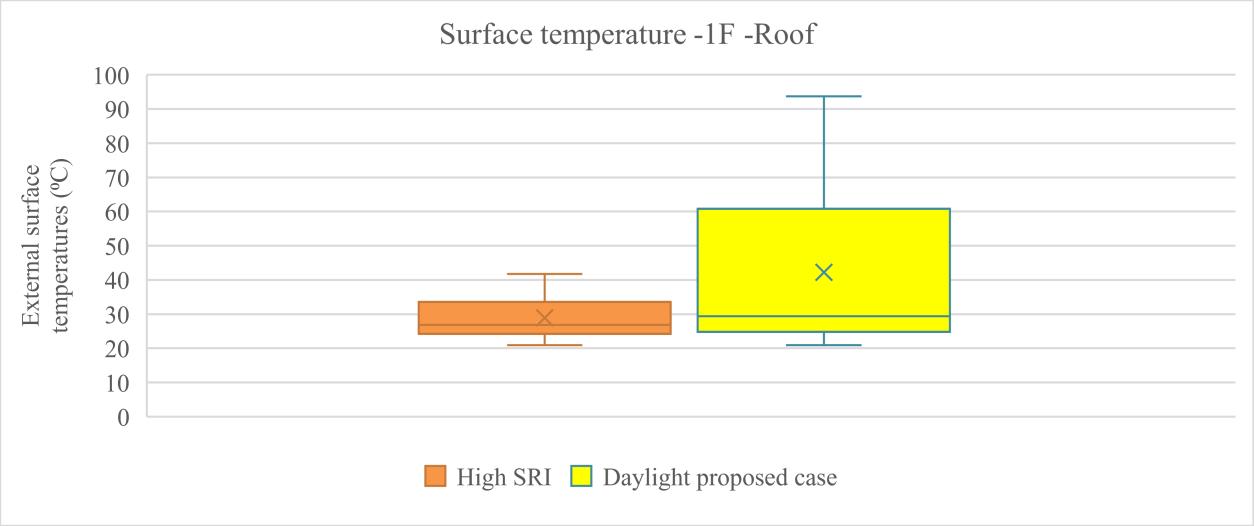
Figure 24 Surface temperatures Roof
Figure 24 shows thevaluesof external surface temperatures of the roof with and without the high SRI paint. There is a decrease of 30% in average surface temperatures. This helps in reducing the conductive gains through the roof.
The EPI reduction is as observed from the simulation model:
• EPIDaylight proposed = 123.58 kWh/m2/yr
• EPI roof High SRI= 121.04 kWh/m2/yr
There is a reduction of 2.05% in the EPI if we apply a high SRI paint. The feasibility of this ECM is further checked under section 9 based on the investment cost and payback period it provides.
5.2.6 Lighting controls
Impact of lighting controls (building level)
20
0
Lighitng consumption (kWh) Days
High variation in 100% area than other cases due to the dimming effect of lights during daylit hours
100% area 75% area 50% area 25% area
Figure 25 Energy Consumption Lighting controls
Figure 25 shows the annual electricity consumption pattern due to the application of lighting controls. The lighting controls work on dimming the electric lights provided based on a target lux level setpoint. For this
Awatans Tripathi PBE21071 | MTech. Building Energy Performance | FT | CEPT University
simulation, a target of 300 lux was provided to the model. 4 possible iterations were simulated in which 25%, 50%, 75%, and 100% of the floor area were included under the lighting sensor controls. The results obtained in terms of EPI are as shown:
• EPIDaylight proposed (0% light control) = 123.58 kWh/m2/yr
• EPI 25% light control = 117.19 kWh/m2/yr
• EPI 50% light control = 110.79 kWh/m2/yr
• EPI 75% light control = 104.38 kWh/m2/yr
• EPI 100% light control = 97.98 kWh/m2/yr There is a maximum reduction of 20% in the EPI if we employ 100% lighting controls in the building. The feasibility of this ECM is further checked under section 9 based on the investment cost and payback period it provides. Refer to ANNEXURE C for the lighting EPI reduction analysis
5.3 Conclusion
140
120
EPI (kWh/m2/yr)
100
80
60
40
20
EPI sensitivity analysis
123.58 123.41 123.10 122.46 122.35 121.84 121.04 120.08 117.19 113.81 110.79 104.38 97.98 94.93 0
IDL proposed case WINDOW ECMU value 2.5 WINDOW ECMU value 1.7 ROOF ECMU value 0.2 WALL ECMU value 0.3 ROOF ECMU value 0.1 ROOF ECMhigh SRI 0.9 WALL ECMU value 0.2
ECMs
LIGHTING CONTROLS25% area WALL ECMU value 0.1 LIGHTING CONTROLS50% area LIGHTING CONTROLS75% area LIGHTING CONTROLS100% area LIGHTING CONTROLS100% area+ High SRI
Figure 26 EPI reduction of all ECMs
Figure 26 shows the effect of each ECM tested on the building EPI. From the simulations and life cycle cost analysis of all the ECMs, two measures stood out in terms of optimal EPI reduction within the budget. The roof high SRI ECM and 100% lighting control ECM were selected as a combination which collectively reduced the EPI by 23.1%. This decision was also made considering the payback period and budget constraints. Section 9 describes the detailed simple payback period and cost analysis for all the ECMs. All further simulations are carried out on this model.
Page 24 of 53
Awatans Tripathi PBE21071 | MTech. Building Energy Performance | FT | CEPT University
6 Outcomes and finalizations
Thissectiondealswithadiscussionrelatedtoloadingcalculations,modesofoperation,andthermalcomfort analysis. Representative zones have been checked for cooling loads and analyzed for MM or NV operation pertainingto adaptive setpoints providedto the model. Based on the results,a final zoningstrategy has been provided based on the mode of operation of the building.
6.1 Load distribution
Figure 27 shows the reduction in all zones' cooling loads when the 2 ECMs selected above are applied to the model. The open office areas on each floor and the reception area show an average reduction of 25% from the daylight proposed case. (Datalabelsonthegraphare%reductioninpeakcoolingloads)
Zone wise cooling loads
Peak cooling load (kW)
25
20
15
10
5
21% 19% 7% 8% 7%
21% 11% 17% 9% 12%
18%
30% 20% 27%
28% 0
RECEPTION CANTEEN TOILET0F CONFROOM 0F SERVICEAREA OPENOFFICE0F DIRECTOREAST AUDITORWEST LIB&DOCS UNITHEADWEST PUMPROOMSOUTH OPENOFFICENORTH 1F CONFROOM1F TOILET1F OPENOFFICESOUTH 1F
Daylight proposed model with ECMs
Figure 27
Cooling load
reductions
For the analysis of zones that can be operated on MM, NV, or full AC mode, calculations for two representative zones have been incorporated in the report. The zones under consideration are: 1. Open office 0f 2. Open office north 1f In the forthcoming sections, an analysis of only one zone is depicted. Refer to ANNEXURE B for data related to other zones.
Awatans Tripathi PBE21071 | MTech. Building Energy Performance | FT | CEPT University
6.2 Operational strategies
Based on the outdoor and indoor conditions mapping, each zone has been analyzed for the potential of natural ventilation and mixed mode operation. The following figures in the sub sections show the co relation of window opening based on the provided logic and comfortable hours based on temperature and humidity.
6.2.1 IMAC setpoints and window operation logic
IMAC suggests a range of operative temperatures considered comfortable based on two different acceptability ranges of 80% and 90%. For this exercise, the 90% acceptability range has been selected for deriving the comfort band of operative temperatures. Figure 28 shows the comfort band and comfortable setpoints for the city of Surat for NV and MM operations.
Comfort band
Operative temperature (⁰C)
0.00 5.00 10.00 15.00 20.00 25.00 30.00 35.00 1 220 439 658 877 1096 1315 1534 1753 1972 2191 2410 2629 2848 3067 3286 3505 3724 3943 4162 4381 4600 4819 5038 5257 5476 5695 5914 6133 6352 6571 6790 7009 7228 7447 7666 7885 8104 8323 8542
Hours
Figure 28 Comfort band for NV and MM
The setpoints denoted by the dotted line in Figure 28 were provided as the setpoints for the windows to open. Therefore, based on these setpoints, the windows will open if outside DBT reaches the setpoint, zone temperature is higher than the setpoint, and zone temperature is higher than outside DBT.
6.3 Comfort hours analysis NV operation
This section contains a correlation of window opening based on the input logic and the number of comfortable hours achieved inside the zones.
Awatans Tripathi PBE21071 | MTech. Building Energy Performance | FT | CEPT University
Comfort hours (9AM 6PM) Met hours Un-met hours
Figure 29 Unmet hours in NV zones
Figure 29 shows the unmet hours (onlyfor3650hoursofoperation) for each zone based on two filters: the IMAC band and the Rh band (30%-70%). The significant spaces, such as the open offices on both floors and canteens, cannot operate on NV mode since the un met hours are high; thus, these spaces will require active measures (HVAC) to achieve comfort. Spaces such as the toilets and pump room can be operated on NV mode since these spaces are not regularly occupied and do not require active cooling or dehumidification. The toilets on the exterior walls can be assigned exhaust fans to circulate stale air.
Awatans Tripathi PBE21071 | MTech. Building Energy Performance | FT | CEPT University
6.3.1 Natural Ventilation
The building has windows open up to 50% of the effective area. The HVAC is switched off with temperature control assigned to windows and adaptive setpoints derived, as discussed in section 6.2.1
9101112131415161718192021222324252627282930313233343536373839404142434445464748495051525354555657585960616263646566676869707172737475767778798081828384858687888990919293949596979899100101102103104105106107108109110111112113114115116117118119120121122123124125126127128129130131132133134135136137138139140141142143144145146147148149150151152153154155156157158159160161162163164165166167168169170171172173174175176177178179180181182183184185186187188189190191192193194195196197198199200201202203204205206207208209210211212213214215216217218219220221222223224225226227228229230231232233234235236237238239240241242243244245246247248249250251252253254255256257258259260261262263264265266267268269270271272273274275276277278279280281282283284285286287288289290291292293294295296297298299300301302303304305306307308309310311312313314315316317318319320321322323324325326327328329330331332333334335336337338339340341342343344345346347348349350351352353354355356357358359360361362363364365 00hrs 24hrs
9101112131415161718192021222324252627282930313233343536373839404142434445464748495051525354555657585960616263646566676869707172737475767778798081828384858687888990919293949596979899100101102103104105106107108109110111112113114115116117118119120121122123124125126127128129130131132133134135136137138139140141142143144145146147148149150151152153154155156157158159160161162163164165166167168169170171172173174175176177178179180181182183184185186187188189190191192193194195196197198199200201202203204205206207208209210211212213214215216217218219220221222223224225226227228229230231232233234235236237238239240241242243244245246247248249250251252253254255256257258259260261262263264265266267268269270271272273274275276277278279280281282283284285286287288289290291292293294295296297298299300301302303304305306307308309310311312313314315316317318319320321322323324325326327328329330331332333334335336337338339340341342343344345346347348349350351352353354355356357358359360361362363364365 09hrs 18hrs 00hrs 24hrs
30 Heatmap 09hrs 18hrs
• Figure 31 shows the comfortable hours inside the 0f open office. The comfort hours are based on temperature and humidity limits.
• There are no comfort hours even on opening windows because of high humidity levels (beyond 70%). The windows open based on provided logic of set point, which does not consider Rh.
• Some hours during winter months are comfortable based on window opening during winter since Rh is within limits.
• The open office, a primary zone in terms of area and function, cannot be run on NV mode and will require active cooling measures.
• There are hardly any days when the windows can be opened at a stretch of more than 3 4 hours. This concludes that active measures will be required to cool the zones. Refer to ANNEXURE B.
6.3.2 Mixed Mode
In this, the building is run in mixed mode operation with two primary logics:
1. Open windows according to the setpoints provided
Awatans Tripathi PBE21071 | MTech. Building Energy Performance | FT | CEPT University
This simulation observes the effect of adaptive setpoints along with the mixed mode operation, and the reduction in EPI is mapped. As mentioned towards the end of section 6.1, the analysis has been provided for the two selected zones.Refer to ANNEXURE B for an analysis of other zones. Figures 32 and 33 below show the correlation between the opening of windows and AC operation for 0f open office.
101112131415161718192021222324252627282930313233343536373839404142434445464748495051525354555657585960616263646566676869707172737475767778798081828384858687888990919293949596979899100101102103104105106107108109110111112113114115116117118119120121122123124125126127128129130131132133134135136137138139140141142143144145146147148149150151152153154155156157158159160161162163164165166167168169170171172173174175176177178179180181182183184185186187188189190191192193194195196197198199200201202203204205206207208209210211212213214215216217218219220221222223224225226227228229230231232233234235236237238239240241242243244245246247248249250251252253254255256257258259260261262263264265266267268269270271272273274275276277278279280281282283284285286287288289290291292293294295296297298299300301302303304305306307308309310311312313314315316317318319320321322323324325326327328329330331332333334335336337338339340341342343344345346347348349350351352353354355356357358359360361362363364365 00hrs 24hrs
09hrs 18hrs 00hrs 24hrs
09hrs 18hrs
Figure 32 Heatmap showing window opening
Figure 33 Heatmap showing AC operation
101112131415161718192021222324252627282930313233343536373839404142434445464748495051525354555657585960616263646566676869707172737475767778798081828384858687888990919293949596979899100101102103104105106107108109110111112113114115116117118119120121122123124125126127128129130131132133134135136137138139140141142143144145146147148149150151152153154155156157158159160161162163164165166167168169170171172173174175176177178179180181182183184185186187188189190191192193194195196197198199200201202203204205206207208209210211212213214215216217218219220221222223224225226227228229230231232233234235236237238239240241242243244245246247248249250251252253254255256257258259260261262263264265266267268269270271272273274275276277278279280281282283284285286287288289290291292293294295296297298299300301302303304305306307308309310311312313314315316317318319320321322323324325326327328329330331332333334335336337338339340341342343344345346347348349350351352353354355356357358359360361362363364365 july august september october november december january february march april may june Window closed Window open AC off AC on
• The windows open and AC turns off based on provided logic of the set point, which does not take Rh into account. This is majorly happening during the morning hours in winter.
• The windows are closed for a significant part of the year, and AC turns on since the internal gains through the Envelope are high.
Page 29 of 53
Awatans Tripathi PBE21071 | MTech. Building Energy Performance | FT | CEPT University
6.3.2.1 Comfort hours and EPI analysis
Figure 34 shows the MM comfort band and the hours lying beyond the band. The peaks highlighted are the Sundays when the AC is scheduled off for the whole day. Sundays also occur during other parts of the year but are primarily comfortable due to suitable outdoor conditions. 8529 hours lie inside the comfort band for 0f open office. On average, this is the trend being followed for each zone.
35.00
30.00
25.00
20.00
15.00
10.00
Operative Temperature (⁰C) Hours
Comfort hours (0f open office) upper limit lower limit Zone Operative Temperature 59.37 44.51 44.19
Figure 34 Comfortable hours in MM mode
EPI comparison cooling electricity EPI
Figure 35 EPI analysis
95
90
85
80
94.93 83.6 83.03 75
100 0 10 20 30 40 50 60 70 Full AC with 24 setpoint Full AC with adaptive setpoint Mixed mode operation
EPI (kWh/m2/yr) Cooiling electricity (kWh) Thousands
Figure 35 shows that by employing adaptive setpoints as an ECM, cooling electricity is reduced by 25%, andEPIis12%.However,byemploying amixedmodestrategyinthevariouszonesbasedonthesuitability of window opening and internal loads, there is not much significant difference observed in the EPI.
Page 30 of 53
Awatans Tripathi PBE21071 | MTech. Building Energy Performance | FT | CEPT University
Applying MM operation to selected five primary zones, the EPI was reduced by less than 1% with respect to full AC with adaptive setpoint operation. From this, it can be concluded that:
• MM operation will incur costs regarding window operation control and system controls.

• On the contrary, this strategy does not reduce the EPI significantly; hence, savings will be almost negligible, resulting in a high payback period.
6.4 Conclusion
Figure 36 shows the final proposed zoning strategies for the operation of the building. The toilets and the pump room will be entirely naturally ventilated, and the rest will be run in full AC mode. The principal EPI reduction caused is only due to the employment of adaptive setpoints. All simulations up to this point are run on a generic air cooled VRF system as prescribed by ECBC. The system tonnages are compared, as shown in Table 4. The EPI reduces by 32%, and the system tonnage reduces by 22%.
Table 4


System configuration & EPI
Page 31 of 53
Awatans Tripathi PBE21071 | MTech. Building Energy Performance | FT | CEPT University
7 HVAC exploration
7.1 Introduction
The building up until this point is run on a generic air cooled VRF system following ECBC. The system size and EPI are 30.8 TR and 83.6 kWh/m2/yr. This section further analyses the performance of different systems in terms of cooling electricity, system tonnage, and EPI. The following iterations were done:
• Water cooled chiller with VAV no reheat coil: A water cooled chiller with auto size mode is tested for any change in EPI, cooling electricity, and system size.
• Air cooledchillerwithVAV noreheat coil: Anair cooledchilleristestedsimilarly.Itisexpected to perform inferior to the water cooled chiller since the heat rejection capacity of the water cooled chiller is better than that of the air cooled chiller.
• Water-cooled VRF v/s Air-cooled VRF: A performance analysis is done based on the average CoP achieved by each system and the costs involved.
7.2 Air cooled chiller v/s Water cooled chiller
The approach is described as follows: Air cooled chiller is tested for average CoP at part loads that occur the most frequently. Similarly, the average CoP of a Water cooled chiller is plotted. The conclusion is drawn based on the following two parameters:
• Average CoP
• EPI
Figure 37 shows the part loads at which the chiller operates most of the hours. Coincidently, these hours are during which the CoP gives maximum Cop The chiller is run at sequential loading, where the system is run at its maximum part load ratio.
Part loads
1
0.8
0.6
0.4
0.2
0
Majority of operation hours lie b/w 50-60% PLR. The CoP is also maximum also is for these hours
1.2 0 1 2 3 4 5 6 7
CoP(W/W)
Figure 37 Chiller CoP v/s PLR
Awatans Tripathi PBE21071 | MTech. Building Energy Performance | FT | CEPT University
Figure 38 shows a comparison between basic models of air and water cooled chillers. As expected, there is a 30% drop in cooling electricity since heat rejection is more efficient in water cooled chillers. The sizing suggested by energy plus for the chiller is 41 TR (141000W), which is almost 10 TR more than the air cooled VRF system. Therefore, additional costs for:
• Chiller equipment and system sizing
• Cooling tower Will be incurred if the system is changed. The following sub section deals with a comparison between air cooled and water cooled VRF systems.
7.3
Figure 38 Water v/s air cooled performance
Air cooled VRF v/s Water cooled VRF
A similar approach is taken for testing the two systems below: Air cooled and water cooled VRF are tested foraverageCoPatpartloads thatoccurthemostfrequently.Theconclusionisdrawnbasedonthefollowing two parameters:
Figure 39 Part load study
Page 33 of 53
Awatans Tripathi PBE21071 | MTech. Building Energy Performance | FT | CEPT University
Figure 39 shows the part loads at which the equipment operates for the maximum time. Therefore, choosing the VRF system that gives the maximum CoP at these part loads is essential.
Air v/s Water cooled VRF
Part load Rarios CoP (W/W)
Avg. CoP:5.54 Avg. CoP:6.59
0 0.2 0.4 0.6 0.8 1 1.2 0 1 2 3 4 5 6 7 8 9 10
Figure 40 Comparison of water & air cooled VRF system
Figure 40depictsanaverage riseinCoP oftheselectedVRF system. The water cooled VRF,asexpected, outperforms the air cooled VRF by giving a higher average CoP for the most frequent part loads.
AIR cooled WATER cooled 33357.85
41228.01 75.23
EPI (kWh/m2/yr) Cooling electricity (kWh)
83.6 70 72 74 76 78 80 82 84 86 0 5000 10000 15000 20000 25000 30000 35000 40000 45000 Water cooled Air cooled
EPI comparison cooling electricity EPI
Figure 41 Performance of air cooled vs water cooled VRF
Figure 41 depicts the decrease in EPI when adding a condenser for water cooling. Although there is an added component of heat rejection electricity of 1379kWh annually, the decrease in cooling electricity compensates for it, resulting in an overall lower EPI.
Awatans Tripathi PBE21071 | MTech. Building Energy Performance | FT | CEPT University
7.4 Conclusion
Figure 42 shows the overall analysis conducted regarding various HVAC systems. The water cooled VRF stands out in terms of the following:
• Minimum EPI
• Maximum reduction in cooling EPI
• Minimum cooling electricity consumption. Although the water cooled chiller is the next best option, for such low tonnage requirements (31 TR), a chiller is not feasible since it will incur the high capital cost and maintenance costs. Also, the system capacity will have to be oversized since the chillers are not available at such low tonnage requirements. Finally, in this case, it is not feasible to divide the system into two chillers and apply sequential loading, again due to low tonnage. Therefore, in conclusion, a water cooled VRF with adaptive set points is used as the cooling system for the building.
HVAC analysis
Cooling electricity (kWh) Thousands
30
20
40 50 60 70 VRF with 24⁰C setpoint
94.21 83.66 10
35 0 10 20 30 40 50 60 70 80 90 100 Air
cooled VRF (ad. st pts) Water cooled VRF (ad. st pts) Air cooled chiller (ad. st pts) Water cooled chiller (ad. st pts) % reduction in cooling EPI & EPI(kWh/m 2 / yr )
Cooling electricity EPI % reduction
in cooling EPI
Awatans Tripathi PBE21071 | MTech. Building Energy Performance | FT | CEPT University
8 Renewable energy system integration
8.1 Introduction
Integration of on site energy generation help in further reducing dependence on off site sources. For this exercise, the potential of solar energy was harnessed to power the building. The system sizing is mainly based on the budget allotted for applying ECMs. The system size is calculated, and the annual electricity generation potential is. The following section describes the calculations regarding plant sizing.
8.2 Plant sizing
For the city of Surat, Gujarat, the average solar irradiation in the state is 1266.52 W/m2 1kWp solar rooftop plant will generate an average of 5.0 kWh of electricity per day (considering 5.5 sunshine hours) As per the remaining budget after conducting the simple payback period and cost analysis (section 9) of all ECMs, the plant size has been calculated based on the per kW cost. Therefore, the plant size feasible for this case at Rs.38236/kW is 22.6kW.
The annual on site generation from this plant will be 33900 kWh/yr. Therefore, energy generated per building area unit is 25.44 kWh/m2/yr. Table 5 summarizes the renewable energy potential of the building.
Table 5 Solar PV potential
Total roof area (m2) 808.76
EPI of building (kWh/m2/yr) 75.23
Annual average solar irradiation (W/m2) 1266.52
The budget allotted for solar panels (Rs.) 860238
Size of solar panel feasible (kW) 22.6
Roof area required (m2) 226.45
Annual generation by the plant (kWh) 33900
EPI offset by Solar panels (kWh/m2/yr) 25.44
Net EPI of building (kWh/m2/yr) 49.78
Awatans Tripathi PBE21071 | MTech. Building Energy Performance | FT | CEPT University
9 Simple payback period & cost analysis
9.1 Introduction
This section will mainly focus on selecting various ECMs tested on the building as per the allotted budget, whichis7.5%ofthetotalcapitalcostofthe ECBCstandardcase.Thesectionsbelowdescribethelumpsum cost of the building and additional investments made for applying the ECMs. The building should be able to give back the extra investments made within the pre defined limit of not more than 3years.
9.2 Cost breakdown ECBC standard case
The following table 6 and figure 43 show the cost calculation carried out for the base case. Most of the cost lies with the HVAC and roof, followed by the lighting. This indicates that cutting down on the HVAC and lighting costs by introducing certain ECMs will allow for increasing savings and investing in better alternatives of ECMs. For example, changing the U value of the wall will result in decreased cooling loads, which will decrease the HVAC system size, giving rise to extra savings.
Cost analysis
Awatans Tripathi PBE21071 | MTech. Building Energy Performance | FT | CEPT University
Table 6 Lumpsum costing for ECBC standard case
Walls Area (m2) Rate (Rs./m2) Cost (Rs.) North 158.09 2692 425720.454 East 324.17 2692 872957.1735 South 185.31 2692 499021.1735 West 190.86 2692 513966.7648 858.43 total 2311665.566
Window Area (m2) Rate (Rs. /m2) Cost North 30.61 2060 63056.6 East 181.76 2060 374425.6 South 3 2060 6180 West 311.95 2060 642617 527.32 total 1086279.2
Roof Area (m2) Rate (Rs. /m2) Cost (Rs.) roof 1 808.765 6311.482788 5104506.377
Floor Volume(m3) Rate (Rs./m3) Cost (Rs.) floor1+2 199.80 7945 1587411
TOTAL CIVIL (Rs.) 9546562.377
Lighting and Electrical Parameter Rate Cost (Rs.) civil work 12.5% of civil work 1193320.297
HVAC Horsepower Rate(/hp) Cost 226.00 45000 10170000
Green screen Al. panels Parameter Rate Total area 79.5 3000/ m² 238500
GRAND TOTAL ₹21,759,594.91 ECM budget 7.5% cost ₹1,631,969.62
A total of ₹1,631,969.62 is allotted for the application of ECMs. The following sections describe the costs and the same payback periods associated with the ECMs. Firstly, based on the budget, certain ECMs are selected. The remaining budget is then proposed to be applied to employing renewable energy systems.
Page 38 of 53
Awatans Tripathi PBE21071 | MTech. Building Energy Performance | FT | CEPT University
9.2.1 Wall U values
Different wall assemblies are tested for EPI reductions and payback periods.
Cost & Savings
0 1 2 3 4 5 6 7 0.05 0.1 0.15 0.2 0.25 0.3 0.35
U value (W/m2K)
Expenditure & Savings (Rs.) Lakhs
Figure 44 Costs & savings Wall U values
• The % reduction in cooling EPI goes up to 8%. However, the cost that needs to be invested is significantly high. The payback period of the 0.1 U value is 6.7 years, as shown in figure 45. This individual intervention still does not satisfy the 3 year constraint.
• The payback periods of the other two interventions are higher than six years at lower costs, but still will not be sufficient.
• As shown, the reduction in HVAC sizing due to these interventions gives rise to additional savings in each case.
• Therefore, from this study, it is inferred that the 0.1 U value wall, if used with other ECMs, may be able to help reach the 3 year payback period staying within budget.
Investment cost & Savings Lakhs
Payback period | Wall U values
5
4
3
2
Expenditure Electricity savings savings in HVAC 0
6.7 yrs 8.5 yrs 9.6 yrs
1
6 1 2 3 4 5 6 7 8 9 10
Years
savings on electricity 0.3 U value savings on electricity 0.2 U value savings on electricity 0.1 U value Investment cost 0.3 U value Investment cost 0.2 U value Investment cost 0.1 U value
Figure 45 Simple payback Wall U values
Page 39 of 53
Awatans Tripathi PBE21071 | MTech. Building Energy Performance | FT | CEPT University
9.2.2 Roof U values
Different roof assemblies are tested for EPI reductions and payback periods.
Cost & Savings
0 5 10 15 20 25 30 0.2 U value 0.1 U value High SRI Expenditure & Savings (Rs.) Lakhs Strategy
savings savings in HVAC
Figure 46 Costs & savings Roof strategies
• The % reduction in cooling EPI goes up to 2.1%. The costs saved by changing the U value are low concerning the investments made. However, these interventions offer the opportunity to save money by reducing system size.
• The payback periods of the changing U values are unrealistically high and therefore are unfeasible. The roof is already optimized, it being an ECBC compliant assembly.
• High SRI paint, which is assumed to produce an SRI of around 90%, gives a realistic payback period of around five years with the least expenditure and effective HVAC system sizing savings.
• Therefore, from this study, it is inferred that the high SRI paint intervention can be chosen from the other two expensive and unfeasible alternatives.
Payback period | Roof properties
130 yrs 62 yrs 5 yrs
savings on electricity high SRI Investment cost high SRI savings on electricity 0.1 U value Investment cost 0.1 U value savings on electricity 0.2 U value Investment cost 0.2 U value
Figure 47 Simple payback Roof strategies
Awatans Tripathi PBE21071 | MTech. Building Energy Performance | FT | CEPT University
9.2.3 Window U values
Different window assemblies are tested for EPI reductions and payback periods.
Cost & Savings
Figure 48 Costs & savings Window strategies
• The%reductionincoolingEPIgoesuptoaminor0.4%.Thecostssavedbybothcasesare minimal as compared to the investments
• These interventions only help reduce conductive gains through windows which are not enough to generate significant savings.
• Therefore, from this study, it is highly unfeasible to go for these options. Windows with lower SHGC must also be looked upon, but the feasibility will be expected to be low due to the high investment amount and payback periods.
Payback period | Windows savings on electricity 2.5 U value savings on electricity 1.7 U value Investment cost 2.5 U value Investment cost 1.7 U value
Figure
162 yrs 343 yrs
Payback Window U
Page 41 of 53
Awatans Tripathi PBE21071 | MTech. Building Energy Performance | FT | CEPT University
9.2.4 Lighting controls
Different lighting control areas are tested for EPI reductions and payback periods.
Cost & Savings lighting control Expenditure Electricity savings savings in HVAC
Figure 50 Costs & savings Lighting controls
• The % reduction in lighting EPI goes up to 20%. The costs saved by changing the area under lighting controls are pretty significant.
• The payback periods are also realistic, which go up to 2 years without much increase in cost.
• The decrease in lighting energy also affects the HVAC sizing. This intervention decreases the cooling EPI and lighting EPI simultaneously.
• Therefore, from this study, it is inferred that any four interventions can be chosen to work with further, given their economic feasibility.
Costing analysis | Lighting controls
&
controls
Awatans Tripathi PBE21071 | MTech. Building Energy Performance | FT | CEPT University
9.3 Conclusion
Several ECMsweretestedonthemodel,andEPIreductionandinvestment feasibilitywere analyzed.Based on the results, 2 ECMs were selected to take forward. This decision was taken based on each measure's minimum payback period and amount of investment cost in the ECM. Lighting controls and high SRI coatings involve an optimum investment cost with a low payback period. Along with the ECMs mentioned above, solar panels are proposed based on the remaining budget, as shown in Table 6. Figure 50 shows the final set of strategies adopted, along with the payback periods and invested cost. The final payback period is two years and seven months with an EPI of 49.78 kWh/m2/yr.
120.00
100.00
80.00
60.00
40.00
20.00
4.44 1.93 2.19 2.19 1.92 2.60 0 0.5 1 1.5 2 2.5 3 3.5 4 4.5 5 0.00
113.80 123.58 121.04 97.98 94.93 83.60 75.23 49.78
140.00 Base case ECBC IDL proposed case High SRI paint (ECM 1) LIGHTING CONTROLS100% area (ECM 2) ECM 1 +ECM 2 ECM 1 +ECM 2 + adaptive set points (air cooled VRF) ECM 1 +ECM 2 + adaptive set points(water cooled VRF) All ECMs + Solar PV Payback period (years) EPI (kWh/m 2 / yr ) EPI Payback period
Figure 52 Summary of performance optimization
Table 7 Cost breakdown of ECMs ECM Invested Cost (Rs.) Notes High SRI paint 110620 100% lighting control 411111 the additional cost of installing light control sensors Water cooled VRF 250000 the additional cost of cooling tower based on system tonnage Solar panels 860238 based on the remaining budget TOTAL 1,631,970
Page 43 of 53 Awatans Tripathi PBE21071 | MTech. Building Energy Performance | FT | CEPT University
10 ECBC compliance
10.1 Introduction
This report hasbeenpreparedfor theSARIbuildinginAhmedabad,Gujarat.Thefollowingsectioncontains details related to compliance with measures undertaken for the performance optimization of the building.
10.2 Section 3 Compliance and approach
10.2.1 Section 3.1 (a)
• The EPI ratio must be less than or equal to 1. EPI ratio = 75.23/113.79 = 0.66
10.3 Section 4 Building envelope
10.3.1
Fenestration
• Prescribed U value for fenestration for Hot & Dry climate= 3 W/m2K.
1. All windows comply with this requirement.
• Prescribed SHGC value for fenestration for Hot & Dry climate= 0.5 for North windows & 0.27 for no north windows.
1. All windows comply with this requirement.
10.3.2 Walls
• Prescribed U value for walls for Hot & Dry climate= 0.4 W/m2K.
1. All walls comply with this requirement.
10.3.3 Roof
• Prescribed U value for the roof for Hot & Dry climate= 0.33 W/m2K.
1. All roofs comply with this requirement.
10.4 Section 5- Comfort systems and controls
10.4.1
Ventilation
There are no means of mechanical ventilation provided in the building. Hence this clause does not apply to this project.
10.4.2
Space conditioning efficiency
The installed equipment (water cooled VRF) reports an average CoP of 6.59. Therefore, this clause is compliant with the requirement.
Awatans Tripathi PBE21071 | MTech. Building Energy Performance | FT | CEPT University
10.4.3 Condensers
Condensers will belocated to make the heat sinkfree ofinterferencefrom heat dischargeby devices located in adjoining spaces and not to interfere with other such systems installed nearby.
10.5 Section 6- Lighting and controls
10.5.1
Daylighting metrics
The project complies with the super ECBC requirement of uDI for 68.47% of the floor area.
10.5.2 Automatic controls in daylit areas
The project has interior lighting fittings for more than 300 m2. The project has also been optimized for daylight penetration; hence all areas have been provided with lighting controls.
10.6 Section 7 Renewable energy systems
10.6.1 On site energy generation solar PV array
There is a proposal to install rooftop solar PV panels of 33.8% (22.6kW) of the total demand load of the building. The roof area is free of any obstruction. 28% of the total roof area will be utilized in this process.
10.7 Whole building performance method
10.7.1 Project details & thermal zoning
Refer to sections 1 and section 3 for project details and energy modeling.
• Building area = 1332.26 m2
• WWR= 40%
• Annual electrical load = 151597.86
• System tonnage = 39.73 TR
• System CoP = 3.3
S. No. Model input parameter
1. Exterior wall construction
2. Roof construction
3. Glazing
Table 8 Model inputs for simulation
ECBC standard case
Final proposed case
U value= 0.44 W/m2K U value= 0.44 W/m2K
U value= 0.3 W/m2K U value= 0.3 W/m2K
High SRI paint
U value= 3 W/m2K U value= 3 W/m2K
Awatans Tripathi PBE21071 | MTech. Building Energy Performance | FT | CEPT University
SHGCnorth= 0.5; SHGCnon north= 0.27 SHGCnorth= 0.5; SHGCnon north= 0.27 4. Shading
As built Extra shading provided on east and west façade glazing 5. EPD 11.7 W/m2 11.7 W/m2 6. LPD 9.5 W/m2 9.5 W/m2 7. Lighting controls All areas under lighting controls 8 HVAC system
Air cooled VRF (24⁰C setpoint) Water cooled VRF (adaptive setpoints) 9. Renewable system 22.6 kW rooftop solar PV array
10.8 Results
The proposed case shows significant savings in energy majorly due to the following interventions:
• High SRI paint on the roof
• Addition of lighting controls across the whole area
• Optimization of VRF system in terms of: o Provision of adaptive setpoints
o Addition of a water cooled condenser for better hear rejection
Table 8 shows the savings summarized for the project. There is a different generation of energy through the installation of solar panels.
Table 9 EPI comparison
Parameter
ECBC standard case Final proposed case
EPI (kWh/m2/yr) 113.79 75.23
Annual Energy Consumption (kWh) 151597.86 100225.91 On site annual energy generation (kWh) 33900 Energy saving % 33.8
Page 46 of 53
Awatans Tripathi PBE21071 | MTech. Building Energy Performance | FT | CEPT University
11 References
• National Portal for Rooftop Solar Ministry of New and Renewable Energy. (n.d.). https://solarrooftop.gov.in/rooftop_calculator.
• Bureau of Energy Efficiency (2017), Energy Conservation Building Code 2017 (Energy Conservation Building Code) 1st edition, Bureau of Energy Efficiency.
• ATEEnterprisesOffice. (n.d.). RMA Architects. https://rmaarchitects.com/architecture/factory for ate/
• \climatewebsite\WMO_Region_2_Asia\IND_India. (n.d.). https://climate.onebuilding.org/WMO_Region_2_Asia/IND_India/index.html
• Central Public works department (2021), Delhi schedule of rates 2021 (Delhi schedule of rates) 1st edition, Central Public works department.
• Light Guide: Occupancy and Vacancy Sensors. (n.d.). https://www.lightsearch.com/resources/lightguides/sensors.html
Awatans Tripathi PBE21071 | MTech. Building Energy Performance | FT | CEPT University
12 ANNEXURES
12.1 Annexure A Climate, Daylight
This section contains graphs related to weather file selection analysis and climate analysis.
Weather data comparison
Relative humidity (%)
Dry bulb temperature (⁰C)
IND_GJ_Surat.428400_ISHRAE2014 IND_GJ_Surat.428400_TMYx.2004-2018. IND_GJ_Surat.428400_TMYx.2007-2021 IND_GJ_Surat.428400_TMYx
Annex. Figure 1 TMY data comparison Annex. Figure1 shows thecorrelation between the datasets of allfour weather files. The deviationin values is not significant. Therefore, the file with the latest dataset is preferred over all files.
Annex. Figure 2 Climate summary
Awatans Tripathi PBE21071 | MTech. Building Energy Performance | FT | CEPT University
Annex. Figure 2 shows the hours under each category that requires countermeasures to provide comfort. The temperature limits are based on the lowest value of the upper band of 90% acceptability range for mixed mode operation. For example, the 285 hours inside the humidity range but below the lower band require sensible heating. Similarly, hours between the humidity band and temperature band are considered comfortable. Therefore, during these hours, natural ventilation is possible.
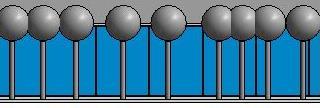


Annex. Figure 3,4 show the east and west facades of the intermediate iterations. An option was selected as the final design based on the results mentioned in Table 3.
12.2 Annexure B Modes of operation (NV, MM)
09hrs 18hrs Window closed Window open 00hrs 24hrs
89101112131415161718192021222324252627282930313233343536373839404142434445464748495051525354555657585960616263646566676869707172737475767778798081828384858687888990919293949596979899100101102103104105106107108109110111112113114115116117118119120121122123124125126127128129130131132133134135136137138139140141142143144145146147148149150151152153154155156157158159160161162163164165166167168169170171172173174175176177178179180181182183184185186187188189190191192193194195196197198199200201202203204205206207208209210211212213214215216217218219220221222223224225226227228229230231232233234235236237238239240241242243244245246247248249250251252253254255256257258259260261262263264265266267268269270271272273274275276277278279280281282283284285286287288289290291292293294295296297298299300301302303304305306307308309310311312313314315316317318319320321322323324325326327328329330331332333334335336337338339340341342343344345346347348349350351352353354355356357358359360361362363364365 july august september october november december may june
09hrs 18hrs Not comfortable Comfortable
Annex. Figure 5 Heatmap showing window opening pattern
89101112131415161718192021222324252627282930313233343536373839404142434445464748495051525354555657585960616263646566676869707172737475767778798081828384858687888990919293949596979899100101102103104105106107108109110111112113114115116117118119120121122123124125126127128129130131132133134135136137138139140141142143144145146147148149150151152153154155156157158159160161162163164165166167168169170171172173174175176177178179180181182183184185186187188189190191192193194195196197198199200201202203204205206207208209210211212213214215216217218219220221222223224225226227228229230231232233234235236237238239240241242243244245246247248249250251252253254255256257258259260261262263264265266267268269270271272273274275276277278279280281282283284285286287288289290291292293294295296297298299300301302303304305306307308309310311312313314315316317318319320321322323324325326327328329330331332333334335336337338339340341342343344345346347348349350351352353354355356357358359360361362363364365 00hrs 24hrs
Annex. Figure 6 Heatmap showing comfortable hours
• Annex. Figure 6 shows the comfortable hours for NV operation inside the 1f open office north. The comfort hours are based on temperature and humidity limits.
• The majority of the hours are comfortable. Although this does not owe solely to window openings, the ambient conditions during winter also play a role.
• There are no comfort hours even on opening windows because of high humidity levels (beyond 70%). The windows open based on provided logic of set point, which does not consider Rh
50 of 53
Awatans Tripathi PBE21071 | MTech. Building Energy Performance | FT | CEPT University
89101112131415161718192021222324252627282930313233343536373839404142434445464748495051525354555657585960616263646566676869707172737475767778798081828384858687888990919293949596979899100101102103104105106107108109110111112113114115116117118119120121122123124125126127128129130131132133134135136137138139140141142143144145146147148149150151152153154155156157158159160161162163164165166167168169170171172173174175176177178179180181182183184185186187188189190191192193194195196197198199200201202203204205206207208209210211212213214215216217218219220221222223224225226227228229230231232233234235236237238239240241242243244245246247248249250251252253254255256257258259260261262263264265266267268269270271272273274275276277278279280281282283284285286287288289290291292293294295296297298299300301302303304305306307308309310311312313314315316317318319320321322323324325326327328329330331332333334335336337338339340341342343344345346347348349350351352353354355356357358359360361362363364365 july august september october november december january february march april may june Window closed Window open
89101112131415161718192021222324252627282930313233343536373839404142434445464748495051525354555657585960616263646566676869707172737475767778798081828384858687888990919293949596979899100101102103104105106107108109110111112113114115116117118119120121122123124125126127128129130131132133134135136137138139140141142143144145146147148149150151152153154155156157158159160161162163164165166167168169170171172173174175176177178179180181182183184185186187188189190191192193194195196197198199200201202203204205206207208209210211212213214215216217218219220221222223224225226227228229230231232233234235236237238239240241242243244245246247248249250251252253254255256257258259260261262263264265266267268269270271272273274275276277278279280281282283284285286287288289290291292293294295296297298299300301302303304305306307308309310311312313314315316317318319320321322323324325326327328329330331332333334335336337338339340341342343344345346347348349350351352353354355356357358359360361362363364365 00hrs 24hrs
Annex. Figure 7 Heatmap showing window opening pattern
00hrs 24hrs
09hrs 18hrs AC off AC on
09hrs 18hrs
Annex. Figure 8 Heatmap showing AC operation
• Annex. Figures 7 and 8 show the co relation of the window opening and AC operation for 1f open office north. The results are similar to those of 0f open office and all other zones.
• The windows open and AC turns off based on provided logic of the set point, which does not take Rh into account. This is majorly happening during the morning hours in winter.
• The windows are closed for a significant part of the year, and AC turns on since the internal gains through the Envelope are high.
Awatans Tripathi PBE21071 | MTech. Building Energy Performance | FT | CEPT University
12.3 Annexure C- ECM sensitivity analysis
0% 1% 2% 3% 4% 5% 6% 7% 8% 9% 0.05 0.1 0.15 0.2 0.25 0.3 0.35 % reduction in cooling EPI U value (W/m2K)
Annex. Figure 9 % reduction in cooling EPI Wall U values
Annex. Figure 9 shows that the % reduction in cooling EPI goes up to 8% if we change the U value from 0.3 W/m2K to 0.1 W/m2K.The ECBC standardcase isalready optimized to acertain extent; therefore,there are no significant reductions observed in cooling loads in this test.
% reduction in cooling EPI
Roof strategies
2.0%
1.5%
Wall U value 0.9%
1.0%
0.5%
1.4%
2.1% 0.0%
2.5% 0.2 U value 0.1 U value High SRI
Strategies
Annex. Figure 10 % reduction in cooling EPI Roof U values
Annex. Figure 9 shows that the % reduction in cooling EPI goes up to 2.1% if we change the U value from 0.3 W/m2K to 0.1 W/m2K.The ECBC standardcase isalready optimized to acertain extent; therefore,there are no significant reductions observed in cooling loads in this test.
Page 52 of 53
Awatans Tripathi PBE21071 | MTech. Building Energy Performance | FT | CEPT University
% reduction in cooling EPI Strategy
0.4%
0.1%
0.0% 0.1% 0.1% 0.2% 0.2% 0.3% 0.3% 0.4% 0.4% 0.5% 2.5 U value 1.7 U value
Annex. Figure 11 % reduction in cooling EPI Window U values
Annex. Figure 11 shows that the % reduction in cooling EPI goes up to 0.4% if we change the U value from 3 W/m2K to 1.7 W/m2K. The windows contribute majorly to radiative heat gains. Therefore, changing U values does not affect the heat gains and cooling loads.
Lighting controls
20%
15%
Window strategies 0%
25% 0 20 40 60 80 100 120
10%
5%
% reduction in lighting EPI % area controlled
Annex. Figure 12 % reduction in lighting EPI lighting controls
Annex. Figure 11 shows that the % reduction in cooling EPI goes up to 0.4% if we change the U value from 3 W/m2K to 1.7 W/m2K. The windows contribute majorly to radiative heat gains. Therefore, changing U values does not affect the heat gains and cooling loads.
Awatans Tripathi PBE21071 | MTech. Building Energy Performance | FT | CEPT University
