17 minute read
Technical Briefing: Using Magnetic Dirt Filtration for Magnetite Removal
Swati Sharma, Ph.D., Water Engineering Inc.
An important method for improving a facility’s energy efficiency is to increase the condensate return to the boiler. Depending on the system, magnetite (also known as black iron oxide) can potentially contribute to the reduction of condensate return into the boiler feedwater system. In the absence of a condensate return, the steam system must compensate for the loss with makeup water, thereby increasing operational costs. Most of the systems suffer from black iron oxide contamination, creating thick sludge deposits. These deposits resulting from corrosion, along with water hardness scales and other unwanted contaminants, can lead to system failure. A design using magnetic dirt filtration technology was studied for the removal of magnetite in the condensate return. The filters use individually removable neodymium magnetic rods, making it easy and safe to maintain. The study showed that the filtration technology removed more than 80% of the magnetite from the system, resulting in low iron levels. This article reviews some of the study findings.
Introduction
The condensate system is an integral part of a boiler system. When steam is transferred to process application, it converts back to a liquid phase known as the condensate. Returning condensate to the boiler is an attractive option because the condensate not only contains water but also the boiler treatment chemicals and the energy needed for combustion. Returning condensate to the boiler is one of the highest returns on investment. Thus, the condensate needs to be of high quality.
Magnetite is one of the oxides of iron that is magnetic in nature (i.e., ferrimagnetic), and it may prevent condensate return. Old systems suffer from black iron oxide contamination, creating thick sludge deposits. These deposits resulting from corrosion, along with water hardness scales and other unwanted contaminants, can lead to system failure. Magnetite corrosion is a common problem in heating and cooling systems.
The oxide particles vary in size from large to sub-micron. The sub-micron-sized oxide particles can eventually leach to system water during operation. The presence of dissolved iron enhances the growth of iron bacteria, which forms dark-colored slime layers on the inner side of a system’s pipes. The slime is then released into the network through water flow fluctuations, leading to dirt buildup and damage to the system. Iron oxide, in combination with other debris or contaminants, could become mordant during circulation through the system, causing mechanical and operating failures (1–5).
Magnetic filtration techniques have been gaining recognition for their ability to remove iron oxide in hydronic heating systems. Yamamoto et al. (2) developed an iron oxide removal system utilizing a superconducting magnet from the boiler feedwater in the thermal power plants. The study conducted by Okada et al., and Yamamoto et al. (2, 5) concluded that scale or iron oxide removal is efficient using a superconducting magnetic separation system. Another study by Mori et al. (1) developed a superconducting high-gradient magnetic separation (HGMS) system that could remove iron oxide in the boiler-feedwater system of thermal plants. The study simulated the hydronic heating system and conducted the HGMS experiments under a constant flow rate with a large pump in a large-scale system having a filter diameter of 300 millimeters (mm) (1).
In 2018, the innovation group at ADEY manufactured a magnetic filtration system designed with neodymium magnets to form bands of thicker and thinner magnetite collection. The filter canister is designed in a way that is large enough to capture the magnetite without affecting the flow of water but results in minimal pressure drop (3).
Keeping a condensate return system operating at peak performance is crucial. Customer expectations, operating budgets, and client comfort are all at stake. It is vital to protect against anything that might lead to hydronic system failure.
Magnetite corrosion can be potentially harmful to boiler and cooling components, even in small amounts. It can cause expensive damage to systems, leading to:
• Poor system circulation
• Erosion damage in turbulent areas
• Excessive system noise
• Blocked system pipes and heat emitters
• Increased operating costs
• Frequent breakdowns and costly repairs
The purpose of this study, in collaboration with ADEY, was to understand the efficiency of magnetic dirt filtersA in removing black iron oxide sludge from a condensate system.
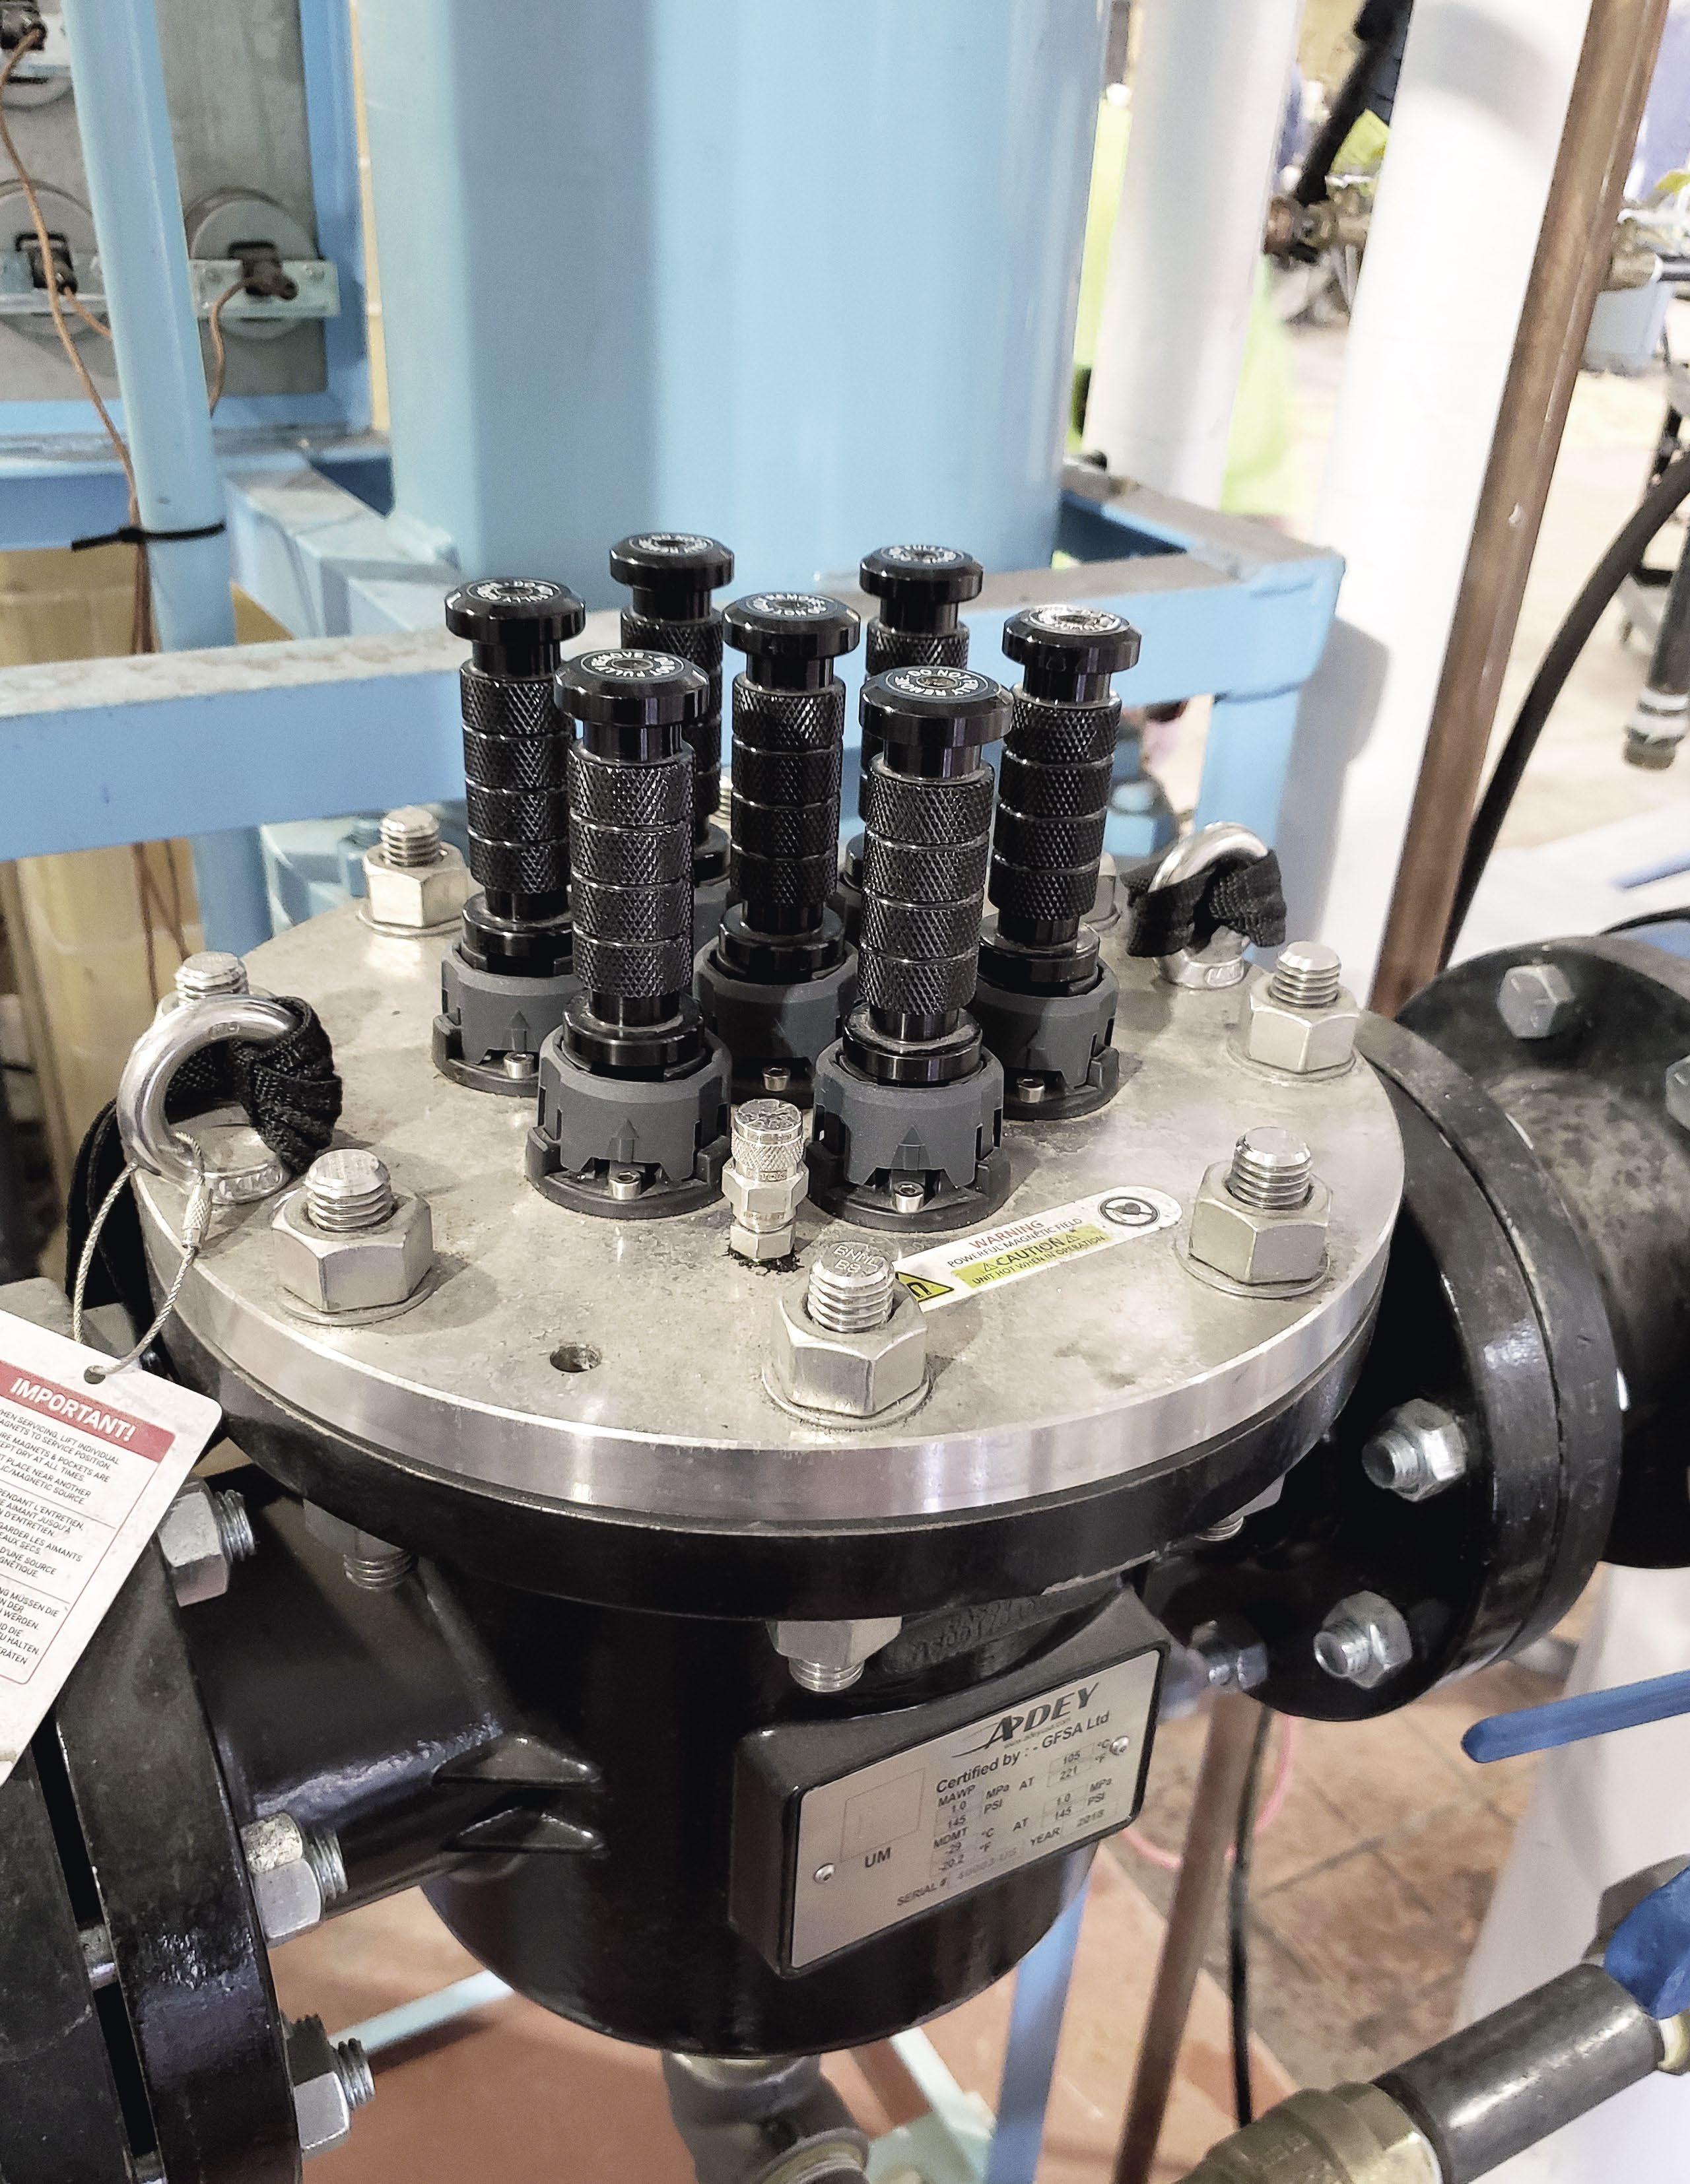
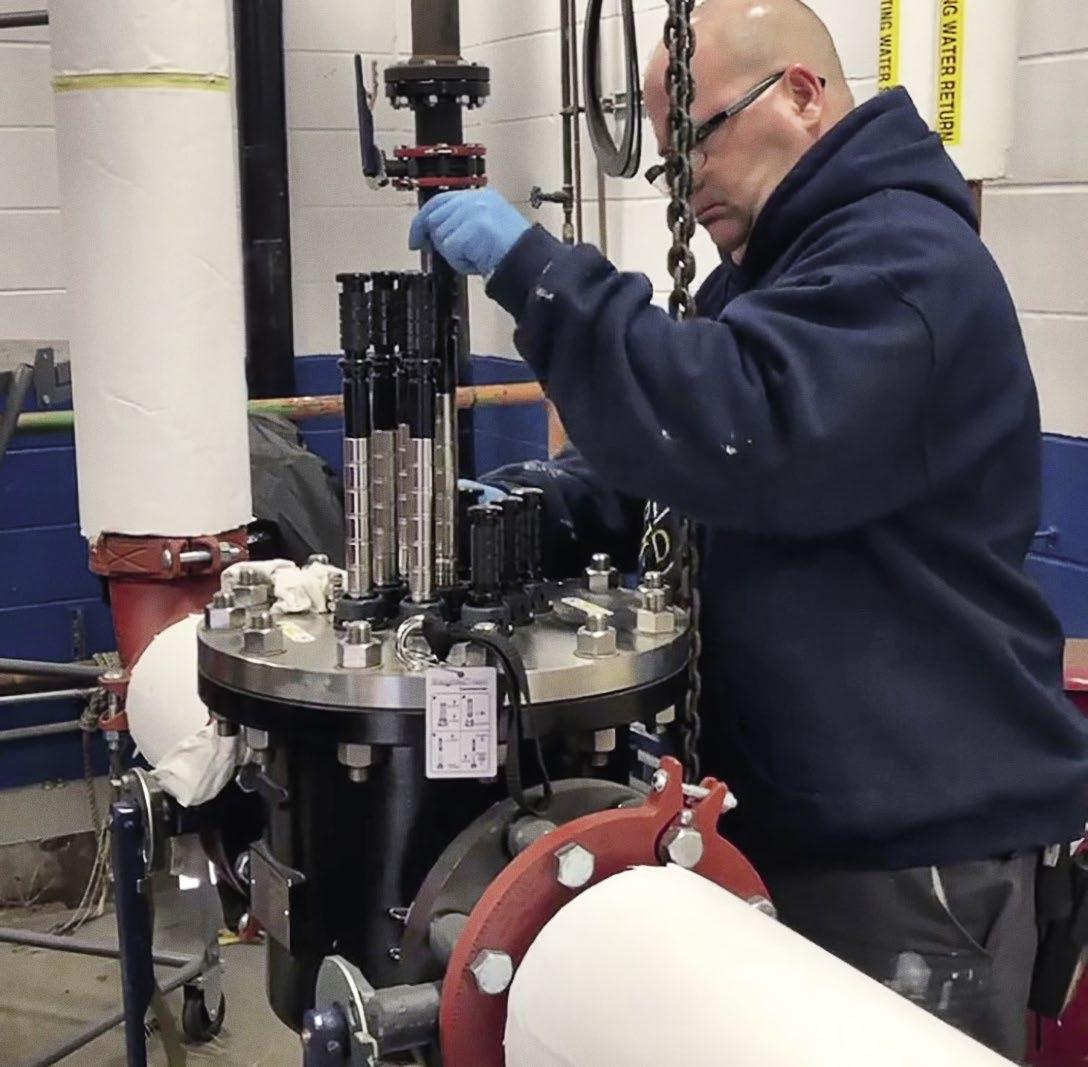
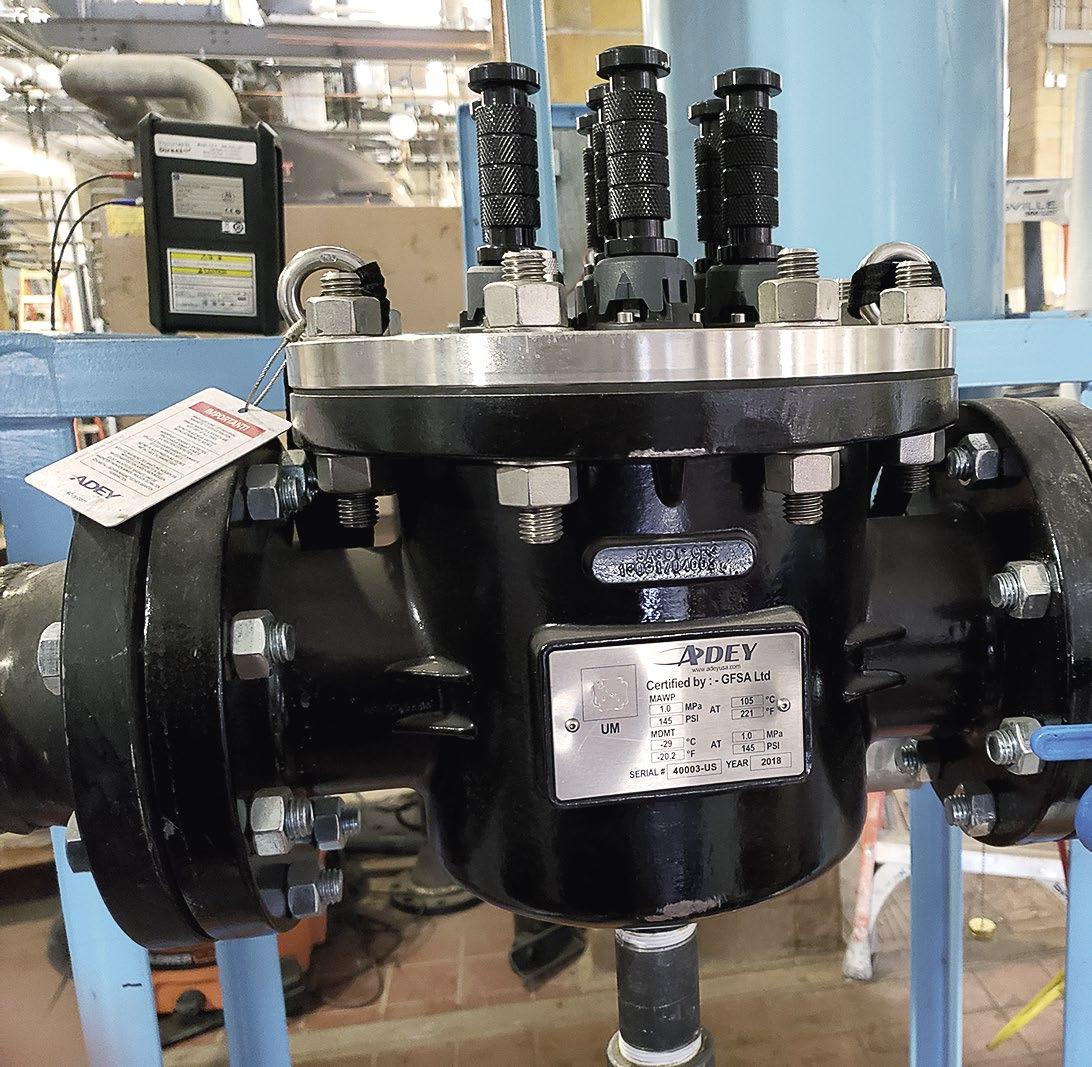
Figure 1: Magnetic dirt filters.
Challenge
A condensate system in a steam generation plant had a constant issue of high iron levels coming into the system,, which impacted the reusability of the condensate return into the boiler feedwater tank. Due to the old systems in place throughout the facility, a number of these existing systems consistently brought more than 20 parts per million (ppm) of iron back to the condensate receiver. As a result, the facility was not able to reuse the condensate and was also dealing with the expenses of makeup water.
Methodology
To reduce the high levels of iron in the hydronics system, the author used the magnetic dirt filter range that removes damaging iron oxide sludge through magnetic filtration technology. Two 4-inch filters were installed in parallel at the facility to reduce the iron sludge from the condensate system before it entered the receiver tank and then he deaerator tank. The installed filters are shown in Figure 1.
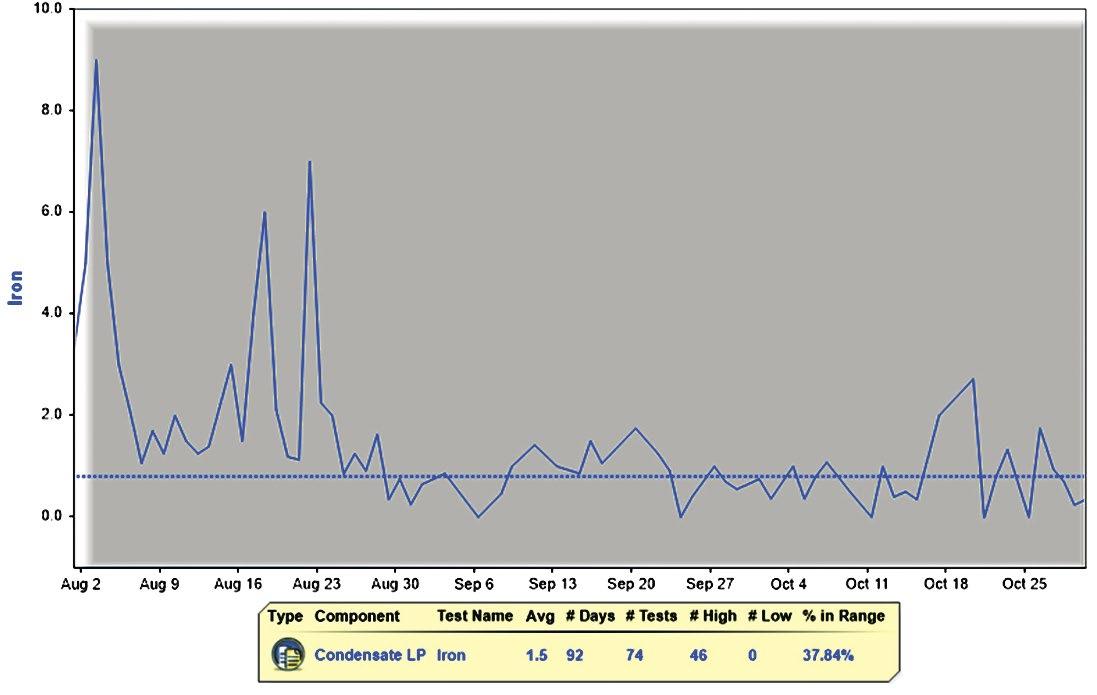
Figure 2: Decrease in iron level following magnet dirt removal filter installation.
Results and Discussion
The system was installed and data were collected to test for iron levels before and after the filters. The data shown in Figure 2 show a decrease in iron levels from the condensate sample in a period of 60 days dated from August 2020 to October 2020. The initial concentration of iron in the beginning of filter installation was 9 ppm. Over the period of 60 days, the iron levels decreased to less than 1 ppm. Other data recorded from January 2020 until October 2020 and presented in Figure 3 show consistently high iron levels of more than 20 ppm until the installation of the filters and a gradual decrease in the iron levels post-installation.
Figure 3: Iron level trend over a period of 300 days.
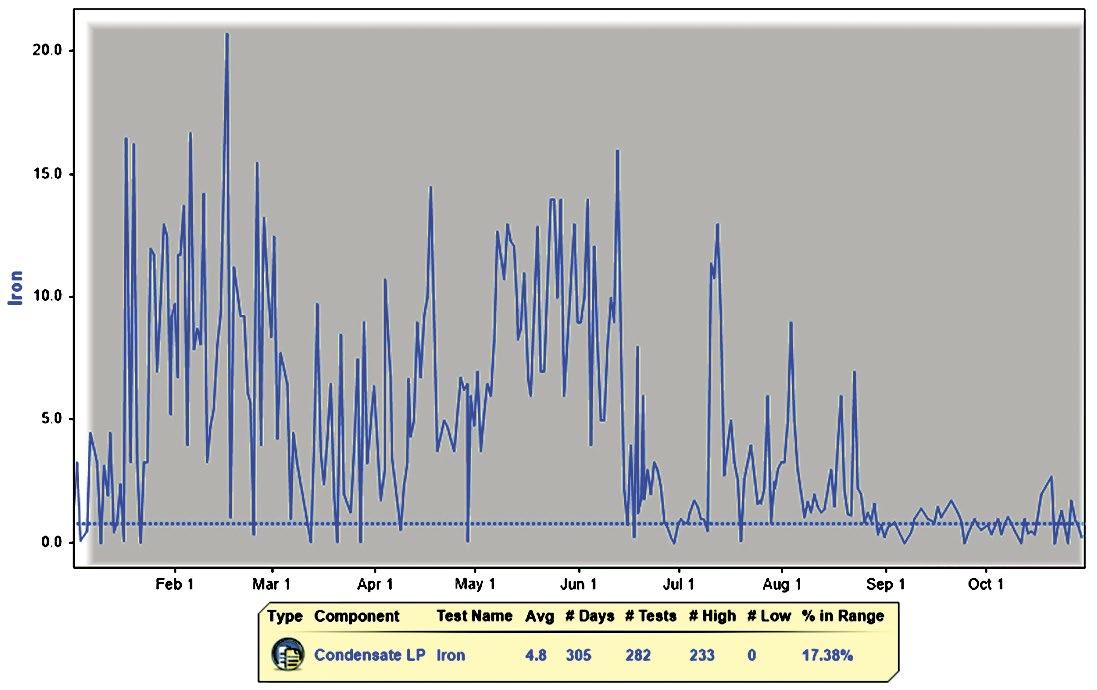
From the data presented above, it was evident that the iron present in the condensate sample was mainly magnetic in nature and therefore could be attracted by the magnets in the filter. The remaining nonmagnetic and dissolved iron levels were low in concentration and were treated by satellite feed of neutralizing amine. The filter that was used forces system water to pass through the central magnetic core, where iron oxide is drawn out by powerful magnetic rods.
Conclusion
The magnetic dirt filtration technology successfully removed more than 95% of the particulate magnetic iron oxide from the condensate return in a period of 60 days, which allowed the system to have lower iron levels and a low pressure drop.
Acknowledgement
The author wishes to thank Neil Watson, CFO of ADEY, for his help with this article.
References:
1. Mori, T., et al. (2020). “Removal of Iron Oxide Scale from Feed-Water in
Thermal Power Plant by High-Gradient Magnetic Separation: Scale-Up
Effect,” IEEE Transactions on Magnetics, 56.12, pp. 1–8. 2. Yamamoto, J., et al. (2018). “Removal of Iron Scale from Feedwater in Thermal
Power Plant by Magnetic Separation—Introduction to Chemical Cleaning
Line,” Progress in Superconductivity and Cryogenics, 20.2, pp. 6–10. 3. Adey, C.; Downie, S. (Oct. 9, 2018).”Separator Device,” U.S. Patent No. 10,092,912. 4. Shibatani, S., et al. (2016). “Study on Magnetic Separation Device for Scale
Removal from Feed-water in Thermal Power Plant,” IEEE Transactions on
Applied Superconductivity, 26.4, pp. 1–4. 5. Okada, H., et al. (2016). “Development of a Magnetic Separation System of
Boiler Feedwater Scale in Thermal Power Plants,” IEEE Transactions on Applied
Superconductivity, 26.3, pp. 1–5.
Endnote
A The ADEY MagnaClean CommercialTM magnetic dirt filters were the filters referenced in the article.
Swati Sharma, Ph.D., completed her doctorate in environmental engineering from North Dakota State University, where she specialized in wastewater treatment and quality monitoring. Dr. Sharma has eight years of experience in industrial, municipal, and agricultural water/wastewater treatment using biological, physicochemical, and electrochemical methods. Currently working as research and analytics manager at Water Engineering Inc., Dr. Sharma is involved with in-house analytical laboratory management, chemical formulations, and technical consulting in industrial water and wastewater solutions. She may be contacted at ssharma@h2oeng.com.
This paper was presented at AWT’s Annual Convention & Exposition, which was conducted September 22–25, 2021, in Providence, Rhode Island.
F
Fund a mentals and Applicatio
Sales
S
A
ASSE / l A PMO/ANSI 10290 Training Wt
R
Wat er T r eatment
RO / U ltra filtration
WEST
February 21–24, 2023 Doubletree Mission Valley San Diego, CA
EAST
March 29–April 1, 2023 Omni William Penn Pittsburgh, PA
CATEGORIES
ASSE/lAPMO/ANSI 10280 Training Fundamentals and Applications RO/Ultrafiltration Sales Water Treatment Wastewater Treatment
A F
R S
W
Wt
REGISTRATION IS NOW OPEN!
Visit www.awt.org/technical-training-2023 to reserve your spot today.
Are We Treating Beakers or Systems? The Pitfalls of Laboratory Simulation
Robert J. Ferguson, French Creek Software, Inc., and John F. Zibrida, Zibex, Inc.
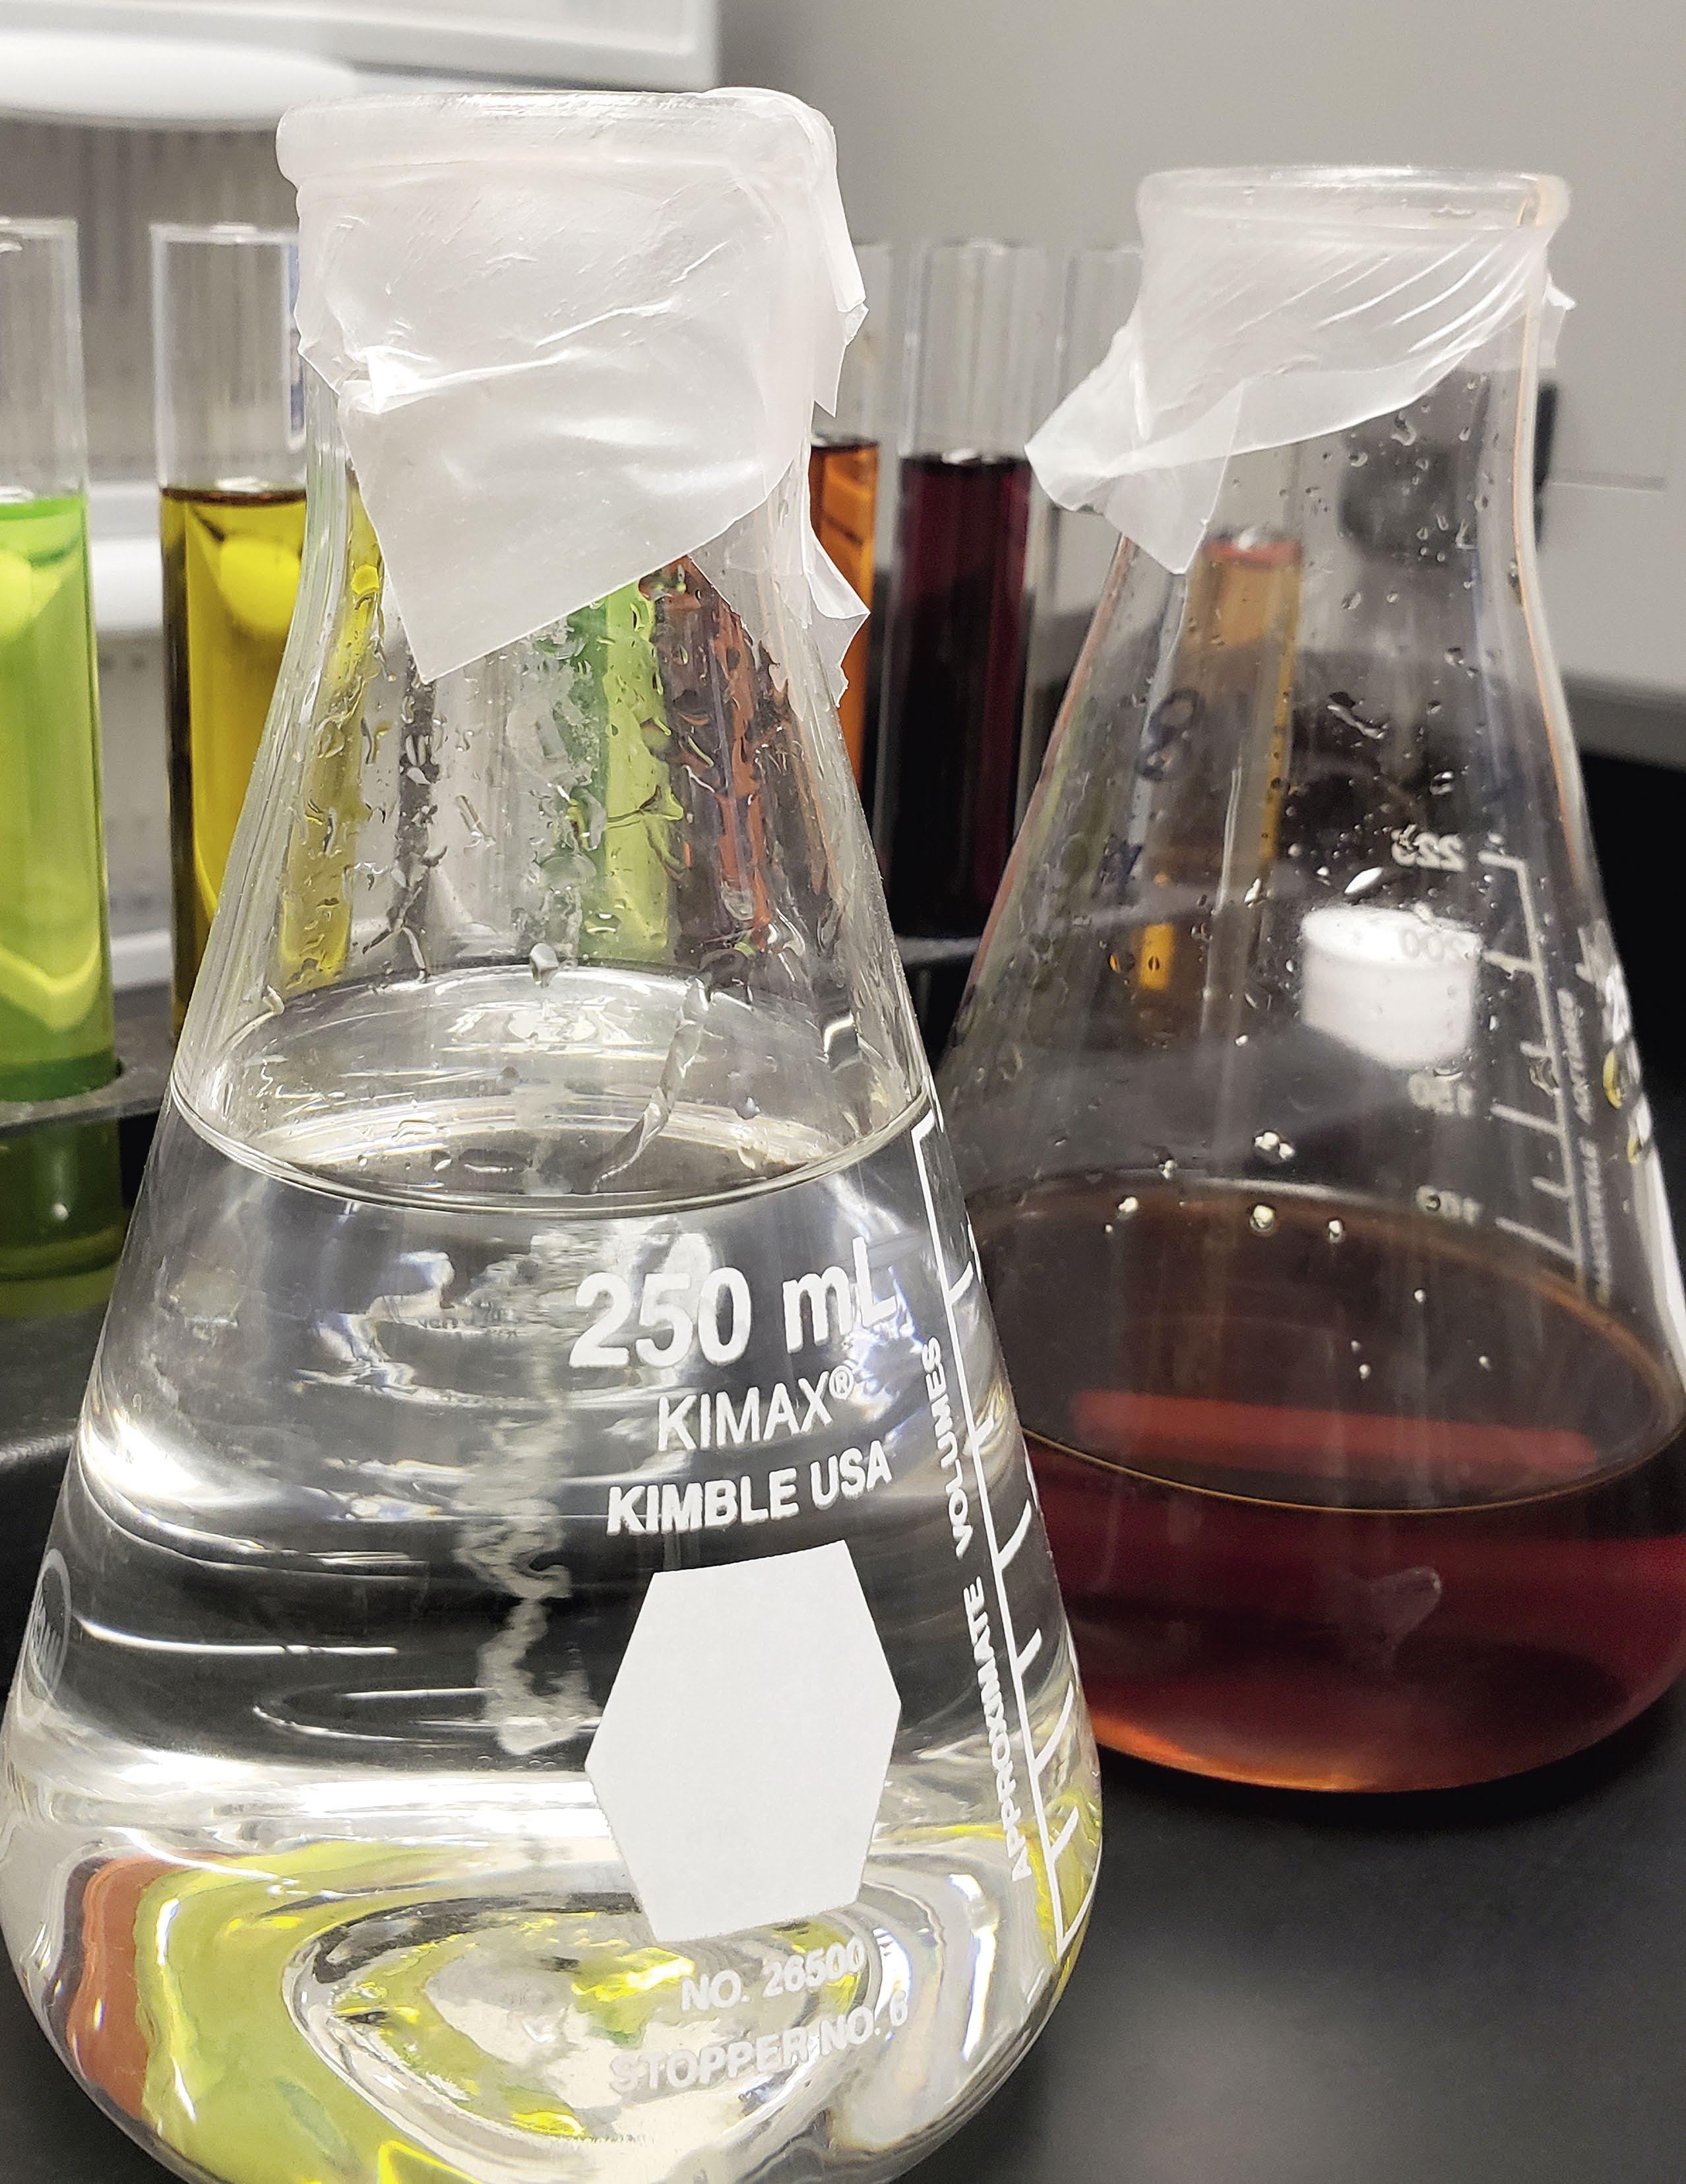
Laboratory testing of water treatment programs for scale and corrosion control are run and used for several purposes:
• To evaluate new inhibitors and treatments and predict field performance over a range of systems and operating parameters.
• To optimize treatments and determine the minimum effective dosage.
• To compare existing treatments to proposed treatments.
• To develop “technically accurate and appropriate” data for sales literature and promotion.
• To explore new areas, such as inhibitor interaction, with respect to synergy and antagonism.
Testing results should correlate well to field results under the same or similar conditions. This article discusses parameter selection and experimental test design. The goal is to avoid laboratory simulations that predict stellar results in a beaker but result in abject failure when applied in actual end user water systems.
Anecdotal History
On my (Robert Ferguson’s) first day at a new job with a major water treatment company in the early 1980s, a meeting was held to discuss discrepancies between minimum effective dosage in laboratory tests and dosages that actually worked in the field. The application under study was calcium carbonate scale control in high volume once-through condenser cooling systems. Dosages observed to prevent scale in the laboratory were approximately 3 to 10 times those found to work in the actual condenser cooling systems. A simple question resolved the dilemma:
Question: “What was the duration of the laboratory test, and what is the residence time where scale must be prevented in the condenser cooling systems?”
Answer: “Laboratory tests were run for 15 to 30 minutes, and the minimum dosage that prevented precipitation was noted. The condenser cooling system had a design residence time of 5.6 seconds.”
Developing and applying a “time” factor synchronized the dosages (1–3). The increase in dosage when time is increased from 6 seconds to 900 seconds has been found to be an increase of 240%. The increase from 6 seconds to 24 hours for the same inhibitor and conditions was calculated at 1,900%.
Matching the residence time by which an inhibitor must prevent scale formation and growth is a critical parameter that can make or break correlations of laboratory dosages to those actually required in the field.
Standard Tests
A popular test (4) for comparing inhibitor effectiveness against calcium carbonate scale is run at a high ionic strength from sodium chloride due to its origins as a test for oilfield brines. This test typically underestimates dosages for lower total dissolved solids (TDS) applications, such as cooling water.
This failure to correlate is due to the effect of ionic strength on scale potential, such as calcite saturation ratio, and on inhibitor effectiveness:
• As ionic strength increases, activity coefficients decrease, resulting in a decrease in driving forces for scale formation, such as calcite saturation ratio. The recommended dosage will decrease, typically as ionic strength increases, with all other parameters held constant (5). This effect is observed in the typical TDS range for commercial water treatment applications. At extreme TDS levels, activity coefficients actually increase as near effects gain control (6).
• As ionic strength increases, the dissociation constants for acid groups on inhibitors increase. This results in an increase in the percentage of an inhibitor in the active dissociated form. Lower dosages will then be recommended due to the higher percentage of active inhibitor under the higher TDS test condition than in the lower TDS field application (7).
Clean or Dirty?
Scale Control In laboratory simulations, many tests start out in sparkling clean beakers or with new polished heat exchangers. Scale formation must then proceed in multi steps:
• Seed crystal formation
• Seed crystal attachment or growth and attachment
• Growth on the existing substrate
Each step is unique and requires a different inhibitor model (8).
Seed Crystal Formation The saturation ratio must exceed the “activation energy” to overcome the barrier between aqueous-phase clusters and the solid-phase crystals or amorphous solids.
Deposition: Once this barrier is crossed, seed crystals must grow to a size where they attach to the system, thus forming a substrate with active sites for growth on an existing substrate.
Growth: Precipitated scale serves as a substrate for growth by aqueous-scale-forming molecule clusters. A lower energy (saturation ratio driving force) is required for growth on an existing substrate.
These steps define the rule of thumb that “It is easier to keep a clean system clean than to keep a dirty system from getting dirtier.”
Laboratory simulations in clean beakers or equipment simulate the seed crystal formation stage. Some researchers jump over this step by adding seed crystals (9)or by adding steel wool to non-scale active sites.
Dosages from studies in “clean” beakers may recommend lower dosages than necessary for an operational “dirty” system.
Corrosion Control Laboratory tests for corrosion inhibitors can be extremely misleading when run in clean, brand-new, shiny beakers with sandblasted coupons or pristine probes. The worst case of this phenomena as observed by the authors occurs with a neutral-to-slightly alkaline phosphate treatment with a new novel scale inhibitor thought to also have corrosion inhibitor properties. The combination provided superior results in the “sterile” laboratory environment.
Field results were disappointing for this approach. The effectiveness of this surface-active scale inhibitor was affected because it adsorbed on the system components, suspended solids, and other active sites. The inhibitor was also a nutritious “treat” for the field system microflora. Therefore, the fouled heat transfer surfaces required significantly higher inhibitor levels (phosphate) to inhibit corrosion under existing deposits.”
This failure to translate from beaker to operating system could have been prevented in many ways, one being an intermediate onsite pilot study.
Mine Fails Less Than Yours!
Promotional literature and advertisements may include test results comparing an inhibitor to competitive products under conditions where no inhibitor works. For example, if inhibitors are known to fail at saturation ratios above 150, and inhibitors are compared at a saturation ratio of 300, none of them will typically ever provide adequate performance in an operational treatment program. Theis type of testing can also be misleading, but the results do not necessarily relate to the performance or limits to be expected in the operational system.
The degree of “failure” is represented in these tests as percent inhibition. Less than 100% inhibitions demonstrates less than complete control (Equation 1).
% Inhibition = 100% x (Ca initial – Ca final)/Ca initial Eq. 1
It is strongly recommended that tests of this type be avoided. Simulations should be conducted under conditions matching those of the actual operational system as closely as possible. Failure limits should be evaluated, and treatments not applied above their failure points (10, 11).
The pharmaceutical industry uses statistical models to extrapolate the equivalent of % inhibition to 100%. These, or similar algorithms, have been employed in an attempt to extrapolate dosages to 100%. This approach is not recommended, as it can result in extrapolations implying that scale control by an inhibitor is achievable above its failure point.

Pilot Test Units
Pilot test units can come very close to duplicating an actual system. Onsite test units can use the same water source. In an ideal situation, laboratory tests might be run, and a preliminary dosage model developed (Step 1). In Step 2, dosages from the laboratory model will be evaluated on the pilot unit. Optimum dosage results will then be verified on the operating commercial system for Step 3. This sequence was used in the development and field verification of the first utility once-through cooling system ultra-low dosage models (2, 3, 12, 13).
Similar approaches and development sequences have proven successful in modeling open recirculating cooling water systems (14). The sequence for cooling tower systems might include laboratory screening tests and preliminary models, laboratory pilot units that vary from circulators to pilot cooling towers, pilot cooling systems in the field using the same makeup source, and verification through implementation on the operating system.
Care should be taken when shipping water to a laboratory pilot unit. The pH and carbonic equilibrium will shift. Microbial activity can further deteriorate and change the sample. Metals such as iron will not be reliable after shipping, and silica might become altered or adsorbed.
Matching Critical Parameters
A key to successful laboratory and pilot testing is determining and matching critical parameters such as:
• Residence time.
• Shear force against the tube wall.
• Temperature, including low end if scale control follows normal solubility, like barite.
• Active sites for growth on an existing substrate.
It is important to evaluate obvious parameters and match those relevant to your application.
Field Verification and Criteria for Success
The ultimate test for treatment is performance in the operating system. Establishing criteria for success is paramount in the final evaluation. Many evaluations have a success criteria of clean heat transfer surfaces (and/or other system components) upon physical inspection. Others have a criteria of no following factor increase (or, in the case of utility surface condensers, decrease in cleanliness factor).during the field evaluation.
Systems that operate by necessity under conditions where no treatment will provide maintenance of cleanliness and/or heat transfer might have a success criteria of an extended run between cleanings. Success criteria might also include improved cleanliness, as was the case with the first successful field biodispersant trials.
Formulating for Synergy
Inhibitor synthesizers and water treatment service companies and formulators have long claimed (or at least alluded to) synergistic formulations, which include the following:
• Synergy would be demonstrated if a blend of inhibitors had a higher failure point than either inhibitor applied as the sole inhibitor.
• If a blend of inhibitors performed better when either inhibitor was applied as the sole inhibitor, this would be demonstrated if induction time extension by the blend was greater than that expected for either inhibitor at the dosage.
The antithesis of “formulating for synergy” is “formulating for antagonism.” Here are two examples:
• If a blend of inhibitors had a lower failure point than either inhibitor applied as the sole inhibitor, antagonism would be demonstrated.
• If a blend of inhibitors provided poorer performance when either inhibitor was applied as the sole inhibitor, antagonism would be present. This would be demonstrated if the induction time extension by the blend was less than that expected for either inhibitor at the dosage.
Synergy and antagonism, and test methods for determining their presence, are discussed in References 15 and 16.
Summary
Laboratory tests for selecting and optimizing treatments for field applications should incorporate test parameters as close to those of the field as possible. Results of laboratory simulations should be correlated and synchronized to actual field performance. If the parameter causing a poor correlation is not apparent, evaluate mechanisms (e.g., initial seed formation, growth on an existing substrate) and independent parameters (e.g., time) to determine the missing variable. The tests should be adapted to reflect the impact of the missing parameter.
Evaluations should incorporate laboratory simulations, pilot evaluations, and onsite verification where possible. Onsite pilot evaluations are preferred when feasible.


