PRESENTING SPONSOR


2023
PRESENTING SPONSOR
No matter where you are in your journey, SRP offers rebates and programs that make finding and owning an EV easier than ever. Discover how to shift your focus and embrace lower emissions and lower costs.


Welcome to the Arizona Hispanic Chamber of Commerce’s 27 th annual DATOS: The State of Arizona’s Hispanic Market report breakfast.
The annual DATOS report is an essential resource that provides a unique and comprehensive analysis of the enormous economic impact of the Hispanic community and identifies key issues and challenges. It is also an important tool for identifying potentially powerful opportunities for future growth.

SRP is proud to be a long-standing partner of the Arizona Hispanic Chamber of Commerce and the critical DATOS research, demonstrating the significant contribution of the Hispanic community to Arizona’s landscape and economy. As business leaders and as a community, we have a responsibility to be inclusive and make sure everyone has an opportunity to share in our collective success.
As DATOS reminds us, we are stronger when we celebrate our differences and embrace the diversity that makes Arizona such a special place.
I hope that you find value in DATOS and all that it has to offer.

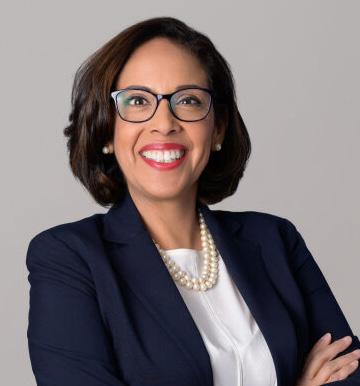
 STEVEN LOPEZ DATOS Honorary Chair Senior Director, Customer Strategy Salt River Project (SRP)
¡Bienvenidos! to the 27th annual DATOS
I am proud to introduce our 27 th DATOS: The State of Arizona’s Hispanic Market, which at 365 pages, is a clear indication that our state and our country are getting back to business and putting the devastating years of the COVID-19 pandemic in the rear-view mirror.
This year, Transportation (p.234) is the main DATOS focus, with seven InFocus features and four informative reprints plus a Special Transportation Feature from Univision Communications that explores Auto Insurance in Phoenix and Tucson, plus types of transportation Hispanics use, how far they travel and other interesting facts. Thanks to the commonly called Bipartisan Infrastructure Bill signed into law by President Joe Biden in November 2021, the U.S. transportation infrastructure is getting a massive overhaul.
Here is just a small piece of what the infrastructure bill is doing:
• investing $105 billion in public transit, the largest federal investment in history;
• earmarking $110 billion to fix crumbling roads and bridges, with measures to improve access for cyclists and pedestrians;
• making the largest federal investment in passenger rail since the creation of Amtrak in 1971; and
• electrifying thousands of school and transit buses across the country (see p.254 to learn about the Isaac School District’s experience); and creating a new Grid Deployment Authority to build a resilient, clean, 21 st century electric grid.
Our Transportation chapter has features from Valley Metro (p.252), TUFESA, the luxury Mexican bus company (p.256), and a look back with the Arizona Republic and La Voz at their transportation coverage (p.259). You also will learn about the incredible local economic impact of “America’s Friendliest Airport” (p.262), meet Joya Kizer, one of Sky Harbor’s most successful entrepreneurs (p.265) and get an insider’s view of rideshare from Lyft (p.267).
Each of the other 12 chapters have original, compelling articles that will make you proud of our community (meet Lynda Carter on p.28, January Contreras on p.203 and the AZHCC Entrepreneur of the Year Imelda Hartley on p.146). Personally, I am particularly proud of my work on the Community Collaborative (p.332), which started its new season on the STN network this month. These articles will entertain you; a few others—like the ones on two recent Supreme Court decisions (pp.92 and 355) and the horrors of human trafficking (p.223) and the fentanyl crisis (p.226)—will make you think.
So, sit down with your favorite bebida in your favorite chair and prepare to be amazed by how far we have come and sobered by the challenges still ahead. The optimist in me knows, however, that Arizona’s Latino community has the fortitude and resilience to overcome the challenges we face to continue to be a major positive force in Arizona and beyond.
¡Sí se puede!
MÓNICA S. VILLALOBOS
 President & CEO, AZ Hispanic Chamber of Commerce
Editor, DATOS: The State of Arizona's Hispanic Market PhotobyFonsecaPhotography
President & CEO, AZ Hispanic Chamber of Commerce
Editor, DATOS: The State of Arizona's Hispanic Market PhotobyFonsecaPhotography
(LISTED IN ALPHABETICAL ORDER BY COMPANY/ORGANIZATION)
DR. FRANCISCO
LARA-VALENCIA
ASU SCHOOL OF TRANSBORDER STUDIES
DR. LOUI OLIVAS
ARIZONA STATE UNIVERSITY
TARA JACKSON
ARIZONA TOWN HALL
ANDREA WHITSETT
ASU MORRISON INSTITUTE FOR PUBLIC POLICY
CHRISTINA TELLEZ
AZ REPUBLIC MEDIA
JOSEPH GARCIA
CHICANOS POR LA CAUSA (CPLC)
ELSA BELJEAN
CITY OF MESA
JAMES MONTOYA
CITY OF PHOENIX
SHARA GALONSKY
CLARITAS
MYRNA CARDENAS
EDUCATION FORWARD ARIZONA
KRISTEN STEPHENSON
GREATER PHOENIX
ECONOMIC COUNCIL
FRANCISCO AVALOS
LYFT
ERIC DIAZ
OYE! INTELLIGENCE
DALE BROWN
PHOENIX BUSINESS
JOURNAL
LUIS CORDOVA
ROUNDS CONSULTING
STEVEN LOPEZ
SALT RIVER PROJECT (SRP)
DR. MARIA R. CHAVIRA
THE ROMAN CATHOLIC DIOCESE OF PHOENIX
DR. BERT VALENCIA
THUNDERBIRD SCHOOL OF MANAGEMENT
SARAY LOPEZ
UNIVERSITY OF PHOENIX
JAIME BOYD
UNIVISION ARIZONA
JAIME HINOJOS
VANTAGE WEST CREDIT UNION
DAVID MARTINEZ III
VITALYST HEALTH FOUNDATION
GLENN IWATA
WESTGROUP RESEARCH
KATY GALLERT
WESTGROUP RESEARCH
DR. LOUI OLIVAS
SANDY FERNIZA
GEMA DUARTE-LUNA
RHONDA CARRILLO
EDITOR
CARMEN G. MARTÍNEZ
CREATIVE DIRECTOR
PAUL PADILLA
ASSOCIATE EDITOR
KAREN MURPHY
STAFF WRITER/
COPY EDITOR/PROOFREADER
GRACIELA MARTINEZ
BUSINESS RESEARCH ANALYST INTERN
MANUELA MONTOYA
BUSINESS RESEARCH ANALYST INTERN
In DATOS2023, the terms Hispanic, LatinX and Latino are used synonymously, as are Native American and American Indian and African-American and Black. White, non-Hispanic is sometimes referred to as non-Hispanic white. Hispanics may be of any race.
The information presented here was selected from standard secondary sources. However, data changes quickly and is not always collected annually. Data often offers a static picture of an ever-changing situation. The numbers calculated for any statistic depend on the definitions and assumptions used to produce them.
SALVADOR RIVERA
THYNKB


• THIS IS A COMPREHENSIVE COMPILATION OF SECONDARY RESEARCH MADE AVAILABLE TO THE AZHCC FROM VARIOUS SOURCES. IT IS EITHER PUBLIC INFORMATION OR USED WITH PERMISSION FROM THOSE SOURCES.
• PLEASE NOTE THAT THIS IS A SEARCHABLE PDF AND BY CLICKING CTL-F ON A PC OR COMMAND-F ON A MAC, A SEARCH BOX WILL APPEAR TO LOCATE ANY WORD OR PHRASE.


JUSTICIA SOCIAL
COHESIÓN SOCIAL / CULTURAL PARQUES Y RECREACIÓN
DISEÑO DE COMUNIDADES SALUDABLES
OPCIONES DE TRANSPORTE ACCESO A LA ATENCIÓN DE SALUD
EQUIDA D E N SALUD
RESI L I E NCIA
ELEMENTOS DE UNA COMUNIDAD SALUDABLE
ALIMENTOS DE CALIDAD A PRECIOS ACCESIBLES
VIVIENDA DE CALIDAD A PRECIOS ACCESIBLES

SEGURIDAD COMUNITARIA
CALIDAD DEL MEDIO AMBIENTE
OPORTUNIDADES ECONÓMICAS
OPORTUNIDADES EDUCATIVAS
Given how often data ends up challenging conventional wisdom, it’s almost funny how surprising an accumulation of facts and framing can be. This has held true with Hispanics and DATOS and it similarly applies to health.
Conventional thinking holds that health is the product of health care, subject to the influence of genes and personal choice. But the data tell a different story. The consensus finding of the World Health Organization (WHO) is that health care represents only about 10-20 percent of overall health. The science of epigenetics is clarifying that genetic profiles actually do not predetermine our individual fates. Meanwhile, public health officials worldwide agree that the choices we make are predicated by the choices we have.
In other words, health goes beyond health care. Health is everywhere — shaped by the contexts in which we live, work, learn and play. Many of health’s data experts assert that the strongest predictor of health and well-being is not your genetic code, but rather your zip code. In fact, conditions in neighborhoods separated by just a 10-20 minute drive in Phoenix have the capacity to affect life expectancy by up to 10-14 years. Phoenix is not an anomaly. Cities all over the U.S. share similar profiles.
These facts are not just attention-getting, they are also perception-shifting and empowering. They tell us that we have new options to improve health and well-being. We can call upon partnership with sectors like food, housing or transportation. We can delve into the health impacts of education and economic opportunity. We can extend ourselves toward impacting the visceral effect that social factors like isolation or toxic stress have on health. We can study how all of these factors are rooted by the cross-cutting issues of equity and resilience. We can use that knowledge to collaborate and integrate efforts among and across sectors. In so doing, we can be more powerful, more effective and more impactful in improving community health and well-being.
We are humbled to be partnered with the Arizona Hispanic Chamber of Commerce in order to more thoroughly understand what this approach can mean for the well-being of Hispanics. Part of the DATOS mission is to align perceptions of Arizona Hispanics with a data-based reality. Vitalyst’s Live Well Arizona goal is to realign perceptions with the facts as well — and to capitalize on that new understanding with cross-sector investments of time, talent and treasure that can propel Arizona to a more equitable, healthier future.
When it comes to honoring the Hispanic community’s unique assets and strengths within this new health paradigm, we couldn’t be more grateful to partner with DATOS
Here’s to a future of working together to improve community health and well-being for us all.
The Elements of a Healthy Community wheel was designed and produced by Vitalyst Health Foundation in collaboration with community partners. The elements are inspired by the work of the World Health Organization and the Centers for Disease Control and Prevention. To learn more, please visit VitalystHealth.org

1. The U.S. Hispanic population reached 62.5 million in 2021.
Source: U.S. Census Bureau
2. Hispanics were nearly one-third of the total Arizona population in 2021—at 32.3% of the total Arizona population (2.4 million).
Source: U.S. Census Bureau
3. Twenty-seven percent of U.S. Hispanic/Latino households earned $100K or more compared to 25% of Arizona Hispanic/Latino households.
Source: U.S. Census Bureau
4. If U.S. Latinos were their own economy, they would be the 5th largest economy in the world.
Source: Latino Donor Collaborative
5. Nearly half, 47%, of the Arizona K—12 student population is Hispanic.
Source: Arizona Department of Education
6. As of 2020, one in five students at U.S. postsecondary institutions are Hispanic.
Source: Pew Research Center
7. In 2021, Arizona had the 5th highest Hispanic homeownership rate in the U.S.— at 59.4%.
Source: The National Association of Hispanic Real Estate Professionals (NAHREP)
8. Seventy-one percent of Latinos purchased a home before the age of 45, compared to 64% of the general population.
Source: The National Association of Hispanic Real Estate Professionals (NAHREP)
9. In 2021, Arizona had the 24th lowest food insecurity rate among all 50 U.S. states and D.C.—at 10.3%.
Source: Feeding America
10. Among all U.S. counties, Maricopa County, AZ had the 4th highest number of food insecure people in 2021.
Source: Feeding America
11. From 2011 to 2021, heat-caused deaths in Arizona have increased by 146%.
Source: Arizona Department of Health Services
12. Hispanics/Latinos are 43% more likely than non-Hispanics/non-Latinos to live in areas in the U.S. where climate change will adversely affect work hours.
Source: United States Environmental Protection Agency
13. In 2021, nearly one-fifth of Hispanics (17.7%) in the U.S. did not have health insurance coverage.
Source: U.S. Census Bureau
14. Medicaid/CHIP is the largest source of coverage for Latino kids in Arizona; 52.6% of Latino kids in Arizona are insured by Medicaid/CHIP.
Source: UnidosUS and Georgetown University Health Policy Institute Center for Children and Families
15. Arrests of Hispanics accounted for more than one-fourth (26%) of the total arrests in Arizona in 2022—at 26% of the total arrests in Arizona.
Source: Arizona Department of Public Safety
16. In 2022, nearly one-fourth (24.2%) of hate crimes related to race in Arizona were anti-Hispanic or Latino.
Source: Arizona Department of Public Safety
17. About 60% of Households in the U.S. and Arizona have two or more vehicles.
Source: U.S. Census Bureau
18. The average commute time for workers in Phoenix was 26 minutes between 2017 and 2021.
Source: U.S. Census Bureau
19. Economic losses in Arizona from motor vehicle crashes summed up to over $20.1 billion.
Source: The Arizona Department of Transportation
20. Fatal motor vehicle crashes in Maricopa County increased 21% between 2020 and 2021.
Source: The Arizona Department of Transportation
21. Phoenix Sky Harbor International was the 12th busiest U.S. airport in 2022.
Source: United States Department of Transportation
PARKS AND RECREATION
22. Nearly one-third (32.2%) of U.S. outdoor participants in 2021 had an average annual income of $100K or more.
Source: Outdoor Foundation
23. Only 51% of U.S. Hispanics participated in outdoor recreation or in an outdoor activity in 2021.
Source: Outdoor Foundation
24. Arizona ranked as the 4th most dangerous state for pedestrians; averaging 2.98 pedestrian deaths annually (per 100K people).
Source: Smart Growth America and The National Complete Streets Coalition
25. In the next 30 years (by 2053), Arizona is projected to have the 13th largest increase in state cooling costs.
Source: First Street Foundation
26. U.S. Hispanics/Latinos who reported being two or more races increased by 567% in 2020 vs. 2010.
Source: U.S. Census Bureau
27. Streaming—particularly Netflix and YouTube—is the most popular TV source among U.S. Latinos; accounting for 43.6% of total U.S. Latino TV views.
Source: Nielsen Diverse Intelligence Series
28. Nearly 40% (37.9%) of Arizona Hispanic eligible voters are not yet registered to vote.
Source: KFF
29. Between 2020 and 2021, Arizona had the 3rd largest percentage decrease (-10.3%) in the prisoner population in the U.S.
Source: U.S. Department of Justice, Bureau of Justice Statistics (BJS)
There are a lot of moving par ts to running a successful small business optimizing cash flow, increasing efficiency, and growing revenue Find strategies and solutions that may help run your business at smallbusinessresources.wf.com.

ONE 1
TEN HUNDRED ONE THOUSAND
THOUSAND
1,000,000,000,000
57,276 Millions
How many zeros DOES A million have? 6 ZEROS
How many zeros does million have?
Therefore, one has to add 6 zeros to the number 57,276.
As a result:
57,276,000,000
Therefore, one has to add 6 zeros to the number 57,276.
• THE U.S. HISPANIC POPULATION IS ALMOST 20% OF THE TOTAL U.S. POPULATION
• MARICOPA COUNTY HAS THE 5TH LARGEST HISPANIC POPULATION OF ALL U.S. COUNTIES
• HISPANICS ARE ONE-THIRD OF THE TOTAL ARIZONA POPULATION
• NINE OF 15 COUNTIES IN ARIZONA ARE OVER 25% HISPANIC
• HISPANIC POPULATION GROWTH FROM 2010 TO 2021 FAR EXCEEDED THAT OF OTHER RACES/ETHNICITIES
• ARIZONA WAS FOURTH IN HISPANIC POPULATION GROWTH FROM 2000 TO 2021
• BY PERCENTAGE, NORTH DAKOTA HAD THE LARGEST INCREASE IN ITS HISPANIC POPULATION FROM 2000 TO 2021
• BY PERCENTAGE, MCKENZIE COUNTY IN NORTH DAKOTA HAD THE LARGEST INCREASE IN ITS HISPANIC POPULATION FROM 2010 TO 2020
• THE DOMINICAN POPULATION IN ARIZONA INCREASED BY 750% FROM 2000 TO 2021, THE HIGHEST PERCENTAGE INCREASE OF ANY OTHER HISPANIC DESCENT GROUP
• MARICOPA HAD THE 3RD LARGEST HISPANIC POPULATION INCREASE AMONG ALL U.S. COUNTIES FROM 2010 TO 2020
• THE VENEZUELAN POPULATION IN THE U.S. INCREASED BY OVER 620% FROM 2000 TO 2021, THE HIGHEST PERCENTAGE INCREASE OF ANY OTHER HISPANIC DESCENT GROUP
• HISPANICS REMAIN THE YOUNGEST COMPARED TO OTHER RACES/ETHNICITIES IN THE U.S.
• HISPANICS REMAIN THE YOUNGEST COMPARED TO OTHER RACES/ETHNICITIES IN ARIZONA
• U.S.-BORN HISPANICS ARE THE LARGEST GROUP OF U.S. HISPANICS
• THE NUMBER OF U.S. HISPANICS WHO IDENTIFY AS MULTIRACIAL HAS INCREASED SIGNIFICANTLY FROM 2010 TO 2021
• THE U.S. HISPANIC POPULATION IS EXPECTED TO INCREASE BY MORE THAN 66% BETWEEN 2025 AND 2060
Population chapter include comparisons from the U.S. Census Bureau’s 2000 Decennial Census, 2010 Decennial Census, 2020 Decennial Census and 2021 American Community Survey (ACS). Outcomes derived from these comparisons should be acknowledged with caution as each U.S. Census Bureau product has a different methodology. More information about comparing estimates can be found here
A broad overview of the Hispanic population in the Phoenix and Tucson markets, courtesy of Univision Communications
IN FOCUS
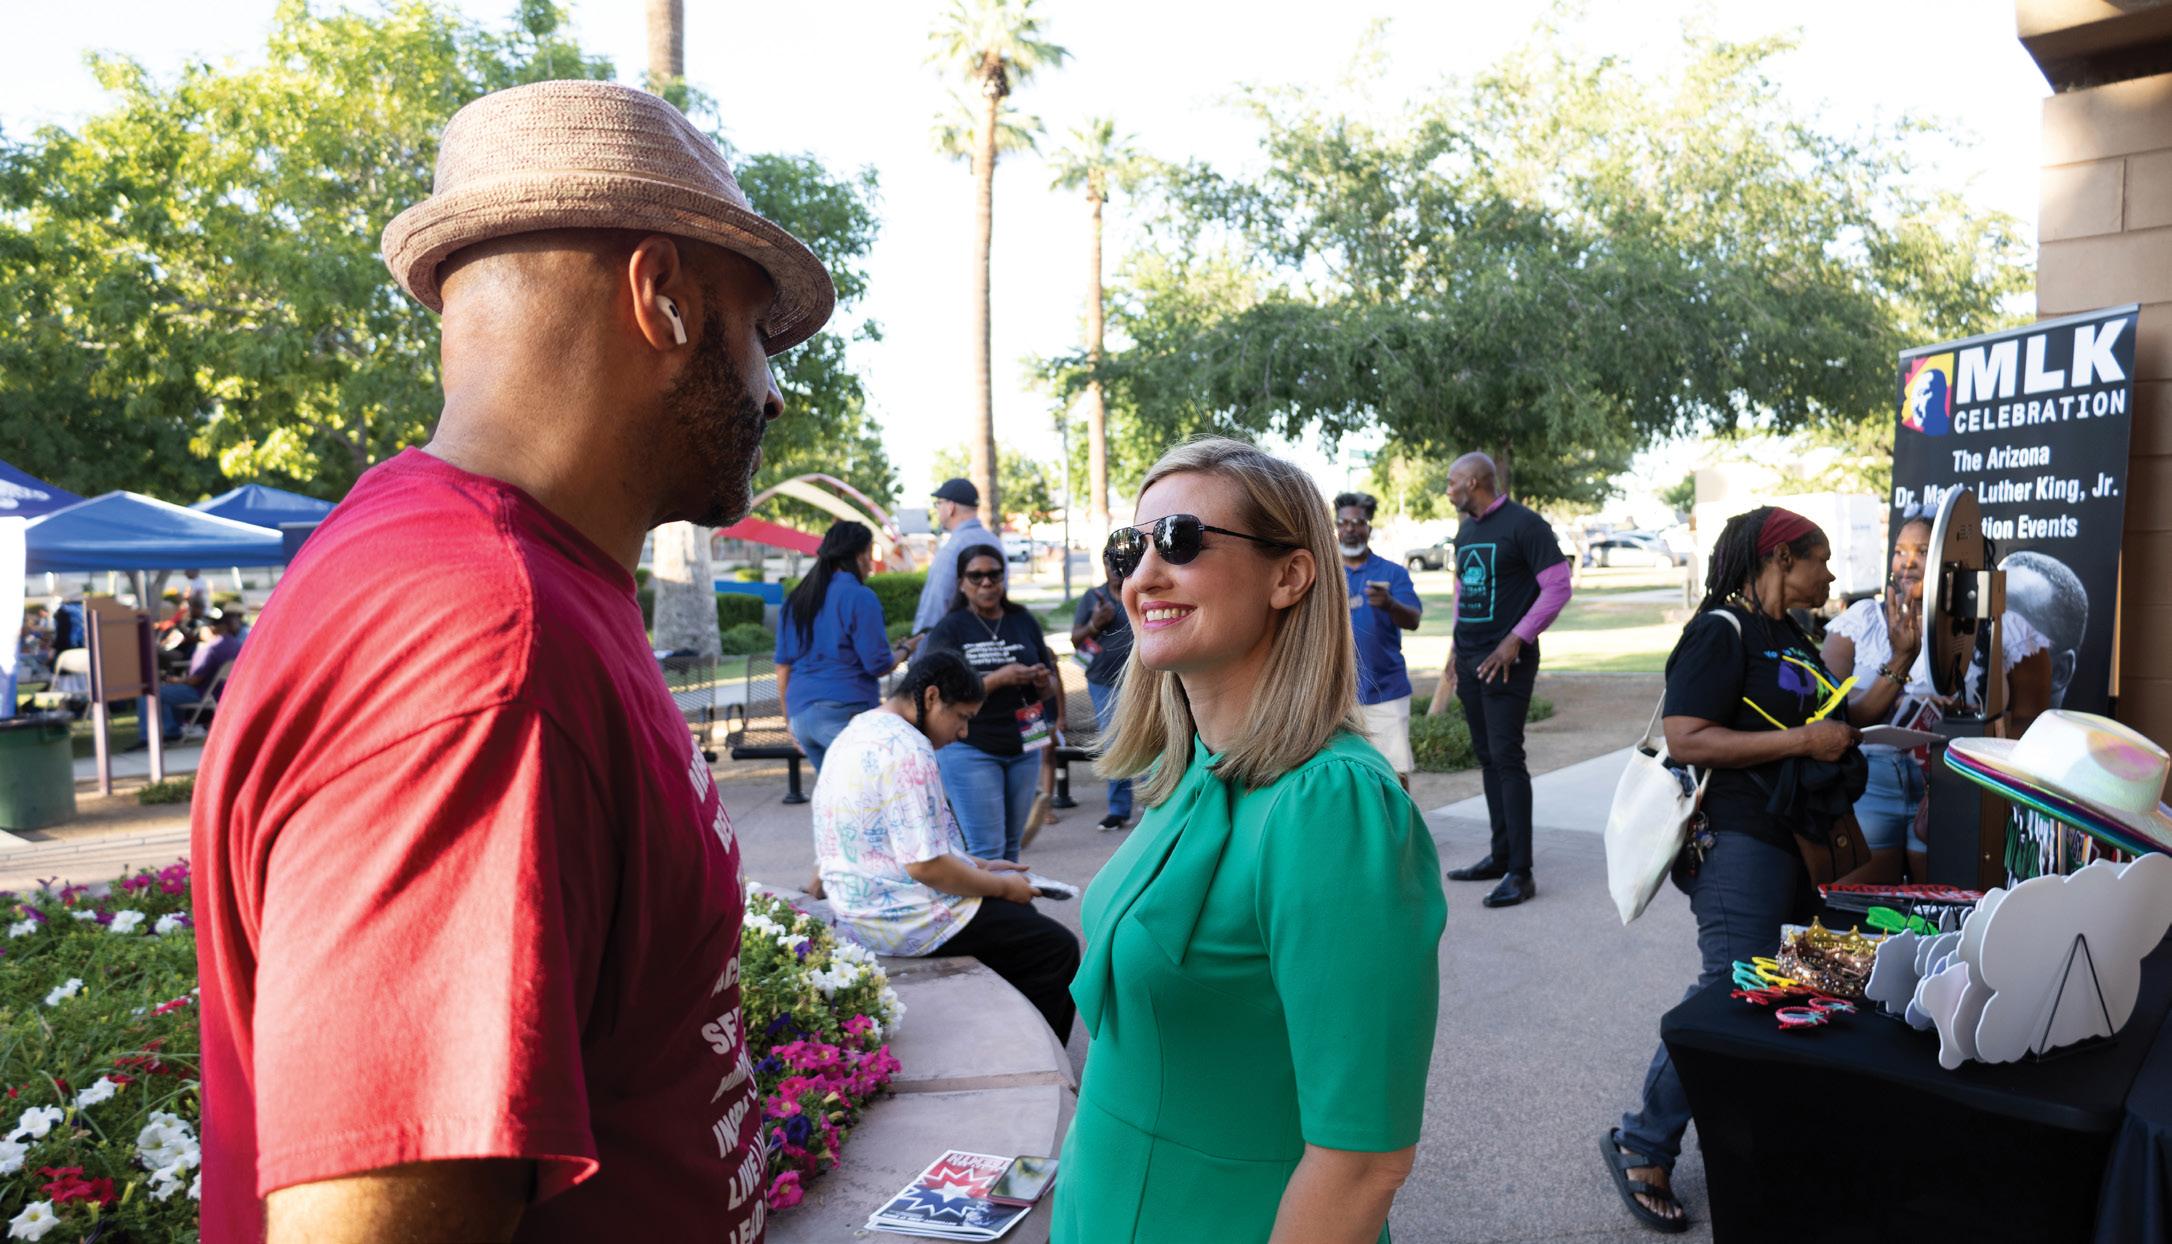
Everybody Counts: How the City of Phoenix Improved its Census Count
The city of Phoenix appealed its count—and won—which means the city will receive more accurate funding for crucial state programs
BY KATE GALLEGOIN FOCUS
Arizona-Mexico Commission
The commission has been working for more than 60 years to strengthen cross-border public—private collaborations
BY LORENA RUEDAIN FOCUS
Meet Lynda Carter
You probably know her for her iconic role as Wonder Woman—but Lynda Carter always been a superwoman in her real life
BY KAREN MURPHY
Some solid facts from Claritas about the Hispanic population in four key cities: Phoenix, Tucson, Flagstaff and Yuma

18.8%
HISPANICS ARE ONE-THIRD OF THE TOTAL ARIZONA POPULATION
2,351,124 3 2 % NON
4,925,192 68%
U.S. POPULATION CHANGE BY RACE/ETHNICITY (2010—2021)
Source: Pew Research Center, “Key facts about U.S. Latinos for National Hispanic Heritage Month,” Jens Manuel Krogstad, Jeffrey S. Passel and Luis Noe-Bustamante, September 23, 2022 www.pewresearch.org/short-reads/2022/09/23/key-facts-about-u-s-latinos-for-national-hispanic-heritage-month/
Sources: U.S. Census Bureau, 2000 Decennial Census DEC Redistricting Data (PL 94-171) data.census.gov/table?tid=DECENNIALPL2000.PL002
U.S. Census Bureau, 2021 American Community Survey 1-Year Estimates data.census.gov/table?tid=ACSDT1Y2021.B03002
TOP 10 HISPANIC DESCENT GROUPS WITH THE LARGEST HISPANIC POPULATION GROWTH IN THE U.S. (BY PERCENT, 2000—2021)
212.9%
212.4%
212.0%
208.1%
MEDIAN AGE OF U.S. POPULATION BY RACE/ETHNICITY (2000 VS. 2021)


NUMBER OF U.S. HISPANICS WHO IDENTIFY WITH MORE THAN ONE RACE (IN MILLIONS, 2010—2021)
THE NUMBER OF U.S. HISPANICS WHO IDENTIFY AS MULTIRACIAL HAS INCREASED SIGNIFICANTLY FROM 2010 TO 2021
Source: Pew Research Center, “Key facts about U.S. Latinos for National Hispanic Heritage Month,” Jens Manuel Krogstad, Jeffrey S. Passel and Luis Noe-Bustamante, September 23, 2022 www.pewresearch.org/short-reads/2022/09/23/key-facts-about-u-s-latinos-for-national-hispanic-heritage-month/

7 1 % of U.S. Hispanics agree that they wish they had more ways to show the world how proud they are of their culture and heritage. 2

8


 BY KATE GALLEGO
The COVID-19 pandemic presented countless challenges for communities and local governments. The 2020 Census Count, the once-in-a-decade population count that takes place across the nation, was among the many efforts that were affected. As folks were self-isolating to protect themselves from the virus and at a time when “social distancing” became the norm, the process of going door-to-door to initiate a critical population count was severely hindered.
Concerns about the Trump administration’s inclusion of a citizenship question additionally stymied responses. The city of Phoenix was concerned that some residents, especially in Black and Hispanic communities may have been missed. And, because the census informs key formulas for state funding for programs like Medicaid, nutritional assistance and education funding, getting the count as accurate as possible was imperative to our growing city.
Luckily, the U.S. Census Bureau provides a variety of recourse options, one of which is called the Post-Census Group Quarters Review (PCGQR). The city of Phoenix used this avenue to appeal to the bureau to revisit its totals from group living facilities—places like college dormitories, correctional institutions, nursing homes, rehabilitation facilities and shelters for people experiencing homelessness. The city made a diligent effort to ensure that the facilities were both within city boundaries as well as fully operational during the census count.
The city team submitted their findings to the Census Bureau in
February of this year with the hope to recover the missed numbers. In May, it was announced that Phoenix’s appeal was successful, making Phoenix the biggest city in the country to successfully pursue this review. While it is hard to calculate the precise dollar value of this outcome due to the many factors that go into funding distribution formulas, the city’s successful effort will benefit our diverse communities for years to come.
Specifically, this effort can have a positive impact through critical federal programs that allocate funds based in whole or in part on the total population. These include, but are not limited to, Medicaid, the Supplemental Nutrition Assistance Program (SNAP), Pell grants and housing grants. Here are a few examples of what the increased funding can do:
• Medicaid: Increased Medicaid funding can result in expanded healthcare coverage for disadvantaged communities and increased access to quality medical services for those who need it the most.
• SNAP: With higher funding for SNAP, families facing financial hardships can receive increased assistance to meet their nutritional needs, reducing food insecurity and promoting better health outcomes.
• Pell grants: A boost in Pell grants can open doors for more students of color to pursue higher education and achieve their academic aspirations without being burdened by excessive student loan debt.
• Housing grants: Greater funding for housing grants can facilitate affordable housing initiatives, making safe and stable living arrangements more attainable.
These are just a few examples of programs that may be positively affected by this process, which will help to improve the quality of life for all Phoenix residents. In addition, this process alerts the Census Bureau to the existence of group facilities that were overlooked in 2020, setting a foundation for a more accurate 2030 Census.
By securing fair and accurate representation, Phoenix has become a model for inclusive governance and proactive measures to address the needs of its diverse population—for its residents today and for future generations.
 BY LORENA RUEDA
The Arizona-Mexico Commission (AMC) is a one-of-a-kind crossborder governor’s office commission, whose mission is to improve the economic prosperity and quality of life for all Arizonans through strong, public—private collaborations. The AMC has a proven track record of collaboration, innovation and impact that spans more than six decades, working strongly with our Sonoran counterpart and throughout Mexico.
Arizona and Sonora have been great partners in ensuring that the megaregion continues to thrive. The commission has a legacy of unparalleled cross border success and is a model for cooperative binational coordination. Just this year, two major undertakings were achieved: the
Arizona-Sonora Border Infrastructure Master Plan, which helps the region identify and advance projects to sustainably relieve traffic congestion, reduce delays, enhance safety and security; promote international trade, ensure reliable travel times and improve the quality of life for residents in the border region; and the ArizonaSonora Environmental Strategic Plan, which identifies border priorities in air quality, water quality, waste management and wildlife conservation, addressing the most pressing transboundary environmental concerns. These initiatives, which are hallmarks of the work the AMC does, ensure that the megaregion remains competitive and forward thinking.
As a nonprofit membership organization, the AMC advances its initiatives through a board of directors chaired by Governor Katie Hobbs and through the tireless efforts of 16 binational committees. The commission tackles a range of issues from trade and commerce to infrastructure and tourism, forming collaborative cross-border partnerships that drive solutions and innovation to ensure continued economic prosperity.
As it celebrates nearly 65 years, the Arizona-Mexico Commission looks forward to advancing the governor’s vision of building an Arizona for everyone—through strong partnerships, forward thinking projects and a legacy of success.
Arizona-Mexico Commission (AMC) 100 N. 7th Ave., Suite 400 Phoenix, AZ 85007 602.542.1370 azmc.org
JOIN THE AMC
Individuals can join for $250/year and students can join for just $50/year. Annual sponsorships are also available from $1,500/year to $15,000/year. ectownusa.net/members/newmem/new-mem-reg. php?org_id=AZMC

tomanyasWonderWoman onthehitTVseries,LyndaCarter is much more than that. Inadditiontoherimpressiveacting career,shealsoisanaccomplished singerandtirelessactivist— andaproudLatinafromArizona. Here’swhatshehadtosayrecently abouthermusicalcareer,thelegacy ofWonderWoman,heradvocacy workandwhatsheisdoingrightnow.
BY KAREN MURPHY“I was still writing and recording music throughout my acting career, so it wasn’t so much a switch as it was an added art form. I loved roles that involved singing, especially when I had the chance to perform on WonderWoman.
“I have a new series of singles coming out in the next year—all original songs. I’ve had the privilege of writing and working with Grammy-winning songwriters and musicians and my amazing producer, Kyle Lehning.
“One of my favorite songs is Danny’s All-Star Joint by Rickie Lee Jones, which I covered for my last EP, Unexpected.”
“Wonder Woman is unique in the superhero genre because she was really the everywoman who happened to be a hero and she preferred to change hearts and minds over using force. I think
Actor Gary Burghoff (Radar O’Reilly in both the film M*A*S*H and the TV series) was the drummer for the band Lynda Carter and her two cousins formed in the 1960s called The Relatives?
Wonder Woman has taught so many people about the value of introspection and tapping into our inner strength.
“Asteria is such a special role. I love that she is part of Diana’s sisterhood but stands alone because of the sacrifice she made for her people. I think many women can identify with her story.”Editor’s note:CarterplayedAsteriainWonderWoman1984,whichcameoutin2020.
Became Miss World USA
Voted “The Most Beautiful Woman in the World” by the International Academy of Beauty and the British Press Organization Face of Maybelline Cosmetics
Lynda Carter’s musical TV special, Celebration, won an Emmy for Outstanding Achievement in Choreography (Walter Painter)
Hispanic Woman of the Year Award from The Hispanic Women’s Council in Los Angeles
Lifetime Achievement Award at the Gracies
The award, from the Alliance of Women in Media, honors outstanding individual achievement and programming by, for and about women
Given the 2,632 nd star on the Hollywood Walk of Fame (6562 Hollywood Blvd., Los Angeles )
Inducted into the California Hall of Fame
Carter lived in Los Angeles from 1972—1984.
Sor Juana Legacy Award
The award, from the National Museum of Mexican Art in Chicago, recognizes women of Mexican descent for their lifetime achievements and outstanding contributions to the arts.
July 24, 1951; born Lynda Jean Córdova Carter
Mexican (mother, Jean Córdova) and English/Irish (father, Colby Carter)
Two—James (born 1.14.88) and Jessica (born 10.7.90); both are lawyers. Jessica has also released two EPs, No Rules and For You. James is the director of publishing operations at Bethesda Softworks, a unit of ZeniMax Media.
Married to Robert A. Altman for 37 years until his death in 2021 from myelofibrosis, a rare form of leukemia. Altman was a lawyer who became the chairman and CEO of ZeniMax, a video game company that was bought by Microsoft in 2021. A previous marriage to Ron Samuels (1977—1982) ended in divorce.
Two—a brother, Vincent and a sister, Pamela Graduated from Arcadia High School in Phoenix; Attended Arizona State University, but dropped out to pursue music
At five years old in a Phoenix talent show; made her professional singing debut at age 14 in Tempe
Wonder Woman, in the TV series that ran for three seasons between 1975 and 1979
Four—Portrait (1978), rereleased in 2013 with two previously unreleased bonus tracks; At Last (2009); Crazy Little Things (2011); and Red, Rock N’ Blues (2018); Also wrote five original songs for the video game Fallout 4, in which Carter voices the character Magnolia
A supporter of abortion rights, LGBTQ+ rights, literacy and cures for Alzheimer’s disease (her mom died of the disease in 2013), myelofibrosis and breast cancer; has been the grand marshal for Pride Parades in Phoenix, New York and Washington, D.C.
Lynda Carter Online lyndacarter.com

Hollywood Walk of Fame walkoffame.com/lyndacarter
Jessica Carter Altman Online jessicacarteraltman.com
From Britannica Online Wonder Woman britannica.com/topic/ Wonder-Woman
Smithsonian American Women’s History Museum womenshistory.si.edu
NOTE: The museum has an expected physical opening in about 10 years.
Translational Genomics Research Institute (TGen) tgen.org
“Last year, I began partnering with the Translational Genomics Research Institute (TGen), which is based in Phoenix, to establish a fund for myelofibrosis research. Their scientists are working to develop drugs tailored to a genetic understanding of the disease and I have high hopes that people living with myelofibrosis will be able to live longer and manage in the dormant phase of the illness.
“I am so proud to be from Arizona and that this innovative research is taking place in my hometown.”
“I have a series of singles, all original songs, coming out in the next year.
“I am also on the advisory council for the Smithsonian American Women’s History Museum. In 10 years, I hope to be seeing our incredible work with the museum come to life.”
Karen Murphyis anAZHCC staffwriterand copyeditor/proofreader.

Pinpointing potential customers more precisely. Engaging with them one-onone more effectively. Turning them into loyal, paying customers more efficently. That's the Claritas Advantage.
Know more about who your best customers and prospects are with our industry-leading segmentations
Know more about how and where to reach your best audiences across devices and channels with the Claritas Identity Graph

Know more about what's working and improve what isn't with our near realtime analytics and advanced modeling capabilities
know morn.
identify i r optimize
Source: www2.claritas.com/Knowmore

Source: www2.claritas.com/Knowmore

Source: www2.claritas.com/Knowmore

Source: www2.claritas.com/Knowmore
Source: www2.claritas.com/Knowmore
Source: www2.claritas.com/Knowmore
Source: www2.claritas.com/Knowmore
Source: www2.claritas.com/Knowmore
Source: www2.claritas.com/Knowmore
Source: www2.claritas.com/Knowmore
• THE LATINO WORKFORCE DOUBLED THAT OF NON-LATINOS FROM 2010 TO 2020
• NEARLY 25% OF THE U.S. HISPANIC WORKFORCE WORKS IN MANAGEMENT, PROFESSIONAL AND RELATED OCCUPATIONS
• LATINOS DEMONSTRATED HIGHEST RATE OF NEW ENTREPRENEURS BY RACE AND ETHNICITY FROM 2010 TO 2021
• ALL UNEMPLOYMENT RATES ARE LEVELING OFF AT PRE-PANDEMIC LEVELS
• ARIZONA’S UNEMPLOYMENT RATE WAS CONSISTENT WITH THE U.S. FROM 2000 TO 2021
• LATINO HOUSEHOLD INCOME IN ARIZONA IS SLIGHTLY HIGHER THAN THE NATIONAL RANGE
• SINCE 2000, LATINOS HAVE EXPERIENCED THE LARGEST DROP IN POVERTY
• U.S. HISPANIC RETIREMENT ACCOUNT OWNERSHIP RATES ARE LOW COMPARED TO OTHER RACES AND ETHNICITIES
• HISPANICS IN THE U.S. CONSISTENTLY HAD THE LOWEST WEEKLY EARNINGS FROM 2000 TO 2021
• MEDIAN ANNUAL EARNINGS BY GENDER ARE LOWER IN ARIZONA COMPARED TO THE U.S.
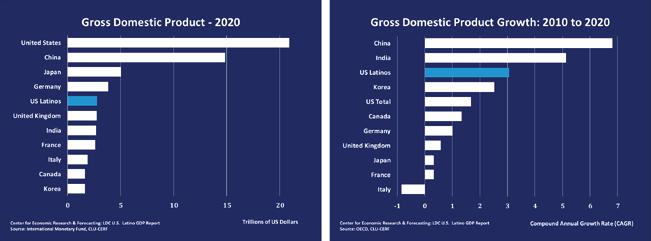
• U.S. LATINO GROSS DOMESTIC PRODUCT IS 5TH IN THE WORLD
• CONSTRUCTION IS A TOP 5 INDUSTRY FOR U.S. LATINO GDP, BUT NOT FOR U.S. TOTAL GDP
• CONSTRUCTION IS A TOP 5 INDUSTRY FOR ARIZONA LATINO GDP, BUT NOT FOR ARIZONA TOTAL GDP
• LATINOS LED IN U.S. GDP PERCENT GROWTH FROM TO 2010 TO 2020
• THE VALUE OF ARIZONA’S EXPORTS AND IMPORTS INCREASED SIGNIFICANTLY FROM 2013 TO 2022
• MEXICO IS ARIZONA’S TOP TRADING PARTNER FOR BOTH EXPORTS AND IMPORTS
• COMPUTER AND ELECTRONIC PRODUCTS ARE ARIZONA’S TOP EXPORT AND IMPORT SECTORS
A close look at the financial sector in the Phoenix and Tucson markets, from small business entrepreneurs and the employment outlook to how Hispanics spend their money, courtesy of Univision Communications
The Phoenix metro area is in a prime position to become a major player on the international stage
BY CHRIS CAMACHOArizona is grappling with significant disparities—and ranks poorly on women’s equality, executive and political representation
BY ALIKA KUMAR
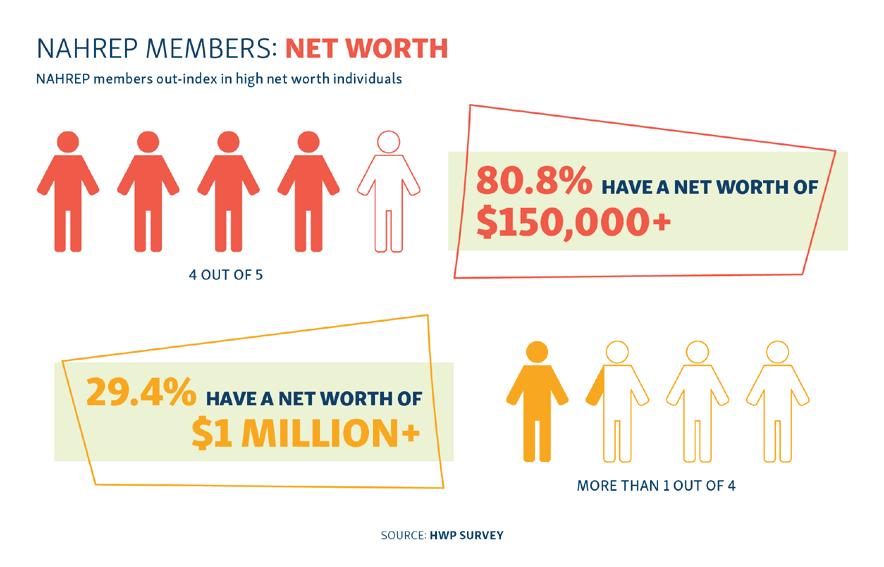
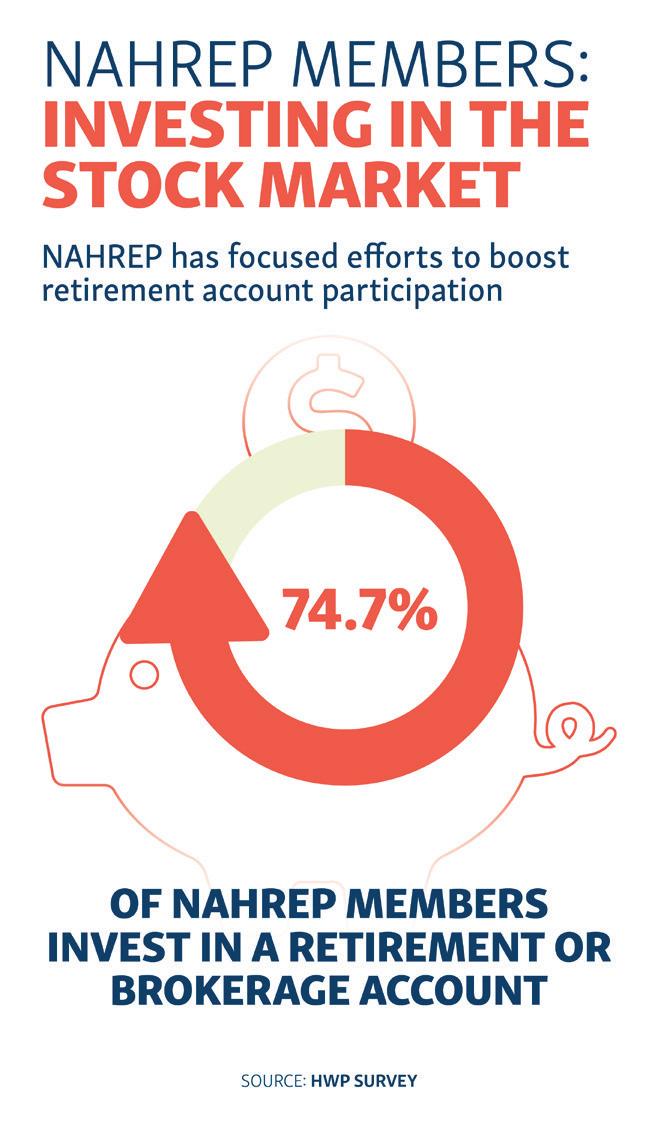
This annual report from The National Association of Hispanic Real Estate Professionals spotlights how Latinos are creating wealth and their progress in increasing their overall net worth
The Latino Donor Collaborative in partnership with Wells Fargo takes an in-depth look at the growing economic contribution of Latinos living in the United States. In 2020, the most recent year for which core data is available, that number reached an astonishing $2.8 trillion
This report, funded by the Bank of America Charitable Foundation, says that the 2018 GDP in the region was larger than the entire economy of states like Maine and North Dakota
This report, from the Eller College of Management at the University of Arizona, reports that Arizona’s overall trade worldwide was up 13.9% in 2021
NEARLY 25% OF THE U.S. HISPANIC WORKFORCE WORKS IN MANAGEMENT, PROFESSIONAL AND RELATED OCCUPATIONS
*NOTE: The rate of new entrepreneurs is the percent of individuals (ages 20—64) who do not own a business in the first survey month and start a business in the following month with 15 or more hours worked per week.
Source: Kauffman Indicators of Entrepreneurship, National Report on Early-Stage Entrepreneurship in the United States: 2021, Robert Fairlie, March 2022 www.kauffman.org/entrepreneurship/reports/early-stage-entrepreneurship-national-2021/
ALL UNEMPLOYMENT RATES ARE LEVELING OFF AT PRE-PANDEMIC LEVELS
ARIZONA’S UNEMPLOYMENT RATE WAS CONSISTENT WITH THE U.S. FROM 2000 TO 2021
Source: U.S. Bureau of Labor Statistics, Local Area Unemployment Statistics www.bls.gov/lau/rdscnp16.htm
LATINO HOUSEHOLD INCOME IN ARIZONA IS SLIGHTLY HIGHER THAN THE NATIONAL
NOTE: This data was retrieved from the 2021: ACS 1-Year estimate detailed tables and is in 2021 inflation-adjusted dollars. The 2021 ACS covers the calendar year, January 2021—December 2021.
Entrepreneurship Initiative, "State of Latino Entrepreneurship," Marlene Orozco and Jonathan Furszyfer, principal investigators, 2021 www.gsb.stanford.edu/sites/default/files/publication/pdfs/report-2021-state-of-latino-entrepreneurship.pdf
U.S. MEDIAN WEEKLY EARNINGS
MEDIAN
Source: U.S. Census Bureau, 2021 American Community Survey 1-Year Estimates data.census.gov/table?tid=ACSDT1Y2021.B24022
$60,775 $49,532 $11,243
UNITED
CONSTRUCTION IS A TOP 5 INDUSTRY FOR U.S. LATINO GDP, BUT NOT FOR U.S. TOTAL GDP
GROSS
(2020)
CONSTRUCTION IS A TOP 5 INDUSTRY FOR ARIZONA LATINO GDP, BUT NOT FOR ARIZONA TOTAL GDP
*NOTE: The Phoenix—Mesa—Scottsdale Metropolitan Statistical Area (MSA), is comprised of Maricopa and Pinal counties and covers nearly 14,600 square miles in South Central Arizona.
LATINOS LED IN U.S. GDP PERCENT GROWTH FROM TO 2010 TO 2020


Compared to Non-Hispanic Women
P lan t o St art o r Buy a Business in t he Ne xt 12 Mo nt hs.
Compared to Non-Hispanic Women
8 5 K+
1 8 0 % Latinas Non-Hispanic Women
Tucson Female Small Business Owners Ar e Latinas*
Lat inas Are +33% More Like ly t o Agre e w it h t he St atement: “I Wo uld Like t o Se t Up My Ow n Business One Day.”
Compared to Non-Hispanic Women


Small businesses and entrepreneurs are vital to thriving communities in Arizona and around the United States. At JPMorgan Chase, we are taking actions to support business owners and entrepreneurs in Black, Latino and Hispanic communities by:

• Providing additional loans

• Increasing access to coaching, technical assistance and capital
• Building on our supplier diversity efforts through additional spending with Black, Latino and Hispanic suppliers
jpmorganchase.com/dei
© 2023 JPMorgan Chase & Co.
Situated in the western United States between Mexico and Canada, Greater Phoenix boasts a prime location that positions businesses for seamless access to domestic and international markets. From an exceptional transportation infrastructure to a robust supply chain network, the region provides a wealth of opportunities for companies and emerging industries to thrive.
Greater Phoenix is home to an exceptional and modern transportation infrastructure that promotes rapid expansion. Seamlessly connected to major national and international markets through a vast network of highways, railways and air transportation, interstates I-10 and I-17 serve as lifelines for goods and services, providing easy access to markets in California, Texas and beyond. With proximity to major ports on the West Coast, including the Port of Los Angeles and the Port of Long Beach, Greater Phoenix offers the ability to access more than 35 million consumers within a single day truck haul.
International, regional and municipal airports provide direct access to markets across the globe. Phoenix Sky Harbor International Airport consistently ranks among the top 10 busiest airports in the U.S. and serves as a vital hub for air cargo and passenger traffic, shipping and receiving more than 900 tons of air cargo every day. With more than 140 destinations in the U.S. and around the world and more than 1,200 daily flights, businesses can effortlessly connect with their partners and customers worldwide. Meanwhile, Phoenix-Mesa Gateway Airport (PMGA) has expanded and now hosts more than 40 companies with direct connections to more than 60 domestic and international cities. PMGA is also home to SkyBridge Arizona, the nation’s first joint U.S.-Mexico customs inspection facility. The region’s cargo facilities, coupled with advanced customs processes, facilitate the smooth movement
Source: www2.claritas.com/Knowmore
of goods, making Greater Phoenix an ideal location for companies engaged in international trade.
Greater Phoenix’s strategic location and robust transportation infrastructure contribute to a thriving logistics ecosystem. The region’s proximity to the U.S.-Mexico border makes it a key gateway for trade with Mexico, one of our country’s largest trading partners. In 2022, Arizona exported more than $8.7 billion worth of goods to Mexico and imported $10.9 billion worth of goods from Mexico, making it the state’s largest trading partner market.
Expanding warehouse space and infrastructure around the Loop 303 has provided companies with the flexibility and capacity to handle their storage and distribution needs. With more than 160 million sq. ft. of industrial space and a vacancy rate consistently below the national average, the region offers companies the infrastructure necessary to support and maintain operations.
Through smart growth strategies and regional collaboration, Greater Phoenix has built a modern and dependable framework that allows for easy, reliable access to the region and consumers. The strategic location of Greater Phoenix significantly enhances supply chain efficiency, minimizing transit times and reducing costs. Companies can take advantage of the region’s exceptional logistics infrastructure to optimize shipping paths and ensure timely delivery to their customers.
Greater Phoenix is home to thriving industries that benefit from this strategic advantage. The region has established itself as a leader in aerospace and defense, advanced manufacturing, healthcare and bioscience, technology and logistics. The presence of industry
leaders, such as Boeing, Intel and Amazon, is a testament to the region’s potential and creates a supportive ecosystem for companies looking to tap into existing expertise and synergies.
In addition to its strategic location and robust infrastructure, Greater Phoenix offers a highly skilled and diverse workforce. The region is home to more than 5 million people, with a median age below the national average, ensuring a steady pipeline of talent for businesses. Its educational institutions provide a strong foundation for a knowledge-based economy and foster collaboration between academia and industry.
The pro-business policies and low-tax environment in Arizona make Greater Phoenix an attractive destination for companies. Arizona consistently ranks among the top states for business friendliness and offers incentives, such as the Quality Jobs Tax
Credit, to encourage job creation and capital investment. These policies create an environment conducive to innovation, growth and long-term success.
Chris Camacho is President and CEO of the Greater Phoenix Economic Council (GPEC).
Source: www2.claritas.com/Knowmore
“On average, women employed in the United States lose a combined total of nearly $1.6 trillion every year due to the wage gap. These lost wages mean women and their families have less money to support themselves, care for their families and communities and save and invest for the future. Families, businesses and the economy suffer as a result.”
—Fair Pay Report, NationalPartnership.org, March 2023
In a report titled “Persistent Economic Impact of Gender and Race-based Wage Disparities from Cradle to Grave,” published in 2019, we discussed the critical issue of gender and race-based wage disparities and their far-reaching economic consequences. The state of Arizona is grappling with significant disparities, ranking poorly in women’s equality, executive pay and political representation. To address these challenges, it is essential to implement policies that enforce equal pay, offer flexible work options and provide family support.
Women, especially women of color, continue to face a substantial wage gap compared to their male counterparts, leading to significant income disparities. For example, in February 2023, Forbes Advisor reported that women of color are among the lowest-paid workers in rural areas, with rural Black and Hispanic women making just 56 cents for every dollar that rural white, nonHispanic men make. Latinas were compensated just 54% of what non-Hispanic white men were paid in 2021; Black women were paid 58% of what non-Hispanic white men were paid in 2020; while Native American women are typically paid only 60 cents for every
dollar paid to white, non-Hispanic men. And still today, a 20-yearold woman just starting full-time, year-round work stands to lose $407,760 over a 40-year career compared to her male counterpart. These economic consequences reverberate through families from early life stages to retirement, creating a domino effect that impacts future generations.
Achieving gender parity and enacting legal protections for all women to have fair economic opportunities remains a pressing priority. The following update report aims to provide a comprehensive overview of changes and propose the necessary measures to tackle these persistent wage disparities.
Pew Research Center (PRC) finds that the gender pay gap has barely budged in past 20 years. The lack of progress could be because women’s work is valued less than men’s and determines wealth and power based on gender. According to a PRC survey conducted in October 2022, half of U.S. adults felt that women being treated differently by employers was a major reason why
2023: AN UPDATE ON THE PERSISTENT ECONOMIC IMPACT OF GENDER AND RACE-BASED
there was a gender wage gap, while others believed it was because women made different choices about how to balance work and family (42%) and worked in jobs that pay less (34%). However, it is arguable that women are faced with greater pressures such as family caregiving responsibilities. Research has shown that being a mother can reduce women’s earnings, while fatherhood can increase men’s earnings.i
Women aren’t promoted as often or as quickly as men
Women of color see wider pay gaps as they advance in their careers
Women of color see the fewest opportunities for advancement
Source: www2.claritas.com/Knowmore
Presently, gender gaps persist in education, health, work, wages and political participation globally. According to the World Economic Forum, women will not achieve equality with men for another 131 years, necessitating urgent action.ii In the United States, the gender and race-based wage gap is a major concern, particularly in Arizona, where the wage gap for female earnings lags behind male earnings by $8,452. Women of color face an even wider gap, with Latinas, Black women and Native American women earning significantly less compared to non-Hispanic white men.
The distribution of high-earning jobs favors men, leading to lower pay for women when doing the same job, especially at higher job levels and in certain occupations and industries. Though some progress has been made in closing the gap over time, persistent disparities persist.iii
Moreover, increased levels of education are not improving the wage gap, which persists even though women are more likely to have graduated from college than men. “In 2022, women with at least a bachelor’s degree earned 79% as much as men who were college graduates and women who were high school graduates earned 81% as much as men with the same level of education (PRC).iv For women, the pay gap worsens with age. This underscores the challenges faced by women of all education levels in closing the pay gap” (Center for American Progress).v
The COVID-19 pandemic highlighted the vital role women play in the economy and family economic security, but it also revealed the disproportionate impact on women’s employment. Postpandemic, women’s unemployment rates surpassed men’s, by 4.1%, necessitating attention to the specific challenges faced by women in the workforce (Forbes).vi
Persistent disparities perpetuate systemic discrimination, preventing women, especially women of color, from attaining financial security and career advancement.
The pay gap does not just affect women currently in the workforce. The American Association of University Women (AAUW) found that women reported a median retirement income of just $13,792, while
Women who are parents experience a larger pay gap
The longer people are unemployed, the lower their wages when they return to work—a gap which is wider for women
Women lose earning power as they age compared to men
Women are paid less than men regardless of their education
The gender pay gap is wider for women of color
Women are paid less than men as they move up the corporate ladder
men’s median retirement income was $24,289. The gender pay gap significantly affects women’s retirement savings, leading to lower Social Security benefits and pension benefits compared to men. Over time, the cumulative effect of lower wages while working translates to reduced retirement savings and overall wealth for women. On average, women receive 20% less than men in Social Security benefits.vii Women also tend to receive lower pension benefits than men, further intensifying the difference in retirement savings.viii The long term impact of reduced resources and wealth for women affects future generations who consequently do not have equal access to education, resources and opportunities.
From a business perspective, racial inequity costs companies $172 billion over a five-year period according to Society for Human Resource Management (SHRM).ix It is the cost of hiring and rehiring employees, who leave after short tenures due to deeply ingrained and systemic discrimination, microaggressions, lack of career advancement and often, hostile work environments.x
By empowering women and providing equal opportunities, we can unlock the full potential of the female workforce, leading to a stronger economy for everyone.
To address these challenges and promote gender and race-based wage parity, action is required and a wide array of strategies could be employed. These could include the following: Strengthening equal pay laws; pay transparency; expanding family-friendly policies; increasing representation and leadership opportunities for women; addressing educational disparities; eliminating workplace discrimination; and enhancing support for womenowned businesses are crucial steps towards creating a more equitable workforce and society.
Moreover, it is essential to promote equal pay for equal work, raise the minimum wage, guarantee quality healthcare, provide paid sick days and family leave, expand affordable childcare, protect workers from gender-based violence, uphold the rights of incarcerated women and encourage women’s political leadership.
Source: www2.claritas.com/Knowmore
It is clear, that women, families, the country and the economy cannot afford discrimination and lower wages. The consequences will most likely impact everyone.
The persistent economic impact of gender and race-based wage disparities demands sincere sustained attention and an intentional effort to create comprehensive solutions. Policy measures, such as federal reporting of pay by gender, race and ethnicity, prohibiting inquiries into pay history, posting pay bands during hiring and adequately funding enforcement agencies, can contribute to closing the pay gap. Additionally, policies that raise wages for most workers and reduce gender and racial/ethnic pay gaps are vital, including running the economy at full employment, raising the federal minimum wage and strengthening workers’ rights to collective bargaining for higher wages and benefits.
By implementing these strategies and policies, we can work towards achieving gender and race-based wage parity, benefiting not only women but also promoting overall economic growth and social equality for the entire nation.
Alika Kumar is Executive Director of the Arizona Minority Business DevelopmentAgency(MBDA) Business Center.
i Pew Research Center
ii Halving gender pay gap may boost developed and emerging markets GDP by 6%
iii 2023 Gender Pay Gap Report
iv The Enduring Grip of the Gender Pay Gap
v Center for American Progress
vi Gender Pay Gap Statistics In 2023 (Forbes Advisor)
vi Gender Pay Gap Statistics In 2023 (Forbes Advisor)
vii The Pay Gap Remains a Major Hurdle for Women
ix Society for Human Resource Management (SHRM)
x Supporting Women of Color… (Forbes)


Source: The National Association of Hispanic Real Estate Professionals (NAHREP) and the Hispanic Wealth Project, “2022 State of Hispanic Wealth Report,” Noerena Limón, Jaimie Smeraski, Julie Aguilar, Jovana Campos and Miriam Torres Sanchez (Sept. 23, 2022) hispanicwealthproject.org/annual-report/
Source: www2.claritas.com/Knowmore

Source: www2.claritas.com/Knowmore


Source: Latino Donor Collaborative, 2022 LDC U.S. Latino GDP Report, Dan Hamilton, Matthew Fienup, David Hayes-Bautista and Paul Hsu www.latinodonorcollaborative.org/original-research/2022-ldc-u-s-latino-gdp-report
Source: www2.claritas.com/Knowmore
www.LatinoDonorCollaborative.org

Source: www2.claritas.com/Knowmore
www.LatinoDonorCollaborative.org
Source: www2.claritas.com/Knowmore


Source: California Lutheran University and UCLA Health Center for the Study of Latino Health and Culture, “2023 Metro Latino GDP Report: Phoenix—Mesa—Scottsdale,” Dan Hamilton, Matthew Fienup, Paul Hsu and David Hayes-Bautista clucerf.org/2022-metro-latino-gdp/
Source: www2.claritas.com/Knowmore
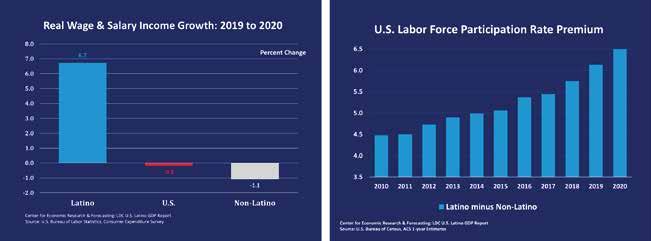
The 2020 LDC U.S. Latino GDP Report1 provides a factual view of the large and rapidly growing economic contribution of Latinos living in the United States. In that report, we estimate the U.S. Latino GDP based on a detailed, bottom-up construction which leverages publicly available data from major U.S. agencies. At the time of publication, the most recent year for which the core building block was available was 2018. Thus, the report provides a snapshot of the total economic contribution of U.S. Latinos in that year.
As a summary statistic for the economic performance of Latinos in the United States, the 2018 Latino GDP is extraordinary. The total economic output (or GDP) of Latinos in the United States was $2.6 trillion in 2018, up from $2.3 trillion in 2017, and $1.7 trillion in 2010 If Latinos living in the United States were an independent country, the U.S. Latino GDP would be the eighth largest GDP in the world. The Latino GDP is larger even than the GDPs of Italy, Brazil or South Korea.
While impressive for its size, the U.S. Latino GDP is most noteworthy for its extraordinary growth rate. Among the world’s 10 largest GDPs in 2018, the Latino GDP was the single fastest growing. Latino real GDP grew 21 percent faster than India’s and 30 percent faster than China’s. Over the entire period from 2010 to 2018, the Latino GDP was the third fastest growing, while the broader U.S. economy ranked fifth. Latino GDP grew a remarkable 74 percent faster than non-Latino GDP from 2010 to 2018.
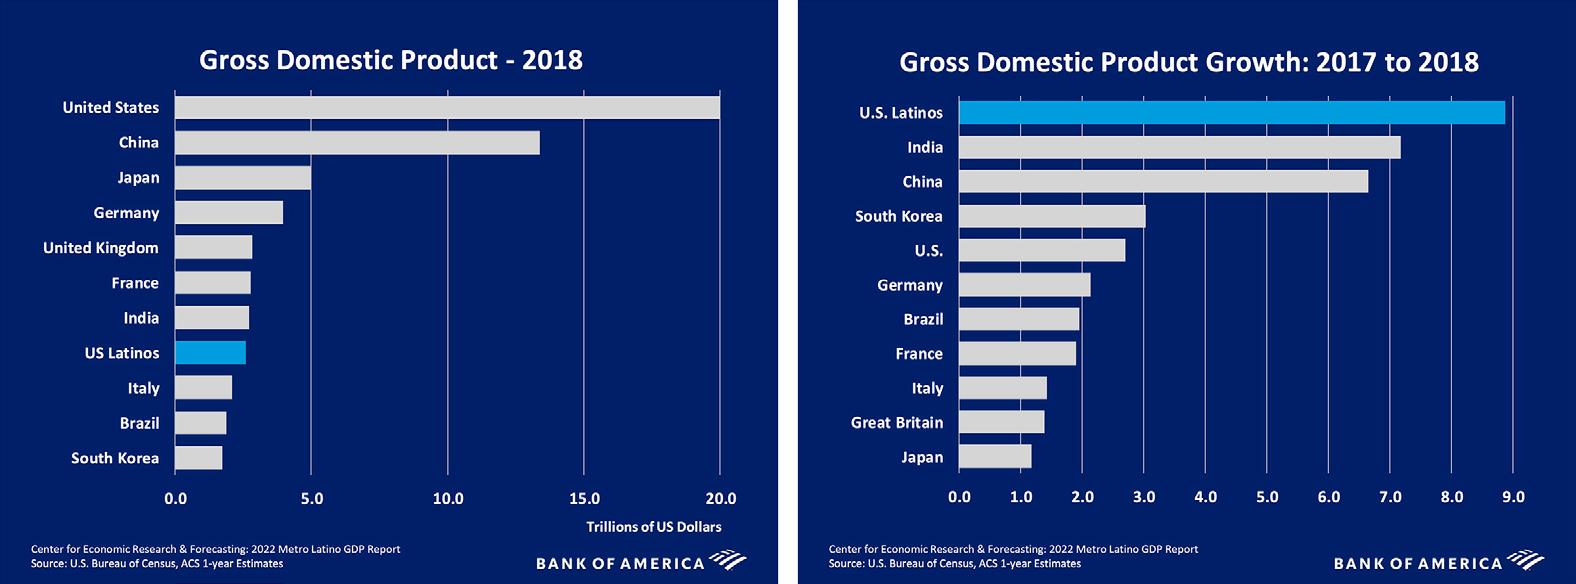
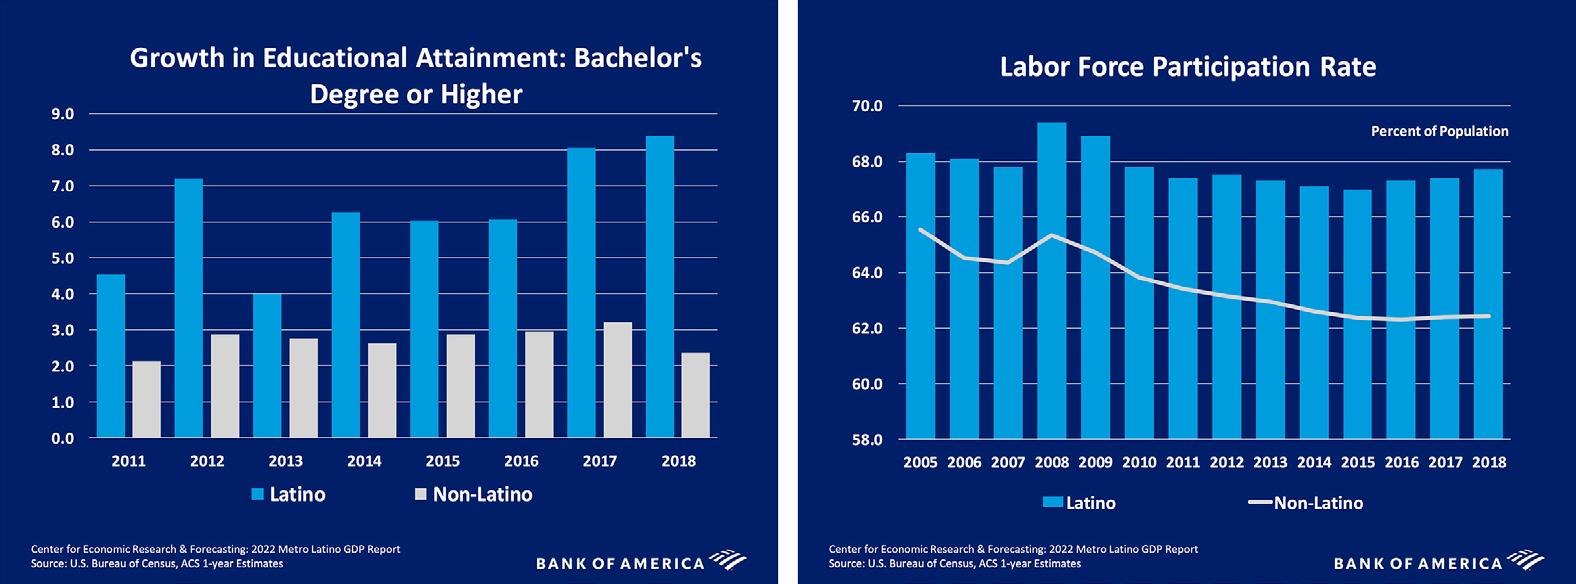
The single largest component of rapid Latino GDP growth since 2010 is personal consumption growth. From 2010 to 2018, Latino real consumption grew 135 percent faster than non-Latino consumption. This dramatic increase is driven by large gains in personal income, which naturally flow from Latinos’ rapid gains in educational attainment and strong labor force participation. Whereas the U.S. had average wage and salary growth of just 5.1 percent over the previous five years, wage and salary growth for Latinos averaged 8.6 percent. From 2010 to 2018, growth in the number of people with a bachelor’s degree or higher was 2.6 times more rapid for Latinos than Non-Latinos. And Latino labor force participation in 2018 was 67.8 percent, more than five percentage points higher than non-Latino
1 2020 LDC U.S. Latino GDP Report: https://www.clucerf.org/2020/09/28/2020-ldc-u-s-latino-gdp-report/

Source: www2.claritas.com/Knowmore
Metro Latino GDP: Phoenix – Mesa – Scottsdale MSA2
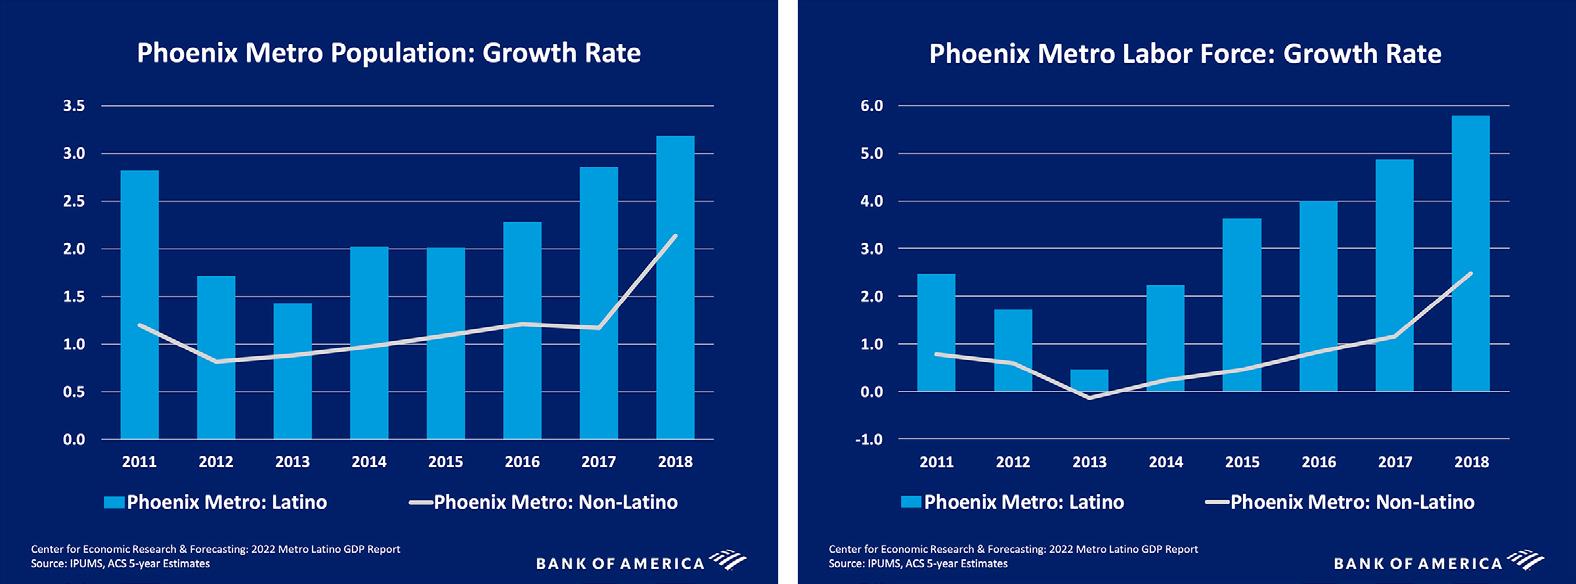
The Phoenix – Mesa – Scottsdale Metropolitan Statistical Area (MSA), is comprised of Maricopa and Pinal counties In 2018, the Phoenix Metro Area was home to 4 9 million people of all ethnicities, making it the ninth largest MSA in the nation. The Phoenix Metro Area is the eighth largest MSA by Latino population, with 1.5 million Latinos in 2018. Latinos comprise 31 percent of the total Phoenix Metro Area population
The 2018 Phoenix Metro Area Latino GDP is $65 1 billion, larger than the entire economy of states like Maine or North Dakota The largest component of the Phoenix Metro Area’s Latino GDP is personal consumption. Latino consumption in the Phoenix Metro totaled $44 5 billion in 2018, representing a consumption market larger than the entire economy of the state of Wyoming or Vermont
As in the state of Arizona at large, Latinos are making strong and consistent contributions to the Phoenix Metro Area’s population and labor force. The Phoenix Metro’s Latino population is growing at a rate 2 times that of Non-Latinos. Despite being only 31 percent of the Metro Area’s population, Latinos are responsible for 60 percent of the growth of the labor force.
2 In 2019, the U.S. Census Bureau changed the name of this Metropolitan Statistical Area (MSA) to the Phoenix-MesaChandler MSA.
Source: www2.claritas.com/Knowmore
Source: The University of Arizona, Eller College of Management, Economic and Business Research Center, “Arizona’s Trade and Competitiveness in the U.S.-Mexico Region 2022,” George W. Hammond azmex.eller.arizona.edu/news/2022/07/arizonas-trade-and-competitiveness-us-mexico-region-2022

Source: www2.claritas.com/Knowmore
Total trade (exports + imports) performance from 2020 to 2021 World $52.2 billion
13.9%
Mexico $17.6 billion (33.6% share)
12.5%
Canada $4.6 billion (8.9% share)
11.5%
China $5.2 billion (9.9% share)
34.6%
Trade performance 2011 through 2021 with World 47.1% Mexico 43.7% Canada 32.3% China 50.5%
–
Arizona’s trade with World 17.1% Mexico 3.1% Canada 11.9% China 39.1%
6 Economic and Business Research Center, Eller College of Management, The University of Arizona
Source: www2.claritas.com/Knowmore
79–85
• SINCE 2015, MORE THAN ONE-FOURTH OF STUDENTS ENROLLED IN U.S. PUBLIC SCHOOLS ARE HISPANIC
• HISPANICS ARE NEARLY HALF OF ARIZONA’S K-12 STUDENT ENROLLMENT
• BY 2030, HISPANIC STUDENTS ARE PROJECTED TO REPRESENT NEARLY 30% OF THE TOTAL STUDENT POPULATION IN U.S. PUBLIC SCHOOLS
• TEACHERS IN U.S. PUBLIC SCHOOLS WERE, BY PERCENTAGE, OVERWHELMINGLY WHITE FROM 2003 TO 2021
• THE HISPANIC HIGH SCHOOL GRADUATION RATE IN ARIZONA WAS LOWER THAN MANY OTHER RACIAL/ETHNIC GROUPS FROM 2018 TO 2022
• NATIVE AMERICAN AND HISPANIC STUDENTS IN ARIZONA HAVE THE HIGHEST RATES OF ABSENTEEISM
• LESS THAN 10% OF STUDENTS IN ARIZONA PUBLIC SCHOOLS ARE ENGLISH LANGUAGE LEARNERS
• AS OF 2020, ONE IN FIVE STUDENTS AT U.S. POSTSECONDARY INSTITUTIONS ARE HISPANIC
• HISPANICS ARE LEAST LIKELY TO BE ENROLLED IN COLLEGE OR HAVE A BACHELOR’S DEGREE
• COLLEGE ENROLLMENT IN ARIZONA
• SUPPORTING FAMILY IS THE GREATEST BARRIER TO PURSUING A FOUR-YEAR COLLEGE DEGREE FOR U.S. LATINOS
• THE MAJORITY OF PART-TIME U.S. UNDERGRADUATES ARE EMPLOYED
SPECIAL FEATURE Back to School
88 IN FOCUS 90 IN FOCUS 95 EXCERPT 92 IN FOCUS
EXCERPT 99 EXCERPT
105 EXCERPT 103
The Arizona Community Foundation and Its New CEO Have Big Plans
New president and CEO Anna María Chávez has always wanted to be a public servant and an advocate for those who need a little help to fulfill their dreams
BY LISA DANCSOK
At ASU’s Thunderbird School of Global Management, students are getting real-world experience as consultants to companies in all corners of the globe
BY MANUELA MONTOYAThe recent Supreme Court ruling that declared affirmative action in university admissions unconstitutional has forced U.S. universities throughout the U.S. to determine how to continue to encourage and support diversity on their campuses
BY KAREN MURPHYThis Spring 2022 report from Rounds Consulting Group says that Arizona can become a national hub of technology, research and innovation—if the state can meet the current workforce challenges
The coronavirus virus took a serious toll at all levels of education in the U.S., according to the U.S. Department of Education’s National Center for Education Statistics
This June 21 opinion piece reprinted from AZCentral.com hightlights the importance of an educated population to build the strength of Arizona’s communities and its economy
BY DR. STEVEN GONZALES AND MÓNICA VILLALOBOSThis 2022-2023 report from ALL in Education, says that the educational outcomes for Latino, Black, Indigenous and People of Color (BIPOC) students is where a failure to act on problematic issues is causing a corresponding gap in attainment


NOTE: Data in this table represent the 50 states and the District of Columbia. Race categories exclude persons of Hispanic ethnicity. Enrollment data for students not reported by race/ ethnicity were prorated based on the known racial/ethnic composition of a state by grade to match state totals.
Source: U.S. Department of Education, National Center for Education Statistics, Common Core of Data (CCD), "State Nonfiscal Survey of Public Elementary and Secondary Education," 1998-99 through 2020-21 and 2021-22 Preliminary; and National Elementary and Secondary Enrollment by Race/Ethnicity Projection Model, through 2030. nces.ed.gov/programs/digest/d22/tables/dt22_203.60.asp
TEACHERS IN U.S. PUBLIC SCHOOLS WERE, BY PERCENTAGE, OVERWHELMINGLY WHITE FROM 2003 TO 2021
Source: U.S. Department of Education, National Center for Education Statistics, Schools and Staffing Survey (SASS), "Public School Teacher Data File" and "Private School Teacher Data File," 1987-88 through 2011-12; SASS, "Charter School Teacher Data File," 1999-2000; and National Teacher and Principal Survey (NTPS), "Public School Teacher Data File" 2015-16, 2017-18 and 2020-21; and "Private School Teacher Data File," 2017-18 and 2020-21 nces.ed.gov/programs/digest/d17/tables/dt17_209.10.asp
BY 2030, HISPANIC STUDENTS ARE PROJECTED TO REPRESENT NEARLY 30% OF THE TOTAL STUDENT POPULATION IN U.S. PUBLIC SCHOOLS
*NOTE: The "four-year graduation rate" is the percentage of students who graduated within the first four years of enrolling in high school.
*NOTE: State of Arizona identifies a student as experiencing chronic absenteeism if a student misses more than 10% of a school's calendar days. A normal calendar is 180 days, therefore a student would need to miss in excess of 18 to be considered in this category.
REASONS WHY U.S. ADULTS DID NOT RECEIVE A FOUR-YEAR COLLEGE DEGREE (2021)
Source: Pew Research Center, “Hispanic enrollment reaches new high at four-year colleges in the U.S., but affordability remains an obstacle,” Lauren Mora, October 7, 2022 www.pewresearch.org/fact-tank/2022/10/07/hispanic-enrollment-reaches-new-high-at-four-year-colleges-in-the-u-s-but-affordability-remains-an-obstacle/
NEARLY 30% OF U.S. HISPANICS 25 AND OLDER HAVE A COLLEGE DEGREE


 BY LISA DANCSOK
The Arizona Community Foundation is Arizona’s only statewide community foundation, focusing on both urban and rural needs with a central office in Phoenix and regional offices that serve Cochise and eastern Santa Cruz counties, Flagstaff and northern Arizona, Graham and Greenlee counties, Sedona and the Verde Valley, Yavapai County and Yuma and western Arizona. Since 1978, through our personalized donor service model, we have provided charitable advice and fund management for thousands of donors in communities across the state.
In February 2023, ACF welcomed our new president and CEO, Anna María Chávez. Chávez grew up in rural Arizona and was taught by her parents that helping neighbors was essential. While various jobs took her as far east as Washington, D.C., where she held highranking civil service posts during the Clinton administration, she always valued the nonprofit sector and knew she wanted to be an advocate for girls and the elderly. She saw herself as a public servant, one who advocated and worked for individuals who were trying to do good every day.
Leading ACF, which is home to more than 2,000 donors that support the communities in which they live, was a dream come true for Chávez. Raised in the small community of Eloy, her passion has always centered around rural communities. Her ability to mobilize and collaborate is an important attribute for her new leadership role—and one she is excited to tackle.
ACF is the largest independent provider of scholarships in Arizona, awarding $5.4 million in 2022. This work, focused on helping young people across the state afford higher education opportunities, along with more than $114 million distributed in grants, scholarships and loans, sets ACF apart from other philanthropic entities.
The foundation provides funding and leadership in areas that include housing and homelessness, education and health innovations. This has set the stage for even more impactful work that Chávez will oversee as she leverages the ACF team, board and community partners to develop a strategic plan that will guide the work of the foundation over the next three to five years.
Lisa Dancsok is the Chief Brand and Impact Officer for the Arizona CommunityFoundation (ACF), Phoenix.
BY MANUELA MONTOYA
The Global Challenge Lab (GCL) began as a simple elective offered through Thunderbird School of Global Management at Arizona State University. It has since evolved into a required core course that all students in the master of global management (MGM) program have the opportunity to experience.
In the program, second-year MGM students gain unique, realworld business experience working as consultants at various corporations, public sector groups and nongovernmental organizations around the world. Although approximately 30% of the projects are centered in Latin America, GCL students also address growth-related issues in countries such as Mexico, Colombia, El Salvador, Ecuador and Brazil, in addition to projects in advanced markets such as Europe, Asia and the United States. Thunderbird Global Challenge Labs are offered in over 30 countries, with more than 200 clients and over 750 Thunderbird student consultants, confirming that it has become a successful worldwide initiative.
The experiential learning journey has three parts that must be completed within a seven-week academic term (summer or fall): Introduction and Data Collection, Discovery and Analysis and Analysis and Refinement. Part one begins with two weeks on-campus, during which students immerse themselves in the fundamentals of consulting. They initiate discovery calls with their clients, identify the current and ideal states of their clients’
businesses and become experts in their clients’ respective industries, regions and project scopes.
Following the on-campus phase, students travel to work with their clients onsite for the next three weeks, conducting primary research and interacting with key company stakeholders. During this time, students receive guidance and feedback from faculty, present mid-point deliverables and start analyzing the data collected during their research.
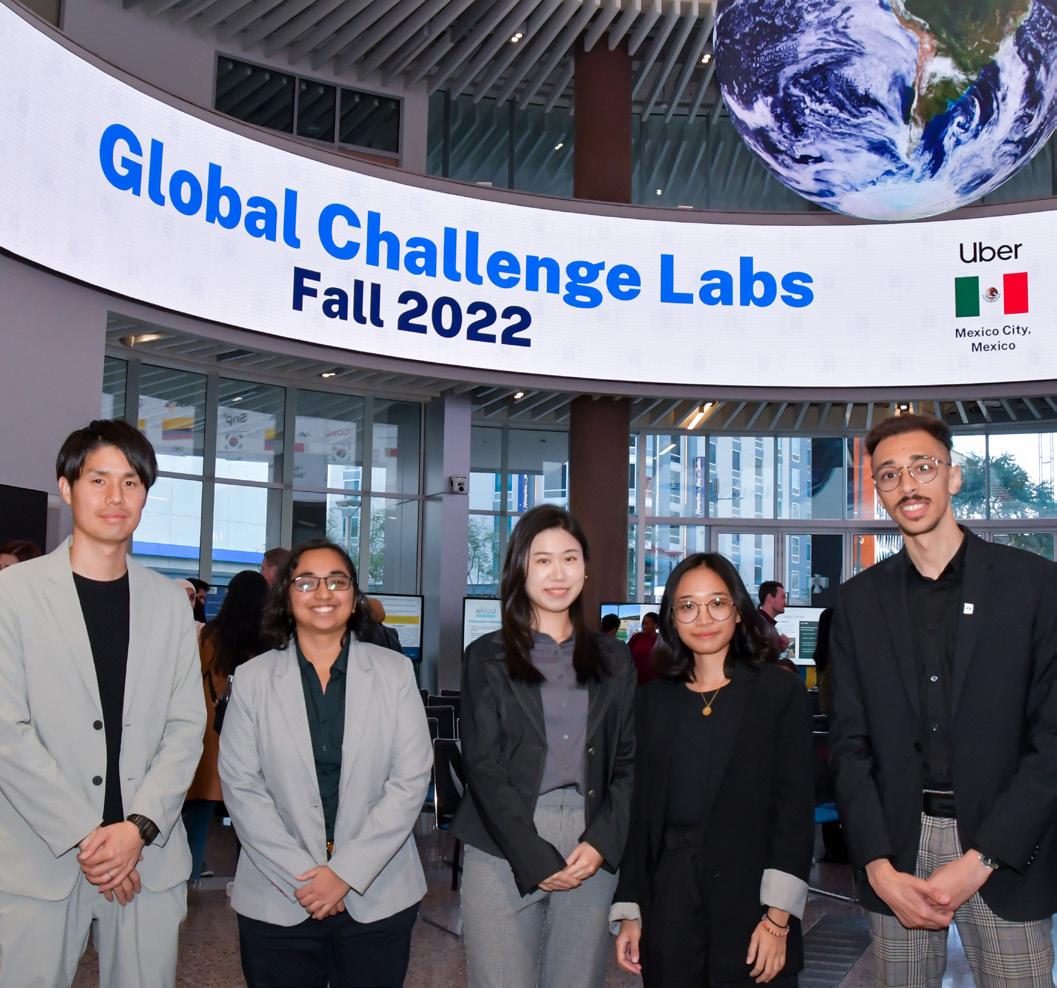
the GCL with their business challenges. Uber has worked with Thunderbird’s GCL students on several projects. It has already completed two projects and will do a third this fall 2023. Most recently, students developed a customer engagement and loyalty strategy for Uber that catered to both existing and future users.
In Colombia, the GCL partnered with both Banco Davivienda and Café Devoción. For the project, students analyzed the mobile money and remittances market to inform the bank’s digital growth strategy. For Café Devoción, a producer of Colombian coffee beans, the GCL team provided valuable insights that will guide future investment decisions, including insight on various aspects of the products, target audiences and marketing and progress tracking.
Moderna Alimentos in Quito, Ecuador, is another GCL success story. The GCL team’s comprehensive analysis, diverse brainstorming and innovative ideas laid the foundation for the Ecuadorian food company to make crucial investment decisions.
In the Analysis and Refinement phase, students are back on campus for two weeks. During this final phase, students organize their key insights, polish their final analysis and deliver it to their clients, encouraging their clients to consider adopting their recommendations. Finally, students complete their individual course assignments and then celebrate the project’s completion with the Thunderbird community.
The work GCL students do fosters team building and teamwork and guides students and their clients to embrace the different challenges of multicultural communications, professional growth and social development.
The GCL’s past projects showcase the breadth of the industries it serves, ranging from small start-ups to large multinational corporations. Transportation, food and financial services are just some of the many business sectors that have benefited from the GLC’s work. Notable companies like Uber, Jüsto (an online grocer based in Mexico City) and ScotiaBank Mexico have entrusted
Thunderbird aims to further expand the GCL’s reach. New partners, alliances and opportunities for growth continue Thunderbird’s mission to empower businesses across the globe.
Manuela Montoya is anAZHCC business research analyst intern.
BY KAREN MURPHY
The U.S. Supreme Court’s affirmative action ruling earlier this year sent shock waves through the high education community. On June 29, the U.S. Supreme Court, by a 6—3 vote breaking solidly along conservative/liberal lines, ruled that affirmative action in university admissions was unconstitutional in Students for Fair Admissions Inc. v. President & Fellows of Harvard College and StudentsforFairAdmissionsIncv.theUniversityofNorthCarolina (SFFA).
Sonia Sotomayor, the first Latina Supreme Court Justice, wrote in her 69-page dissenting opinion that the ruling “rolls back decades of precedent and momentous progress.” She also said, “At its core, today’s decision exacerbates segregation and diminishes the inclusivity of our Nation’s institutions in service of superficial neutrality that promotes indifference to inequality and ignores the reality of race.”
Surprisingly, according to a Pew Research Center survey conducted March 27—April 2 before the court’s decision, 50% of U.S. adults said they “disapproved of selective colleges and universities taking prospective students’ racial and ethnic backgrounds into account when making admissions decisions. Hispanics surveyed were equally divided with 39% on each side and 20% unsure (see chart on page 93).
Not surprising, when viewed along strictly political lines, the percentages were dramatically far apart: Only 14% of Republicans voiced approval for affirmative action while 54% of Democrats did. In June, before the ruling, a new Pew Research Survey found that Americans were “nearly three times as likely to say they strongly disapproved of colleges doing this (29%) as they were to say they strongly approved (11%).”
Long before the court’s ruling, in 1996, California was the first state in the U.S. to ban race-based affirmative action. Eight other states, including Arizona, then followed California’s lead: Washington (1998, rescinded 2022), Florida (1999), Michigan (2006), Nebraska (2008), Arizona (2010), New Hampshire (2012), Oklahoma (2012) and Idaho (2020). It is interesting to note that even though there is a wide gap between Republicans and Democrats on this subject, the states that had already dropped affirmative action break evenly among red, blue and swing states.
a July 27 article in the New York Times
Following the court’s ruling, a vigorous debate has begun on also ending legacy admissions, which are defined as giving preferential admissions treatment to the children of alumni. Just weeks after the court’s ruling, Wesleyan University, a liberal arts college in Connecticut, announced that it was ending its legacy
“The hindrance to higher education isn’t legacy admission, it’s a paywall that makes education a gift from parents to children or a debt sentence.”
—Melissa Byrne, a Democratic activist who has campaigned to make public undergraduate schools free and for the federal government to waive student debt, as quoted in
admissions. Other top tier schools, however, had already made that decision before the court’s ruling, including Johns Hopkins, Amherst, the University of California system, public schools in Colorado, Massachusetts Institute of Technology, Carnegie Mellon and the University of Washington. It seems highly likely that more schools will follow.
Students for Fair Admissions, the group that brought the lawsuits against Harvard and the University of North Carolina that led to the Supreme Court’s ruling has gone even further in its demands since this victory. According to Inside HigherEducation, the group “sent a letter to 150 colleges and universities with a list of demands
—U.S. Supreme Court Justice Sonia Sotomayor, in her dissenting opinion on the court’s ruling
% who approve/disapprove/not sure of selective colleges and universities taking race and ethnicity into account in admissions decisions to increase the racial and ethnic diversity at the school (March 27—April 2, 2023)
*Estimates for Asian adults are representative of English speakers only. NOTE: Black, Asian and White adults include those who report being only one race and are not Hispanic; Hispanics are of any race. No answer responses not shown.
Source: Pew Research Center, Survey of U.S. adults conducted March 27—April 2, 2023
“…[the Supreme Court’s] decision exacerbates segregation and diminishes the inclusivity of our Nation’s institutions in service of superficial neutrality….”
Half of U.S. adults disapprove of affirmative action
that went far beyond the realm of admissions offices and into recruitment, financial aid, scholarships, employment and data collection.”
In response to the high court’s ruling, Shirley J. Wilcher, the Executive Director for the American Association for Access, Equity and Diversity (AAAED), a national not-for-profit association of equal opportunity, diversity and affirmative action professionals, issued the following statement: “The Supreme Court is attempting to freeze in time the march toward racial diversity by invoking the 14th Amendment and asserting that this amendment, enacted to erase the vestiges of slavery, is color-blind to the continued scourge of racial discrimination and exclusion in the United States. By erasing 45 years of precedent, those who were intended to benefit are least likely to do so.”
There is no doubt that many more lawsuits will follow and ongoing spirited debate will continue as U.S. universities grapple with how to continue to encourage and support diversity and inclusion in their admissions process while not violating the Supreme Court’s ruling.
Students for Fair Admissions, Inc. v. President and Fellows of Harvard College supremecourt.gov/opinions/22pdf/20-1199_hgdj.pdf
American Association for Access, Equity & Diversity (AAAED) aaaed.org
From Britannica Affirmative Action britannica.com/topic/affirmative-action
From the American Civil Liberties Union Affirmative Action aclu.org/issues/racial-justice/affirmative-action
From the Harvard Business Review (July 12, 2023) What SCOTUS’s Affirmative Action Decision Means for Corporate DEI hbr.org/2023/07/what-scotuss-affirmative-actiondecision-means-for-corporate-dei


Since 2008, the Arizona economy has become more diversified. Efforts made by public and private sector stakeholders to implement aggressive economic development policies and initiatives led to expansions in high value industries including manufacturing, financial activities, healthcare and professional and business services.
However, Arizona’s education system is struggling to keep pace with the demands of our rapidly evolving economy. Arizona trails the national average in key measures of educational attainment. While the public university system has scaled-up quickly to educate and train more students – especially in STEM fields vital to the New Economy – it is apparent that growth will not meet the workforce demands now required.
This report endeavors to review several core questions about the relationship between Arizona’s economic performance and post high school education:
• How is Arizona’s economy performing vs the national economy?
• Can Arizona reach national performance in key economic quality measures?
• How limiting is the lack of in state post-high school educational attainment to Arizona’s continuing economic performance?
• Is Arizona’s continued economic performance at risk due to a lack of post-high school educational attainment?
While each of these questions is answered in detail, the bottom line is despite strong economic growth in terms of volume, Arizona has yet to reach its full potential. Arizona continues to trail the national economy in key quality measures such as per capita GDP, and unless Arizona sees significant improvements in degree prod uction either through in-state education or through in-migration, current economic output levels are at risk.
With additional targeted investment in workforce development , including postsecondary education, Arizona will be well-positioned to attract competitive industries with high relative pay and opportunity for advancement. As documented by this study, Arizona would reap a sizable economic return on its investment.
The reason is two-fold – a better-educated citizenry not only earns more and generates greater economic growth, it also utilizes social services and government welfare at a much-reduced rate. The fiscal impacts are staggering…

Simply by reaching the U.S. average for educational attainment, Arizona would benefit by nearly $5 billion in additional state and local tax revenues over ten years.
Furthermore, fully resolving the bachelor’s degree shortage would result in a 10-year cumulative state and local fiscal impact of $8 billion.
The needed boosts in workforce development and educational attainment will not occur by happenstance. It will require a coordinated effort involving state and local policymakers; private employers; public and private universities, community colleges and technical schools; Arizona’s K -12 system; non-profits; and more. Each entity will need to play a specific role.
Arizona has an opportunity to become a national hub of technology, research and innovation. However, unles s our state meets the workforce challenges inherent in these growing industries, Arizona’s potential will be severely constrained by labor shortages.
In order to develop the workforce Arizona needs, efforts are necessary across post-secondary education – and earlier, through enhanced emphasis on skills development and technical education in high school. The consequences of inaction are equally stark. Between now and 2030, Arizona will experience an annual shortfall of 26,300 bachelor’s degrees. That means 26,300 jobs will not develop or go unfilled. This translates into reduced capital investment, fewer quality jobs and less economic opportunity for Arizona families.
This investment is a crucial opportunity for Arizona and it is essential that the state’s public universities, business organizations, economic development leaders and state and local policymakers work together to ensure Arizona reaches its potential – to the benefit of everyone in the state.
This analysis makes clear the crossroads ahead and the opportunity for Arizona’s future. We are called to act As leaders of Arizona’s business organizations, we are eager to work together with the universities, policy and economic leaders to advance the future of our state.
As previously addressed, state policymakers will need to work on the full continuum of academic achievement, from high school graduation to community college and trade schools to university degrees. While this specific report monetizes the benefits related to closing the educational attainment gaps, extra emphasis was placed on bachelor’s degrees.
It is recommended that further research be completed at the community college and trade school levels. It is also recommended that additional research be conducted on what specific proposals should be listed and then placed in a proper queue in order to close the achievement gaps that are listed and monetized in this analysis.
In other words, the intent of this review is to highlight the opportunities (and potential losses) related to closing the achievement gap. The next step is to identify the specific projects that need to be implemented so the state can benefit at the levels calculated in this report.
Note: This report was made possible with support and cooperation from the state’s business community organizations.


The emergence of the coronavirus pandemic brought major disruptions to all levels of education. One important component of early childhood services is formal schooling, such as preschool and kindergarten. Between 2019 and 2020—in the first year of the pandemic—the school enrollment rate for 3- to 4-year-olds fell 13 percentage points to 40 percent, while the enrollment rate for 5-year-olds fell 6 percentage points to 84 percent ( Enrollment Rates of Young Children).
Similarly, for students in prekindergarten through grade 12, between fall 2019 and fall 2020, total public school enrollment dropped from 50.8 million to 49.4 million students. This 3 percent drop brought total public enrollment back to 2009 levels (49.4 million), erasing a decade of steady growth. The 2020 drop in public school enrollment was concentrated among those in grades prekindergarten (preK) through 8 (Public School Enrollment).
At the postsecondary level, undergraduate enrollment was declining before the pandemic (a decrease of 0.9 million students, or 5 percent, over a period of 10 years between 2009 and 2019), but during the pandemic it decreased by 0.7 million students (or 4 percent) between 2019 and 2020 alone (Undergraduate Enrollment). In contrast, total enrollment in postbaccalaureate programs (such as master’s and doctoral programs) increased by 8 percent between 2009 and 2019 (from 2.8 million to 3.1 million students). It continued to increase between 2019 and 2020, by another 2 percent (67,300 students) (Postbaccalaureate Enrollment).
Based on reports from adults who had household members planning to take classes from a postsecondary institution in fall 2021, plans for postsecondary education were disrupted to a lesser extent than they were one year earlier in the pandemic. Specifically, 44 percent of adults reported that there was no change for any household member in their fall 2021 plans for postsecondary classes, compared with 28 percent who reported no change to fall 2020 plans. Despite this improvement, it is worth noting that a majority of adults in households with prospective postsecondary students reported some change to fall 2021 plans due to the pandemic, over a year after its emergence in the United States. Nearly one-third (32 percent) reported that the classes would be taught in different formats in the fall (e.g., formats of instruction would change from in-person to online), 16 percent reported that all plans to
take classes in the fall had been canceled for at least one household member, and 12 percent reported that at least one household member would take fewer classes in the fall.1 (Impact of the Coronavirus Pandemic on Fall Plans for Postsecondary Education)
In addition to presenting data on how the pandemic might have influenced education choices and school enrollment, the Condition of Education Indicator System presents a picture of a U.S. education system that serves a diverse population of students across a variety of school settings. Of the 49.4 million students who were enrolled in public elementary and secondary schools (preK through grade 12) in fall 2020, some 22.6 million were White, 13.8 million were Hispanic, 7.4 million were Black, 2.7 million were Asian, 2.2 million were of Two or more races, 0.5 million were American Indian/ Alaska Native, and 180,000 were Pacific Islander (Racial/ Ethnic Enrollment in Public Schools). Among public school students, 7 percent attended public charter schools in fall 2019, reflecting a steady increase over the prior decade ( Public Charter School Enrollment). Despite overall increases in K–12 enrollments in public schools between fall 2009 and fall 2019 ( Public School Enrollment), the number of students in traditional public schools decreased over this period (Public Charter School Enrollment).
The health of an education system is often assessed through indicators of achievement and attainment. The national trends in reading and mathematics achievement show improvement at ages 9 and 13 between the 1970s and 2020.2 However, average scores for 9-year-olds were not measurably different for either subject in 2020 compared with the previous assessment in 2012. For 13-year-olds, the
1 Because this survey is designed to represent adults 18 years old and over, the estimates indicate the percentages of adults in households with prospective postsecondary students who reported a given change, rather than the percentages of students themselves. Respondents could choose more than one response to reflect the fact that different prospective students within the household may have had distinct changes in postsecondary plans or that an individual prospective student within the household may have had multiple changes in postsecondary plans.
2 Data are from the long-term trend National Assessment of Educational Progress (NAEP). Long-term trend NAEP results differ from the main NAEP results presented in other NCES publications. The long-term trend assessment measures a consistent body of knowledge and skills over an extended period, while the main NAEP undergoes changes periodically to reflect current curricula and emerging standards. In addition, several changes were made to the long-term trend assessment in 2004 to align it with current assessment practices and policies applicable to the NAEP main assessments. This included allowing accommodations for students with disabilities and for English learners. These changes have been carried forward in more recent data collections. Despite these changes to the assessment, the trend analysis is still valid. The 2020 assessment data include the performance of nationally representative samples of 9-yearold and 13-year-old students. The assessment was administered prior to pandemic-related disruptions to schooling.
average scores were lower in 2020 than in 2012 for both subjects, marking the first time reading or mathematics scores for this age group declined between assessments (Reading and Mathematics Score Trends).
Another signal of student learning is course completion. Greater percentages of high school graduates in 2019 than in 2009 had completed algebra II (85 vs. 80 percent), precalculus/mathematical analysis (40 vs. 36 percent), and courses in all three subjects of biology, chemistry, and physics (35 vs. 30 percent). However, the percentage of graduates who had completed calculus was lower in 2019 than in 2009 (16 vs. 18 percent) (High School Mathematics and Science Course Completion).
In terms of educational attainment, one critical measure is high school completion. In 2018–19, the U.S. average adjusted cohort graduation rate (ACGR) for public high school students was 86 percent, the highest rate since the ACGR was first measured in 2010–11 (Public High School Graduation Rates). 3 4 In 2020, there were 2.0 million status
dropouts between the ages of 16 and 24, and the overall status dropout rate was 5.3 percent, a decrease from 2010.5 (Status Dropout Rates).
One of the paths high school graduates may take to prepare for their future is to enroll in some form of postsecondary education. Of the 3.1 million high school completers who graduated in the first 9 months of 2020, some 2.0 million, or 63 percent, were enrolled in college in October 2020 (Immediate College Enrollment Rate).6
Educational attainment 7 is associated with many long-term life outcomes. The median earnings for 25- to 34-year-olds who worked full time, year round in 2020 were 17 percent higher for those with a master’s or higher degree ($69,700) than for those with a bachelor’s degree ($59,600). In the same year, the median earnings of those with a bachelor’s degree were 63 percent higher than the median earnings of those who completed high school ($36,600) ( Annual Earnings by Educational Attainment).
3 Data for the United States include the 50 states and the District of Columbia.
4 Although a relatively new graduation rate measure, the ACGR is considered the most accurate measure available for reporting on-time graduation rates. For more information, see Seastrom, M., Chapman, C., Stillwell, R., McGrath, D., Peltola, P., Dinkes, R., and Xu, Z. (2006). User’s Guide to Computing High School Graduation Rates, Volume 2: Technical Evaluation of Proxy Graduation Indicators (NCES 2006-605). U.S. Department of Education. Washington, DC: National Center for Education Statistics. Retrieved March 24, 2022, from https://nces.ed.gov/pubsearch/pubsinfo. asp?pubid=2006605
5 The status dropout rate represents the percentage of 16- to 24-year-olds who are not enrolled in high school and who lack a high school credential (either a diploma or an alternative credential such as a GED certificate).
6 “High school completers” refers to individuals ages 16 to 24 who graduated from high school or completed a GED or other high school equivalency credential. About 95 percent of those who completed high school in the first 9 months of 2020 were between 16 and 24 years old.
7 Levels of educational attainment refer to the highest levels of education attained. Report

to meet our workforce needs, build stronger communities, and bring billions to our economy.
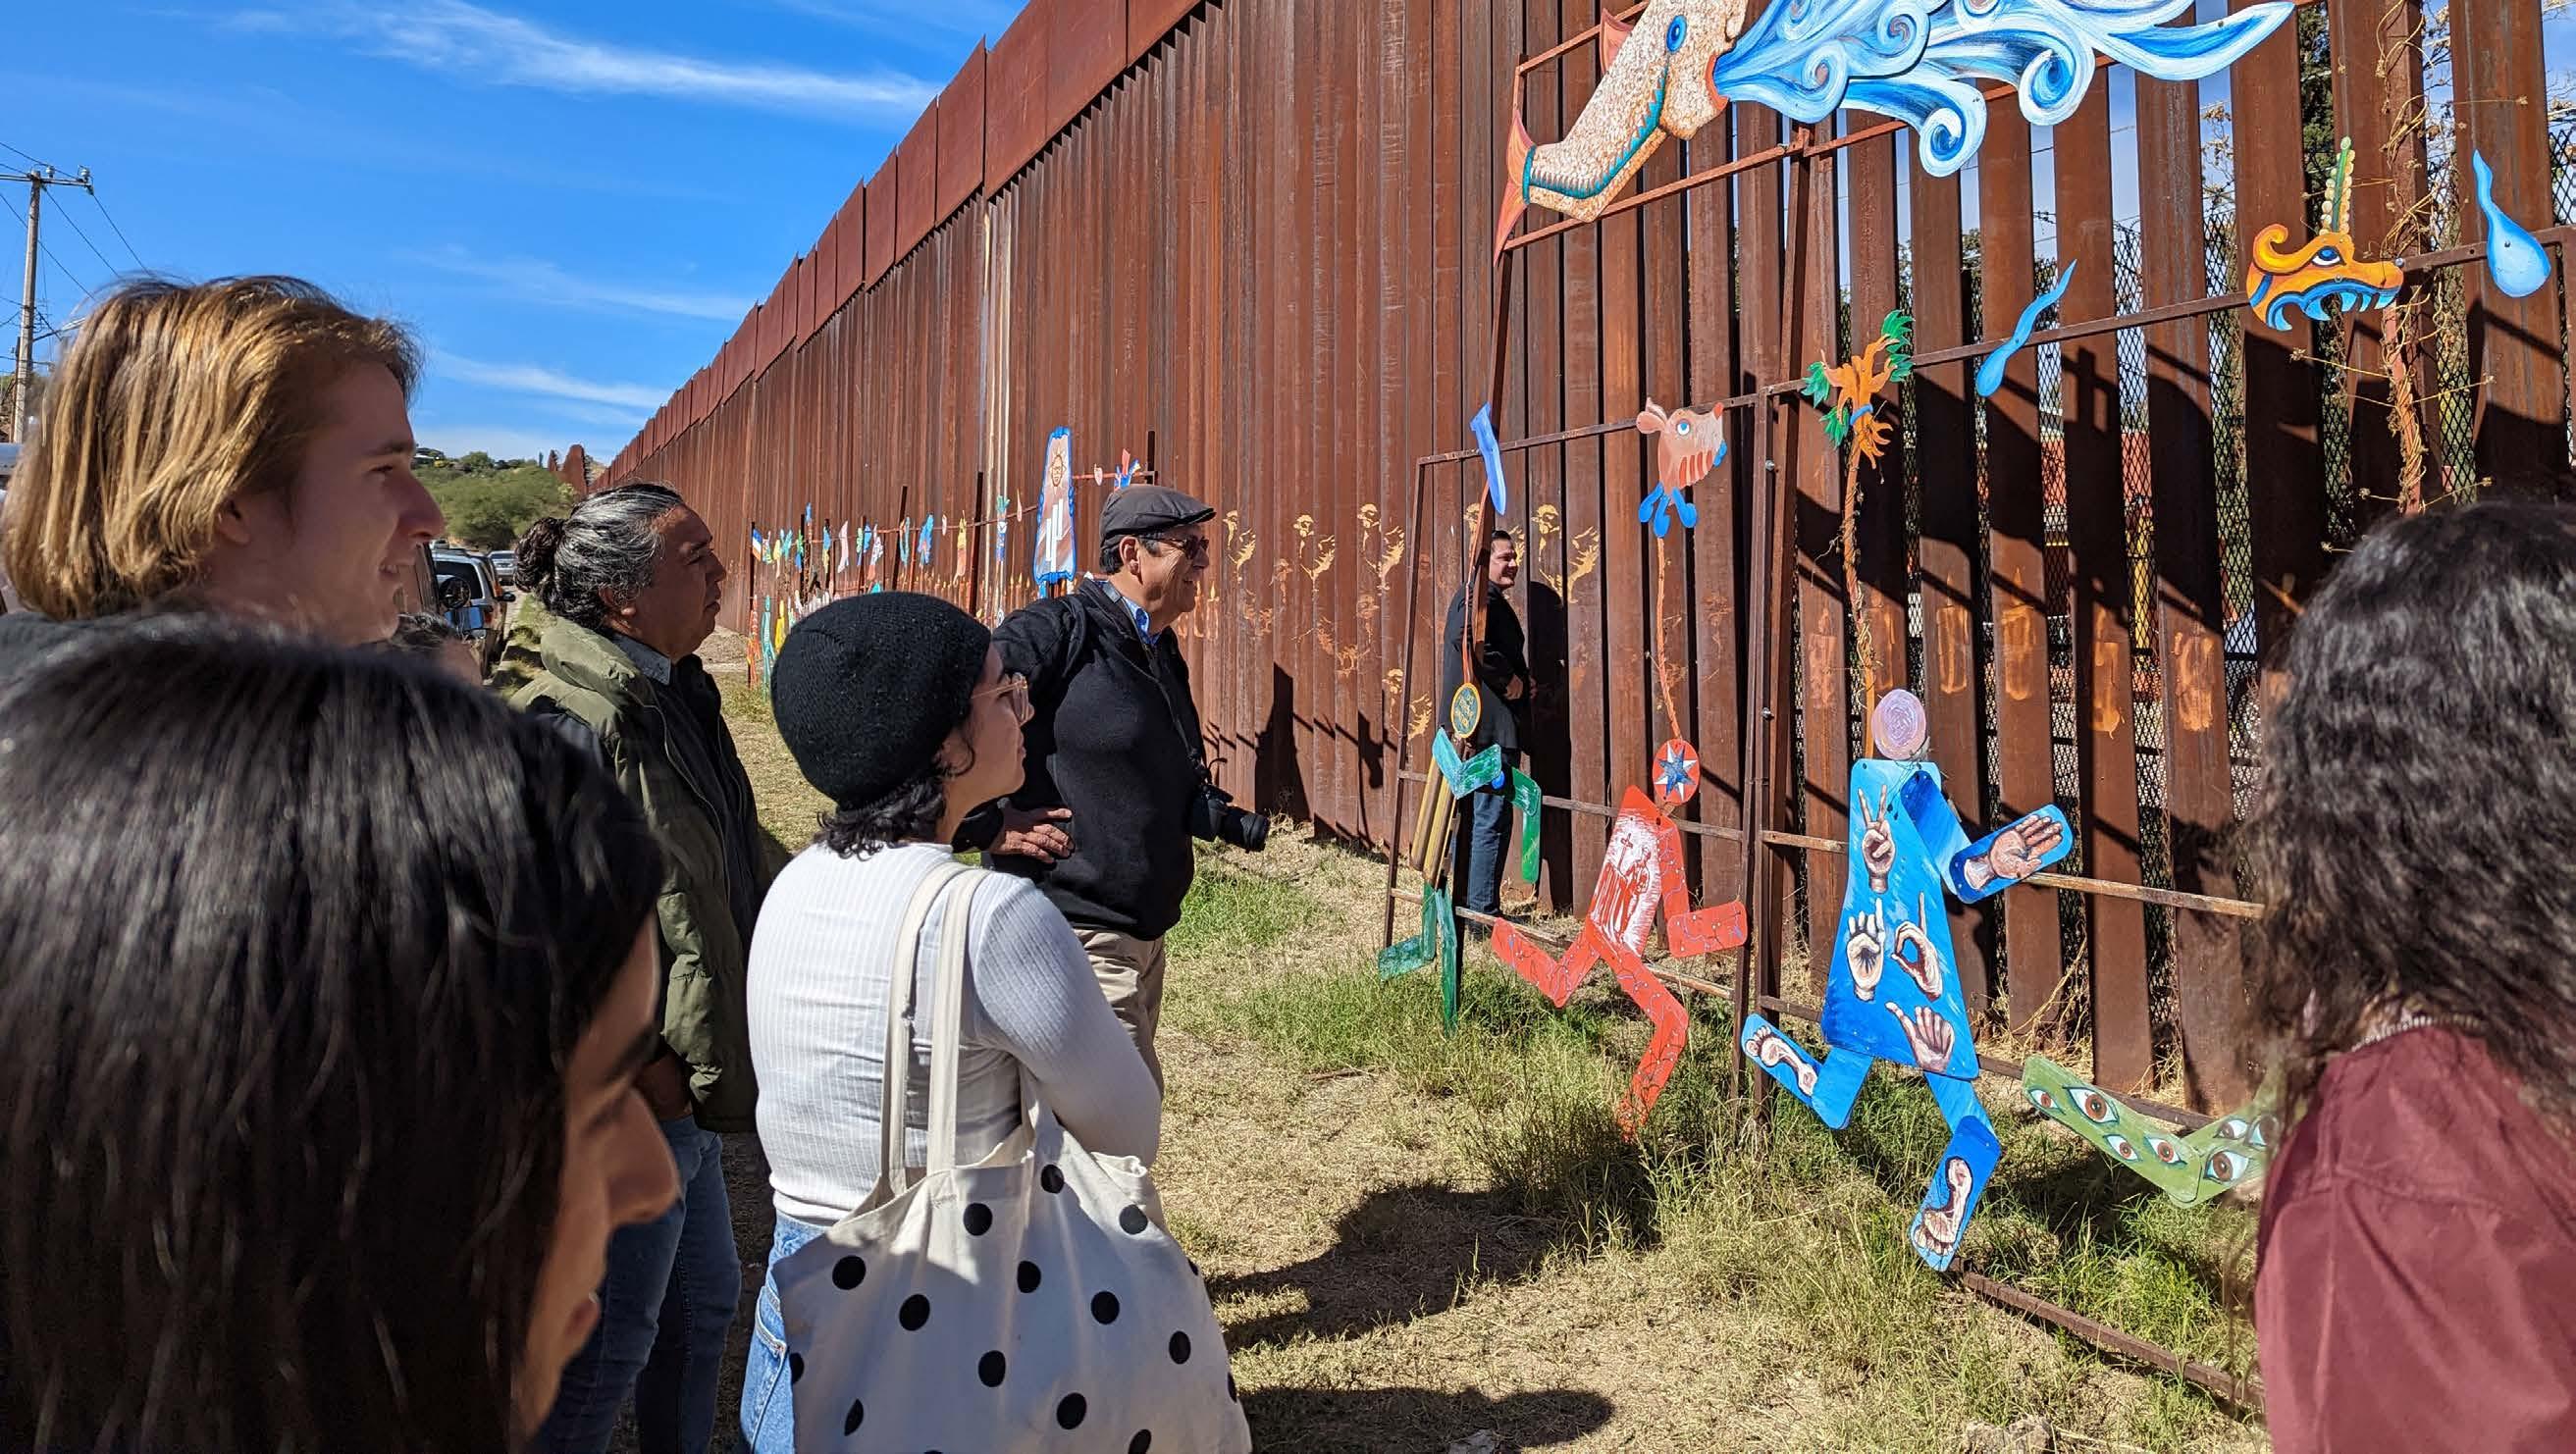
Currently only 41% of Arizona’s Hispanic high school graduates are continuing their education after high school.

Let’s work together to close the gap and create a brighter future for Arizona students and our state! Learn more at EverythingtoGain.org.
EverythingtoGain.org

At the center of expertise and action, we make borders human.
Opinion:MostArizonagraduateswilljointheworkforcewithoutacredentialor degree.Thatmightworkfornow,butithurtsthemandourstatelongterm.
Our future is at risk.
Arizona is off track to meet the statewide Achieve60AZ goal of ensuring that 60% of adults attain a postsecondary degree or credential by the end of the decade. And newly released postsecondary enrollment data show that only 48% of Arizona’s high school graduates enroll in some form of postsecondary education.
That means more than half of Arizona high school graduates will go straight into the workforce for $20-an-hour jobs, where they may earn enough to share an apartment, make a car payment and have fun on weekends. But these jobs won’t put them on a career path with steady income or advancement, particularly with Latino and low-income students who are most likely to forgo education after high school.
Ten years from now, many graduates who jumped immediately into the workforce will be looking for better jobs and likely will need more education or skills to get them. If they had completed a certificate, earned a credential or completed a bachelor’s degree, they would be making more money and have better job security and career options.
The Federal Reserve and other researchers have documented that the financial benefits of having a degree are greater than the cost of the degree.
In the years to come, jobs that don’t require a postsecondary degree also are more likely to be replaced by artificial intelligence. Not to mention that if Arizona’s postsecondary attainment rates stay the same, we’ll continue to face regular fiscal crises and poor health outcomes.
Arizona’s progress needs to accelerate and it is worth it for everyone to care.
A recent analysis from Helios Education Foundation and Education Forward Arizona suggests that if we increase postsecondary enrollment by just 20%, Arizona stands to benefit from more than $5 billion in annual gains attributable to factors like higher lifetime earnings, improved health and increased workforce productivity.
Recent efforts to promote affordable options and encourage dual enrollment are steps toward increasing education and training beyond high school. But to build the strength of Arizona’s communities and economy, we must have more than half of Arizona high school students pursuing additional training and credentials.
Just this year, the governor, Legislature and business community made it easier for high school students to earn college credits and adopt a college-going mindset.
Research indicates that students in dual enrollment are twice as likely to go to college and more likely to persist once they get there. The state budget added $15.5 million to incentivize students in low-income communities to join dual enrollment programs. But that funding is only for the upcoming school year. High schools and colleges need to get more students to enroll now and state leaders must continue to invest in dual enrollment.
We invite community leaders across sectors to join the effort:
• Families and educators can encourage more families to complete the FAFSA to be eligible for federal financial aid, including Pell grants that will enable hundreds of thousands of Arizona students to afford to continue their education and training.
• Business leaders can work hand in hand with educators to use data to determine the most essential workforce needs and to emphasize the value of a degree or certificate on lifetime earnings and career pathways.
• Lawmakers also must scale funding for Arizona Promise Scholarships, which help students whose Pell grants don’t
cover the cost of tuition, so that the implied promise to lowincome families can be kept.
We must think beyond just high school students, too. Arizona can help working adults achieve valuable credentials. Arizona community colleges have open admissions and affordable tuition for programs that prepare students of all ages for in-demand jobs in health care, high-tech manufacturing, construction management and other growing fields that require college degrees or credentials.
Some Maricopa Community Colleges and other two-year institutions across the state offer selected bachelor’s degrees in high-demand fields. Community colleges are often a gateway to a bachelor’s degree at a state university.
With everything to gain, Arizona can no longer afford to question the value of education after high school.
The evidence is undeniable: Everyone benefits when more Arizonans earn a degree or certificate.
Dr. Steven Gonzales is chancellor for the Maricopa County Community College District. Mónica S.Villalobos is president and CEO oftheArizona Hispanic Chamber of Commerce. On Twitter: @mcccd and @azhcc.


For decades we have been hearing of the demographic shift happening in Arizona and the country. That demographic shift has been accompanied with talks about the economic opportunity and implications found within the Latino population. Yet most of those discussions have been met with resistance, inaction and little urgency. These failures to act are proving to be detrimental across multiple sectors that are intrinsically tied to the economic success of our state. What the data shows us is that educational outcomes for Latino, Black, Indigenous, and People of Color (BIPOC) students is where gaps in action are causing gaps in attainment.
The 2022 DATOS report published by the Arizona Hispanic Chamber of Commerce found that Latino purchasing power exceeded the previous projected number of $57 billion this year and has currently reached $63 billion. Aside from an economic standpoint, these numbers also help tell the story of the power and growth of the Latino population. Another set of numbers that help paint the bigger picture are the demographics of Phoenix Union High School District. The current student demographic is over 92% students of color, 82% of those identify as Latino and 77% qualify for free or reduced priced lunch. Historically, the demographics of Phoenix Union High School District have trended ten years ahead of the City of Phoenix, twenty years ahead of the state of Arizona, and Arizona trends twenty years ahead of the country.
ALL In Education uses this statistic frequently because it is important to note that the majority of the student population served by Phoenix Union are Latino, 82% and 77% of the students in the district qualify for free or reduced priced lunch. The data demonstrates that in Arizona, there is a direct correlation between being a Latino student and living in poverty. This further indicates that the current status quo trajectory for our state may result in the majority of Arizona’s future workforce could be living in poverty.
Education has the power to transform lives - but that transformative experience can either lead to success or hold students back from achieving their full potential. For students that have experienced an educational journey rooted in quality, access and equity that transformation can lead to success, establishing a pathway towards building generational wealth, growth and contribution to society.
On the other hand, for students that lack access to an education system that prioritizes quality, access and equity, their future can be bleak and present challenges for their success. Education, for the most part, has been treated as a siloed problem. One that can be resolved by solely addressing teaching and learning, and solutions have been focused on adding more funding, having more qualified teachers and smaller class sizes. While every one of those issues are important and make an impact on student outcomes, they are not the only factors that can improve a student’s educational experience.
The reality is that if we want to solve the “education crisis” facing schools, we must look at the problem through a holistic lens. The second reality is that we cannot expect schools to act as social service agencies. It should not be left up to a school alone to solve poverty, food insecurity, or provide housing solutions. While schools can be and should be hubs for resources for the communities they serve, we must view schools as a partner that can help identify solutions to The Social Determinants of Education. We must move away from the expectations that schools alone can solve all of these challenges in a siloed way.
The social determinants have been impacting families in Arizona for generations. For many, moving to a new residence year after year is the norm, and a form of survival. Similarly, lack of access to nutritious food, affordable healthcare, mental health support or green spaces are all ongoing barriers to success. The challenges become part of a family’s daily experiences and can often be normalized as something that is simply part of life. However, the impact of the social determinants on the lives of individuals can be carried throughout their entire lives. Building solutions to the external factors impacting education will not be achieved overnight. It will take collaborative efforts, data-driven and thoughtful solutions, supported by values-based leaders working towards systemic change.
As previously highlighted in our MAPA reports, there is a large gap in representation across classrooms and boardrooms for Latino students in Arizona. Forty-seven percent of PK-12 students are Latino, but only 17% of state education board members are Latino, including the Arizona State Board of Education, the Arizona State Board for Charter Schools, and the Arizona Board of Regents. Similarly, only 17% of certified teachers and administrators, in Arizona’s public schools, are Latino. This means that many of those making decisions on behalf of the majority of Arizona’s students do not reflect them nor do they have similar lived-experience as the students they serve.
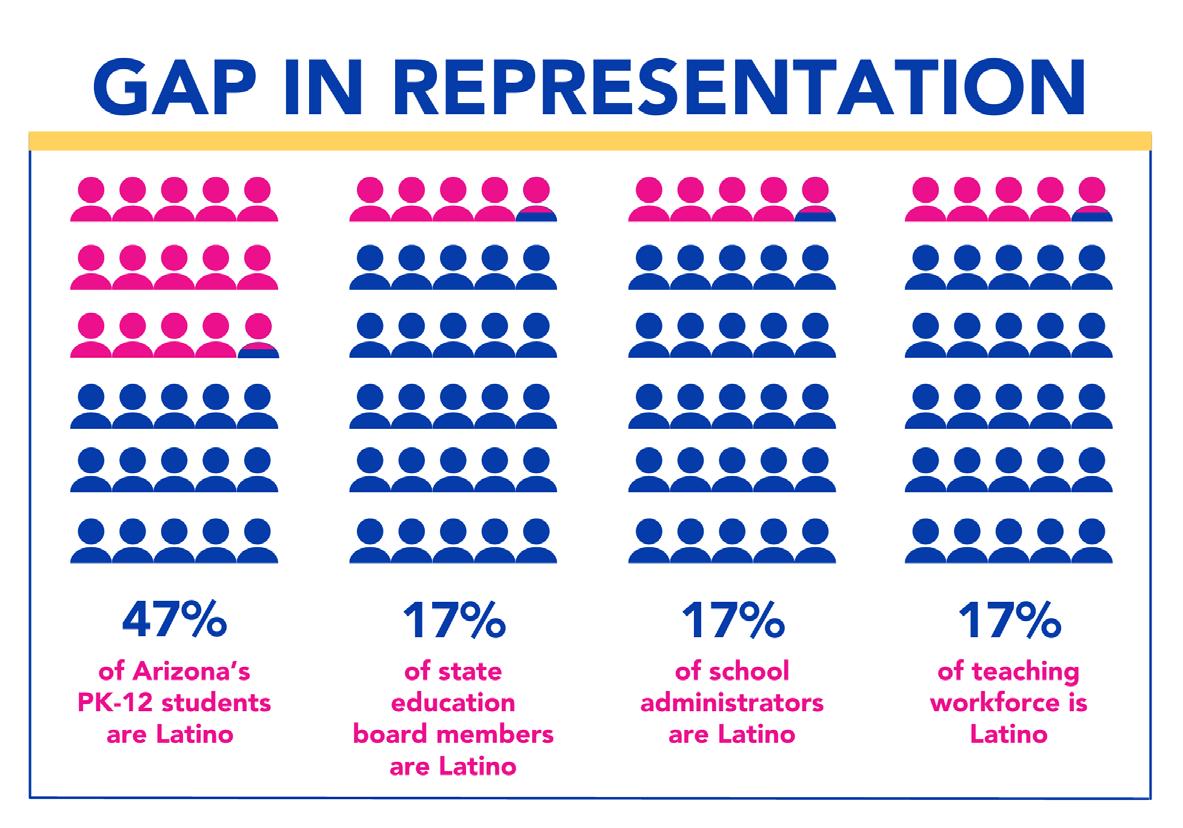
The gap in representation is why the development of our core programming and initiatives is rooted in centering the community and tapping into building the power and influence of Latinos in leadership at all levels of education. With an alumni network of 378 leaders, we have seen individuals from all three of our signature programs - Parent Educator Academy, Adelante Fellowship and LISTO (Leaders In Support Of Transformational Opportunities) Academy - emerge into leadership roles. Our programs are creating the values-based, bold and daring leaders that will transform our communities, schools and classrooms to create a better future for every student and Arizonan.
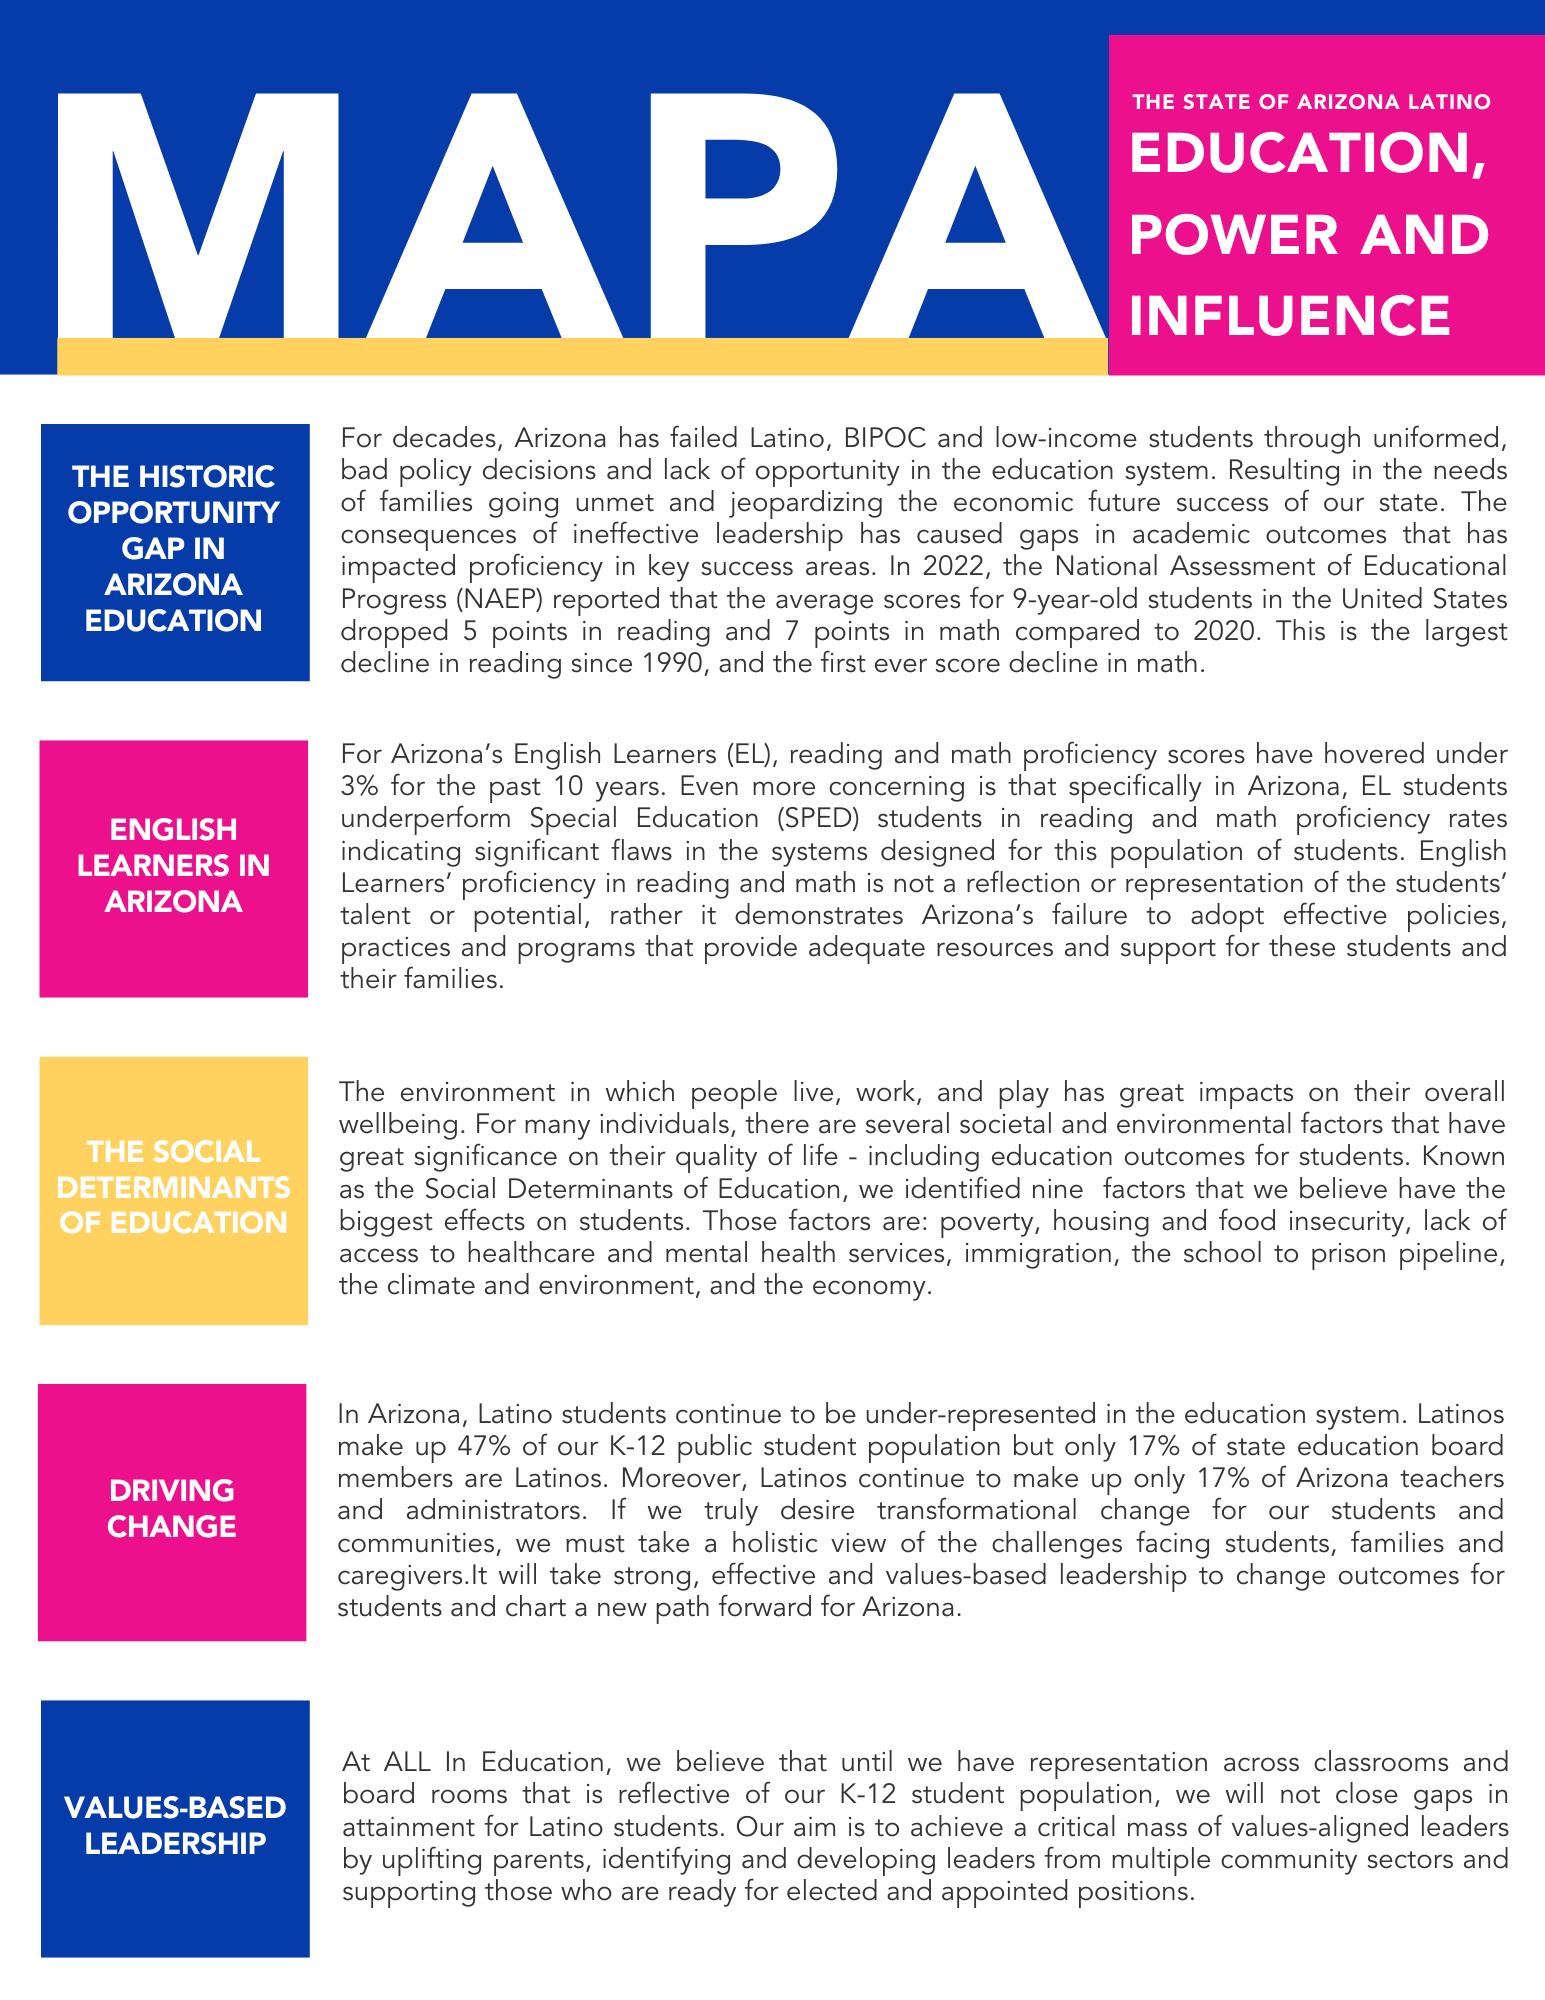
In Arizona, we’re more than 11,000 employees helping to ensure people across the state can access the health care services they need.
In your community, on your phone, or in your home, CVS Health connects you to care that’s high quality, convenient and a�ordable – however you need it –so it’s never out of reach for any Arizonan.

We're proud to partner with Arizona's small businesses, health plans and public programs to deliver care that helps build healthier communities.
Learn more about how we’re making healthier happen together at CVSHealth.com.
• SINCE 2000, THE U.S. HISPANIC HOMEOWNERSHIP RATE HAS NEVER DROPPED BELOW 45%
• ARIZONA HAD THE 5TH HIGHEST HISPANIC HOMEOWNERSHIP RATE IN THE U.S.
• NONE OF THE 15 CITIES WITH THE HIGHEST RENT PRICES ARE LOCATED IN ARIZONA
• SINCE 1990, WHITE HOUSEHOLDS IN THE U.S. CONTINUE TO DECLINE WHILE HISPANIC HOUSEHOLDS SHOW A STEADY INCREASE
• 71% OF LATINOS PURCHASED A HOME BEFORE THE AGE OF 45, COMPARED TO 64% OF THE GENERAL POPULATION
• ONLY ONE-FIFTH OF U.S. HOUSEHOLDS WITH CHILDREN RECEIVING FINANCIAL ASSISTANCE ARE HISPANIC
• VOUCHERS ARE THE MOST COMMON FORM OF HOUSING ASSISTANCE ACROSSS RACE AND ETHNICITY
• ONLY 11% OF ASSISTANCE-ELIGIBLE U.S. HISPANIC HOUSEHOLDS WITH CHILDREN ACTUALLY RECEIVE ASSISTANCE
• 46% OF HISPANICS HAVE A FICO SCORE OF 700 OR BELOW
• HOMEOWNERSHIP NARROWS THE WEALTH GAP
• MORE THAN A THIRD OF HISPANICS USE ALTERNATIVE FINANCING TO PURCHASE A HOME
• BLACK & LATINO HOUSEHOLDS STRUGGLED MOST WITH LOSS OF INCOME AND FALLING BEHIND ON HOUSING PAYMENTS AS A RESULT OF THE PANDEMIC
• TYPICAL HOME VALUES AND MORTGAGES ARE MUCH HIGHER IN THE PHOENIX METRO AREA VS. TUCSON
• AS OF 2021, FAMILIES IN PHOENIX AND TUCSON NEED TO INVEST MORE THAN SIX TIMES THEIR ANNUAL INCOME TO BUY A HOME
• TYPICAL HOME VALUES AND RENTS IN PHOENIX AND TUCSON INCREASED DRAMATICALLY BETWEEN 2019 AND 2021
Univision Communications provides an overview of the real estate markets for Hispanics in Phoenix and Tucson
The Raza Development Fund believes that Latinos and Latino small business owners are good investments that reap big rewards
BY MELISSA MCDONALDReal estate prices in Mexico are causing investors to look south of the border when they consider buying a second home
BY MARY RABAGOThe National Association of Hispanic Real Estate Professionals has found that while affordability was an issue in 2022, Latinos are finding creative ways to combat a tight housing market
The Joint Center for Housing Studies at Harvard University says the U.S. housing market is at an inflection point—and high housing costs will continue to be an issue for lower-income households and households of color
*NOTE: NAHREP concluded that the data reported by the U.S. Census Bureau in 2020 was likely overestimated due to methodological changes in the data collection during the pandemic, therefore NAHREP decided to omit 2020 specific data.
STATES WITH THE HIGHEST HISPANIC HOMEOWNERSHIP RATE (2021)
67.4% 67.3% 66% 62.6% 5 9
4 %
NOTES:
*Values for 2020—2030 and 2030—2040 are projected values.
**In 2010—2020, there were zero net households formed in the White category.
***Other includes Asians, American Indians, Alaska Natives, Native Hawaiians, other Pacific Islanders and multiracial individuals.
“Latinos are…more likely to use FHA financing than both the general population and their non-Hispanic White counterparts…. This may be due in part to its accessibility, as Latinos were 66 percent more likely to be denied conventional financing than their non-Latino counterparts [in 2021].
Comparatively, Latinos were only 4 percent more likely to be denied [by FHA].”
71% OF LATINOS PURCHASED A HOME BEFORE THE AGE OF 45, COMPARED TO 64% OF THE GENERAL POPULATION
ONLY ONE-FIFTH OF U.S. HOUSEHOLDS WITH CHILDREN RECEIVING FINANCIAL ASSISTANCE ARE
PERCENT
ONLY 11% OF ASSISTANCEELIGIBLE U.S. HISPANIC HOUSEHOLDS WITH CHILDREN ACTUALLY RECEIVE ASSISTANCE
*NOTE: According to the Legal Information Institute at Cornell University Law School, FICO is the acronym for Fair Isaac Corp., as well as the name for the credit scoring model the company developed. FICO credit scores, which range from 300 to 850, are used by many lenders to determine if a person qualifies for a credit card, mortgage or other loan. FICO scores also determine the interest rates a person would pay or their credit limit. Higher scores generally correlate to a better likelihood of getting a loan and better interest rates for those loans. Here are the ratings: Poor (below 579), Fair (580—669) Good (670—739) Very Good (740—799) and Exceptional( 800+).
PERCENT OF U.S. HOUSEHOLDS BEHIND ON RENT/MORTGAGE PAYMENTS* BY RACE/ETHNICITY**
(DECEMBER 2021 — APRIL 2022)
PERCENT OF U.S. HOUSEHOLDS WITH LOST EMPLOYMENT INCOME BY RACE/ETHNICITY**
(DECEMBER 2021 — APRIL 2022)
NOTES: *Households who are behind on their rent or mortgage reported that they were not currently caught up on housing payments at the time of survey.
**White, Black, Asian or householders of another race are non-Hispanic. Hispanic households may be of any race.
NOTE: Income data for 2021 are based on Moody’s Analytics forecasts. Home prices are the median sale price of existing single-family homes and incomes are the median household income within markets.
INCREASED DRAMATICALLY BETWEEN 2019 AND 2021
AS OF 2021, FAMILIES IN PHOENIX AND TUCSON NEED TO INVEST MORE THAN SIX TIMES THEIR ANNUAL INCOME TO BUY A HOME
CHARTS
• IN 2021, NEARLY 1/5 OF HISPANICS IN THE U.S. DID NOT HAVE HEALTH INSURANCE COVERAGE
• THE PERCENTAGE OF UNINSURED HISPANICS AGED 18–64 ROSE TO MORE THAN THREE TIMES THAT OF NON-HISPANICS BY 2021
• MEDICARE/CHIP IS THE LARGEST SOURCE OF COVERAGE FOR LATINO KIDS IN ARIZONA
• NUMBER & RATE OF UNINSURED LATINO CHILDREN BY ARIZONA COUNTY (2018)
• HISPANICS AGED 18–29 FIND THE PROCESS TO GET MEDICAL CARE HARDER TO UNDERSTAND THAN OTHER HISPANIC AGE GROUPS
• ABOUT A THIRD OF HISPANIC ADULTS SAY THEY WOULD PREFER A HEALTH CARE
• A GREATER PERCENTAGE OF HISPANIC ADULTS 18+ VS. NON-HISPANICS DID NOT GET
• A GREATER PERCENTAGE OF HISPANIC ADULTS 18+ VS. NON-HISPANICS DID NOT TAKE
• MEDICATION AS PRESCRIBED TO SAVE MONEY
• A GREATER PERCENTAGE OF HISPANIC ADULTS 18+ VS. NON-HISPANICS WERE OBESE
• LATINO DIABETES RATES HAVE REMAINED CONSTANT OVER THE LAST DECADE IN ARIZONA (2011–2021)

• MENTAL HEALTH IN ARIZONA (FEBRUARY 2021)
• SINCE 2020, ALL RACIAL/ETHNIC GROUPS HAVE EXPERIENCED HIGHER RATES OF MENTAL DISTRESS
• 53% OF HISPANIC ADULTS SAY HEALTH RISKS IN JOBS ARE MAJOR REASON FOR GENERALLY WORSE HEALTH OUTCOMES
CHARTS
• IN 2021, NEARLY 1/5 OF HISPANICS IN THE U.S. DID NOT HAVE HEALTH INSURANCE COVERAGE
• THE PERCENTAGE OF UNINSURED HISPANICS AGED 18–64 ROSE TO MORE THAN THREE TIMES THAT OF NON-HISPANICS BY 2021
Arizona benefits when we support small businesses, especially Latino-owned businesses. Our clients prove this time and time again by maximizing our investments.
• MEDICARE/CHIP IS THE LARGEST SOURCE OF COVERAGE FOR LATINO KIDS IN ARIZONA
• NUMBER & RATE OF UNINSURED LATINO CHILDREN BY ARIZONA COUNTY (2018)
• HISPANICS AGED 18–29 FIND THE PROCESS TO GET MEDICAL CARE HARDER TO UNDERSTAND THAN OTHER HISPANIC AGE GROUPS
The Raza Development Fund (RDF) is the country’s largest Latinoled community development financial institution, which means we bring financial capital to organizations who make a direct impact in Latino and under-resourced communities. In doing so, we prioritize our investments in a few areas, including entrepreneurship.
• ABOUT A THIRD OF HISPANIC ADULTS SAY THEY WOULD PREFER A HEALTH CARE PROVIDER WHO SPEAKS SPANISH
• A GREATER PERCENTAGE OF HISPANIC ADULTS 18+ VS. NON-HISPANICS DID NOT GET NEEDED MEDICAL CARE DUE TO COST
During the height of the pandemic, RDF offered Hope Fund grants to small businesses. We proudly watched as these entrepreneurs used these funds to keep their businesses open and then shared their new fortune with their communities.
• A GREATER PERCENTAGE OF HISPANIC ADULTS 18+ VS. NON-HISPANICS DID NOT TAKE
• MEDICATION AS PRESCRIBED TO SAVE MONEY
• A GREATER PERCENTAGE OF HISPANIC ADULTS 18+ VS. NON-HISPANICS WERE OBESE
Stephanie Vasquez, owner of Fair Trade Café, is a great example. A Latina leader, she has taken fellow business owners, even competing coffee shop owners, under her wing to help them grow. To her, it’s about supporting the entire community. After we provided Vasquez with a grant for her café, she reached out to other local small business owners to connect them to resources like our RDF team.
• LATINO DIABETES RATES HAVE REMAINED CONSTANT OVER THE LAST DECADE IN ARIZONA (2011–2021)
• MENTAL HEALTH IN ARIZONA (FEBRUARY 2021)
• SINCE 2020, ALL RACIAL/ETHNIC GROUPS HAVE EXPERIENCED HIGHER RATES OF MENTAL DISTRESS
While these grants made an impact, we knew our small businesses still needed financial support. Unfortunately, systemic barriers still create challenges for Latinos, specifically Latino small business owners, in navigating financial and technical support and accessing capital. We believe it’s imperative for the benefit of the Latino community, Arizona and our entire country that we work to close these disparity gaps.
• 53% OF HISPANIC ADULTS SAY HEALTH RISKS IN JOBS ARE MAJOR REASON FOR GENERALLY WORSE HEALTH OUTCOMES
Thankfully, our partners at Wells Fargo agree. Through the Wells Fargo Open for Business Program, RDF was able to expand our investments in small businesses.
We connected with five, nonprofit community-based organizations to deploy low-cost small business loans in their local markets, including the Arizona Hispanic Chamber of Commerce. Thanks to their efforts, we were able to provide a combined total of more than 90 small business loans totaling more than $4 million, including


• ABOUT A THIRD OF HISPANIC ADULTS SAY THEY WOULD PREFER A HEALTH CARE PROVIDER WHO SPEAKS SPANISH
• A GREATER PERCENTAGE OF HISPANIC ADULTS 18+ VS. NON-HISPANICS DID NOT GET NEEDED MEDICAL CARE DUE TO COST
one for the Fair Trade Café, to help these entrepreneurs cover a wide range of business needs, including equipment purchases and growth capital.
• A GREATER PERCENTAGE OF HISPANIC ADULTS 18+ VS. NON-HISPANICS DID NOT TAKE
• MEDICATION AS PRESCRIBED TO SAVE MONEY
The impact doesn’t end with a loan. Our RDF team’s energy rises as we watch these small businesses maximize our investments.
Raza Development Fund
• A GREATER PERCENTAGE OF HISPANIC ADULTS 18+ VS. NON-HISPANICS WERE OBESE
We cheer as we hear Vasquez’s rallying cry while growing her nonprofit organization, Empowering Latina Leaders in Arizona (ELLA), which provides opportunities like the Mujeres Mercado pop-up market for entrepreneurs to scale their businesses. And we’re beyond excited as she kicks off her newest venture: Amor Collective, a small business incubator in Peoria’s Park West shopping center that will feature products from Latina-owned businesses while providing educational opportunities for these entrepreneurs.
• LATINO DIABETES RATES HAVE REMAINED CONSTANT OVER THE LAST DECADE IN ARIZONA (2011–2021)
410 E Southern Ave. Phoenix, AZ 85040 602.417.1400 razafund.org/phx
• MENTAL HEALTH IN ARIZONA (FEBRUARY 2021)
• SINCE 2020, ALL RACIAL/ETHNIC GROUPS HAVE EXPERIENCED HIGHER RATES OF MENTAL DISTRESS
• 53% OF HISPANIC ADULTS SAY HEALTH RISKS IN JOBS ARE MAJOR REASON FOR GENERALLY WORSE HEALTH OUTCOMES
Here is the simple fact: Latinos and Latino small business owners are good investments. At RDF, we look forward to extending our support of small businesses as we work together to create longterm sustainability.
Melissa McDonald is the Chief Operating Officer of Raza Development Fund(RDF)andamemberoftheArizonaHispanicChamberofCommerce Board ofDirectors. RDFis a support organizationto UnidosUS.
Fair Trade Café 1020 N. 1 st Ave. Phoenix, AZ 85003 602.354.8150 azfairtrade.com
Empowering Latino Leaders in Arizona (ELLA)
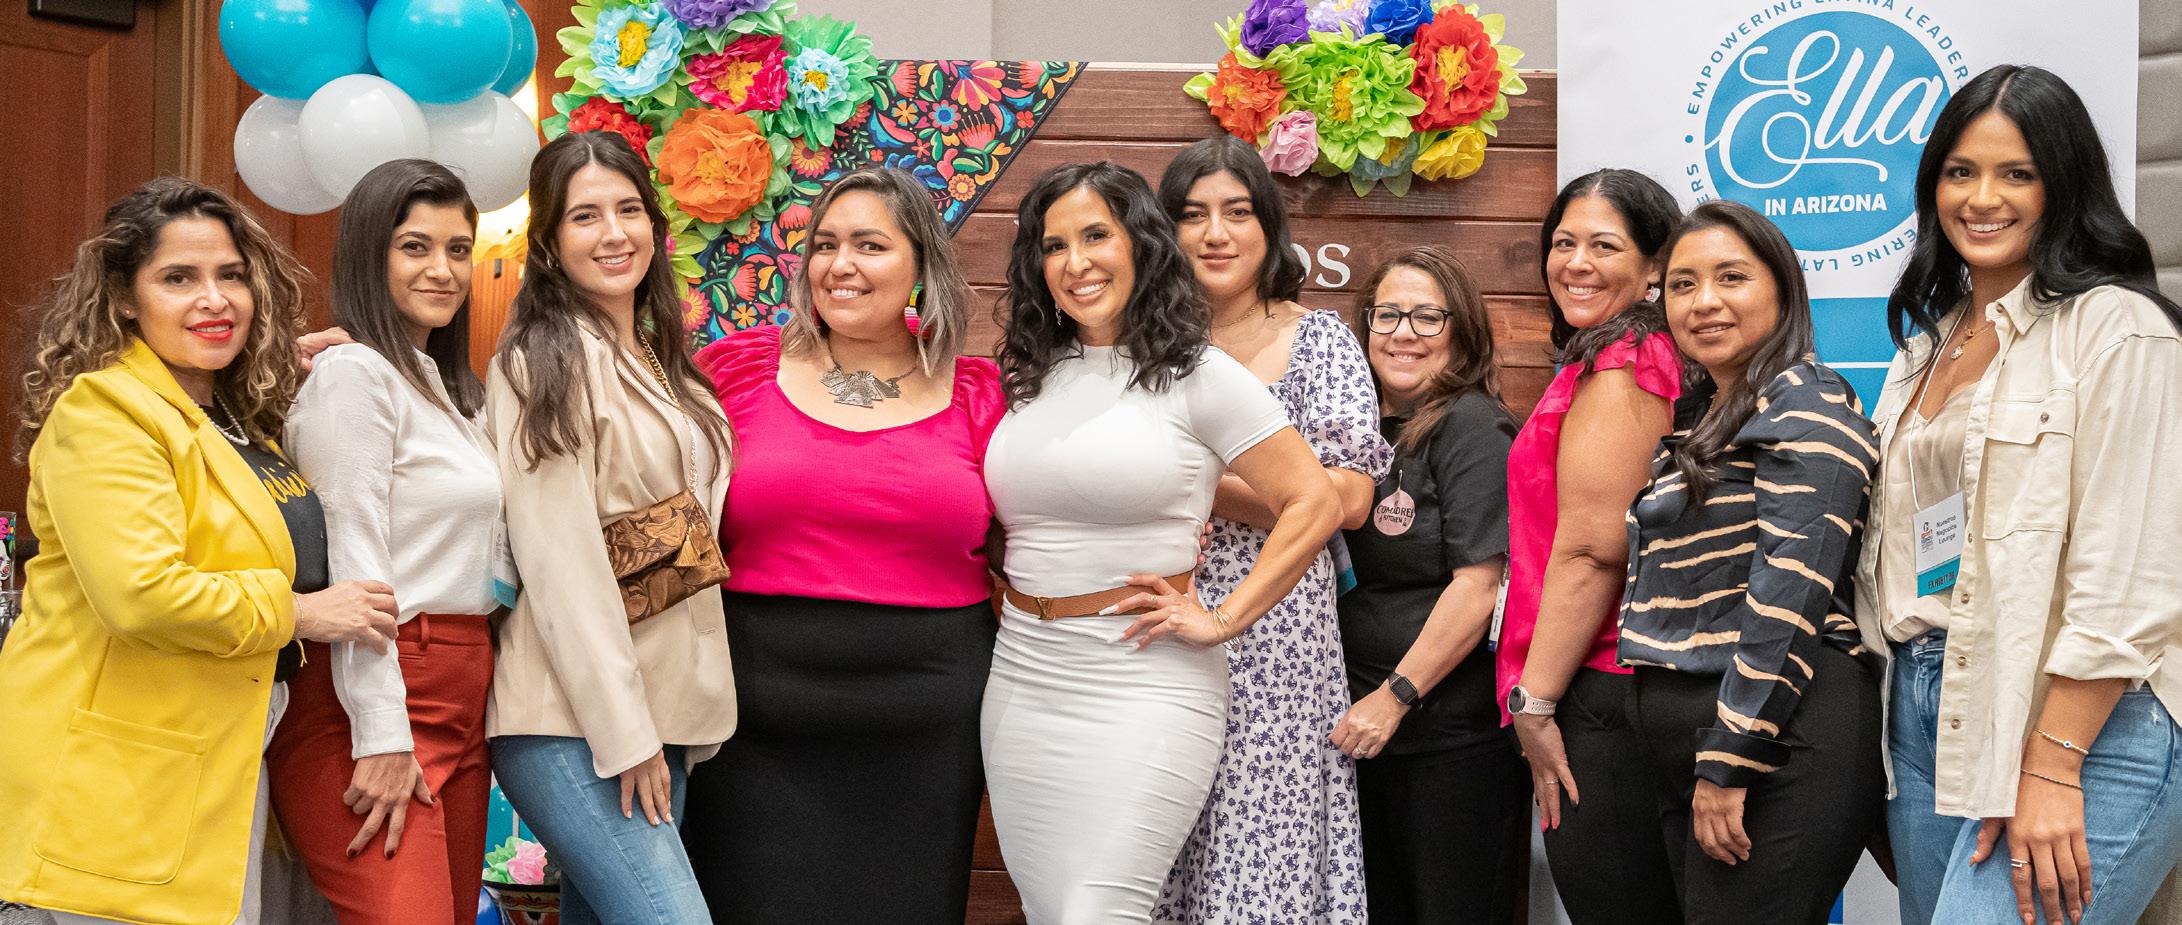
azella.org
Amor Collective amorcollectiveaz.com
• IN 2021, NEARLY 1/5 OF HISPANICS IN THE U.S. DID NOT HAVE HEALTH INSURANCE COVERAGE
BY MARY RABAGO• THE PERCENTAGE OF UNINSURED HISPANICS AGED 18–64 ROSE TO MORE THAN THREE TIMES THAT OF NON-HISPANICS BY 2021
Lupita is one of millions of Mexican immigrants who calls Arizona and the United States her adopted home. After years of struggles and tribulations adapting to her chosen country, Lupita has seen her hard work pay off: Her cleaning company is thriving, creating a better future for her and her family. Not only is it providing for her household, but it’s also creating economic opportunities for dozens of other families that depend on her Arizona small business.
• MEDICARE/CHIP IS THE LARGEST SOURCE OF COVERAGE FOR LATINO KIDS IN ARIZONA
• NUMBER & RATE OF UNINSURED LATINO CHILDREN BY ARIZONA COUNTY (2018)
• HISPANICS AGED 18–29 FIND THE PROCESS TO GET MEDICAL CARE HARDER TO UNDERSTAND THAN OTHER HISPANIC AGE GROUPS
• ABOUT A THIRD OF HISPANIC ADULTS SAY THEY WOULD PREFER A HEALTH CARE PROVIDER WHO SPEAKS SPANISH
Now, Lupita and her husband dream of retiring young, enjoying the fruits of their efforts. With the current interest rates and spike in prices in the real estate market across the United States, Lupita has found a great option to multiply her abundance—investing in real estate south of the border.
• A GREATER PERCENTAGE OF HISPANIC ADULTS 18+ VS. NON-HISPANICS DID NOT GET NEEDED MEDICAL CARE DUE TO COST
• A GREATER PERCENTAGE OF HISPANIC ADULTS 18+ VS. NON-HISPANICS DID NOT TAKE
• MEDICATION AS PRESCRIBED TO SAVE MONEY
It’s a trend many people are taking advantage of, especially those who possess dual citizenship. Mexico destinations are popular among this new sector of investors. In fact, Puerto Peñasco, Sonora, Mexico, better known to Arizonans as Rocky Point, leads the way in foreign investors. Less than four hours from Phoenix, Rocky Point is known as “the beach for Arizonans,” and is now a hot market.
• A GREATER PERCENTAGE OF HISPANIC ADULTS 18+ VS. NON-HISPANICS WERE OBESE
• LATINO DIABETES RATES HAVE REMAINED CONSTANT OVER THE LAST DECADE IN ARIZONA (2011–2021)
• MENTAL HEALTH IN ARIZONA (FEBRUARY 2021)
• SINCE 2020, ALL RACIAL/ETHNIC GROUPS HAVE EXPERIENCED HIGHER RATES OF MENTAL DISTRESS
Many Americans or U.S. citizens have made Mexico their second home, buying properties and investing in the neighbor country. It is a different type of migration than what is typically associated with Mexican nationals immigrating to the United States. These cross-border real estate buyers are motivated by several factors: the pleasure of living a coastal lifestyle, making their dollars go further in their golden years, the natural beauty throughout Mexico and the lure of Mexican culture, food and traditions. These buyers have also created a secondary migration caused by the supply and demand of the workforce needed and the lack of opportunities many Mexicans face in their homeland.
• 53% OF HISPANIC ADULTS SAY HEALTH RISKS IN JOBS ARE MAJOR REASON FOR GENERALLY WORSE HEALTH OUTCOMES
These two conditions are now propelling this new type of real estate investment in Mexico. Lupita’s story demonstrates how more Latino entrepreneurs are going from being part of the labor force to taking risks and creating wealth as investors. Small business owners in the restaurant, service, construction and maintenance industries are now financially able to invest in two, three or even more properties south of the border, generating passive income while also enjoying a second home.
It’s a trend that is predicted to grow. According to DATOS, from 2009 to 2019, Latino business owners grew by 34% compared to just 6% of white business owners and 1% of all business owners. For immigrants, especially those from Mexico, the dream of having a second home in their country is now becoming a reality for thousands.
generates wealth for everyone who lives, works and invests in this region. Now is the perfect time for collaboration, education and action.
CHARTS
The shift is also changing the way investors and developers in Mexico think about generating new business. Besides affluent Americans looking to invest in Mexico, these real estate businesses are now catering to their paisanos who, after creating wealth en el norte, are coming back to their homeland, investing their hard-earned dollars and injecting millions of dollars into the Mexican economy. It’s now more than simply the remittances they send annually to their family members who still live in Mexico; it’s money they are investing in real estate in Mexico.
• IN 2021, NEARLY 1/5 OF HISPANICS IN THE U.S. DID NOT HAVE HEALTH INSURANCE COVERAGE
• THE PERCENTAGE OF UNINSURED HISPANICS AGED 18–64 ROSE TO MORE THAN THREE TIMES THAT OF NON-HISPANICS BY 2021
Lupita and her husband are leading the way. Their experience highlights the value of investing now: It’s still possible to buy at an affordable price in Mexico and their investment should multiply. Through their small business and real estate investment, they are creating wealth on both sides of the border.
• MEDICARE/CHIP IS THE LARGEST SOURCE OF COVERAGE FOR LATINO KIDS IN ARIZONA
The conditions of the real estate market in the U. S. are propelling this new trend of investors in Mexico, but there is still much to be done. Education is needed by authorities and experts in the real estate industry on both sides of the border to streamline these transactions.
• NUMBER & RATE OF UNINSURED LATINO CHILDREN BY ARIZONA COUNTY (2018)
Mary Rabago is a former national and international journalist who now uses her expertise as founder of Mary Rabago Productions, bridging Latino culture and buying powerwithAmerican enterprise.
• HISPANICS AGED 18–29 FIND THE PROCESS TO GET MEDICAL CARE HARDER TO UNDERSTAND THAN OTHER HISPANIC AGE GROUPS
• ABOUT A THIRD OF HISPANIC ADULTS SAY THEY WOULD PREFER A HEALTH CARE PROVIDER WHO SPEAKS SPANISH
Significant progress in this arena was made at the recent Real Estate Summit Across Border event in Phoenix, which I helped to organize. As a business owner, an immigrant from Mexico and a recent investor in my home country, I know firsthand the value of bringing together experts and authorities to collaborate, educate and fuel growth in the rapidly expanding cross-border real estate market.
• A GREATER PERCENTAGE OF HISPANIC ADULTS 18+ VS. NON-HISPANICS DID NOT GET NEEDED MEDICAL CARE DUE TO COST
• A GREATER PERCENTAGE OF HISPANIC ADULTS 18+ VS. NON-HISPANICS DID NOT TAKE
Mary Rabago Productions 1008 E. Buckeye Rd., Suite 120 480.518.2185 www.maryrabago.com
• MEDICATION AS PRESCRIBED TO SAVE MONEY
• A GREATER PERCENTAGE OF HISPANIC ADULTS 18+ VS. NON-HISPANICS WERE OBESE
More important than the economic impact cross-border development offers is the potential it creates to unite, rather than divide, people. The U.S.—Mexico border real estate market demonstrates what is possible when we are united by the border’s opportunities. This emerging market shows how our border
• LATINO DIABETES RATES HAVE REMAINED CONSTANT OVER THE LAST DECADE IN ARIZONA (2011–2021)
From Live and Invest Overseas Buying Property In Mexico: Step-By-Step Guide For Expats liveandinvestoverseas.com/countries/mexico-countries/ buying-property-mexico-step-by-step-guide-expats
• MENTAL HEALTH IN ARIZONA (FEBRUARY 2021)
• SINCE 2020, ALL RACIAL/ETHNIC GROUPS HAVE EXPERIENCED HIGHER RATES OF MENTAL DISTRESS
• 53% OF HISPANIC ADULTS SAY HEALTH RISKS IN JOBS ARE MAJOR REASON FOR GENERALLY WORSE HEALTH OUTCOMES
Source: The National Association of Hispanic Real Estate Professionals (NAHREP), State of Hispanic Homeownership Report, 2022 nahrep.org/shhr/


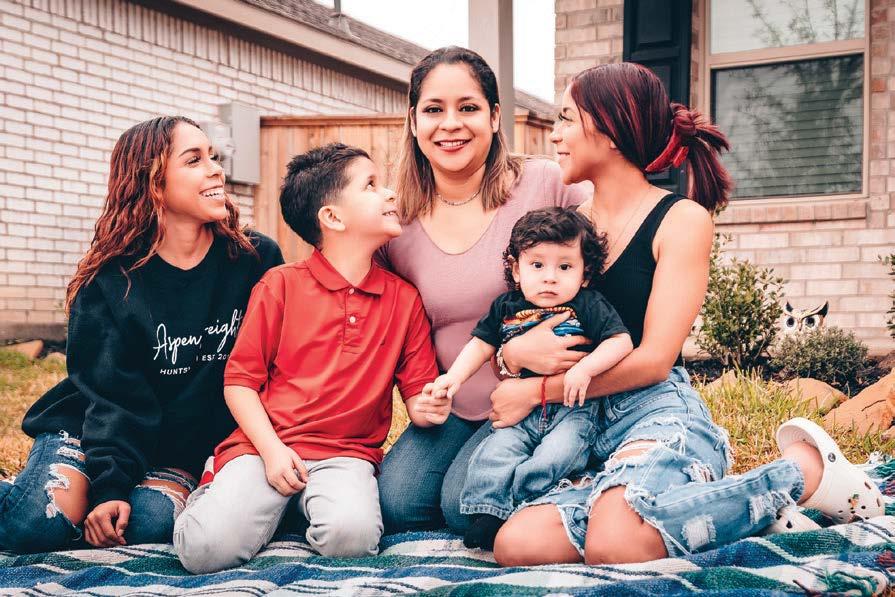


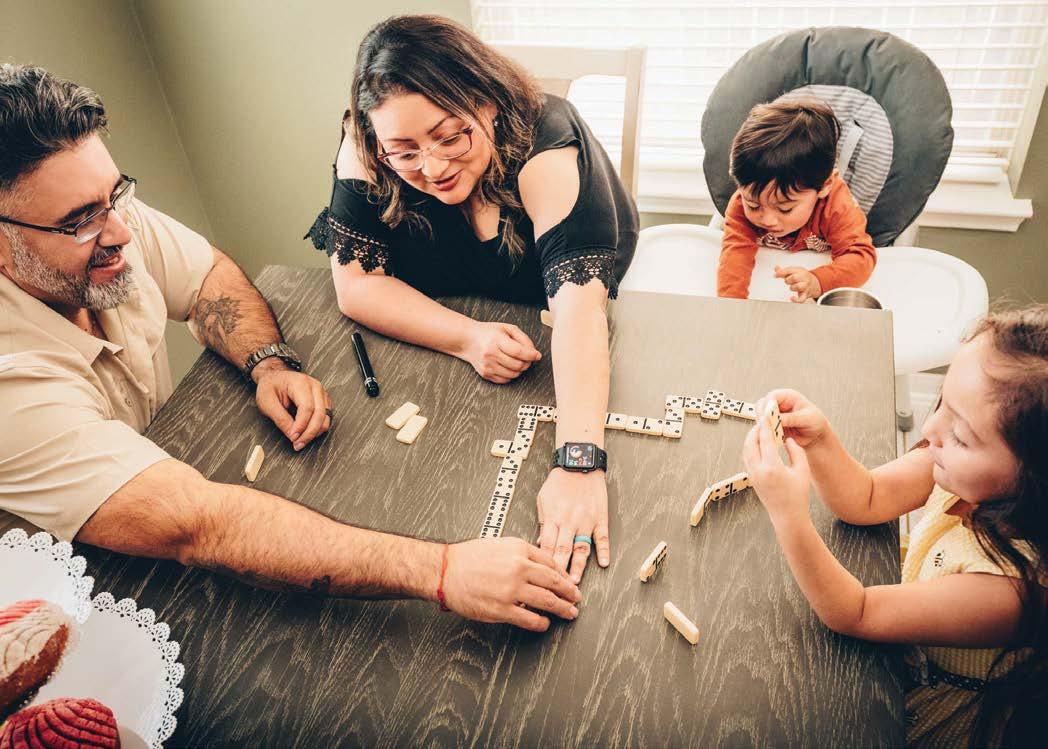

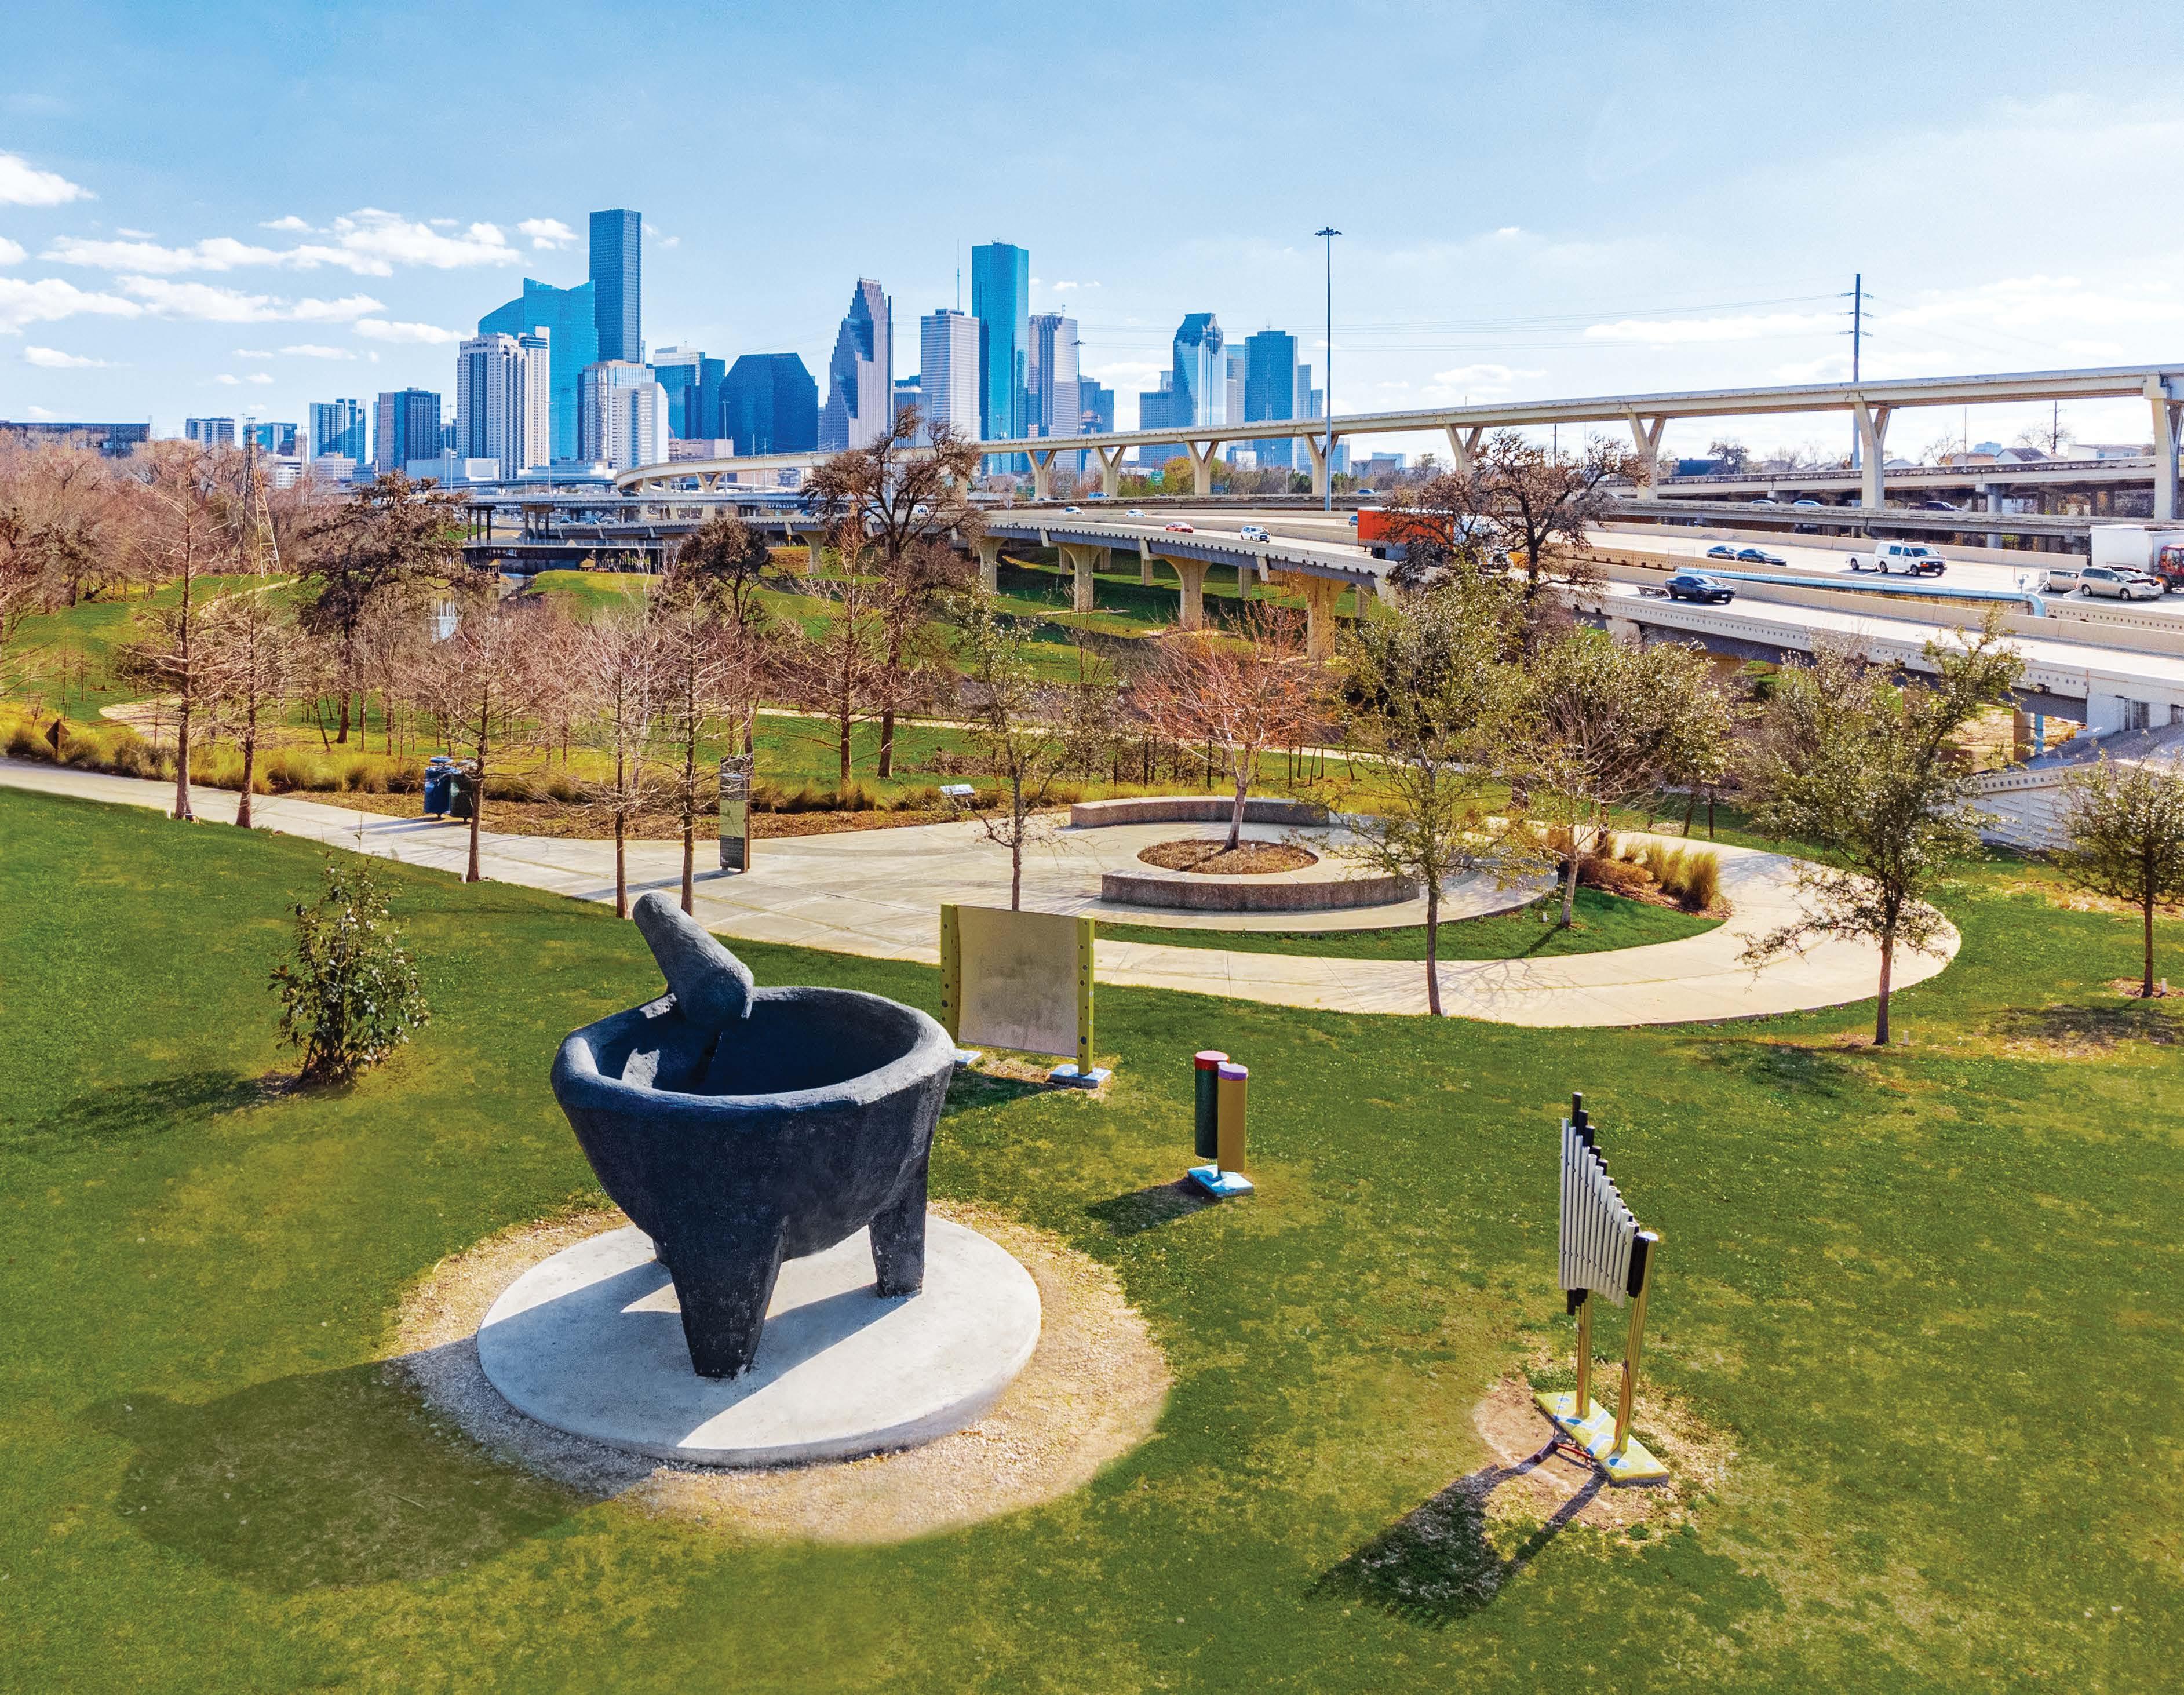
2022 began with an extremely hot real estate market fueled by record low interest rates. Competition for singlefamily homes was at an all-time high in almost every major market in the country, driving record home price appreciation. However, after several months of double-digit inflation, the Federal Reserve began an aggressive series of interest rate increases — the sharpest in decades. In a span of seven months, mortgage rates rose from 3 to 7 percent. The combination of higher interest rates and rising home price appreciation made affordability for first-time buyers more difficult than at any time in recent history. Notwithstanding strong headwinds, Latinos remain the only demographic to post eight continuous years of steady homeownership gains. In NAHREP’s annual survey and qualitative study, a consistent theme among top producing real estate practitioners emerged, showcasing the resilience and persistence of Hispanic homebuyers, which continues to elevate Hispanic homeownership in America.
CHARTS
• IN 2021, NEARLY 1/5 OF HISPANICS IN THE U.S. DID NOT HAVE HEALTH INSURANCE COVERAGE
• THE PERCENTAGE OF UNINSURED HISPANICS AGED 18–64 ROSE TO MORE THAN THREE TIMES THAT OF NON-HISPANICS BY 2021
• MEDICARE/CHIP IS THE LARGEST SOURCE OF COVERAGE FOR LATINO KIDS IN ARIZONA
Hispanic homeownership rates have experienced steady growth over the past eight years, reaching 48.6 percent. In 2022, Latinos added a net total of 349,000 homeowner households, one of the largest single-year gains for Latinos in the past 10 years.1 Since 2014, when homeownership rates among Latinos began increasing following the Great Recession, 2.3 million net new Hispanic homeowner households had been added to the market, accounting for 24.4 percent of overall homeownership growth. Today, there are 9.2 million Hispanic homeowner households. 2
In Spanis h, 'b ienes ra ic es ' means a pr operty that has root s. Fo r a La tino fa mi ly, a house is a place where family builds its root s. Bu yin g a house is an emoti onal decision because th eir home is whe re th ey see their fam il y g ro w. "
• NUMBER & RATE OF UNINSURED LATINO CHILDREN BY ARIZONA COUNTY (2018)
• HISPANICS AGED 18–29 FIND THE PROCESS TO GET MEDICAL CARE HARDER TO UNDERSTAND THAN OTHER HISPANIC AGE GROUPS
Jona Gamboa , G amboa R eal Est ate Gr ou p, Midv ale, U T
formations last year. This is in contrast to the two years prior when an unexpected boom in non-Hispanic White household formations nearly doubled that of Latino households.4 However, this shift in recent trends was expected, as the relative youth and growing population of the Latino community would add to new household formations.
In Spanis h, 'b ienes ra ic es ' means a pr operty that has root s. Fo r a La tino fa mi ly, a house is a place where family builds its root s. Bu yin g a house is an emoti onal decision because th eir home is whe re th ey see their fam il y g ro w. "
• ABOUT A THIRD OF HISPANIC ADULTS SAY THEY WOULD PREFER A HEALTH CARE PROVIDER WHO SPEAKS SPANISH
Jona Gamboa , G amboa Rea l Est ate Gr ou p, Midv ale, U T
• A GREATER PERCENTAGE OF HISPANIC ADULTS 18+ VS. NON-HISPANICS DID NOT GET NEEDED MEDICAL CARE DUE TO COST
• A GREATER PERCENTAGE OF HISPANIC ADULTS 18+ VS. NON-HISPANICS DID NOT TAKE
• MEDICATION AS PRESCRIBED TO SAVE MONEY
• A GREATER PERCENTAGE OF HISPANIC ADULTS 18+ VS. NON-HISPANICS WERE OBESE
home price appreciation continued across multiple states, including those that are more affordable and are home to large Latino populations. Florida, New Jersey, and Texas, home to a combined 19.6 million Latinos, continued to see some of the highest growth.7
• LATINO DIABETES RATES HAVE REMAINED CONSTANT OVER THE LAST DECADE IN ARIZONA (2011–2021)
• MENTAL HEALTH IN ARIZONA (FEBRUARY 2021)
Latinos are young, with a median age of 30, eight years younger than the median age of the general population. 5 Latinos also trend younger as homeowners. According to Home Mortgage Disclosure Act (HMDA) data, most (70.6 percent) Latinos who purchased a home with a mortgage in 2021 were under the age of 45, compared to 63.9 percent of the general population, and 61.5 percent of non-Hispanic White buyers. Additionally, Latinos boast the highest share of homebuyers under the age of 25. 6
• SINCE 2020, ALL RACIAL/ETHNIC GROUPS HAVE EXPERIENCED HIGHER RATES OF MENTAL DISTRESS
In 2022, Latinos added 628,000 new households, the largest growth in over a decade, and more than double that of non-Hispanic White households.
3 Latinos accounted for 38.7 percent of all household
Home price appreciation has reached unprecedented levels, hitting a new record high of 20.1 percent as of April 2022, the largest year-over-year price increase in decades. Over the last 10 years, the national home price index has more than doubled. While rising interest rates have tempered price gains toward the end of 2022, double-digit
The lack of housing for sale drives affordability challenges. In January 2022, there were fewer existing homes available for sale than at any point since the late 1990s, down 17.5 percent from the record low set a year prior. 8 The lack of housing supply is compounded by a decade-long shortfall of new construction, which fell dramatically after the Great Recession and has yet to fully recover. Additionally, more affordable homes have seen the steepest decline. According to realtor.com®, 70.5 percent of homes on the market had a list price below $350,000 in July 2015, compared to 38.5 percent in October 2022. 9
• 53% OF HISPANIC ADULTS SAY HEALTH RISKS IN JOBS ARE MAJOR REASON FOR GENERALLY WORSE HEALTH OUTCOMES
In early January of 2022, the average U.S. 30-year fixed rate mortgage was 3.22 percent. By April, average rates reached 5 percent and by October, over 7 percent. While a 7 percent interest rate is not the highest the U.S. has seen, the average 30year fixed rate hasn’t been over 7 percent since 2002.10 2022 marked the fastest interest rate increase in history. While the rapid rise in interest rates had a cooling effect on the overheated housing market, it also created new barriers to affordability.
increases to 39 percent. Latinos have the largest near mortgage-ready population of any racial or ethnic group.13
• IN 2021, NEARLY 1/5 OF HISPANICS IN THE U.S. DID NOT HAVE HEALTH INSURANCE COVERAGE
30 percent.11 This is visible across nearly every market. Despite a home’s purchase price, the rise in interest rates dramatically increased monthly mortgage payments, even in markets that experienced price reductions. In each of the markets that experienced a drop in list prices between 2021 and 2022, monthly mortgage payments increased by at least 30 percent.12
• THE PERCENTAGE OF UNINSURED HISPANICS AGED 18–64 ROSE TO MORE THAN THREE TIMES THAT OF NON-HISPANICS BY 2021
• MEDICARE/CHIP IS THE LARGEST SOURCE OF COVERAGE FOR LATINO KIDS IN ARIZONA
• NUMBER & RATE OF UNINSURED LATINO CHILDREN BY ARIZONA COUNTY (2018)
A rise in interest rates from 3 percent to 7 percent translates into a purchasing power loss of
• HISPANICS AGED 18–29 FIND THE PROCESS TO GET MEDICAL CARE HARDER TO UNDERSTAND THAN OTHER HISPANIC AGE GROUPS
As of 2022, there are 7.9 million mortgage-ready Latinos aged 45 and under and 2.8 million who are near mortgage-ready. According to Freddie Mac, 33 percent of Latinos aged 45 and under have the credit characteristics to qualify for a mortgage. Among those who don’t already have a mortgage, the share of mortgage-ready Latinos

The greatest opportunity for Latino homeownership growth exists in markets that have mortgage-ready Latinos and adequate affordability. Freddie Mac and the NAHREP have identified the top 25 markets with the most mortgage-ready Latinos aged 45 and under, ranked by share of those who can afford medianpriced homes. According to this ranking, McAllen, Texas offers the highest opportunity, followed by the Brownsville and El Paso, Texas metropolitan statistical areas (MSA).
• ABOUT A THIRD OF HISPANIC ADULTS SAY THEY WOULD PREFER A HEALTH CARE PROVIDER WHO SPEAKS SPANISH
• A GREATER PERCENTAGE OF HISPANIC ADULTS 18+ VS. NON-HISPANICS DID NOT GET NEEDED MEDICAL CARE DUE TO COST
Affordability challenges have made homeownership attainment more difficult in 2022, particularly in higher-cost markets. While Latinos tend to be concentrated in larger cities and coastal markets where home prices are high, the adoption of creative strategies to combat the tight housing market, such as pooling economic resources or relocating to more affordable areas enabled them to make homeownership gains. To this point, Hispanic homeownership also saw substantial gains in Texas and Florida, and more recently, Latinos have demonstrated an inclination to migrate to midwestern states, which have traditionally seen lower Latino populations. Real Estate practitioners cite the willingness to make sacrifices and get creative as what distinguishes Latinos from other demographics, allowing them to remain resilient despite challenges. However, encouraging housing production, reducing development costs, and investing in special purpose credit programs to help thousands of new homeowners qualify for mortgages and purchase their first home will be key to preserving homeownership growth. Given their youth, work ethic, and enthusiasm for homeownership, the country will continue to rely on Latinos to drive both homeownership rates and economic growth.
• A GREATER PERCENTAGE OF HISPANIC ADULTS 18+ VS. NON-HISPANICS DID NOT TAKE
• MEDICATION AS PRESCRIBED TO SAVE MONEY
• A GREATER PERCENTAGE OF HISPANIC ADULTS 18+ VS. NON-HISPANICS WERE OBESE
• LATINO DIABETES RATES HAVE REMAINED CONSTANT OVER THE LAST DECADE IN ARIZONA (2011–2021)
• MENTAL HEALTH IN ARIZONA (FEBRUARY 2021)
• IN 2021, NEARLY 1/5 OF HISPANICS IN THE U.S. DID NOT HAVE HEALTH INSURANCE COVERAGE
• THE PERCENTAGE OF UNINSURED HISPANICS AGED 18–64 ROSE TO MORE THAN THREE TIMES THAT OF NON-HISPANICS BY 2021
• MEDICARE/CHIP IS THE LARGEST SOURCE OF COVERAGE FOR LATINO KIDS IN ARIZONA
• NUMBER & RATE OF UNINSURED LATINO CHILDREN BY ARIZONA COUNTY (2018)
• HISPANICS AGED 18–29 FIND THE PROCESS TO GET MEDICAL CARE HARDER TO UNDERSTAND THAN OTHER HISPANIC AGE GROUPS
• ABOUT A THIRD OF HISPANIC ADULTS SAY THEY WOULD PREFER A HEALTH CARE PROVIDER WHO SPEAKS SPANISH
• A GREATER PERCENTAGE OF HISPANIC ADULTS 18+ VS. NON-HISPANICS DID NOT GET NEEDED MEDICAL CARE DUE TO COST
• A GREATER PERCENTAGE OF HISPANIC ADULTS 18+ VS. NON-HISPANICS DID NOT TAKE
• MEDICATION AS PRESCRIBED TO SAVE MONEY
• A GREATER PERCENTAGE OF HISPANIC ADULTS 18+ VS. NON-HISPANICS WERE OBESE
• LATINO DIABETES RATES HAVE REMAINED CONSTANT OVER THE LAST DECADE IN ARIZONA (2011–2021)
• MENTAL HEALTH IN ARIZONA (FEBRUARY 2021)
• SINCE 2020, ALL RACIAL/ETHNIC GROUPS HAVE EXPERIENCED HIGHER RATES OF MENTAL DISTRESS
• 53% OF HISPANIC ADULTS SAY HEALTH RISKS IN JOBS ARE MAJOR REASON FOR GENERALLY WORSE HEALTH OUTCOMES
After a record-shattering year in 2021, the housing market is at an inflection point. Higher interest rates have already taken some heat out of the homebuying market, and the large number of apartments under construction should bring some relief on the rental side. For lower-income households and households of color, though, the pressure of high housing costs is unlikely to relent. The surge in the prices of gas, food, and other necessities has made matters worse, especially now that most emergency government supports have ended. The housing stock itself is in dire need of investment to meet the demands of a rapidly aging population and the threats posed by climate change.
• THE PERCENTAGE OF UNINSURED HISPANICS AGED 18–64 ROSE TO MORE THAN THREE TIMES THAT OF NON-HISPANICS BY 2021
• MEDICARE/CHIP IS THE LARGEST SOURCE OF COVERAGE FOR LATINO KIDS IN ARIZONA
• NUMBER & RATE OF UNINSURED LATINO CHILDREN BY ARIZONA COUNTY (2018)
• HISPANICS AGED 18–29 FIND THE PROCESS TO GET MEDICAL CARE HARDER TO UNDERSTAND THAN OTHER HISPANIC AGE GROUPS
• ABOUT A THIRD OF HISPANIC ADULTS SAY THEY WOULD PREFER A HEALTH CARE PROVIDER WHO SPEAKS SPANISH
THE SOARING COSTS OF HOUSING

The costs of both owner-occupied and rental housing continue to climb (Figure 1). Home price appreciation nationwide hit 20.6 percent in March 2022—topping the previous high of 20.0 percent in August 2021 and marking the largest jump in three decades of recordkeeping. The runup has been widespread, with 67 of the top 100 housing markets experiencing record-high appreciation rates at some point over the past year. And even in the other 33 major markets, home prices increased by at least 9 percent.
• A GREATER PERCENTAGE OF HISPANIC ADULTS 18+ VS. NON-HISPANICS DID NOT GET NEEDED MEDICAL CARE DUE TO COST
• A GREATER PERCENTAGE OF HISPANIC ADULTS 18+ VS. NON-HISPANICS DID NOT TAKE
• MEDICATION AS PRESCRIBED TO SAVE MONEY
• A GREATER PERCENTAGE OF HISPANIC ADULTS 18+ VS. NON-HISPANICS WERE OBESE
• LATINO DIABETES RATES HAVE REMAINED CONSTANT OVER THE LAST DECADE IN ARIZONA (2011–2021)
Meanwhile, rents for apartments in professionally managed properties were up 12 percent nationally in the first quarter of 2022 from a year earlier, with increases in several metro areas exceeding 20 percent. Although most of the hottest rental markets were in the South and West, RealPage data indicate that some of the largest increases were in coastal metros where rents had plummeted early in the pandemic. In the New York metro area, for example, apartment rents fell 15 percent year over year in the first quarter of 2021 but then shot up by 20 percent between then and the first quarter of 2022, leaving the median rent up 11 percent on net from the early 2020 level.
• MENTAL HEALTH IN ARIZONA (FEBRUARY 2021)
• SINCE 2020, ALL RACIAL/ETHNIC GROUPS HAVE EXPERIENCED HIGHER RATES OF MENTAL DISTRESS
• 53% OF HISPANIC ADULTS SAY HEALTH RISKS IN JOBS ARE MAJOR REASON FOR GENERALLY WORSE HEALTH OUTCOMES
Rents for single-family homes rose even faster than those for apartments, pushed up by increasing demand for more living space among households able to work remotely. According to CoreLogic data, single-family rents nationally rose 14 percent in March 2022, the 12th consecutive month of record-high growth. The largest year-over-year increases were in Miami (39 percent) and Cape Coral (28 percent), as well as six other Florida metros. Other Sunbelt metros where single-family rents rose sharply include Phoenix (18 percent) and San Diego (17 percent).
Phoenix (36 percent), and Los Angeles (34 percent) at the end of 2021.
CHARTS
• IN 2021, NEARLY 1/5 OF HISPANICS IN THE U.S. DID NOT HAVE HEALTH INSURANCE COVERAGE
• THE PERCENTAGE OF UNINSURED HISPANICS AGED 18–64 ROSE TO MORE THAN THREE TIMES THAT OF NON-HISPANICS BY 2021
• MEDICARE/CHIP IS THE LARGEST SOURCE OF COVERAGE FOR LATINO KIDS IN ARIZONA
• NUMBER & RATE OF UNINSURED LATINO CHILDREN BY ARIZONA COUNTY (2018)
Adding to the pressure on prices, investors moved aggressively into the single-family market over the past year, buying up moderately priced homes either to convert to rental or upgrade for resale. CoreLogic reports that the investor share of single-family homes sold in the first quarter of 2022 hit 28 percent, well above the 19 percent share a year earlier and the 16 percent share averaged in 2017–2019. Not surprisingly, investors focused on markets with rapid home price appreciation, accounting for especially high shares of sales in Atlanta (41 percent), San Jose (38 percent),
Although leveling off from the record surge in 2021, both home prices and rents are still rising because of the severe constraints on supply. Indeed, the inventory of existing homes for sale set a new low of 850,000 units in January 2022 before edging up to 1.0 million units in April, still down 10 percent from the year-earlier level. Rental vacancy rates in the professionally managed apartment stock also reached an all-time low of 4.8 percent in the third quarter of 2021 and held at just 5.0 percent in the first quarter of 2022.
• HISPANICS AGED 18–29 FIND THE PROCESS TO GET MEDICAL CARE HARDER TO UNDERSTAND THAN OTHER HISPANIC AGE GROUPS
• ABOUT A THIRD OF HISPANIC ADULTS SAY THEY WOULD PREFER A HEALTH CARE PROVIDER WHO SPEAKS SPANISH
• A GREATER PERCENTAGE OF HISPANIC ADULTS 18+ VS. NON-HISPANICS DID NOT GET NEEDED MEDICAL CARE DUE TO COST
• A GREATER PERCENTAGE OF HISPANIC ADULTS 18+ VS. NON-HISPANICS DID NOT TAKE
• MEDICATION AS PRESCRIBED TO SAVE MONEY
Surprisingly strong household growth throughout the pandemic contributed to the sharp rise in housing costs. According to the latest Housing Vacancy Survey data, the number of new households increased at an average annual rate of 1.6 million between the first quarter of 2020 and the first quarter of 2022, only slightly below the average in the two years preceding the pandemic (Figure 2) This increase is well above the Joint Center’s baseline projection of 1.2 million new households annually in 2018–2028, the pace consistent with the underlying growth and shifting age structure of the population.
• A GREATER PERCENTAGE OF HISPANIC ADULTS 18+ VS. NON-HISPANICS WERE OBESE
• LATINO DIABETES RATES HAVE REMAINED CONSTANT OVER THE LAST DECADE IN ARIZONA (2011–2021)
• MENTAL HEALTH IN ARIZONA (FEBRUARY 2021)
• SINCE 2020, ALL RACIAL/ETHNIC GROUPS HAVE EXPERIENCED HIGHER RATES OF MENTAL DISTRESS
• 53% OF HISPANIC ADULTS SAY HEALTH RISKS IN JOBS ARE MAJOR REASON FOR GENERALLY WORSE HEALTH OUTCOMES
Much of the jump in household growth is among millennials that had delayed living on their own while in their 20s and early 30s. Indeed, the acceleration of growth in new households among adults under age 45—and particularly those in the 35–44 year-old age group—helped to lift overall household growth by an additional 400,000 annually on average over the past five years. In terms of sheer numbers, however, the 65-and-over age group still leads household growth as the large baby-boom generation moves into the traditional retirement years.
The pickup in household growth among younger adults was fueled by low unemployment and strong income gains in the years up to the pandemic, as well as the
quick rebound in the economy last year. The unemployment rate dropped from 6.7 percent in December 2020 to 3.9 percent in December 2021, and nominal wages increased by 4.9 percent. These conditions helped to provide many younger adults the financial footing to form their own households. The federal government’s steps to shore up incomes early in the pandemic— including expanded unemployment benefits, three rounds of stimulus payments, and the moratorium on student loan repayments—also kept some households intact that might otherwise have dissolved.
CHARTS
• IN 2021, NEARLY 1/5 OF HISPANICS IN THE U.S. DID NOT HAVE HEALTH INSURANCE COVERAGE
have rebounded by a solid 4.6 percentage points and 3.4 percentage points, respectively, outpacing the increases among all other age groups. As a result, the number of homeowner households under age 45 rose by 2.7 million over the past five years, to a total of 23.3 million, while their share of all homeowners increased to 28 percent.
• THE PERCENTAGE OF UNINSURED HISPANICS AGED 18–64 ROSE TO MORE THAN THREE TIMES THAT OF NON-HISPANICS BY 2021
• MEDICARE/CHIP IS THE LARGEST SOURCE OF COVERAGE FOR LATINO KIDS IN ARIZONA
• NUMBER & RATE OF UNINSURED LATINO CHILDREN BY ARIZONA COUNTY (2018)
But now with the Federal Reserve in a battle to curb runaway inflation, rising interest rates will likely slow the growth of households along with that of the economy. Even so, household formation rates among young adults are still low relative to those of previous generations at similar ages, suggesting that there is still pent-up demand among the under-45 age group. Increased immigration may also provide a near-term lift to household growth as borders reopen and immigration services return. Indeed, the Pew Research Center reports that green card issuances were back to pre-pandemic levels at the end of 2021.
• HISPANICS AGED 18–29 FIND THE PROCESS TO GET MEDICAL CARE HARDER TO UNDERSTAND THAN OTHER HISPANIC AGE GROUPS
Although their homeownership rates were essentially unchanged, the number of homeowners age 65 and over climbed even faster than the number of younger homeowners. The count of older homeowners was up by some 4.4 million over the past five years, to 27.3 million. Although most of these older households were not new homeowners, rapid growth in the 65-and-over population has pushed up their share of all homeowners to fully a third.
• ABOUT A THIRD OF HISPANIC ADULTS SAY THEY WOULD PREFER A HEALTH CARE PROVIDER WHO SPEAKS SPANISH
• A GREATER PERCENTAGE OF HISPANIC ADULTS 18+ VS. NON-HISPANICS DID NOT GET NEEDED MEDICAL CARE DUE TO COST
• A GREATER PERCENTAGE OF HISPANIC ADULTS 18+ VS. NON-HISPANICS DID NOT TAKE
• MEDICATION AS PRESCRIBED TO SAVE MONEY
• A GREATER PERCENTAGE OF HISPANIC ADULTS 18+ VS. NON-HISPANICS WERE OBESE
Even with home prices rising so rapidly, homebuying remained relatively affordable in 2020–2021. Historically low interest rates for much of this period offset the price increases, holding down monthly mortgage payments. Some 2.2 million new homeowners were added on net between the first quarter of 2020 and the first quarter of 2022, lifting the national homeownership rate 0.1 percentage point to 65.4 percent.
• LATINO DIABETES RATES HAVE REMAINED CONSTANT OVER THE LAST DECADE IN ARIZONA (2011–2021)
Households of color accounted for half of the total growth in homeowners between early 2016 and early 2022, and even a larger share (55 percent) of the increases over the past two years. Even so, disparities in homeownership remain large. In early 2022, the homeownership rates of Black households stood at just 45.3 percent—some 28.7 percentage points below the rate for white households. Although the homeownership rate for Hispanic households was somewhat higher at 49.1 percent, the gap was still substantial at 24.9 percentage points. These wide disparities are in part the legacy of centuries of discrimination—in education and labor markets as well as in housing—that has constrained the earning power of households of color.
• MENTAL HEALTH IN ARIZONA (FEBRUARY 2021)
• SINCE 2020, ALL RACIAL/ETHNIC GROUPS HAVE EXPERIENCED HIGHER RATES OF MENTAL DISTRESS
Younger buyers accounted for a substantial share of these new homeowners. Homeownership rates among households under age 35 jumped by 1.5 percentage points over this two-year period, to 38.8 percent, while the rate for households aged 35–44 rose 0.8 percentage point, to 62.3 percent. Indeed, measured from their lows in the first quarter of 2016 to the first quarter of 2022, homeownership rates for these two age groups
• 53% OF HISPANIC ADULTS SAY HEALTH RISKS IN JOBS ARE MAJOR REASON FOR GENERALLY WORSE HEALTH OUTCOMES
The sharp rise in interest rates has had an enormous impact on the costs of homeownership, making it even more difficult to close longstanding disparities. Indeed, the impact on monthly mortgage payments of the 2.0 percentage point hike in interest rates between late December 2021 and mid-April 2022 is equivalent to that of a 27 percent jump in home prices.
With prices continuing to rise along with interest rates, the savings and income needed to qualify for a home
CHARTS
• IN 2021, NEARLY 1/5 OF HISPANICS IN THE U.S. DID NOT HAVE HEALTH INSURANCE COVERAGE
• THE PERCENTAGE OF UNINSURED HISPANICS AGED 18–64 ROSE TO MORE THAN THREE TIMES THAT OF NON-HISPANICS BY 2021
• MEDICARE/CHIP IS THE LARGEST SOURCE OF COVERAGE FOR LATINO KIDS IN ARIZONA
• NUMBER & RATE OF UNINSURED LATINO CHILDREN BY ARIZONA COUNTY (2018)
• HISPANICS AGED 18–29 FIND THE PROCESS TO GET MEDICAL CARE HARDER TO UNDERSTAND THAN OTHER HISPANIC AGE GROUPS
• ABOUT A THIRD OF HISPANIC ADULTS SAY THEY WOULD PREFER A HEALTH CARE PROVIDER WHO SPEAKS SPANISH
• A GREATER PERCENTAGE OF HISPANIC ADULTS 18+ VS. NON-HISPANICS DID NOT GET NEEDED MEDICAL CARE DUE TO COST
• A GREATER PERCENTAGE OF HISPANIC ADULTS 18+ VS. NON-HISPANICS DID NOT TAKE
loan have skyrocketed, raising the financial hurdles for first-time and middle-income buyers. At today’s prices, the downpayment that a first-time buyer would have to make on a median-priced home—typically 7.0 percent of the sales price—amounted to $27,400 in April 2022. Without help from family or other sources, this requirement alone would rule out 92 percent of renters, whose median savings are just $1,500.
• MEDICATION AS PRESCRIBED TO SAVE MONEY
• A GREATER PERCENTAGE OF HISPANIC ADULTS 18+ VS. NON-HISPANICS WERE OBESE
• LATINO DIABETES RATES HAVE REMAINED CONSTANT OVER THE LAST DECADE IN ARIZONA (2011–2021)
justed Purchase Index shows a 16 percent year-overyear drop in average weekly home purchase mortgage applications. In addition, sales of existing homes were down each month from January to April, bringing the total decline so far in 2022 to 13.6 percent on a seasonally adjusted basis. Given the additional bump in interest rates in May, home sales are likely to slow even further.
• MENTAL HEALTH IN ARIZONA (FEBRUARY 2021)
Reducing the downpayment to just 3.5 percent, the monthly mortgage payment on the median-priced home would be a hefty $2,020 (Figure 3) In combination with rising prices, the recent interest rate hikes raised the minimum income needed to afford these payments from $79,600 in April 2021 to $107,600 in April 2022—effectively pricing out some 4 million renter households with incomes in this range.
• SINCE 2020, ALL RACIAL/ETHNIC GROUPS HAVE EXPERIENCED HIGHER RATES OF MENTAL DISTRESS
• 53% OF HISPANIC ADULTS SAY HEALTH RISKS IN JOBS ARE MAJOR REASON FOR GENERALLY WORSE HEALTH OUTCOMES
Between high prices and rising interest rates, the homebuying frenzy has already started to cool. As of midMay 2022, the Mortgage Bankers Association’s unad-
Although making conditions more challenging for first-time buyers, the surge in home prices has been a boon for current homeowners. Federal Reserve data show that, in aggregate, owners’ equity in real estate soared by $4.3 trillion between the fourth quarter of 2020 and the fourth quarter of 2021, to $26.4 trillion. At the same time, the amount of mortgage debt outstanding rose by only $823 billion, to a total of $11.7 trillion. By CoreLogic’s estimates, the typical US homeowner saw an increase in equity of $55,300, although state-level averages reached as high as $128,000.
• U.S. HUNGER FACTS — 2021
• ARIZONA HAS THE 24TH LOWEST FOOD INSECURITY RATE AMONG ALL 50 U.S. STATES AND D.C.
• MARICOPA COUNTY IS IN THE TOP 5 COUNTIES OF FOOD-INSECURE PEOPLE
• NAVAJO COUNTY HAS THE WORST FOOD INSECURITY IN ARIZONA FOR THE LATINO/HISPANIC POPULATION
• ARIZONA’S WIC COVERAGE WAS CONSISTENT WITH U.S. PERCENTAGE FROM 2016 TO 2019
• IN 2021, ALTHOUGH A HISTORICALLY LOW NUMBER OF SCHOOL LUNCHES WERE SERVED, NEARLY ALL WERE FREE OR REDUCEDPRICED
• SNAP* REACH IN ARIZONA — FISCAL YEAR 2022
• NAVAJO COUNTY HAD THE HIGHEST PERCENTAGE OF HISPANIC INDIVIDUALS ELIGIBLE FOR SNAP BENEFITS FROM 2017 TO 2019
• YAVAPAI COUNTY HAD THE LOWEST PERCENTAGE OF SNAP-ELIGIBLE HISPANIC INDIVIDUALS WHO ACCESSED SNAP BENEFITS FROM 2017 TO 2019
• ON AVERAGE, SNAP HOUSEHOLDS WITH CHILDREN RECEIVE 62% MORE IN MONTHLY BENEFITS THAN GENERAL SNAP HOUSEHOLDS
• THE CASH VALUE OF ARIZONA’S TOP 16 AGRICULTURAL COMMODITIES IN 2021 WAS $3.4 BILLION
• U.S. IMMIGRANTS WERE MORE LIKELY TO CONSUME MILK, FRUIT AND VEGETABLES THAN NATIVE-BORN INDIVIDUALS FROM 1999 TO 2012
143 SPECIAL FEATURE
146 IN FOCUS
149 IN FOCUS
152 IN FOCUS
154 IN FOCUS
All Things Food
Univision Communications looks at the grocery shopping habits of Hispanics in Phoenix and Tucson plus their preferences for quick service and sit-down restaurants
IMELDA HARTLEY
The AZHCC’S 2023 Entrepreneur of the Year is a True Inspiration for All Women
How Imelda Hartley got from an abusive situation in Mexico to a successful entrepreneur selling her famous tamales at Super Bowl LVII in Arizona this year is an amazing story of true grit and perseverance against all odds
Celebra con Nosotros!
When Clara Sanchez opened her café last year, she wanted to honor her roots, which is how Mis Raices Café was born
BY KAREN MURPHYRedevelopment of the Old Del Rio Landfill Site Will Change Access to Food in the Southwest
Arizona Fresh’s ambitious Agri-food Innovation Center project is on the way to revolutionize the distribution of fresh produce in the Southwest
BY MANUELA MONTOYAST. MARY’S FOOD BANK
Tackling Food Insecurity and Poverty in Arizona
St. Mary’s Food Bank, the nation’s first, not only tackles food insecurity, it offers vocational programs to help people get out of poverty
BY PAUL PADILLA157 EXCERPT Map the Meal Gap 2023
This report from Feeding America on county and congressional district food insecurity and county food cost in the U.S. has found that food insecurity among Black and Latino individuals is higher that white individuals in more than 9 out of every 10 counties
to feed families through our Zero Hunger | Zero Waste initiative.


We're ending hunger and eliminating waste in the communities we serve. In 2022, Fry's donated 13 million meals to Arizona's hungry families and diverted more than 106 million pounds of waste from landfills through our recycling, livestock feeding, and food rescue programs.
*NOTE: WIC refers to the Special Supplemental Nutrition Program for Women, Infants and Children.
*NOTE: The National School Lunch Program (NSLP) provides low-cost or free lunches to children and operates in nearly 100,000 public and nonprofit private schools (grades PreKindergarten—12) and residential child care institutions.
Source: U.S. Department of Agriculture, Economic Research Service, "National School Lunch Program," August 2022 ers.usda.gov/topics/food-nutrition-assistance/child-nutrition-programs/national-school-lunch-program
NATIONAL SCHOOL LUNCH PROGRAM* BY NUMBER OF LUNCHES SERVED AND PERCENT FREE OR REDUCED-PRICE (1971—2021)
825,700 ARIZONA RESIDENTS WERE SNAP PARTICIPANTS.
MORE THAN 69% OF SNAP PARTICIPANTS WERE IN FAMILIES WITH CHILDREN.
ALMOST 29% OF SNAP PARTICIPANTS WERE IN FAMILIES WITH MEMBERS WHO ARE OLDER ADULTS OR ARE DISABLED.
*NOTE:
MORE THAN 46% OF SNAP PARTICIPANTS WERE IN WORKING FAMILIES.
Source:
PROBABILITY
NOTE:


 BY KAREN MURPHY
Imelda Hartley has one of those life stories that seems like the plot of a Lifetime original made-for-TV movie. It has all the familiar plot twists: domestic abuse, homelessness, single motherhood—and ultimately triumph against unbelievable odds.
According to Hartley, she never really intended to come to the United States. She is originally from Culiacan, Sinaloa, Mexico. When she left her home in Mexico, she was just looking for her older brother, who she thought was living in Tijuana. She went to a local Tijuana radio station to try and call him, but after waiting five hours with no response, she gave up and left the station. She got on a bus that ended at the ocean and, with a coconut in hand for sustenance, starting walking on the beach. After Hartley walked for about an hour, she discovered she had walked right across the Mexico—U.S. border into California.
Hartley’s early life was a struggle scarred by years of violence. She endured 20 long years of domestic abuse in different relationships that produced a total of 14 kids (eight boys and six girls) before she finally broke the cycle in 2010. Three of her children were already grown by then, but after she left, she discovered she was pregnant with her youngest son, Jesus, who is turning 13 this year.
• One of Imelda’s sons is a model who goes by the name Ernesto Loxx .
• She has written a book about her life (available on Amazon) called La Guerrera De Dios (Warrior of God). It currently is only available in Spanish, but an English translation is in the works.
• She has developed a pilot program in Mexico to offer help and resources to incarcerated women and those just coming out of prison. At press time, the government of Mexico was planning to implement the program in September 2023.
• The Hope Tamale —with just chicken and green sauce—is the #1 tamale at Happy Tamales. It can also be made with pork loin.
• Her Human Project of Love gives back to the community in several ways: by paying victims of domestic violence to work at Happy Tamales when there is an event, providing food to the homeless and volunteering in the community on projects such as neighborhood cleanups and painting and reading books to children with cancer.
Newly elected Gov. Katie Hobbs stepped right into a big controversy when she decided to veto House Bill 2509 (aka The Tamale Bill) which, according to the Arizona Public Health Association, “would have expanded the kinds of homemade foods Arizonans can sell and provided a way for families to help ends meet while building safeguards against foodborne illness.” The governor cited the “increased risk of food-borne illnesses” as the reason for her veto.
The bill had bipartisan support and sailed through both the Arizona House and Senate, passing with a 45-11 vote in the House and a 24-4 vote in the Senate. After the veto, a bid in May to override the governor’s veto fell just six votes short of the needed 40 votes (two-thirds of the Arizona House).
“I respect our governor—I voted for our governor—but this veto, I do not agree with. It’s hurting our Latino community,” Imelda Hartley said in an April 25 New York Times article. The article says that Hartley pointed out that “cooking from home was the only realistic choice for immigrants, many of them undocumented, who wanted to get a toehold in running a food business. A cook can book time in a shared commercial kitchen more cheaply than renting an entire restaurant or buying a food truck, but…some of those shared spaces had long waiting lists and could be hard to reach without a car.”
So, with 11 kids to care for, she tackled the hard work of rebuilding her life. To support her kids and pay her bills, she sold tamales on the weekends—a few hundred a month outside the Econo Wash laundromat (1420 W. Indian School Rd., Phoenix).
To better herself, she also got involved with the Arizona Hispanic Chamber of Commerce and participated in all the workshops and seminars the chamber offered. However, it was a program offered by the Consulate General of Mexico in Phoenix that she credits with her business success: The Consular Entrepreneurship Program for Mexican Women Abroad. The program began in January 2021 as a pilot program to provide entrepreneurial tools for Mexican women to either start a business or grow an existing business. The third edition of this highly successful program just ended at the end of July.
The rest of Hartley’s story is the truly inspiring part.
From the Arizona Public Health Association
What’s All the Tamal Drama About?
https://azpha.org/2023/04/20/whats-all-the-tamale-drama-about/
From The New York Times (April 25, 2023)
The Hot Issue Bedeviling Arizona’s New Governor: Tamales nytimes.com/2023/04/25/us/arizona-tamales-katie-hobbs-veto.html
From Phoenix New Times (April 27, 2023)
Katie Hobbs Gets Singed After Unwrapping Tamale-tastrophe
phoenixnewtimes.com/news/katie-hobbs-faces-tamale-backlashfrom-cottage-food-vendors-16095547
This year, her company Happy Tamales participated in the Taste of the NFL as one of the three PepsiCo Foundation IMPACTO Hispanic Business Accelerator and Juntos Crecemos Program chefs for Super Bowl LVII in February. The event also featured several of Arizona’s finest chefs and was led by five all-star celebrity chefs: Andrew Zimmern, Carla Hall, Tim Love, Lasheeda Perry and Mark Bucher. For the events, Hartley’s company made 7500 tamales. As part of Pepsico’s Juntos Crecemos: Jefa-Owned, which supports Latina-owned restaurants, bodegas and carnicerías, Hartley received a $10,000 check to support her business. She was also awarded the exclusive Jefa-owned neon sign, which celebrates the heart and soul Latinas bring to the table.
As a result of the exposure she received from the Super Bowl experience, she received a call from a restaurant owner in Utah because his wife heard Hartley’s incredible story. As a result of that call, she will begin making 10,000 tamales a month in October for Señor Pollo Mexican Grill, a chain of Mexican restaurants with seven locations in Utah—and two more opening in Salt Lake City. Hartley says she also recently received a call from a restaurant in Kentucky that was interested in her tamales. Right now, though, she says that offer is on hold while she focuses on the Señor Pollo job.
She also was named 2023 Entrepreneur of the Year by the AZHCC during the chamber’s annual Black and White Ball and Business Awards, which was held May 6 at the Arizona Grand Resort & Spa in Phoenix.
Hartley is both tireless and fearless—and leads by example. She volunteers at several organizations and wants other women to know that they are not alone and can escape abuse and have the lives they deserve. She named her company Happy Tamales to foster hope and positivity. Even all the tamales have own inspirational names like Hope, Empowerment, Gratitude, Joy and New Beginning—for added encouragement.
Karen Murphyis anAZHCC staffwriterand copyeditor/proofreader.
Happy Tamales ORDER ONLINE
623.216.0681
imeldahartley@gmail.com
imeldahappytamales.com
NOTE: At press time, only catering and deliverywere available, but Hartleywas looking for a kitchen that allowed pick-up and delivery options.
Consular Entrepreneurship Program for Mexican Women Abroad
Consulate General of Mexico in Phoenix
602.242.7398
consulmex.sre.gob.mx/phoenix
 BY KAREN MURPHY
It was a random message on Instagram that changed Clara Sanchez’s life. She went from happily selling her cold brew concentrates and bags of coffee at pop-ups around the Valley to opening a charming brick and mortar store in the lively Grand Ave. district in Phoenix.

Sanchez was at first skeptical about the message that said there was a rental space available on Grand Ave. because she did not know the person who sent it. At the time, she had been thinking about getting a trailer or a food truck so she could have a mobile coffee shop and not have to pay rent. She discussed her concerns with her husband, who told her that he thought they should just go take a look at the Grand Ave. spot.
Since Sanchez was raised in Mexico and not Phoenix, she didn’t really know anything about the history of Grand Ave. and how much
it has changed—and gentrified—in recent years. It is now similar to Roosevelt Ave. and is becoming known for its interesting art galleries and many shops and restaurants.
WhenClaraSanchezopenedhercafélastyear,shewanted to honor her roots, which is how Mis Raíces Café was born
Clara Sanchez says customers love the Horchata, but when asked, she recommends her favorite drink: Marias, which has a vanilla flavor similar to the cookies of the same name.
From Phoenix magazine (August 25, 2020)
Grand Avenue Mural Guide
phoenixmag.com/2020/08/25/grand-avenue-mural-guide
Grand Avenue Arts & Preservation grandavenueartsandpreservation.org
Grand Avenue Members Association https://www.historicgrandave.com
History of Grand Ave.
http://historicgrandave.com/team-3
From the SCA Journal (Spring 2008)
The Lone Diagonal in a Grid Town
What’s Grand About Grand Avenue neonmotel.com/download/grand.pdf
“As soon as we walked into the space,” she says, “[we knew we wanted it.] It’s small and cute and in a great area.”
Once they committed, it took just five days to get the contracts signed.
“It was just meant to be for us,” Sanchez says. “And it is doing great since we opened.”
Although Sanchez was born in California, her parents decided to move back to Mexico and raised her in Guadalajara, Mexico, where they ran a tortillería for about 20 years. She worked with her parents at the tortillería when she was a teenager, but when she turned 18 in 2008, she decided to go back to the United States. She arrived knowing no English and admits that it was hard in the beginning, but she enrolled in ESL classes and feels that her English continues to get better.
It was in 2021 when she officially launched her business as Mis Raíces and began taking pre-orders for her cold concentrate. She designed her own logo, with the “R” and the “S” representing her husband’s last name and her last name. The two hands represent holding hands with her husband, honoring what they have built together. And the leaves represent their two children.
After just one year of selling her products at pop-ups, she got that random message that led to the opening of Mis Raíces Café on Grand Ave. in July 2022. The café sells a variety of hot and cold coffees, teas, smoothies and other refreshing drinks. There also are light breakfast offerings (a selection of croissants and bagels) and a variety of homemade pastries made by a local woman licensed to bake in her home.
When Mis Raíces Café first opened, Sanchez planned to change the menu each week. After a year in business, however, she reconsidered that idea and has decided to keep the menu the same. She may, however, add a few new drink flavors.
Looking ahead to the future, she would like to open two more locations of Mis Raíces Café—one in the East Valley and one in the West Valley. In that way, she says, she will cover the east, central and west locations in the Phoenix metro area.
When asked if she had any advice for people who wanted to follow in her footsteps and open their own food-related businesses, she had one main piece of advice: “Don’t be afraid to ask questions and look for help.” She readily admits that asking others for advice “was her biggest fear,” and she wishes she had done it sooner. “If it is meant to be for you, go ahead and do it,” Sanchez says. “If you love what you’re doing, try it and see what happens.”
Karen Murphyis anAZHCC staffwriterand copyeditor/proofreader.FIRST FRIDAYS ART WALKS
First and Third Fridays
6-9pm
Take a stroll down the avenue to visit the local art galleries, restaurants and shops. facebook.com/FirstFridayOnGrandAve
SAT, NOV 4, 2023
Grand Ave. Festival
1301 Grand Ave. 11am—7pm
An arts-centric festival that highlights the small businesses in the area (Grand Ave. at 7 th Ave. and Van Buren north to Roosevelt).
A wholesale market plays a pivotal role in a local economy by facilitating bulk transactions between manufacturers, producers, retailers and businesses. It is an intermediary that streamlines the distribution of goods from manufacturers to end users and is a central platform where buyers and sellers can come together to conduct large-scale transactions. Both sellers and buyers benefit from the increased efficiency and cost-effectiveness of wholesale markets.
The absence of a modern large-scale wholesale market in the greater Phoenix area has left a significant void in the distribution of food within the Southwest. Arizona’s bilateral trade with Mexico highlights the critical need to have efficient distribution channels. With more than $2 billion worth of fresh produce exported from Mexico to the U.S. annually, a modern wholesale market in the greater Phoenix area would meet the needs of both local consumers and regional customers.
Enter the Arizona Fresh Agri-food Innovation Center. This visionary project from Arizona Fresh Holdings LLC will redevelop the Del Rio former landfill site, which has sat dormant for more than 40 years, from a food desert into an opportunity zone. The plans call for a state-of-the-art wholesale produce distribution center, a retail food market, a community park and education and research facilities related to food, agriculture and education. The center will serve more than 27 million people, which is 7% of the total population of the United States.
The Arizona Fresh Wholesale Market will be the centerpiece of the Agri-Food Innovation Center. The market will be a distribution hub for the five southwestern states—Arizona, New Mexico, Utah,
Nevada and Colorado. By eliminating the multiple handoffs in the current distribution chain, the market also will deliver produce to customers in the Phoenix metro area faster, in fresher condition and at a lower cost.
The community benefits of this initiative are equally impressive. The project will span 20 acres of riverfront parkland between 7th and 16th streets on the south bank of Salt River in south Phoenix. It is the ideal location to develop a project of this magnitude and only a few miles from Downtown Phoenix and Sky Harbor Airport and adjacent to the Industrial District. It will create open spaces for family gatherings, playgrounds, hiking trails and a public amphitheater. These community spaces will host concerts, festivals and special events, fostering a mixed-use environment with potential opportunities for restaurants and additional retail spaces.
The project will have four phases of planned development. Phase I is projected to include 132,000 sq. ft. of wholesale produce distribution space and 600,000 sq. ft. of industrial space. In Phase I, the Arizona Fresh Wholesale Produce Market will be established, with dozens of producers bringing a wide variety of produce. There will be educational programs on topics such as sustainability, data analytics, wellness and nutrition and food safety, in addition to other technology-driven topics. A pedestrian-friendly community park system and other community amenities are expected to be available by 2030 in addition to 250,000 square feet for foodrelated business. All of Phase I is expected to be completed within the next 4—5 years.
Phases II—IV will offer additional community benefits: an AgriFood Research Center, test fields to improve the production and delivery of fresh produce, a start-up incubator and conference center and a multitenant office park for strategic partners. At this time, no completion dates have been announced for these phases.
With a modern wholesale and inclusive market at its core, the Arizona Fresh Agri-food Innovation Center is poised to revolutionize
the distribution of fresh produce. By bridging the gap in the supply chain, this initiative will not only benefit local businesses and consumers but will also contribute to the economic growth and prosperity of the entire Southwest. It is a transformative step toward a more efficient, sustainable and connected regional agricultural ecosystem.
Marcos Gaucin and his colleagues at St. Mary’s Food Bank have a holistic mindset: “People do better when they have enough to eat.”
Gaucin has been the Chief Programs Officer for the food bank for the last five years. Before that, he served 12 years in the food bank’s finance department. His interpretation of the mission of St. Mary’s Food Bank is simple: help those who are experiencing food insecurity and provide a path out of poverty.
For the first issue, St. Mary’s Food Bank offers a variety of programs to address food insecurity. It essentially operates as a distribution center and relies on its agency partner networks (such as schools, faith-based groups, community centers and other nonprofits), mobile distributors, home delivery and their client service centers (in Phoenix and Surprise) to distribute food to underserved families. The nonprofit serves 10 of the 15 Arizona
counties, distributing food as far south as Casa Grande and as far north as Colorado City. From east to west, they work from the New Mexico border to the California/Nevada border.
To pave the way forward out of poverty, St. Mary’s Food Bank also offers vocational programs. The Skills Center offers free job training through their Community Kitchen and LIFT programs, which provide culinary and warehouse training, respectively. In addition to vocational skills, the instructors at the Skills Center also help students develop important life skills such as building healthy relationships, wearing appropriate work attire and always being on time.
Once program training, which ranges from six to nine weeks, is completed, St. Mary’s offers job placement assistance for its students. It has partnered with employers within Arizona that
that St. Mary’s Food Bank was the nation’s first food bank?
It was established in the late 1960s by retired businessman John van Hengel, who also created a national organization for food banks in 1979 called Second Harvest, which became Feeding America in 2008. —Feeding America
A key aspect of the Skills Center is to foster a nonjudgmental, inclusive environment. Anyone over the age of 18 years old who has experienced issues obtaining employment is welcome to apply for the nonprofit’s vocational programs, regardless of their background or history.

“Our ultimate goal,” Gaucin says, “is to provide service to anyone who comes to our door, without exception.”
From Gaucin’s perspective, the work done at St. Mary’s Food Bank to provide food to the underserved community also carries cultural significance. Food plays such an integral role in households, particularly in the Hispanic community. Many Hispanic cultural events and holidays center around family and food. Being able to provide food for families in need, he explained, alleviates one key
The work St. Mary’s Food Bank is doing is more critical than ever. In fiscal year 2023, the nonprofit distributed 116 million pounds of food to people in need.
VOLUNTEER
A FOOD/ FUND DRIVE CORPORATE GIVING
Just $1 provides five meals. secure3.convio.net/smfba/site/ Donation2?df_id=7862&7862. donation=form1
stmarysfoodbank.volunteerhub. com/vv2
firstfoodbank.org/get-involved/ feedaz
source of stress, which allows a family to focus on other important aspects of their family’s well-being.
The food St. Mary’s provides is both healthy and culturally relevant in addition to being sustainable. Fresh produce is a major portion of the food the food bank provides—and it is produce cultivated
by farmers in Arizona, California and Mexico. Then, it is shipped to produce houses in Arizona, where St. Mary’s Food Bank obtains its goods.
Most of the produce that St. Mary’s receives is donated by growers and produce houses from their excess supply. This is a smart, sustainable approach that reduces the amount of fruits and vegetables that would otherwise go to waste.
In the most recent fiscal year, St. Mary’s Food Bank had 1.9 million visits, which is a 12% increase over the previous fiscal year and the most visits in the food bank’s 56-year history. Gaucin attributes this increase to two unfortunate circumstances: the end of the COVID-19 relief funds program and inflation, which has dramatically driven up the cost of food.
Regardless of a family’s circumstances, though, St. Mary’s will never turn anyone away.
“If you come to us and you’re hungry,” Gaucin says, “we’re going to give you something to eat.”
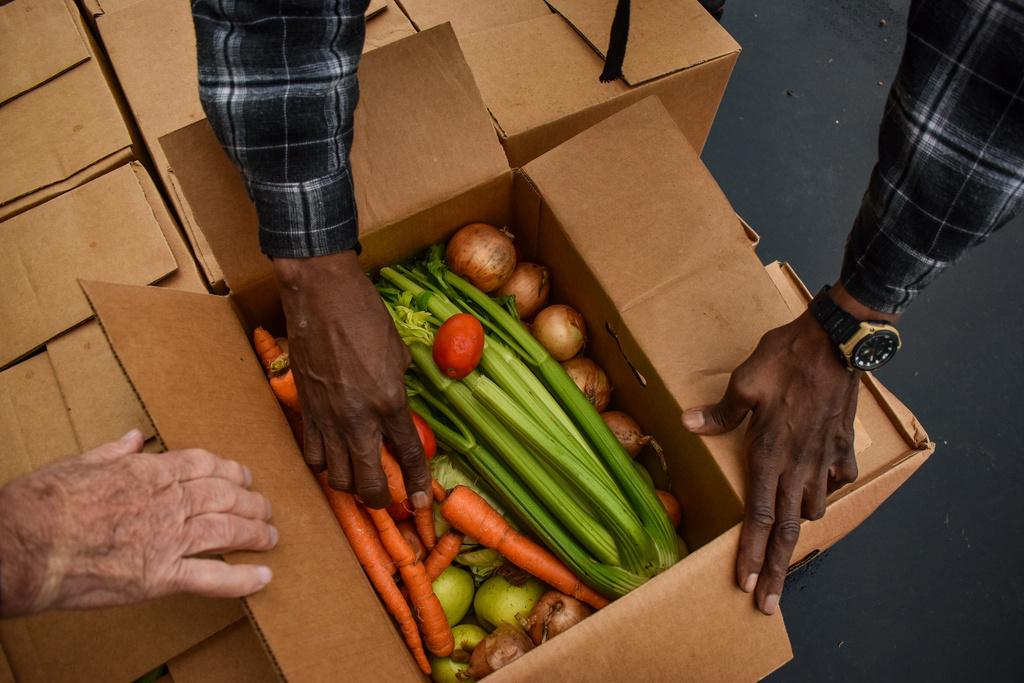


Below are 10 key findings from this year's release of M Map the Meal Gap.
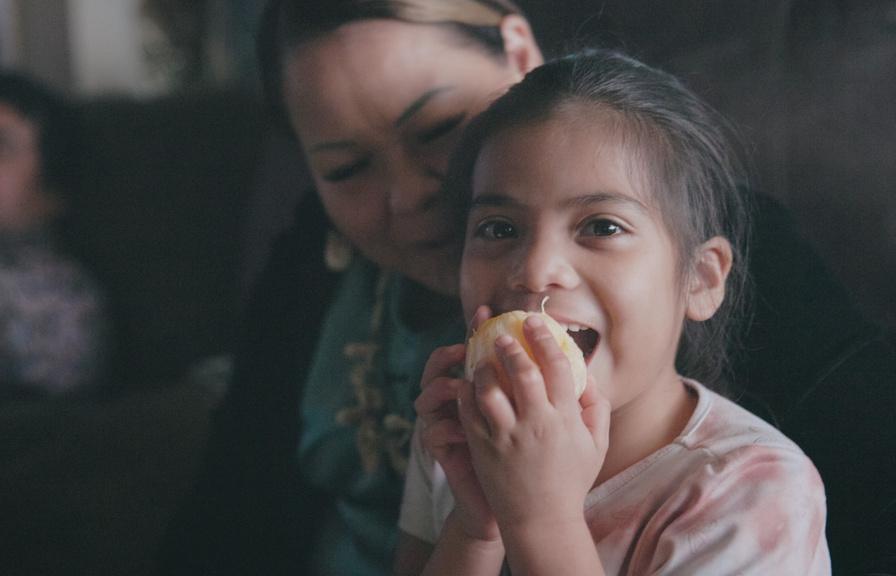
People in all 3,143 counties and 436 congressional districts in all 50 states and D.C. experience food insecurity. However, levels of food insecurity vary by population and place. The percentage of the overall population estimated to be food insecure ranges from a low of 2% in Griggs County, North Dakota to 26% in places like Kusilvak Census Area, Alaska. These variations reflect differences in factors such as unemployment and poverty, and often reflect systems and policies that prevent certain households and communities from accessing the food they need. In response to these challenges, multiple interventions have been shown to reduce food insecurity. For example, national food insecurity would likely have been much higher in 2020 and 2021 if not for the unprecedented collective response by the charitable and public sectors to the public health and economic crises caused by COVID-19. Of particular note for 2021 was the 20% increase in the Thrifty Food Plan which led to large increases in benefits for all SNAP recipients.
Disparities by race and ethnicity existed before and continue to be stark during the second year of the COVID-19 pandemic. In nearly 99% of counties with comparable data (1,431 out of 1,452), food insecurity among Black individuals is higher than among white, non-Hispanic individuals; these disparities range in magnitude and are as high as 48 percentage points in Cumberland County, Tennessee (59% versus 11%, respectively). In nearly 96% of counties with comparable data (1,695 out of 1,771), food insecurity among Latino individuals is higher than among white, non-Hispanic individuals; these disparities also range in magnitude and are as high as 26 percentage points in Jackson County, Arkansas (42% versus 16%, respectively). In nearly 82% of counties with comparable data (906 out of 1,109), food insecurity among Black individuals is higher than among Latino individuals; these disparities range in magnitude as well and are as high as 37 percentage points in Cumberland County, Tennessee (59% versus 22%, respectively).
At the local level, estimated food insecurity rates among Black individuals range from less than 1% in Wright County, Minnesota, to 59% in Cumberland County, Tennessee. Food insecurity rates among Latino individuals range from approximately 3% in Calvert County, Maryland, to 42% in Jackson County, Arkansas. Food insecurity rates among white, non-Hispanic individuals range from less than 1% in the District of Columbia to 28% in Wolfe County, Kentucky.
While approximately 13% (1 in 8) of children across the U.S. may experience food insecurity, estimated rates reach as high as 43% (1 in 2) in East Carroll Parish, Louisiana. Food insecurity is also more prevalent among children than it is among the total population in every state and in more than 8 out of 10 counties (2,593 out of 3,143). The consequences and costs of food insecurity for children of all ages make addressing the issue an economic and social imperative as research demonstrates links between food insecurity and poor child health and behavioral outcomes at every age.
Federal programs like the Supplemental Nutrition Assistance Program (SNAP), the nation’s largest food assistance program, are the first line of defense against hunger. Unlike assistance provided by food banks and similar organizations, however, availability of government support typically varies based in part on household income. In the case of SNAP, state income thresholds range from 130% to 200% of the federal poverty line (between $39,000 to $60,000 for a family of four as of January 2023). Moreover, many households that are eligible under the gross income test may not be eligible under the net income test and, in states not waiving the asset test, many households are ineligible even if they meet the gross and net income tests. County estimates indicate that 12.5 million or 37% (1 in 3) of individuals experiencing food insecurity may not be eligible for SNAP, after accounting for state-specific gross income limits. In some counties, everyone who is estimated to be food insecure likely qualifies for SNAP; however, the share of people experiencing food insecurity who are likely ineligible for the program is estimated to be as high as 96% in Loving County, Texas. The fact that not everyone who qualifies for SNAP is enrolled and receiving benefits further underscores the importance of charitable food assistance and the need to not only protect and strengthen federal nutrition programs, but also increase enrollment.
A person who is food insecure reports needing, on average, an additional $20.91 per week or $53 per month to buy just enough food to meet their needs. This represents an increase of nearly 16% from 2020 after adjusting for inflation ($17.25 in 2020 is equivalent to $18.06 in 2021 dollars) and the first time the weekly shortfall has surpassed $20. The total annual food budget shortfall across all individuals estimated to be food insecure stands at $21.5 billion, up from $20.0 billion in 2020 ($21.0 billion in 2021 dollars). The national annual shortfall is still well below its peak of more than $24 billion in 2013 and 2014 ($28 billion in 2021 dollars) despite the recent increase in the weekly per capita amount due to the steady decline in the number of individuals experiencing food insecurity (from 49.1 million in 2013 to 33.8 million in 2021).
The South contains 45% of all U.S. counties but was home to an estimated 83% of counties with the highest rates of food insecurity (267 of the 321 counties in the top 10% of all 3,143 counties). One in 5 (19%) counties in the South had high food insecurity (with rates of 16.1% or greater), compared to 1 in 25 (4%) in the West and 1 in 30 (3%) in the Midwest. Bronx County, New York is the sole county in Northeast (1 in 217 or 0.5%) that appears in the top 10%. These regional disparities at the local level are consistent with national data from the USDA, which also show that individual food insecurity rates are higher in the South (11.4% as compared to 10.3% in the West, 10.1% in the Midwest, and 8.6% in the Northeast).
Rural counties (those outside of major metropolitan areas) make up 63% of all U.S counties but represent 89% of counties with food-insecurity rates in the top 10% (285 out of 321). In other words, counties with the highest rates of food insecurity are disproportionately rural. This also reflects the sharp disparity in food insecurity rates across the U.S. While overall rates of food insecurity are similar across metro (urban) and non-metro (rural) areas there are pockets of very high rates in rural areas.
9
The national average cost per meal was $3.59
Individuals who are food secure reported spending an average of $3 59 per meal, up from $3 25 in 2020 ($3 40 in 2021 dollars) and the highest reported amount since 2005 ($3 41 in 2021 dollars) At $3 59 per meal, a person who is food secure spends an average of $327.59 on food per month ($353.48 in February 2023 dollars). For context, this reported amount is 1 6 times as much as the average individual cost of the Thrifty Food Plan ($203 11 as of December 2021), which represents a nutritious, practical, cost-effective diet and what the USDA uses to calculate the maximum SNAP benefit allotments Prior to the update of the TFP in 2021, people who were food secure reported spending nearly 1 9 times as much as the TFP ($296 56 versus $158 57 as of December 2020)
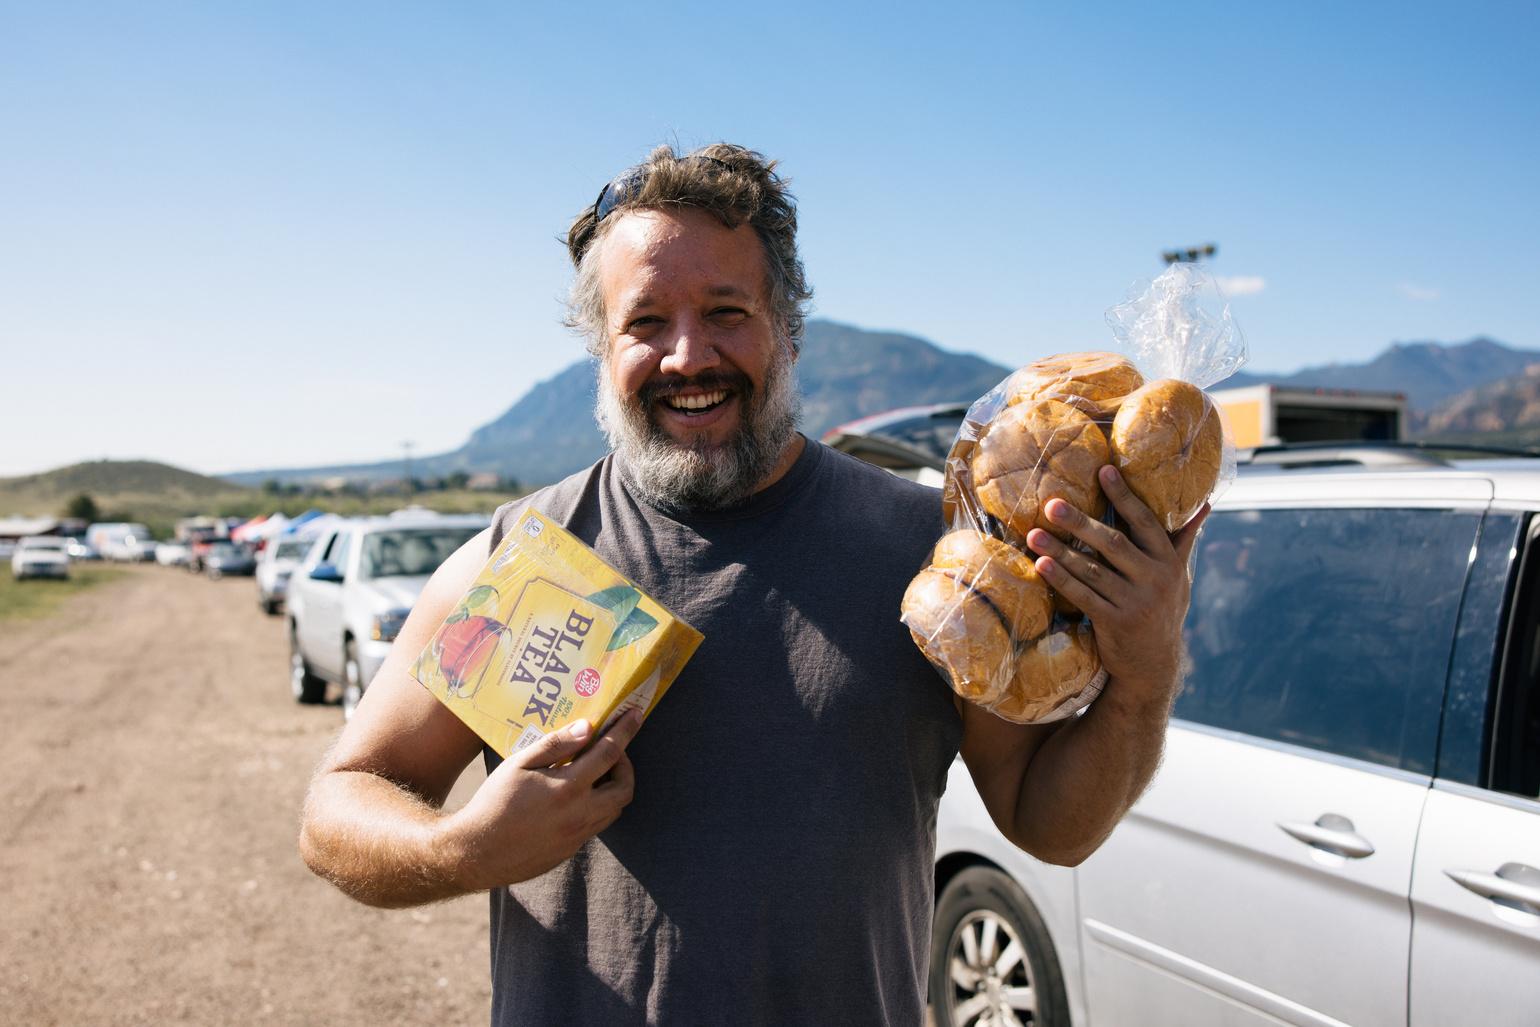
10 County meal costs range from $2.73 to $7.89.
County meal costs range from 76% of the national average ($3 59) in Dimmit County and Maverick County ($2 73) along the southwest border of Texas to close to twice the national average in places like New York County, New York ($5 93), after accounting for local sales taxes and using county food price data from NielsenIQ Although the greatest number of people live in urban areas, not all urban areas have high food prices, and not every rural community is affordable. For example, urban Bexar County in Texas where San Antonio is located has a relatively low estimated meal cost of $3 21 while rural Leelanau County in northwest Michigan is home to the highest meal cost in the country ($7 89) For a household struggling to afford housing, utilities, transportation and other necessities, the additional burden of high food prices can have a significant impact on a household’s budget
165–169
• PHOENIX IS AMONG THE CITIES WITH THE MOST NUMBER OF HIGH OZONE DAYS
• HISPANICS/LATINOS ARE ALMOST 50% MORE LIKELY TO LIVE IN AREAS IN THE U.S. WHERE CLIMATE CHANGE WILL ADVERSELY AFFECT WORK HOURS
• MORE THAN TWO-THIRDS OF ARIZONA’S ELECTRICITY IS COMPRISED OF NATURAL GAS AND NUCLEAR ENERGY
• ARIZONA’S WATER SUPPLY VS. WATER USE
• AS OF 2021, GASOLINE FUEL CONSUMPTION IN ARIZONA IS BACK TO PRE-PANDEMIC LEVELS
• GASOLINE VEHICLES ARE RESPONSIBLE FOR NEARLY 50% OF ALL CO2 EMISSIONS IN ARIZONA
• SINCE 2020, THERE HAS BEEN A SPIKE IN HEAT-CAUSED AND HEAT-RELATED DEATHS IN ARIZONA
• SINCE 2017, HEAT-CAUSED DEATHS IN ARIZONA SUFFERED BY HISPANICS HAS BEEN TRENDING UPWARD
• HISPANICS IN THE U.S. EXPERIENCE MORE HIGH TEMPERATURE DAYS IN A YEAR THAN ANY OTHER RACIAL/ETHNIC GROUP
170 IN FOCUS 173 EXCERPT 177 EXCERPT
GreenLoop, a local startup, has an ambitious plan to provide a sustainable solution for the construction industry
BY MIJAIL ZEGALOThe U.S. Environmental Protection Agency has a dire warning for minorities about the effects of climate change on their communities
The consequences are dire and affect both the nation’s gross national product (GDP) in addition to workers’ health
Caring, giving and making things better. It all starts by working together. Join us in celebrating the power of community.

HISPANICS/LATINOS ARE ALMOST 50% MORE LIKELY TO LIVE IN AREAS IN THE U.S. WHERE CLIMATE CHANGE WILL ADVERSELY AFFECT WORK
NOTE: The bar charts present the relative likelihood that weather-exposed workers in each socially vulnerable group (e.g., Hispanic/Latino) currently live in areas with the highest projected labor hour losses relative to their reference populations (e.g., non-Hispanic/non-Latino). Positive percentages indicate higher comparative risk and negative percentages indicate lower comparative risk. Levels of global warming are relative to the 1986—2005 average.
LIKELIHOOD (BY PERCENTAGE) OF LIVING IN AN AREA WITH THE HIGHEST PROJECTED LABOR HOUR LOSSES DUE TO INCREASES IN HIGH-TEMPERATURE DAYS3.6ºF GLOBAL WARMING
MORE THAN TWO-THIRDS OF ARIZONA’S ELECTRICITY IS COMPRISED OF NATURAL GAS AND NUCLEAR ENERGY
“Without meaningful action to reduce emissions and/or adapt to extreme heat, labor productivity losses could double to nearly $200 billion by 2030 and reach $500 billion by 2050.”
—Atlantic Council, August 2021
AS OF 2021, GASOLINE FUEL CONSUMPTION IN ARIZONA IS BACK TO PRE-PANDEMIC LEVELS
NOTES: *Light-duty vehicles excluding fuel cell electric **Based on assumptions with 2021 data from Energy Information Administration (EIA).
*NOTE: Heat-caused deaths are deaths where the primary cause of death is listed as exposure to excessive natural heat.
SINCE 2020, THERE HAS BEEN A SPIKE IN HEAT-CAUSED AND HEAT-RELATED DEATHS IN ARIZONA
*NOTE:
IN THE U.S. EXPERIENCE MORE HIGH TEMPERATURE DAYS IN A YEAR THAN ANY OTHER RACIAL/ETHNIC GROUP
Consider this alarming fact: Less than 9% of the plastic produced in the world is currently recycled. The truth is that are simply not enough companies that add value to post-consumer plastic. GreenLoop strives to change that fact.
GreenLoop, a local Arizona startup with Latin American roots, has a single goal: to provide a sustainable solution for the construction industry by producing plastic wood that is made from recycled plastic and fiber waste. By using recycled materials, the company will significantly benefit the environment by helping to reduce the amount of plastic waste while providing a valuable resource for construction projects. It is a solution that is both sustainable and local.
GreenLoop has three main needs:

• to create alliances with construction companies, design studios, architectural firms and local flooring companies that would be interested in using and selling the company’s products;
• to form partnerships with social clubs, universities and local organizations to plan the collection of plastic; and
• to connect with impact-driven angel investors and supporters for our GoFundMe campaign.
• Every hour, 2.5 million plastic bottles are thrown away in the U.S.
• Between 75 and 199 million tons of plastic are currently in our oceans.
• Plastic bottles take upward of 450 years to degrade.
• Of the 40 million tons of plastic waste generated in the U.S. in 2021, only 5% to 6% — or about two million tons — was recycled.
—2022 Recycling Statistics from the World Economic Forum
Our mission is to encourage recycling practices in local communities and, in effect, play an active role in the growth of the city, both in economic matters and in sustainable education.
We would like to encourage the participation of both local citizens and public and private institutions to produce the raw material we will need to turn plastic garbage from waste into useful products such as decking, fencing, ceilings and siding, or tables, benches and chairs.
Phoenix can easily improve its waste management by using plastic wood. Research has shown that the amount of this material thrown in the garbage is double what ends up in recycling bins. To make the Greater Phoenix area a greener city is an important and achievable goal.
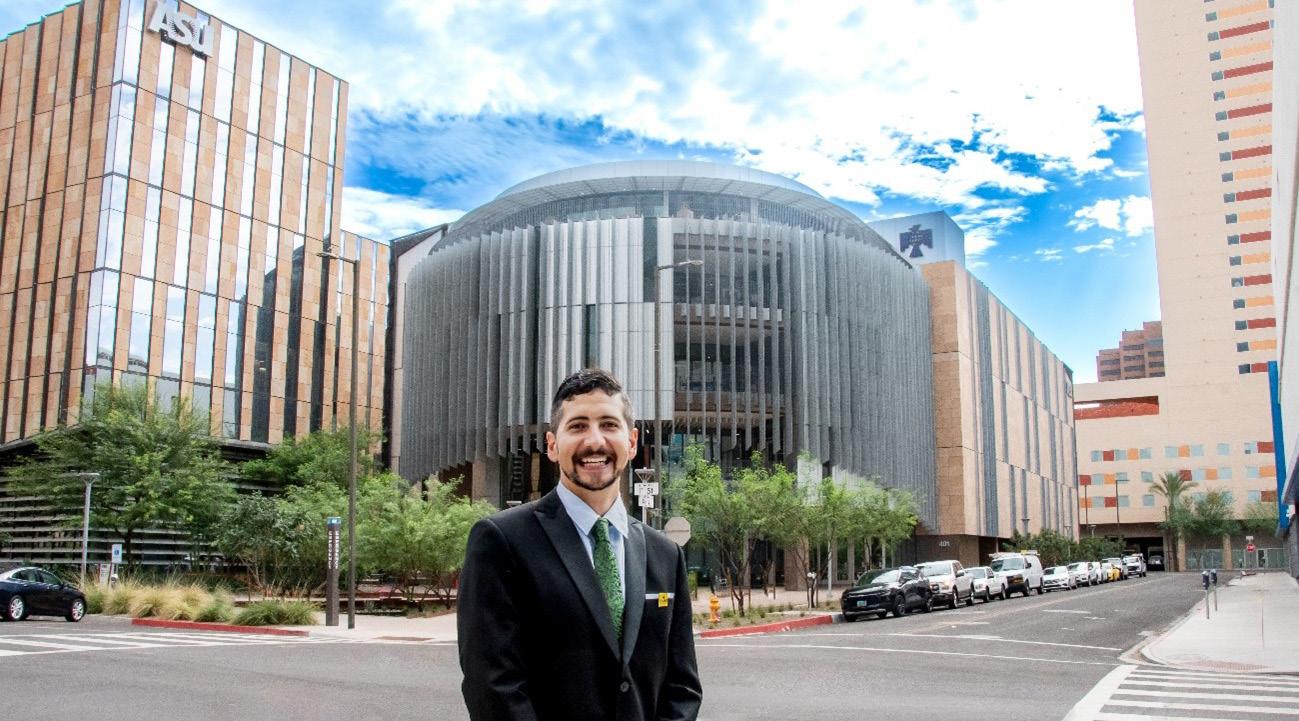
Plastic wood or wood—plastic composites (WPCs), offer five key benefits over traditional wood or plastic materials:
GreenLoop
480.803.7097 info@greenloop.com.ar
www.greenloop.com.ar
Instagram: Greenloop.us
LinkedIn: greenloopar
BECOME A SPONSOR
greenloop.com.ar/sponsor
The campaign was started to raise the funds needed to buy the necessary equipment and establish the company’s first facilities in Argentina. There are plans to expand to other locations in the United States and Africa.
DONATE NOW
Center for Entrepreneurial Innovation (CEI)
275 N. Gateway Drive Phoenix, AZ 85034
602.286.8950 infocei@ceigateway.com ceigateway.com
Venture Café Phoenix venturecafephoenix.org
J. Orin Edson Entrepreneurship + Innovation Institute at ASU Venture Devils Demo Day entrepreneurship.asu.edu/funding-resources/venturedevils-demo-day
Thunderbird School of Global Management
401 N. 1 st St. Phoenix, AZ 85004 602.496.7000 thunderbird.asu.edu/
From National Geographic 7 Things You Didn’t Know About Plastic (and Recycling) blog.nationalgeographic.org/2018/04/04/7-things-youdidnt-know-about-plastic-and-recycling
From the World Economic Forum Top 25 recycling facts and statistics for 2022 weforum.org/agenda/2022/06/recycling-global-statisticsfacts-plastic-paper
From the U.S. Environmental Protection Agency Draft National Strategy to Prevent Plastic Pollution epa.gov/circulareconomy/draft-national-strategy-preventplastic-pollution
Frequent Questions on Recycling epa.gov/recycle/frequent-questions-recycling
• Durability: The product is resistant to rot, decay and insect damage.
• Low maintenance: There is no painting, staining or sealing required.
• Environmentally friendly: It reduces deforestation by using recycled materials.
• Moisture resistance: It does not absorb water, which prevents rotting or warping.
• Longevity: It lasts longer, which reduces the need for replacements.
Community engagement is an important part of GreenLoop’s strategic plan. The company plans to encourage local businesses and community members in our first two locations in Argentina and Phoenix to become actively involved in recycling to become the solution to, not the creators of, plastic waste.
In February 2023, GreenLoop won first place in the Thunderbird School of Management’s annual Pitch Competition. Then, in April, the company won two additional awards: one at the Venture Devils Demo Day at the J. Orin Edson Entrepreneurship + Innovation Institute, the most competitive pitch competition at ASU and at the Venture Café Phoenix, which is hosted by the Center for Entrepreneurial Innovation (CEI).
These awards validate the mission of the GreenLoop project and have given it greater exposure in the community.
Mijail Zegalo is the founder and manager of GreenLoop, a company thatwas createdto produce plastic lumber.The companyhas plansfor two locations: Santa Fe, Argentina and Phoenix. Zegalo has a chemical engineering degree from the Universidad Nacional del Litoral (FIQ — UNL)inSantaFe,Argentinaandmaster’sdegreeinglobalmanagement from the Thunderbird School of Global Management at Arizona State University in Phoenix. He also has an international certification in project management (PMP).


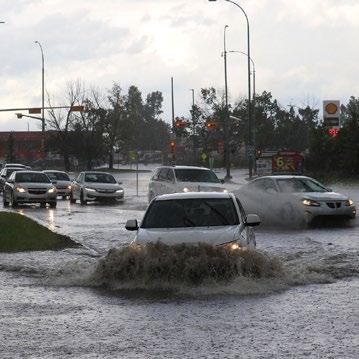
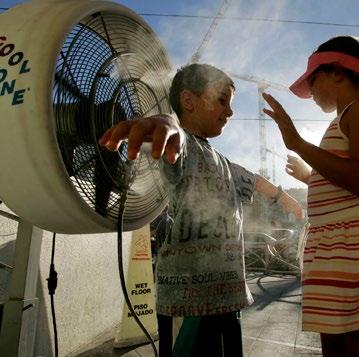


AIR QUALITY AND HEALTH
New asthma diagnoses in children age 0 to 17 due to particulate air pollution, and premature deaths in adults ages 65 and older due to particulate air pollution.4


EXTREME TEMPERATURE AND HEALTH

Deaths due to extreme temperatures.
COASTAL FLOODING AND TRAFFIC

Traffic delays due to high-tide flooding and extreme temperature and precipitation.5
COASTAL FLOODING AND PROPERTY

Property inundation due to sea level rise, and exclusion from protective adaptation measures.
EXTREME TEMPERATURE AND LABOR
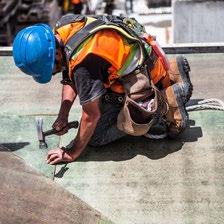
Labor hours lost by weather-exposed workers due to high-temperature days.

INLAND FLOODING AND PROPERTY


Property damage or loss due to inland flooding.
Specifically, the analyses presented in this report first identify the areas in the contiguous United States (U.S.) where impacts are projected to be the highest under future global temperature change and sea level rise. For example, the Extreme Temperature and Labor analysis estimates where weatherexposed workers are projected to lose the most labor hours due to high-temperature days, and the Coastal Flooding and Property analysis estimates where the highest percentage of property is projected to be inundated due to sea level rise. Next, the analyses estimate the likelihood that those who are socially vulnerable live in these areas compared to those who are not. This determination is based on current demographic distributions and projected
changes in climate hazards under different levels of global warming and sea level rise. The result is a consistent measure of the disproportionate risk to socially vulnerable individuals, which can be compared across groups, regions, and impact categories.
Due to data limitations, the analyses are limited to the contiguous U.S. Future work will enhance both the coverage of important areas such as Hawai’i and Alaska, and will explore additional impacts. Furthermore, additional dimensions of social vulnerability (e.g., gender and linguistic isolation) are not included and warrant additional analysis. Please see the Introduction and Approach chapters for more information on the analytic scope and limitations.
Figure ES.2 summarizes the results of the six analyses described in this report. These summary findings focus on national-level results for scenarios with 2°C of global warming (relative to the 1986-2005 average) or 50 cm of global sea level rise (relative to the year 2000). Results for additional scenarios and geographic regions are provided in the following chapters and appendices. Note the analyses in this report estimate risks to each socially vulnerable group independently and do not analyze interconnections between the four measures of social vulnerability examined.
Of the four socially vulnerable groups examined, minorities are most likely to currently live in areas where the analyses project the highest levels of climate change impacts with 2°C of global warming or 50 cm of global sea level rise.6,7
• Black and African American individuals are 40% more likely than non-Black and non-African American individuals to currently live in areas with the highest projected increases in mortality rates due to climate-driven changes in extreme temperatures. In addition, Black and African American individuals are 34% more likely to live in areas with the highest projected increases in childhood asthma diagnoses due to climate-driven changes in particulate air pollution.
• Hispanic and Latino individuals are 43% more likely than non-Hispanic and non-Latino individuals to currently live in areas with the highest projected labor hour losses in weather-exposed industries
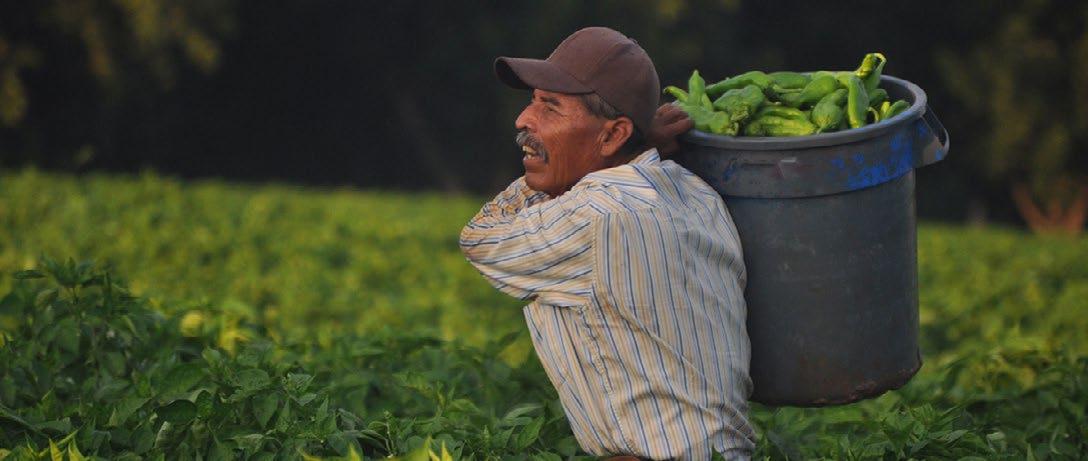
due to climate-driven increases in high-temperature days. Hispanic and Latino individuals are also 50% more likely to live in coastal areas with the highest projected increases in traffic delays from climatedriven changes in high-tide flooding.
• American Indian and Alaska Native individuals are 48% more likely than non-American Indian and non-Alaska Native individuals to currently live in areas where the highest percentage of land is projected to be inundated due to sea level rise.8 American Indian and Alaska Native individuals are also 37% more likely to live in areas with the highest projected labor hour losses in weatherexposed industries due to climate-driven increases in high-temperature days.
• Asian individuals are 23% more likely than nonAsian individuals to currently live in coastal areas with the highest projected increases in traffic delays from climate-driven changes in high-tide flooding.
The estimated risks for each socially vulnerable group are relative to each group’s “reference” population, defined as all individuals other than those in the group being analyzed. The estimated risks presented in the chart are for scenarios with 2°C of global warming (relative to the 1986-2005 average) or 50 cm of global sea level rise (relative to 2000). For the inland flooding analysis, the baseline is 2001-2020. Results for additional scenarios are provided in the following chapters and appendices.
Minorities are 41% more likely than non-minorities to currently live in areas with the highest projected increases in traffic delays from high-tide flooding associated with 50 cm of global sea level rise.
Those with no high school diploma are 3% less likely than those with a high school diploma to currently live in areas with the highest projected extreme temperature mortality impacts with 2°C of global warming.
AIR QUALITY AND HEALTH*
New asthma diagnoses in children due to particulate air pollution.
EXTREME TEMPERATURE AND HEALTH
Deaths due to extreme temperatures.
EXTREME TEMPERATURE AND LABOR
Lost labor hours for weather-exposed workers.
*Impacts not estimated for 65 and Older.
COASTAL FLOODING AND TRAFFIC
Traffic delays from high-tide flooding.
COASTAL FLOODING AND PROPERTY
Property inundation due to sea level rise.
INLAND FLOODING AND PROPERTY
Property damage or loss due to inland flooding.

At Blue Cross® Blue Shield® of Arizona, we believe in investing in the health of Arizona. Our tradition of philanthropy has resulted in millions invested to support the health and vibrancy of every Arizonan. Our corporate giving program funds a select number of event sponsorships and corporate memberships every year. Grant opportunities for programmatic impact and applied research are available through the Blue Cross Blue Shield of Arizona Foundation for Community & Health Advancement. We’re based in Arizona, and we love it here. And we wake up every day looking forward to helping you be your healthiest.
AZBlue.com/LoveAZ
The United States has historically faced periods of extreme heat, but climate change over the next 30 years could make these events more frequent, widespread, and severe. Under prevailing late-twentieth-century climate conditions, around 5 percent of the current population—roughly 16.5 million people—could expect to experience 100+ days per year where the daily maximum temperature is above 90°F. Without concerted action to limit emissions, this could increase to around 30 percent of the population by 2050. Many more people face extreme heat in unusually warm years: the recent heat wave in the Pacific Northwest provides stark evidence of how even relatively cool parts of the country can be exposed to high-severity heat events.
The economic and societal consequences of extreme heat are pervasive. Impacts encompass reductions in GDP, as workers and infrastructure systems become less productive, as well as wider detrimental effects on well-being, as healthcare outcomes worsen and people are unable to access outdoor space. Impacts include transitory
ones, from people enduring uncomfortable conditions and workers taking sick leave, and enduring losses, for example, due to interruptions to education or property damage from wildfires which can be more severe due to extreme heat’s effect on the environment. Tourism and other leisure activities are also affected as temperatures rise, making walking, shopping, and sightseeing uncomfortable and potentially dangerous.
This paper quantifies some of the likely socioeconomic impacts of heat in the United States under current and possible future conditions. It provides new, quantitative evidence of the economic importance of heat for policy makers and investors and shows how impacts are disaggregated across regions, socioeconomic groups, and sectors of the economy. As Table A1 in the Annex highlights, this paper considers only a subset of the ways in which extreme heat can impact the US economy and society and appraises impacts only in “normal”—as opposed to unusually warm—years, meaning it provides a conservative view of the overall significance of the issue.
Note: Baseline based on historical climate data from 1986 to 2005. Future outlooks for 2030 and 2050 are based on an ensemble mean of 10 CMIP5 climate models run under the RCP 8.5 emissions scenario for 2021 to 2040 and 2041 to 2060, respectively. See methodology document for further details.
Source: County-level analysis conducted by Vivid Economics.
182-188
• NEARLY ONE-FIFTH OF HISPANICS IN THE U.S. DO NOT HAVE HEALTH INSURANCE COVERAGE
• THE PERCENTAGE OF UNINSURED HISPANICS AGED 18—64 ROSE TO MORE THAN THREE TIMES THAT OF NON-HISPANICS BY 2021
• MEDICAID/CHIP IS THE LARGEST SOURCE OF COVERAGE FOR LATINO KIDS IN ARIZONA
• TOP ARIZONA COUNTIES WITH THE MOST UNINSURED LATINO CHILDREN
• HISPANICS AGED 18—29 FIND THE PROCESS TO GET MEDICAL CARE HARDER TO UNDERSTAND THAN OTHER HISPANIC AGE GROUPS
• ABOUT A THIRD OF HISPANIC ADULTS SAY THEY WOULD PREFER A HEALTH CARE PROVIDER WHO SPEAKS SPANISH
• A GREATER PERCENTAGE OF HISPANIC ADULTS 18+ VS. NON-HISPANICS DID NOT GET NEEDED MEDICAL CARE DUE TO COST FROM 2019 TO 2021
• A GREATER PERCENTAGE OF HISPANIC ADULTS 18+ VS. NON-HSPANICS DID NOT TAKE MEDICATION AS PRESCRIBED TO SAVE MONEY FROM 2019 TO 2021
• A GREATER PERCENTAGE OF HISPANIC ADULTS 18+ VS. NON-HISPANICS WERE OBESE FROM 2019 TO 2021
• LATINO DIABETES RATES HAVE REMAINED CONSTANT OVER THE LAST DECADE IN ARIZONA
• MENTAL HEALTH IN ARIZONA (FEBRUARY 2021)
• SINCE 2020, ALL RACIAL/ETHNIC GROUPS HAVE EXPERIENCED HIGHER RATES OF MENTAL DISTRESS
• 53% OF HISPANIC ADULTS SAY HEALTH RISKS IN JOBS ARE MAJOR REASON FOR GENERALLY WORSE HEALTH OUTCOMES 189
SPECIAL FEATURE Health Care
Univision Communications takes a broad overview of the state of dental, medical and mental health care for Hispanics in Phoenix and Tucson in addition to the use of health clubs in those cities
Optum has put a huge network in place to guarantee that it meets its main goal: Keeping Arizonans healthy as they age
BY STEVE MACIASCarmen Heredia is the first Latina and fourth woman to lead the Arizona Health Care Cost Containment System, the state’s version of Medicaid. After the recent billing fraud scandal, she has her work cut out for her
BY KAREN MURPHYTo reduce your risk of developing cancer, take two positive steps: Get screened early and eliminate habits known to increase the risk
BY JOSEPH SCHWERDT
Terros Health is committed to bringing health care into the most vulnerable communities in Arizona
BY LORENZO SIERRAThe good news for Arizona is that this proud Arizonan has recently returned home after most recently working in the Biden administration as Assistant Secretary, Administration for Children and Families (ACF). Here’s what she had to say about what she has learned and what advice she has for young people deciding on a career
Based on this 2023 report from Mental Health America, it is clear we have a long way to go as a nation in dealing with the mental health of the U.S. population
According to this fact sheet from UnidosUS, the uninsured rate for children overall in Arizona is higher than the national average and Latino children are more than 1.5 times as likely to be uninsured compared to other children in the state
PEOPLE IN THE U.S. WITHOUT HEALTH INSURANCE COVERAGE BY RACE AND HISPANIC ORIGIN (2021)
PERCENTAGE OF UNINSURED* U.S. ADULTS AGED 18—64 BY ETHNICITY (2019—2021)
*NOTE: A person was defined as uninsured if they did not have any private health insurance, Medicare, Medicaid, Children's Health Insurance Program (CHIP), state-sponsored or other government-sponsored health plan, or military plan. A person was also defined as uninsured if they had only Indian Health Service coverage or had only a private plan that paid for one type of service, such as dental or vision care.
HEALTH INSURANCE COVERAGE SOURCES FOR LATINO KIDS (2018)
NUMBER & RATE OF UNINSURED LATINO CHILDREN BY ARIZONA COUNTY (2018)
MARICOPA PIMA
YUMA PINAL MOHAVE YAVAPAI COCHISE SANTA CRUZ COCONINO LA PAZ Source:
NOTE: Respondents were asked if there was any time during the past 12 months when they needed medical care but did not get it because of the cost.
PERCENTAGE OF U.S. ADULTS AGED 18 AND OVER WHO DID NOT TAKE MEDICATION AS PRESCRIBED TO SAVE MONEY (2019—2021)
NOTE: Respondents who reported taking prescribed medicine in the past 12 months were asked in separate questions if during the past 12 months any of the following were true: They skipped medication doses to save money, they took less medication to save money or they delayed filling a prescription to save money.
A GREATER PERCENTAGE OF HISPANIC ADULTS 18+ VS. NON-HISPANICS WERE OBESE FROM 2019 TO 2021
NOTE: Calculated from information that respondents supplied in response to survey questions regarding height and weight. For both men and women, obesity is indicated by body mass index (BMI) of 30.0 or higher.
“One in two Latinos will develop diabetes over their lifetime. Latinos are at a 66% greater risk of developing type 2 diabetes and once diagnosed, have worse outcomes than non-Hispanic whites. Diabetes often brings mental health problems in its wake: one in five diabetics have depressive symptoms. But Latinos are also less likely to receive treatment for depression, anxiety and other behavioral issues than their white counterparts.”
—The Brookings Institution, in a September 2020 report by Ariel Gelrud Shiro and Richard V. Reeves
DIABETES RATES* IN ARIZONA BY RACE/ETHNICITY** (2011—2021)
NOTES: *Percentage of adults who reported ever being told by a health professional that they have diabetes (excluding pre-diabetes and gestational diabetes) **Rates for the following groups were limited or completely unavailable: Asian, Hawaiian/Pacific Islander, Multiracial and Other Race.
1,030,000 40.8% 87,000 57.8%
The number of adults in Arizona who had a mental health condition. It was more than four times the population of Scottsdale.
The percentage of Arizona adults who reported symptoms of anxiety or depression.
Source: National Alliance of Mental Illness (NAMI), Mental Health in Arizona Fact Sheet, February 2021 www.nami.org/NAMI/media/NAMI-Media/StateFactSheets/ArizonaStateFactSheet.pdf
The number of Arizonans aged 12—17 who had depression.
The percentage of Arizonans aged 12—17 with depression who did not receive any care in the previous year.
NOTES:
*Percentage of adults who reported their mental health was not good 14 or more days in the past 30 days
**Rates for the following groups were limited or completely unavailable: Asian, Hawaiian/Pacific Islander, Multiracial and Other Race.
PERCENTAGE OF HISPANIC ADULTS WHO SAY EACH CATEGORY IS A REASON WHY HISPANIC PEOPLE GENERALLY HAVE WORSE HEALTH OUTCOMES THAN OTHER ADULTS IN THE U.S. (2021)
53% OF HISPANIC ADULTS SAY HEALTH RISKS IN JOBS ARE MAJOR REASON FOR GENERALLY WORSE HEALTH OUTCOMES
ARE M ORE LIKELY TO HAVE PREEXISTING HEALTH CONDITIONS
LIVE IN COMMUNITIES WITH MORE ENVIRONMENTAL PROBLEMS
HEALTH CARE PROVIDERS ARE LESS LIKELY TO GIVE ADVANCED CARE
HOSPITALS AND MEDICAL CENTERS GIVE LOWER PRIORITY TO WELL - BEING
MAJOR
COURTESY


13K Or
U.S. Hispanics Are +31% More Li kel y than Non- Hispanics to Agree with the Statement:
“I’ll pay ju s t ab out anyth ing wh en it c onc erns my h ealth”

of Hispanics vs. 43.8% of Non -Hispanics 2

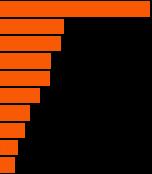
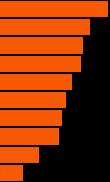
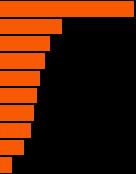
U.S. Hispanics Are +44% More Likely than Non- Hispanics to Agree with the Statement:
“I mad e an appoin tment to s ee a d oc tor as a res ult of ad vertising.”
30 Days


85%


As we get older, the steps we need to take to maintain our health change. Staying physically active takes on a new level of importance as we seek to keep our bodies healthy and pain-free.
Numerous studies demonstrate that maintaining physical activity is one of the very best ways to protect our health as we get older— and that people who engage with others on a regular basis maintain a strong sense of purpose and even live longer. Maintaining a strong social support network both keeps your spirits up and helps keep your mind healthy.
The Optum team approaches this goal from the ground up. It starts with building an expansive, expert foundation of health care professionals experienced in treating a variety of conditions. Optum maintains a network of more than 900 primary care providers, 2,700 specialists and 40 hospitals throughout the state, treating and caring for patients of all ages. As important as it is to maintain your health when you are older, the first step in that
health care journey is getting the tools to help you stay healthy throughout your life.
Optum has a key mission: Keeping Arizona’s population healthy. The six Arizona Optum Community Centers—open to the public at no cost and no membership required—are central to this mission. These centers are neighborhood hubs, where older adults can gather in a social, supportive setting, improve their own health and expand their social network.

With an understanding that all aspects of health—physical, emotional, intellectual and social—are intricately connected, programming at the community centers stresses those four key aspects of well-being: physical activity, emotional resiliency, intellectual stimulation and social connection.
Physical activity sessions that include classes like chair yoga, Zumba and Pilates and others are all led by experts in their
Optum
888.445.8745 toll-free optum.com/care/locations/ arizona/optum-arizona.
html
Optum operates six community centers in Arizona—one in Tucson and five in the Phoenix metro area. All ofthe community center programming is open to adults 55+ at no cost and with no appointments or sign-up necessary.
Central Phoenix 1125 E. Glendale Ave.
Chandler 985 W. Chandler Heights Rd., Ste. 12
Deer Valley 20414 N. 27 th Ave. 1 st Floor
East Mesa 6005 E. Southern Ave.
Goodyear
1981 N. Pebble Creek Parkway, Ste. 8
Tucson
4780 E. Grant Rd.
Optum.com/ azcommunitycenters
Click on the View Event Calendar for a list of classes at each location.
youtube.com/ playlist?list=PLsqiKKQGfB91F0_ERCPKeijAV7og_fq7
From the Centers for Disease Control and Prevention (English and Spanish) How much physical activity do older adults need?
cdc.gov/physicalactivity/ basics/olderadults
Fact Sheet for Physical Inactivity Among Adults 50 Years and Older article cdc.gov/physicalactivity/ inactivity-among-adults50plus/modules/Adults_ need_more_PA_factsheet_ March2022_508.pdf
From the U.S. Census Bureau Demographic Turning Points for the United States: Population Projections for 2020 to 2060 census.gov/library/ publications/2020/demo/ p25-1144.html
respective fields. The classes are also designed to meet the participants where they are in their physical fitness journey, regardless of ability. The Optum community centers create and maintain a welcoming environment for all. Each center also features an exercise studio, where older adults can work on their cardiovascular and strength training with the support of certified physical trainers.
Emotional resiliency and support programs help participants manage, understand and process their emotions in positive ways. Richard Crislip, Optum’s vice president of behavioral health, developed and currently leads many of these programs at the community centers.
Intellectual stimulation is a critical component of healthy aging and is just as central in community center programming—with book clubs, conversational foreign language workshops and even classes designed to get older adults comfortable with technology.
Social connection is fundamental to older adults maintaining their independence and a positive sense of self. The Optum community centers operate in fully social environments, so peers can get to know each, exercise with new friends, learn new skills and truly build a sense of community.
Providing these supports and structures to our aging population is critical, both in terms of the benefits realized by the individuals themselves and in lessening the strain on health care resources overall. In simplest terms, when we provide a strong system of support for the most vulnerable in our community, the whole community prospers.
Prioritizing the health and well-being of older adults is simply the right thing to do. The U.S. Census Bureau estimates that by the year 2034 older Americans will outnumber children for the first time in U.S. history. Because of that reality, an already-important priority is quickly approaching critical concern. Optum provides the community resources to help address that concern—and stands proudly beside all those individuals, nonprofit organizations and other healthcare delivery companies who are working to ensure the health of our expanding older population.
When Carmen Heredia was picked by newly elected Arizona Gov. Katie Hobbs to be the director of the Arizona Health Care Cost Containment System (AHCCCS), there was no honeymoon period. She had to hit the ground running.
For the last three years, Heredia had been the CEO at Valle del Sol, a nonprofit organization that provides behavioral health, human services and leadership development for the Hispanic community.
When she became the director at the AHCCC after Jami Snyder resigned in December 2022, she walked right into a perfect storm: a billing scandal that was all over the media and the end of the Medicaid disenrollment freeze on April 1.
The AHCCCS, which is Arizona’s version of Medicaid, was the victim of a massive billing fraud scandal targeting mostly Native Americans that was described in May by Arizona Attorney General Kris Mayes as one of the “the biggest scandals in the history of
The Arizona Health Cost Containment System (AHCCCS, pronounced “Access”) is Arizona’s version of Medicaid that provides acute behavioral health and long-term care services to more than 2.5 million Arizona residents at an annual cost of $22 billion. Arizona was the last state to become part of the Medicaid system in 1982 and the first to offer a managed care approach, which is basically a public/private partnership that uses public dollars from both the federal and state governments and contracts with private businesses to provide services.
Arizona…our office estimates that it is in the hundreds of millions of dollars [and] it could go higher.”
The Medicaid disenrollment was not an unexpected challenge, but it was a huge undertaking to manage the end of the disenrollment freeze that cancelled coverage for hundreds of thousands of Arizonans who no longer met the eligibility requirements or who
AHCCCS
801 E. Jefferson St., Phoenix 602.417.4000 azahcccs.gov
QUESTIONS?
DIFFICULTY ACCESSING SERVICES?
602.364.4558
800.867.5808
CQM@azahcccs.gov
REPORT SUSPECTED FRAUD
ANONYMOUSLY
In Arizona: 602.417.4193
Outside AZ: 888.487.6686
WHAT IF YOU NO LONGER QUALIFY FOR AHCCCS?
healthearizonaplus.gov
855.432.7587
MON—FRI, 7am—6pm
FACT SHEET
AHCCE Provider Payment Suspensions (.pdf)
This fact sheet also includes all the steps being taken to prevent fraudulent billing in the future.
did not respond to requests from AHCCS for more information during the renewal process.
From all initial indications, Heredia, the first Latina and the fourth woman to become the AHCCCS director, is up to the task. She was inspired by her parents’ work in the social work field to go into health care.
“I was inspired by the work that they did to contribute back to society and to be in public service,” Heredia says. Her mom worked with families, teaching parenting skills to young parents and helping to reunify families that had been separated by social stresses and different needs. Her dad, she says, “had an interesting background,” but for many years worked as a substance use counselor in the county jail system to help rehabilitate inmates.
Her parents were very influential in her life, Heredia says, but over the years she also has had many, many other mentors who have helped her along the way. “I think we all stand on the shoulders of other people who came before us,” she says.
To move the agency past the recent scandal, the AHCCS under Heredia has taken several steps in the right direction—and Heredia believes that it is ultimately her responsibility to make sure this kind of fraud can never happen again.
“We are doing a lot of community education with different groups that have been targeted and affected by [the fraud],” Heredia says, pointing out that the agency is also doing a lot of data analysis.
The AHCCS has posted information on its website about some of the changes being made to address the problems. These changes include:
• Elevating three behavioral health provider types to a highrisk category for all new registrants, requiring fingerprints, on-site visits, background checks and additional disclosures;
• Eliminating the ability for providers to bill on behalf of others;
• Imposing a moratorium on new provider registrations for all behavioral health outpatient clinics, integrated clinics,
non-emergency transportation providers and community service agencies;
• Setting billing thresholds and imposed prepayment review for certain scenarios;
• Adding new reporting to flag concerning claims for review before payment;
• Implementing new agency rules that allow AHCCCS to exclude individuals affiliated with suspended or terminated providers; and
• Requiring third-party billers to disclose terms of compensation.
“We also are going through a forensic audit by an external firm, looking at what other states have done and getting advice from our federal partners and funders,” Heredia says. “It’s become allhands-on-deck.”
On top of these two issues was the added complication that the Arizona legislature also was doing its regular evaluation of the
agency to answer, according to Heredia, a simple question: “Does the state agency need to continue or not?”
The actual review was delivered to the agency in September and December of 2022 and it became her job, Heredia says, to address the legislature’s findings, make any necessary corrections and then make the case to the legislature that the agency should continue to exist.
“Luckily,” she says, “we were renewed for six years.”
Six more years will give this new AHCCCS director a chance to make her mark and make sure that everyone in Arizona understands the importance of having health care coverage.
“You have to have healthy communities,” Heredia says. The Arizona Hispanic Chamber of Commerce focuses on business, prosperity and economic advancement for the community, she says and “health is an important part of the equation.”
Karen Murphyis anAZHCC staffwriterand copyeditor/proofreader.According to the American Cancer Society, Hispanic men and women are less likely than other ethnic groups in the United States to be diagnosed with the most common cancers: lung, colorectal, breast and prostate. However, they are more likely to develop cancer in the liver, stomach and cervix.
These types of cancer, however, may be preventable—and Hispanics and others can take steps to reduce their cancer risk.
Hispanic women have a high rate of cervical cancer, which may be caused by the human papilloma virus (HPV), the most common sexually transmitted infection (STI).
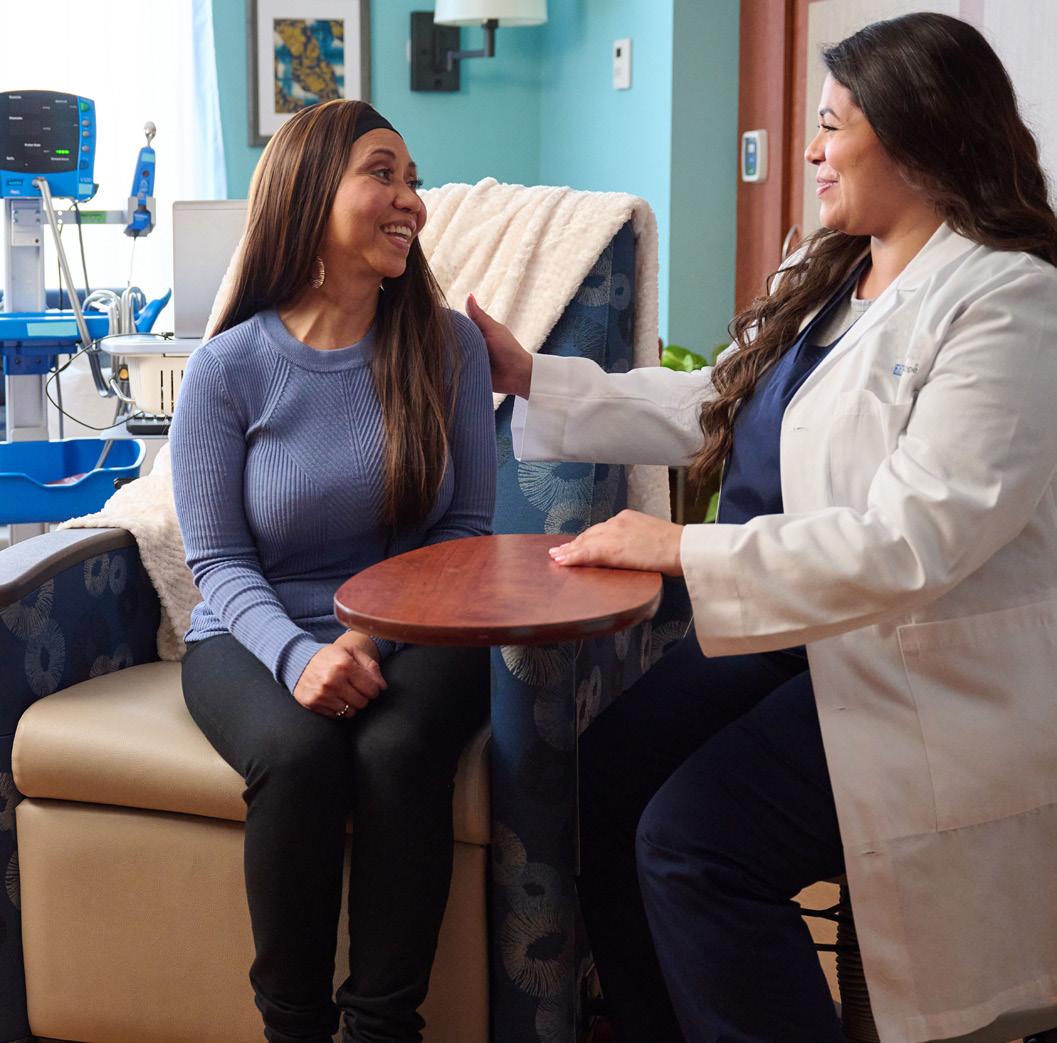
Hispanic men and women have the second highest rate of death from liver cancer, which may be caused by hepatitis B and C viruses (HBV and HCV). According to HIV.gov, there are three main ways that HBV and HCV spread:
• by sharing needles, syringes and other injection equipment,
• by pregnant women, who can pass infections to their infants and
• sexually, although HBV is more likely than HCV to be transmitted in this way. NOTE: HCV is most likely to be transmitted sexually among gay and bisexual men who have HIV.
Every person can take two actions to greatly reduce their risk of developing and dying from the most common types of cancer in the United States:
• Make efforts to reduce those harmful everyday habits that increase the risk of developing cancer.
• Follow the guidelines for recommended cancer screenings.
—American Cancer Society
Hispanic men and women also have the highest rates of stomach cancer diagnoses and deaths. This disease is often caused by chronic Helicobacter pylori (H. pylori) infections. According to the U.S. Centers for Disease Control and Prevention (CDC), it is not always known how H. pylori is transmitted, but it may be from exposure to contaminated water or from oral-to-oral contact with someone who is infected.
These viruses and bacterium account for more than 90 percent of all infection-related cancers worldwide.
There are four easy steps to prevent these cancers:
• Get vaccinated—and get your children vaccinated. The HPV vaccine significantly lowers the risk of cervical cancer and at least five other cancers. In addition, the HBV vaccine reduces the risk of hepatitis, which may lead to cancer.
• Get screened. A Pap test for women may help detect cervical cancer early. In addition, an annual colonoscopy or endoscopy may help find early signs of stomach cancers and other cancers in the digestive tract.
• Talk to your doctor. If you are having any symptoms, talk to your primary care physician about the available cancer screening tests.
• Make lifestyle changes. Losing weight, eating a healthy diet, quitting smoking, drinking less alcohol, practicing safe sex and getting regular exercise reduces the cancer risk for everyone.
City of Hope
Comprehensive Care and Research Center 14200 W. Celebrate Life Way
Goodyear, AZ 85338
623.207.3000 (existing patients)
866.489.2270 24/7
www.cancercenter.com/schedule-an-appointment
GET A CANCER SCREENING
602.883.1463
Outpatient Care Centers
855.625.7993 (new patients)
Gilbert
3530 S. Val Vista Drive
480.530.4700 (existing patients)
North Phoenix
2915 West Rose Garden Lane
623.932.8960 (existing patients)
Scottsdale 9755 N. 90th Street
480.935.4200 (existing patients)
From the Centers for Disease Control and Prevention (in English and Spanish)
Genital HPV Infection — Basic Fact Sheet cdc.gov/std/hpv/stdfact-hpv.htm
Helicobacter pylori (H. pylori) infection wwwnc.cdc.gov/travel/yellowbook/2024/infections-diseases/ helicobacter-pylori
Liver cancer
cdc.gov/cancer/liver
From the American Cancer Society
Cancer Facts & Figures for Hispanic/ Latino People 2021—2023
cancer.org/content/dam/cancer-org/research/cancer-facts-andstatistics/cancer-facts-and-figures-for-hispanics-and-latinos/ hispanic-latino-2021-2023-cancer-facts-and-figures.pdf
Facts & Figures
cancer.org/research/cancer-facts-statistics/cancer-preventionearly-detection.html
 BY LORENZO SIERRA
The COVID global pandemic was merciless in its attack on the world. COVID did not care who you were, where you were from, how old you were or your ethnicity. As a Federally Qualified qualified Health Center (FQHC) and Certified Community Behavioral Health Center (CCBHC), Terros Health saw firsthand the great disparities in the delivery of primary health care during this global pandemic.
We found that the most vulnerable populations were even more disadvantaged during the COVID pandemic. The clients of the Arizona Center for the Blind and Visually Impaired (ACBVI), for example, had extremely limited access to COVID testing, vaccines and treatment.
Located at the northwest corner of 32nd St. and Roosevelt St. in Phoenix, ACBVI has been empowering people with vision loss since 1947. Clients come to learn job skills, life skills and receive a hot meal. They also find hope. During the pandemic ACBVI leadership found that their clients were unable to access COVID-related services. As Terros Health began deploying our mobile health unit to ACBVI, we discovered that COVID was only the tip of the iceberg: There was a strong need for accessible comprehensive primary care. We began having a weekly presence on campus to give people who had traditionally limited access to primary healthcare to finally have the access they needed to achieve better health.
In addition to the ACBVI clients, we found that residents of the neighborhoods adjacent to the ACBVI campus also had limited access to primary healthcare. According to the U.S. Census Bureau, the neighborhoods adjacent to the ACBVI campus are more than 70 percent Hispanic. These neighbors also lacked access to primary care and Terros Health saw an opportunity to also help them.
“Not everyone has access to primary healthcare, but they should,” says Terros Health CEO Dr. Karen Tepper.
This belief is one of Terros Health’s organizational drivers. We believe that access to care is a fundamental right for all.
Since 2018, the Arizona Hispanic Chamber of Commerce (AZHCC) has partnered with the Vitalyst Foundation to uncover the Hispanicfocused demographics that make the “elements of a healthy community.” One of the key tenants of a healthy community model is “access to care.”
At Terros Health, we are committed to providing access to care wherever there are barriers. By opening a freestanding clinic on the ACBVI campus, we can be available for both their members and the whole community.
Opened in late summer 2023, the Roosevelt Health Center is Terros Health’s newest integrated healthcare facility. In addition to primary healthcare, patients at the health center can access behavioral health services, including individual and group counseling, psychiatric services and substance use and mental health day treatments.
“Our hope is that this clinic serves as a point of pride for this community,” Dr. Tepper says.
Terros Health is actively working to achieve FQHC status for this new facility. As an FQHC, by law, we must treat ALL people, regardless of their ability to pay. During our research period, we found that people in this general area had very limited access to primary care as well as behavioral health care.
At Terros Health, building a health clinic in areas where it is most needed is who we are and what we do. Terros Health was founded in 1969 by a group of high school students who grew concerned about the substance use they saw in our community.
Terros Health
3003 N. Central Ave., Ste 400 Phoenix, AZ 85012 602.685.6000
terroshealth.org
The original Terros students were volunteers who secured a van that had a mattress in it. They would go to concerts and other venues where overdoses were likely to occur.
Over the years, Terros Health built a strong reputation as a safe place to seek relief from drug addiction. As time went on, Terros Health also entered the mental health space. Today, we serve tens of thousands of people looking to improve their mental and physical health—especially in populations that have been traditionally underserved.
Terros Health recently rejoined the AZHCC. We participated in the chamber’s community health fair this past summer and will continue to partner with the AZHCC and its members to promote healthy communities.
Let’s talk about your roots. Where did you grow up?
JANUARY CONTRERAS: I grew up in Phoenix and Mesa, Arizona. When I was little, I spent a lot of time at my nana’s and tata’s home because my mom and dad both worked nights at the post office. My tata, one of five brothers who served in WWII, had been a paratrooper in the Army. My nana attended the Arizona Territorial School in Tubac and her family had long ties to southern Arizona. I was lucky to know their stories and the strong contributions my family made to our state and country. My grandparents raised me to be proud of my Mexican-American roots and to know that our story was an Arizona story. I carry them with me in all that I do.
January is an unusual name. Is there a story behind it? My parents were young when they had me. When I was born, my dad was in the Air Force. He wasn’t in town when my mom went into the hospital so the legend, as told by my mom, is that she was lonely and wanted to come up with a unique name that was all her idea. I was born in January so she decided to name me January Joy.
JanuaryContrerasisaproudArizonanative whoseimpressivecareerhasbeenshapedbyher passionandsenseofdutytohelpchildrenand families.AZHCCStaffWriterKarenMurphyhad anopportunityinAugusttoaskherabouther careerasshewasgettingreadytoleaveherjobin theBidenAdministrationasAssistantSecretary, AdministrationforChildrenandFamilies(ACF),to return to Arizona. She shared what she has learned alongthewayandheradviceforyoungpeople decidingonacareerpath
Do you have any siblings?
I was an only child for my first 11 years. I watched my mom break barriers by working full-time and earning her college degree at ASU. It was a huge blessing to me when my little sister was born. My mom worked nights, so I grew up taking care of my sister. I was responsible for feeding her, caring for her and putting her to bed each night. It taught me how to be a leader—starting in my own home—and shaped me into a person who truly believes that service to others is one of the greatest callings there is. Later, my dad remarried and I also became a big sister to my brother.
What made you choose your career path?
I’ve truly listened to where I’ve felt called and it’s taken me to the most unexpected and meaningful places. My family and the responsibilities I carried as a young person, shaped me into being driven to public service. I’m grateful for that.
Becoming an attorney was never something I would have thought of becoming when I was growing up because I didn’t have exposure
to any attorneys. When I was in college I had the chance to see lawyers in action for important causes. I wanted a job that would never leave me powerless for myself or for others. Having a law degree seemed like a way to achieve this. I couldn’t afford an LSAT prep class, but my alma mater, the University of Arizona, was kind enough to send me a set of books to study with. Within in a year, I was a first-year law student at the U of A and I’ve been able to use my law degree in very meaningful ways ever since.
What was your first job out of college?
Two days after I graduated from college, my college sweetheart, now husband and I packed up my truck and moved to California. I interned for free at a television station while working at Macy’s. A few months later, I was hired as a broadcast associate for $7 an hour. It was an amazing feeling to get the job, but I wanted more independence than the news industry provided. Just a few months, later I started studying for the bar exam to enter law school.
You have had a very impressive career. Looking back, is there any one job that stands out?
This one is a tough one because I have had a lot of jobs that have been fulfilling. I think of many young victims of human trafficking or child abuse who I stood with as a lawyer and it makes me proud to know they improved their lives through an organization that I built.
I think of leading reforms that made undocumented immigrant victims of crime safer through my work with the White House Council on Women and Girls. I think of the ways that we protected health care and took on health care disparities in Arizona when I was at AHCCCS [Arizona Health Care Cost Containment System] and the Arizona Department of Health.
The job I have now has allowed me to play a role in proposing regulatory change to make child care more affordable and accessible and to better support grandparents and other kin who step in to raise children in tough times.
All this work is about people. Serving people in ways that help them not only survive but thrive is what fulfills me most.
You ended up in Washington because you had worked with former Arizona Gov. Janet Napolitano. You became her senior advisor when she headed the Department of Homeland Security. Was it difficult to move from Arizona to Washington, DC?
My husband and I have taken some big leaps together and moving to Washington, D.C. to serve in the Obama Administration was certainly one of them. Our children were young enough to take the move well and we were blessed that my mom had retired and decided to go with us. She used to say that she was just like the Obama grandma who moved to the White House to help care for her grandkids.
I missed Arizona while away but learned so much about effective governing and leadership. Janet Napolitano is one of the smartest and most dedicated public servants I know and I was fortunate that she trusted me to tackle an issue that matter to people all over the country. As a designee to the White House Council on Women and Girls, I worked with committed colleagues to build a plan to combat violence against women.
My greatest privilege was leading efforts to ensure that undocumented immigrant victims of crime were afforded the same dignity and protections that all victims deserve. That work has made a huge difference when, for example, a battered immigrant woman needs to call 911. Advocates often comment on the impact of that work and I’m proud to have been a part of an incredible collaborative effort to create that change.
“I’ve truly listened to where I’ve felt called, and it’s taken me to the most unexpected and meaningful places. My family and the responsibilities I carried as a young person, shaped me into being driven to public service.”
After your job with Napolitano ended in 2012, you became the CEO of Arizona Legal Women and Youth Services (ALWAYS). Tell me about that experience. While I was in DC, I traveled around the country as part of our national efforts to share new training and tools to protect victims who were undocumented. I met often with advocates, lawyers who provide victims services and law enforcement.
During my travels, I saw that many communities had longstanding and robust legal service networks to help victims of crime and I decided to go home and help build this in Arizona. I reached out to a mentor, former Maricopa County Presiding Judge Barbara Rodriguez Mundell, for her support and we started meeting with people for advice. She became the first Board Chair of ALWAYS.
I am incredibly proud that ALWAYS will be celebrating its 10th anniversary this year. ALWAYS has put legal services within reach of thousands of young people experiencing abuse, human trafficking and homelessness, a majority who are women and girls of color. We found a need that wasn’t being filled and started filling it. Each client I represented has a story that stays with me and motivates me to keep building communities that support them instead of leaving them behind.
In 2018 you ran for the position of Arizona attorney general but lost in the general election to Mark Brnovich in a close race. What do you think was the deciding factor that led voters to choose Brnovich? Running for attorney general of Arizona was one of those journeys
that I didn’t have on my bingo card but after the 2016 election, I was very concerned about the loss of respect for the rule of law. It’s dangerous when it becomes acceptable to pick and choose whose rights will and will not be protected, or to determine that some people are above the law.
Running against an incumbent with an arsenal of big donors isn’t easy but I’m incredibly proud to have stood up for integrity and honesty and to be the first Latino candidate to ever earn more than a million votes. I’m grateful to all the Arizonans, of every political background, who supported me.
Would you consider running for public office again?
Public service is just a part of my DNA. I will always be drawn to serve others. I am often asked when I will run again and I truly do appreciate that continued support, but I don’t feel like it is the only way to share leadership.
As I always have, I will remain open to whatever path I am called to and [will] evaluate if it’s a good match for my family and me at that time. I am committed to service and helping our state be as strong as possible for everyone who lives here—no matter the title I do that with.
Do you think that Arizona is beginning to lean more Democratic or is it still mostly a Republican state?
More than any political party, Arizonans choose to be Independent voters; I don’t see that changing anytime soon. The good news is that our state has shown a penchant for rejecting extreme dishonesty and hate. I hope we always have that independent streak that veers toward common sense and truth.
Were you excited when you got the call from the Biden Administration to lead the Administration for Children and Families?
Yes, it was amazing to be tapped to serve in this way. HHS [The Department of Health and Human Services] felt like a natural home given my prior state leadership roles in Medicaid and public health, but to be asked to lead the human services heart of HHS was an incredible privilege.
The Administration for Children and Families leads everything from Head Start, child welfare and child care to refugee resettlement
JANUARYCONTRERAS WAS BORN TO SERVE
“I have found government service to be some of the best kind of work there is because it is centered on delivering results for the people we serve….I loved the nimbleness of serving in state government and the broad influence of federal service.”
and community action networks in every state, plus economic supports like utility assistance and cash assistance. We also lead in preventing and responding to family violence and human trafficking, as well as supporting family well-being, economic development and language preservation in tribal nations.
ACF placed a duty on my shoulders to deliver a mission that makes a difference for families, kids and people all over the country every day. It’s an agency where I oversee a $70 billion budget and work alongside a workforce of about 1,700 wonderful public servants. I’m convinced it’s the best job in government.
What do you feel have been your biggest accomplishments at ACF?
ACF has an amazing mission to strengthen the well-being of children and families. Helping to drive our mission with a resultsoriented philosophy that centers on equity, prevention and the people we serve is probably what I’m most proud of. Doing this has resulted in actions that make a difference for families—like supporting greater access to quality, affordable child care and supporting the child care workforce.
I’ve led efforts to broaden access to mental health and substance use treatment services through the Family First Prevention Services Act and expanded tools to help parents, caregivers and peers support the mental health of children and youth.
I’m proud to have launched a new family violence office that positions them at the leadership table to collaborate across ACF and HHS and to have revitalized our nation-to-nation commitment to tribal government leaders. These are all priorities for President Biden and Secretary Becerra that we were able to drive as Team ACF. [EDITOR’S NOTE: Xavier Becerra is the 25th HHSSecretary.]
It has been widely reported that you are leaving the Biden Administration after one year because your husband Carlos took a position in Arizona to become the Director of the Office of Economic Opportunity for Gov. Katie Hobbs. Is that correct?
When I was 19 years old, I started dating a cute engineering student who preached about how the U.S. could grow its economy
Born January 15;
Raised in Phoenix and Mesa
• One sister, one stepbrother
• Two sons
• Married to Carlos Contreras for 29 years
B.A. and J.D.
University of Arizona, Tucson
Assistant Secretary, Administration for Children and Families at the U.S. Department of Health and Human Services
and transform the prosperity of communities by revitalizing our manufacturing sector. He started out as an engineer refining Bounty paper towels and went on to a great career in the semiconductor sector.
I’m proud to see him join Gov. Hobbs’ cabinet to help carry out the dreams he spoke of way back in college. We’ve been married 29 years and have taken turns supporting one another in our professional journeys. While leaving my current role brings mixed emotions, it feels 100% right to be coming home to support Carlos in this new role.
I will always be grateful to President Biden, Secretary Becerra and a bipartisan delegation from the U.S. Senate for the opportunity to serve as the assistant secretary for ACF at HHS. I’m looking forward to taking a break before opening the door to what’s next. I’ve been fortunate to have a career centered on service and I don’t expect that to change.
What are the biggest challenges we face as a country in terms of our children and our families?
One of the biggest challenges facing our nation is the rise of mental and behavioral health challenges among people of all ages, especially our youth. There are kids who are struggling and worried parents and families in every zip code.
Bipartisan support to address this has meant unprecedented investments in creating access to mental health services and building the necessary pipeline of diverse professionals. Substance use issues are also affecting many families. There is an all-handson-deck movement in this space in the federal government across agencies, along with strengthening economic supports to give families more breathing room day to day.
What are the biggest challenges Arizona is currently facing?
As a state, we have to seek solutions to some of the basic needs of Arizonans like affordable housing and health care, adequate water and heat planning and investing in our public schools while making college and technical training more affordable.
My grandparents raised 11 kids on the salary of a mechanic and every family deserves the chance to realize their dreams for their children. It’s important today to keep building supports to help working families succeed.
What advice would you give young people when they are deciding on a career path?
My advice to young people is to expose themselves to as much as possible. When you see organizations, events, internships or
opportunities to serve that interest you, show up and make them happen.
For me, the lawyers I met through my legislative internship and exposure to the Los Abogados Bar Association, planted seeds that really took root and grew. Also, find mentors who have led lives that you admire and try to learn how their paths developed.
Finally, I’d say don’t be afraid to change your mind and be open to new fields and roles. When others see you work hard and deliver results, it can lead to new paths that you didn’t even know were possible.
Would you recommend government service—either at the state or federal level?
I have found government service to be some of the best kind of work there is because it is centered on delivering results for the people we serve. I would highly recommend government service at any level. I loved the nimbleness of serving in state government and the broad influence of federal service.
Is there anything else you would like to share?
My very first mentors were my mom and dad and my grandparents. I’m always most grateful to them for believing in me and my abilities.
I’ve also had many people come into my life as mentors and mentees. My Los Abogados family, Mujer Inc., ALWAYS board members and a network of national Latina leaders have especially been part of my circle of support. I learn from them to this day.
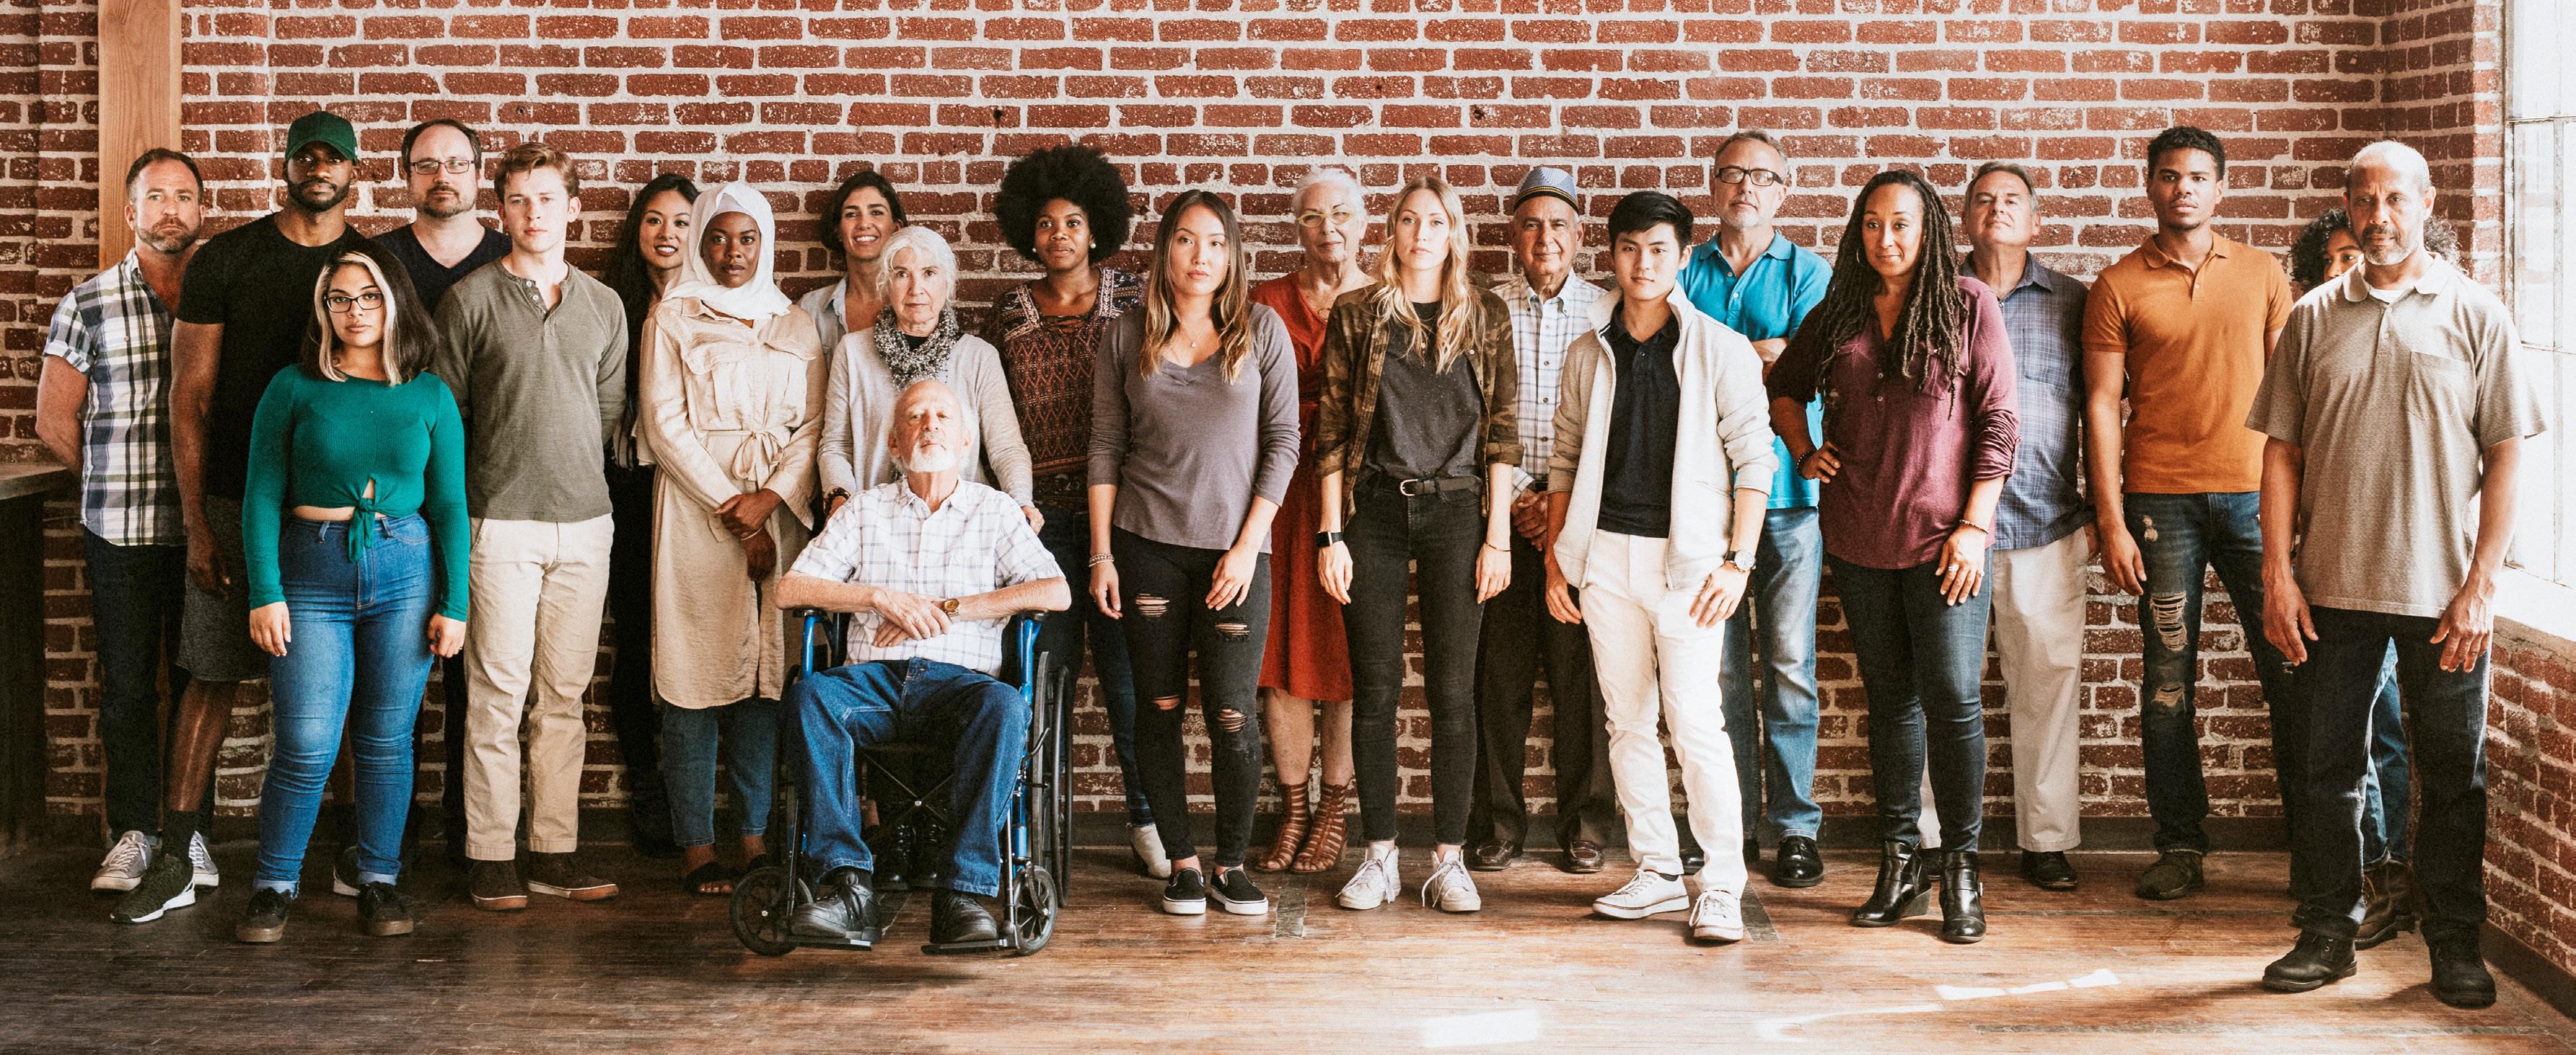
of adults are experiencing a mental illness. Equivalent to over 50 million Americans. did not receive treatment.
The percentage of adults reporting serious thoughts of suicide is
– over 12.1 million adults.
of adults had a substance use disorder in the past year.
In the U.S., there are
of youth report su ering from at least one major depressive episode in the past year.
More than 2.7 million youth are experiencing severe major depression.
(over 5.5 million) of adults with a mental illness are uninsured.
individuals for every one mental health provider.
of adults who report experiencing 14 or more mentally unhealthy days each month were not able to see a doctor due to costs.
of adults who identi ed with two or more races reported serious thoughts of suicide.
of adults with a mental illness receive no treatment – over 28 million individuals.
of youth with major depression do not receive mental health treatment.
of all adults with a mental illness reported that they were not able to receive the treatment they needed.
Most reported they did not receive care because they could not a ord it.
youth with private insurance do not have coverage for mental or emotional di culties –over 1.2 million youth.
State officials’ decisions about coverage options, especially in times of crises, have a profound effect on children and can exacerbate pre-existing racial and ethnic disparities. In Arizona, the uninsured rate for children overall is higher than the national average (8.3% vs 5.2%). Additionally, Latino children are more than 1.5 times as likely to be uninsured compared to other children in the state (10.4% vs. 6.6%). Removing barriers to Arizona Health Care Cost Containment System (AHCCCS) and KidsCare enrollment would help reduce this disparity.
The uninsured rate for Latino kids in Arizona is 10.4%
Latino kids in Arizona are more than 1.5 times as likely to be uninsured compared to other kids
While AHCCCS and KidsCare are important sources of coverage for all children in Arizona, they are especially important for Latino children. Latino families have a higher labor force participation rate than others in the country, but are more likely to work in industries that do not offer employer-sponsored insurance (ESI). AHCCCS and KidsCare fill an important gap by providing affordable health coverage to these working families and while AHCCCS enrollment is always open, KidsCare enrollment was closed between 2010-2016.
Having health insurance like Medicaid improves families’ health and economic security. When adults’ health care needs are met, they are better equipped to support their children as they grow and learn.
All children in Arizona are significantly more likely to be uninsured compared to the national average. Almost half (44.6%) of all children in Arizona are Latino. Coverage inequities between Latino children and other children in Arizona narrowed from 2008 to 2018, but more work remains to be done. Between 2017 and 2018, the uninsured rate went in the wrong direction for all children in the state.
Change significant at the 90% confidence level and relative to prior year. ^ Change significant at the 90% confidence level (2016-2018).
The uninsured rate for Latino children in Arizona decreased for children 12 years old and younger, while the rate was flat for teens ages 13 to 18. Yet Latino teens have the highest uninsured rates by age group at over 15%. Although over 97% of Arizona’s Latino children are U.S. citizens, anti-immigrant rhetoric may lead parents to not enroll or renew their children’s coverage out of fear.
Latino Child Uninsured Rates in Arizona by Census Poverty Threshold, 2016 and 2018
The uninsured rate for Latino children in Arizona decreased for most income groups studied between 2016 and 2018. However, the uninsured rate for Latino children in families earning between 200% and 249% of the poverty thresholds (about $40,400-50,300 for a family of 3) increased over the period studied. These children have the highest uninsured rate at 14%. The disproportionate job losses among Latinos during the COVID-19 pandemic could result in even more coverage losses.
CHARTS
• OVERALL CRIME IN ARIZONA IS DOWN 11% COMPARED TO 2021
• AS OF 2022, ARRESTS OF HISPANICS ACCOUNT FOR MORE THAN ONE-FOURTH OF THE TOTAL ARRESTS IN ARIZONA
• THE MAJORITY OF ARRESTS IN ARIZONA ARE FOR GROUP B OFFENSES
• SINCE A PEAK IN 2020, HATE CRIMES IN ARIZONA ARE TRENDING DOWNWARD
• THE MAJORITY OF HATE CRIMES IN ARIZONA ARE RELATED TO RACE/ ETHNICITY/ANCESTRY
• NEARLY ONE-FOURTH OF THE HATE CRIMES RELATED TO RACE IN ARIZONA ARE ANTI-HISPANIC OR LATINO
• A LACK OF AFFORDABLE HOUSING IS THE MOST SERIOUS PROBLEM FACING ALL RACIAL/ETHNIC GROUPS
• MORE THAN ONE-THIRD OF LATINO ADULTS VIEW CRIME AS A SERIOUS NEIGHBORHOOD PROBLEM
• ABOUT ONE-FOURTH OF LATINO AND BLACK ADULTS FEAR BEING THREATENED OR PHYSICALLY ATTACKED IN THEIR NEIGHBORHOOD
• NEARLY ONE-FIFTH OF LATINO ADULTS FEEL UNWELCOME BECAUSE OF THEIR RACE/ETHNICITY IN THEIR NEIGHBORHOOD
• OPIOID-RELATED HOSPITALIZATIONS AND EMERGENCY ROOM VISITS IN ARIZONA ROSE AGAIN IN 2021 AFTER DROPPING IN 2020
• MEN HAVE A DRAMATICALLY HIGHT FATALITY RATE FROM OPIOIDS COMPARED TO WOMEN IN ARIZONA
• THE BLACK OR AFRICAN AMERICAN POPULATION IN ARIZONA HAS A SIGNIFICANTLY HIGHER OPIOID FATALITY RATE
An in-depth look at cellphone usage in Phoenix and Tucson, courtesy of Univision Communications
TRAFFICKING
It’s Happening in Plain Sight
Arizona is 13th on the list of the worst states for human trafficking
BY KAREN MURPHYThe persistent rumor that immigrants and asylum seekers are bringing illicitly manufactured fentanyl across the border is simply not true. According to two think tanks—Third Way and the Cato Institute—it is U.S. citizens that are bringing it in through legal ports of entry
BY KAREN MURPHY
This report, from the Arizona Department of Health Services, warns that this is a growing problem not just in Arizona, but throughout the U.S. and is the leading cause of preventable death
Safe Kids Worldwide reports that parents’ attitudes, beliefs and behaviors are related to the key causes of unintentional childhood injury


OVERALL CRIME IN ARIZONA IS DOWN 11% COMPARED TO 2021
*NOTE: Values as of May 25, 2023. Values are updated on a regular basis.
AS OF 2022, ARRESTS OF HISPANICS ACCOUNT FOR MORE THAN ONE-FOURTH OF THE TOTAL ARRESTS IN ARIZONA
TOTAL NUMBER OF ARRESTEES IN ARIZONA BY ETHNICITY* (2018—2022)
*NOTE: Values as of May 25, 2023. Values are updated on a regular basis. The National Incident Based Reporting System (NIBRS) is an incident-based reporting system for crimes known to the police. For each crime incident coming to the attention of law enforcement, a variety of data are collected about the incident.
(18,615) 16.8%
(19,053) 17.2% GRO UP B* * CR IM E S AGA IN S T SOCIE TY** * CRIM E S AGA IN S T PR OPE R TY** * * C R IM E S AGA IN S T PERSON** ** *
NOTES: *Values as of May 25, 2023. Values are updated on a regular basis.
**Group B arrests include offenses such as, for example, driving under the influence, disorderly conduct, trespass of real property and liquor law violations. ***Crimes against society are typically victimless crimes in which persons or property are not the object. These crimes can include, for example, drug equipment violations, pornography, sports tampering, prostitution, weapon law violations and animal cruelty.
****Crimes against property occur to obtain money, property or another benefit. Examples include robbery, burglary, larceny theft, motor vehicle theft and arson.
*****Crimes against person are those where the victims are always individuals. Examples include forcible rape, aggravated assault, criminal homicide and human trafficking.
*NOTE: Values as of May 25, 2023. Values are updated on a regular basis.
NEARLY ONE-FOURTH OF THE HATE CRIMES RELATED TO RACE IN ARIZONA ARE ANTI-HISPANIC OR LATINO
*NOTE: Values as of May 25, 2023. Values are updated on a regular basis.
PERCENTAGE
*NOTE: Values as of May 25, 2023. Values are updated on a regular basis.
A LACK OF AFFORDABLE HOUSING IS THE MOST SERIOUS PROBLEM FACING ALL RACIAL/ ETHNIC GROUPS
*NOTE: This poll was conducted May 16 — June 13, 2022, among a nationally representative, probability-based sample of 4,192 adults age 18 or older in the U.S. The survey included nationally representative samples of 1,216 White, 1,103 Black, 1,066 Latino, 552 Asian and 180 Native American adults.
Source: National Public Radio (NPR), the Harvard T.H. Chan School of Public Health and The Robert Wood Johnson Foundation, Personal Experiences of U.S. Racial/Ethnic Minorities in Today’s Difficult Times, August 2022 www.rwjf.org/en/insights/our-research/2022/08/personal-experiences-of-u-s-racial-ethnic-groups-in-todays-difficult-times.html
PERCENTAGE OF SURVEYED* U.S. ADULTS WHO VIEW CRIME AS A SERIOUS NEIGHBORHOOD PROBLEM BY RACE/ETHNICITY (2022)
MORE THAN ONE-THIRD OF LATINO ADULTS VIEW CRIME AS A SERIOUS NEIGHBORHOOD PROBLEM
22% 28% 35% 3 5 % 40%
*NOTE: This poll was conducted May 16 — June 13, 2022, among a nationally representative, probability-based sample of 4,192 adults age 18 or older in the U.S. The survey included nationally representative samples of 1,216 White, 1,103 Black, 1,066 Latino, 552 Asian and 180 Native American adults.
Source: National Public Radio (NPR), the Harvard T.H. Chan School of Public Health and The Robert Wood Johnson Foundation, Personal Experiences of U.S. Racial/Ethnic Minorities in Today’s Difficult Times, August 2022 www.rwjf.org/en/insights/our-research/2022/08/personal-experiences-of-u-s-racial-ethnic-groups-in-todays-difficult-times.html
ABOUT ONE-FOURTH OF LATINO AND BLACK ADULTS FEAR BEING THREATENED OR PHYSICALLY ATTACKED IN THEIR
*NOTE: This poll was conducted May 16 — June 13, 2022, among a nationally representative, probability-based sample of 4,192 adults age 18 or older in the U.S. The survey included nationally representative samples of 1,216 White, 1,103 Black, 1,066 Latino, 552 Asian and 180 Native American adults.
PERCENTAGE OF SURVEYED* U.S. ADULTS WHO FEEL UNWELCOME IN THEIR NEIGHBORHOOD BECAUSE OF THEIR RESPECTIVE RACE/ETHNICITY (2022)
NEARLY ONE-FIFTH OF LATINO ADULTS FEEL UNWELCOME BECAUSE OF THEIR RACE/ETHNICITY IN THEIR NEIGHBORHOOD
*NOTE: This poll was conducted May 16 — June 13, 2022, among a nationally representative, probability-based sample of 4,192 adults age 18 or older in the U.S. The survey included nationally representative samples of 1,216 White, 1,103 Black, 1,066 Latino, 552 Asian and 180 Native American adults.
Source: National Public Radio (NPR), the Harvard T.H. Chan School of Public Health and The Robert Wood Johnson Foundation, Personal Experiences of U.S. Racial/Ethnic Minorities in Today’s Difficult Times, August 2022 www.rwjf.org/en/insights/our-research/2022/08/personal-experiences-of-u-s-racial-ethnic-groups-in-todays-difficult-times.html
OPIOID OVERDOSE FATALITY RATE* AND PERCENT OF OPIOID DEATHS IN ARIZONA BY RACE/ETHNICITY (2020—2021)
BLACK OR AFRICAN AMERICAN POPULATION IN ARIZONA HAS A SIGNIFICANTLY HIGHER OPIOID FATALITY RATE
*NOTE: Rate per 100,000 population
Source: Arizona Department of Health Services, Opioid Overdoses Surveillance Report, Arizona, 2020-2021, Michael Shayne Gallaway, Lubaba Tasnim, Mercedeh Reamer, Samantha Davidson and Laura Erhart, 2022 directorsblog.health.azdhs.gov/opioid-overdoses-surveillance-report-available-for-2020-2021/


There is a four-mile stretch in Phoenix on 27th Ave. from Indian School to Northern known as “The Track,” where, according to local authorities, sex trafficking, the main form of human trafficking, is in full view every night. The alarming scenario also takes place nightly in Mesa along Main St., in Chandler on Arizona Ave. near Ray Rd., on Mill Ave. in Tempe and in Scottsdale’s Entertainment District.
Human trafficking is a worldwide crisis that is roughly divided into two types: sex trafficking and forced labor. In the U.S., the National Human Trafficking Hotline was established in 2007 and run by Polaris, a nonprofit that gets its funding from the U.S. Department of Health and Human Services. The hotline assists “victims of severe forms of trafficking” to communicate with service providers. The hotline does not report callers to law enforcement without consent. However, the hotline does report “all situations
• 2,198 persons were referred to U.S. Attorneys for human trafficking offenses in fiscal year 2020, a 62% increase from the 1,360 persons referred in 2011.
• 1,343 persons were prosecuted for human trafficking, an 84% increase from the 729 prosecuted in 2011.
• 685 persons were convicted of a federal human trafficking offense in 2020, compared to 837 in 2019 and 464 in 2011.
• 1,564 persons were in the custody of a state prison serving a sentence for a human trafficking offense at year-end 2020, based on the 47 states that reported data.
Of the 1,169 defendants charged in U.S. district court with human trafficking offenses in fiscal year 2020:
were
Stop Trafficking, Phoenix Police Department VICE Unit
were
Citizens were
were Black were Hispanic had no prior convictions
Based on data gathered by the U.S. State Department, Arizona is a prime transit and destination area for both sex and labor trafficking in the United States. The Department of Justice has identified Phoenix as one of the top human trafficking jurisdictions in the country.
—Training and Resources Unite to
Thursday, September 28, 2023
Arizona Grand Resort
8000 South Arizona Grand E, Phoenix aatn.org/2023-breakfast
GUEST SPEAKER
Bradley Myles , Senior Advisor-Innovation, Panorama
Global and former CEO, Polaris
ART FOR HOPE
Human trafficking survivors have created artwork—handpainted canvases, custom clothing, jewelry, Christmas cards, birthday cards and much more—that will be on display. Some of the art will also be available for sale to raise money to help other women who are human trafficking survivors. The event will also include an informative presentation with expert speakers from the Phoenix Dream Center.
THE DETAILS
Saturday, Nov. 4, 2023 10am—Noon
Phoenix Dream Center
3210 NW Grand Ave., Phoenix 602.346.8700
phoenixdreamcenter.org
STOP TRAFFIC WALK
TICKETS
Only a limited number of tickets will be sold. Tickets (available online) are $5 for 1, $8 for 2 and $12 for four.
phoenixdreamcenter.org/ artwalk
The average age of first sex trafficking experience was 16.9 years old, with the youngest age of first sex trafficking experience being 12 years old.
—The Youth Experiences Survey (YES, 2014—2021), conducted by the Office of Sex Trafficking Intervention Research at Arizona State University
involving children to appropriate authorities as directed by state and federal protocols…[and] will also report situations where immediate and escalating violence can be heard or observed.”
According to the hotline, California, Texas and Florida are the worst states for human trafficking but they are far from the only states with serious issues. In 2021, it reported that Arizona was #13 in terms of human trafficking with 651 reports of human trafficking tips, 213 cases and 337 victims. The situation gets even worse in the Valley of the Sun during major events like the recent Super Bowl.
A Stop Traffic Walk raises funds for Where Hope Lives, located at the Phoenix Dream Center (ages 18+), StreetLightUSA (ages 13—17) and Colorado City Dream Center (familial trafficking survivors). This event will have a climbing wall and games for children, food vendors, entertainment and more. The walk will begin at 6pm around the perimeter of the complex and will be less than a mile.
DETAILS
Saturday, Jan 27, 2024 4pm—7pm
Peoria Sports Complex
16101 North 83rd Ave., Peoria
CONTACT
Dream City Foundation 602.867.7117
p2p.onecause.com/stwphoenix
According to a story on the FOX10 Phoenix website, nearly 350 arrests were made during an operation targeting human trafficking and sex crimes between Jan. 30 and Feb. 11 when Super Bowl LVII, the WM Phoenix Open and the Barrett-Jackson Auto Auction created a perfect storm that brought people to the Phoenix area from all over the world. Of the arrests made during that period, 48 were felonies and 300 were misdemeanors, 120 of which were alleged sex buyers.
Victims of human trafficking are not easily identified, says the U.S. Department of State. They can be “any age, race, ethnicity, sex, gender identity, sexual orientation, nationality, immigration
…almost one in every four participants [reported] both sex trafficking…and labor exploitation….
status, cultural background, religion, socio-economic class or education attainment level.” The most vulnerable are “children in the child welfare and juvenile justice systems, including foster care; runaway and homeless youth; unaccompanied foreign national children without lawful immigration status; individuals seeking asylum; American Indians and Alaska Natives, particularly women and girls; individuals with substance use issues; racial or ethnic minorities; migrant laborers, including undocumented workers and participants in visa programs for temporary workers; foreign national domestic workers in diplomatic households; persons with limited English proficiency; persons with disabilities; LGBTQI+ individuals; and victims of intimate partner violence or other forms of domestic violence.”
It is important for everyone to remember this chilling fact: Human traffickers can be anyone— from strangers and casual acquaintances to even family members.
Karen Murphyis anAZHCC staffwriterand copyeditor/proofreader.
•
It is based on exploitation and does not require movement across borders. Trafficking has two basic types: sex trafficking and forced labor trafficking. Victims are found in legitimate and illegitimate labor industries, including sweatshops, massage parlors, agriculture, restaurants, hotels and domestic service. Under federal law, every minor induced to engage in commercial sex is a victim of human trafficking.
•
It is based on movement and involves moving a person across a country’s border with that person’s consent in violation of immigration laws. It is very different from trafficking, but can become trafficking if the smuggler uses force, fraud or coercion to hold people against their will for labor or sexual exploitation.
—U.S. Department ofHomeland Security
ARIZONA
Arizona Anti-Trafficking Network
1.844.400.2286 aatn.org
Arizona Human Trafficking Council 1700 W. Washington St., Suite 230 Phoenix, AZ 85007 602.542.4043 goyff.az.gov/htc
THE PHOENIX DREAM CENTER
The Phoenix Dream Center has several missions—and one of them is to stop human trafficking.
CONTACT INFO
3210 NW Grand Ave., Phoenix 602.346.8700 phoenixdreamcenter.org
ASU Office of Sex Trafficking Intervention Research (STIR) 411N. Central Ave., Phoenix socialwork.asu.edu/stir
Sex Trafficking 101
An online training module with specific information for the general public, school professionals, mental health providers and medical providers
Arizona Human Trafficking hotline 1-877-4AZ-TIPS
Phoenix Vice non-emergency hotline 602-454-2771
ALWAYS Mailing Address 24 W. Camelback Rd. Box A335, Phoenix, AZ 85013 602.248.7055 info@alwaysaz.org alwaysaz.org
This group provides legal assistance to human trafficking survivors and others.
NATIONAL
National Human Trafficking Hotline
1.888.373.7888
TEXT: BEFREE or HELP to 233733 humantraffickinghotline.org polarisproject.org
Surviving Sex Trafficking
A movie about sex trafficking that can be watched online. survivingsextraffickingfilm.com
The numbers are staggering—and heartbreaking: According to the Centers for Disease Control and Prevention (CDC) in 2022, “… more than two thirds (68%) of the reported 107,081 drug overdose deaths in the United States involved synthetic opioids other than methadone, principally illicitly manufactured fentanyls (IMFs).” Sadly, this shocking number is expected to rise again this year.
Fentanyl is a synthetic opioid that was originally developed by Dr. Paul Janssen in 1959 when he was looking for a drug more potent than morphine for pain relief, but with a shorter duration. Janssen was a Belgian pharmaceutical researcher with more than 100 patents who was responsible for many scientific breakthroughs in pain management, psychiatry, infectious disease and gastroenterology during his career. Fentanyl was approved in 1968 by the U.S. Food & Drug Administration primarily for use as a painkiller during surgeries and as pain relief for cancer patients.
The CDC says the U.S. opioid crisis first began in the late 1990s when opiates were increasingly prescribed for pain relief. According to a 2020 commentary on the Brookings Institute website, Purdue Pharm and the Sackler family promoted “OxyContin in misleading and unethical ways, notably misrepresenting its risk of addiction
MAY 7, 2024
National Fentanyl Awareness Day
fentanylawarenessday.org
The Faces of Fentanyl is a special exhibit at the U.S. Drug Enforcement Administration (DEA) that commemorates the lives lost from fentanyl poisoning. For consideration for inclusion in the special exhibit, email a photo of your loved one lost to fentanyl (include their name and age) to: fentanylawareness@dea.gov
You can also post a photo and the name of your loved one on social media using the hashtag #JustKNOW .
VIEW THE FACES OF FENTANYL
DEA Headquarters
—Michael
U.S.
and
inaMarch9,2023,articlein The Washington Post
700 Army Navy Drive Arlington, VA 22202 TUES—SAT, 10 am—4pm dea.gov
“One pedestrian tried to come through in January wearing a sheaf of tablets that looked like a pair of shorts. Another smuggler jammed 14,000 pills inside the metal frame of a walker.”
Humphries,
Customs
BorderProtection’s Nogalesportdirector,
when used to treat chronic, non-cancer pain.” After thousands of lawsuits, Purdue filed for bankruptcy in 2019 and, in May of this year, according to the Washington Post, a federal appeals court in New York ruled that the Sackler family will relinquish control of their company and will pay up to $6 billion in settlement money “over 18 years to victims, survivors and [state] governments….” The ruling, the Post says, also “controversially shields [the family] from future claims.”
CELEBRITIES WHO DIED FROM FENTANYL-RELATED OVERDOSES
Prince, 57
Iconic pop, rock and R&B artist
Tom Petty, 66 Rock singer/guitarist
Michael K. Williams, 54
Actor on The Wire TV show
Leandro De Niro Rodriguez, 19
Actor and Grandson of Oscar-winning actor
Robert De Niro
Adam Rich, 54
Former Eight is Enough child star
Lil Peep, 21 American rapper and singer
ARIZONA DEPARTMENT OF HEALTH SERVICES
azdhs.gov/opioid
Report Unlawful Activity to the DEA
1.877.792.2873
deadiversion.usdoj.gov/tips_online.htm
OPIOD ASSISTANT AND REFERRAL LINE
1.888.688.4222
Luke Bell, 32 Country singer
Colt Brennan, 37 Record-setting
University of Hawaii football quarterback
Michelle McNamara, 46 New York Times
best-selling author and wife of comedian
Patton Oswalt
Mac Miller, 26 Rapper
Frank
Vallelonga Jr., 60
Actor who appeared in the movie, Green Book and was in a 2004 episode of the HBO drama, The Sopranos
DEA INTELLIGENCE REPORT
Fentanyl Flow to the United States
FENTANYL AWARENESS
dea.gov/fentanylawareness
CDC FENTANYL INFORMATION
cdc.gov/opioids/basics/fentanyl.html
LEARN ABOUT NALOXONE (NARCAN) naloxoneaz.com narcan.com
FENTANYL TEST STRIPS
These small strips of paper have been legal in Arizona since September 2021. The strips can be used to detect the presence of fentanyl in drugs such as cocaine, methamphetamine and heroin and drug forms (pills, powder and injectables), but not the amount present or its potency.
• More than five people die every day from opioid overdoses in Arizona.
—Arizona Department ofHealth Services
• Fentanyl trafficking offenders have increased by 950% between FY 2017 and FY 2021.
• 86.2% of fentanyl trafficking offenders were United States citizens—and 82.8% were men.
• The District of Arizona was in the top five districts for fentanyl trafficking offenders with 95 offenders. The top district was the Southern District of California with 120 offenders.
—The U.S. Sentencing Commission, an independent agencyinthe judicial branch ofthe government created bythe Sentencing Reform Act of1984;facts arefrom afiscalyear2021 report
• Fentanyl is a synthetic opioid that is up to 50 times stronger than heroin and 100 times stronger than morphine.
• There are two types of fentanyl: pharmaceutical and illegally made. Illegally made fentanyl is the cause of most recent cases of fentanyl-related overdoses.
• Drug overdose death rates involving fentanyl increased by 279% from 5.7 per 100,000 in 2016 to 21.6 in 2021.
—CentersforDisease Control and Prevention (CDC), U.S. Department of Health & Human Services
• 42% of pills tested for fentanyl contained at least 2 mg of fentanyl, considered a potentially lethal dose. The amount is so small it can fit on the tip of a pencil.

• Drug trafficking organizations typically distribute fentanyl by the kilogram. One kilogram of fentanyl has the potential to kill 500,000 people.
—The United States Drug EnforcementAdministration
• More than 96% of fentanyl seizures along the border since the start of fiscal year 2023 have been at legal U.S. ports of entry. While Texas Republicans point to undocumented immigrants in their state as fentanyl drug smugglers and traffickers, almost all fentanyl seized by CBP was at legal points of entry in Arizona and California.
—ThirdWay, aWashington, D.C.-based public policythinktank
The original opioid crisis of the 1990s morphed in 2014 into the current fentanyl crisis, which has only gotten worse— much worse—in 2023. Much of the problem is related to fake prescription pills laced with fentanyl and street drugs such as heroin, cocaine and MDMA (Ecstasy/Molly) cut with fentanyl. The U.S. Drug Enforcement Administration (DEA), an agency of the U.S. Department of Justice (DOJ), reported that 2023 fentanyl seizures represent more than 190 million deadly doses. In 2022, the agency’s laboratory found that of the fentanyl-laced fake prescription pills analyzed, “six out of 10 now contain a potentially lethal dose of fentanyl.”
According to a January 2020 DEA Intelligence Report on fentanyl trafficking, although Mexico and China “are the primary source countries for fentanyl and fentanyl-related substances trafficked directly into the United States, India is emerging as a source for finished fentanyl powder and fentanyl precursor chemicals.” In
addition, according to the report, some fentanyl products are also being smuggled on a smaller scale into the United States from Canada.
The DEA, working with Mexican officials, have seized illicit pill mills, including one operating in Azcapotzalco, Mexico City, that was producing illicit fentanyl-laced oxycodone M-30 pills, suspected fentanyl powder, precursor chemicals and multiple other items related to the production of fentanyl-laced illicit pills. The DEA has named the Sinaloa and the New Generation Jalisco (Cártel de Jalisco Nueva Generación or CJNG) cartels as likely the primary trafficking groups responsible for smuggling fentanyl into the United States from Mexico using U.S. citizens. The DEA also believes that these Mexican transnational criminal organizations (TCOs) control the trafficking routes that go through California and Arizona. As a result of regulations being implemented in both India and China, these Mexican TCOs could assume an even larger role in the fentanyl supply chain.
What is not true, but unfortunately is believed by Americans of
all political persuasions (see chart below), is that immigrants and asylum seekers are responsible for bringing fentanyl across our southern border. Both the Third Way, a think tank that claims to represent “modern center-left ideas” and the Cato Institute, a libertarian think tank co-founded by one of the Koch brothers, agree with the findings of the U.S. Sentencing Commission: Fentanyl is primarily trafficked by U.S. citizens through legal ports of entry. Between 2018—2021, U.S. citizens received the most convictions by far and in 2021, U.S. citizens accounted for 86.3 percent of fentanyl trafficking convictions compared to just 8.9 percent for illegal immigrants.
Although the Biden Administration and federal and local state agencies are working tirelessly to stop the flow of fake prescription drugs being sold online and flowing across our borders, it is important that every single American who thinks that fake prescription pills bought online or on the street are safe know just one important fact: Like the DEA campaign says, “One pill can kill.”
Karen Murphyis anAZHCC staffwriterand copyeditor/proofreader.
TOTAL DEMOCRATS REPUBLICANS INDEPENDENTS 39% 23% 60% 38%
*The poll surveyed 1,116 U.S. adults online between July 28—29, 2023. The margin of errorforthe overall sample is ±3.6 percentage points. NOTE: This was not the only question on the poll.
% WHO BELIEVE THIS FALSE STATEMENT: “Most of the fentanyl entering the U.S. is smuggled in by unauthorized migrants crossing the border illegally”

Prescription and illicit opioids, like fentanyl, are addictive and responsible for an increasing number of deaths in Arizona. 1 This rise reflects a growing problem across the nation and overdose deaths are the leading cause of preventable injury death. 2, 3 In 2020-2021, there were 3,888 opioid overdose deaths among Arizona residents. The leading manner of death was an accident (93% of all opioid overdose deaths). The leading cause was prescription and synthetic opioids (94.5%). The mortality rate for opioid overdose deaths was highest among males (39 per 100,000 persons), Black or African American (38 per 100,000 persons), and persons 25-34 years old (59 per 100,000 residents) or 35-44 years old (49 per 100,000 persons). The overall trend of opioid overdose deaths increased significantly from 2017-2020, but was stable (not significantly increasing or decreasing) from 2020-2021.
Other opioid-related events are reported via three mechanisms, with varying degrees of specificity. From most to least specific, there were 7,448 reportable non-fatal opioid overdose events (MEDSIS), 18,203 suspected emergency department (ED) or inpatient visits (syndromic surveillance), and 104,450 hospitalization or ED visits with any mention of opioids (hospital discharge records) in 2020-2021. Nonfatal opioid-related overdoses most commonly occurred among males (65%), White (58%) and Hispanic (28%) persons, and persons ages 18-44 (68%). The rate of non-fatal opioid-related overdoses were highest among males (67 per 100,000), American Indian or Alaska Native (35 per 100,000) and African American or Black persons (33 per 100,000), and persons ages 18-44 (289 per 100,000). The overall trend of non-fatal opioid overdoses was stable (not significantly increasing or decreasing) during 2020-2021.
The number of opioid prescriptions, pills, and average morphine milligram equivalents (MME) dispensed in Arizona decreased during 2020-2021 compared to previous years
There were 17,484 Emergency Medical Services (EMS)/Law Enforcement responses reported for suspected opioid overdoses. EMS/Law Enforcement response for suspected opioid overdoses occurred most commonly for males (66%), White (55%) and Hispanic (25%) persons, and persons ages 18-44 years old (62%). Naloxone was administered for 15,012 EMS/Law Enforcement responses for suspected opioid overdoses (>80% of all responses). Naloxone was administered most commonly by EMS (75%), Law Enforcement (19%), or a bystander (5%). Naloxone dispensed by pharmacies has continued to significantly increase during 2020-2021 compared to previous years.
Hospitalizations with any mention of opioids resulted in approximately $2.2 billion in total charges annually in 2020-2021.
1 Arizona Department of Health Services, Bureau of Public Health Statistics. (2020). Opioid Interactive Dashboard. Accessed August 23, 2021.
https://www.azdhs.gov/prevention/womens-childrens-health/injury-prevention/opioid-prevention/opioids/index.php#dashboard 2 Centers for Disease Control & Prevention, Opioid Data Analysis and Resources. Trends in Death Rates Involving Opioids (2020). Accessed July 28, 2021. https://www.cdc.gov/drugoverdose/data/analysis.html
3 Woolf, S.H., Schoomaker, H. (2019). Life Expectancy and Mortality Rates in the United States, 1959-2017. JAMA. 322(20): 1996-2016. doi:10.1001/jama.2019.16932

Unintentional injuries are the leading cause of death among children 1–9 years of age and the 5th leading cause among infants under 1 year of age.1 Each year on average, unintentional injuries claim the lives of about 3,100 children under the age of 10, and an estimated 2.5 million more are seen in emergency rooms (ERs) for nonfatal unintentional injuries. 2,3 Importantly, most of these injuries are preventable.
Effective prevention requires a combination of laws, policies, environmental and product modifications, and awareness raising and educational efforts by government, the private sector, and civil society. However, parents and caregivers also play a key role and are often the first line of defense in keeping kids safe. Safe Kids Worldwide and its network of coalitions has contributed towards these efforts for 35 years by raising awareness and educating parents and caregivers about child injury hazards and preventive strategies and advocating with government and industry for changes that keep children safer.
In 2021, with the support of its founding sponsor Johnson & Johnson, Safe Kids established the National Parent Survey on Child Injury to begin to track key safety behaviors that would reduce the risk of injury among children under the age of 10 years. The intent is to repeat the survey with a nationally representative sample every few years to monitor parents’ attitudes, beliefs, and behaviors related to key causes of unintentional childhood injury. The inaugural survey was fielded in February 2021 to 1,081 parents and explored safe behaviors across six causes of child injury.
A majority of parents surveyed are concerned about the risk of injury to their child (74 percent) but also believe that most childhood injuries are preventable (68 percent) and that they have at least some controll over that prevention (78 percent). When asked about safety behaviors specific to different causes of unintentional child injury, responses varied:
• Child passenger injuries: 88 percent of parents report that their child is always restrained when riding in the car with them.
• Pedestrian injuries: 89 percent of parents of children ages 2–9 report that they do not allow their child to cross the street without an adult.
• Bicycling injuries: 64 percent of parents whose child ages 2–9 ever rides a bike report that their child always wears a helmet when doing so.
• Drowning: 75 percent of parents who indicated their child can swim report that their child can float or tread water for at least a minute.
• Fire and burn injuries: 87 percent of parents with smoke alarms in their home have one inside or outside of every bedroom.
• Poisoning: 38 percent of parents keep medicine, laundry detergents, and/or household cleaners in cabinets, drawers, or closets that are at a level above their head only.
This report provides information on levels of safe behaviors, as well as demographic, attitudinal, and behavioral factors associated with those behaviors. The insights gained can help guide educational efforts and the results serve as a baseline against which future years of the survey can be compared.
• GASOLINE-FUELED VEHICLES HAVE DOMINATED IN ARIZONA FROM 2016 TO 2021
• ABOUT 60% OF HOUSEHOLDS IN THE U.S. AND ARIZONA HAVE TWO OR MORE VEHICLES
• THE MAJORITY OF U.S. AND ARIZONA WORKERS DRIVE ALONE TO WORK
• A SMALL PERCENTAGE OF WORKERS IN PHOENIX RELY ON PUBLIC TRANSPORTATION TO GET TO WORK
• THE AVERAGE COMMUTE TIME FOR WORKERS IN PHOENIX IS UNDER A HALF HOUR
• ARIZONA MOTOR VEHICLE CRASH FACTS (2021)
• ECONOMIC LOSSES IN ARIZONA FROM MOTOR VEHICLE CRASHES (2021)
• THE NUMBER OF FATAL MOTOR VEHICLE CRASHES IN ARIZONA HAS INCREASED WHILE THE NUMBER OF INJURY AND PROPERTY DAMAGE MOTOR VEHICLE CRASHES HAVE DECREASED BETWEEN 2007 AND 2021
• FATAL MOTOR VEHICLE CRASHES IN MARICOPA COUNTY INCREASED 21% BETWEEN 2020 AND 2021
• MOST MOTOR VEHICLE CRASHES IN ARIZONA OCCUR ON FRIDAYS
• THE PERCENTAGE OF ALL FATALITIES IN ARIZONA CAUSED BY ALCOHOL-RELATED MOTOR VEHICLE CRASHES HAS DECREASED BETWEEN 2017 AND 2021
• ALCOHOL-RELATED MOTOR VEHICLE CRASHES IN ARIZONA OVERWHELMINGLY INVOLVE MALE DRIVERS IN 2021
• PHOENIX SKY HARBOR INTERNATIONAL IS THE 12TH BUSIEST U.S. AIRPORT
245
FEATURE 252 IN FOCUS 256 IN FOCUS 254 IN FOCUS
265 IN FOCUS 262 IN FOCUS 259 IN FOCUS
AUTO INSURANCE
A look at auto insurance in the Phoenix and Tucson markets for the Hispanic population and the top types of transportation used and owned, courtesy of Univision Communications
Valley Metro Provides Access Throughout the Phoenix Metro Area
Ridership is rebounding post-pandemic and Valley Metro is responding with more bus and light rail routes throughout the Valley of the Sun
B Y HILLARY FOOSEThrough the U.S. Environmental Protection Agency’s Clean School Bus Program, this Phoenix metro area school district will be able to replace six of its diesel-fueled buses with electric-powered ones
BY KAREN MURPHYTUFESA International Connects Mexico and the Western United States
With a commitment to quality and unmatched customer service, this passenger transportation company, whose main routes include Phoenix, Los Angeles and Las Vegas, has been able to consistently expand its services and now operates 83 vehicles, with more than 200 direct collaborators
BY TUFESA STAFFMEETING THE LATINO COMMUNITY’S NEEDS
The Arizona Republic and La Voz Offer Transportation Coverage and Resources
Transportation is an important topic for the local Hispanic community so The Arizona Republic and its Spanish-language sister publication, La Voz, make sure to give the community the information it needs
BY LAURA DANIELLA SEPULVEDA, APRIL SANTANA CASTILLO AND JOANNA JACOBO RIVERAPhoenix Sky Harbor is a Major Asset for the City and the Entire State
“America’s Friendliest Airport” is also an economic powerhouse for the entire state
BY DAVID J. RAMIREZJoya Kizer now runs the airport concessionaire company her parents founded in 1989 with one store. The company has expanded a lot since then, including joint venture partnerships in Miami, Dallas/Fort Worth and Los Angeles
BY DAVID J. RAMIREZApp-based rideshare services are relatively new, but already play a crucial role in people’s lives—no matter what their income level
BY CARL FRANZENThe American Public Transportation Association has all the facts about how public transportation in the U.S. is used
A look at transportation in Arizona by the U.S. Department of Transportation’s Bureau of Transportation Statistics
The Maricopa Association of Governnments (MAG) takes a look at accessibility & equity in terms of the local transportation system
Economic Impact Report 2023 — Arizona
Lyft examines what their drivers want and need — and flexibility and independence are key requirements
PERCENT OF WORKERS (AGED 16+) WHO USE PUBLIC TRANSPORTATION TO COMMUTE TO WORK IN U.S. CITIES WITH THE MOST HISPANICS (2017—2021) Source:
NOTE: “The initial 20-mile light rail [Valley Metro Rail] line opened on December 27, 2008. Two extensions began service by spring 2016, adding six more miles and connecting downtown Mesa to northwest Phoenix. In 2019, the line extended 1.9 miles east to the new Gilbert Rd/Main St light rail station, where there are additional transit connections. The 50th St/Washington station also opened in 2019 with enhanced accessibility features, including advanced pedestrian detection crosswalk signals, wider platforms and gently sloped entries.”
AVERAGE COMMUTE TIMES FOR WORKERS (AGED 16+) IN U.S. CITIES WITH THE MOST HISPANICS (2017—2021)
Approximately 3.23 persons were killed each day. One person was killed every 7 hours and 25 minutes. There were 141 persons injured every day.
One person was injured every 10 minutes and 11 seconds.
Alcohol-related crashes accounted for 4.63% of all crashes and 20.23% of all fatal crashes. Of all pedestrian crashes, 15.05% were fatal while 4.38% of pedalcycle crashes were fatal.
Crashes which occurred during daylight hours (6:00 a.m. to 6:00 p.m.) accounted for 69.8% of all crashes.
THE PERCENTAGE OF ALL FATALITIES IN ARIZONA CAUSED BY ALCOHOLRELATED MOTOR VEHICLE CRASHES HAS DECREASED BETWEEN 2017 AND 2021
HARTSFIELD - JACKSON ATLANT A INTERNATIONAL (AT LA NTA , GA)
DA LLAS/FORT WORTH INTERNATION A L (DALL A S/ FORT WORTH, TX)
DE NV ER INTERNATIONAL (DENVER, CO)
CHICAGO O'HARE INTERNATI ONAL (CHICAGO, IL)
L O S ANGELES INTERNATIONAL (LO S ANGELES, CA)
J O HN F. KENNEDY INTERNATIONAL (NEW YORK, NY)
M CCA RRA N I NTERNATIONAL (LAS VEGAS, NV)
ORLAN DO INTERNATIONAL (ORLA ND O, FL)
M IA MI INTERNATIONAL (MIAMI, FL)
C HARLOTTE DOUGLAS INTERN ATIONAL (CHARLOTTE, NC)
S EA TTLE/TACOMA INTERNATIONAL (SEATTLE, WA)
PHO E N IX SKY HARBOR INTERNATIONAL (PHOENIX, AZ)
NEWARK LIBERTY INTERNATIONA L (N EWARK, NJ)
S A N F RANCISCO INTERNATIONAL (SAN FRANCISCO, CA)
GEORGE BUSH INTERCONTINENTAL/HOUSTON (HOUSTON , TX)
Source: United States Department of Transportation, Bureau of Transportation Statistics, “Passengers Boarded at the Top 50 U.S. Airports,” as of April 19, 2023 bts.gov/content/passengers-boarded-top-50-us-airports
45,395,960
35,345,122
33,773,762
33,114,058
32,323,365
26,935,638
25,411,956
24,469,671
23,946,445
23,100,118
22,157,855
21,569,474
20,411,222
19,813,054

OF HISPANICS PLAN TO BU Y OR LEASE A NEW OR PREOWNED VEHICLE IN THE NEXT YEAR 19%
COURTESY OF
36%
HISPANIC SHARE OF ALL ADULTS WITH AU TO INSURANCE
2 OUT OF 5
HISPANICS PLAN TO SW ITCH THEIR AUTO INSURANCE PROVIDER WITHIN THE NEXT

OF ADULTS WHO PLAN TO SW ITCH AUTO INSURANCE P R OVIDERS IN THE NEXT YEAR ARE HISPANIC

HISPANIC SHARE OF ALL ADULTS THAT P LAN TO BU Y OR LEASE A NEW OR PREOWNED VEHICLE IN THE NEXT YEAR +75%


Boletos en dbg.org
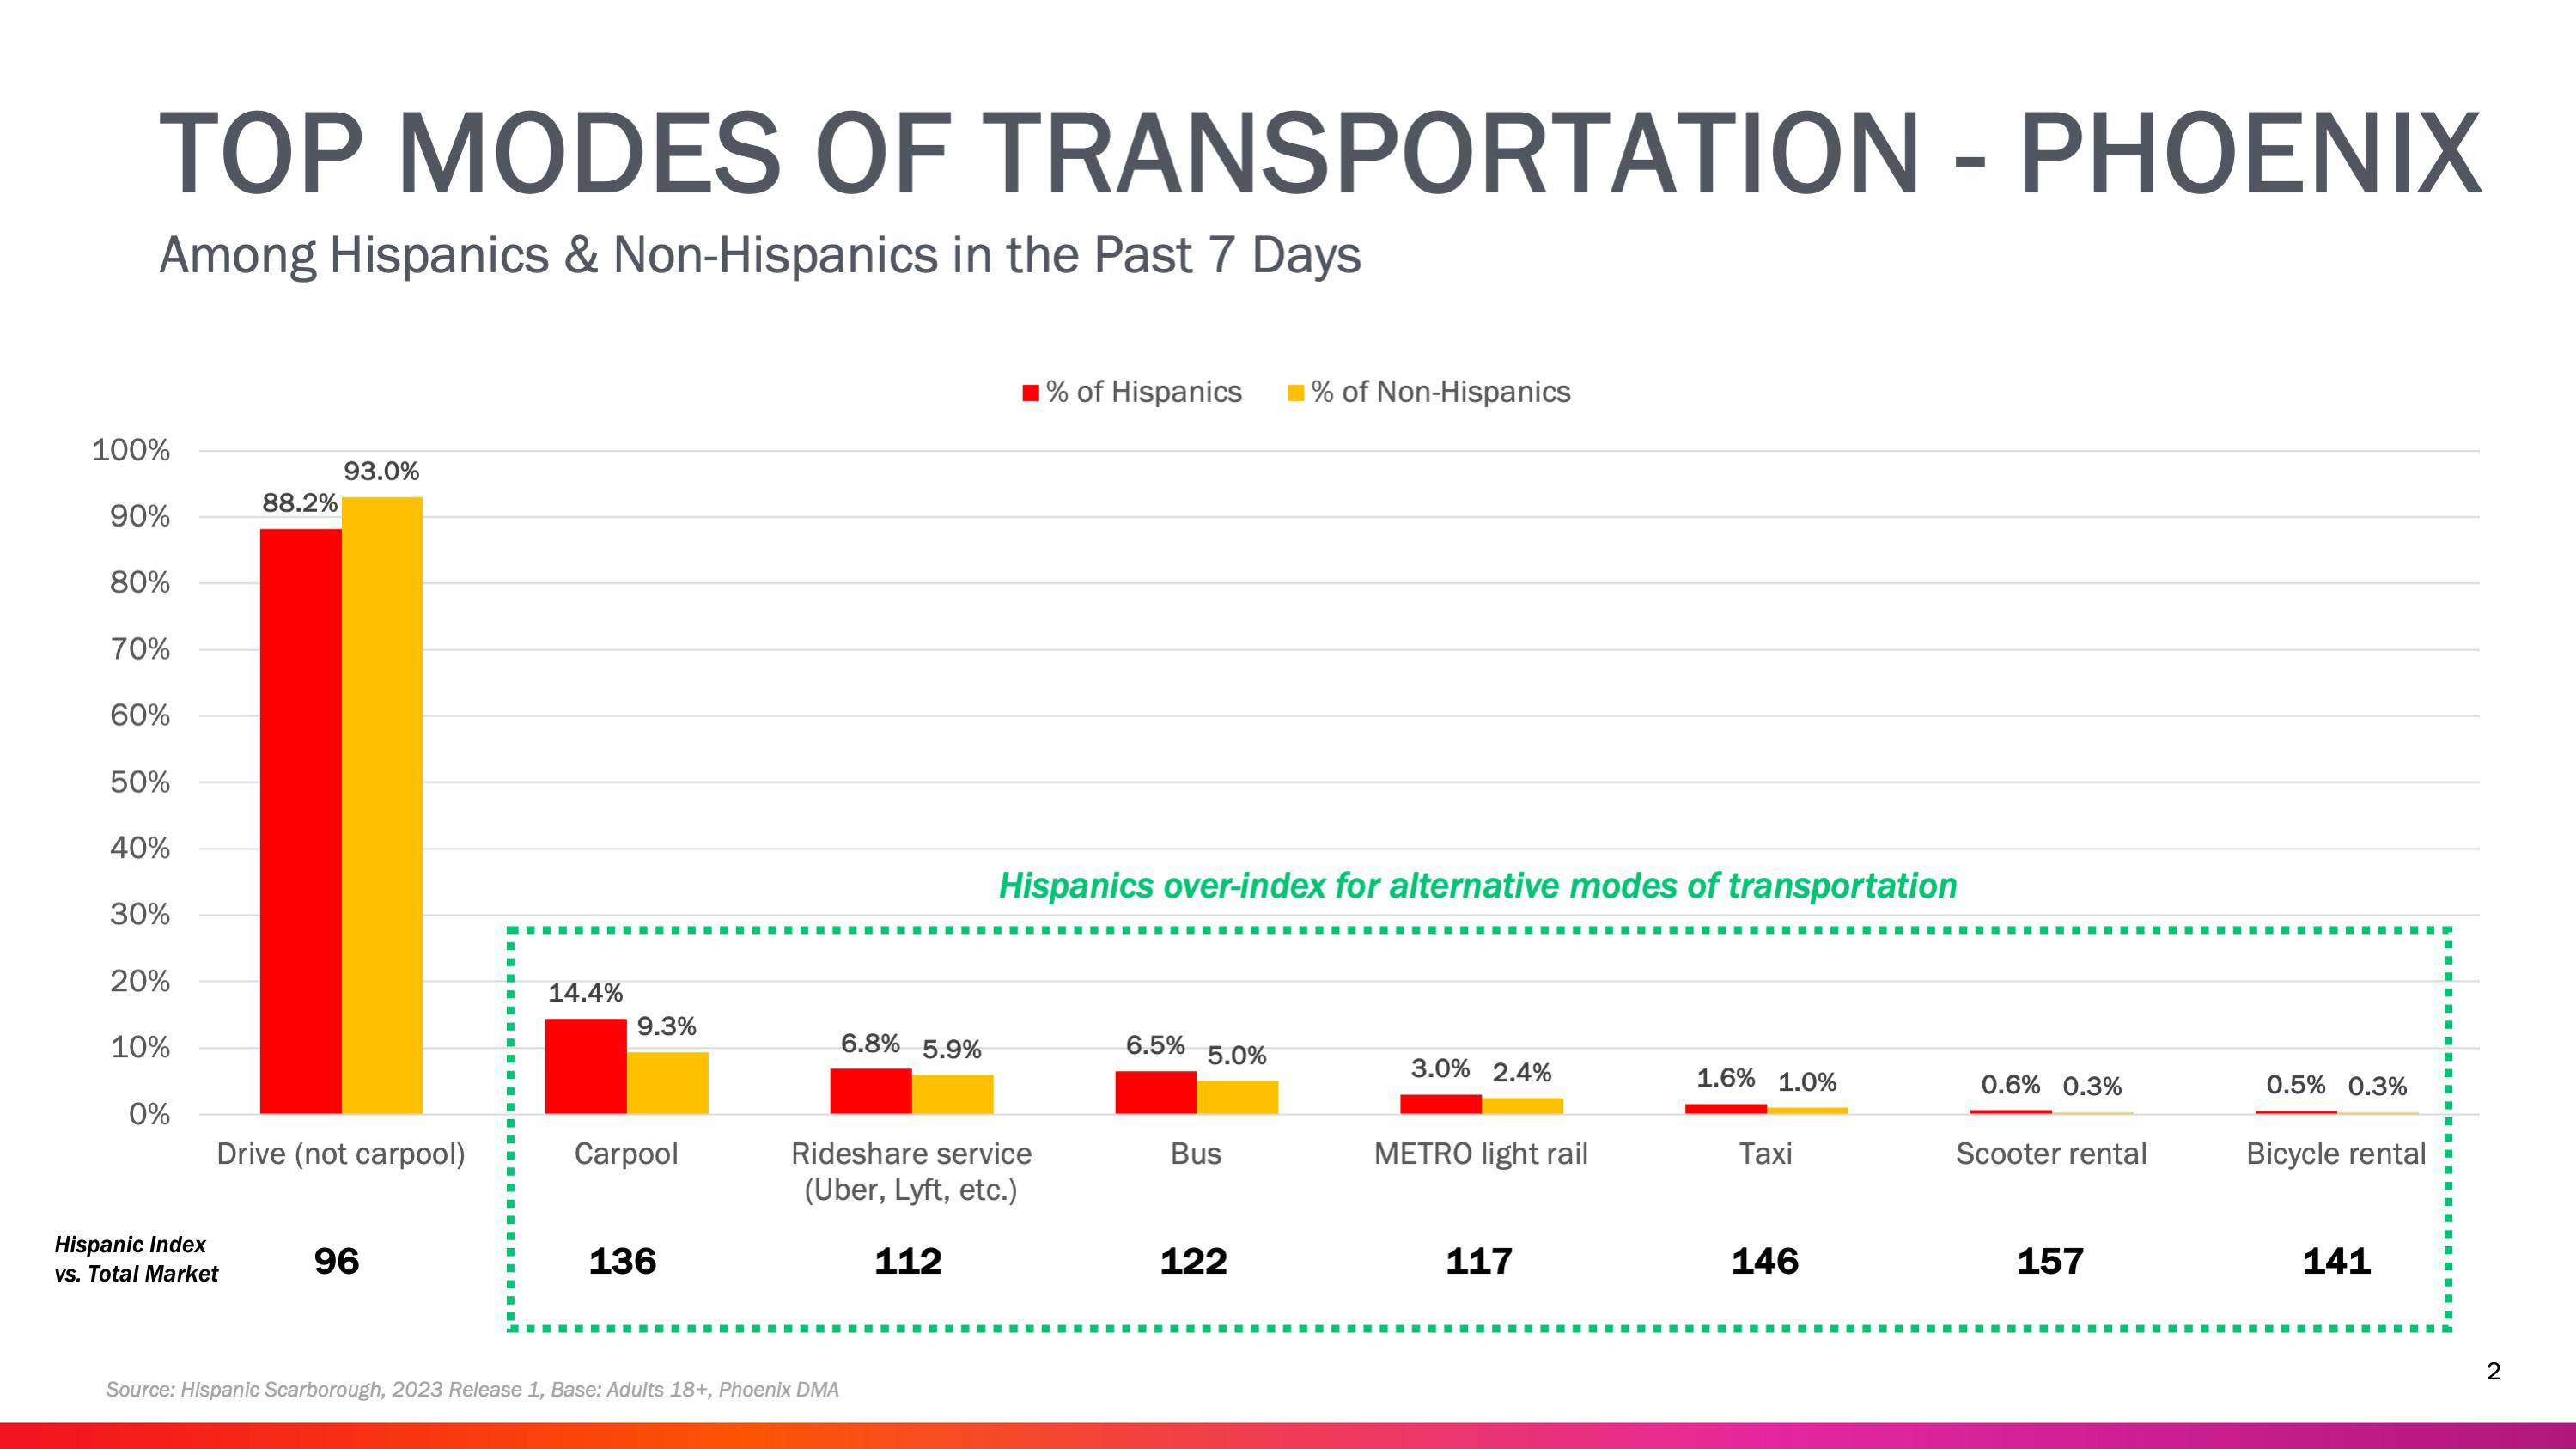
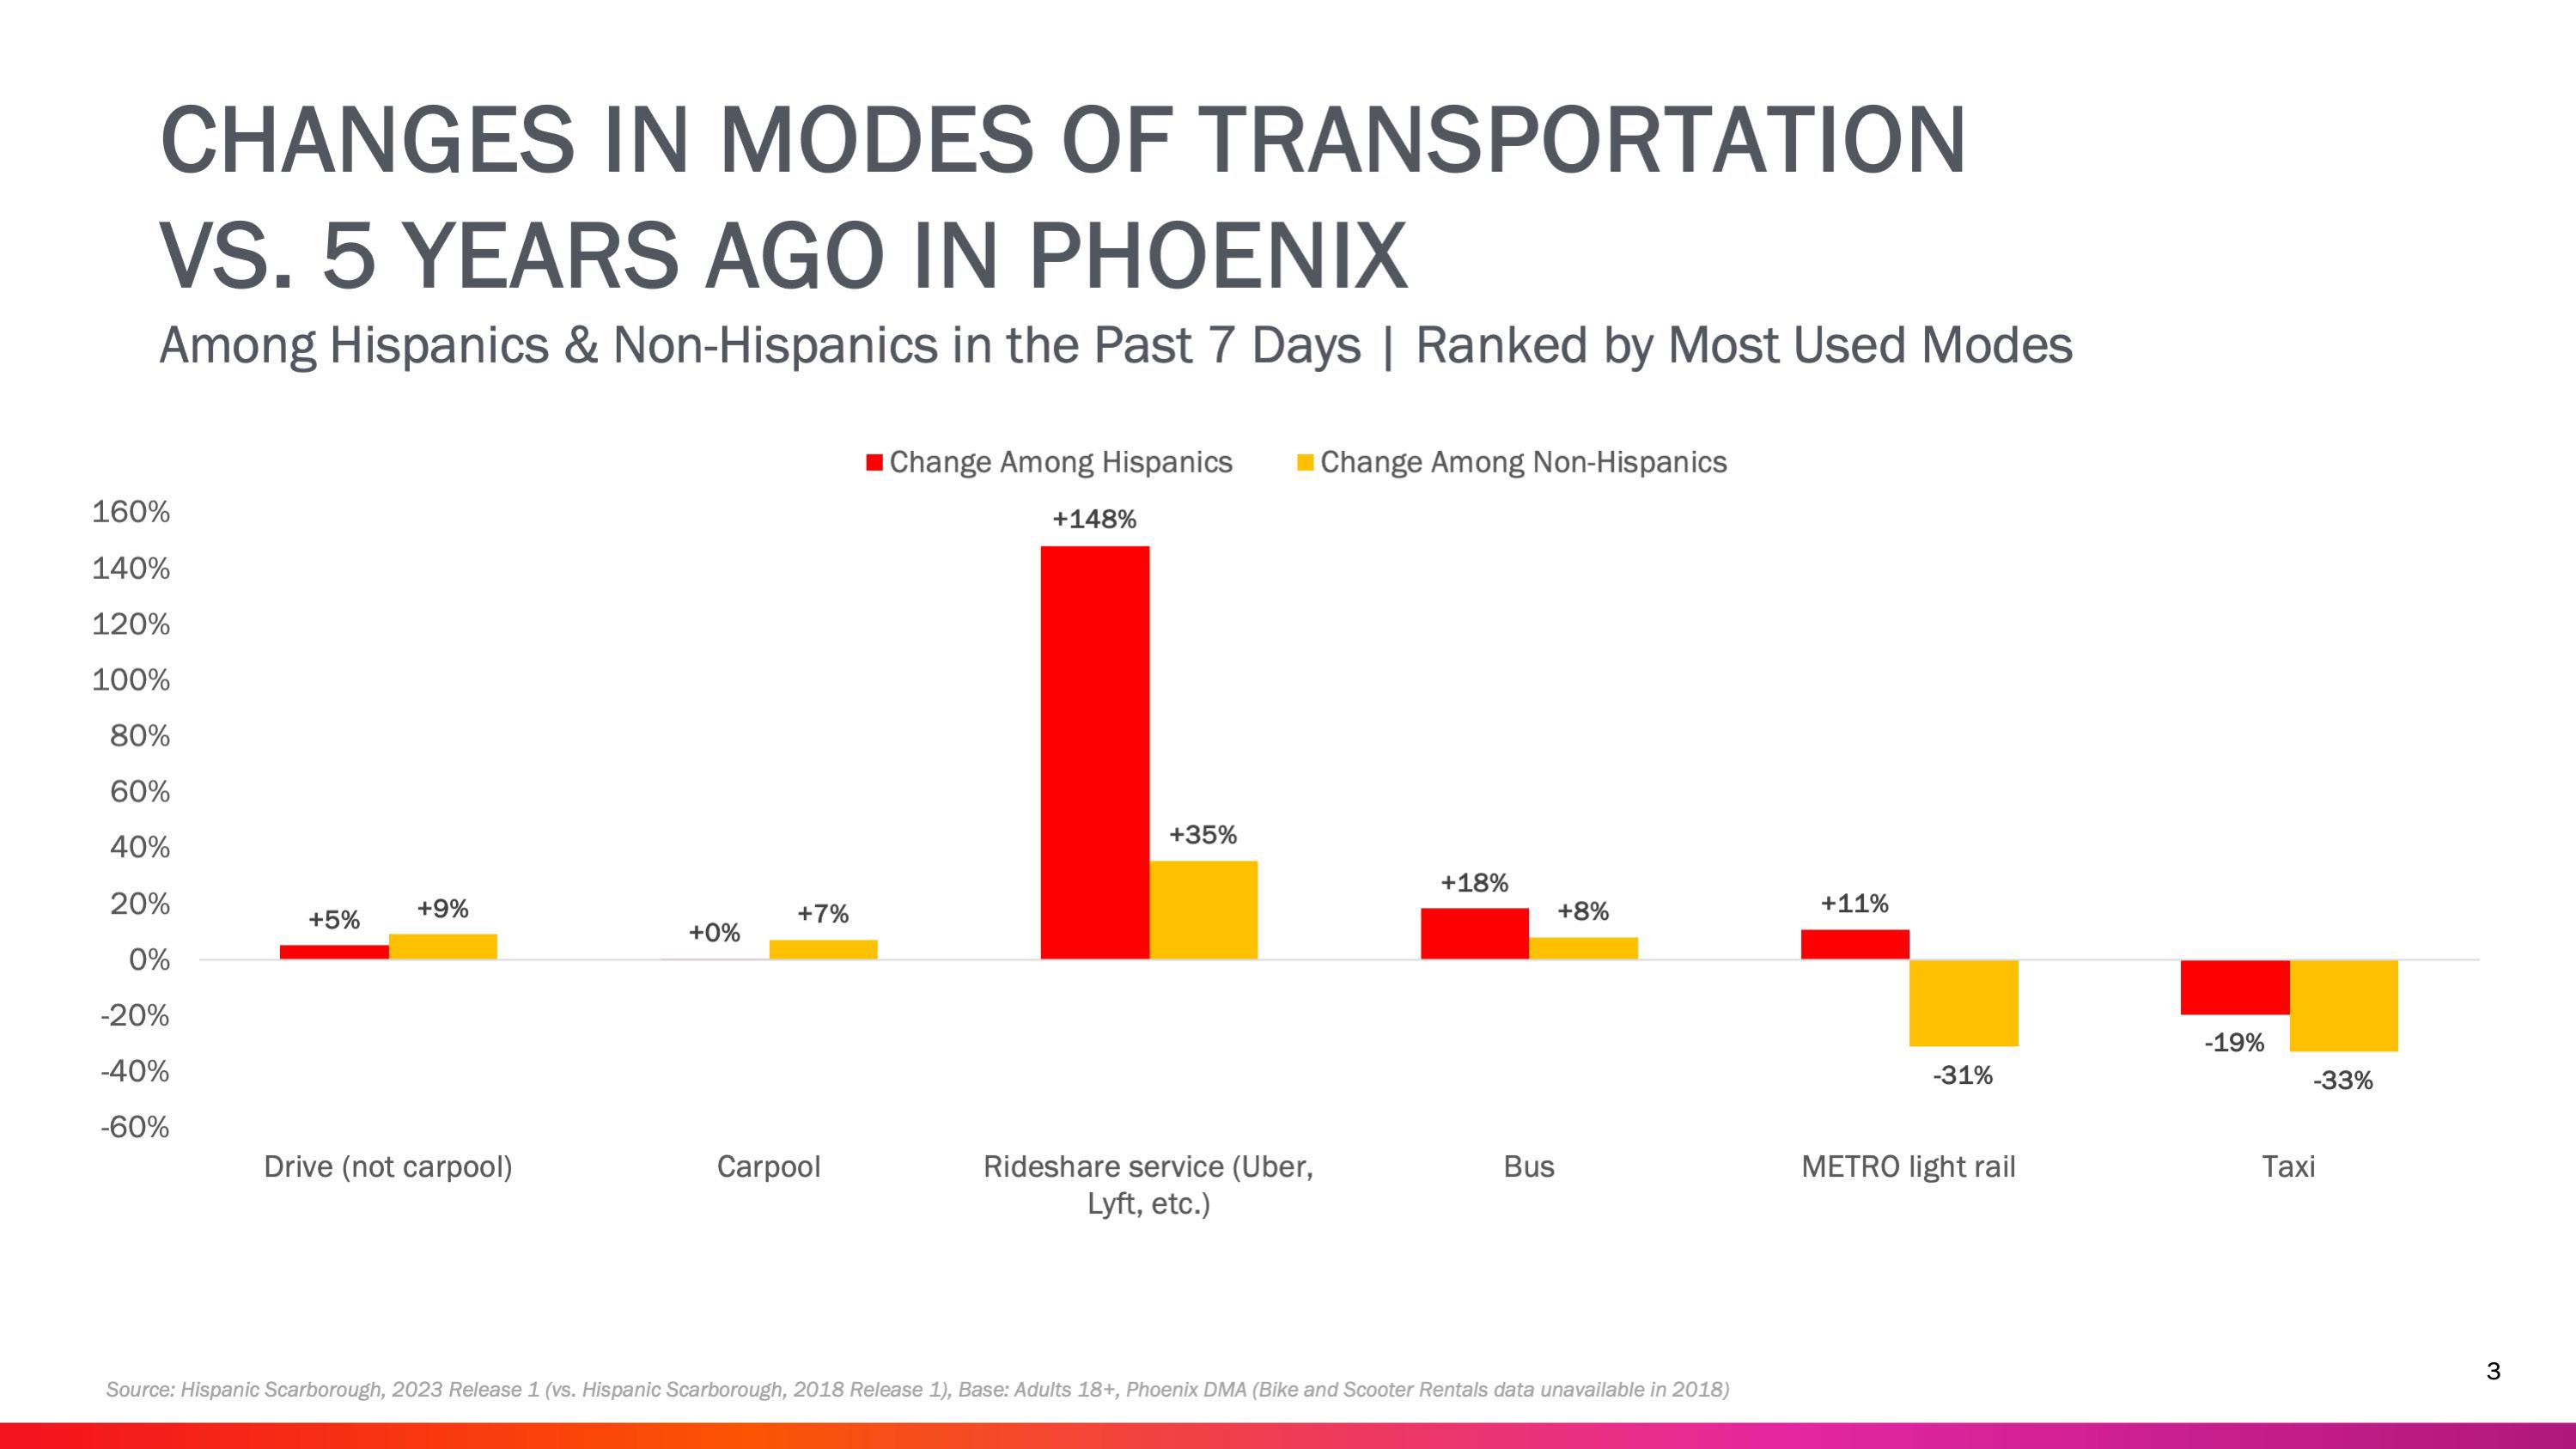
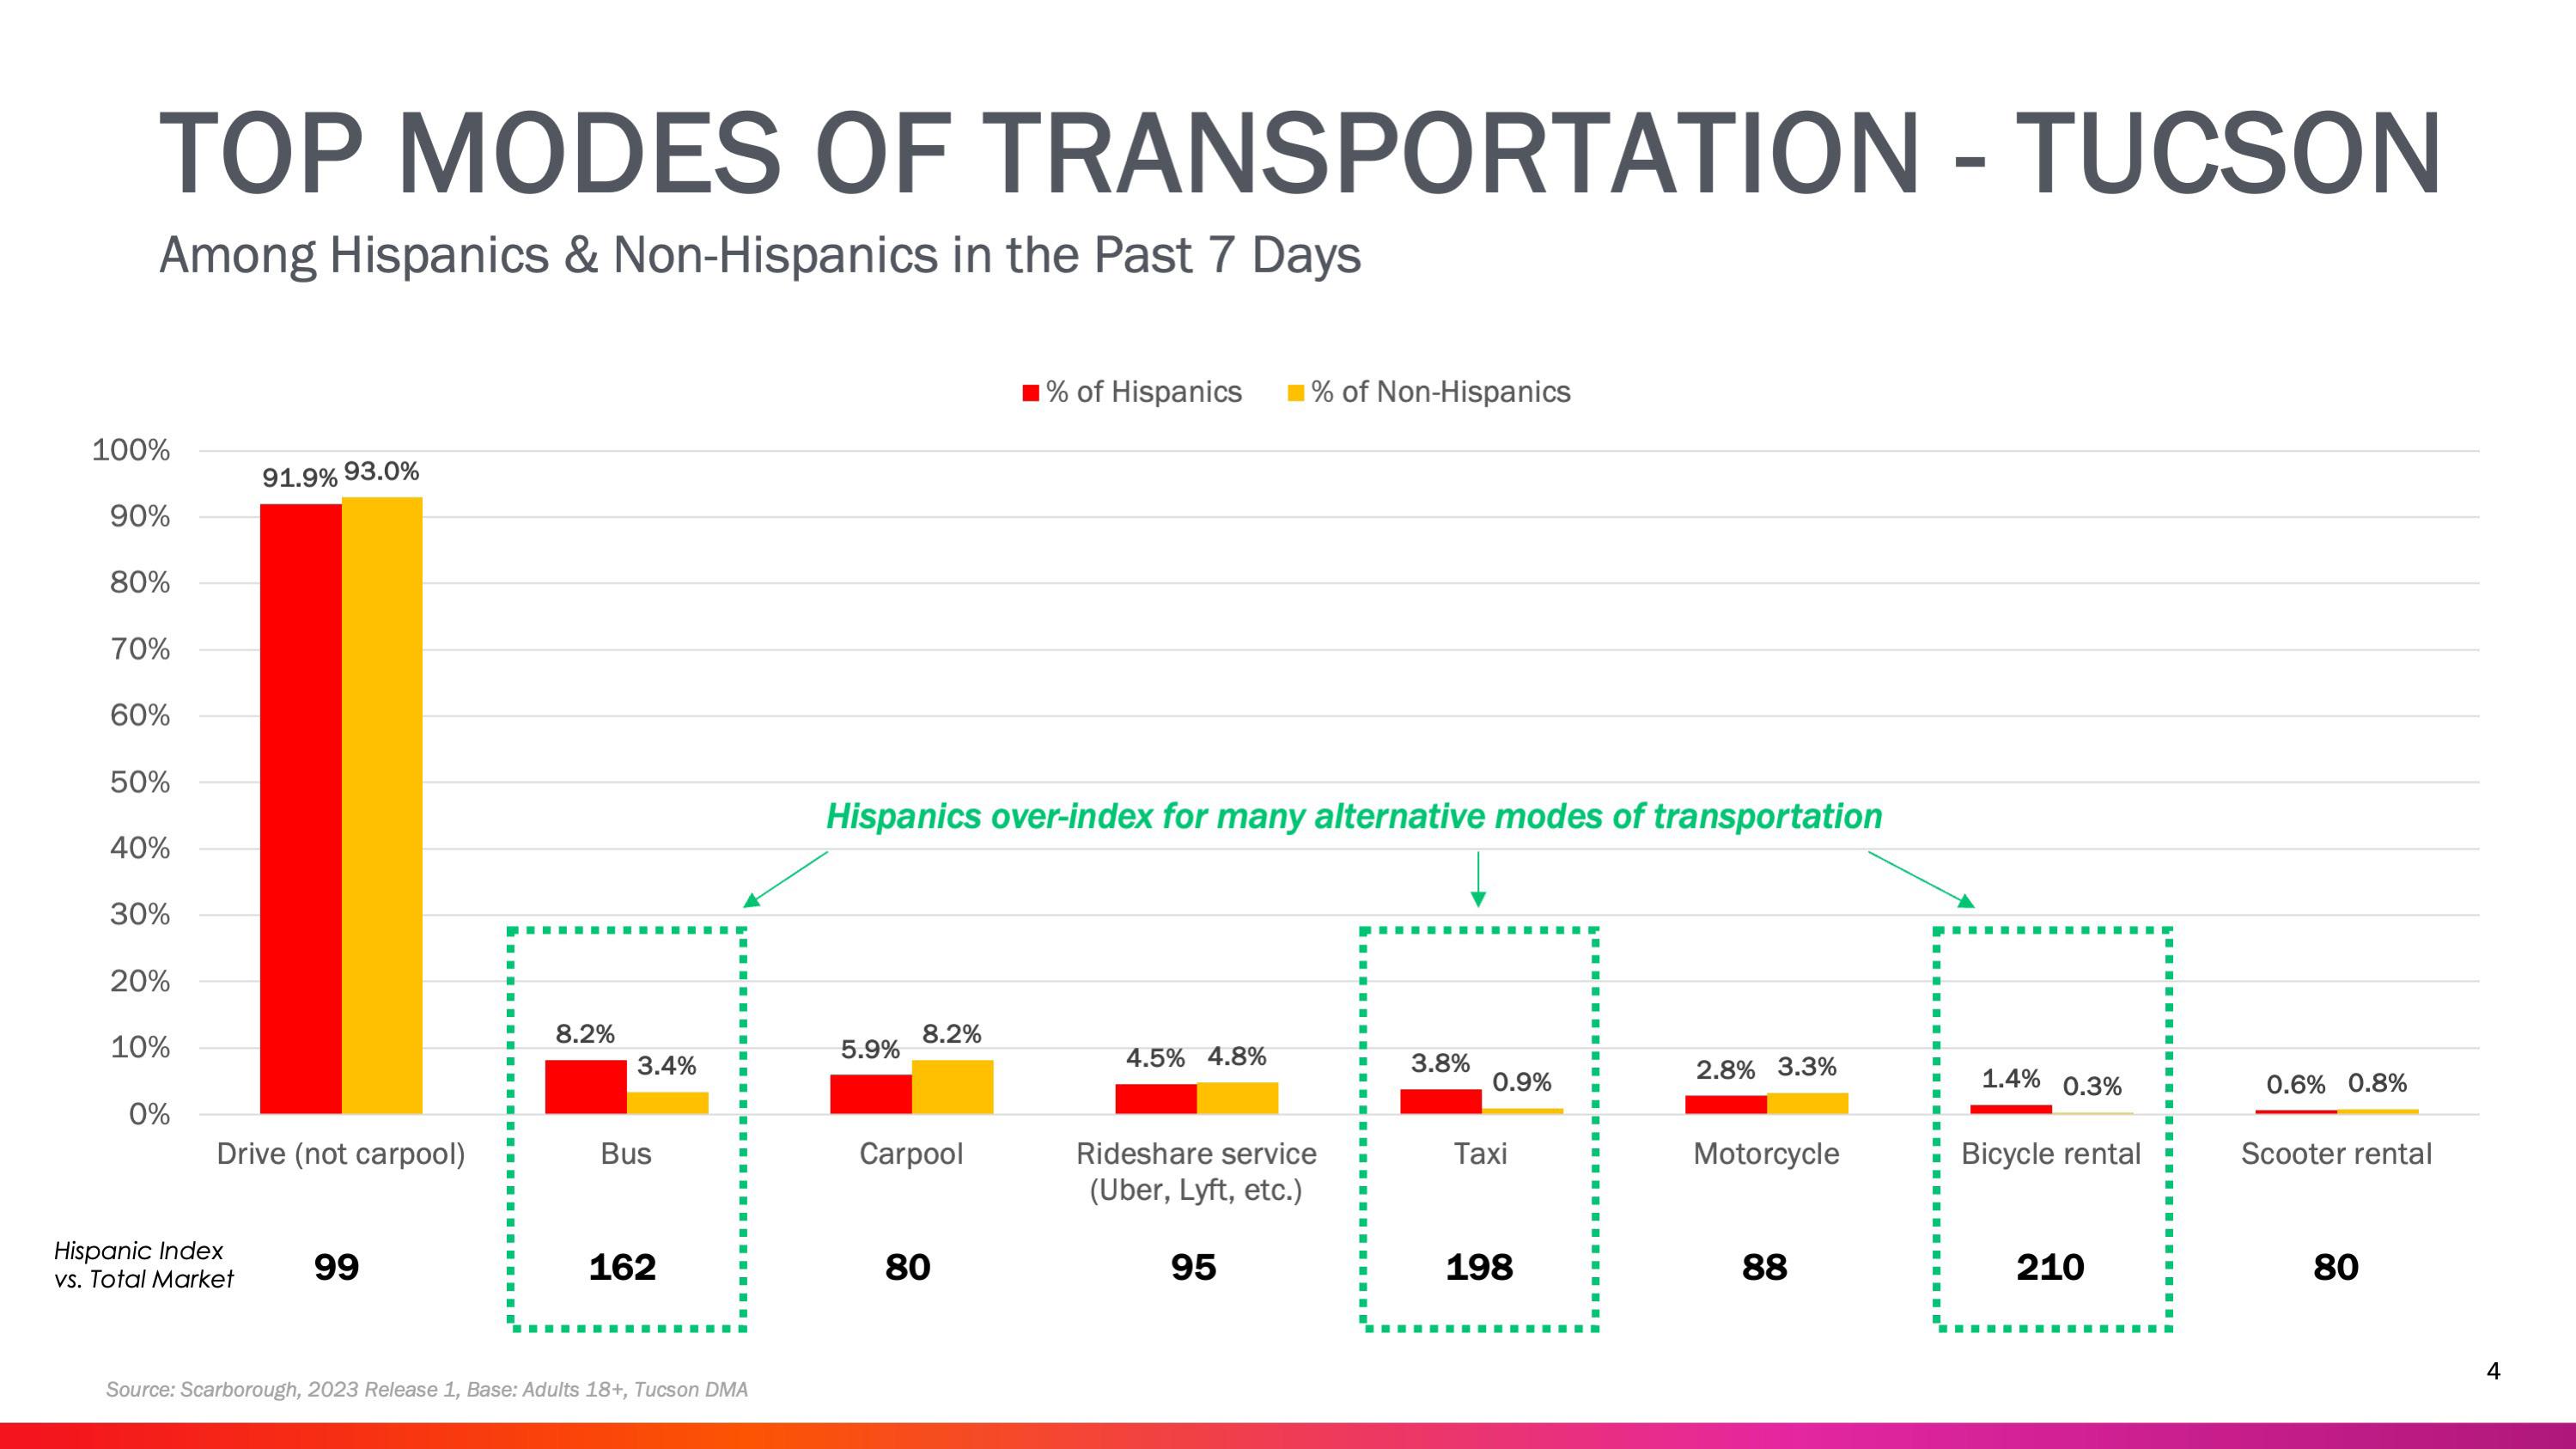
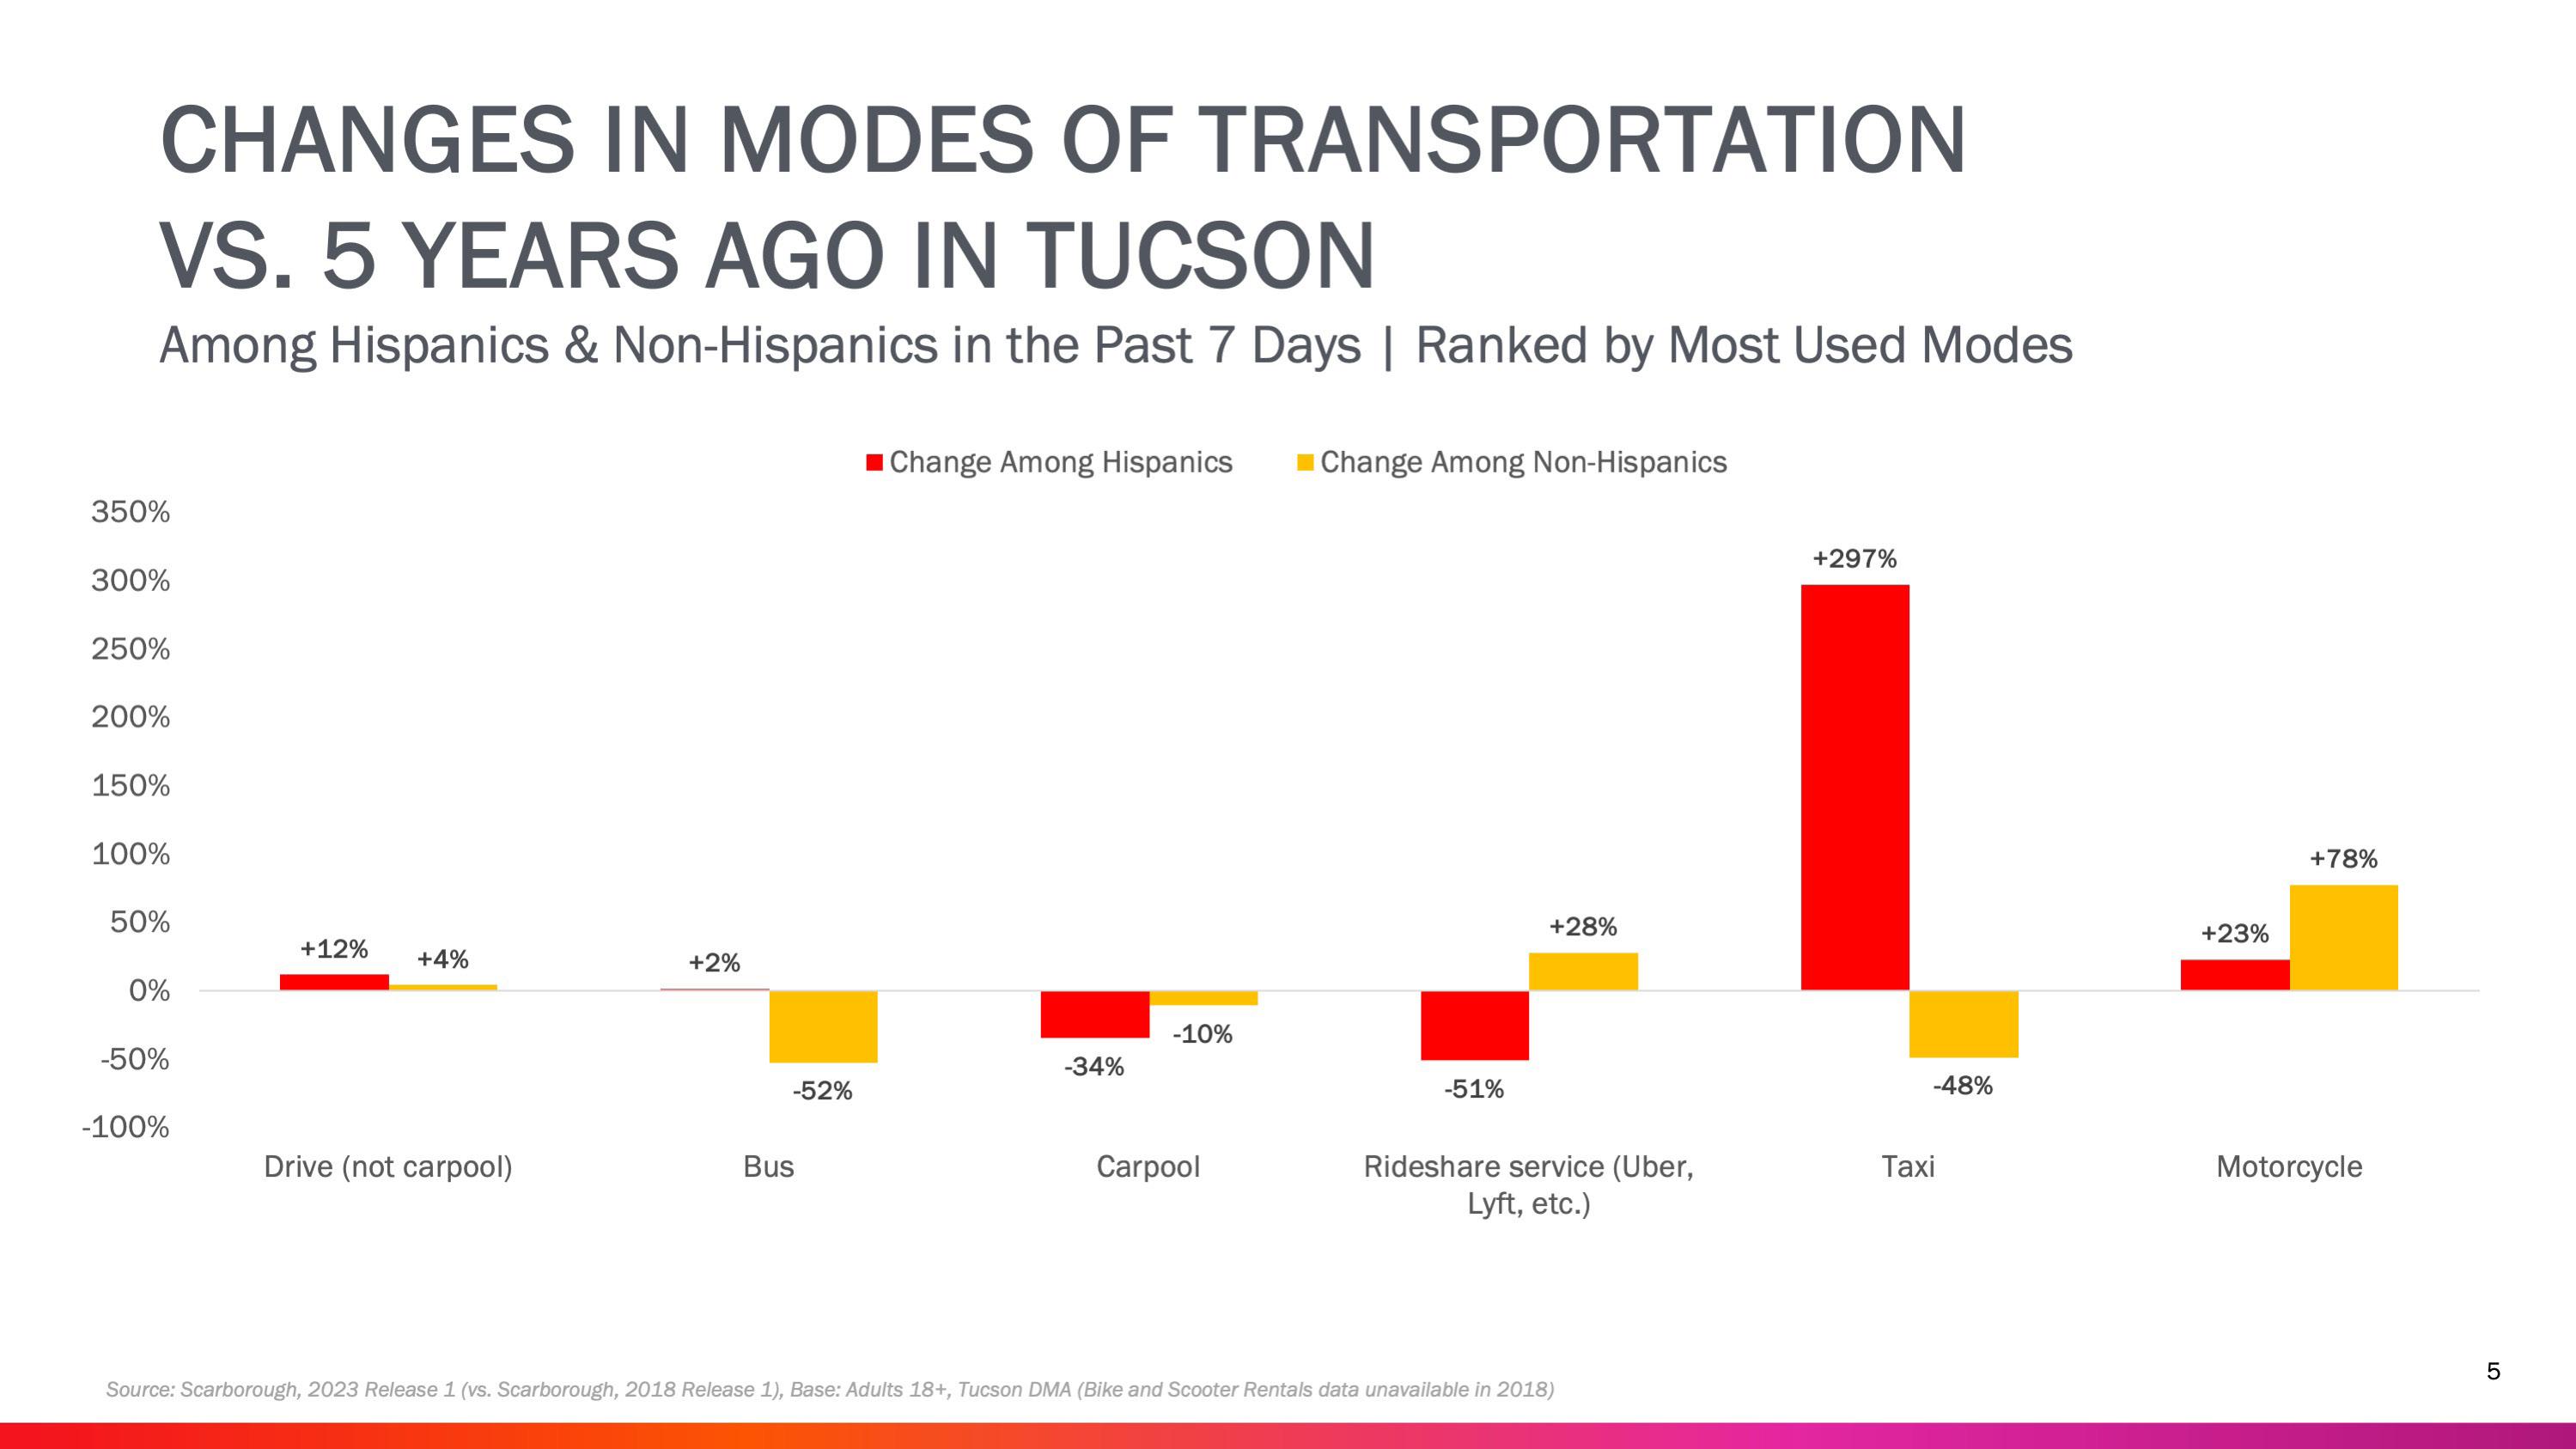
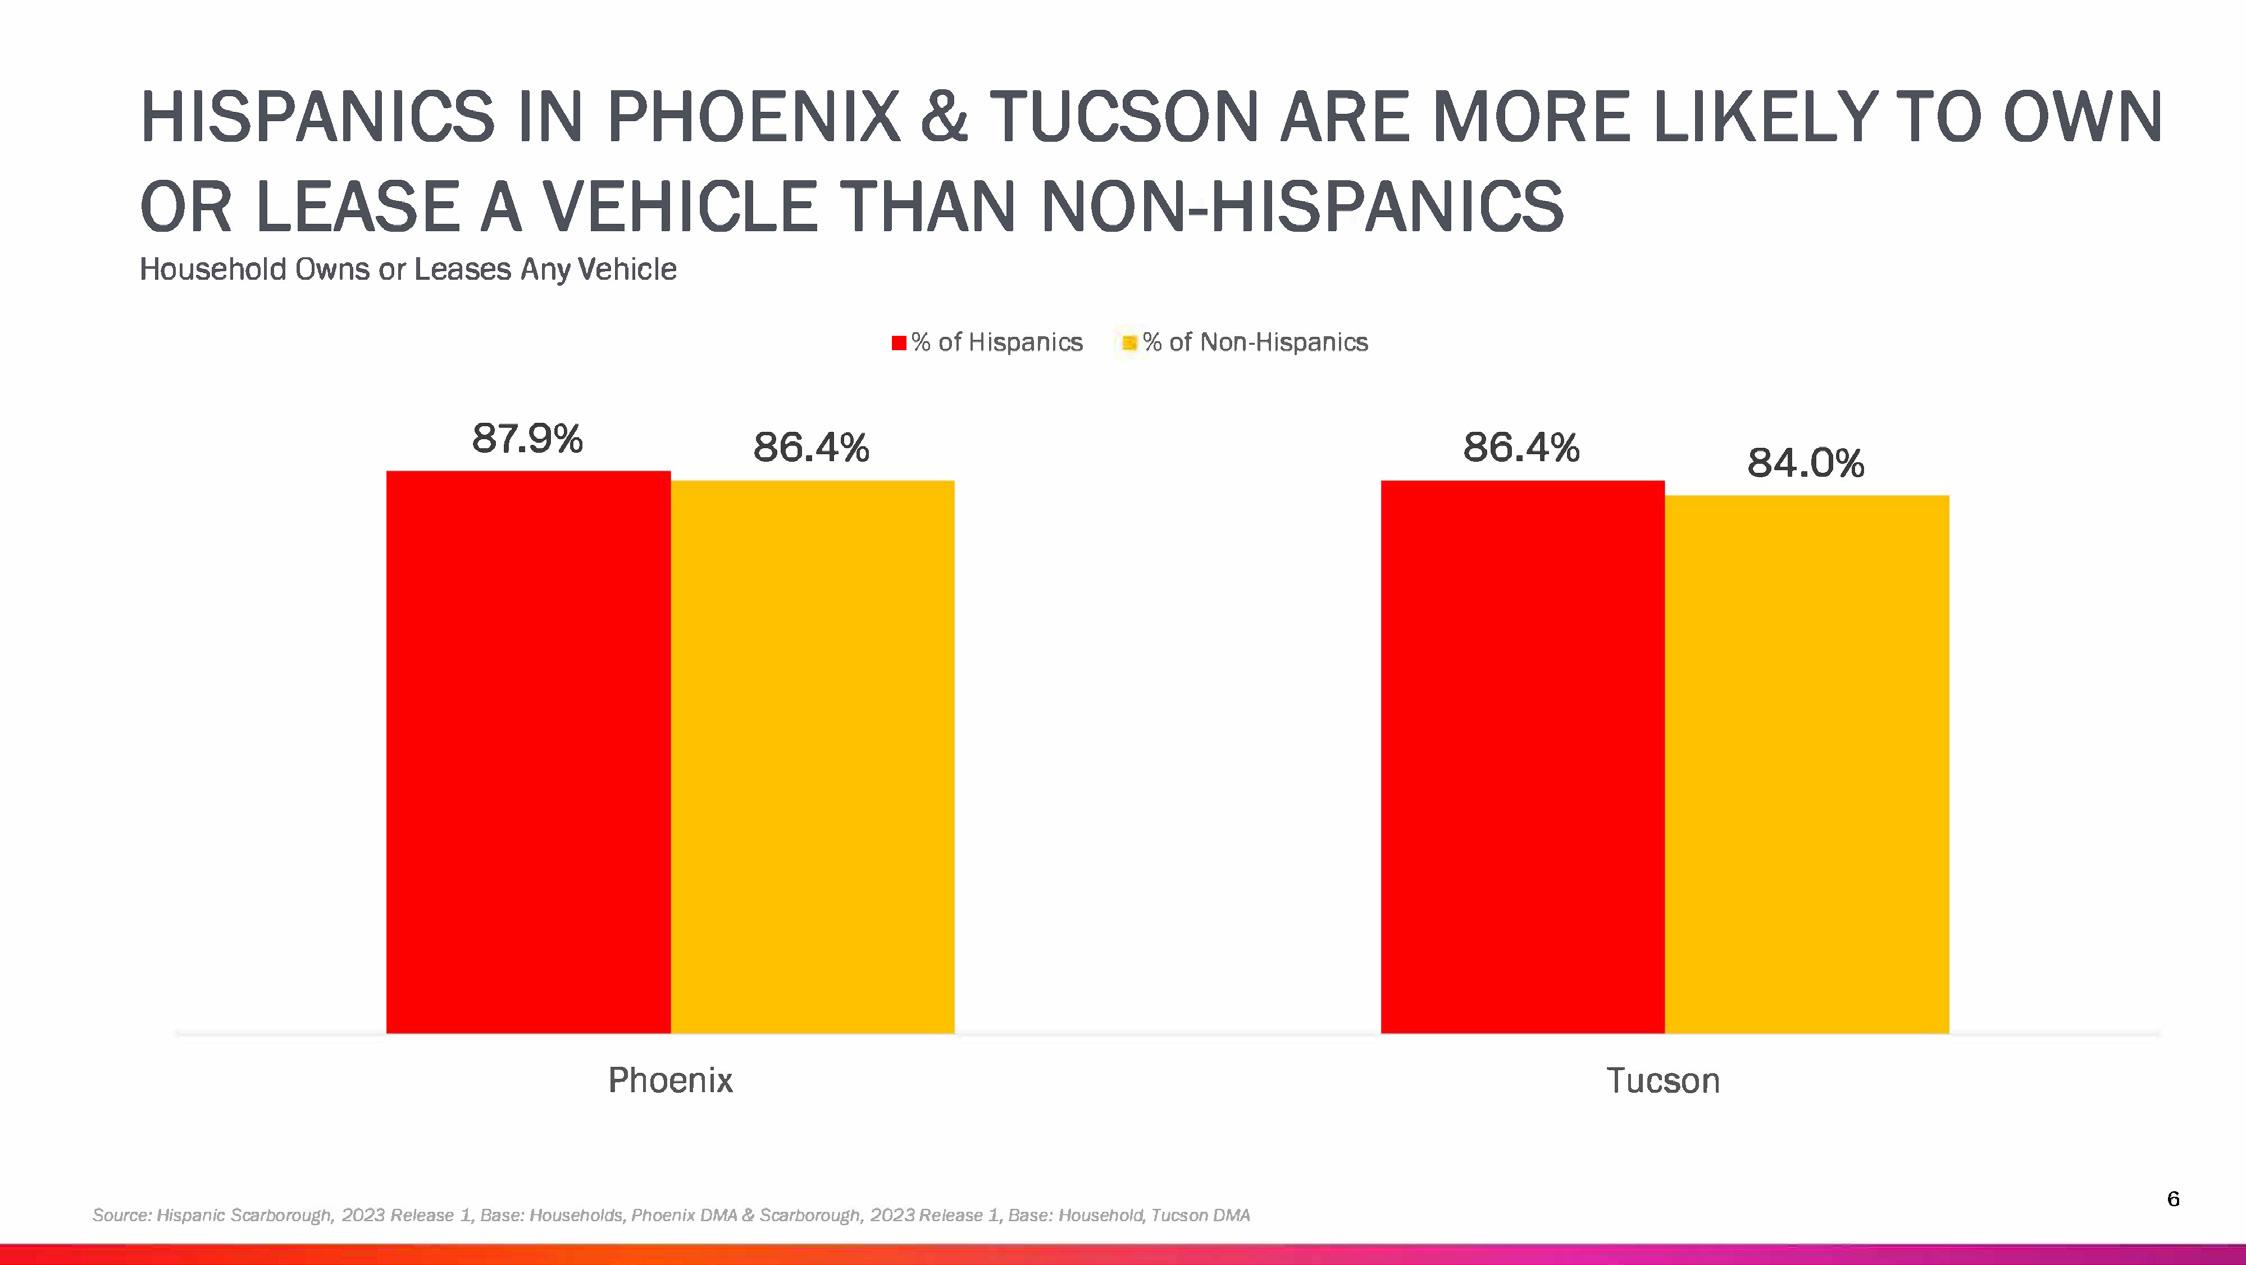
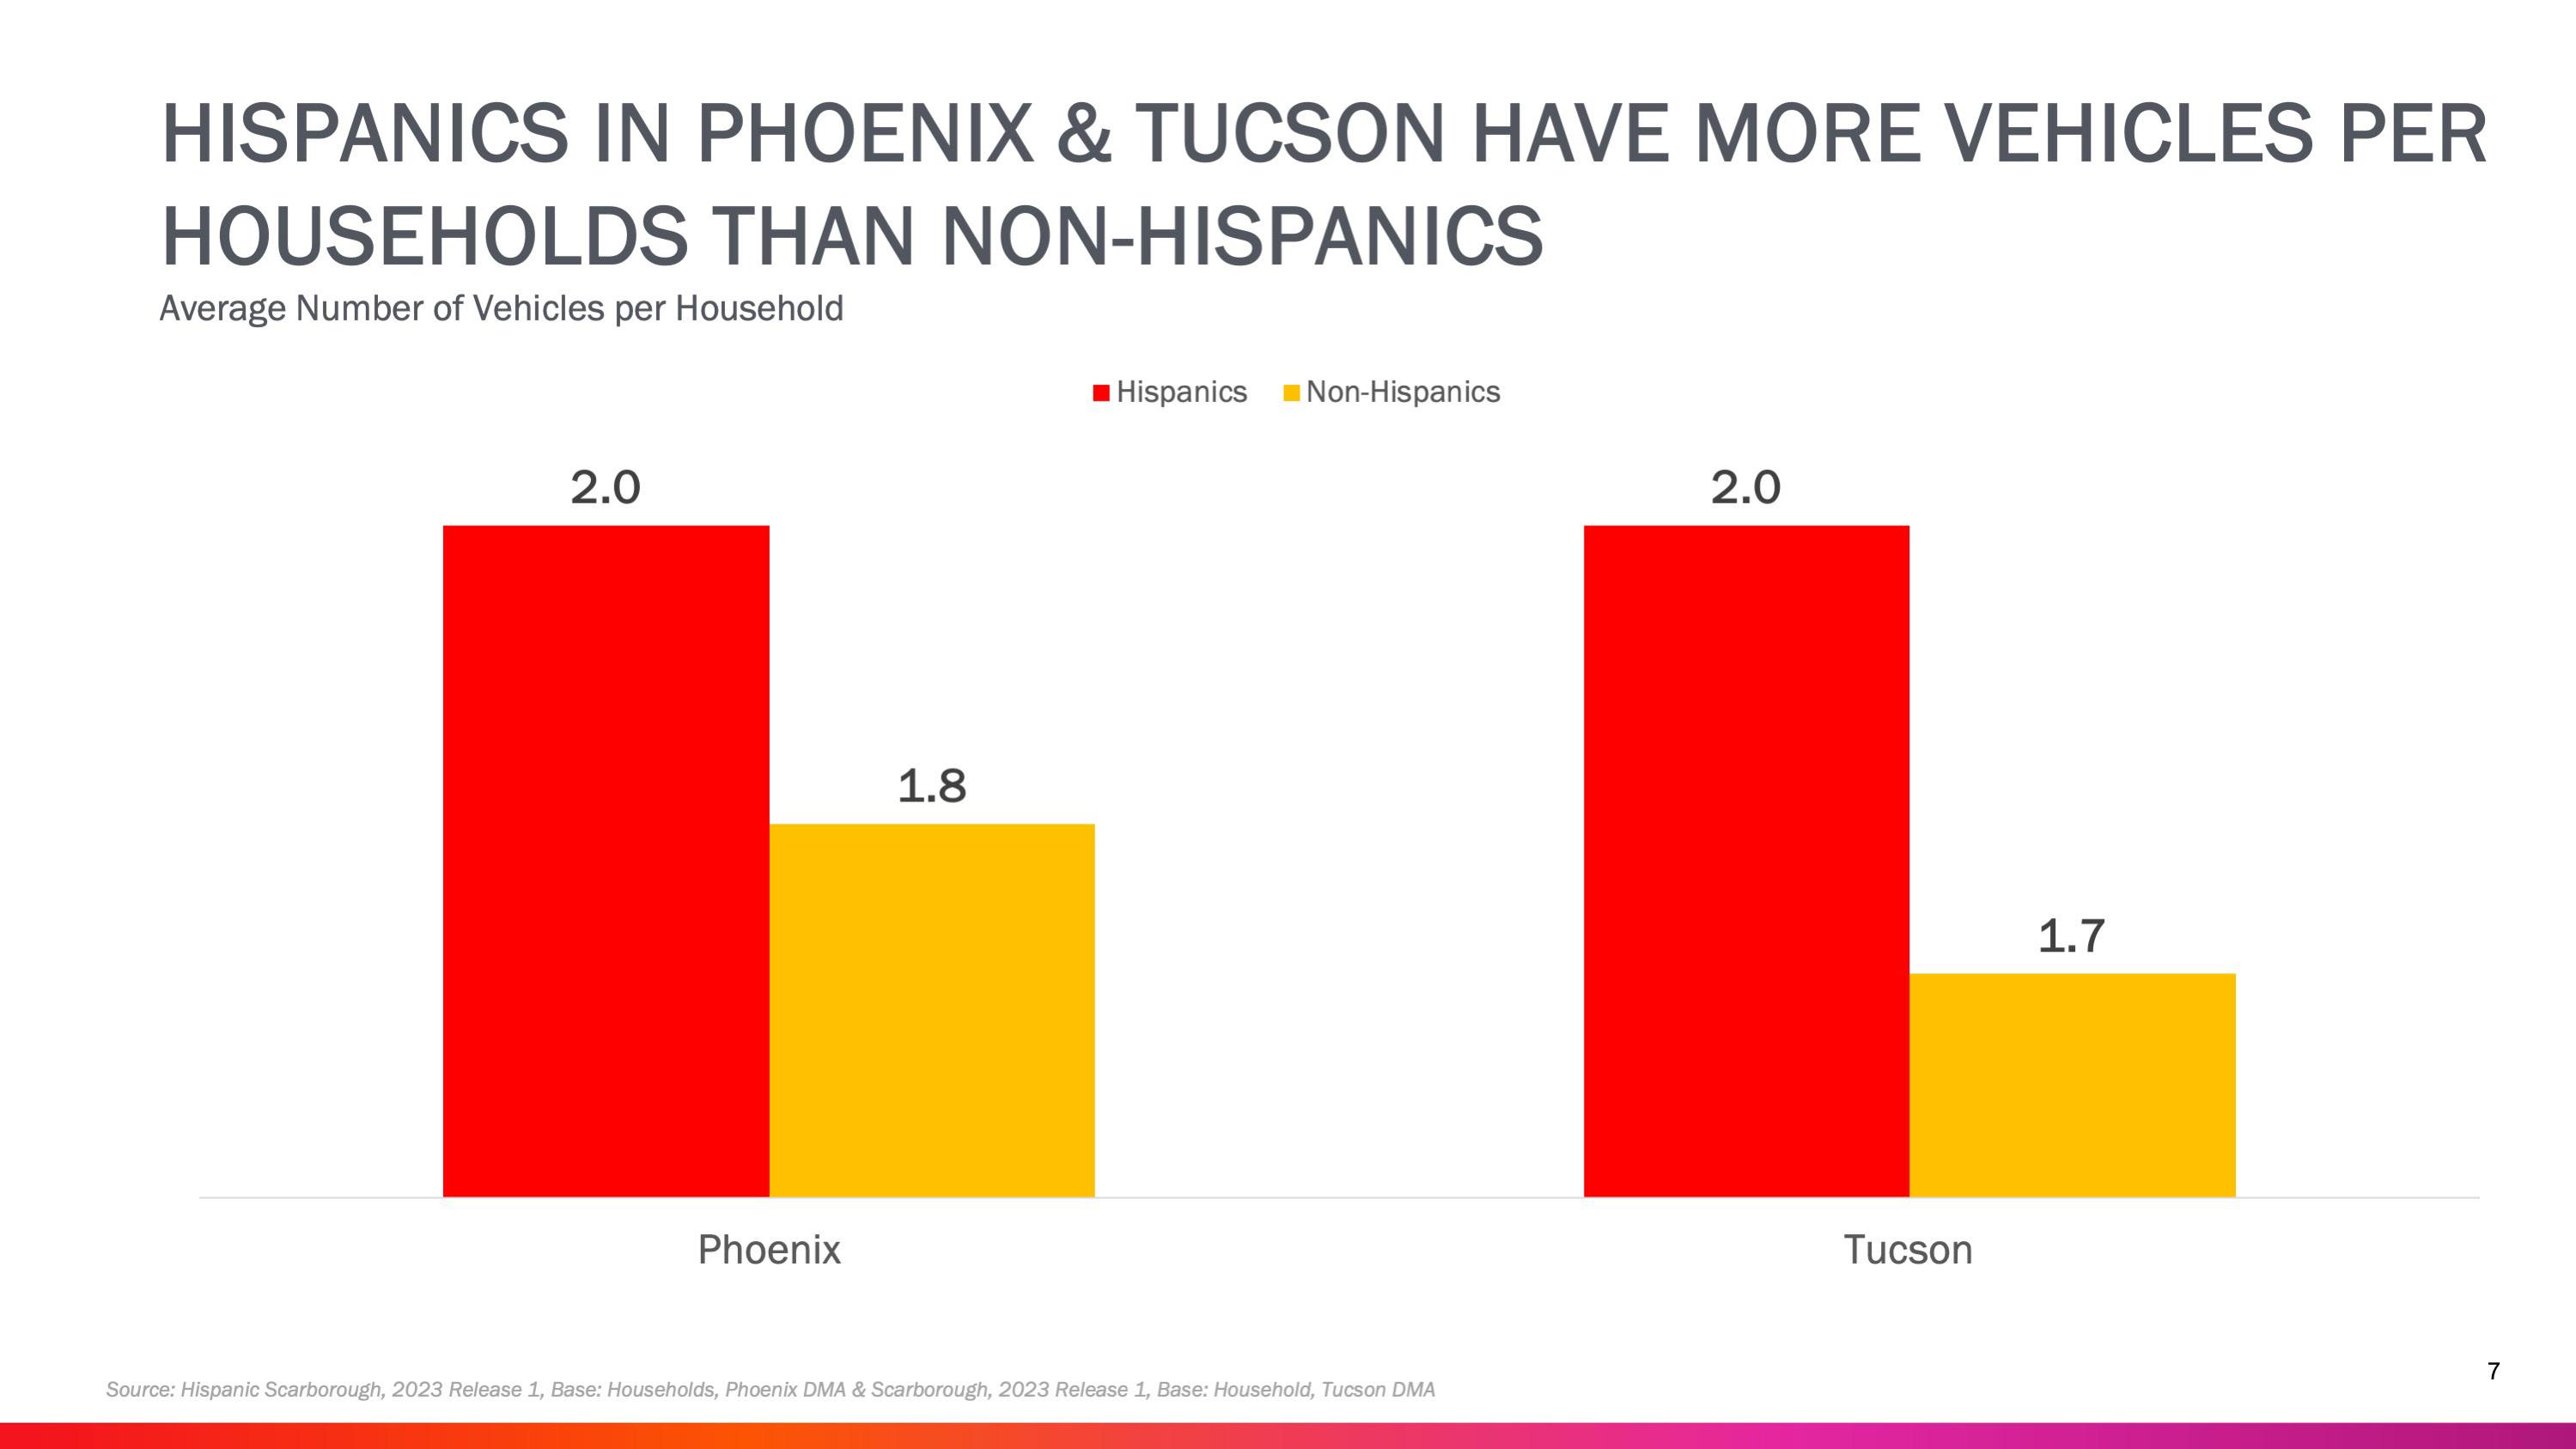
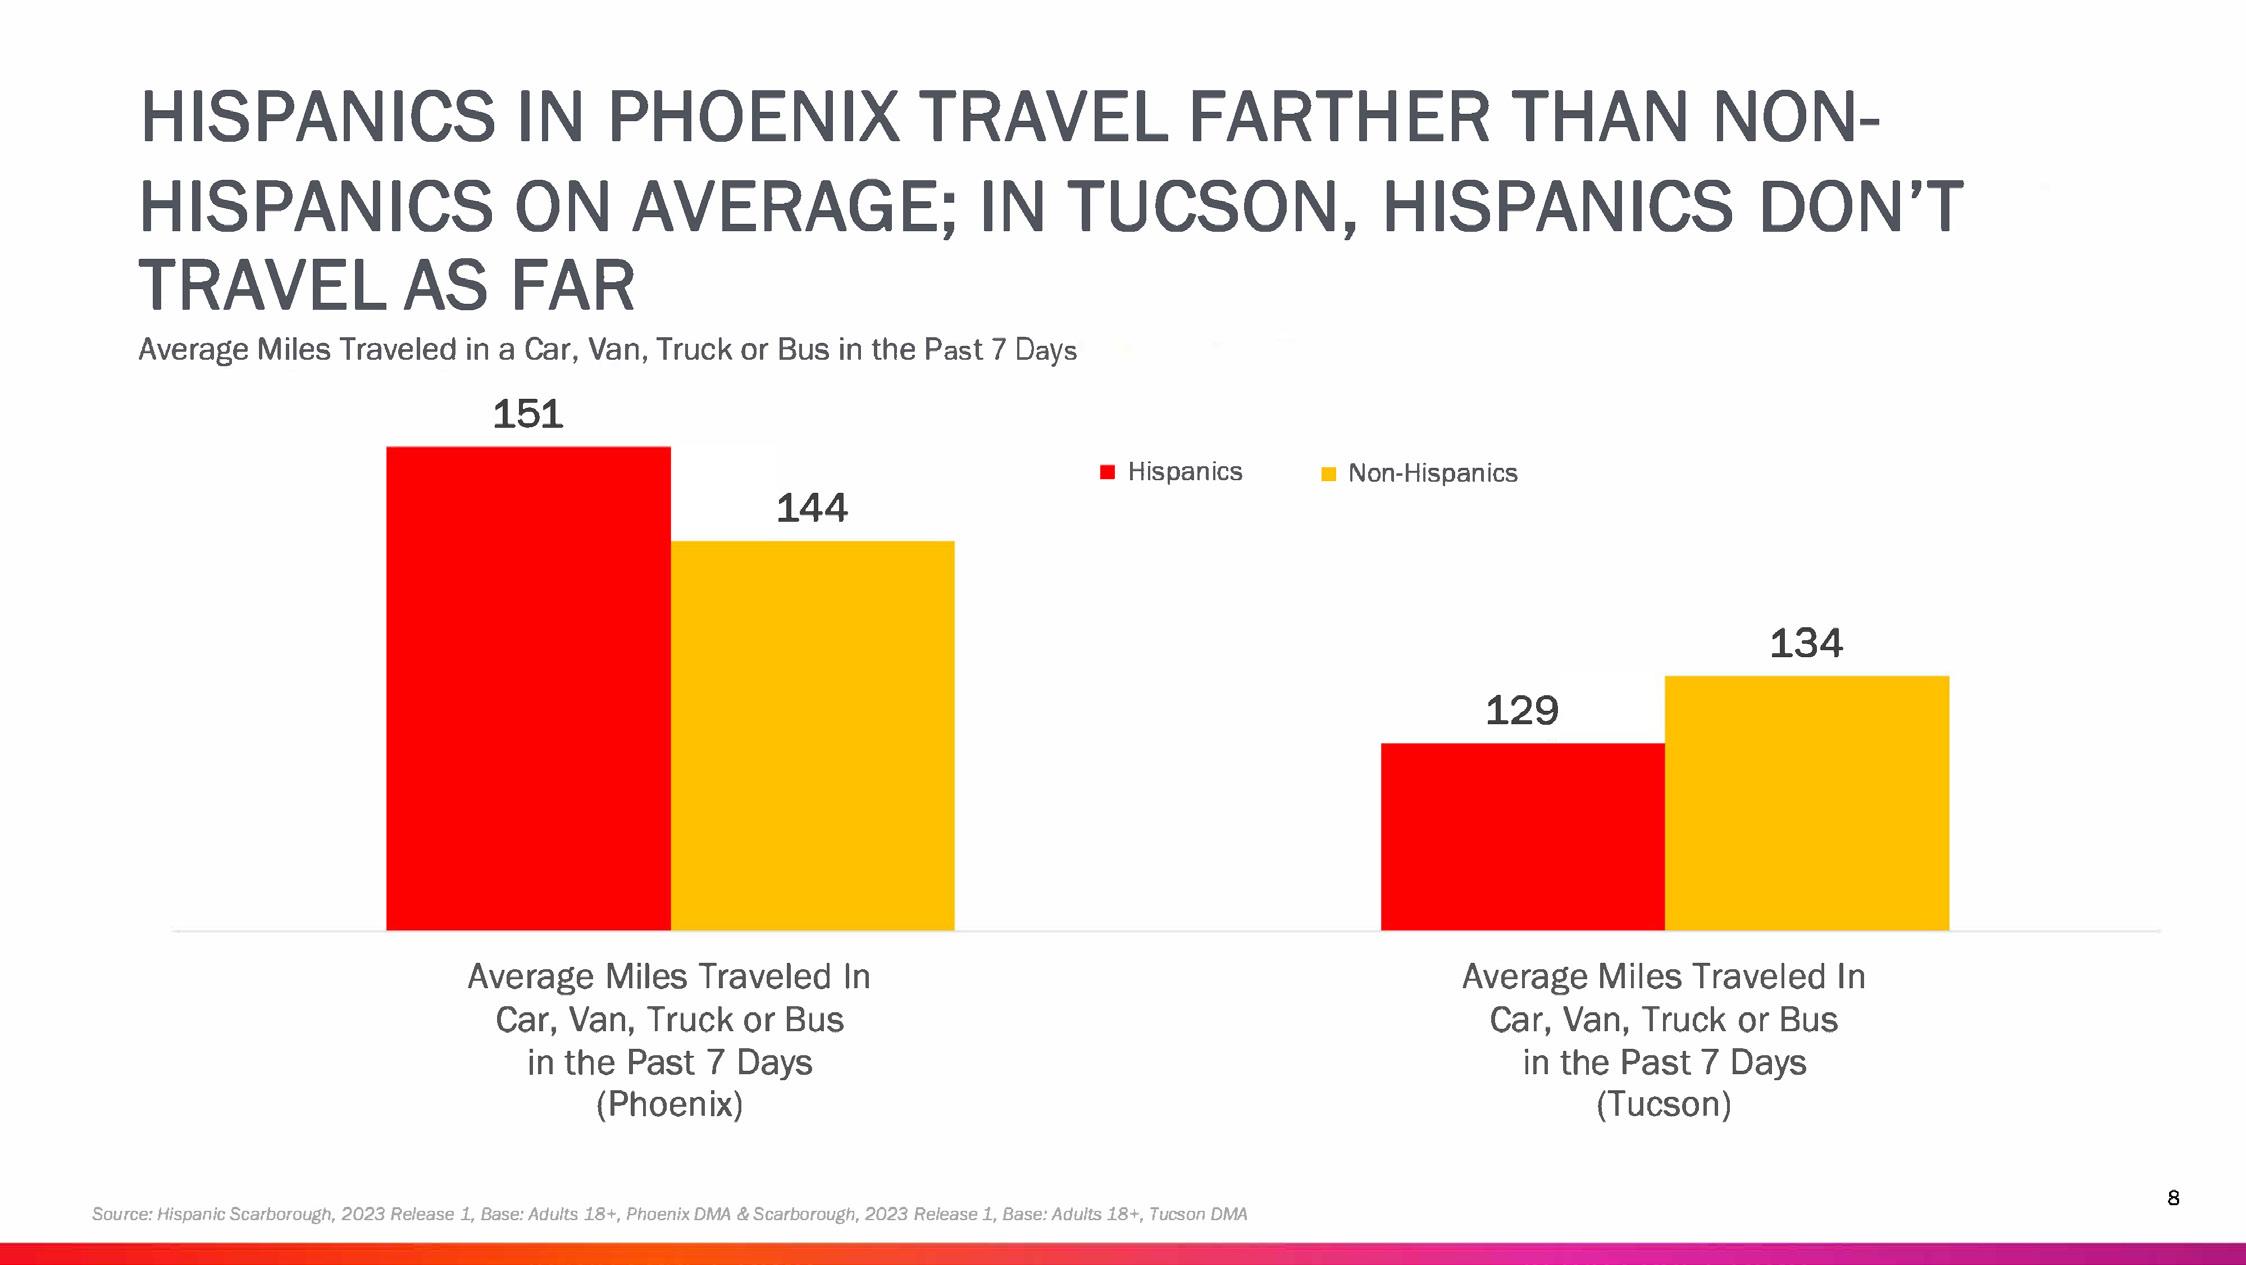
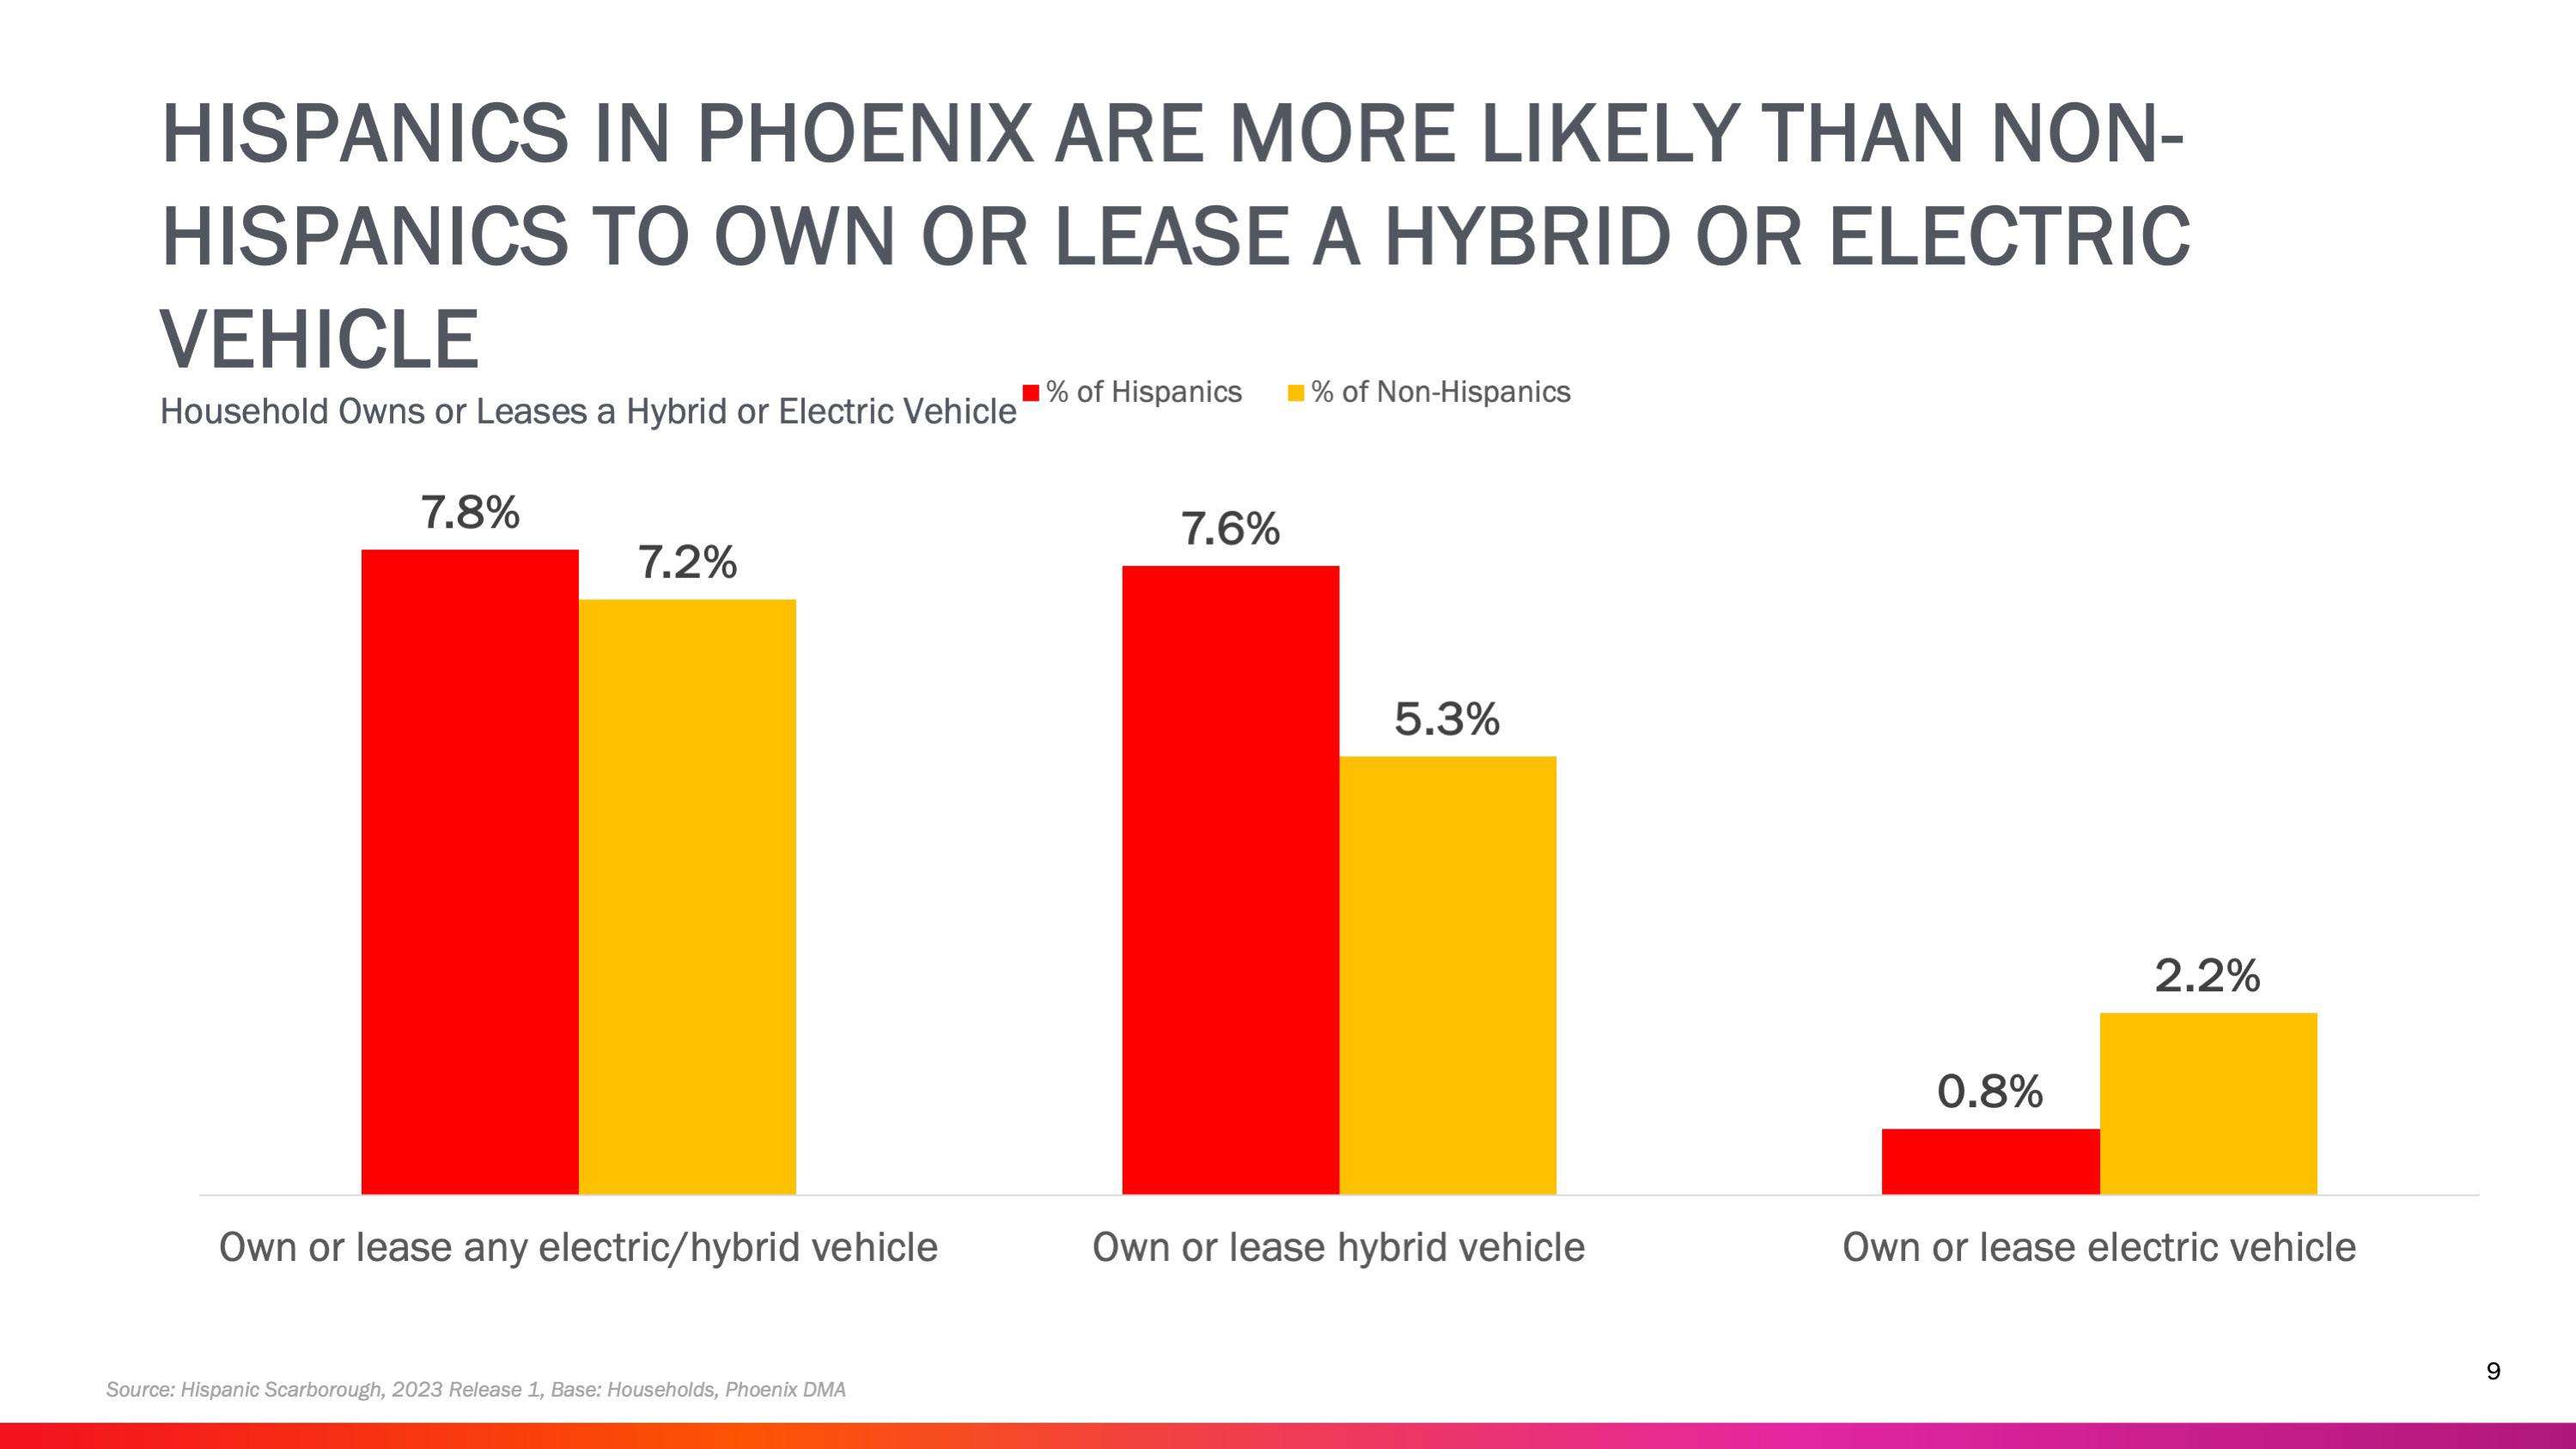
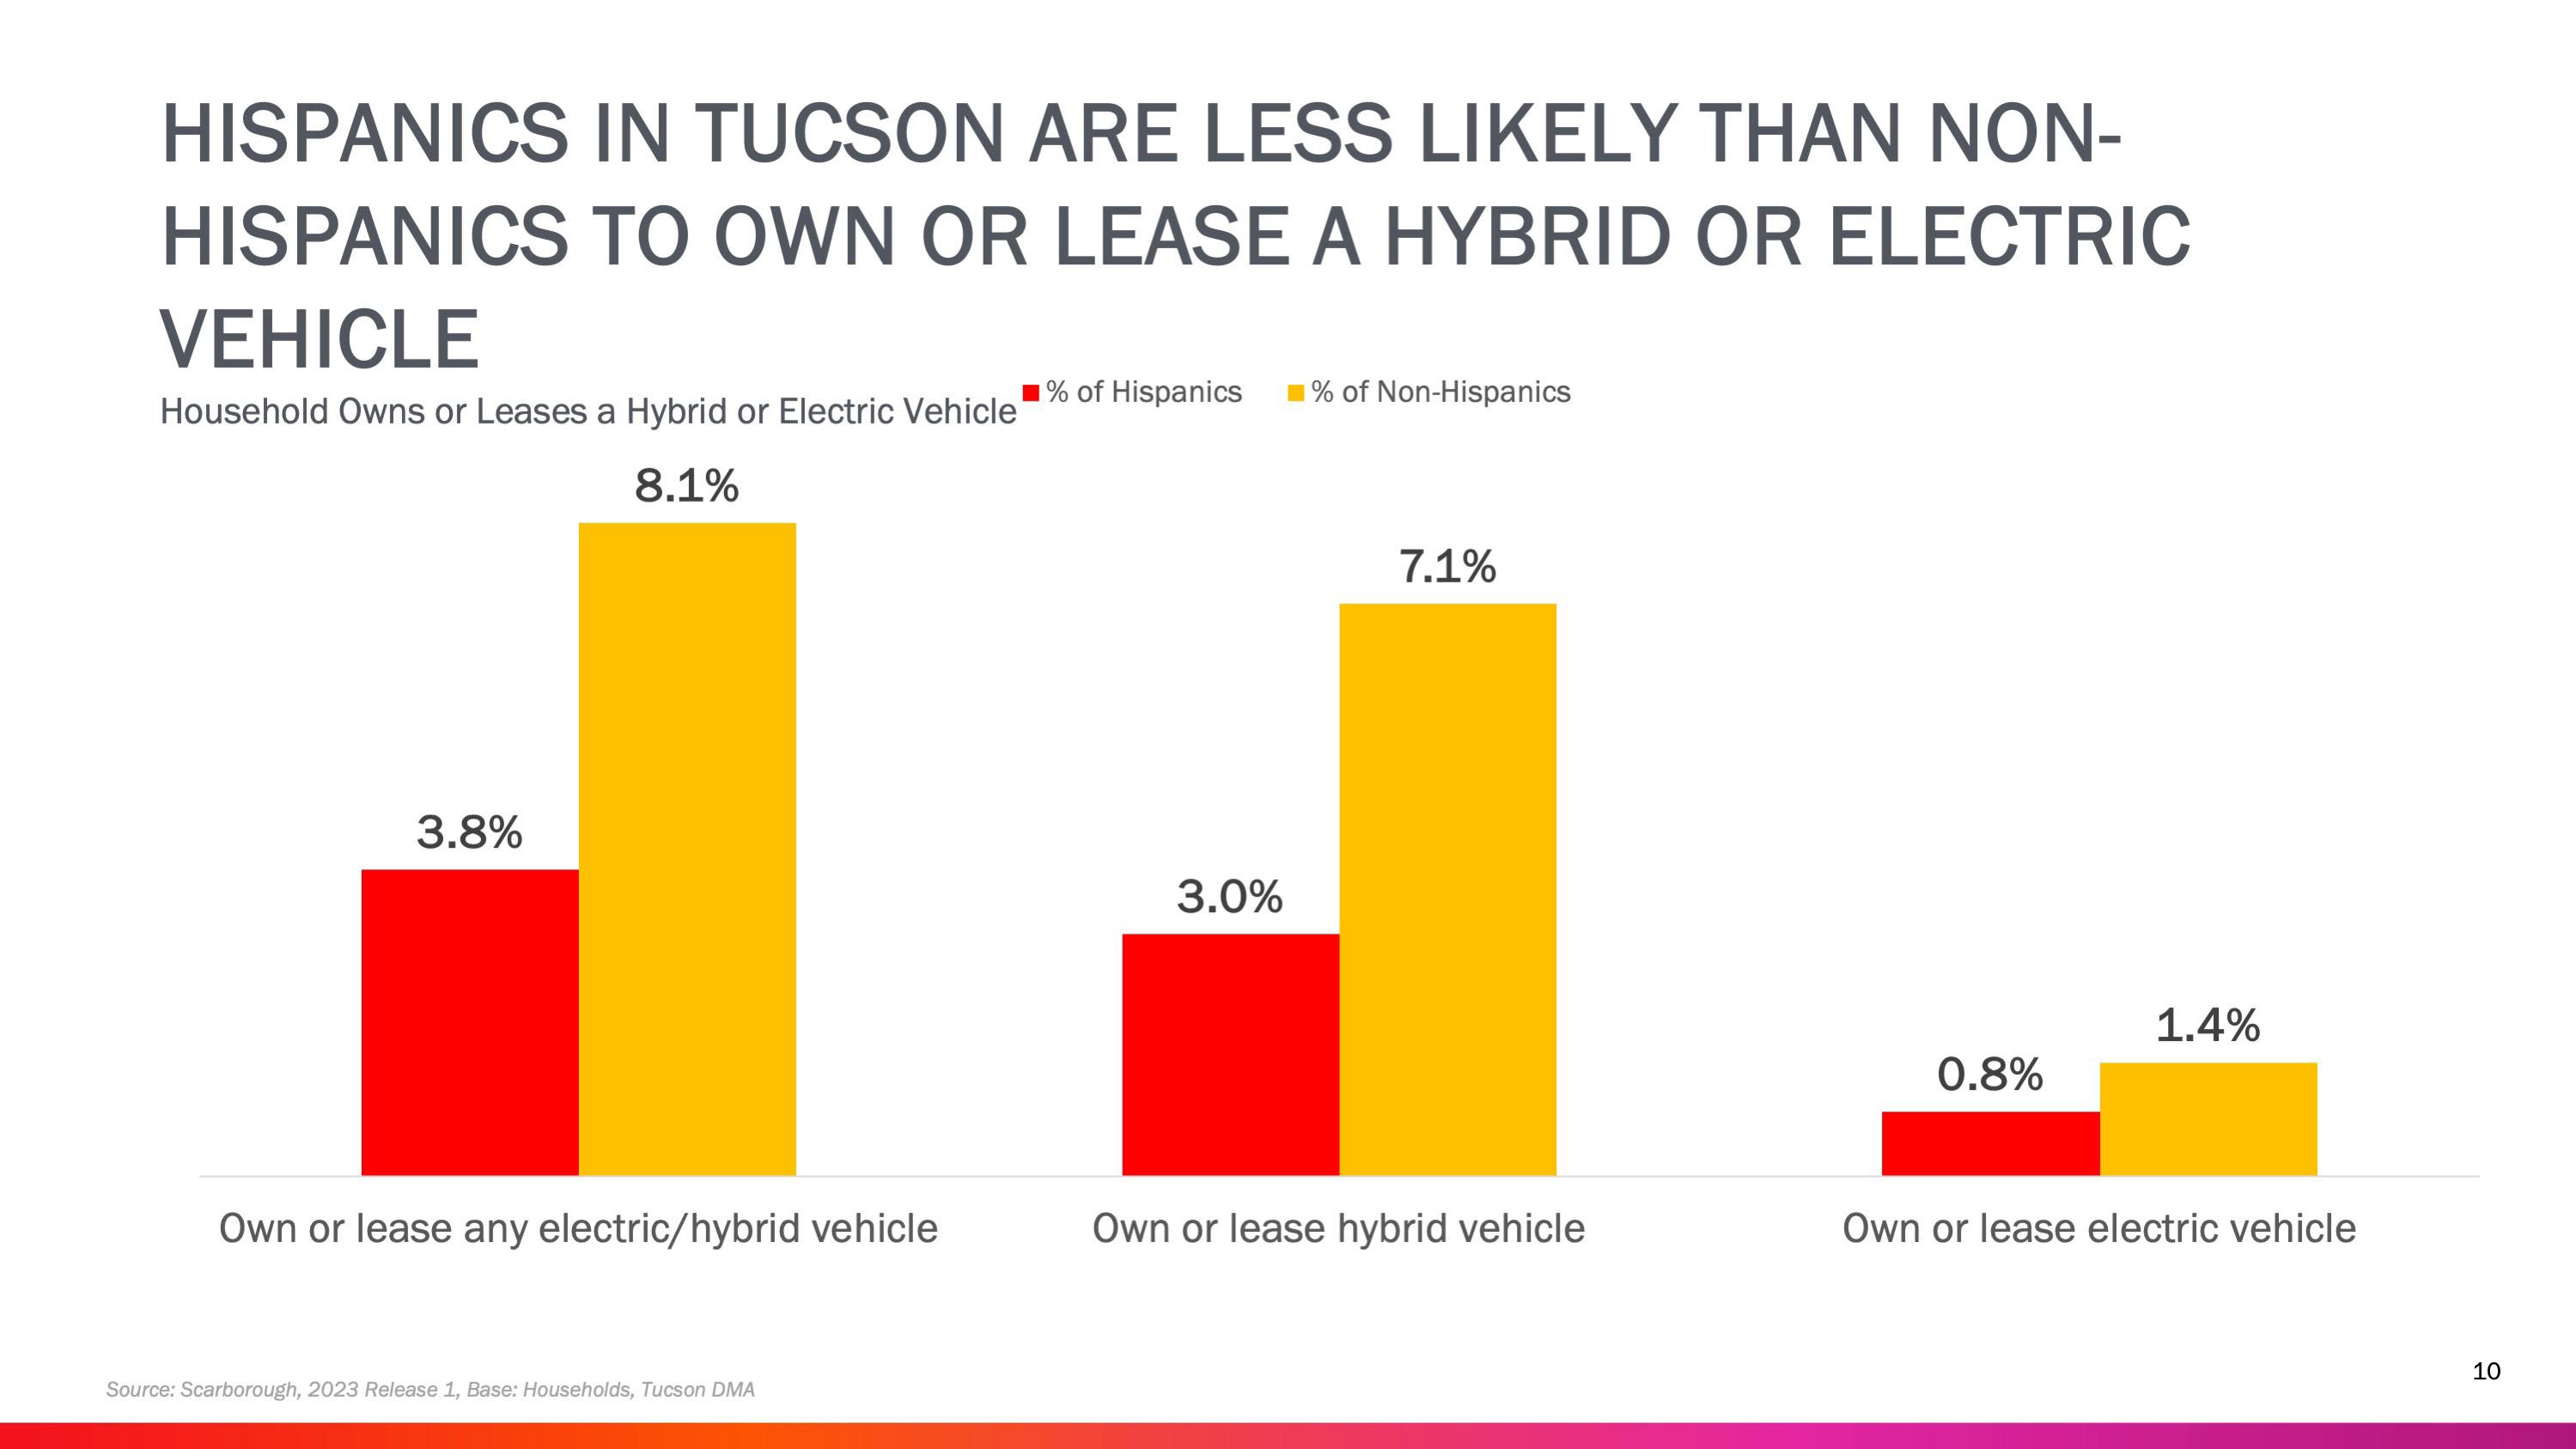
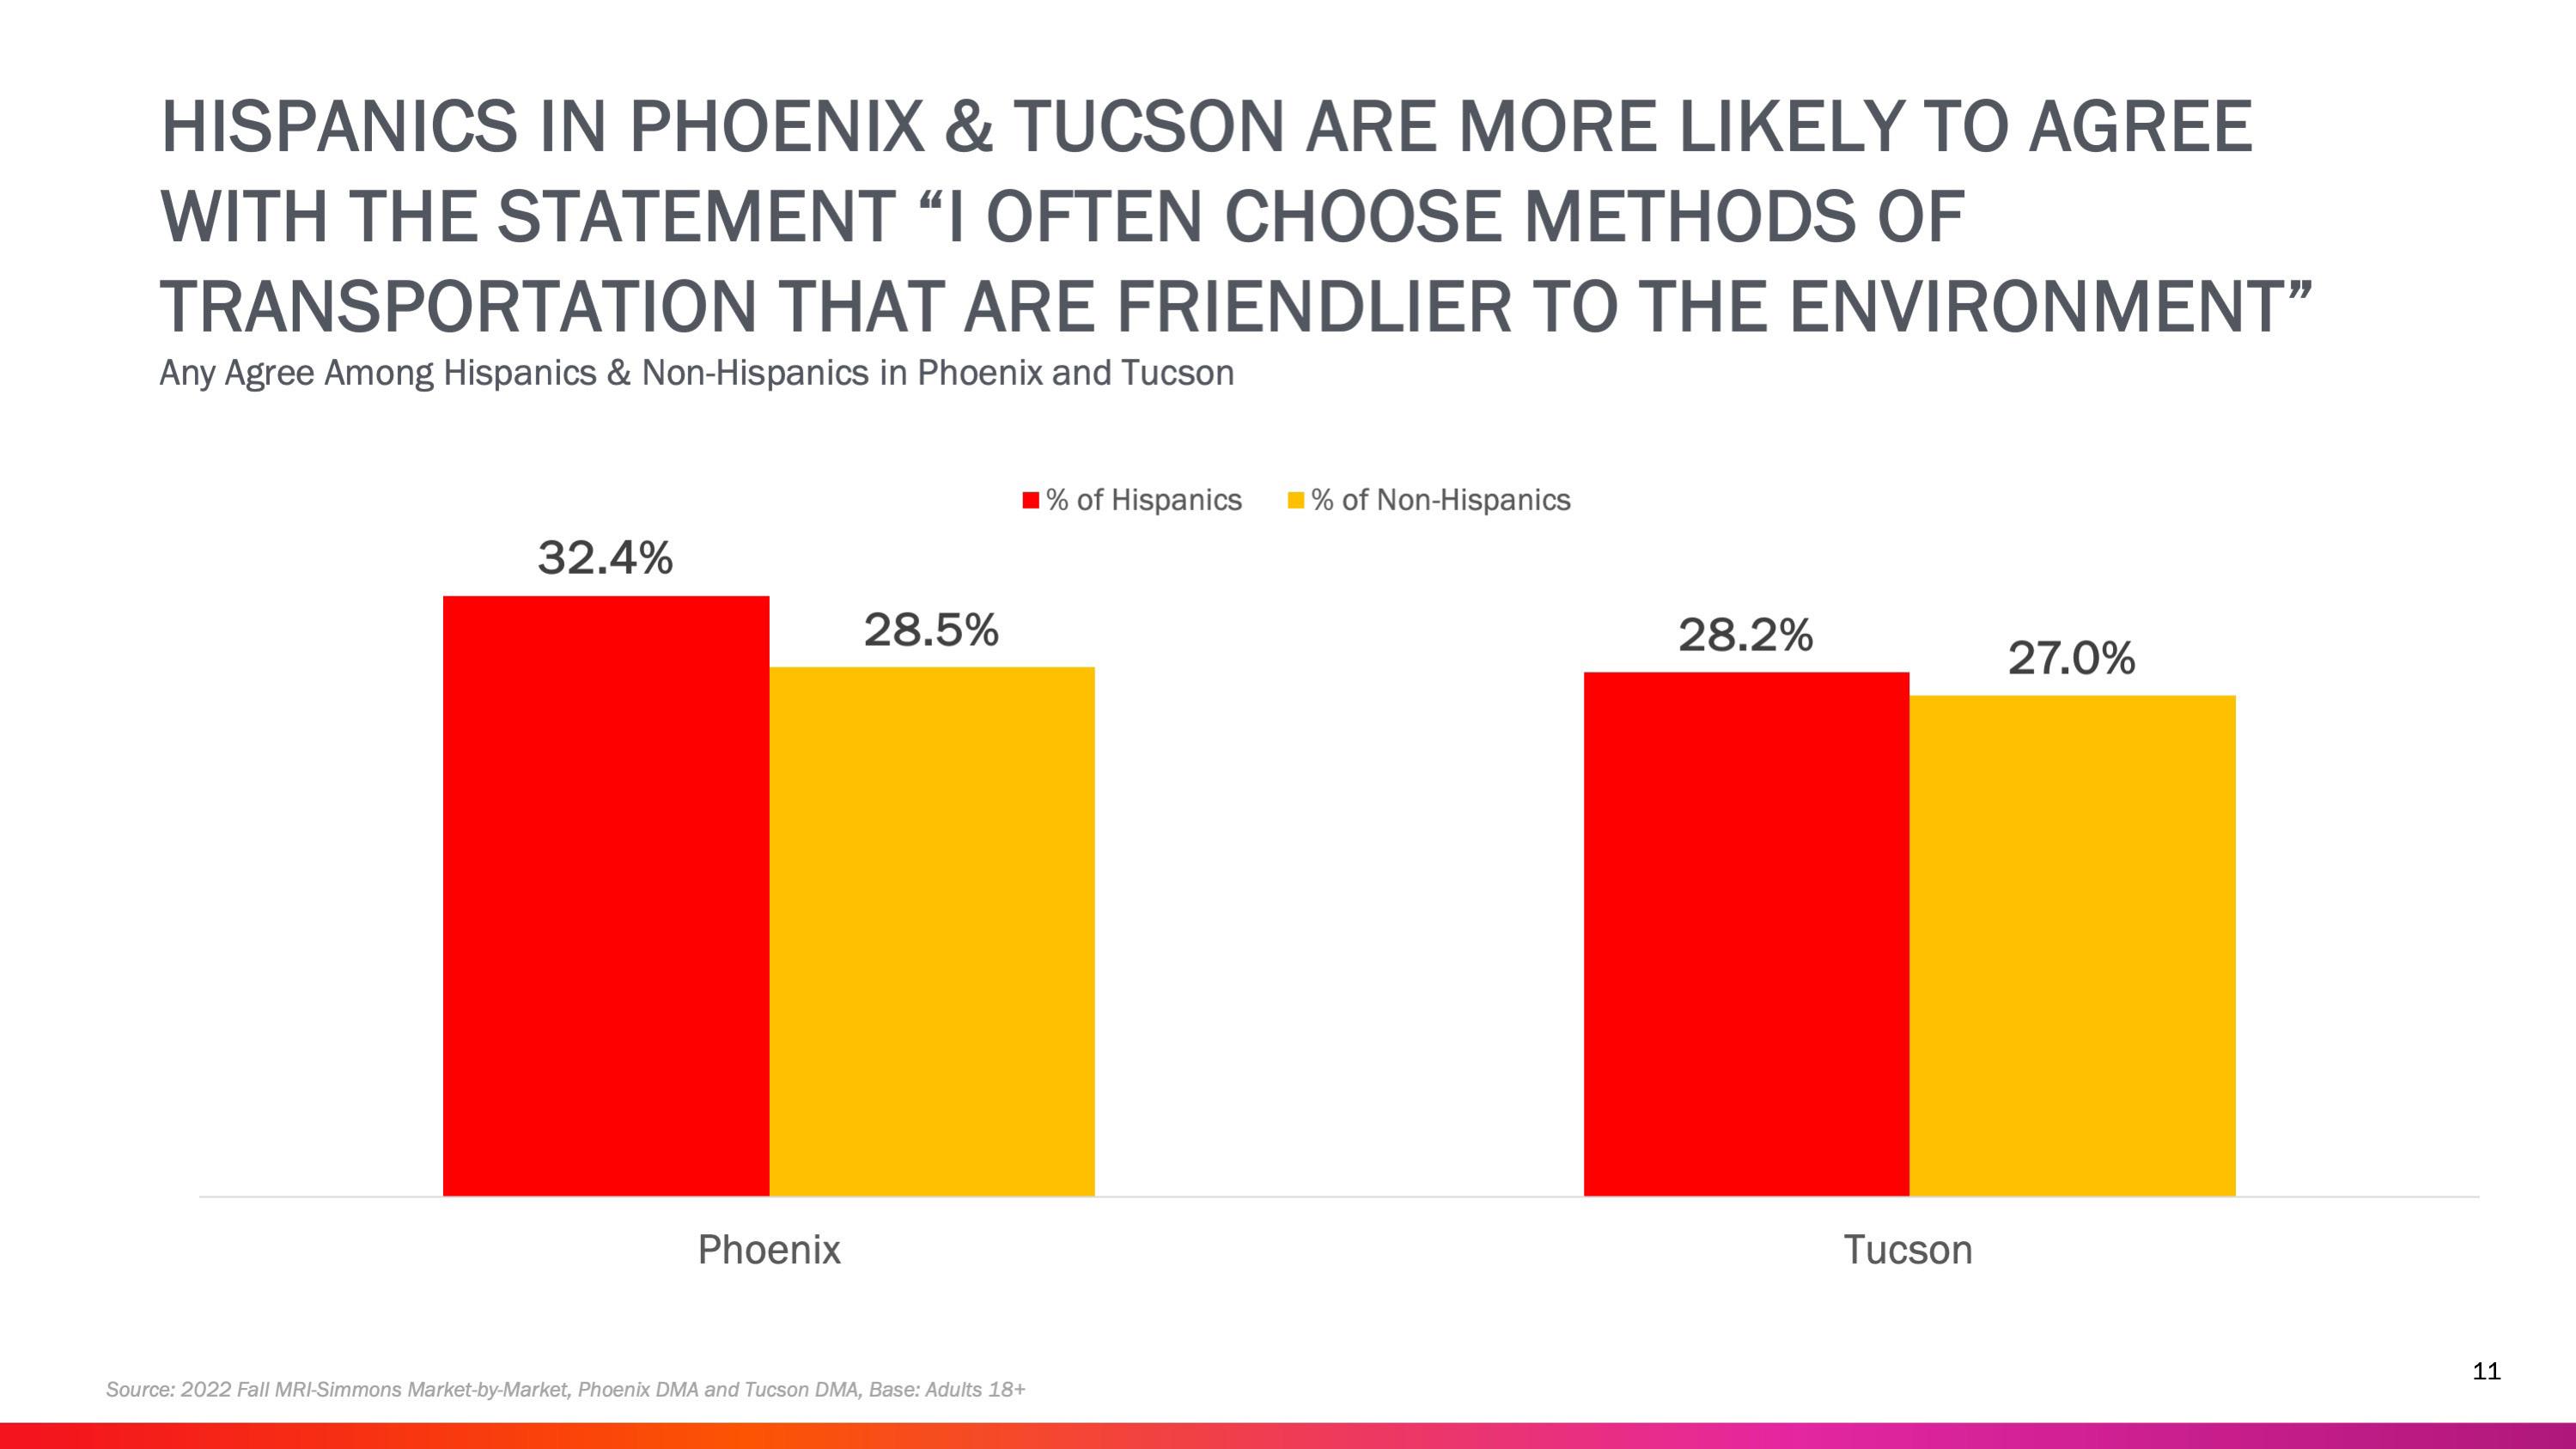 BY HILLARY FOOSE
Valley Metro exists to connect communities and enhance lives with service to more than 34 million annual riders and an additional one million paratransit customers, who are our seniors and people with disabilities. Valley Metro connects people to the most important destinations in their lives, from work, school and medical appointments to grocery stores and recreation.
With 53% of our riders without access to a vehicle, Valley Metro— through our 100 bus routes and 30+ miles of rail—provides critical access that supports our local workforce and overall quality of life. The greatest proportion of our riders use public transit for work and school. Our ridership is as diverse as the metro Phoenix region and we’re proud to serve a mix of ages, genders and ethnicities. From our most recent on-board survey, 43% of our passengers identify as white, 25% as Hispanic and 19% as African American. We also welcome a host of additional communities, including Native American, Asian and those who are two+ races.
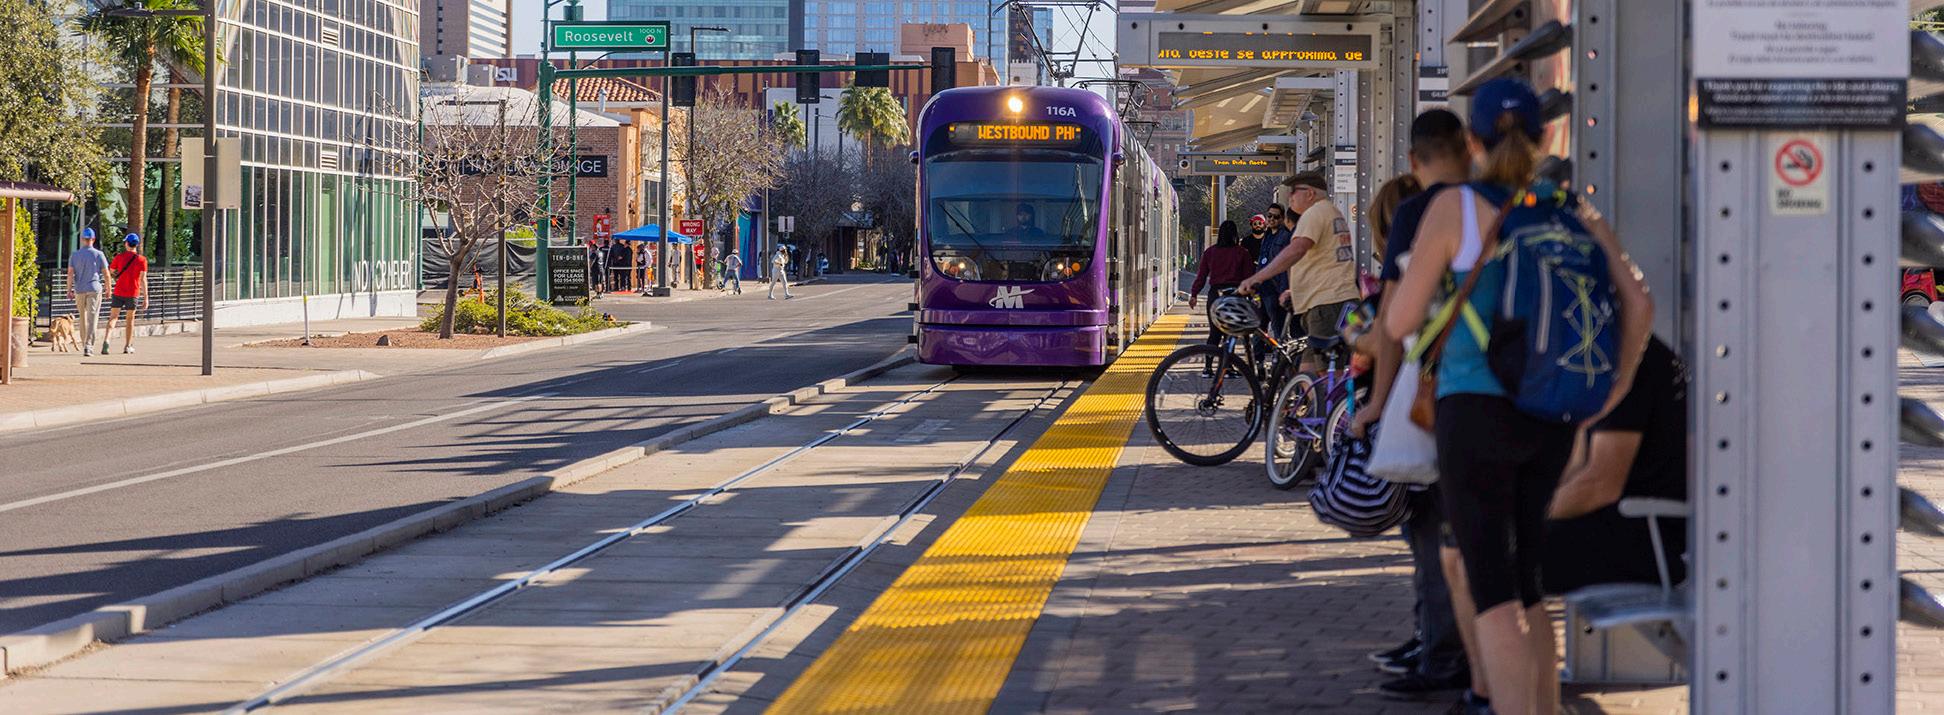
Coming out of the pandemic, we are seeing ridership rebounds, despite the significant changes in overall commuting (and telecommuting) patterns. We are steadily rebounding on our bus and rail systems, with 12% and 33% gains in ridership, respectively, compared to the prior year.
We are seeing even stronger returns on some of our newer mobility solutions, including the streetcar in Tempe and microtransit options operated out of the West Valley. Valley Metro Streetcar has the highest satisfaction rating in our system and over 3,000 weekday boardings, making it one of the busiest routes by mile in our entire system. We are looking to expand the streetcar’s reach with a study underway to potentially extend the service farther into Tempe and west Mesa along Rio Salado Parkway.
Streetcar and light rail continue to attract development and jobs, with more than $17 million in public and private sector development within a half-mile of these two corridors. The developments
range from affordable residential and high-rise commercial to co-working spaces and every option in between. In Tempe, we’re proud to partner with Culdesac, the first car-free neighborhood in the U.S. and adjacent to our station at Smith Martin/Apache Blvd.
Ridership spiked across the six days of Super Bowl LVII in February 2023. Public transit, particularly Valley Metro Rail, is part of the metro Phoenix region’s successful formula to be one of only two cities who have hosted the Super Bowl four times. Valley Metro Rail served 250,000 riders—a 60% increase above average—during the Super Bowl LVII festivities in downtown Phoenix, providing seamless service and a positive customer experience for many, including many first-time residents and visitors.
“Our accessible and efficient light rail system met the needs of tens of thousands of residents and visitors…and along the way showcased how Phoenix’s continued investment in public transit supports our efforts to sustainably grow our city, create jobs and reduce our carbon footprint,” said Phoenix Mayor Kate Gallego following the successful event, which set records for transit and transportation in Phoenix.
Without light rail, the gridlock in downtown Phoenix would have prohibited the Super Bowl experiences from being as large and all-access as they were. The ease and reliability that Valley Metro provides helps our region continue to secure mega events, including the NCAA Final Four and WNBA All Star Game in 2024. Valley Metro is also hard at work to deliver the community’s vision of expanded public transit with the active construction of the Northwest Extension Phase II and the South Central Extension/ Downtown Hub light rail projects. These two projects have leveraged local city of Phoenix and regional Proposition 400 dollars to generate $687 million in federal investment for our region. Each project has created and trained a local workforce and will connect thousands of new riders to the regional transit system.
In early 2024, we will open the Northwest Extension Phase II that will bridge the West Valley, across Interstate 17, to regional destinations in Phoenix, Tempe and Mesa, including Phoenix Sky Harbor, major employment centers, educational institutions and entertainment and dining options.
All along the way, Valley Metro and the City of Phoenix have prioritized the caring for and sustainability of the neighboring business community. This year, we will hit the $1 million mark for grants awarded to adjacent, small businesses experiencing construction as part of the first-ever Small Business Financial Assistance Program funded by the city of Phoenix. It’s the first time in Valley Metro’s history that we’ve been able to add financial assistance to our array of consulting, marketing and signage programs that help businesses through construction and to benefit from the future line in operation.
Valley Metro will open our project of “firsts” with the Northwest Extension Phase II that extends light rail from 19th Ave./Dunlap to the redevelopment of the former Metrocenter Mall area via a rail-only bridge across I-17 and our first elevated station. Greater technology will be deployed with the help of a $13 million federal grant supporting our initial investment in electric buses and bus infrastructure, helping our fleet to go “greener” and to create a more sustainable operation.
Technology is also being used to provide easier, more savvy ways to pay for trips on public transportation, including mobile fare, which is active now and reloadable accounts and smartcards for all riders.
Sometimes a decision is crystal clear. That was the case for the Isaac School District in Phoenix when faced with a fleet of aging buses that needed to be replaced. The obvious answer: Go electric.
The school applied for funding to replace half of its diesel school buses through the U.S. Environmental Protection Agency’s (EPA) Clean School Bus Program. The EPA had $5 billion available to replace existing school buses with zero-emission buses as part of the Bipartisan Infrastructure Deal (The Infrastructure Investment and Jobs Act) passed by Congress on Nov. 6, 2021. Although the bus program is open to all, funding was prioritized for low-income, rural and Tribal school districts.
Between Van Buren and 51 St. Ave. and 19 th Ave. and Thomas in Phoenix; a small portion extends north to Indian School and 43 rd Ave.
There are 11 schools that feed into the Phoenix Union High School District: 1 K-8 school
2 Middle schools
7 Elementary schools
1 Virtual
5,291 students ( 48% Female and 52% Male)
According to Isaac District Superintendent Dr. Mario Ventura, the district was excited to learn in November 2022 that it was awarded one the grants. Replacing their aging buses with diesel-fueled buses would have cost approximately $275,000 each. Instead, according to Dr. Ventura, the EPA gave the district $375,000 per bus plus an additional $22,000 for charging stations and infrastructure for a total award of more than $2.25 million. The infrastructure, including the charging stations, will be provided by Veregy. Arizona Public Service (APS) will provide the electric power up to the meter and the district will be responsible for the energy costs.
92.3% Hispanic/Latino
Dr. Mario Ventura (since July 2012)
Isaac School District #5
3348 W. McDowell Rd. Phoenix, AZ 85009 602.455.6700
isaacschools.org
BY KAREN MURPHY
“The transition to electric buses represents a significant step forward in our commitment to sustainable and environmentally friendly transportation solutions for our students and community.”
—Dr. Mario Ventura, Isaac School District Superintendent
“Approximately 47% of our students use buses as a means of transportation,” Dr. Ventura says, pointing out that because of current student enrollment the district has had to add additional stops and will continue to add new bus routes.
“The transition to electric buses represents a significant step forward in our commitment to sustainable and environmentally friendly transportation solutions for our students and community,” he says.
The Isaac School District was one of only eight districts in the state to receive funding from the EPA for new buses. In fact, Dr. Ventura says, “We are the only district in the [Phoenix] metro area that will have six [electric] buses, which is half of our fleet.”
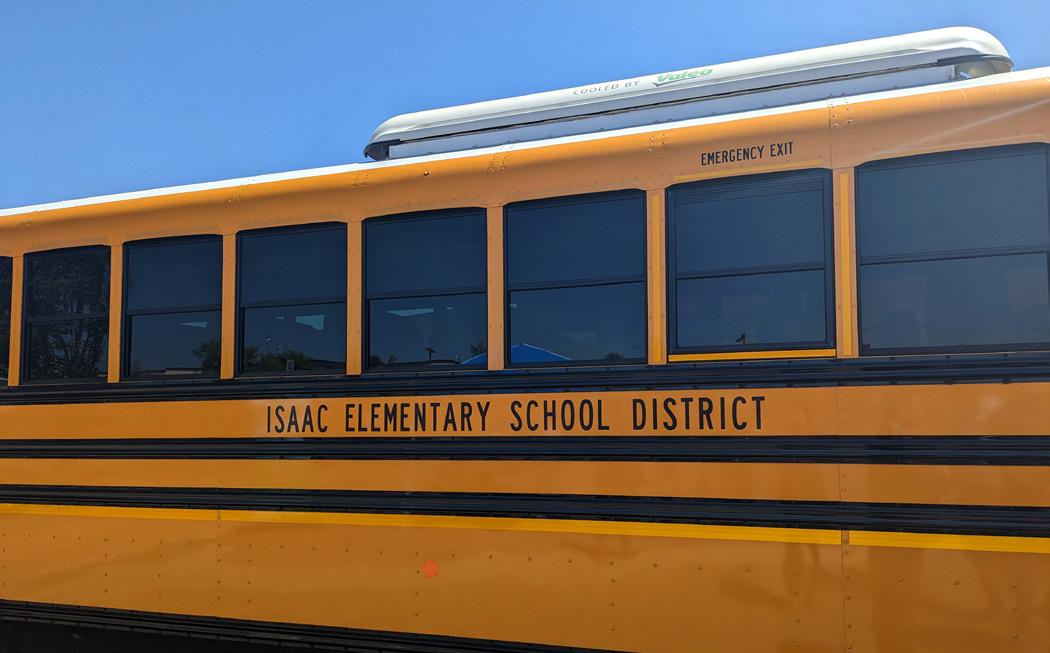
To choose a vendor, the district reviewed and selected vendors through a state approval cooperative that had “pre-approved vendors…to streamline the process and meet procurement requirements.” The two vendor options available for the electric buses were Blue Bird and Thomas Built.
The district chose Blue Bird and expects to get the new buses in February/March 2024. According to Dr. Ventura, the old diesel buses are part of a “trade-in plan that was embedded in the grant so the buses will be decommissioned.”
Although it is difficult to estimate the cost saving from this switch to electric buses, Dr. Ventura say that “the national average is $4,000—$11,000 per bus,” and pointed out that the district expects a cost reduction in both maintenance and fuel costs.
The response to this change “was overwhelmingly positive” from all segments of the local community—the parents, teachers, students and other community members, he says.
“The numerous benefits of electric school buses will include reduced emissions, improved air quality that will likely aid in reducing respiratory illnesses and provide enhanced safety for our students who ride our buses on a daily basis,” Dr. Ventura says. “We firmly believe that this transition will not only [increase] our students’ safety and well-being but will also contribute positively to the environment and inspire our community toward a more sustainable future.”
U.S. Environmental Protection Agency EPA Clean School Bus Program epa.gov/cleanschoolbus
Blue Bird blue-bird.com
Veregy
veregy.com
From Car and Driver magazine You’re About to See Way More Electric School Buses —Here’s Why caranddriver.com/news/a43795823/electric-schoolbuses-latest-details
From the World Resources Institute Electric School Bus Initiative wri.org/initiatives/electric-school-bus-initiative Ride Electric
A quarterly newsletterfrom the Electric School Bus Initiative electricschoolbusinitiative.org/ride-electric-electricschool-bus-initiative-quarterly
 BY TUFESA STAFF
TUFESA International is proud to be a part of the vibrant Latino community. With nearly 20 years of dedication to exceptional service and fostering connections, TUFESA International has become a leading brand in the passenger transportation industry.
Since Tufesa USA, LLC, under its brand TUFESA INTERNATIONAL, was established on Nov. 15, 2004, the company has traveled the roads of Arizona and later expanded to the states of Nevada and California. In addition, it established business ties with the Mexican company Autotransportes Tufesa and together they have built bridges between Mexico and the United States.
The main routes include cities such as Phoenix, Los Angeles and Las Vegas, connecting people from diverse communities. We take pride in being the link that unites families, friends and businesses along the border.
The history of TUFESA International has been one of success and constant growth.
In 2004, terminals were opened in Phoenix and Tucson. In the following years, operations were expanded by opening a terminal in Los Angeles and another one in Las Vegas, serving intermediate points through commercial agents. The Nogales terminal in Arizona was later added.
In 2008, the iconic Golden Gate Bridge was crossed to establish California routes in San Francisco, San Jose and Sacramento, opening terminals in Salt Lake City and intermediate points to provide even wider service. The most recent destination on the route is El Paso, Texas.
The key to success has been an unwavering commitment to quality and customer service, putting every effort into providing an exceptional travel experience at every stage of the journey.
The fleet of buses in the United States has grown significantly and now includes 83 vehicles, with more than 200 direct collaborators.
The key to success has been an unwavering commitment to quality and customer service, putting every effort into providing an exceptional travel experience at every stage of the journey. The staff is trained to provide friendly and professional service, offer important information and meet all passengers’ needs. The company pays attention to every detail—including the cleanliness of the facilities and the buses—to make each passenger’s journey memorable.
The story of TUFESA International is a testament to the founders’ entrepreneurial spirit. From its humble beginnings, the company has overcome obstacles and always remained alongside its passengers and collaborators to achieve the international recognition it receives today. Tufesa USA is proof that dreams can come true when passion, vision and a commitment to excellence are combined.
Today, TUFESA International continues to be a leader in transportation, connecting people, creating memorable travel experiences and exceeding our passengers’ expectations.
The company’s story is intertwined with the experiences of our passengers as we continue to travel together. The company is committed to ongoing service innovations to embrace the future, create an excellent legacy and maintain customer loyalty so we can keep traveling together going forward.


The Arizona Republic and La Voz, the paper’s Spanish-language sister publication and the newsroom’s bilingual desk, have been committed to creating journalism that reflects the diversity of the communities that we serve. We have made it our mission to understand how to best do that directly from community members.

As we began having conversations with community members from the Valley’s second-largest ethnic group, we found that among the many intersecting issues facing Phoenix’s Latino community was transportation. Their challenges involved finding ways to move around a sprawling city purposefully built for car usage, while dealing with financial and systemic barriers to accessing essential services and opportunities.
Driven by the community’s input, La Voz compiled a resource guide (see Resources at the end of this article) designed to help readers access affordable housing programs, understand public transportation routes and find essential services in their neighborhoods.
This recent effort being spearheaded by the La Voz team adheres to the longstanding commitment from The Arizona Republic to cover what our readers deem most important and crucial to live their best lives. And top of mind is always transportation.
Here are some of the highlights from our coverage (see p. 260) on transportation during 2022—led by reporters Megan Taros, Madeleine Parrish and Perry Vandell—and what we are doing moving forward to shape our coverage based on community feedback.
For South Phoenix residents who had their businesses set up along South Central Ave., the undergoing construction of the 5.5-mile extension of the Valley Metro Rail System has caused significant financial losses.
Reporter Madeleine Parrish captured the uncertainty many businesses faced regarding their future due to the light rail project and sheds light on residents’ struggles as they were impacted by the transportation project.
The extension was designed to improve south Phoenix residents’ options to move around the city and increase economic opportunity, but it impacted surrounding small shops that lost their clientele during construction due to lane restrictions, diversions and barriers that caused many drivers to entirely avoid the area.

Small businesses struggle along light rail construction despite financial assistance from Phoenix (Jan. 6, 2023) azcentral.com/story/news/local/phoenix/2022/12/28/ businesses-struggle-along-rail-construction-despite-aid-fromphoenix/10707500002/
Arizona traffic fatalities at 15-year high, data shows (Sept. 17, 2022) azcentral.com/story/news/local/arizona-traffic/2022/09/17/ crash-data-shows-arizona-traffic-fatalities-15-yearhigh/10393777002/
Here’s what Phoenix is doing to make its deadly roadways safer (May 12, 2022) azcentral.com/story/news/local/phoenix-traffic/2022/05/12/ heres-what-phoenix-doing-make-its-deadly-roadwayssafer/9655075002/
On Phoenix’s most dangerous streets, little has been done to address the pedestrian death toll azcentral.com/in-depth/news/local/arizonainvestigations/2019/04/01/pedestrian-deaths-phoenixslow-fix-areas-where-walkers-dying/3009674002/
‘It’s about time’: City will upgrade signals at south Phoenix intersection (June 6, 2922) azcentral.com/story/news/local/phoenix/2022/06/06/phoenixupgrade-signals-7th-and-southern-intersection/7493180001/
Police identify child killed while crossing Phoenix street (Dec. 9, 2022) azcentral.com/story/news/local/phoenix/2022/12/09/ police-identify-child-killed-while-crossing-phoenixstreet/69716022007/
Despite grants offered to business owners by Valley Metro, many were forced to shut down temporarily or permanently.
As Parrish followed the stories of residents who took on extra jobs to make up for the financial impacts to their businesses, she found that while many recipients say the program was somewhat helpful, others said the program wasn’t sufficient to compensate for the income they lost.
When construction began, “mi negocio empezó a ir para abajo, para abajo, para abajo,” Isidro López, who owns a tire shop on South Central, told The Republic in December 2022. “My business started to go down, down, down, because my business depends on cars, on traffic passing on the street.”
López said he lost almost 50% of his sales due to construction and while he received a $3,000 grant to help, he said without taking on an extra construction job where he works 35 hours a week, he would not have been able to keep the shop afloat, on which he and his family depend.
The majority of businesses who applied for the funding were deemed ineligible because they weren’t located adjacent to the construction, while others were denied because they were not in business before construction began, or because they exceeded the revenue cap, according to Valley Metro.
Our coverage has also focused on how cities are working to make their streets safer for pedestrians and motorists.
Arizona ranks as the fifth deadliest state in the United States. Roadways in the state were the deadliest they had ever been in the past 15 years, according to 2021 crash data from the Arizona Department of Transportation.
And in 2022, there were a number of collisions and fatalities on Phoenix’s major throughways, such as Indian School and Camelback Rds. The throughways have crosswalks in intersections, but large sections lack marked crosswalks—much less high-intensity activated crosswalks (HAWKs)—outside of intersections. Because of the distance between legal crossings, pedestrians are enticed
to cross mid-block Ryan said, which is where most pedestrian fatalities occur.
Phoenix has installed more HAWKs, which signal to drivers to slow down and stop for pedestrians wishing to cross the street. A 2019 Republic analysis showed that intersections where HAWKs were installed had lower fatality rates. The city has installed 75 HAWKs since 2009, the city said and 28 of those were installed after our analysis.
Main crossings where HAWKs were installed are located in West and South Phoenix, predominantly Latino areas, at intersections such as McDowell Rd. from 40th St. to 43rd St. and 7th Ave. near Buckeye Rd.
Our coverage also looked at another problem intersection in South Phoenix and how the city planned upgrades and turn signals after two years of unceasing community efforts.
Residents said the intersection of 7th Ave. and Southern Ave. had been dangerous for decades: Between 2016 and 2020, there were 141 collisions—about one collision every 13 days—according to the Street Transportation Department.
For over two decades, Arizona has consistently ranked within the top 10 states for the highest rate of pedestrian fatalities. According to the Arizona Department of Transportation’s yearly Motor Vehicle Crash Facts report, 257 pedestrians were in fatal crashes in 2021. Data from the Arizona Department of Transportation shows most pedestrian fatalities occur in metro Phoenix where, of the 7 million Arizonans, 4.5 million reside in Maricopa County.
While HAWK crossings have proven effective at lowering pedestrian fatalities, experts told us that they don’t resolve every issue that stems from U.S. cities whose roadways were often designed to be more convenient for motorists than for pedestrians.
Our efforts to make our coverage as accessible as possible to all Arizonans began with understanding and addressing the information needs of Latino Arizonans.
We wanted the community’s guidance and feedback to be at the core of our coverage. As we listened to their challenges, aspirations
for their neighborhoods and expectations from the news media, we understood the urgency of amplifying their voices and addressing their needs.
In early 2023, with the support of a grant from the American Press Institute, we launched a bilingual texting service, Con La Phoeniquera, which delivered useful information about what was happening in Phoenix and the surrounding cities. In September, that effort was successfully transitioned into a Latino-focused newsletter, where Spanish and English readers alike can hear from bilingual reporters and editors from our newsroom, learn about community initiatives and become a part of a space dedicated to our gente, a mirror of our growing and ever-changing coverage of our comunidades.
Phoenix Sky Harbor International Airport (PHX) is more than runways and terminals. Yes, it recorded more than 44 million passengers last year, but perhaps more than anything else, PHX is a powerful engine of economic growth. In Arizona, the Phoenix Airport System represents an annual $38 billion economic impact, according to a 2017 study by Arizona State University’s W.P. Carey School of Business Seidman Research Institute and is the largest economic engine in the state. The study, which also included information about Phoenix Deer Valley and Phoenix Goodyear airports, offered several striking statistics:
• PHX Sky Harbor has more than 57,000 employees;
• Regionally, the airport supports 269,000 jobs;
• More than 1,200 flights arrive and depart each day at PHX Sky Harbor;
• An average of 125,000 passengers pass through the airport’s two terminals daily;
• State and local taxes generated by airport-related activity total more than $2.2 billion annually; and
• PHX Sky Harbor has more than 120 nonstop domestic destinations and more than 20 nonstop international destinations.
The value the airport adds to the community and the state is significant. And, the value added to the state’s economy by international flights is also critical. Pre-COVID international flights had an annual economic impact of $3 billion. Mexico in particular plays a prominent role in the airport’s international travel network. There are 11 nonstop destinations in Mexico and PHX averages 15 daily departures for business and leisure travelers seeking trips
to locations such as Mexico City, Hermosillo, Puerto Vallarta, Guadalajara and Monterrey.
The significance of Monterrey cannot be overstated. In January, American Airlines started daily, nonstop service to Monterrey, a market that had no direct service from PHX Sky Harbor since 2004. Monterrey is the third largest city in Mexico and is an important financial, commercial and industrial center. Half of Mexico’s largest businesses have headquarters in the Monterrey area and the influx of foreign and domestic investment shows no signs of slowing.
“Mexico is Phoenix’s number one trade and tourism partner,” Phoenix Mayor Kate Gallego keenly observed at the launch of the Monterrey flight, “which makes air service to Monterrey increasingly important for our local economy. As American Airlines expands its international service, Phoenix benefits from increased connectivity to emerging global markets and sought-after leisure destinations.”
Three carriers serve the Phoenix—Mexico market: American Airlines (10 cities); Southwest Airlines (three cities); and Volaris (two cities). Southwest added its first-ever Phoenix international service to Cabo San Lucas and Puerto Vallarta in 2020 and then added Cancún in 2021. Interestingly, Southwest was among 11 airlines that added 49 markets at PHX Sky Harbor during the
height of the COVID pandemic. While airports around the globe struggled during the worldwide pandemic, commercial air travel options grew at PHX Sky Harbor, which dubs itself as America’s Friendliest Airport®.
A closer look at the Phoenix—Mexico market shows that Cabo San Lucas generates the most flight activity with 28 weekly departures. It is followed by Puerto Vallarta with 19 weekly departures, Cancún with 14 weekly departures and Guadalajara with 13 weekly departures.
Although Phoenix Sky Harbor is owned and operated by the city of Phoenix, operations at one of the country’s busiest airports cost taxpayers nothing. The economic and employment contributions
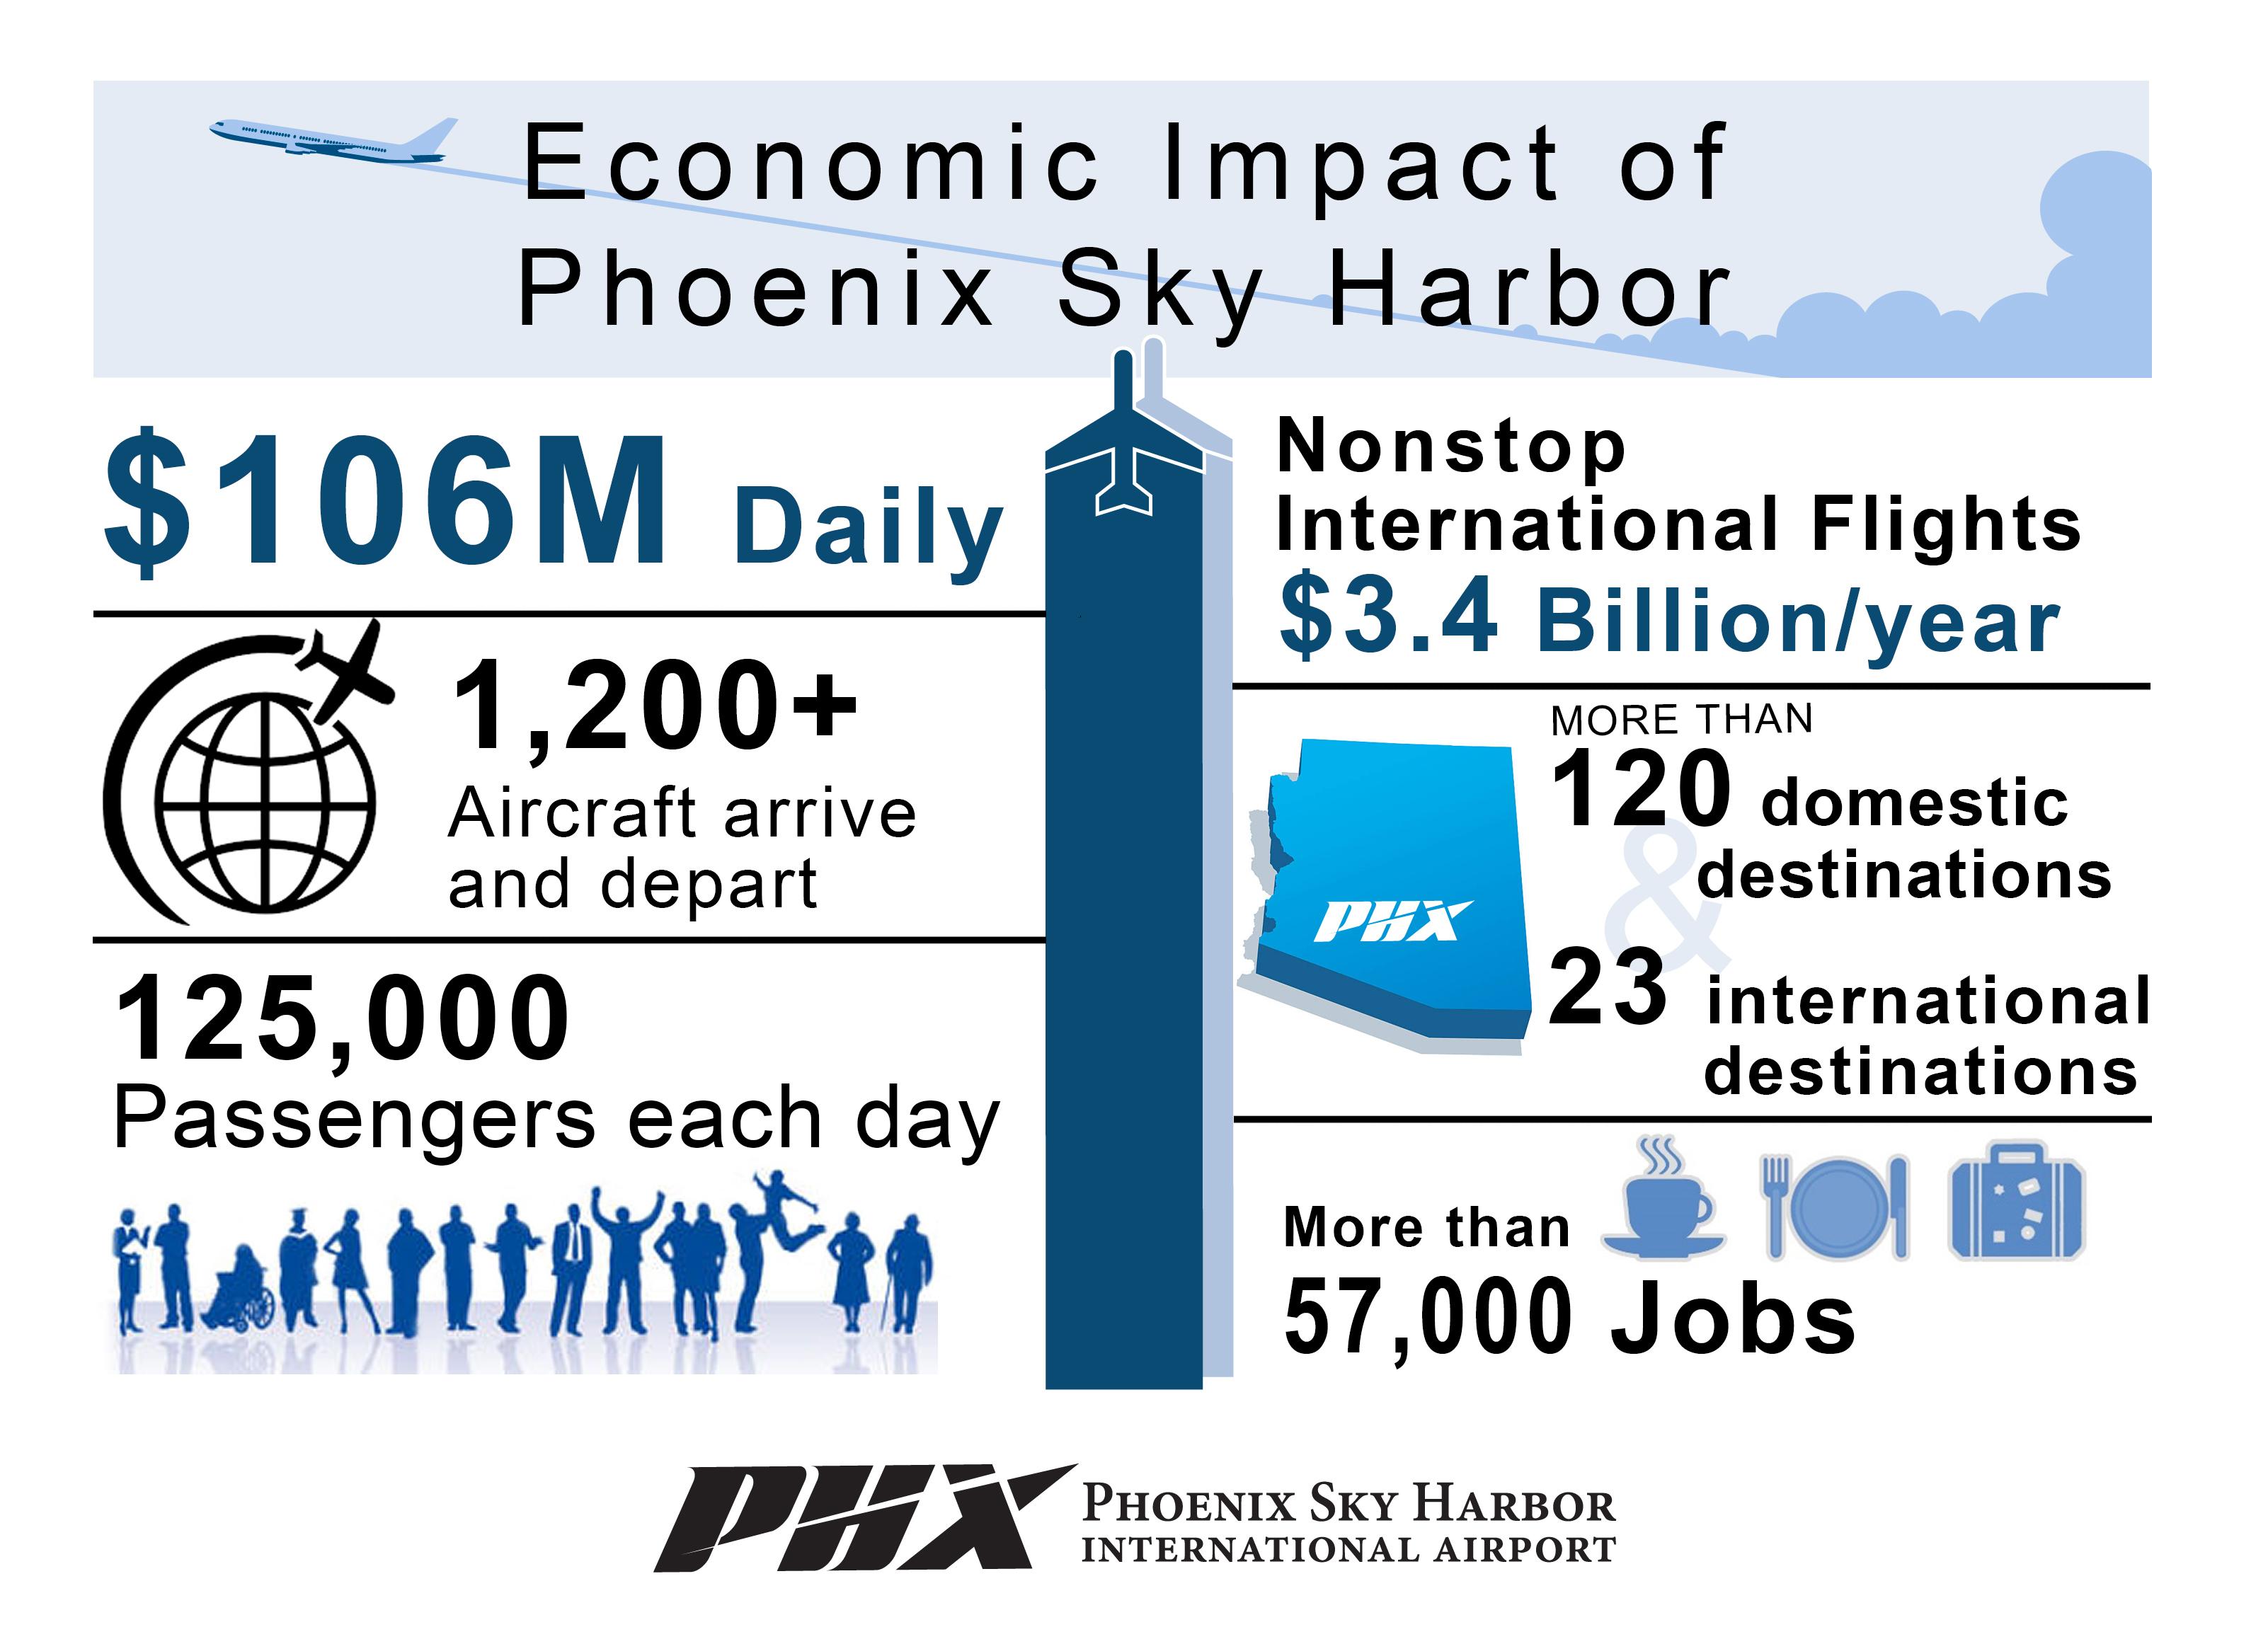
the airport generates, however—including for the Hispanic community— are enormous.
Consider this data from Federal fiscal year (FFY) 2022, which ranged from Oct. 1, 2021, to Sept. 30, 2022:
• In FFY 2022, PHX Sky Harbor had 33 terminal concession locations operating with full or partial Hispanic ownership (meaning Hispanic participation as an owner, joint venture partner or a sub-tenant).
• Through those 33 terminal concession locations, more than $30 million in revenue was generated by the ownership share of those Hispanic business partners.
• The 33 terminal locations account for 25% of PHX’s total terminal concessions (from 129 total concessions outlets).
One of the major advantages PHX Sky Harbor users enjoy is its proximity to the city center. Only four miles separate the airport from downtown Phoenix, which is an approximately 12-minute drive. In Los Angeles, a similar drive to the LA City Hall is approximately 19 miles and can take as long as 40 minutes.
There is no doubt that PHX Sky Harbor provides excellent outbound access to the rest of the United States and many international destinations for businesses and residents while also facilitating the arrival of inbound visitors, goods and services that enhance the local economy. Investment in our local airports is a good
investment in our future. It is a guaranteed way to help Phoenix and Arizona continue to thrive.
DavidJ.RamirezwasapublicinformationofficerfortheCityofPhoenix Aviation Department. He retired inAugust 2023.
BY DAVID J. RAMIREZ
When Joya Kizer was a student at Arizona State University, she was studying zoology—and assumed after graduation that she would work with animals. Instead, her career took a much different path: She is the president and CEO of CASA Unlimited Enterprises, Inc., a family-owned airport concessionaire at Phoenix Sky Harbor International Airport (PHX).
“I thought I would be a research scientist in a lab,” says Kizer, who has expanded CASA’s entrepreneurial footprint not only at PHX, but at airports throughout the country.
CASA currently operates three stores in Terminal 4 at PHX: Lucky Break, Brookstone and the azcentral.com newsstand. CASA, which is a certified Airport Concession Disadvantaged Business Enterprise (ACDBE), also has joint venture partnerships with InMotion Entertainment, XpressSpa, Stellar Retail Group and SSP America throughout both terminals. In addition, CASA has other joint venture partnerships in Miami International Airport (MIA), Dallas/Fort Worth International Airport (DFW) and Los Angeles International Airport (LAX).
Kizer’s parents, Yolanda Collazos Kizer and Aaron Silva Kizer, founded CASA Unlimited in 1989 at PHX with the Curious Creatures store. At roughly the same time, Collazos Kizer was the chairperson of the AZ Hispanic Chamber of Commerce’s (AZHCC) Board of Directors. Under Collazo Kizer’s direction, the AZHCC embraced a more aggressive business direction and focus.
“[My mother] was such a dynamo, just a brilliant person,” says Kizer.
Interestingly, Kizer started her career in retail with HMS Host at PHX while wrapping up her ASU studies. In late 2001, Kizer officially joined the CASA team to become the store manager of

Curious Creatures, where she was responsible for all aspects of the operations, including purchasing, personnel management, cash control, in-store marketing and visual merchandising.
“When I train my team, I tell them we’re in the relationship business,” says Kizer, who says that means that the team should forge meaningful connections with passengers, connect to store landlords and also build relationships with CASA’s partners and vendors.
Casa Unlimited Enterprises 1001 E. Jefferson St., Suite 6 Phoenix, AZ 85034
602.257.8410
casaunltd.com
Airport Concession Disadvantaged Business Enterprise (ACDBE) Program transportation.gov/civil-rights/disadvantaged-businessenterprise/airport-concession-disadvantaged-businessenterprise
From Law Insider Airport Concession Disadvantaged Business Enterprise (ACDBE) definition lawinsider.com/dictionary/airport-concessiondisadvantaged-business-enterprise-acdbe
Kizer says she’s proud of her family’s and CASA’s presence at PHX, noting that the company is likely the only woman-to-woman, second-generation retail ownership on a national level operating in an airport environment.
“It’s such a dynamic industry and symbiotic environment,” says Kizer, who clearly relishes devoting her career to airport logistics, applying her expert skills to the operations, retail, management and longevity of major airport ecosystems.
As CASA’s president and CEO, Kizer does a fair amount of travel, for both business and pleasure—and her love of and interest in animals has not diminished over time. She enthusiastically recounts her experiences raising chickens, pigs and tortoises, among other animals she has had. She also devotes considerable time to her very important job as mother to her two children, Maya and Henry.
For now, though, PHX is proud that Joya Kizer has chosen to use her airport logistics expertise at PHX, America’s Friendliest Airport®.
DavidJ.RamirezwasapublicinformationofficerfortheCityofPhoenix Aviation Department. He retired inAugust.
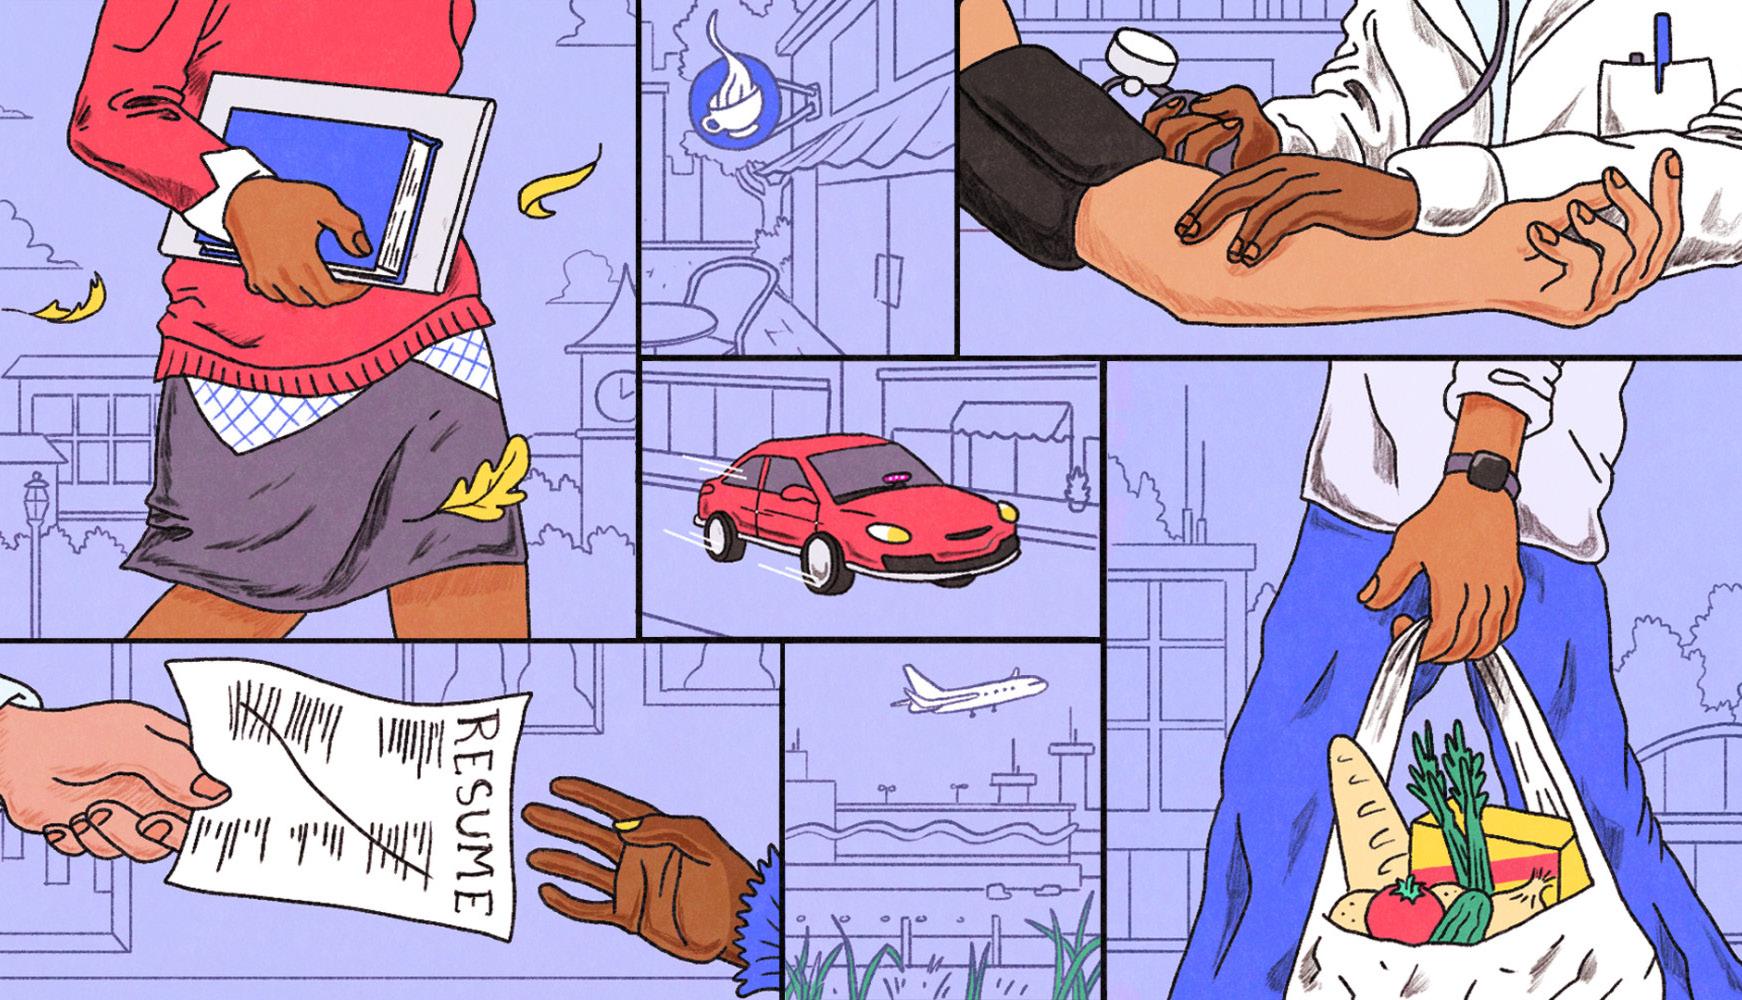 BY CARL FRANZEN
When you open a rideshare app, where are you usually going?
Your answer likely depends on all sorts of unique factors. If your job involves frequent travel, for example, you probably hail rides to the airport; if you don’t own a car, you may use rideshare to run errands. But underlying all these possible use cases is one powerfully predictive data point: your bank account.
New research from Lyft reveals that rideshare use varies dramatically with income level. The company surveyed more than 30,000 riders across the U.S. and Canada and discovered that
those with medium and high household incomes are more likely to hail a ride for leisure activities like bars, travel and restaurants. Meanwhile, a greater percentage of lower-income passengers depend on rideshare for vital services like getting to work and healthcare appointments.
“This is the first time we’ve asked riders about where they are going and analyzed it by income,” says Sarah Cormack-Patton, PhD, Lyft’s policy research manager. “The pattern is very clear across all categories.”
Lyft’s largest category — at 44% — is low-income riders, defined as those with annual household incomes under $50,000. Around 27% of riders are middle income (making between $50,000 and $100,000). And 29% are high-income households (making $100,000 or more).
The pattern identified by Cormack-Patton and team shows lowincome individuals relying on Lyft for help with their most important transportation needs. Around 44% of them use the platform for commuting to work, compared to only 26% of high-income riders. Low-income riders are also far likelier than high-income ones to use the Lyft platform to access rides to school (21% vs. 8%), job interviews (27% vs. 9%), healthcare appointments (34% vs. 17%) and to run errands (40% vs. 17%).
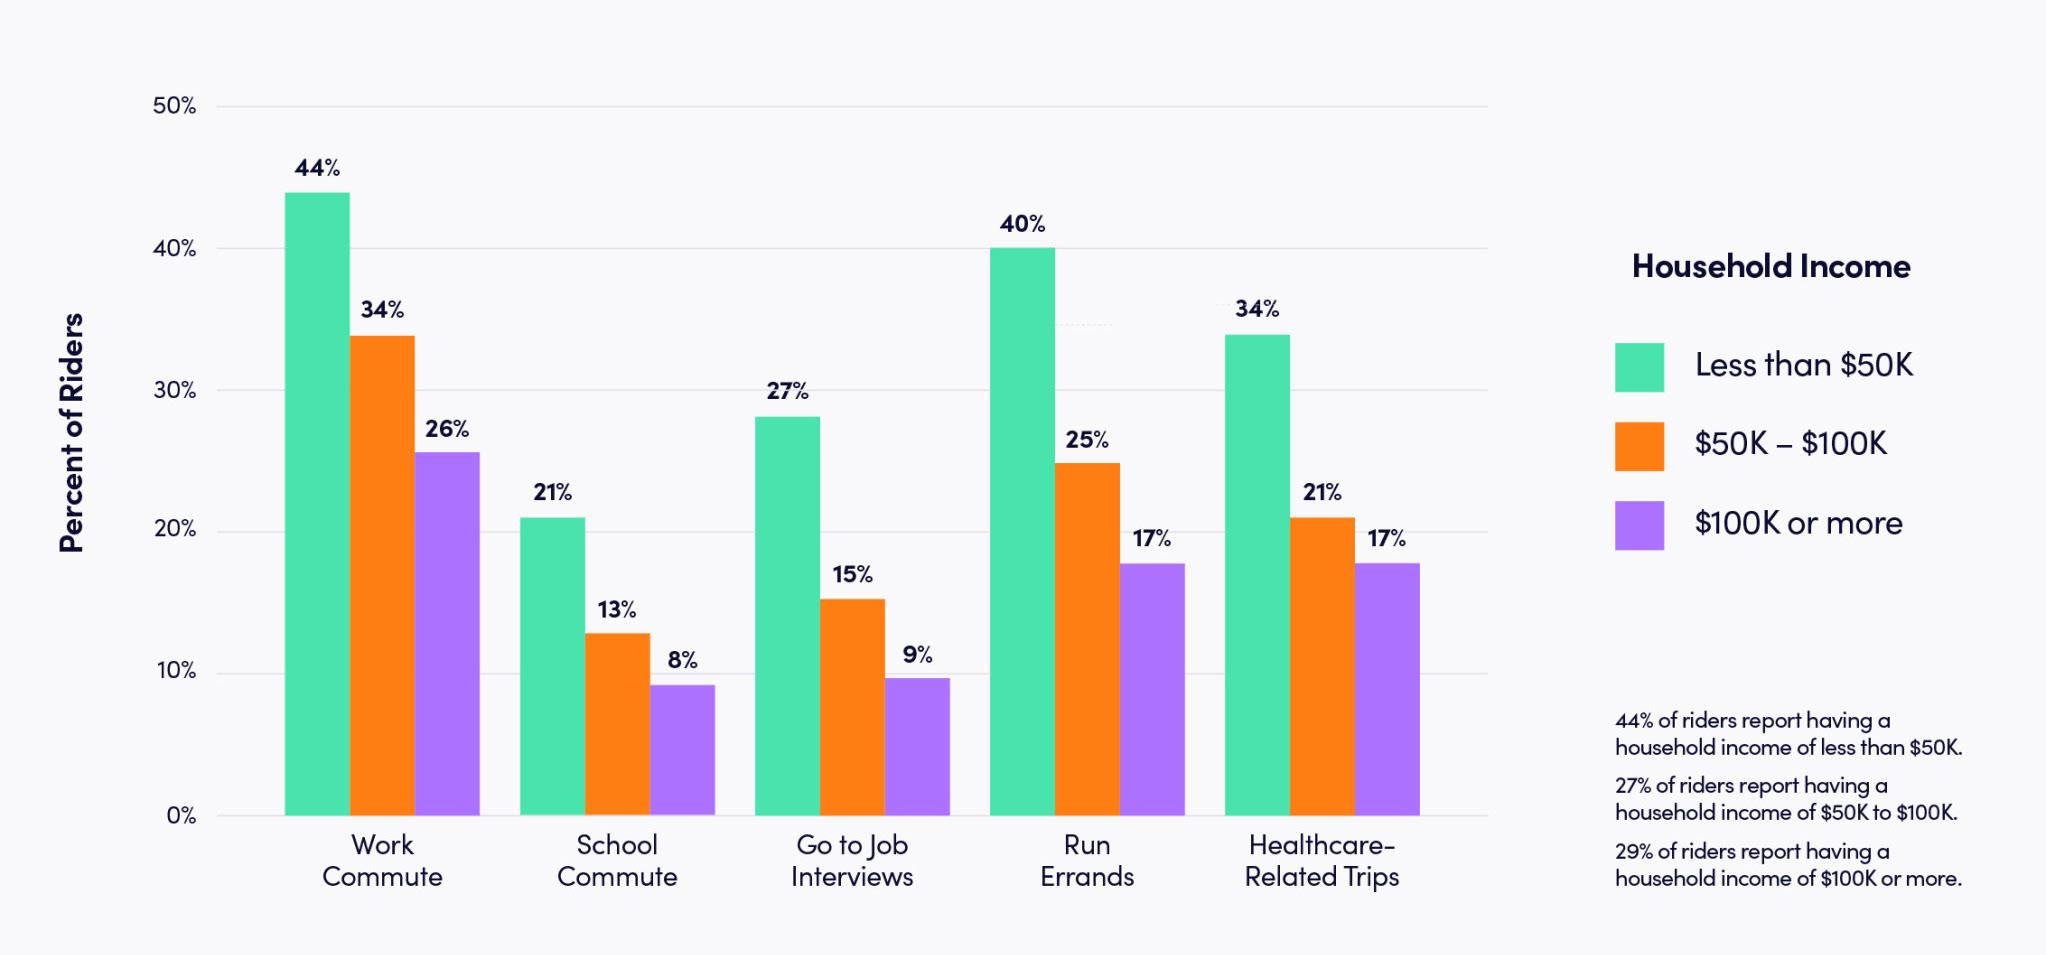
Meanwhile, high-income riders are far more likely than lowincome riders to use the Lyft platform to access rides to and from the airport (81% vs. 40%) and for leisure travel (63% vs. 29%). The same pattern holds true for middle-income riders, who also use the Lyft platform for access to transportation to and from the airport (64%) and leisure travel (49%) more often than lowincome riders.
These results support prior findings of independent researchers, who also observed that low-income households increasingly rely on rideshare. A 2020 study of ride subsidy programs found participants preferred rideshare services to taxis and paratransit because they were on-demand and offered more comfortable and dependable service. A 2021 study of low-income individuals in Michigan also found that rideshare “can be especially beneficial for the low-income, aged, car-less and disabled travelers.”
All of which is to say, even though app-based rideshare services are relatively new in the long history of transportation, they’re already playing a crucial role in people’s lives, especially for those with fewer resources.
At Lyft, we recognize the power and potential of the Latino community, a vibrant tapestry of visionaries, creators and game-changers driving us towards a brighter future.


That’s why we’re proud to partner with the Arizona Hispanic Chamber of Commerce at DATOS, where we celebrate the indomitable entrepreneurial spirit of the Latino community.


Job Creation
430K+
People work for public transportation agencies ECONOMIC RETURN produced by long-term investment in public transit
5 -to-1
50K Jobs created and supported per $1 billion investment in job creation IN TAX REVENUE supported per $1 billion investment in job creation
Fostering Energy Independence
Leading in Clean Technology
Share of Hybrid Electric Buses
2010: 7.0%
2020: 18.8%
(According to APTA’s 2020 Vehicle Database)
Lowering Carbon Emissions
84% less CO2 emissions by using the subway rather than a car (According to
2,000+
SUPPLIERS in 48 states and DC
$42 Billion $382 Million
Reducing Gasoline Consumption Gallons of Gas Saved each year by using public transportation (According
6.0 BILLION
Nearly
IN TRANSIT SPENDING flows to the private sector (65% increase since 2000)
More Efficient Increase in vehicle miles operated per kilowatt-hour over the Past 30 Years
22%
13%
Supporting Private Sector Jobs Heavy Rail Light Rail/ Streetcar
Driving the Economy of trips on transit directly benefit the local economy
87%
(According to APTA’s “Who Rides Public Transportation”)
Number of Agencies
50% of trips are to and from work
37% of trips are to shopping and recreational spending
1,308
4.5K+ 945
Public transit systems are… Rural Urban Nonprofit


Number of rail systems is growing
58 98 2020
Percentage of Buses with Amenities
79% of buses have security cameras
77% of buses have exterior bike racks
78% of buses have automated stop announcements
32.87 BILLION Total Passenger Miles Traveled
5.97 BILLION Trips in 2020


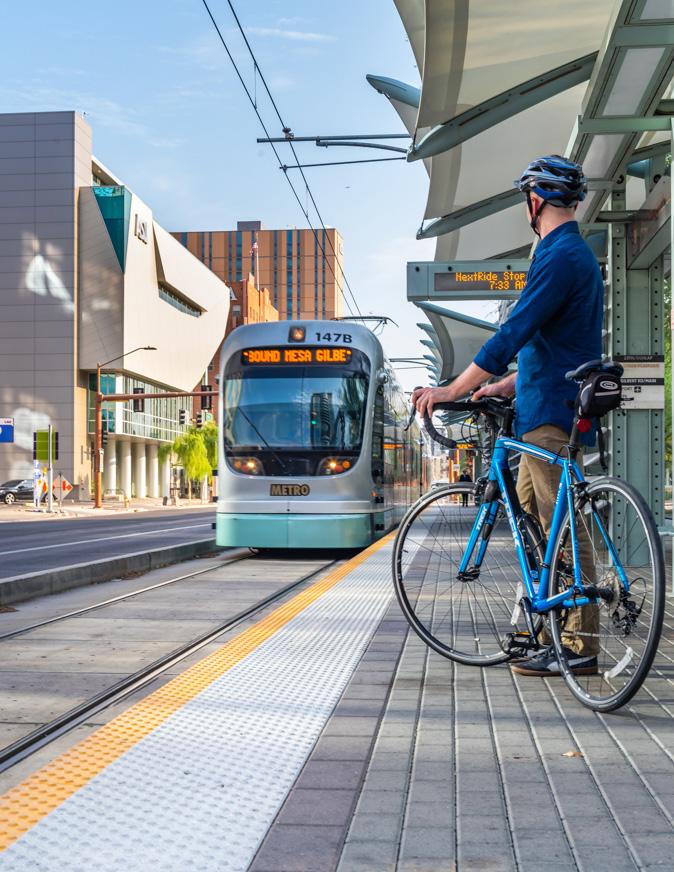
Analyzing Accessibility & Equity MAG is committed to equity, diversity, and inclusion efforts.
To help inform the regional planning process, the Transportation Performance program has performed a comprehensive analysis of different accessibility conditions for various communities and communities of concern.
More information about the chosen variables, communities, and methodology can be found in the Accessibility and Equity section.
A strong correlation was observed between level of poverty, percentage of minority population, and serious injury and fatality rate.
The Grand Corridor
The Grand Corridor is an approximately 13.76 square mile area that is generally bound by 67th, Northern and 35th avenues, and Indian School Road along Grand Avenue.
103,000
RESIDENTS MINORITY POPULATION
78.4%
62.2%
ABOVE REGIONAL AVERAGE FOR SERIOUS AND FATAL INJURY RATE
The number of people using our transportation system continues to grow as our region expands. As we continue to put stress on our existing infrastructure, creative and efficient methods of moving people around the Valley continue to be essential – especially as we continue to navigate the impacts of COVID-19.
129million 32million
VEHICLE MILES TRAVELED IN 2022 TRANSIT RIDERS IN FY 2022
Throughout the course of the pandemic, MAG has continuously monitored and tracked various traffic conditions. Although telecommuting and stay-at-home restrictions held a noticeable impact, traffic volumes have returned to pre-pandemic conditions and have since resumed their climb. Congestion levels have instead fluctuated – 2022 levels have yet to surpass pre-pandemic conditions.
Looking at data for both congestion delay and new COVID cases, a relationship is apparent – as COVID cases rise, congestion falls as people presumably isolate, receive treatment, and/or recover. This relationship is especially apparent in the holiday months of December and January for both 2021 and 2022. As congestion delay continues its periodic growth, MAG will continue to monitor these variables in search of further changes and fluctuations.
On May 20, 2022, the Tempe Streetcar was opened for public use, offering a new transit route and mode for travelers to use in the area. The route spans three miles from Dorsey Lane and Apache Boulevard up to Rio Salado Parkway near Tempe Beach Park. The streetcar is planned to operate every 10 minutes, holds one park-and-ride location at the Dorsey Lane and Apache Boulevard stop, and connects to the light rail at two separate stops.
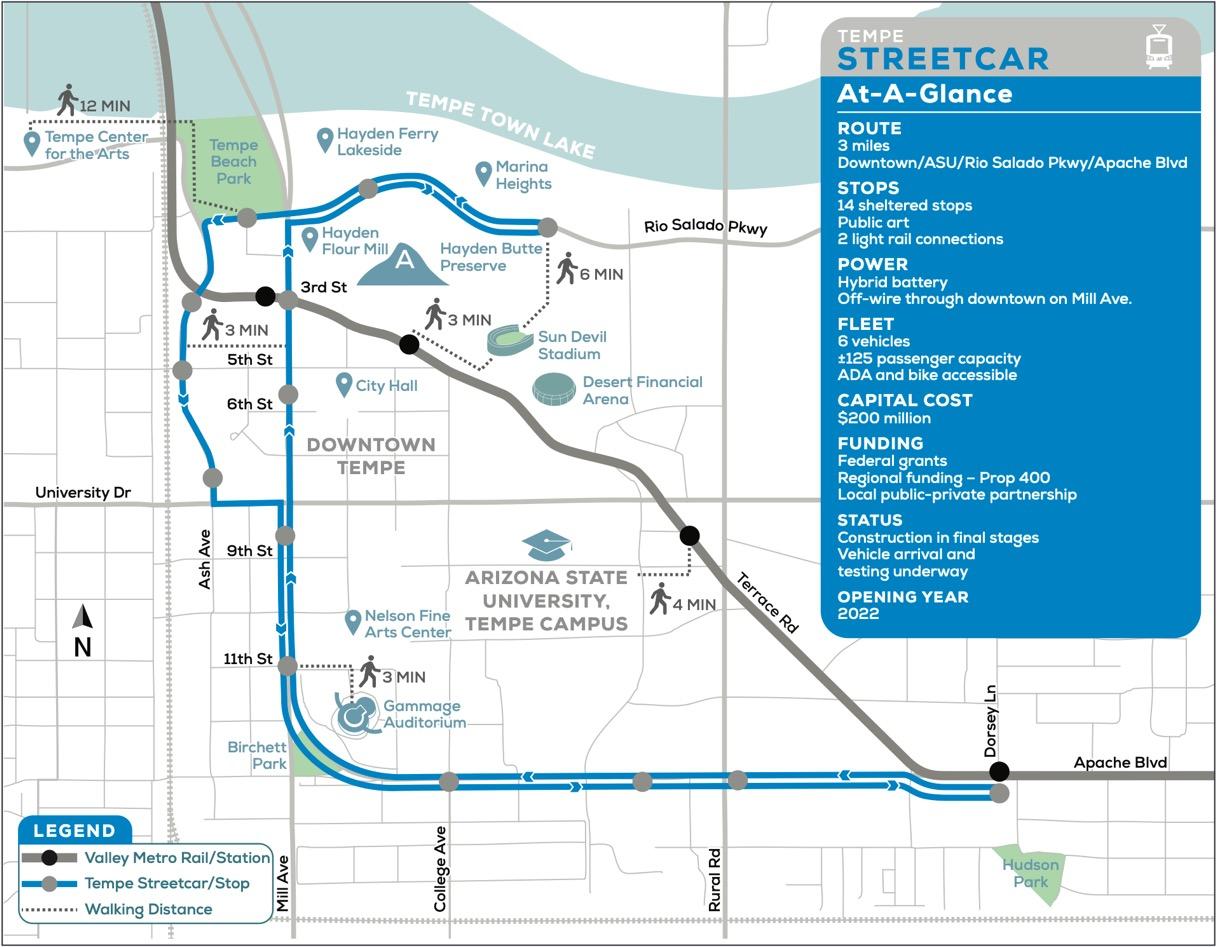
From July 15 to August 15, 2022, there were over 25,900 total boardings. These numbers are expected to increase as Arizona State University (ASU) returns to session and temperatures drop. Serving the population around ASU and Downtown Tempe, the Tempe Streetcar connects residents and travelers to key commercial, retail, educational, and recreational destinations and is fare-free for its first year.
25,000+ BOARDINGS


Tempe’s streetcar system is state of the art, but did you know the first streetcar system in the Valley began operation way back in 1888! The Phoenix Street Railway provided streetcar service until the last line was shutdown in 1948.
Drivers need the flexibility that independent contracting provides
87% work or are students in addition to engaging in app-based work.
67% have a job or are looking for a job outside of app-based work.
16% own a business in addition to driving on the Lyft platform.
Drivers choose app-based work because it works for them
Drivers can drive...
…WHEN
50% routinely provide care for family members or other loved ones.
12% are students.
95% say a flexible schedule is very or extremely important.
Drivers want to maintain their independence
91% support a policy proposal under which drivers would remain independent contractors, maintain the current flexibility they enjoy, and be given some, but not all, of the benefits that employees receive.
Almost 8 times as likely to prefer a work arrangement that includes both flexibility and benefits than they are to prefer being an employee.
22% aged 55 and over.
9% members of the LGBTQ+ community.
22% speak a language other than English at home.
74% would stop driving with app-based platforms if they lost their independence.
26% female.
14% veterans of the U.S. armed forces.
14% retired.
43% take breaks of at least 4 consecutive weeks in 2022, and then return to driving.
93% drive fewer than 20 hours per week.
15% drive in more than 1 metro area.
59% work on other app-based platforms.
And can cash out when they want.
70% use Lyft’s Express Pay feature, which allows drivers to cash out their earnings immediately rather than wait for payday.
54% members of a community of color.1
28% Hispanic or Latin American.
6% Asian, Asian American, Native Hawaiian, or Pacific Islander.
4% Native American, Alaskan Native, First Nation, Indigenous, or Métis.
15% Black, African American, or Afro-Caribbean.
2% Middle Eastern, Arab, or Persian.
73% of riders living with a disability say that Lyft has increased their independence.
93% of riders living with a disability say that Lyft has increased their access to transportation.
Lower-income riders are significantly more likely than higher-income riders to use Lyft to find transportation…
2x...for their work commute — more than twice as likely.
7x...for their school commute — over 7 times as likely.
6x...to go to job interviews — almost 6 times as likely.
3x...for healthcare-related trips — over 3 times as likely.
50%...to run errands — 50% more likely.
50% of rides start or end in lowincome areas. 31%
92% of riders say that Lyft increases access to transportation in their communities.
41% of riders are more likely to attend community events as a result of using the Lyft platform.
42% of riders explore more areas of their cities as a result of using the Lyft platform.
64% of riders use Lyft to find a rideshare driver when they are planning to drink alcohol or use another substance that could impair driving ability.
28%
of riders who have access to a personal vehicle use that car less because of Lyft and other ridesharing services.
40% members of a community of color.2
25% Hispanic or Latin American.
6% Asian, Asian American, Native Hawaiian, or Pacific Islander.
3% Native American, Alaskan Native, First Nation, Indigenous, or Métis.
THE LYFT PLATFORM IS A CRITICAL PART OF THE TRANSPORTATION ECOSYSTEM
43%
of riders have used a Lyft service to get to or from public transit.
25% of riders have used Lyft to get around when public transit does not operate.
8% Black, African American, or Afro-Caribbean.
-% Middle Eastern, Arab, or Persian.
62% of riders have used Lyft to get to or from an airport.
10% of rides on the platform are late-night rides, when public transit services are often limited or unavailable.
12% members of the LGBTQ+ community.
15% students.
41% aged 18 to 34, part of the age group (16 to 34) involved in nearly half of alcohol-involved fatal crashes in the U.S. in which the driver was over the legal limit (0.08).3
A bank is more than just products and services. At Comerica, we believe corporate values are bigger than account features.
That’s why diversity, equity and inclusion are embedded in our business strategy, celebrated among our colleagues, and extended to our community and business partners. That’s how we’re raising expectations of what a bank can be.

• LOW INCOME AND LOW INCOME/NONWHITE COMMUNITIES IN THE U.S. ARE DRASTICALLY MORE NATURE-DEPRIVED THAN OTHER INCOME GROUPS
• NONWHITE AND NONWHITE/LOW INCOME FAMILIES WITH CHILDREN IN THE U.S. ARE MORE NATURE DEPRIVED THAN OTHER FAMILIES
• COMMUNITIES OF COLOR IN ARIZONA ARE MORE NATURE-DEPRIVED THAN WHITE COUNTERPARTS
• IN 2021, THERE WAS A RISE IN NATIONAL PARK VISITS BOTH STATEWIDE AND NATIONALLY
• NEARLY ONE-THIRD OF U.S. OUTDOOR PARTICIPANTS IN 2021 MADE AN AVERAGE ANNUAL INCOME OF $100K OR MORE
• IN 2021, ONLY 51% OF U.S. HISPANICS PARTICIPATED IN OUTDOOR RECREATION OR IN AN OUTDOOR ACTIVITY
• 2021 LATINX CAMPING FAST FACTS
• THERE CONTINUES TO BE A STEADY INCREASE IN THE ANNUAL NUMBER OF HISPANIC CAMPING HOUSEHOLDS
• IN 2021, HISPANICS IN ARIZONA PARTICIPATED THE LEAST IN SOME FORM OF PHYSICAL ACTIVITY OR EXERCISE
• THERE WAS A DECLINE IN REGULAR SPORTS PARTICIPATION FOR U.S. HISPANIC CHILDREN AGED 13-17 BETWEEN 2012 AND 2021
Univision Communications explores the relationship of the Hispanic population in the Phoenix and Tucson markets to entertainment and theme parks
The Boys & Girls Clubs of the Valley (BGCAZ) helps parents with affordable and reliable childcare and gives local kids a safe place to grow
BY MARCIA MINTZ
The Arizona Office of Tourism looks at the economic benefits of visitors to our state
2022 was a year full of major announcements and openings, plus crucial improvements to local parks, trails and services
The Outdoor Foundation and the Outdoor Industry Association report that there has been an increase in participation each of the last eight years
LOW INCOME AND LOW INCOME/ NONWHITE COMMUNITIES IN THE U.S. ARE DRASTICALLY MORE NATURE-DEPRIVED THAN OTHER INCOME GROUPS
*NOTE: Communities are considered nature deprived if their census tract has a higher proportion of natural area lost to human activities than the state-level median. Low income is defined as a median household income less than or equal to the 10th percentile of median income at the census tract level across the state. High income is greater than or equal to the 90th percentile. Moderate income falls between the 10th and 90th percentile.
IN THE U.S. LIVING IN A NATURE-DEPRIVED AREA* BY SELECT DEMOGRAPHICS (2017)
FAMILIES
WITH
36%
39%
NONWHITE FAMILIES WI T H CHILDREN
LOW - INCOME FAMILIES WITH CHILDREN
NONWHITE, LOW - INCOME FAMILIES WITH CHILDREN
65%
Source: The Center for American Progress, "The Nature Gap: Confronting Racial and Economic Disparities in the Destruction and Protection of Nature in America," Jenny Rowland-Shea, Sahir Doshi, Shanna Edberg and Robert Fanger, July 21, 2020 www.americanprogress.org/article/the-nature-gap/


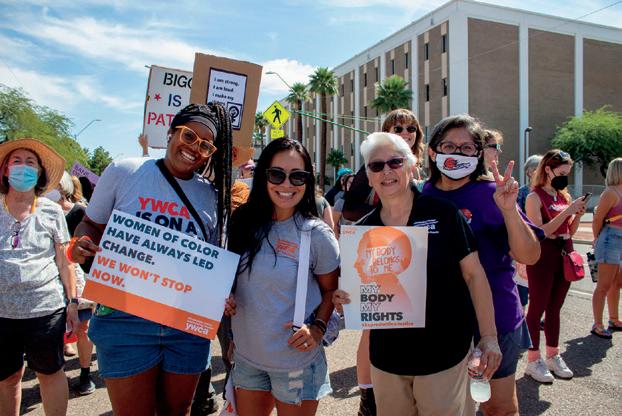
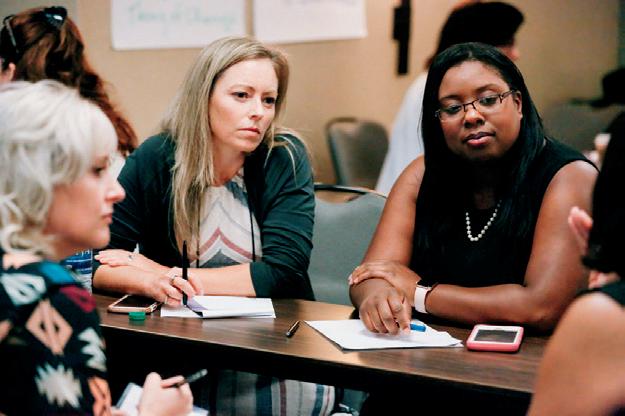


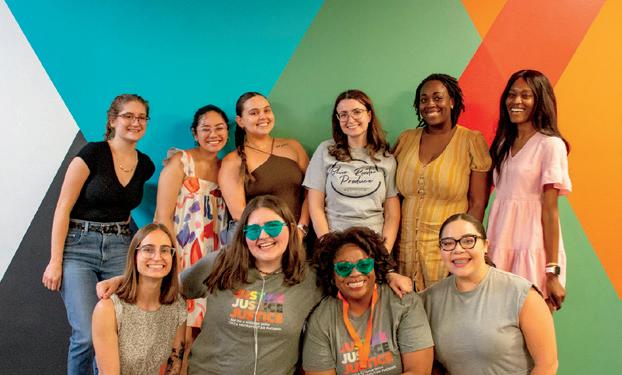

Boys & Girls Clubs of the Valley (BGCAZ) plays a vital role in the lives of Arizona youth: The club empowers young people, especially those who need us most, to reach their full potential as productive, caring, responsible members of the community. One of the ways BGCAZ is helping local families is by addressing Arizona’s childcare challenges by offering affordable and reliable childcare services. Its contributions extend beyond individual families, positively affecting the economy and creating a better future for the community at large.

Arizona is grappling with a significant childcare issue, as nearly half of its residents find themselves residing where quality childcare services are scarce. National and regional workforce trends, as reported by the U.S. Bureau of Labor Statistics, reveal an increase in the rate of employee absenteeism due to childcare challenges since the onset of the COVID-19 pandemic in 2020. Too many Arizonans face an increasingly difficult choice between childcare and work.
BGCAZ bridges this gap by offering high-quality, affordable and reliable childcare in 30 clubs around the Valley. Children ages 5—18 can attend afterschool and summer programs led by caring adults that include academic enrichment, arts, sports and meals.
AZYouthforce, a signature program of BGCAZ, trains and connects Valley teens (ages 16—19) to paid internships in diverse sectors. Current internship partners include Bank of America, Footprint Center and Jiffy Lube. For future business owners, BGCAZ offers the Bayless Entrepreneurship program where teens develop and pitch a business plan with the possibility of winning seed money to start their business.
AZYouthforce creates equity for teens by connecting them to paid internships, providing a workforce coach and sustained mentoring to help teens secure jobs and develop their workplace skills and resilience.
Research conducted by Arizona State University’s Seidman Research Institute, the consultancy arm of the W.P. Carey School of Business and generously funded by the Steele Foundation, quantified the large-scale social impact that BGCAZ has had on the local economy. The study measured the short- and long-term social return on investment for our community, working parents and club members.
The positive social impact generated by BGCAZ translates to a remarkable social return of $15.60 for every dollar invested.
Every $1 invested in Boys & Girls Clubs of the Valley generates $15.60 in positive economic benefits to the community.
—bgcaz.org/economicimpact
BGCAZ MEETS THE MOMENT WITH QUALITY CHILDCARE AND SO MUCH MORE

BENEFIT TYPE
Higher Graduation Rates and Lifetime Earnings (40 Years)
Lower Teen Pregnancy & Motherhood Rates (Lifetime)
Annual Lower Underage Drinking Savings
Lifetime Nonsmoker Savings
Lower Marijuana Addict Savings (10 Years)
Annual Juvenile Crime Savings
Lifetime Food Security Benefits
Lifetime Enhanced Physical Activity Benefit
Annual Working Parent Benefit
Annual Economic Impact of BGCAZ Operations & Capital Expenditure
TOTAL VALUE OF BENEFITS
TOTAL 2020-2021 COSTS ESTIMATED RETURN ON INVESTMENT
MONETARY VALUE (2021)
TO $3,893,600
Specific program benefits that were measured include: nonsmoker savings, annual juvenile crime savings, lower teen pregnancy rates and higher graduation rates.
Marcia Mintz is CEO and president of the Boys & Girls Clubs of the Valley, Phoenix.


In 2022, the future of Phoenix Parks and Recreation was set as the department laid the groundwork for a proactive and productive decade. As the department looks forward to the master plan, which will serve as the department’s guide in years to come, 2022 was full of major announcements and openings, as well as crucial improvements to neighborhood parks, trails and services that impact hundreds of thousands of residents every single day.

Parks and Recreation made incredible progress on the Cesar Chavez Community Center, which will be a marquee grand opening event in early 2023. We welcomed back hikers to Camelback Mountain’s newly realigned and improved Cholla Trail. Our award-winning Aquatics team embarked on a robust marketing campaign to hire lifeguards while welcoming thousands of swimmers to Phoenix pools this summer. At community recreation centers, staff managed the return to full capacity and our community responded with smiles from kids and families of all ages! South Mountain regained a crucial education resource with the reopening of the South Mountain Environmental Education Center, complete with the support of Arizona tribal leaders. In September, thousands of parks and recreation professionals from the across the country experienced the incredible amenities of Phoenix for the National Recreationand and Parks Association National Conference, hosted in downtown Phoenix. These major accomplishments are complemented by a year of hard work by staff, who upgraded dozens of playgrounds across every City Council district.
Looking forward to 2023, Phoenix’s robust parks and recreation amenities will be put to good use as we welcome Super Bowl LVII in February 2023. Margaret T. Hance Park has been selected to be the hub for the week-long fan festival ahead of the Super Bowl and will be showing off a brand-new garden oasis to visitors from around the globe! After two years of closures and limitations, the Phoenix Parks and Recreation Department was able to fully stretch its wings once again and serve the residents of Phoenix in new and innovative ways!
$137,593,365

Total annual operating budget for fiscal year 2022-23
1,354 Total # of full and part-time employees
1,500 trees

The outdoor recreation participant base grew 2.3% in 2022 to a record 168.1 million participants or 55% of the U.S. population ages 6 and older. The outdoor recreation participant base has grown each of the last eight years, adding 14.5 million participants since January 2020. Although 2022 outdoor recreation included record numbers of participants and participation rates, the number of outings per participant declined in 2022 for the first time since the pandemic began in 2020.
We saw continued growth in the number of Americans who participate in outdoor recreation, even as prepandemic routines are reestablished, indicating that outdoor recreation is effectively engaging participants gained over the past three years, but they participate less frequently than earlier cohorts did. The participant base is becoming more diverse across ethnicity/race, education, and age. The data reveals a stable outdoor recreation participant base with key opportunities in demographic segments showing significant growth.
About this report: For over 15 years, the Outdoor Participation Trends Report has served as the most trusted and comprehensive source of insights and narratives around who’s doing what, when, and how outdoors. The Outdoor Foundation, the philanthropic arm of Outdoor Industry Association, funds the research that produces the Annual Outdoor Participation Trends Report and publishes the findings in partnership with OIA every year.
We’re here to focus health care where it belongs: on you.
You deserve the kind of care that goes beyond a chart or a prescription. It’s the kind of care that covers everything you need to live your healthiest life, including support from a whole team of doctors, nurses, and specialists to keep you feeling good. And it’s care that gives you all the benefits of a nationally recognized health care company—including the latest science and technology—with a hometown, personal touch.

Count on all of us to care for all of you, in all the ways you need.
optum.com/AZ
• THERE CONTINUES TO BE A STEADY INCREASE IN THE ANNUAL NUMBER OF PEDESTRIAN FATALITIES IN THE U.S.
• NATIVE AMERICANS AND BLACK OR AFRICAN AMERICANS WERE AFFECTED MOST BY PEDESTRIAN DEATHS IN THE U.S. FROM 2016 TO 2020
• ARIZONA RANKED AS THE 4TH MOST DANGEROUS STATE FOR PEDESTRIANS FROM 2016 TO 2020
• TUCSON WAS THE ONLY ARIZONA CITY IN THE TOP 20 MOST DANGEROUS U.S. METRO AREAS FOR PEDESTRIANS FROM 2016 TO 2020
• THE TOP 5 MOST WALKABLE CITIES IN ARIZONA ARE SOMEWHAT WALKABLE OR CAR-DEPENDENT
• ARIZONA’S TOP 5 CITIES WITH THE BEST TRANSIT OPTIONS STILL ONLY OFFER “SOME TRANSIT”
• TEMPE IS THE ONLY ARIZONA CITY THAT RANKS AS “VERY BIKEABLE”
• HOMELESSNESS IN ARIZONA
• GILBERT AND CHANDLER ARE THE ARIZONA CITIES CLOSEST TO ACHIEVING TREE EQUITY
• WHAT IS A HEAT ISLAND?
• ARIZONA IS PROJECTED TO HAVE THE 13TH LARGEST CHANGE IN STATE COOLING COSTS
Fernando Monarrez and Serastar Technologies are using technology to tackle our community’s greatest challenges
BY PAUL PADILLA
The Arizona Department of Economic Security reports that the number of people experiencing homelessness in Arizona has increased nearly 25% since 2020
The University of Wisconsin’s Population Health Institute at the School of Medicine and Public Health focused this year on the connection between civic health and thriving people and places
This report, from The Maricopa Association of Governments (MAG), is a one-time snapshot of homelessness that is limited by weather conditions, number and training of volunteers, self-reported survey responses and other factors
THERE CONTINUES TO BE A STEADY INCREASE IN THE ANNUAL NUMBER OF PEDESTRIAN FATALITIES IN THE U.S.
*NOTE: This estimate for 2021 is produced by applying the 11.5 percent increase for 2021 projected by the Governors Highway Safety Association (GHSA) to the federal Fatality Analysis Reporting System (FARS) data for 2020.
U.S. PEDESTRIAN DEATHS PER 100,000 BY RACE & ETHNICITY
NATIVE AMERICANS AND BLACK OR AFRICAN AMERICANS WERE AFFECTED MOST BY PEDESTRIAN DEATHS IN THE U.S. FROM 2016 TO 2020
NOTE: 11 percent of all pedestrian fatalities examined failed to report race or ethnicity.
Source: Smart Growth America and The National Complete Streets Coalition, Dangerous By Design, July 2022 smartgrowthamerica.org/dangerous-by-design/
(2016—2020)
ARIZONA RANKED AS THE 4TH MOST DANGEROUS STATE FOR PEDESTRIANS FROM 2016 TO 2020
WALKER’S PARADISE: DAILY ERRANDS DO NOT REQUIRE A CAR
VERY WALKABLE: MOST ERRANDS CAN BE ACCOMPLISHED ON FOOT
SOMEWHAT WALKABLE: SOME ERRANDS CAN BE ACCOMPLISHED ON FOOT
CAR-DEPENDENT: MOST ERRANDS REQUIRE A CAR
CAR-DEPENDENT: ALMOST ALL ERRANDS REQUIRE A CAR
RIDER’S PARADISE: WORLD-CLASS PUBLIC TRANSPORTATION
EXCELLENT TRANSIT: TRANSIT IS CONVENIENT FOR MOST TRIPS
GOOD TRANSIT: MANY NEARBY PUBLIC TRANSPORTATION OPTIONS
SOME TRANSIT: A FEW NEARBY PUBLIC TRANSPORTATION OPTIONS
MINIMAL TRANSIT: IT IS POSSIBLE TO GET ON A BUS
THE TOP 5 MOST WALKABLE CITIES IN ARIZONA ARE SOMEWHAT WALKABLE OR CARDEPENDENT
THE TOP 5 MOST TRANSIT-FRIENDLY CITIES IN ARIZONA
ARIZONA’S TOP 5 CITIES WITH THE BEST TRANSIT OPTIONS STILL ONLY OFFER “SOME TRANSIT”
BIKER’S PARADISE: DAILY ERRANDS CAN BE ACCOMPLISHED ON A BIKE
VERY BIKEABLE: BIKING IS CONVENIENT FOR MOST TRIPS
BIKEABLE: SOME BIKE INFRASTRUCTURE
SOMEWHAT BIKEABLE: MINIMAL BIKE INFRASTRUCTURE
Source: Walk Score, Cities in Arizona www.walkscore.com/AZ/
10,707
PEOPLE EXPERIENCED HOMELESSNESS AN ESTIMATED TOTAL OF 13,553 WERE INDIVIDUALS
2,846 917 857
2,476 40.8% 59.2% 18.6
NOTES:
WERE PEOPLE IN FAMILIES WITH CHILDREN WERE UNACCOMPANIED HOMELESS YOUTH WERE VETERANS
WERE CHRONICALLY HOMELESS INDIVIDUALS
WERE SHELTERED* (5,526)
WERE UNSHELTERED** (8,027)
IN EVERY 10,000 PEOPLE WERE EXPERIENCING HOMELESSNESS
THE HOMELESS POPULATION DECREASED BY 7.5%
THE HOMELESS POPULATION INCREASED BY 23.4%
*Sheltered Homelessness refers to people who are staying in emergency shelters, transitional housing programs, or safe havens.
**Unsheltered Homelessness refers to people whose primary nighttime location is a public or private place not designated for, or ordinarily used as, a regular sleeping accommodation for people (for example, the streets, vehicles, or parks).
Source: The U.S. Department of Housing and Urban Development, The 2022 Annual Homelessness Assessment Report (AHAR) to Congress, Part 1: Point-in-time Estimates of Homelessness, Tanya de Sousa, Alyssa Andrichik, Marissa Cuellar, Jhenelle Marson, Ed Prestera and Katherine Rush, December 2022 www.huduser.gov/portal/sites/default/files/pdf/2022-AHAR-Part-1.pdf
THE TOP 5 MOST BIKEABLE CITIES IN ARIZONA
TEMPE IS THE ONLY ARIZONA CITY THAT RANKS AS “VERY BIKEABLE”
“Heat islands are zones of relative warmth created by urban air and surface temperatures that are higher than those of nearby rural areas. Air temperatures in a large city can be 2—22º F (1—12º C) higher than its rural surroundings . . . Heat islands are responsible for 5—10 percent of summertime electricity demand, leading to higher electricity bills, pressure on the electricity grid and brownouts and blackouts.” —The
AND CHANDLER ARE THE ARIZONA CITIES CLOSEST TO ACHIEVING TREE EQUITY
*NOTE: Historical residential and commercial data were used on the average cost of electricity by state from 1990 to current day provided by the EIA. To calculate a base level energy cost, the average of the months of June to September for the past five years is used.
Source: First Street Foundation, The 6th National Risk Assessment, Hazardous Heat, August 15, 2022
BY PAUL PADILLA
Fernando Monarrez lives by a simple personal mantra: “Help Latinos think on a much bigger scale than we’re thinking right now.”
Monarrez is constantly involved in projects that tackle some of our community’s greatest challenges and uses technology to tackle them. He currently is the chief strategy officer for Serastar Technologies Corp., which developed and patented the world’s first tactical on-the-move H.265 video streaming platform that delivers secure video, voice over internet protocol (VOIP) and keylength-value (KLV) metadata. The company, based in Mesa, AZ, was founded in 2015 when the Department of Homeland Security’s Border Patrol needed a camera that could be mounted on a Leopold Mark 4 spotting scope. After that was built, they asked the company if it could digitize and stream the camera feed.
The impact of the company’s work reaches all corners of the globe, from local counties in Arizona to foreign countries worldwide.
One current project is in Yuma, AZ, where Serastar Technologies is working with the Yuma City Council, Yuma 50, Allo Communications and local agriculture companies to set up wireless connectivity for the vital agricultural sector and the surrounding community. Specifically, the goal in Yuma is to set up the largest broadband connectivity for the largest automation system in agriculture. According to Monarrez, this will be a game-changer because “it will increase their yield and efficiency, so they will be able to monitor everything remotely. When it comes to mineral density in the soil…if it’s too dry, too wet here, they’ll be able to adjust [based on that information.”
Water conservation is another issue Serastar Technologies is addressing. The company is working on leveraging graphene to

desalinate water. According to Monarrez, graphene presents a ton of wide-ranging opportunities. For example, he says, graphenereinforced concrete is being used in the United Kingdom instead of traditional concrete, resulting in a material that is stronger and more sustainable. Graphene can also be transformative when it comes to powering both electric vehicles and smartphones. Graphene batteries charge quicker, power devices for a longer period and are safer and more environmentally friendly than lithium-ion batteries.
A synthetic graphene, Monarrez says, would simply be a much better alternative to lithium-ion that could lead to batteries with a density that is 233 times that of lithium. Then, he says, it would be possible for an electric vehicle to go more than 1000 miles on a single charge and a vehicle owner could fully charge their vehicle in under five minutes.
That kind of change will certainly revolutionize the electric vehicle industry. Right now, many consumers are hesitant to buy an electric vehicle for two specific reasons: the low driving range from each charge and slow charging times.
The impact Serastar Technologies is having stretches well beyond the U.S. borders—all the way to Panama and Ukraine. In Panama,
the company is currently working with the government to provide “white space internet” capability for the entire country. White space internet is unique because, unlike fixed wireless or satellite, it does not require a line of sight, which means that its signals can easily pass through physical obstructions such as Panama’s mountainous regions. With this emerging technology, people in Panama’s rural regions will not lose their internet signal and can have service similar to their urban neighbors.
In Ukraine, Serastar Technologies is using its technological prowess and connections to help save lives during Ukraine’s ongoing conflict with Russia. According to Monarrez, “40% of the [Ukrainian] farmland is covered in land mines.” This is a huge problem, he says, because the country is also the breadbasket of Europe and different parts of Africa. If a solution cannot be found, he warns, “millions of people might starve to death.”
In collaboration with the Phoenix Committee on Foreign Relations, the International Trade Agency and the Ukraine Ministry of Defense, the company was asked to come up with a solution to this critical problem. With the help of a friend, two amazing solutions are currently in the works: quantum light detection and ranging (lidar) and explosive ordnance disposable (EOD) robots.
Quantum lidar uses laser light sent from a source and reflected from objects in the scene. The reflected light is then detected by the system receiver and used to develop a distance map of the objects detected. It can penetrate the ground up to 10 feet and provide feedback on its composition. In conjunction with a preloaded library of the land mines, quantum lidar will be able to identify where all the land mines are in the Ukrainian farmlands.
The second solution, EOD robots, can blow up land mines in real time without any physical human involvement. This situation is the first time EOD robots are being deployed anywhere in the world.
Serastar Technologies has also identified international opportunities south of the U.S. border. Monarrez mentioned how Mexico is projected to potentially become the world’s next manufacturing hub. However, he explained, for Mexico to successfully reach this goal, the country must first invest much more in its data infrastructure because current internet connectivity in Mexico is unstable in many areas.
Unfortunately, Monarrez says, Mexico just doesn’t have that many data centers.
“When I visit my family,” he says, “in certain areas, their servers freeze up because of the lack of servers [and] the lack of fiber optic [technology]. The connectivity is just terrible.”
Investing in a solid data infrastructure is critical for Mexico’s future because it will be the foundation that supports Mexico’s expansion in manufacturing.
As a veteran, Monarrez is always looking to do more on a national level to help improve the lives of his fellow Americans. Serastar Technologies wants to be on par with current defense contractors and become the “backbone” of all telecommunications for the Department of Defense and Homeland Security. For example, the company owns all the patents for the next-generation first responder systems. One feature of these state-of-the-art systems that Monarrez is especially proud of is critical real time information sharing.
“You can track and monitor a person’s vitals in real time and you can know their location,” he says. “You also can share the information because its secured and is HIPPA compliant.”
If this technology is installed in an ambulance, he says, paramedics would be able to share important information about a patient with
TECHNOLOGICAL ADVANCEMENTS REALLY CAN CHANGE THE WORLD
[Serastar] owns all the patents for the next-generation first responder systems. One feature of these state-of-the-art systems…is critical real time information sharing.
a hospital. As a result, it would be possible for paramedics to get critical, real time instructions from a doctor. Just imagine how many lives this technology could possibly save, he says.
Serastar Technologies Corp. 4711 E. Falcon Dr., #102 Mesa, AZ 85215 844.782.7788 serastar.com
From TechRepublic White Space, the next internet disruption: 10 things to know techrepublic.com/article/white-space-the-next-internetdisruption-10-things-to-know
From the NSF’s National Ecological Observatory Network The Basics of LiDar — Light Detection and Ranging — Remote Sensing neonscience.org/resources/learning-hub/tutorials/lidar-basics
Monarrez’s strong entrepreneurial mindset motivates him to keep pushing forward, using technology to improve lives. He also wants to motivate young people to pursue entrepreneurship in the technology space, particularly those in the Hispanic community, because he currently sees a gap in the number of Hispanics who are working in the technology sector.
“What are we always told growing up?” he asks rhetorically. “We are always told to take the safe route. Go to school and get a good job.”
Monarrez wants to show the Hispanic community that there are alternate routes to success that can have a profound impact. His best advice to anyone who might want to get involved in technology is to just “start talking to people.” In other words, he says, the best way to get involved is to connect with other people to foster a network of meaningful relationships that can help you find your true passion.
At his core, Monarrez sees himself as a problem solver and a team player who works hard to find solutions to real-world problems. He is willing to work with anybody, he says, who is willing to work with him.
Arizona Town Hall educates, engages, connects and empowers people to resolve important issues through consensus, not division, using a process based on respectful dialogue that values diverse perspectives, builds relationships, and fosters leadership development. In addition to addressing statewide topics indentified by its members, Arizona Town Hall offers professional facilitation and training services to governments, organizations, and businesses.
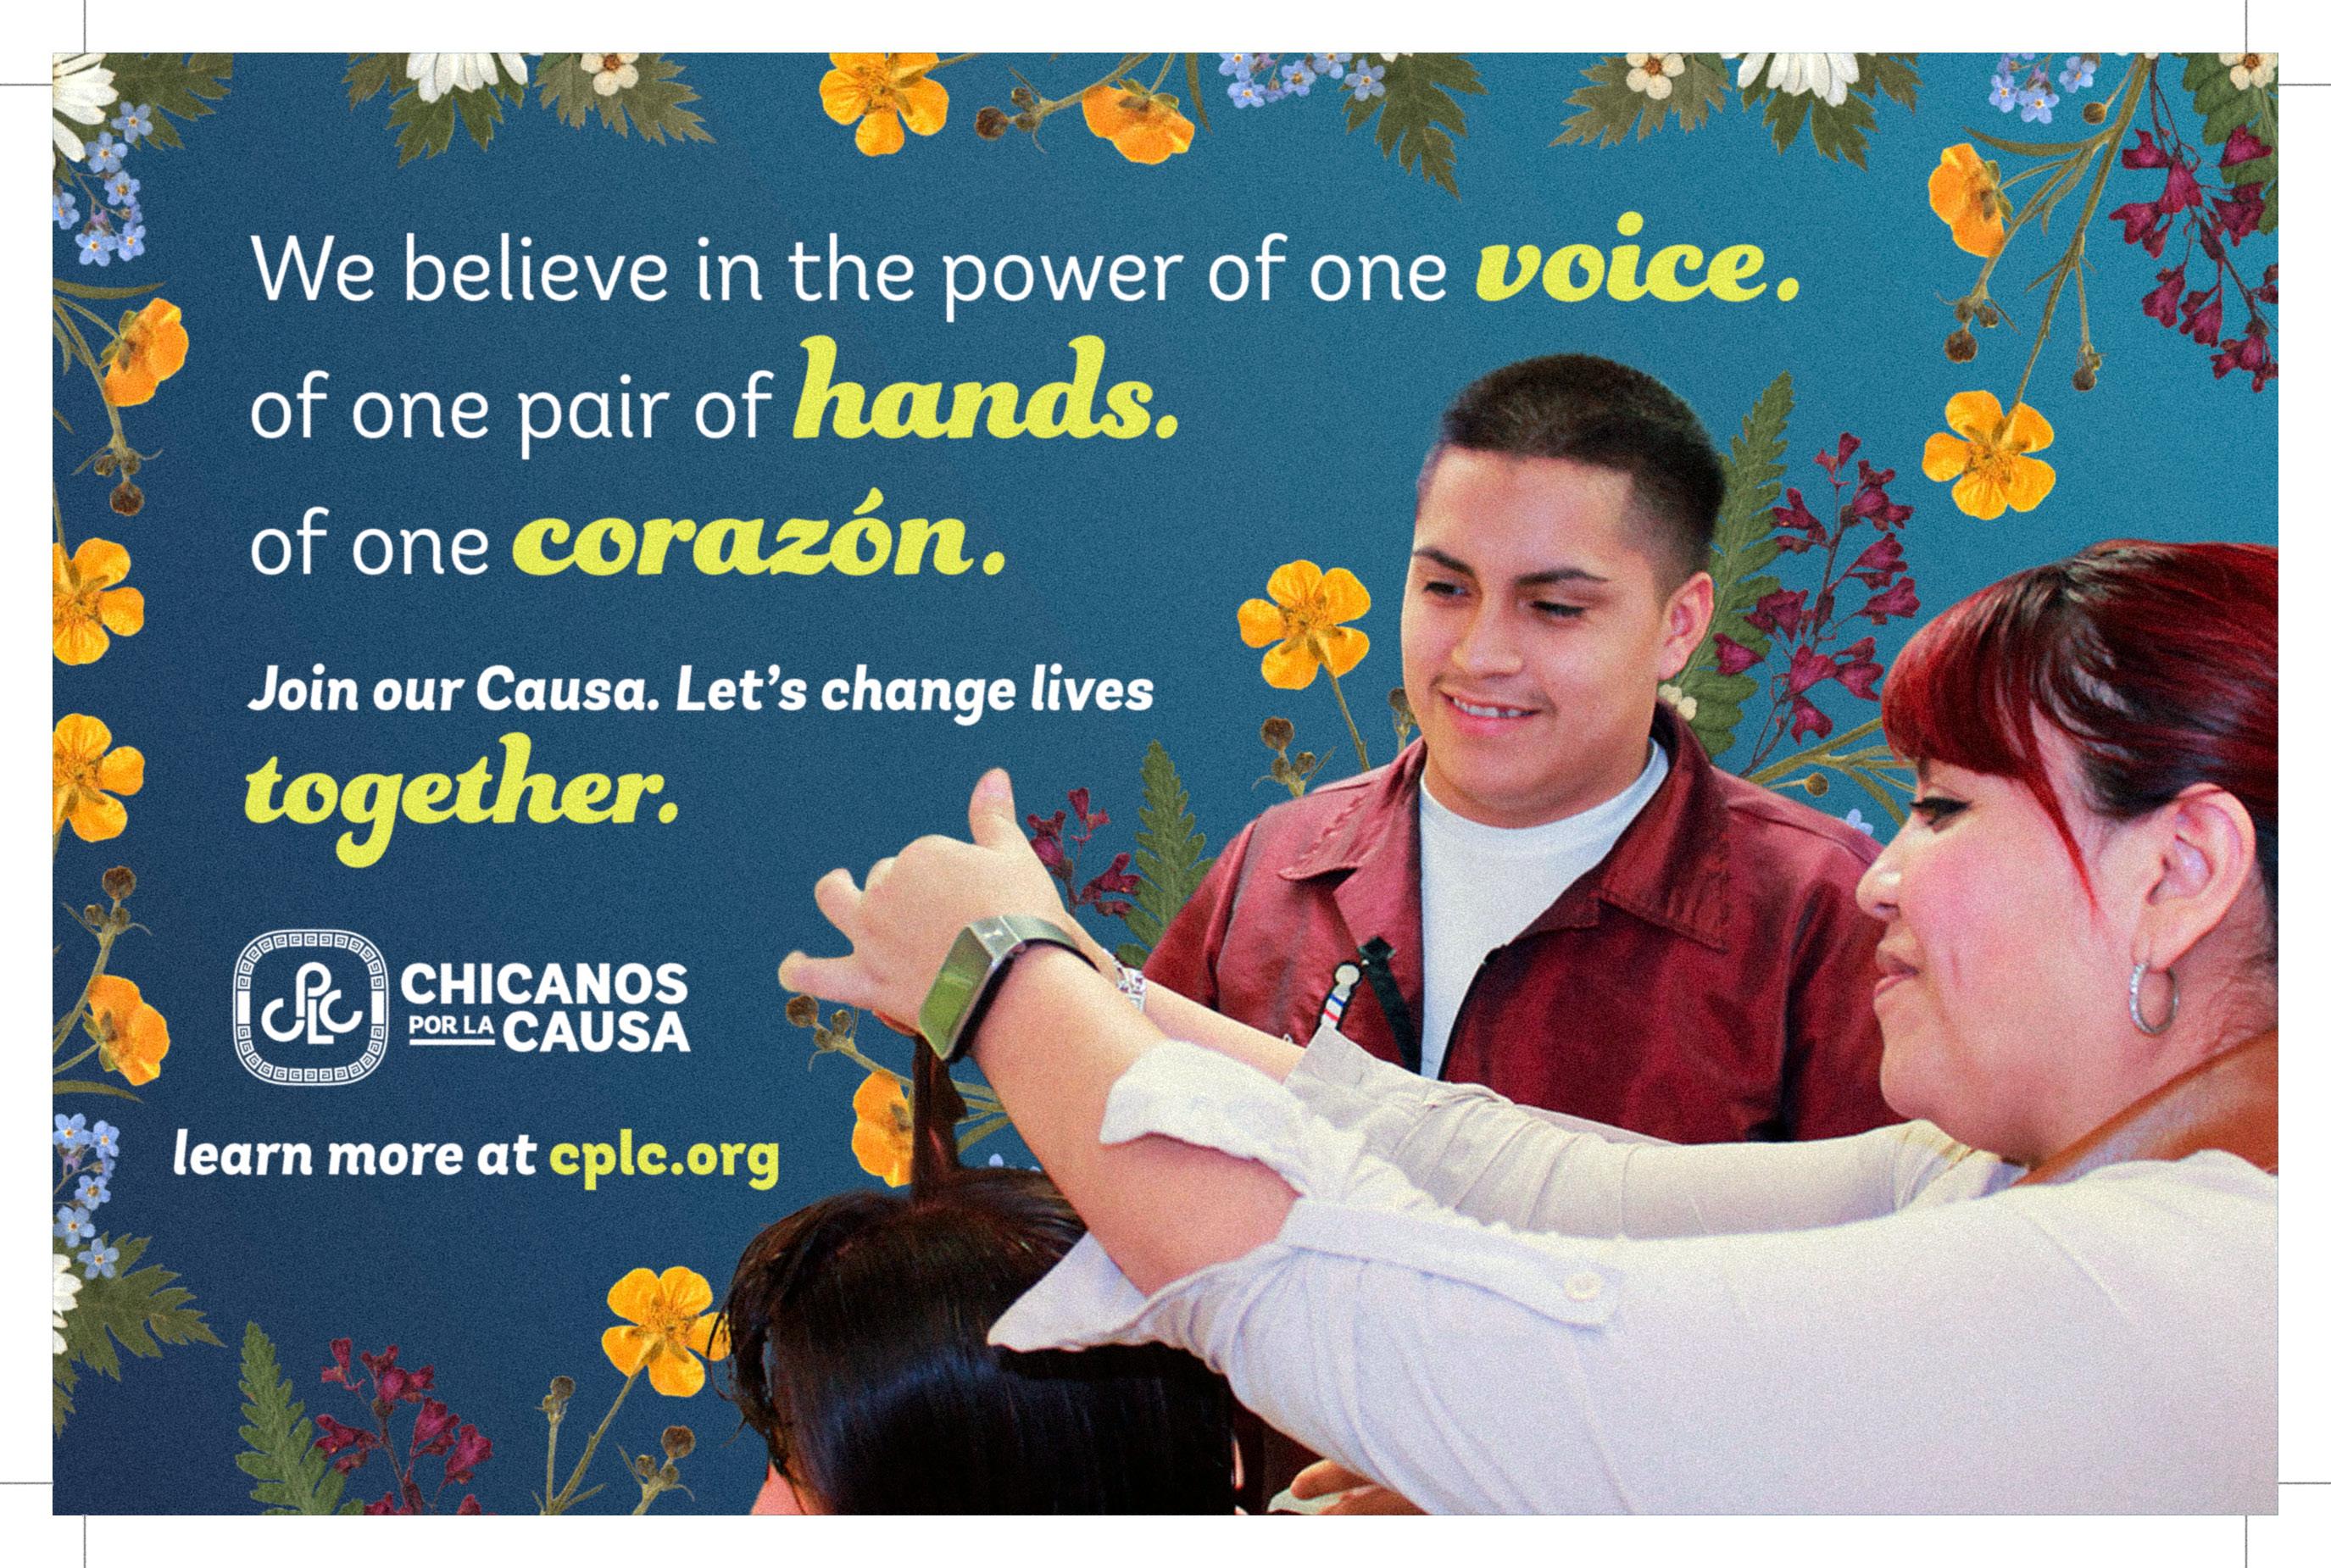
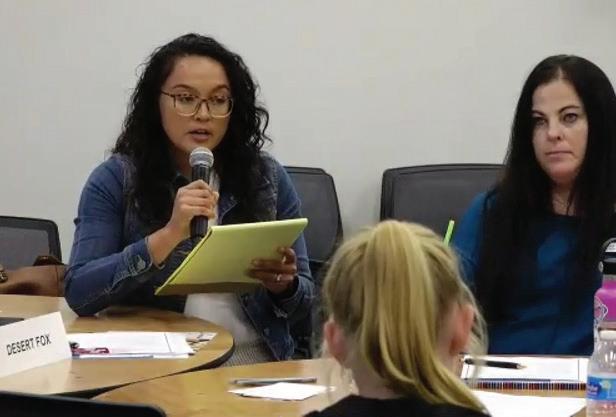
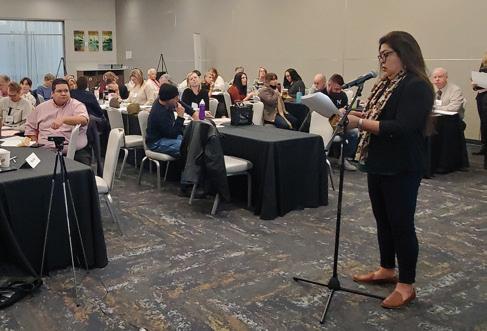
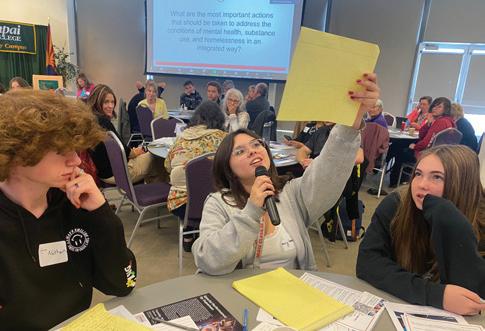
Homelessness in Arizona Annual Report 2022
Arizona Department of Economic Security
December 31, 2022
Pursuant to Arizona Revised Statutes (A.R.S.) § 41-1954 (A) (19) (g), the following Homelessness in Arizona Annual Report provides information about homelessness in Arizona during State Fiscal Year (SFY) 2022, including trends, demographics, and recent efforts designed to prevent and mitigate homelessness in our communities.
Source: Arizona Department of Economic Security, “Homelessness in Arizona Annual Report 2022” (December 31, 2022) des.az.gov/sites/default/files/dl/2022-Homelessness-Annual-Report.pdf?time=1673885268714
Arizona Department of Economic Security | December 2022
As of January 2022, the number of people experiencing homelessness in Arizona was 13,553, an increase of nearly 25% since 2020. The Homeless population has steadily risen in Arizona since 2017, with Unsheltered homelessness increasing by 62% since 2012. Housing insecurity and homelessness are exacerbated by the lack of affordable housing, mental illness, addiction, domestic violence, poverty, and other factors impacting rural and urban communities statewide.
In State Fiscal Year (SFY) 2022, more than 90,000 individuals at-risk of or experiencing homelessness received preventative rental assistance and homeless intervention services. Historically, permanent housing programs like Rapid Rehousing (RRH), Permanent Supportive Housing, and Housing Choice Vouchers have provided the best outcomes for individuals. However, the lack of affordable housing and COVID-19’s negative impact on communal living have limited shelter capacity. These conditions have made it difficult to reach individuals in need effectively. The Department of Economic Security (ADES/Department) continues to partner with other state agencies, local governments, and nonprofits across all 15 counties to implement strategies that assist these individuals with finding housing and regaining and sustaining their independence.
The United States Department of Housing and Urban Development (HUD) defines affordable housing as a permanent dwelling including utilities that a household can obtain for no more than 30 percent or less of its annual income (although this percentage varies slightly by city). Expending more than the 30 percent standard creates living instability as households may then be unable to afford other basic necessities such as food, clothing, transportation, and medical care.
In Arizona and across the nation, affordable housing remains scarce. According to The National Low Income Housing Coalition (NLIHC), there is a national shortage of 7 million affordable rental homes available to extremely low-income renters whose household incomes are below the federal poverty level or 30 percent of their area median income. Evictions and foreclosures have increased across the state of Arizona and nationwide. NLIHC now places Arizona as the 18th highest housing wage in the United States. Housing wage is the hourly wage required to afford a one bedroom rental home. There are currently 193,961 renter households that are extremely low income and a rental shortage of 143,998 units. Seventy-six percent of extremely low-income renter households are also severely cost-burdened, which means they spend more than half of their income on housing. This can cause unstable housing situations and lead to evictions, which have also increased in Arizona. In 2022, working at a minimum wage of $12.80 per hour, an individual would need to work 60 hours to afford a one-bedroom rental home at Fair
Market Rent. According to the NLIHC report, renters in Arizona need to earn an hourly wage of $23.44 to afford a modest two-bedroom housing unit, an increase of $1.14 over last year.1
In response to the COVID-19 pandemic, the federal Consolidated Appropriations Act 2021 and the subsequent American Rescue Plan Act authorized federal funding for emergency rent and utility assistance for households impacted by the pandemic. This funding was allocated directly to states, U.S. territories, local governments, and tribes for administration at the local level. Arizona received more than $880 million of Emergency Rental Assistance (ERA) funding through awards to nine Arizona jurisdictions. Since February 2021, DES has provided more than $200 million in rent and utility assistance to households across the state and has reallocated $194 million to other local jurisdictions with significant demand.
Despite achieving full job recovery since the onset of the pandemic, the rising cost of living and affordable housing shortages have resulted in uncertainty for Arizona’s families. In August 2022, the Phoenix metro area recorded the fourth highest number of evictions in the United States. More than 300 Arizona households across the state apply for rent and utility assistance each day. With average ERA household incomes less than $18,000 per year, these households are paying an average of 83% of their incomes toward rent, placing them at the greatest risk for homelessness.
Arizona’s homeless services are divided into three service areas referred to as Continuums of Care (CoC). The Maricopa Association of Governments leads the CoC that serves Maricopa County The Tucson Pima Collaboration to End Homelessness (TPCH) serves Pima County, and the Balance of State (BOS) continuum serves the remaining 13 counties of the state. HUD requires each CoC to conduct a Point-in-Time (PIT) count of sheltered and unsheltered homeless individuals every year. In 2011, HUD started requiring that the PIT count process include going out into the communities, and interviewing people experiencing homelessness to collect information. Prior to 2011, PIT counts had been conducted by car.
The graph below illustrates the change in the aggregate PIT count year over year. 2021 was not included due to the COVID-19 Pandemic causing an inability to count unsheltered individuals.
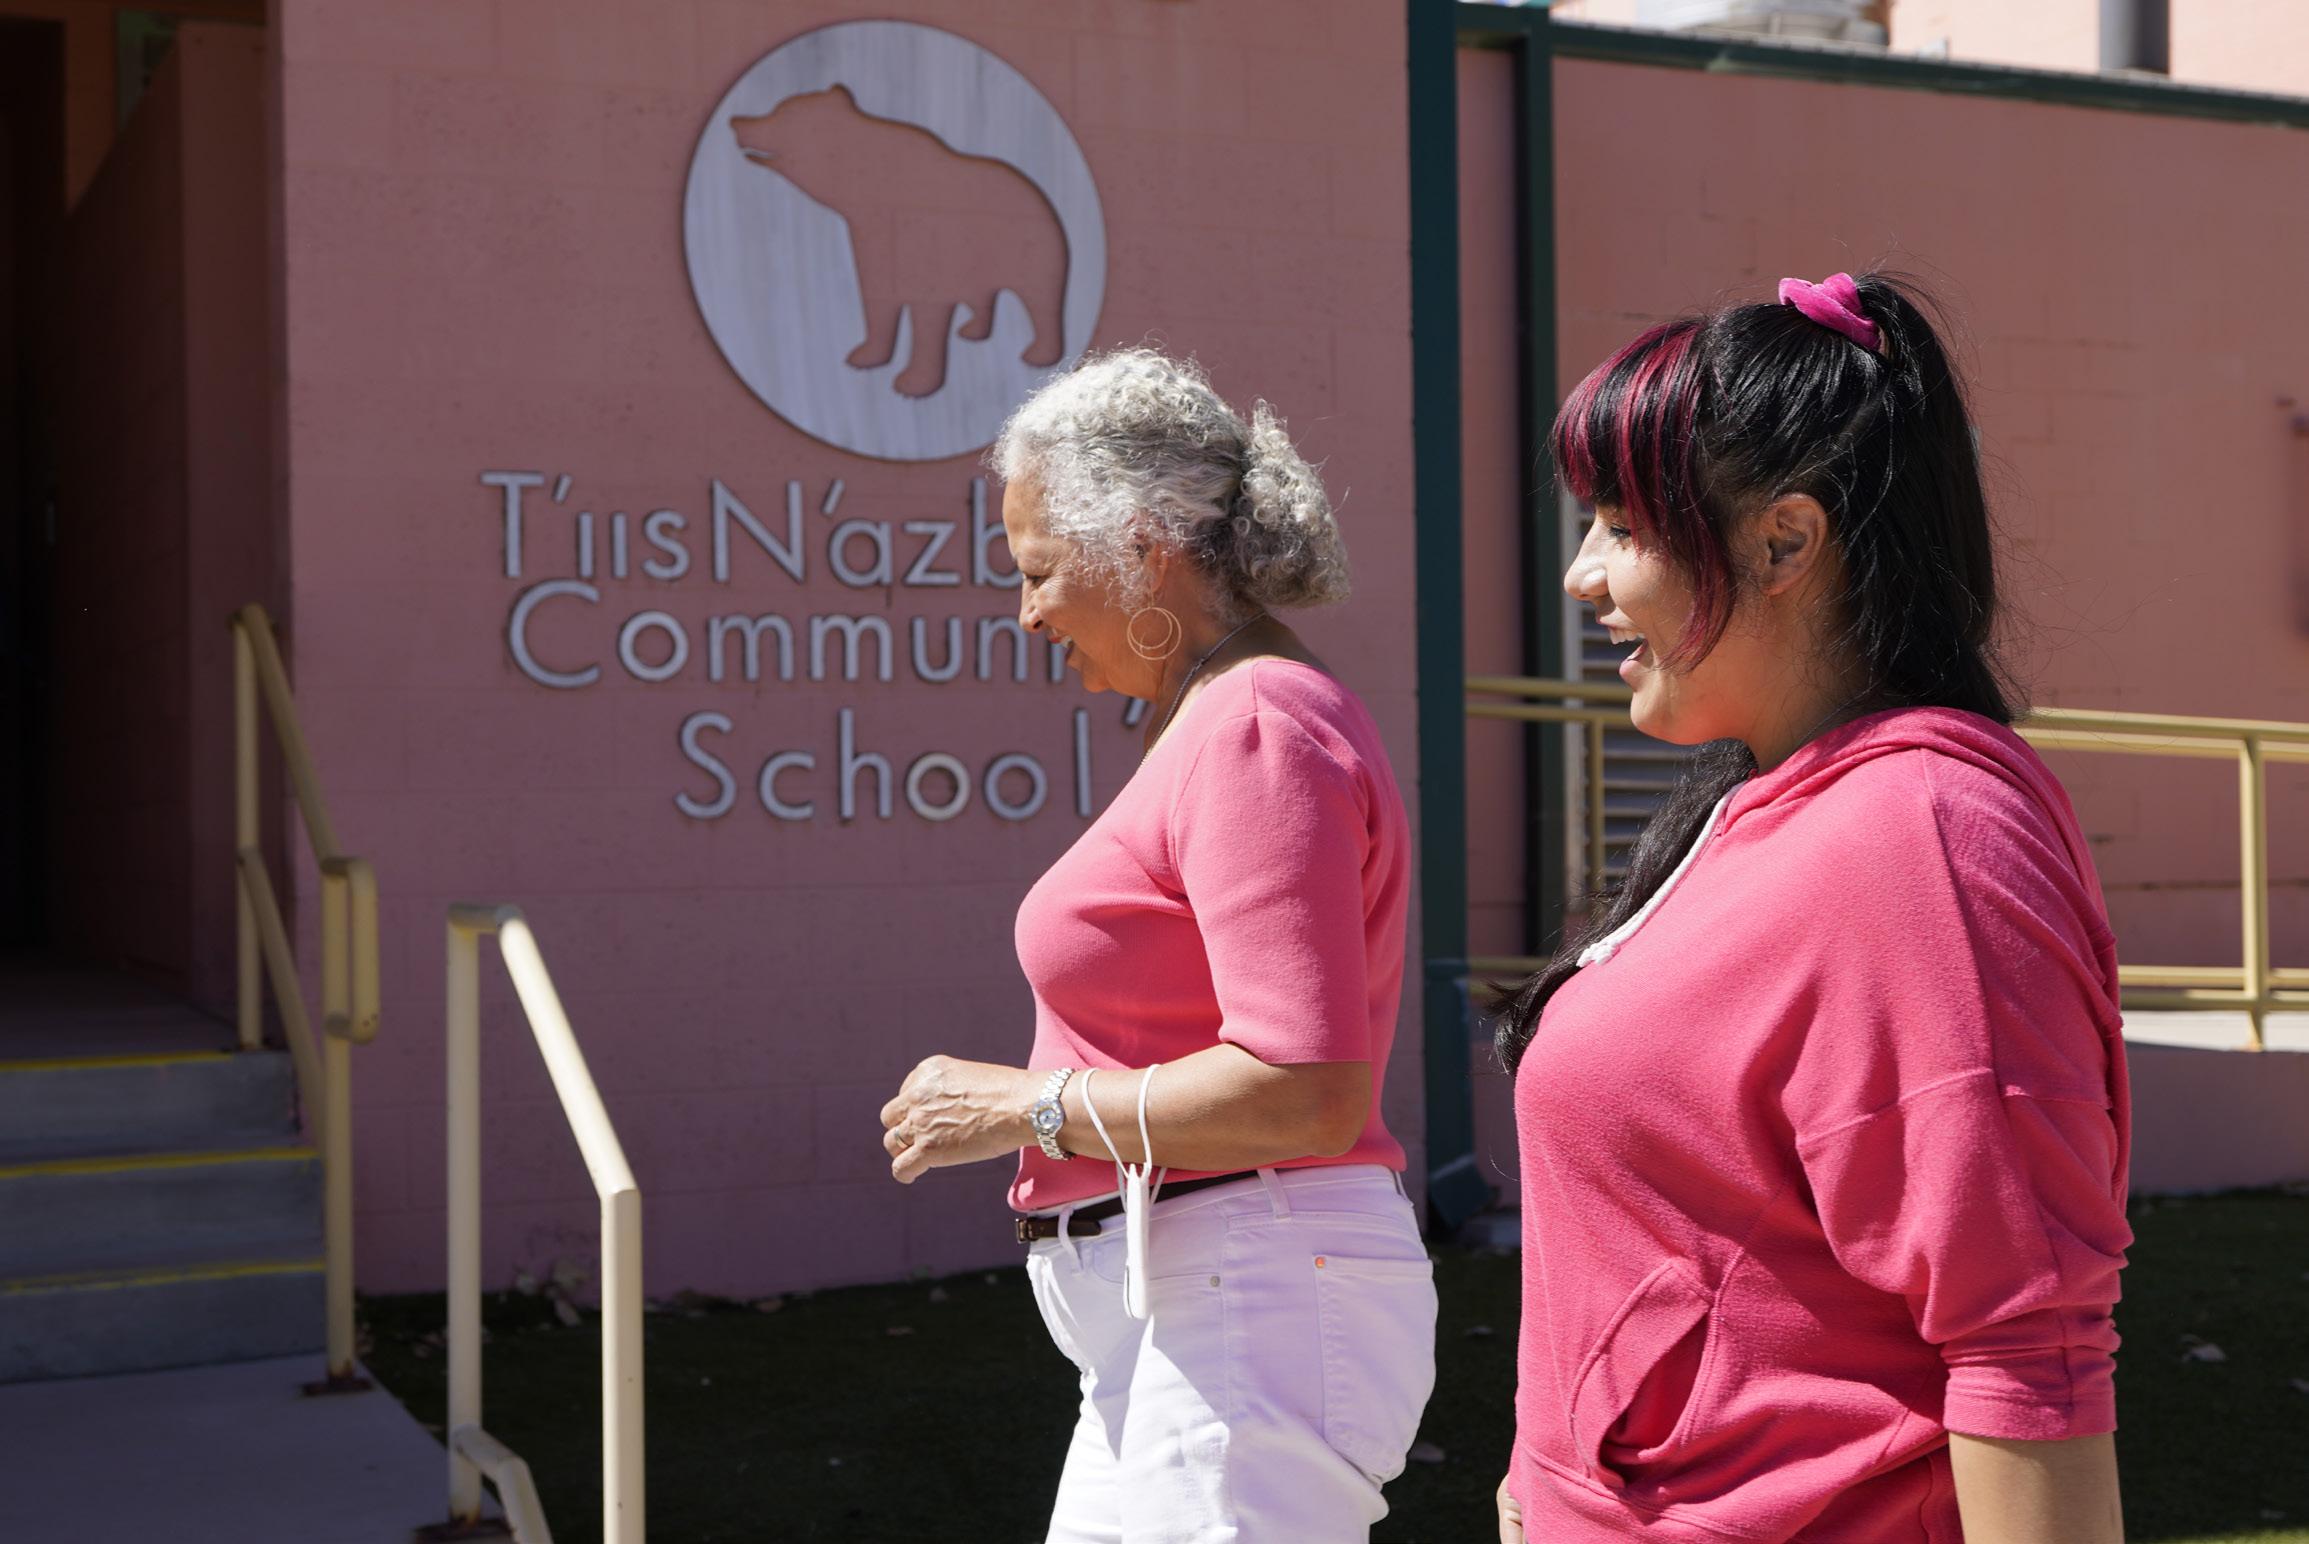


County Health Rankings & Roadmaps (CHR&R) brings actionable data, evidence, guidance and stories to support community-led efforts to grow community power and improve health equity. The University of Wisconsin Population Health Institute (UWPHI) created CHR&R for communities across the nation, with funding from the Robert Wood Johnson Foundation.
This year, we focus on the connection between civic health and thriving people and places. Civic health reflects the opportunities people have to participate in their communities. It starts in our local communities and is the cornerstone of our democracy, representing promise, opportunity, belonging and shared responsibility.
We look at two elements of civic health:
l CIVIC INFRASTRUCTURE, which includes spaces such as schools, parks and libraries that help us stay connected and policies and practices that foster belonging, making civic participation possible.
l CIVIC PARTICIPATION, which includes the ways people engage in community life to improve conditions and shape the community’s future, whether through political activities such as voting and advocacy, or community activities such as volunteering and mentoring.
Our civic health must be nurtured. Intentional investments in civic spaces that foster inclusive participation can have a positive impact on health equity. On the other hand, neglect or deliberate exclusion is detrimental to civic health and our opportunity to thrive. Our civic health depends on the decisions we make—whether we are an elected official or a local volunteer—to cultivate community conditions where everyone is welcome, lives with dignity and thrives.
History shows that when previously disenfranchised groups built power and expressed their will through voting and advocacy, the policies that followed benefited the health and well-being of all. For example, after women won the right to vote in 1920, infant mortality rates dropped dramatically when lawmakers passed a law that set up maternal and child health
units in every state health department, expanded birth and death data collection and supported home-visiting initiatives. The Civil Rights Act, which included hospital desegregation, is associated with health improvement. From 1965 through 1971, infant mortality rates dropped significantly and the gap between Black and white infant mortality narrowed. This followed the passage of the Voting Rights Act in 1965, which fundamentally shifted electoral power in the U.S. and ushered in a new era of government responsiveness to Black voter participation and marginalized populations.
We will make progress toward health equity when all people can be heard and have meaningful involvement in decisionmaking processes. To do this, we must repair harmful policies and practices aimed at exclusion. There are multiple examples of laws and policies—some that started with the birth of the nation and whose effects are still felt today—that underlie current barriers to health. The U.S. census, started in 1790, excluded American Indians until 1890. Literacy tests and poll taxes during the Jim Crow era intentionally prevented Black Americans from voting. Current policy proposals that levy fines, impose prison sentences or force protestors to pay for policing costs all deter people from the right to peaceably assemble. Discriminatory policies and practices do not reflect the aspirational values of our democracy. We can claim our democracy for the common good.
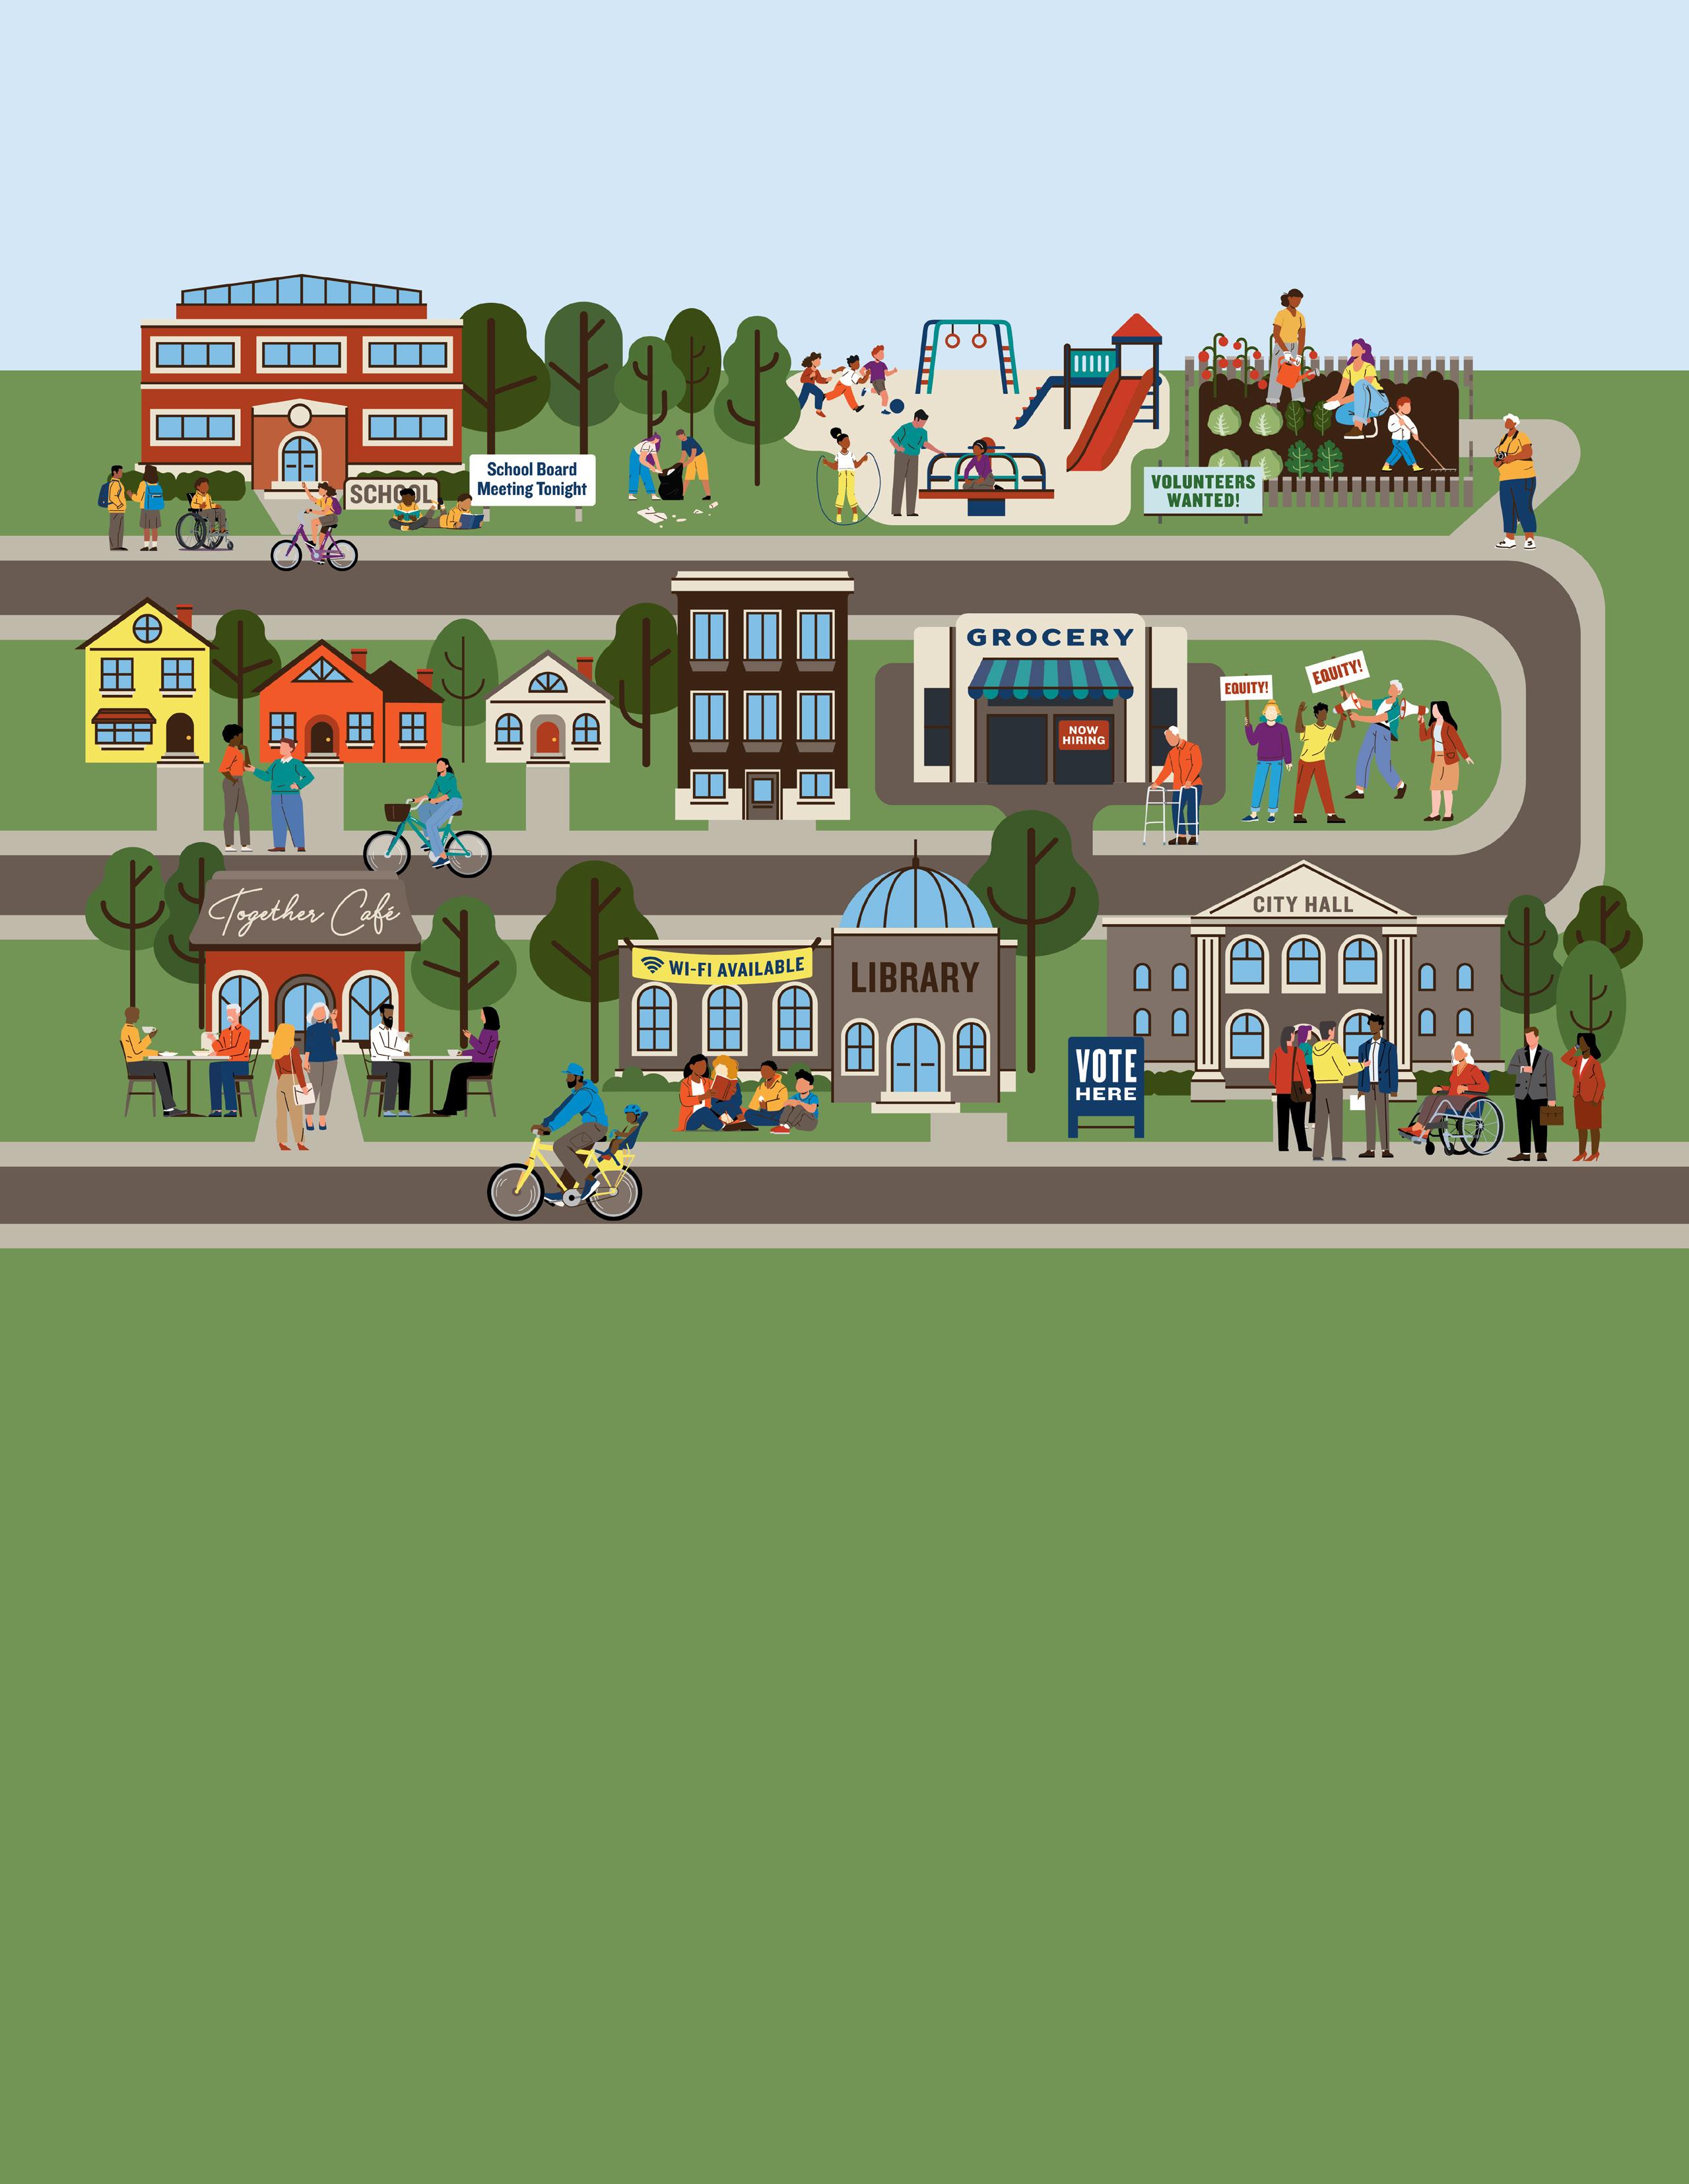
Civic health starts in our local communities and is the cornerstone of our democracy, representing promise, opportunity, belonging and shared responsibility.
Civic spaces include parks, libraries, schools, community centers, sidewalks, public transportation and the internet. Civic spaces are where we gather, connect and organize. Town hall meetings, community events and protests often take place in civic spaces. Civic spaces are also where we learn, stay informed, get connected and come to understand how decisions are made so that we can advocate for our community’s needs. Schools, libraries and community centers are civic spaces that often offer civic education, leadership programs, service learning and access to information. Information comes through local newspapers and other virtual and physical news outlets, virtual forums or social media, all of which help us understand how decisions are made and what is happening locally.
How we govern determines who has a say, what is prioritized and how resources are allocated. Components of governance include voter registration laws, redistricting commissions, open meetings, community advisory boards and their processes such as participatory budgeting and investment procedures from community and economic development organizations. Policies, laws, ordinances and practices determine how easy it is to participate in civic life and for whom, as well as how resources are invested in civic infrastructure to support participation.
We can use our power in many ways to achieve common goals. Volunteering, joining a social group and helping neighbors connects us, fosters belonging and supports a shared purpose.
Civic infrastructure provides us with spaces to meet, make our voices heard, engage in cultural activities, enjoy nature and feel like we belong. These civic spaces support our ability to do things together—whether it’s volunteering at the senior center or attending a community advisory council meeting. Civic spaces are created and maintained with intention—sometimes by governing bodies and sometimes by neighbors working together. They provide a foundation for civic action and local solutions.
Vibrant civic infrastructure is not a reality across all U.S. communities, nor has it ever been. To this day, many groups of people in our communities—but especially people who are Black, American Indian, immigrants, women, LGBTQ+ and have lowincomes—experience the impacts of a history of disinvestment in civic infrastructure and systematic exclusionary policies and practices. Examples of exclusion include “closed door” decisionmaking on resource allocation, laws restricting voter eligibility or registration, residential segregation and digital redlining. We all lose when we disinvest in civic infrastructure that can serve everyone. For example, many communities drained their public pools when racial integration was mandated, denying all people in the community a place to gather and connect in healthy ways.
Systematic exclusionary policies and practices create structural barriers to civic health. They deny many groups of people the ability to safely participate in civic life. This restricts access to opportunities for good health and makes it harder for us to work together to make our communities places where everyone thrives.
People closest to community problems advocate for solutions that benefit everyone.
This was the case when people with disabilities advocated successfully for curb-cuts, ramps cut into street curbs to provide access between sidewalks and streets. Curb-cuts enable better mobility for people who use wheelchairs. People with baby strollers, runners, people moving heavy carts and others benefit too. Safe streets and sidewalks support good health for all.
Drew, Mississippi, is a small town in the Mississippi Delta that looks to people power for its sense of community. Volunteerism fuels the rural community forward after decades of disinvestment and systemic racism left limited opportunity in its wake. Organizations are bringing together residents and local leaders to create a town that reflects a vibrant and socially connected community that works together to create solutions. Since 2016, We2Gether Creating Change has been bringing together partners, such as Drew United for Progress, the City of Drew and Hope Enterprise Corporation—all under the umbrella of the Drew Collaborative—to bring a playground to the town to give families and children a safe place to gather. They also built a pavilion in the town center where concerts, “Drew Day” and Juneteenth festivities occur. Plans to repurpose a city-owned armory into community gardens and a high-speed internet hub for residents to take online classes are on the horizon. Drew is establishing bonds and building a more connected and healthy community by reimagining and revitalizing the spaces where neighbors can engage with one another.
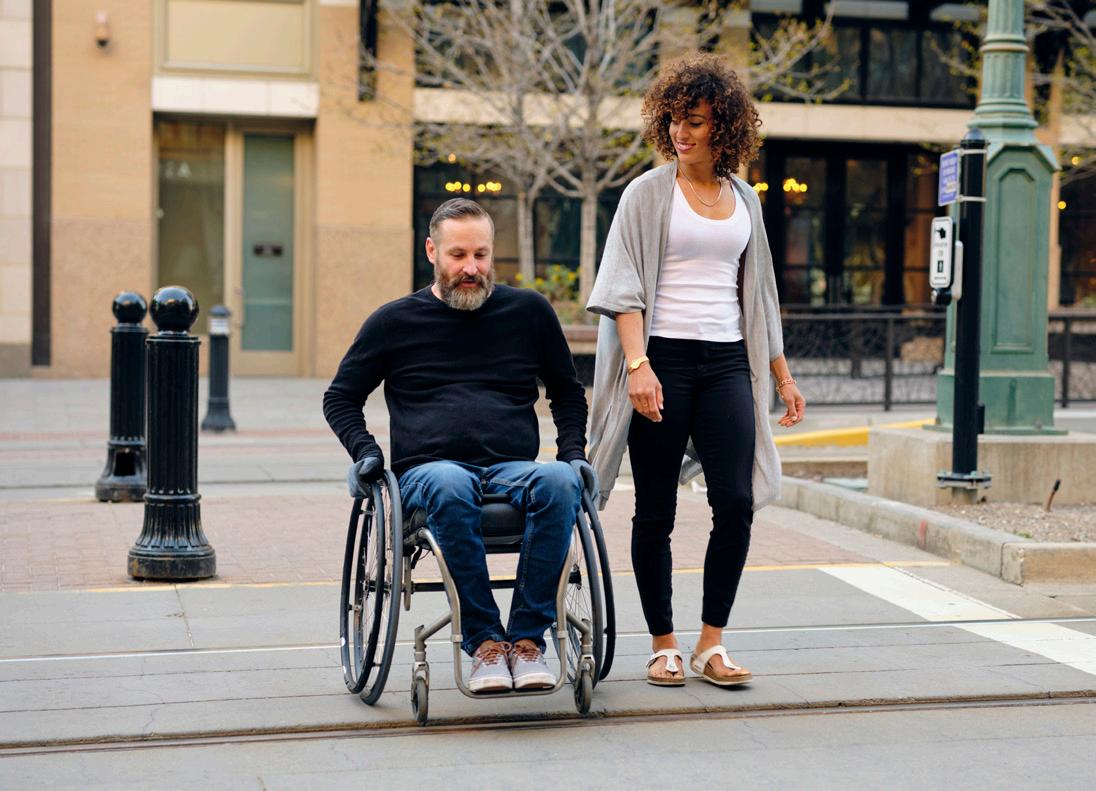
Civic infrastructure and the opportunity to live long and well varies across U.S. counties. Civic infrastructure varies across U.S. counties and regions. Counties in the Northeast, Midwest and West have more available and resourced civic infrastructure (including access to civic spaces and information such as broadband, libraries, newspapers, social associations, parks and schools). These counties often also have more social and economic opportunity.
l Where types of long-standing discrimination and disinvestment have occurred through policies and practices—such as racial segregation through redlining, legal actions to terminate tribal culture and land rights and disinvestment in rural economies—counties have fewer social and economic opportunities (maps to the right). This includes opportunities for education, employment, income and family and social support. These counties consistently fall among the least healthy in measures of length and quality of life.
l Counties in regions such as the U.S.-Mexico Border, Black Belt Region, American Indian/Alaska Native (AI/ AN) tribal areas and their surrounding counties, and Appalachia experiencing these forms of structural racism and disinvestment are often more rural and have a greater percentage of the population of color than the U.S., on average. These counties experience higher rates of children living in poverty, people without health insurance, lower household incomes and greater income inequality and lower rates of high school completion than the rest of the nation’s counties, on average.
l Among counties outside of these regions, approximately 83% of households have access to broadband internet and 66% of the population lives near a park or recreation facility. Most counties have adequate public school funding to support student achievement of national average test scores. Library visits typically occur twice per capita, annually (see figure on next page).
l Compared to the rest of the nation’s counties, counties in disinvested regions tend to have less available and under-resourced civic infrastructure. For instance, only 4% of counties in the Black Belt Region have adequate public school funding and experience school funding deficits of $8000 more per student annually than the rest of the nation’s counties, on average. Counties in the U.S.Mexico Border Region have less than half as many social associations and more than 15% less household access to broadband internet.

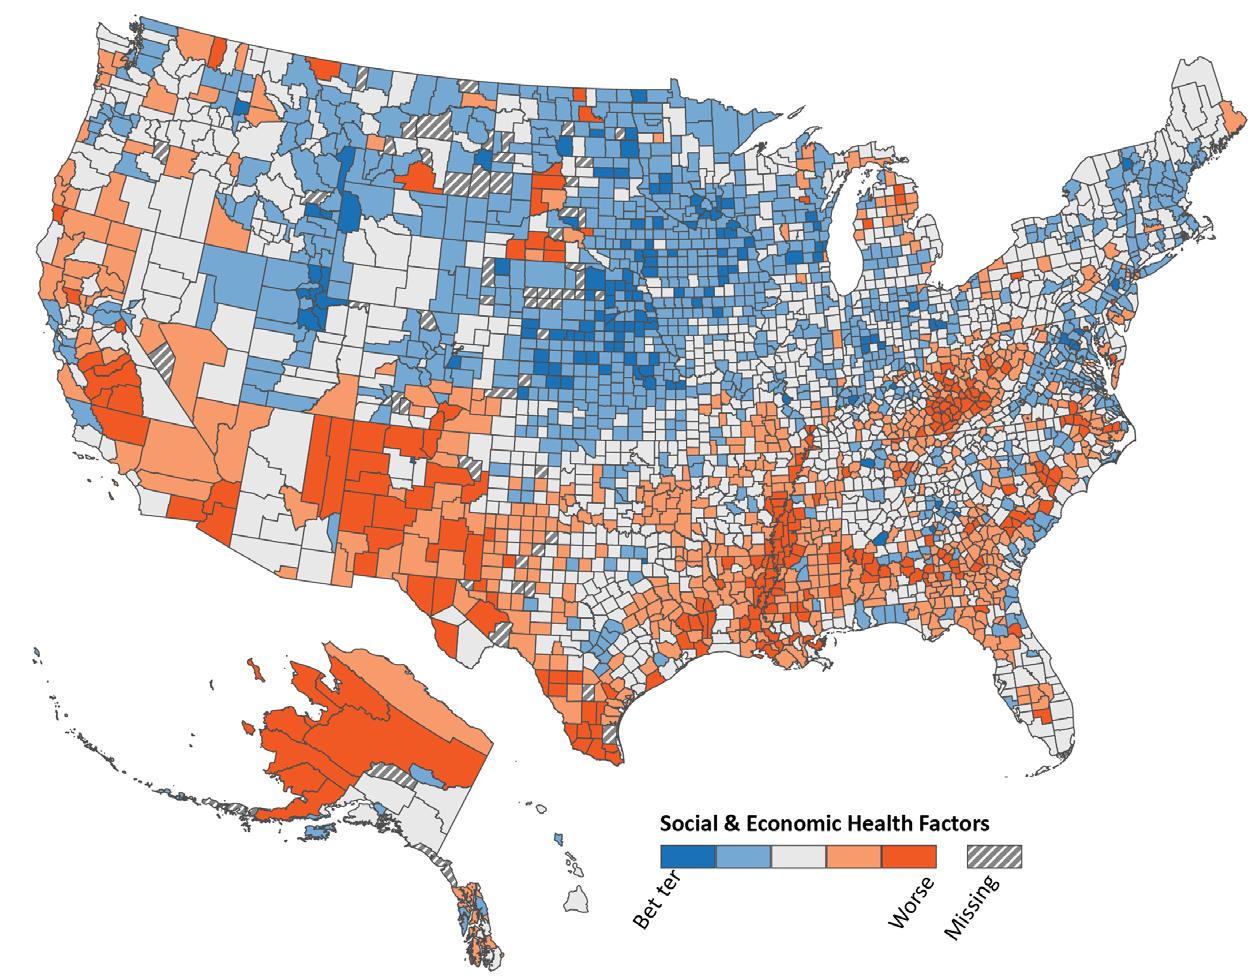
See Glossary of Terms & Technical Notes on pages 16-17 for definitions of types of longstanding discrimination and disinvestment and regions and county categories
Data source: 2023
Regions with Types of Long-standing Disinvestment
Variations in Measures of Civic Infrastructure Among Regions with Types of Long-standing Discrimination and Disinvestment
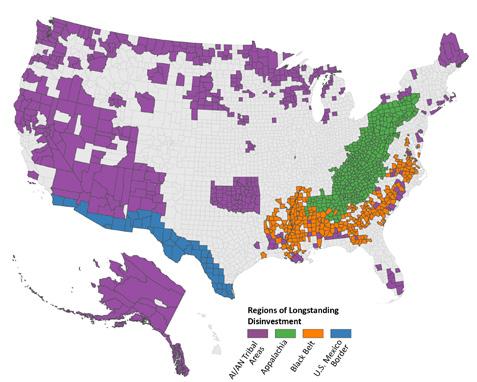
The Point-in- Time (PIT) Homeless Count is an annual street and shelter count that determines the number of people experiencing homelessness in Maricopa County during a given point in time. Conducted on a single day in January, this project includes a brief survey to identify the needs and characteristics of those experiencing homelessness. Every Continuum of Care is required to submit PIT Count results to the U.S. Department of Housing and Urban Development (HUD) as part of a national effort to identify the extent of homelessness across the country.
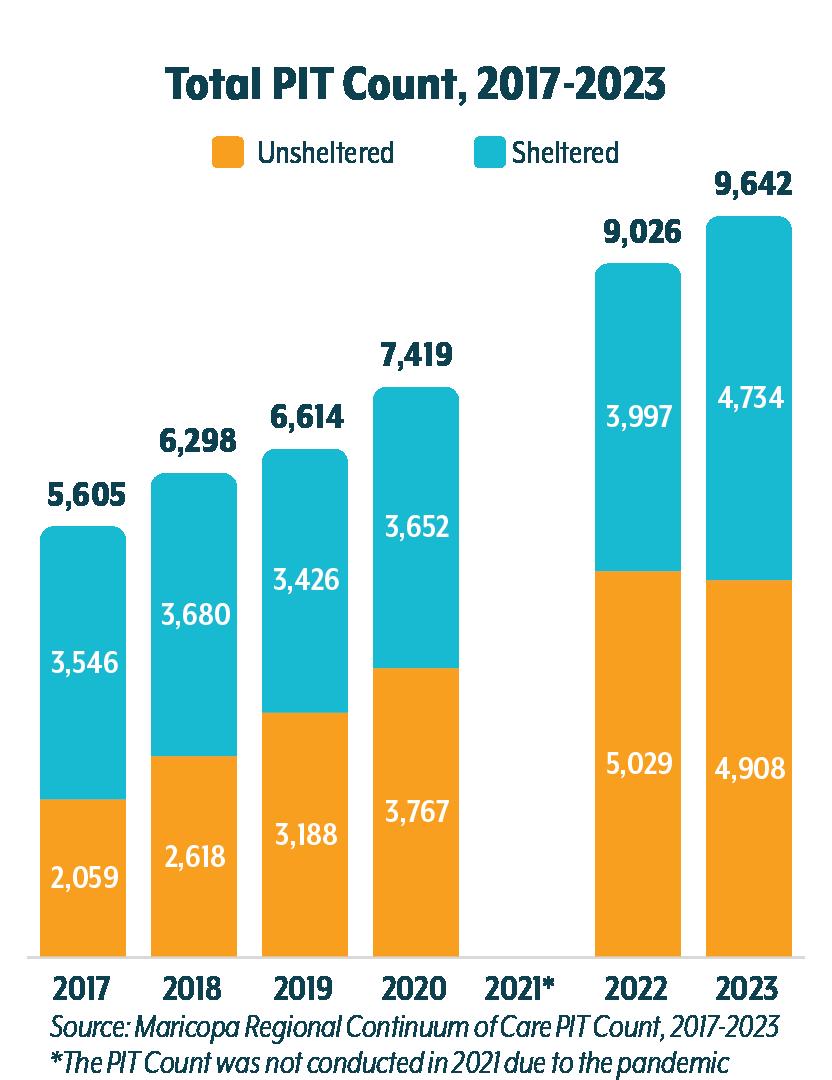
The PIT Count is an important source of data on homelessness, and is reported to Congress as part of the Annual Homelessness Assessment Report (AHAR). The PIT Count is a source of unsheltered homeless numbers and helps to inform communities on the number of people who do not access services such as Emergency Shelters or Transitional Housing at any given point in time. As the number of people experiencing homelessness continues to rise across the region, increased regional efforts to address homelessness are necessary.
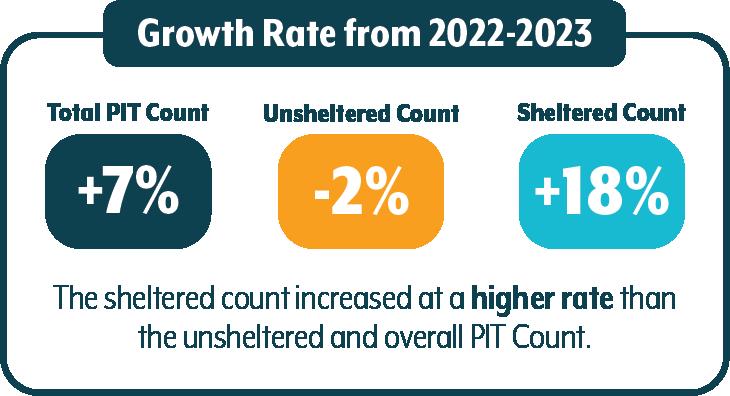
The PIT Count is a one-night snapshot of homelessness that is limited by weather conditions, number and training of volunteers, self-reported survey responses, and other factors. There are more people who experience homelessness over the course of the year than on any given single night. Every year, the Continuum of Care works towards improving the count’s accuracy. The Maricopa Regional Continuum of Care is committed to using data from the PIT Count and the regional Homeless Management Information System (HMIS) to understand more about the population experiencing homelessness in the region and to provide solutions that will make homelessness rare, brief, and non-recurring.
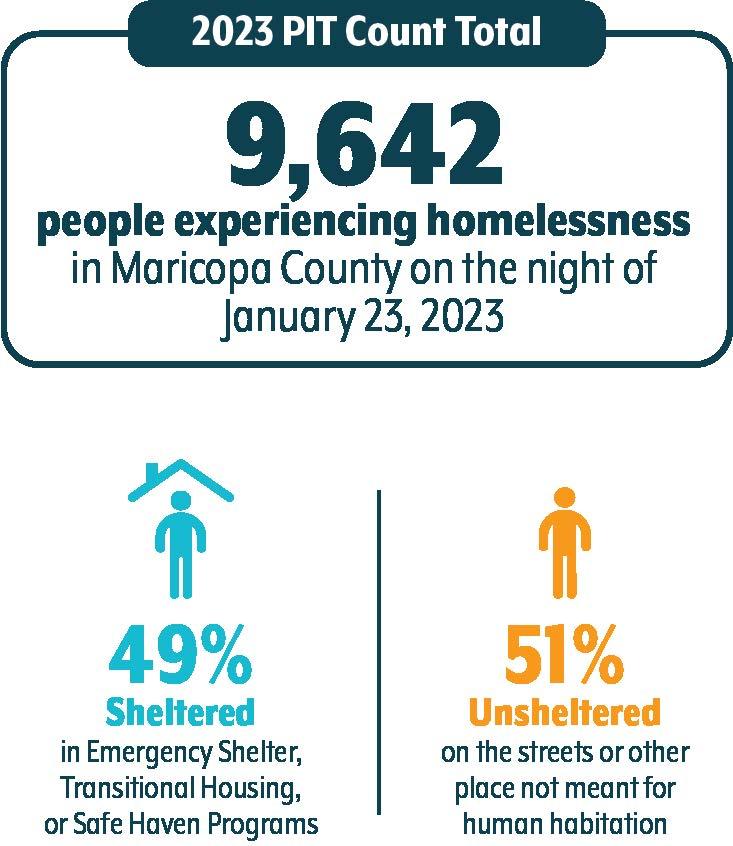
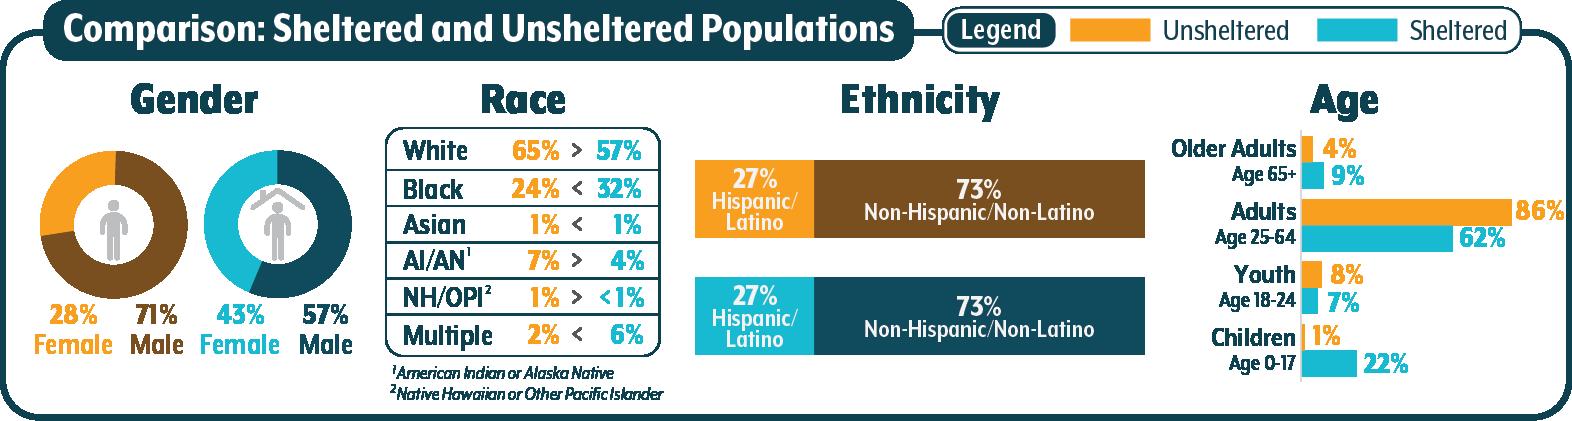
The demographics of the PIT Count have been fairly consistent over the past years. These charts show data from the 2023 PIT Count.
For the 2023 PIT Count, 64% of the population experiencing homelessness identified as male, 35% identified as female, and 1% identified as either transgender, gender non-conforming, or questioning. The proportion of gender has remained the same for the PIT Count throughout the years. The PIT Count had a larger proportion of the population that identified as male than Maricopa County’s average of 49.7% from the 2021 American Community Survey (ACS) estimate (U.S. Census Bureau, ACS 2021 1-year estimate)
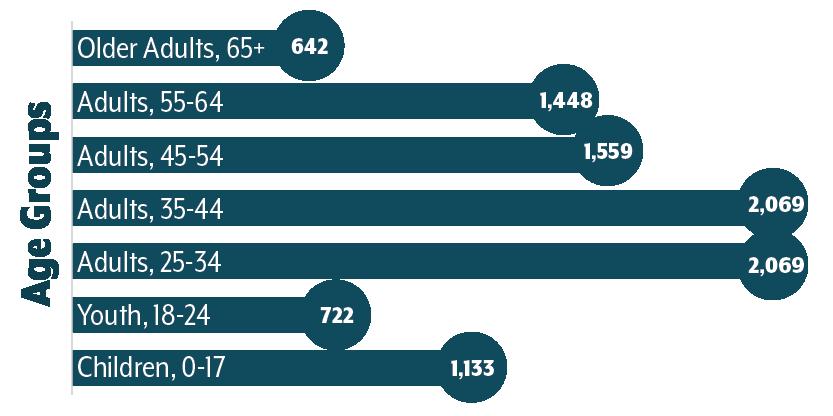
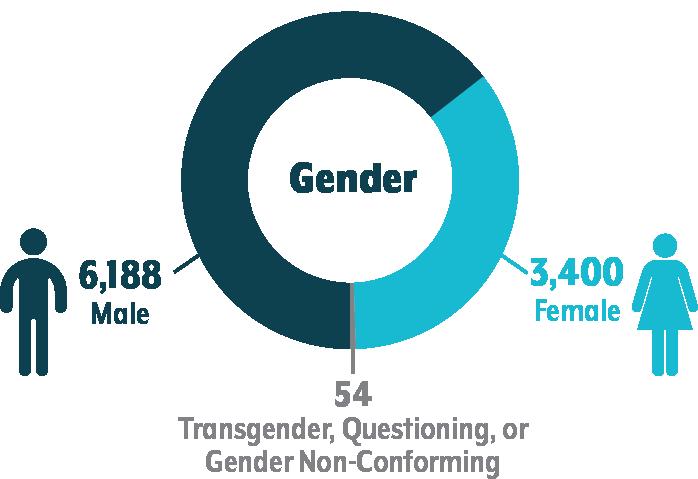
Over the years, a significant majority of the PIT Count has identified as White and Non-Hispanic or Non-Latin(o)(a)(x). By race there has been a slight decrease in the White population and American Indian or Alaska Native, while there was a slight increase in Black or African-American. The 2023 PIT Count reported a differing racial makeup than Maricopa County. The 2021 ACS estimate reported the following numbers for Maricopa County: White (58%); Black or African-American (6%); Asian (4%); American Indian or Alaskan Native (2%); Native Hawaiian or Other Pacific Islander (<1%); and Multiple Races or Other (30%). The PIT Count also has a higher percentage of people identifying as Non-Hispanic or Non-Latin(o)(a)(x) compared to Maricopa County (68%).
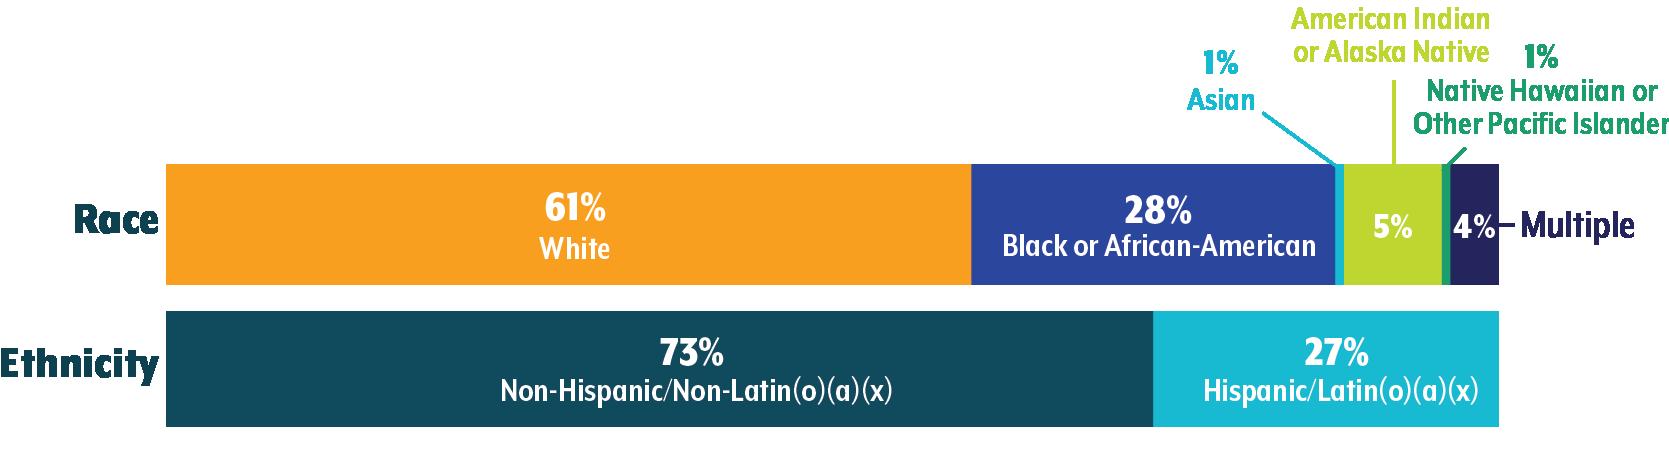
This year, age categories were expanded for adults 25+. The largest age group from the PIT Count is adults 25-34 and adults 3544, which each accounted for 21% of the 2023 PIT population. Children (age 0-17) make up 12% of the population, while youth (age 18-24) and older adults (age 65+) each make up only 7% of the count. 81% of the PIT Count are adults age 25+, a higher percentage than the ACS estimate for Maricopa County, 68% (U.S. Census Bureau, ACS 2021 1-year estimate).


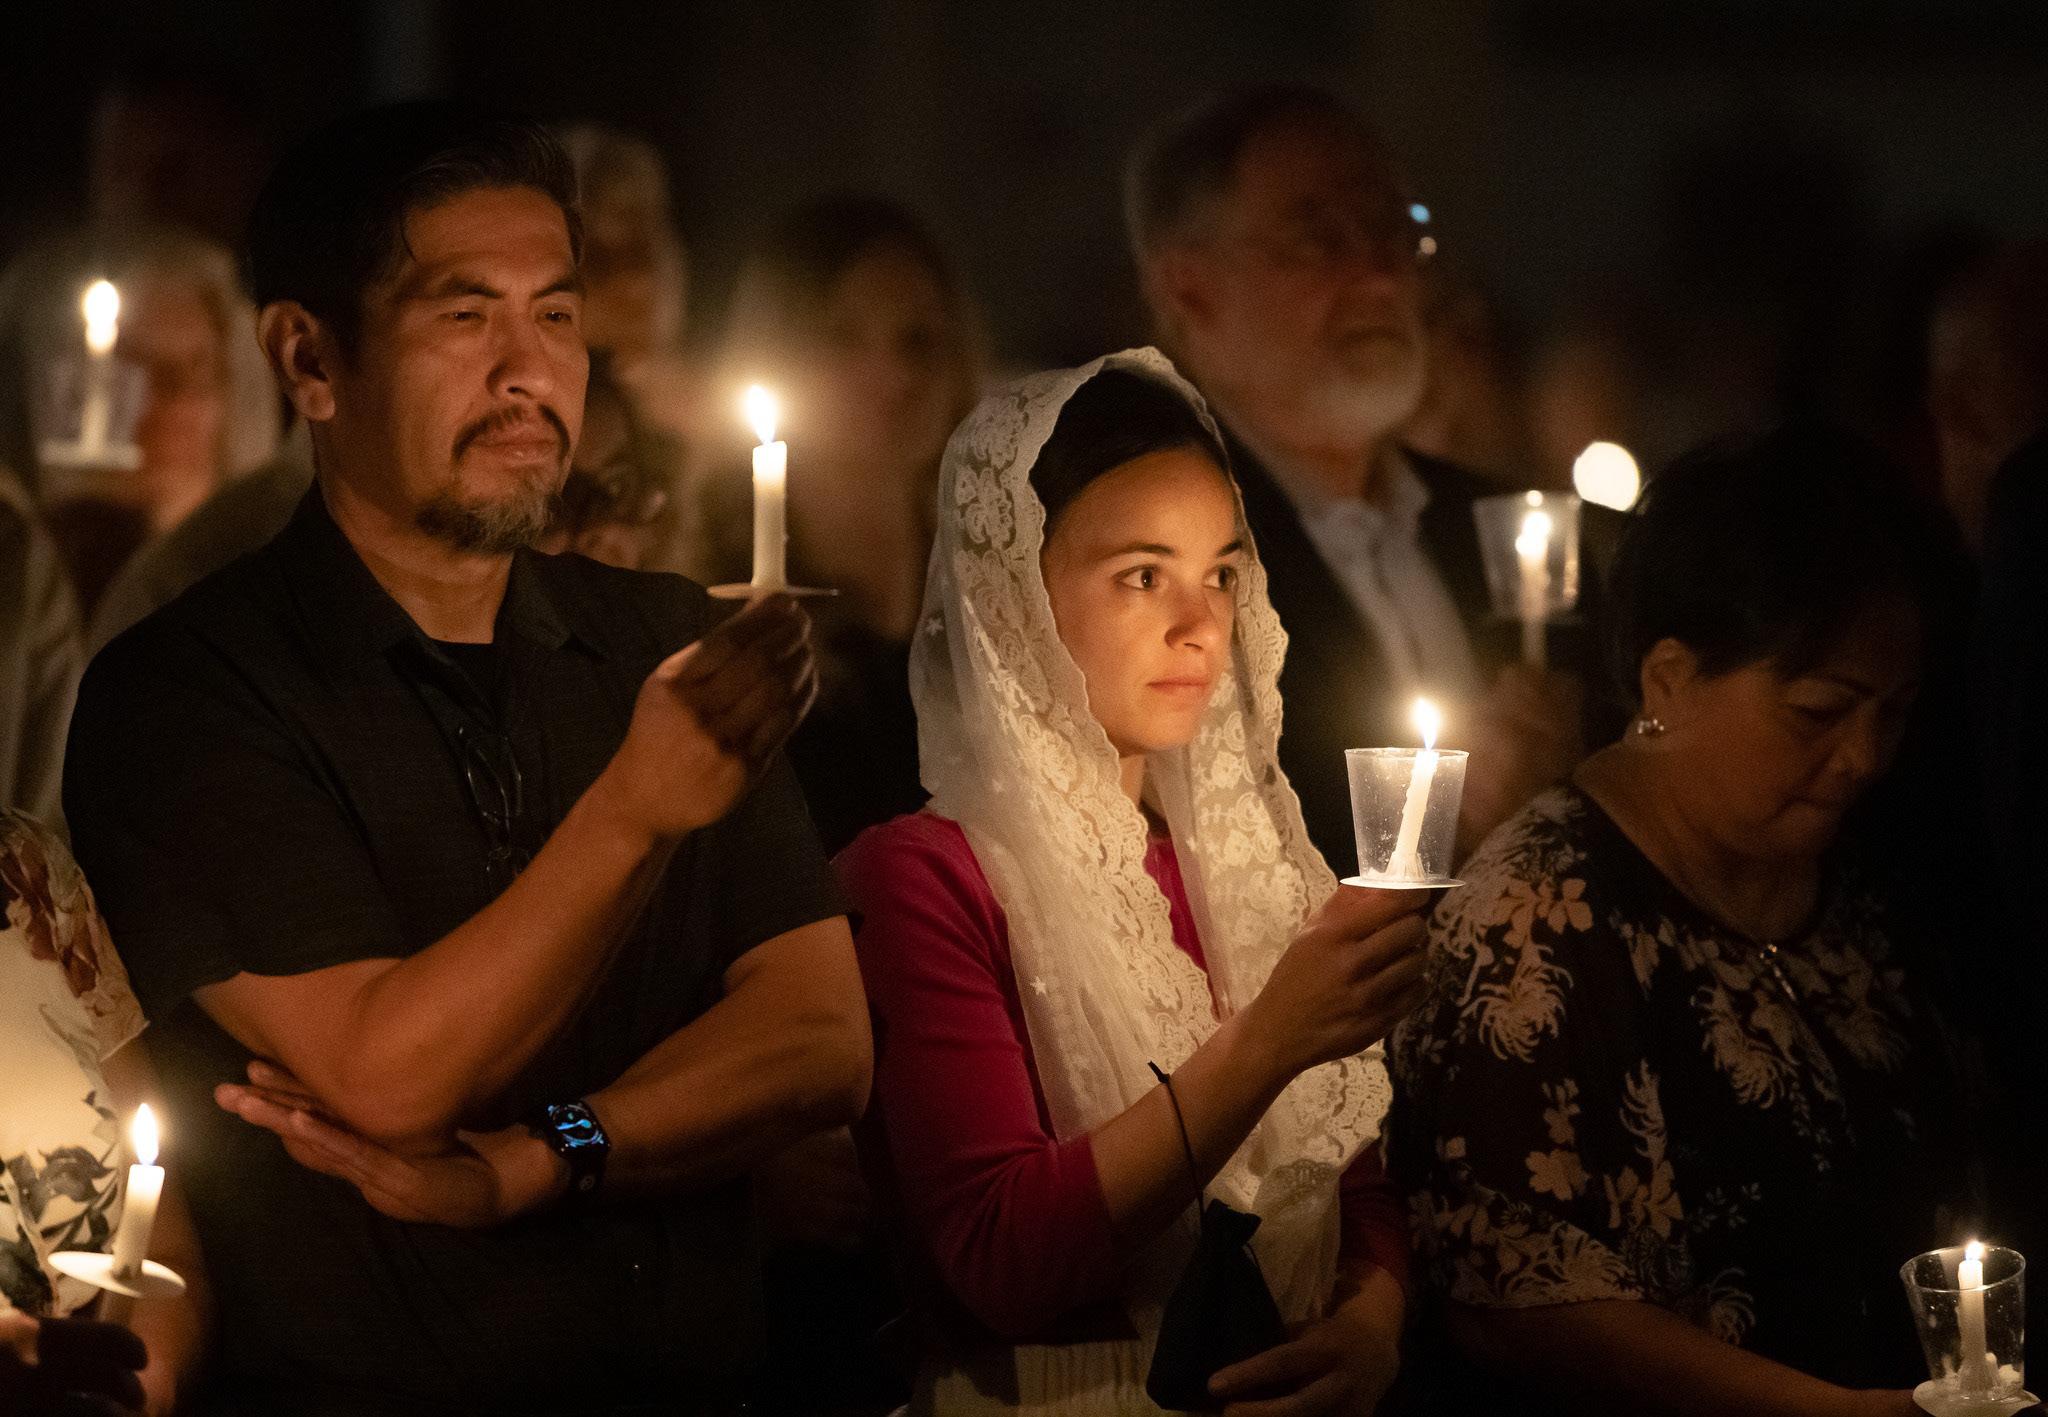
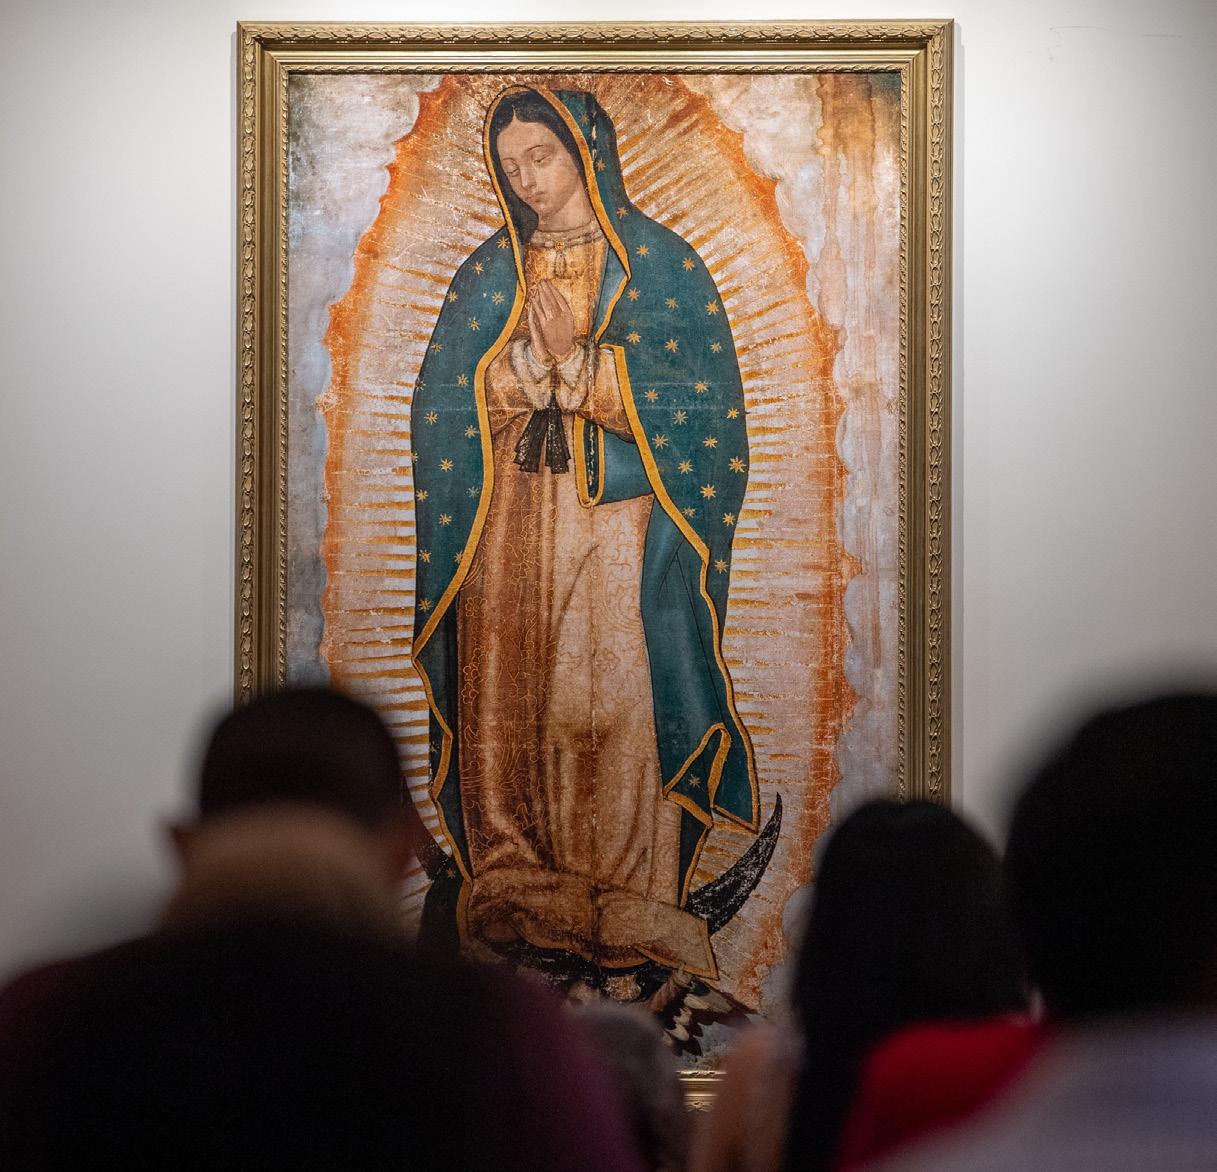
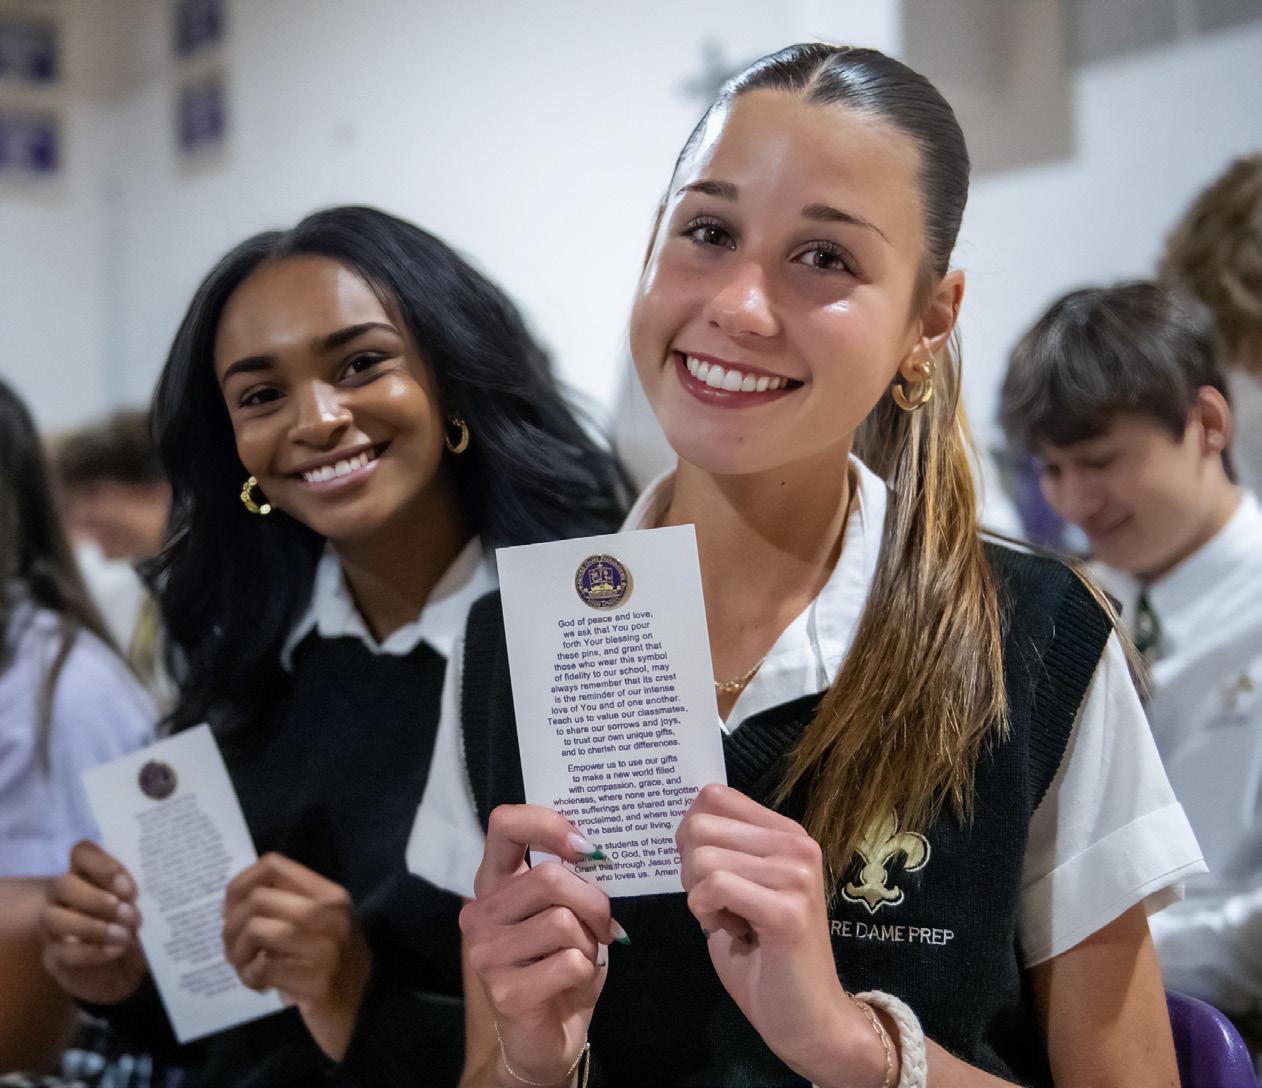


• U.S. HISPANICS/LATINOS WHO REPORTED BEING TWO OR MORE RACES INCREASED BY 567% IN 2020 VS. 2010
• FAMILY IS A TOP PRIORITY FOR LATINOS AND THE MAJORITY LIVE IN LARGER, MULTIGENERATIONAL HOUSEHOLDS
• MORE THAN HALF OF U.S. LATINO CHILDREN LIVE WITH MARRIED PARENTS
• NEARLY 90% OF U.S. HISPANIC PARENTS SHARED FREQUENT MEALS WITH THEIR CHILDREN IN 2021
• ONLY 12% OF U.S. LATINO ADULTS REPORT A LACK OF SOCIAL SUPPORT IN THEIR COMMUNITY
• GIRLS PARTICIPATED MORE IN LESSONS AFTER SCHOOL THAN BOYS IN THE U.S. FROM 2014 TO 2020
• NEARLY 40% OF U.S. LATINO ADULTS SAY RELIGION IS VERY IMPORTANT TO THEM
• U.S. HISPANIC ADULTS WERE LESS LIKELY THAN NON-HISPANIC ADULTS TO RECEIVE MENTAL HEALTH SERVICES FROM 2012 TO 2019
• HISPANICS’ PERCEPTION OF INCLUSIVE CONTENT AND REPRESENTATION
• STREAMING—PARTICULARLY NETFLIX AND YOUTUBE—IS THE MOST POPULAR TV SOURCE AMONG U.S. LATINOS
• NON-U.S. CITIZEN FEDERAL OFFENDERS QUICK FACTS (FY 2022)
332 IN FOCUS 334 IN FOCUS 339 EXCERPT
What started as a simple phone call looking for some help has evolved into The Community Collaborative segment on the Social Television Network’s (STN) monthly show, It Happens at STN
BY KAREN MURPHYThis local National Hockey League team has an unwavering commitment to the local Latino community through outreach, youth development programs and strategic partnerships
BY COYOTES STAFF336 IN FOCUS
Generative pre-trained transformer (GPT) technology is the latest advancement in artificial intelligence that is causing a seismic shift for businesses, educators, researchers and creative types as they determine how to use the technology responsibly and ethically
BY MANUELA MONTOYA
A national survey by National Public Radio (NPR), The Robert Wood Johnson Foundation and the Harvard T.H. Chan School of Public Health was conducted last year to see how racial and ethnic minority populations are being affected by the current state of affairs in the U.S.
HISPANIC OR LATINO
WHITE ALONE
B L ACK OR AFRICAN AMERICAN ALONE
AMERICAN
-52.9% -6.4% 115.3% 27.8% 16.3% 41.7% 5 6 7 . 2 %
Source: U.S. Census Bureau, “2020 Census Illuminates Racial and Ethnic Composition of the Country,” Nicholas Jones, Rachel Marks, Roberto Ramirez and Merarys Ríos-Vargas, August 12, 2021 census.gov/library/stories/2021/08/improved-race-ethnicity-measures-reveal-united-states-population-much-more-multiracial.html
FAMILY IS A TOP PRIORITY FOR LATINOS AND THE MAJORITY LIVE IN LARGER, MULTIGENERATIONAL HOUSEHOLDS
50% of Latinos live in multigenerational households.
84% of Latinos say spending time with family is a top priority.
44% larger than the rest. Latino families are
Source: We Are All Human Foundation, Hispanics in the U.S., 2022 hispanicstar.org/wp-content/uploads/2022/04/2022-Hispanics-in-the-US-30-MIN-.pdf
*NOTE: This poll was conducted May 16 — June 13, 2022, among a nationally representative, probability-based sample of 4,192 adults age 18 or older in the U.S. The survey included nationally representative samples of 1,216 White, 1,103 Black, 1,066 Latino, 552 Asian and 180 Native American adults.
Source: U.S. Census Bureau, “A Child’s Day: Historical Figures and Tables,” April 2022 (page last revised January 3, 2023) www.census.gov/data/tables/time-series/demo/children/childs-day.html
PERCENTAGE OF U.S. CHILDREN AGED
NEARLY 40% OF U.S. LATINO ADULTS SAY RELIGION IS VERY IMPORTANT TO THEM
Source: Pew Research Center, “Among U.S. Latinos, Catholicism Continues to Decline but Is Still the Largest Faith,” Jens Manuel Krogstad, Joshua Alvarado and Besheer Mohamed, April 13, 2023 www.pewresearch.org/religion/2023/04/13/among-u-s-latinos-catholicism-continues-to-decline-but-is-still-the-largest-faith/
56%
49%
64,142 cases were reported to the U.S. Sentencing Commission. 19,894 of these involved non-U.S. citizens. Non-U.S. citizens accounted for 31.2% of all federal offenders in FY 2022.
94.1% of non-U.S. citizen offenders were men.
93.8% were Hispanic, 2.4% were Black, 2.0% were White and 1.8% were Other races. Their average age was 38 years.
87.0% were illegal aliens, 9.6% were legal aliens, 1.9% were extradited aliens and 1.5% were of unknown status
66.7% were from Mexico, 7.3% from Honduras, 5.9% from Guatemala, 4.0% from El Salvador, 3.4% from the Dominican Republic and 12.7% originated from other countries.
The most common guidelines under which non-U.S. citizen offenders were sentenced include:
Immigration (72.6%); Drug Trafficking (16.8%); Fraud (3.9%); Money Laundering (1.7%); and Firearms (1.5%).
As a self-described “serial entrepreneur,” Robin Reed was a little out of his comfort zone when he became president and CEO of the Black Chamber of Commerce of Arizona. He was used to for-profit businesses where he would do the work and make money instead of “spending most of [his] time looking for funding.”
1 2 3 4 5 6
Support black and minorityowned businesses
Partner with diverse organizations on their initiatives
Actively strive to meet and exceed diverse interviewing and hiring targets
Seek out and include diverse voices on company boards and for speaking and educational opportunities and use company media to amplify those voices
Ensure equitable compensation for work
Create a safe space for diverse employees to share their individual experiences
Source: www2.claritas.com/Knowmore
To get a better understanding of how chambers of commerce work, he reached out to AZHCC President and CEO Mónica Villalobos and asked if they could meet to talk about how chambers can work together. That meeting led to getting other local chambers involved in the conversation—the Chinese Chamber of Commerce, the Asian Chamber of Commerce and the American Indian Chamber of Commerce plus the Associated Minority Contractors of Arizona— and the Chamber Collaborative was born.
According to Reed, the group “was always intended to be an informal organization,” where there was no CEO or board chairman. Instead, they are group of community leaders, all equal partners, who get together to share information. It is an approach that worked well for five years. When word began to spread throughout the Phoenix community about their collaboration, other community leaders became interested.
One of those leaders was Angela Hughey, an LGBTQ+ community activist and founder of ONE Community. When she called to see if she could be a part of the group, she pointed out that since she was “not a chamber of commerce,” the name of the group would
“We’re not looking for someone to do everything. We are looking for everyone to do something.”
—Robin Reed, President and CEO, Black Chamber of Commerce of Arizona and STN Producer, Host, commenting on the Community Collaborative’s internal motto
have to change—which is how the chamber collaborative became the community collaborative.
Around the same time that Hughey joined the group, Reed was interviewed on a Social Television Network (STN) show called Arizona Achievers. When Eric Sperling, STN founder and managing director, learned about the Community Collaborative, he wanted to do a segment on the group, which led to a recurring series on the network that focused on all the good work that is being done in the diversity, equity and inclusion space in Arizona.
Since its beginnings as a standalone show, the community collaborative show has evolved to become a regular segment on an STN local news show called It Happens at STN. This new show premiered Sept. 1, 2022, and wrapped its first 10-episode season on July 3. Season 2 began this month, just around the time this 2023 DATOS publication was going to press.
When the new STN show was announced, Executive Producer Kathy Clark said that the show was “the evolution of our community action shows. We began to see that these four pillars we were producing independently consistently intersected with each other. The leaders we are working with are all connected. So, why not take that synergy and have these conversations together in one powerful hour?”
Each episode has four standard segments that address specific societal issues—Community Collaborative (diversity, equity and inclusion), In the Room (mentorship), McQuaid Mission (homelessness) and Project Greenprint (environmental sustainability)—in addition to alternating segments such as leader profiles and impact features that differ with each episode.
New episodes of It Happens at STN are released monthly and full episodes can be viewed on the STN website along with exclusive behind-the-scenes content, comprehensive blogs and detailed information about how anyone can join in the STN mission to address and solve the pressing issues of the day.
Reed is quick to point out one important thing: “Being a guest on our show is not a pay-to-play opportunity.” Guests do not pay to be
Source: www2.claritas.com/Knowmore
on the show and the show does not pay guests to be on the show, he says and emphasized that guests for the community collaborative segment are chosen strictly by whether the work they are doing aligns with the community collaborative’s mission and provides valuable information to the audience.
“Our genuine hope,” Reed says, “is to take this [community collaborative] concept and expand it to see how big we can go with it, in a way that helps other communities, other cities, other metro areas and states really get a sense of how much better we can work when we work together.”
Karen Murphyis anAZHCC staffwriterand copyeditor/proofreader.The Social Television Network (STN)

STN is a TV streaming network founded by Eric Sperling that “creates content that brings together community leaders to share their leadership philosophies and active efforts to make a difference.”
920 E. Madison St., Ste 170 Phoenix, AZ 85034 480.967.7088 stntv.com
Episode Catalog
It Happens at STN
stntv.com/category/episode_recap
NOTE: Shows are taped in front of a live audience, but attendance is by invitation only.
(December 2020 — April 2022 episodes)
Community Collaborative stntv.com/?s=community+collaborative
Arizona is a diverse state with a vibrant Latino community that contributes significantly to the state’s cultural fabric and economic growth. The Arizona Coyotes, the local National Hockey League (NHL) team, is committed to improving the lives of all Arizonans by collaborating with community partners that deliver programs and in-game experiences that align with their main pillars of service: closing the education gap, improving health outcomes and economic empowerment for underserved and diverse groups across the state.
Through our initiatives and partnerships, the Coyotes have become advocates for social change and inclusivity, making a lasting impact on the lives of many residents.
The Coyotes promote access to education through their community outreach programs and have served more than 40 Title 1 schools in the Valley while also enrolling 2,791 students in the Coyotes Reading Program. In addition, we actively collaborate with local nonprofits and organizations, culminating in more than $1.2 million in corporate philanthropy that served more than 60,000 individuals through community grants last season alone.
With a focus on education, health and youth development, the Coyotes aim to address the specific needs of the local community while encouraging young Latinos to envision a brighter future.
The Coyotes have made significant investments in youth hockey development programs, which play a vital role in empowering the Latino community. We work closely with local schools and community centers to introduce hockey to young Latinos through
Source: www2.claritas.com/Knowmore
Los Howlitos, a Spanish language learn-to-play program that is one of the first of its kind in the NHL.
We served more than 7,000 local youth by hosting 293 street hockey clinics. By hosting clinics and donating $87,225 in Arizona Kachinas scholarships, we enable aspiring athletes to pursue their passion for hockey and achieve their dreams.
The Coyotes have formed partnerships with organizations that are aligned with their core values to create a greater impact. Throughout the season, we highlight locally owned Latino businesses through their “Estrella of the Month” program and broadcast games in Spanish on the radio. The team was one of the main sponsors of the United States Hispanic Chamber of Commerce Annual Convention last year in Phoenix and leverages support and guidance from a Latino advisory council that is comprised of
“The impact we can make through sports is one of our guiding principles as an organization. Maintaining our club’s diverse representation while serving the Arizona community is at the forefront of who we are.”
—Xavier A. Gutierrez, Arizona Coyotes president and CEO
Hispanic representatives from both local and national companies to make key decisions on how to appropriately amplify our impact within the Valley’s Hispanic community.
The Coyotes are led by Xavier A. Gutierrez, the first Latino president and CEO in NHL history. He has assembled one of the largest female front offices in the NHL, including Liz Montaño, the first Latina chief operating officer in major professional sports. The Coyotes understand the importance of engaging the Latino community and providing opportunities for individuals to come together, celebrate their heritage and enjoy the sport of hockey.
“The impact we can make through sports is one of our guiding principles as an organization,” Gutierrez says. “Maintaining our club’s diverse representation while serving the Arizona community is at the forefront of who we are. We will always work tirelessly to amplify our support of the Latino community and celebrating our rich and diverse culture is a monumental part of that.
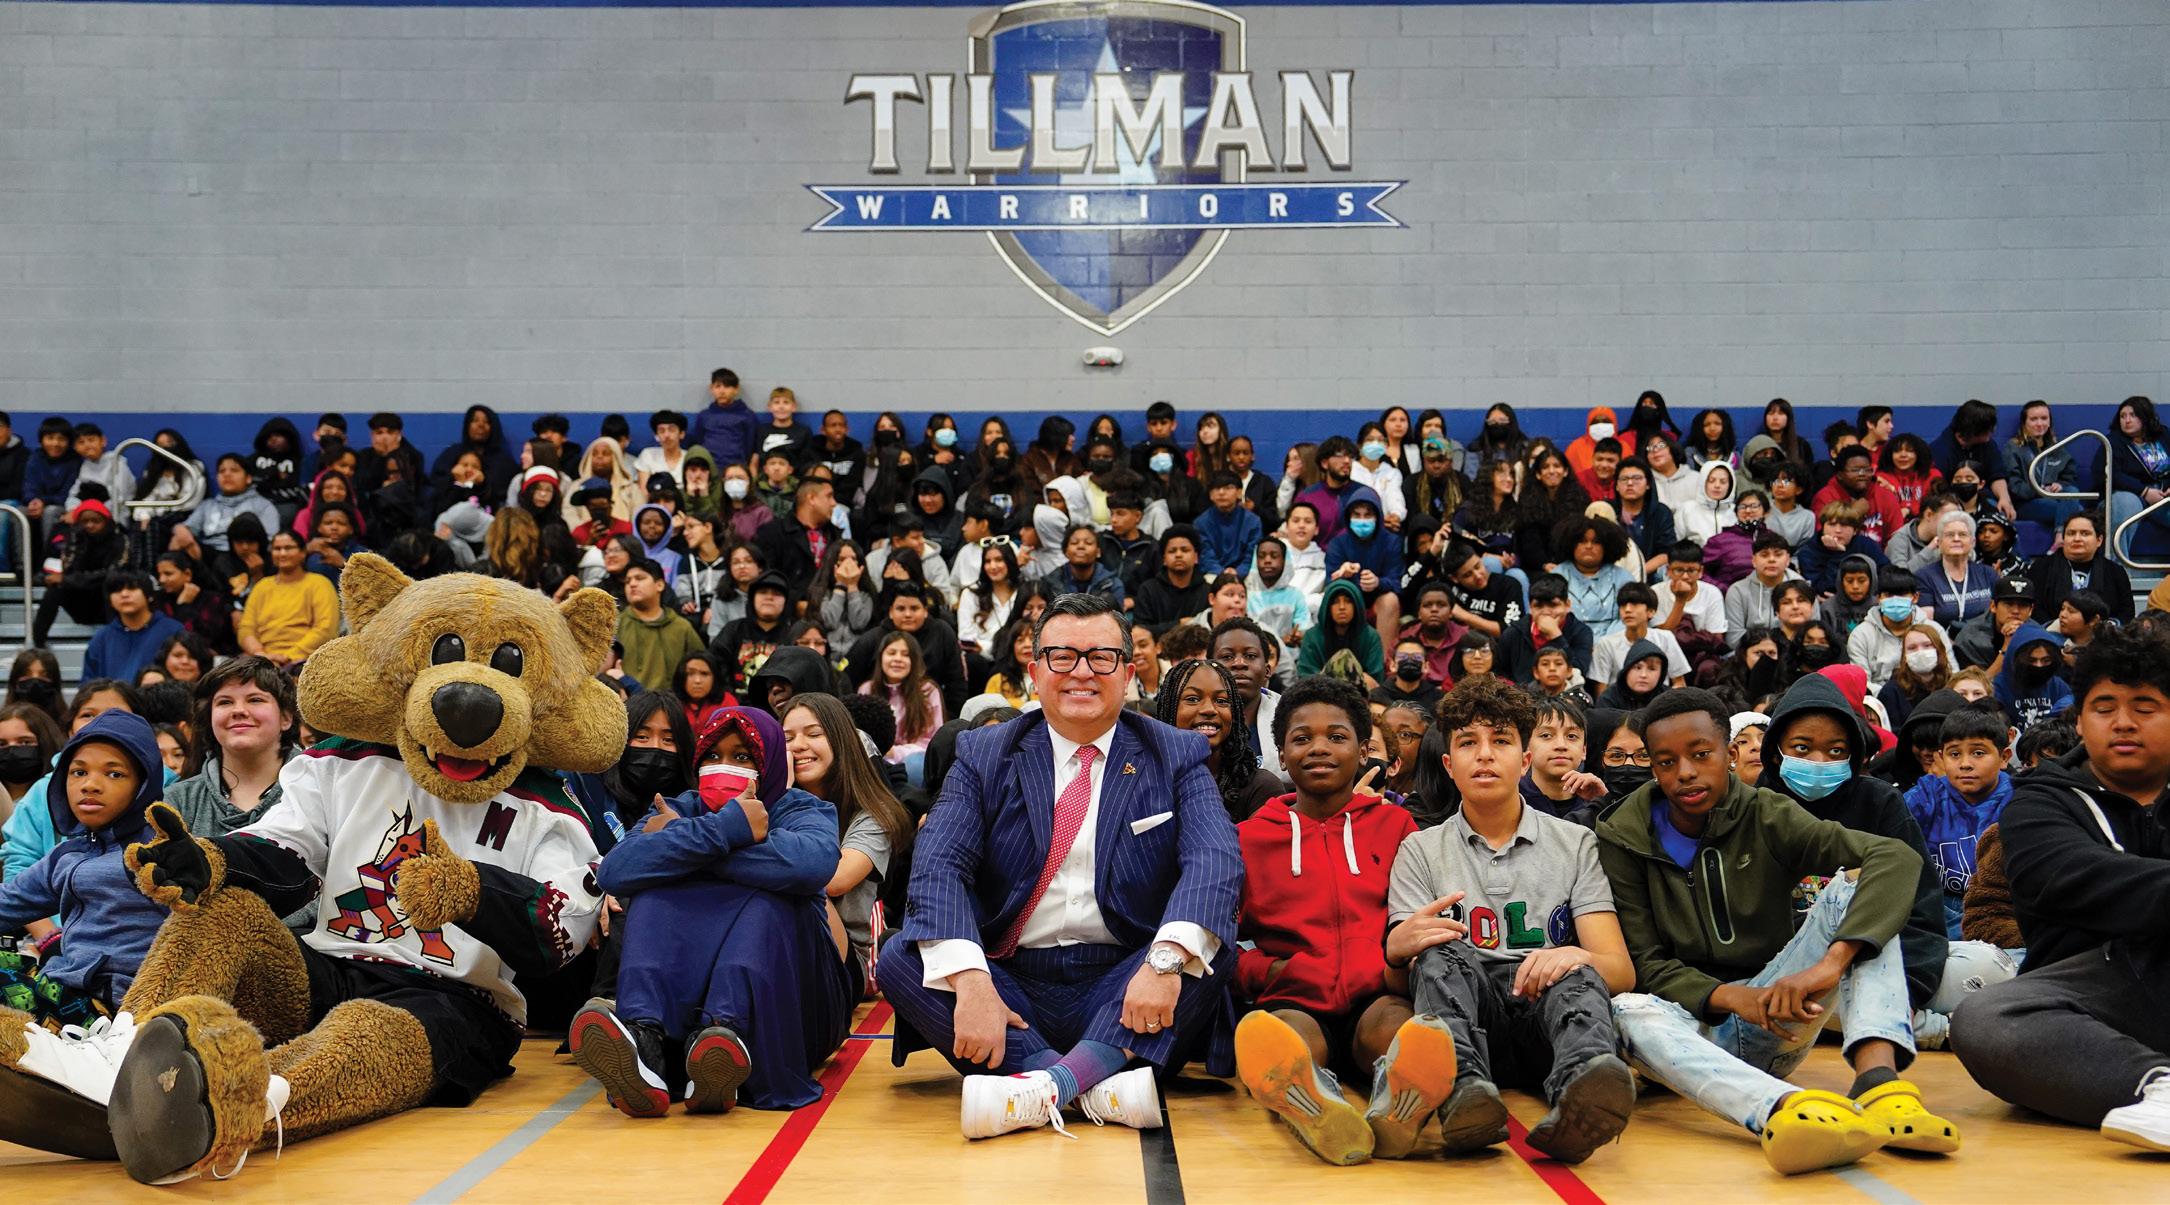
“We are proud to represent the Latino culture on one of the grandest stages in all of professional sports—the [NHL]—and will
continue to identify new ways to both engage and elevate others within our community.”
The Coyotes have demonstrated an unwavering commitment to helping and empowering Arizona’s Latino community. Through community outreach, youth development program and strategic partnerships, the team has made a significant difference in the lives of many. Our dedication to diversity and inclusivity should serve as an example for other sports organizations, showcasing how the power of sports can unite communities and create positive social change.
Artificial intelligence (AI) is hardly a new concept. AI first appeared in the 1950s, but the advances being made right now by companies such as OpenAI, are a giant leap forward that is nothing short of a technological revolution.
OpenAI’s generative pre-trained transformer (GPT) technology is a powerful language processing AI model. In November 2020, the company used GPT-3 to build ChatGPT, which had 175 billion parameters, making it the largest language model available at the time. GPT-4, which has one trillion parameters, was released March 14, 2023. It is currently used by ChatGPT Plus and Microsoft’s Bing Chat.
In simple terms, ChatGPT is defined by WhatIs.com as “an AI chatbot that uses natural language processing to create humanlike conversational dialogue. The language model can respond to questions and compose various written content, including articles, social media posts, essays, code and emails.
Here are just five examples of how the technology is currently being used:
GPT can understand and interpret human language. It comprehends context, semantics and can even detect emotions in text. This capability has paved the way for more effective virtual assistants, chatbots and customer service agents. Additionally, GPT offers sentiment analysis, content summarization and language translation.
One of GPT’s most impressive feats is its ability to generate human-like text. GPT can produce coherent and contextually appropriate content. This capability has helped fill knowledge gaps in various domains, but at the same time has raised concerns
Source: www2.claritas.com/Knowmore
about plagiarism in the academic community. In fact, the New York City public school system has banned the use of ChatGPT on school devices and networks.
OpenAI is an artificial intelligence (AI) research laboratory that has a nonprofit side (OpenAI, Inc.) and a for-profit corporation (OpenAI, L.P.) It was founded in 2015 by Elon Musk, Sam Altman, Greg Brockman, Ilya Sutskever, Wojciech Zaremba and John Schulman as a nonprofit research company. Musk left the company’s board in 2018, but in July of this year launched a challenge to ChatGPT called xAI.
The free ChatGPT app is available for both iOS and Android devices.
Users can buy tokens as needed (1000 words are 750 tokens).
This paid image application can be built into apps to generate and edit images and artwork with three different resolution options. openai.com
GPT has made significant strides in the field of education and e-learning. It can act as a virtual tutor, providing personalized learning experiences and addressing students’ queries in real time. GPT-powered platforms offer interactive lessons, quizzes and adaptive learning paths, enhancing the overall educational experience. Moreover, GPT has facilitated the creation of language learning applications, making learning a language more accessible and engaging for students worldwide.
GPT’s ingenuity extends to creative industries, including art, music and design. It can generate poetry, storytelling and even compose music based on user input or a particular style. Collaborations between artists and GPT have led to innovative creations that blend human creativity with the capabilities of artificial intelligence.
Businesses have harnessed the power of GPT for market research, brand positioning and customer insight. It can analyze customer
From ZDNET (April 21, 2023) What is AI? Everything to know about artificial intelligence

zdnet.com/article/what-is-ai-heres-everything-you-needto-know-about-artificial-intelligence
From Zendesk (Last updated July 12, 2023)
A guide to the best AI chatbots for businesses
zendesk.com/service/messaging/chatbot
Center for AI Safety safe.ai
From Smithsonian magazine (May 4, 2023)
The ‘Godfather of A.I.’ Now Warns of Its Dangers
smithsonianmag.com/smart-news/the-godfather-of-ainow-warns-of-its-dangers-180982108
From The Atlantic (Sept. 7, 2022) ChatGPT is Dumber Than You Think theatlantic.com/technology/archive/2022/12/chatgptopenai-artificial-intelligence-writing-ethics/672386
From The Fountain Institute (March 24, 2023) 5 Ethics Issues for ChatGPT and Design thefountaininstitute.com/blog/chat-gpt-ethics
From Forbes (April 30, 2023)
AI Ethicist Views On ChatGPT forbes.com/sites/cindygordon/2023/04/30/ai-ethicistviews-on-chatgpt/?sh=7e154708eb70
From Wired (Jan. 30, 2023) ChatGPT Is Making Universities Rethink Plagiarism
wired.com/story/chatgpt-college-universityplagiarism/
feedback, social media interactions and market trends to provide companies with a deeper understanding of consumer preferences and behavior. GPT’s language-generation capabilities have also been used to create persuasive advertisements and marketing content.
Clearly, as the scope of GPT continues to expand, so will its impact. From enhancing communications to streamlining processes and fostering innovation, GPT is becoming an indispensable tool for businesses, educators, researchers and creative types. It is crucial, however, to remain mindful of the ethical considerations and potential biases that may arise from its use.
—The opinion of Dr. Jürgen Schmidhuber published in a May 23, 2023, article on Forbes.com. Schmidhuber is a renowned German scientist and AI researcher who is widely regarded as one of the AI pioneers.
By leveraging GPT responsibly and ethically, however, scientists will be able to harness its full potential to further unlock human creativity and intelligence. It is a technological journey that is far from over—and is one that might take us even further than we ever could imagine.
Source: www2.claritas.com/Knowmore
‘…many of those who warn against the dangers of AI are just seeking publicity, exploiting the media’s obsession with killer robots, which has attracted more attention than good AI [that is] accurately detecting diabetes, cancer or heart disease early.’
PERSONAL EXPERIENCES OF U.S. RACIAL/ETHNIC MINORITIES IN TODAY’S DIFFICULT TIMES
August 2022
Source: National Public Radio (NPR), The Robert Wood Johnson Foundation and the Harvard T.H. Chan School of Public Health, “Personal Experiences of U.S. Racial/Ethnic Minorities in Today’s Difficult Times” (August 2022) rwjf.org/en/insights/our-research/2022/08/personal-experiences-of-u-s-racial-ethnic-groups-in-todays-difficult-times.html


Source: www2.claritas.com/Knowmore
The United States is enduring a difficult period, with a majority of the public concerned about strengthening the economy in a time when inflation has hit a 40-year high. This, coinciding with high levels of public concern with the ongoing Covid-19 pandemic, political conflict, difficulty with race relations, and an unaffordable housing market, have left many Americans facing serious problems across many facets of their lives
NPR, The Robert Wood Johnson Foundation, and the Harvard T.H. Chan School of Public Health conducted a national survey, Personal Experiences of U.S. Racial/Ethnic Minorities in Today’s Difficult Times, from May 16
June 13, 2022, to examine how these current events are affecting racial/ethnic minority populations in America today, and to examine differences between the experiences of minority communities compared with non-Hispanic Whites during this difficult economic time period. This report examines critical issues across a number of important areas that have surfaced across this period (including finances, housing, healthcare, safety, and neighborhood conditions), and how these areas are impacting African American/Black, Hispanic/Latino, Asian, and Native American/American Indian/Alaska Native individuals, households, and communities on a national scale.
This poll provides powerful evidence that several racial/ethnic minority communities are often much worse off than non-Hispanic Whites in the current period when it comes to facing serious problems with their finances, housing, healthcare, safety, and neighborhood conditions. In particular, high proportions of Black, Latino, and Native American adults report facing serious problems during this time. Among Asian adults in the U.S., the picture is more mixed. Asians comprise a highly diverse population in the United States,1 with income varying widely within the broader U.S. Asian population. When examining lower-income U.S. Asian adults’ experiences today, substantial shares report facing serious financial problems, including serious problems paying their mortgage or rent, serious problems affording medical care or prescription drugs, and serious problems affording food
Across racial/ethnic groups, notable shares of U.S. adults nationally report that housing affordability and crime are serious problems in their neighborhoods . In addition, many report they have not been able to get healthcare for family members when they needed it, among households with serious illnesses.
These findings raise important concerns about how difficulties in the current period are impacting wide shares of racial/ethnic minority communities. Significant shares of these households report they do not have emergency savings and are facing major problems paying basic costs of living, including food, rent, and medical care.
Main findings from this report include: 2
• SERIOUS FINANCIAL PROBLEMS – Currently, 55% of Black, 48% of Latino, 63% of Native American, and 29% of Asian adults in the U.S. say they are facing serious financial problems (Whites: 38%).
• INFLATION – 58% of Black, 56% of Latino, 69% of Native American, and 36% of Asian households say recent price increases have caused them serious financial problems (Whites: 44%).
1 See, for example, Pew Research Center, “Key facts about Asian Americans, a diverse and growing population,” (2021), available online: https://www.pewresearch.org/fact-tank/2021/04/29/key-facts-about-asian-americans/ 2 Individual-level questions reported as a percentage of adults, household -level questions reported as a percentage of households.
Source: www2.claritas.com/Knowmore
• EMERGENCY SAVINGS – Majorities of Black (58%), Latino (53%), and Native American (58%) adults say they do not have enough emergency savings to cover at least one month of their expenses, while 20% of Asian adults say this (Whites: 36%).
• EXPERIENCES WITH EVICTION – In the past year, 16% of Black renters, 10% of Latino renters, 21% of Native American renters, and 4% of Asian renters in the U.S. say they have either been evicted or threatened with eviction (Whites: 9%).
• HOUSING AFFORDABILITY – Majorities of adults across racial/ethnic identities say a lack of affordable housing to buy is a serious problem in their neighborhoods (Bla ck: 61%, Latino: 74%, Native American: 61%, Asian: 65%, White: 65%). In addition, a majority also say that lack of affordable rental housing is a serious problem in their neighborhoods (Black: 57%, Latino: 67%, Native American: 63%, Asian: 59%, White: 62%).
• FEAR OF BEING THREATENED OR PHYSICALLY ATTACKED – In the past year, 25% of Black adults, 26% of Latino adults, 36% of Native American adults, 21% of Asian adults, and 19% of White adults say they have feared someone might threaten or physical ly attack them in their neighborhood.
• DELAYED CARE FOR SERIOUS ILLNESSES – Among U.S. households where anyone has been seriously ill in the past year, 24% of Black households, 18% of Latino households, 35% of Native American households, 10% of Asian households, and 18% of White households say they were unable to get medical care for serious illnesses when they needed it in the past year.
• FALLING BEHIND IN ACHIEVING LIFE GOALS – In terms of achieving their goals in life, 50% of Black adults, 50% of Latino adults, 45% of Native American adults, and 33% of Asian adults say they have fallen behind in the past year (White adults: 40%).
• SERIOUS PROBLEMS AMONG LOWER-INCOME U.S. ASIAN ADULTS – Given the economic diversity of the U.S. Asian population, we examined results among lower-income U.S. Asian adults (earning <$50,000/year) only, and found notable problems including that 46% of lower-income Asian adults in the U.S. say they are facing serious financial problems. This includes sizeable shares reporting serious problems paying their mortgage or rent (32%), serious problems affording food (28%), and serious problems affording medical care or prescription drugs (24%) When it comes to concerns about inflation, more than half (56%) of lower-income Asian households say recent price increases have caused them serious financial problems. On community problems, 50% of lower -income U.S. Asian adults think a lack of good jobs is a serious problem in their local community.
• RATING K-12 SCHOOLS – Among households with children enrolled in K-12 last school year, 34% of Black adults, 22% of Latino adults, 15% of Asian adults, and 24% of White adults rated the quality of their children’s education as only fair or poor (too few Native American households with children in K12 were interviewed to report this result).
• COLLEGE OPPORTUNITIES FOR CHILDREN – These findings point to the importance parents place on opportunities for their children to attend college in the future. Across racial/ethnic lines, the overwhelming majority of households with children under 18 believe their children will graduate from college in the future (Black: 84%, Latino: 84%, Native American: 84%, Asian: 92%, White: 83%).
Source: www2.claritas.com/Knowmore
• NEARLY 40% OF ARIZONA HISPANIC ELIGIBLE VOTERS ARE NOT YET REGISTERED TO VOTE
• THE 118TH U.S. CONGRESS IS THE MOST RACIALLY AND ETHNICALLY DIVERSE TO DATE
• THE U.S. HOUSE OF REPRESENTATIVES IS MORE DIVERSE THAN THE SENATE IN THE 118TH U.S. CONGRESS
• U.S. CITIZENSHIP FOR UNDOCUMENTED IMMIGRANT POPULATION
• IN TERMS OF THE NUMBER OF UNAUTHORIZED IMMIGRANTS, ARIZONA IS 9TH AMONG STATES
• UNDOCUMENTED IMMIGRANTS IN THE U.S. WORK IN CRITICAL CONDITIONS
• BETWEEN 2020 AND 2021, ARIZONA HAD THE 3RD LARGEST PRISONER POPULATION PERCENT DECREASE IN THE U.S.
• IMPRISONMENT RATES OF U.S. RESIDENTS BY SEX AND RACE/ETHNICITY
• HISPANICS REPRESENT NEARLY ONE-FOURTH OF THE U.S. SENTENCED PRISONER POPULATION
• THE IMPRISONMENT RATE OF THE U.S. BLACK POPULATION IS HIGHER THAN ANY OTHER RACIAL/ETHNIC GROUP
• THERE HAS BEEN A DRASTIC INCREASE RECENTLY IN MINORS EMPLOYED IN VIOLATION OF U.S. CHILD LABOR LAWS
Univision Communications looks at the legal services available and used by Hispanics in Phoenix and Tucson
There currently are two immigration reform bills before Congress, but will we ever see a viable solution to our immigration crisis?
BY KAREN MURPHYThe Supreme Court’s recent ruling in 303 Creative vs. Elenis threatens not only LGBTQ+ rights, but other group’s civil liberties may be next
BY KAREN MURPHYAccording to the Bureau of Justice Statistics at the U.S. Department of Justice, adult imprisonment in the U.S. declined 30% between 2011 and 2021
This UnidosUS position paper is a primer that includes historic examples of systemic racism against Hispanics—and the sad reality that we are still dealing with this problem today

*NOTE: Voter Population includes U.S. citizens who are of voting age (18 years of age or older). This population may include individuals who are ineligible to vote for reasons other than lack of citizenship or who are under 18 years of age. Voter registration rates apply to the November 2022 elections.
Source: KFF, “Voting and Voter Registration as a Share of the Voter Population, by Race/Ethnicity,” November 2022 www.kff.org/other/state-indicator/voting-and-voter-registration-as-a-share-of-the-voter-population-by-raceethnicity/?currentTimeframe=0&sortModel=%7B%22colId%22:%22Location%22,%22sort%22:%22asc%22%7D
NOTE: The data does not include nonvoting delegates or commissioners. Figures for the 118th Congress are as of Jan. 3, 2023. Hispanics are of any race. Members who have more than one racial or ethnic identity for the above groups are counted in each applicable group.
40% OF ARIZONA HISPANIC ELIGIBLE VOTERS ARE NOT YET REGISTERED TO VOTE
THE 118TH U.S. CONGRESS IS THE MOST RACIALLY AND ETHNICALLY DIVERSE TO DATESource: Pew Research Center, “U.S. Congress continues to grow in racial, ethnic diversity,” Katherine Schaeffer, January 9, 2023 www.pewresearch.org/fact-tank/2023/01/09/u-s-congress-continues-to-grow-in-racial-ethnic-diversity/
THE U.S. HOUSE OF REPRESENTATIVES IS MORE DIVERSE THAN THE SENATE IN THE 118TH U.S. CONGRESS THE HOUSE OF REPRESENTATIVES
PERCENTAGE AND NUMBER OF U.S. MEMBERS OF CONGRESS BY RACE/ETHNICITY (118TH CONGRESS, 2023)
THE U.S. HOUSE OF REPRESENTATIVES IS MORE DIVERSE THAN THE SENATE IN THE 118TH U.S. CONGRESS THE HOUSE OF REPRESENTATIVES (434 MEMBERS)
THE SENATE (100 MEMBERS)
PERCENTAGE AND NUMBER OF U.S. MEMBERS OF CONGRESS BY RACE/ETHNICITY (118TH CONGRESS, 2023)
6 % 3.2% 0.9% 0.9%
1 0 . 6 % 3.2% 0.9% 0.9%
THE SENATE (100 MEMBERS)
The data does not include nonvoting delegates or commissioners. Figures for the 118th Congress are as of Jan. 3, 2023. Hispanics are of any race. The four members who have more than one racial or ethnic identity for the above groups are counted only once, as multiracial.
Schaeffer,
Source: Pew Research Center, “U.S.
in-racial-ethnic-diversity/
Source: Pew Research Center, “U.S. Congress continues to grow in racial, ethnic diversity,” Katherine Schaeffer, January 9, 2023 www.pewresearch.org/facttank/2023/01/09/u-scongress-continues-to-growin-racial-ethnic-diversity/
12.2% 1 0 . 6 % 3.2% 0.9% 0.9%
NOTE: The data does not include nonvoting delegates or commissioners. Figures for the 118th Congress are as of Jan. 3, 2023. Hispanics are of any race. The four members who have more than one racial or ethnic identity for the above groups are counted only once, as multiracial.
.
72.1%
WH I TE BLACK
72.1% 12.2% 1 0
3% 6 %
3% 6 % 2%
Source: Pew Research Center, “U.S. Congress continues to grow in racial, ethnic diversity,” Katherine Schaeffer, January 9, 2023 www.pewresearch.org/fact-tank/2023/01/09/u-s-congress-continues-to-grow-in-racial-ethnic-diversity/
H I S P A N I C AS IAN AMERICAN AMERICAN INDIAN AND ALASKA NA TIVE M ULTIRACIAL
72.1% WH I TE BLACK H I S P A N I C AS IAN AMERICAN AMERICAN INDIAN AND ALASKA NA TIVE M ULTIRACIAL
WH I TE BLACK H I S P A N I C AS IAN AMERICAN AMERICAN INDIAN AND ALASKA NA TIVE M ULTIRACIAL
NOTE: The data does not include nonvoting delegates or commissioners. Figures for the 118th Congress are as of Jan. 3, 2023. Hispanics are of any race. The four members who have more than one racial or ethnic identity for the above groups are counted only once, as multiracial.
ABOUT 93% OF THE UNDOCUMENTED IMMIGRANT POPULATION (ESTIMATED 9.3 MILLION) BELONG TO GROUPS THAT U.S. LEGISLATORS HAVE PROPOSED BE ELIGIBLE TO EARN U.S. CITIZENSHIP. This includes:
MILLION
Essential Workers
Individuals Living in the U.S. for 10+ Years
Parents of U.S. Citizen Minor Children
Spouses of U.S. Citizens
Dreamers* Who Came to the U.S. As Children
Farmworkers
Individuals With Temporary Protected Status
Individuals Seeking Asylum and Awaiting a Decision
Individuals Waiting for an Adjustment or Change of Status
*NOTE: At press time, a federal judge ruled again that the Deferred Action for Childhood Arrivals program (DACA) was illegal. According to a September 13 New York Times article, “…the judge did not mandate an immediate end to the program. Current applicants will be able to keep and renew their protection [but no] new applications will be allowed.”
Source: FDW.us, Pathways to Citizenship for Undocumented Immigrants, June 14, 2021 www.fwd.us/news/pathway-to-citizenship/
AMERICAN 72.1%
AMERICAN AMERICAN INDIAN
W HITE BLACK H I S P A N I C A SIAN AMERICAN
NA
NOTE: This data tool is based on a methodology that imputes unauthorized status using U.S. Census Bureau 2015-19 American Community Survey (ACS) and 2008 Survey of Income and Program Participation (SIPP) data, weighted to 2019 unauthorized immigrant population estimates provided by Jennifer Van Hook of The Pennsylvania State University.
PERCENTAGE OF OCCUPATIONS THAT ARE WORKED BY UNDOCUMENTED IMMIGRANTS IN THE U.S. (2019)
Source: FDW.us, Pathways to Citizenship for Undocumented Immigrants, June 14, 2021 www.fwd.us/news/pathway-to-citizenship/
BETWEEN 2020 AND 2021, ARIZONA HAD THE 3RD LARGEST PRISONER POPULATION PERCENT DECREASE IN THE U.S.
*NOTE: Jurisdiction refers to the legal authority of state or federal correctional officials over a prisoner, regardless of where the prisoner is held. Estimates show the percent change in the total number of prisoners with any sentence status on December 31, 2020 and December 31, 2021.
On Dec. 31, 2021, Hispanic males were more than twice as likely as white males in each age group to be in prison on a sentence.
At year-end 2021, more sentenced female prisoners were white (47% or 37,200) than Hispanic (19% or 15,200) or Black (17% or 13,500).
Among females of all ages at year-end 2021, those who were Black (62 per 100,000) or Hispanic (49 per 100,000) were imprisoned at a higher rate than those who were white (38 per 100,000), despite the larger number of white females in the U.S. prison population.
IMPRISONMENT RATES OF U.S. RESIDENTS BY SEX AND RACE/ ETHNICITY
PERCENTAGE
HISPANICS REPRESENT NEARLY ONE-FOURTH OF THE U.S. SENTENCED PRISONER POPULATION
NOTES:
*Jurisdiction refers to the legal authority of state or federal correctional officials over a prisoner, regardless of where the prisoner is held. Counts are for December 31 of each year and are based on prisoners with a sentence of more than 1 year.
**Excludes persons of Hispanic origin (e.g., “white” refers to non-Hispanic white persons and “Black” refers to non-Hispanic Black persons). Race estimates are rounded to the nearest 100. ***Race or Hispanic origin estimates are rounded to the nearest 100.
****Excludes persons of Hispanic origin (e.g., “white” refers to non-Hispanic white persons and “Black” refers to non-Hispanic Black persons). Race estimates are rounded to the nearest 100. Includes Asians, Native Hawaiians and Other Pacific Islanders.
IMPRISONMENT RATES OF U.S. RESIDENTS OF ALL AGES, BASED ON SENTENCED PRISONERS UNDER THE JURISDICTION OF STATE OR FEDERAL CORRECTIONAL AUTHORITIES BY RACE/ETHNICITY* (2021)
THE IMPRISONMENT RATE OF THE U.S. BLACK POPULATION IS HIGHER THAN ANY OTHER RACIAL/ ETHNIC GROUP
350 181
NOTES:
901 4 3 4 763 72
TOTAL WHITE** BLACK** H ISPANIC AMERICAN INDIAN/ALASKA NATIVE**
ASIAN***
*Jurisdiction refers to the legal authority of state or federal correctional officials over a prisoner, regardless of where the prisoner is held. Imprisonment rate is the number of sentenced prisoners under state or federal jurisdiction per 100,000 U.S. residents or per 100,000 U.S. residents in a given category. Rates are for December 31 of each year and are based on prisoners with a sentence of more than 1 year. Resident population estimates are from the U.S. Census Bureau for January 1 of the following year.
**Excludes persons of Hispanic origin (e.g., “white” refers to non-Hispanic white persons and “Black” refers to non-Hispanic Black persons).
***Excludes persons of Hispanic origin (e.g., “white” refers to non-Hispanic white persons and “Black” refers to non-Hispanic Black persons). Includes Asians, Native Hawaiians and Other Pacific Islanders.
of Justice Statistics (BJS), “Prisoners in 2021 — Statistical Tables,” E. Ann Carson, December 2022 bjs.ojp.gov/library/publications/prisoners-2021-statistical-tables


How many times have you heard that the current immigration system is broken and doesn’t work—for border communities, for those seeking asylum or for people just looking for freedom and opportunity in the United States?
First, a little recent history and some facts. In 2020, the Trump Administration invoked Title 42 of the U.S. Code to swiftly turn away migrants at the U.S.—Mexico border during the COVID-19 pandemic. Until the Trump Administration invoked Title 42, it was a rarely used clause of the 1944 Public Health Services Law that addressed public health, social welfare and civil rights and allowed the federal government to take emergency action to keep communicable diseases out of the U.S. It expired May 11 after the public health emergency for COVID-19 was lifted.
Since its expiration, U.S. immigration policy has returned to the standard rules of immigration enforcement known as Title 8. According to a May 25 article on the Migration Policy Institute website, the change “simply sped up a transition that was already well underway. In April, just before Title 42 was lifted, 65 percent of unauthorized arrivals were processed under Title 8,” which allows for expedited removal without a hearing. According to the article, those deported under Title 8 “are barred from re-entering the country for five years and face criminal charges if they attempt another unlawful re-entry. On the other hand, people expelled under Title 42 faced no such sanctions.”
To address some of the issues at the border, the Biden administration has unveiled a proposal that has two main categories (see sidebar on p.354). As part of the administration’s plan, the government
has created a phone app, known as CBP One, to help migrants in northern and central Mexico try to secure an appointment to enter the U.S. at a port of entry along the southern border. Although there have been glitches with the app, a July 3 story in the New York Times reported that, according to recent government data, “nearly 30,000 used it to make appointments in May alone.”
The pandemic made it clear once again that it is long past time for serious immigration reform because the issues that cause the
Title 8 vs Title 42
OCT 2022 — JUNE 2023
AT THE BORDER, WHAT HAPPENS NOW THAT TITLE 42 HAS EXPIRED?
The Dignity Act of 2023
The Dignity for Immigrants while Guarding our Nation to Ignite and Deliver the American Dream Act of 2023, or “DIGNIDAD (Dignity) Act of 2023” is a bipartisan immigration reform bill introduced by U.S. Reps. Maria Salazar (R-FL-25) and Veronica Escobar (D-TX-16).
• Secures the Border
• Mandates E-Verify
• Reforms the Asylum System
• Protects Dreamers
• Dignity Program: Offers undocumented immigrants a seven-year program for renewable legal status
• Redemption Pathway: An optional path to more permanent legal
The U.S. Citizenship Act of 2023 (H.R. 3194)
status, with enhanced criteria, for those who have completed the Dignity Program
• Provides workforce retraining for unemployed or displaced American workers
• Implements market-based reforms for agricultural and guest workers
• Eliminates backlogs and improves our legal immigration system, ensuring U.S. competitiveness
This act was introduced on May 10 of this year by U.S. Rep.
1. Addresses the root causes of migration from Central America by funding President Biden’s four-year plan to increase assistance to El Salvador, Guatemala and Honduras based on their ability to reduce the corruption, violence, poverty and famine that now cause people to flee.
2. Creates safe and legal channels for people to seek protection, so they can apply for legal status in Central America instead of making the dangerous journey north.
3. Cracks down on bad actors by enhancing the U.S. government’s ability to prosecute individuals involved in smuggling, narcotics and trafficking networks who are responsible for drugs flowing into our country and the
exploitation of migrants. It also expands transnational anti-gang task forces in Central America.
4. Modernizes the border using technology that enhances our ability to detect contraband and counter transnational criminal networks since illicit drugs are most likely to be smuggled through legal ports of entry.
5. Protects border communities by providing for additional rescue beacons to prevent needless deaths along the border, requiring agent training and oversight to investigate criminal and administrative misconduct and requiring department-wide policies governing the use of force.
LEARN MORE
One-page summary escobar.house.gov salazar.house.gov
LEARN MORE
lindasanchez. house.gov/ uscitizenshipact
There are two main categories for the proposals unveiled in April by the Biden Administration: building lawful pathways and imposing consequences.
• Creating regional processing centers, initially in Guatemala and Colombia with other locations to follow, to allow individuals from the region to be screened for entry via legal pathways to the United States, Canada and Spain;
• Streamlining the family reunification processes for Cubans and Haitians and expanding processes to Salvadorans, Hondurans, Guatemalans and Colombians;
• Doubling refugee resettlement from the region; and
• Increasing the number of Customs and Border Patrol (CBP) appointments per day using the CPB One app.
• Cubans, Haitians, Nicaraguans and Venezuelans arriving irregularly will continue to be removed to Mexico.
• The Department of Homeland Security will expand expedited removals, including repatriation flights, removals of families, an expanded alternatives to detention (ATD) program and detention for single adults.
• Cubans and Haitians interdicted at sea will no longer be eligible for the parole programs.
• An agreement between the United States, Panama and Colombia to stop migration through the Darién Gap between Panama and Colombia that links North and South America.
SOURCE: The Migration Policy Institute, “A Post-Title 42 Vision for Migration Management Comes into Focus,” by Doris Meissner, Ariel G. Ruiz Soto and Colleen Putzel-Kavanaugh (April 2023)
crisis at the border—violence, poverty and political instability— are not going away any time soon. It has been too long since the Reagan Administration enacted the Immigration and Reform Control Act of 1986 that introduced civil and criminal penalties for hiring undocumented immigrants or those unauthorized to work in the U.S. and gave an estimated 3 million people, mostly of Hispanic descent, legal status. Right now, there are two significant bills before Congress that attempt to address the main issues of immigration reform: The Dignity Act of 2023 and The U.S. Citizen Act of 2023 (H.R. 3194) (see p.353).
Karen Murphyis anAZHCC staffwriterand copyeditor/proofreader.From the Migration Policy Institute U.S. Border Asylum Policy Enters New Territory Post-Title 42 migrationpolicy.org/article/border-after-title-42
A Post-Title 42 Vision for Migration Management Comes into Focus migrationpolicy.org/news/post-title-42-vision-migrationmanagement
From the American Immigration Council A Guide to Title 42 Expulsions at the Border americanimmigrationcouncil.org/research/guide-title-42expulsions-border
From Advocacyfor Human Rights in the Americas 10 Things to Know About the End of Title 42 wola.org/analysis/end-title-42
The CPB One Mobile Application cbp.gov/about/mobile-apps-directory/cbpone
Prior to 2023, the LGBTQ+ community had won two major, hardfought victories in the Supreme Court: In 2015, the Supreme Court legalized same-sex marriage nationwide and in 2020, extended federal protections to gay, lesbian and transgender workers.

It is unfortunate how things can change so quickly. This year, the Supreme Court is backtracking on LGBTQ+ rights, cheered on by conservatives. In its most recent ruling (303 Creative LLC v. Elenis), the Court reversed the ruling of the U.S. Court of Appeals for the 10th Circuit with a 6-3 vote along ideological lines, saying that the Colorado Anti-Discrimination Act (CADA) violated the First Amendment free speech rights of Christian web designer Lori Smith, affirming her right to refuse to create websites that celebrate same-sex marriage because of her religious beliefs.
This ruling follows the 2018 ruling in Masterpiece Cakeshop v. Colorado Civil Rights Commission. According to Ballotpedia, in this ruling “the Colorado Civil Rights Commission had violated the state’s constitutional obligation to treat religious expression neutrally when it showed religious hostility in an antidiscrimination case involving a baker who refused on religious grounds to make a wedding cake for a same-sex couple. The court reversed the commission’s decision requiring the bakery to provide wedding cakes to same-sex couples but did not rule on the broader constitutional questions of freedom of religion and antidiscrimination.”
Conservatives applauded the Supreme Court’s most recent decision because they believe it protects not only free speech
TheSupremeCourt’srecentrulingin 303 Creative vs. Elenis threatensnotonly LQBTQ+rights,butothergroup’scivil libertiesmaybenext
Local Heroes Awards
Oct. 13, 2023 @ 11:30am—1:30pm
Sheraton Grand, Phoenix
This year’s awards will honor Sen. Kristen Sinema, Sarah Krahenbuhl (Phoenix Suns), Terri Kimble (Chandler Chamber of Commerce), Jennie Patel (NCAA Mens’ Final Four Local Organizing Committee), Paul Rockower (Jewish Community Relations Council of Greater Phoenix) and Gabe Hagen and Jesse Shank (Brick Road Coffee). In addition, Lynette Braddock , will receive the Unity Agent honor. Braddock is an Arizona mom who has advocated tirelessly for her daughter Chloe, a transgender young woman currently in law school.
March 2, 2024 @ 10am—6pm
Downtown Mesa
onecommunity.com/block-party-for-equality
CONTACT
Angela Hughey
480.355.0088
angela@onecommunity.com
onecommunity.com

rights, but it also protects all Americans from discrimination. Liberals saw the decision in a completely opposite way: as a slippery slope that will dismantle the previous LQBGTQ+ wins and could lead to civil rights issues for other minority groups. What is certain is that this recent ruling will lead to many more court filings.
In response to the decision, Justice Sonia Sotomayor wrote that the decision in favor of 303 Creative gave businesses “a new license to discriminate.” She also said in her dissent that it “threatens to balkanize the market and to allow the exclusion of other groups from many services.”
According to the Movement Advance Project, a nonprofit think tank that advocates for LGBTQ+ rights, 22 states plus the U.S. Virgin Islands and Washington, D.C., already had laws in place that prohibit discrimination based on sexual orientation or gender identity. Another five states interpret “existing prohibition(s) on sex discrimination to include sexual orientation and/or gender identity.”
While Colorado seems to have risen to the center of the fight over LGBTQ+ rights in the United States, Arizona—and one tireless crusader in particular named Angela Hughey—has united the citizens of Arizona in defense of LGBTQ+ rights. A March 14, 2022, story on azcentral.com, the online presence for The Arizona Republic newspaper, tells the story behind her activism.
The day after she was finally able to marry her longtime partner in October 2008, she bought the domain for the group she wanted to create called ONE Community. But it was when AZ Senate Bill 1062 was on the table in 2014 that her attitude really changed. The bill, which would have allowed businesses to refuse service based on religion, reminded her a lot of SB 1070, which allowed law enforcement to stop, detain and arrest anyone “reasonably suspected” of being undocumented.
In the article, she said she had to decide whether she “would she leave Arizona for a state whose government more closely aligned with her own values, or would stay and work to make the state friendlier to those of all backgrounds.”
“We have a responsibility to participate in the process and to educate people about the harms these things are going to do,” Hughey said in the AZCentral article. “While 1070 was meant to harm Hispanic people and SB 1062 was meant to discriminate against LGBTQ people, when you harm any Arizonan you harm all Arizonans.”
After she co-founded ONE Community, Hughey and her team at ONE Community created in 2013 what they called a “Unity Pledge,” which called for nondiscriminatory LGBTQ+ protections and practices in the workplace, housing and public accommodations. To date, more than 3,400 businesses and more than 21,000 people have signed the Unity pledge.
She is also the president of Equality and Fairness for All Americans Coalition (EFC), which is a bipartisan group of LGBTQ organizations, faith organizations, businesses, trade associations, civic leaders and American citizens, which also has a pledge on its website you can sign to support the group in its efforts to advance equality and federal nondiscrimination protections for all Americans. Links to sign both pledges can be found in the Resources Box on this page.
Commenting on the most recent Supreme Court decision, Hughey had this to say: “The U.S. Supreme Court ruling on 303 Creative LLC v. Elenis is a step in the wrong direction for our nation that will only sow greater division instead of bringing Americans together based on common values of freedom and liberty for all. The ruling not only legalizes discrimination against LGBTQ+ people, but also creates a dangerous path to legalize discrimination against most Americans in all areas of public accommodations and daily life.
“In ruling that a business may deny service to a LGBTQ+ individual based on religious beliefs, the Court has created a dangerous precedent to legalize discrimination based on a wide variety of protected characteristics, including religion.”
Karen Murphyis anAZHCC staffwriterand copyeditor/proofreader.Equality and Fairness
for all Americans Coalition (EFC) equalityandfairness.com
Sign the Pledge equalityandfairness.com/individuals_sign_on
ONE Community onecommunity.com
Sign the UNITY Pledge
The UNITY Pledge is an effort by Arizona businesses, organizations and individuals to advance workplace equality and equal treatment in housing, workforce and public accommodations. openaz.co
ONE Community Business Directory directory.onecommunity.co/listing
From the Arizona Office of Tourism Grand Connection
Angela Hughey tourism.az.gov/angela-hughey
UNDER FIRE SERIES:
The War on LGBTQ People in America
This report is part ofthe “Under Fire” series from The Movement Advancement Project (MAP) on ways that LGBTQ people are under siege from a targeted and coordinated campaign to undermine equality and ultimately erase LGBTQ people from public life.
https://www.mapresearch.org/under-fire-report
From The New Republic (June 29, 2023)
The Mysterious Case of the Fake Gay Marriage Website, the Real Straight Man and the Supreme Court
In filings in the 303 Creative v. Elenis case is a supposed request for a gaywedding website—but the man named in the request says he neverfiled it.
newrepublic.com/article/173987/mysterious-case-fake-gaymarriage-website-real-straight-man-supreme-court
SUMMARY NCJ 305125
The number of persons in prison in the United States decreased 1% from 2020 to 2021. This was the eighth consecutive year that the number of persons in U.S. prisons declined, dropping from 1,221,200 at yearend 2020 to 1,204,300 at yearend 2021. Over the 10-year period from 2011 to 2021, the adult imprisonment rate declined 30%. The imprisonment rate for adult U.S. residents in state or federal prison serving a sentence of more than one year also declined (down 2%) from yearend 2020 to 2021, from 460 to 449 sentenced prisoners per 100,000 adult U.S. residents.
The national decline in the prison population from 2020 to 2021 reflected a decrease in prison populations in 32 states that was offset by an increase in 17 states and the federal Bureau of Prisons (BOP). This state variance differs from 2019 to 2020, when 49 states (data for Idaho are not comparable) and the BOP had a decrease in the number of persons in prison, largely due to the COVID-19 pandemic.
Among racial and ethnic groups, black persons had the highest imprisonment rate in 2021 (1,186 per 100,000 adult black residents), followed by American Indians and Alaska Natives (1,004 per 100,000); Hispanics (619 per 100,00); white persons (222 per 100,000); and Asians, Native Hawaiians, and Other Pacific Islanders (90 per 100,000). Compared to 2011, adult imprisonment rates declined for all racial and ethnic groups in 2021, including a 40% decrease for black persons; 37% for Hispanics; 34% for Asians, Native Hawaiians, and Other Pacific Islanders; 27% for white persons; and 26% for American Indians and Alaska Natives.
More than 651,800 persons (62% of all state prisoners) were serving sentences in state prison for a violent offense at yearend 2020, the most recent year for
DECEMBER 2022
Sentenced prisoners under the jurisdiction of state or federal correctional authorities, 1996–2021
Note: Jurisdiction refers to the legal authority of state or federal correctional officials over a prisoner, regardless of where the prisoner is held. Counts are for December 31 of each year and are based on prisoners with a sentence of more than 1 year. As of December 31, 2001, persons sentenced for a felony in the District of Columbia were the responsibility of the Federal Bureau of Prisons. Counts for 2019 and earlier may have been revised from previous reports.
Source: Bureau of Justice Statistics, National Prisoner Statistics, 1996–2021.
which offense data were available. Forty-seven percent (66,500) of all persons in federal prison were serving time for a drug offense on September 30, 2021 (the most recent date for which federal prison offense data were available), and an additional 20% (28,500) of persons sentenced to federal prison were serving a sentence for a weapons offense.
At yearend 2021, private facilities contracted to state departments of corrections or the BOP held 96,700 persons, a 3% decrease from yearend 2020. Local jail facilities held an additional 65,400 state or federal prisoners, down 11% from yearend 2020. Together, private and local facilities housed more than 13% of the total U.S. prison population in 2021.
The full report (Prisoners in 2021 – Statistical Tables, NCJ 305125), related documents, and additional information about the Bureau of Justice Statistics are available on the BJS website at www.bjs.ojp.gov.
Source: U.S. Department of Justice, Bureau of Justice Statistics (BJS), “Prisoners in 2021 — Statistical Tables,” E. Ann Carson, December 2022 bjs.ojp.gov/library/publications/prisoners-2021-statistical-tables


This paper was co-authored by Viviana López Green, Senior Director, Racial Equity Initiative, and Samantha Vargas Poppe, consultant to UnidosUS. This paper reflects the ideas, input, and advice of numerous contributors, and the authors thank the following colleagues for providing detailed insight, feedback, corrections, and support throughout the writing process:
• David Castro
Senior Director, Content Development
• Amalia Chamorro Director, Education Policy Project
• Alberto Gonzalez
Senior Strategist, Health Policy Project
• Amanda Martinez
Education Policy Analyst
• Margaret Maynard
Intern, Racial Equity Initiative
Source: UnidosUS, “Toward a More Perfect Union: Understanding Systemic Racism and Resulting Inequity in Latino Communities,” Viviana Lopez and Samantha Vargas Poppe (April 2021) unidosus.org/publications/2128-toward-a-more-perfect-union-understanding-systemic-racism-and-resulting-inequity-in-latino-communities
TOWARD A MORE PERFECT UNION:
Acknowledgments continued:
• Eric Rodriguez
Senior Vice President Policy and Advocacy
• Claudia Ruiz
Civil Rights Policy Analyst
• Emily Ruskin Senior Policy Analyst
Immigration Initiatives
• Agatha So Policy Analyst, Wealth-Building Initiative
• Tania Valencia
Education Policy Analyst
• Meggie Weiler
Senior Economic Policy Analyst
• Zandra Zuno Baermann
Senior Vice President
Communications and Marketing
The authors also wish to express special appreciation to Emily Mace, UnidosUS Consultant, for her expert editorial assistance and review, Stephanie Presch, Content Specialist, for her help in editing this publication, and Kelly Isaac, Design and Brand Manager, for formatting and designing the paper.
The authors acknowledge the guidance of Charles Kamasaki, Senior Cabinet Advisor, who assisted in every aspect of the paper’s preparation and provided direction for its completion.
Permission to copy, disseminate, or otherwise use information from this paper is granted, provided that appropriate credit is given to the authors and to UnidosUS.
The views and opinions reflected in this paper are those of the authors and UnidosUS and do not necessarily reflect the positions of any UnidosUS funders or any of the individuals who provided assistance.

The COVID-19 pandemic and Black Lives Matter protests across the country have fueled an unprecedented national conversation on racial justice. Still, this national discourse often ignores how historical and institutional dynamics produce cumulative and persistent disparities for Latino* communities in this country.
This exclusion reflects a long history and set of experiences regarding Latinos in the United States that is often hidden and difficult to quantify. The idea of a “Hispanic” category did not officially exist until 1970, and then only in obscure government reports; it wasn’t until 1980 that Hispanics were fully counted in the census. Thus, to many Americans, the inequitable experiences of Latinos remained mostly invisible in government data sets and accountability efforts. Even today, it’s challenging to fully and accurately capture the rich diversity of Latino communities, with individuals from 22 countries who bring different racial identities and cultures to their communities.1 But history and research show that one thing is clear: past policymakers’ actions—sometimes intentional and other times not—that exclude, suppress, and “otherize” people of color have shaped the Latino experience in this country. Even though the United States has abolished the most egregious, formal examples of structural racism, their legacy, as well as more subtle forms of exclusion, persist.
The effects of this history on Latinos are widespread; many Hispanics struggle with inequity across all aspects of daily life despite hard work. However, a root cause of this inequality—structural racism—and how it applies to Hispanics is not widely known, even by many Latinos. This paper offers a “primer,” the first of a series, detailing historical examples of systemic racism against Hispanics across selected areas and how this phenomenon persists and affects the well-being of Latinos today.† Examining this history can help policymakers, the public, racial justice advocates, and Latinos themselves better understand the structural factors influencing communities of color and why it is essential to fully include Latinos in a shared movement toward racial equity for all Americans.
* The terms “Hispanic” and “Latino” are used interchangeably by the U.S. Census Bureau and throughout this document to refer to persons of Mexican, Puerto Rican, Cuban, Central and South American, Dominican, Spanish, and other Hispanic descent. According to the technical definitions used by the census, Latinos may be of any race. This document uses the sociological construct of “race” whereby, at least historically, most Latinos were treated as a distinct racial group, regardless of ethnicity. UnidosUS also occasionally refers to this population as “Latinx” to represent the diversity of gender identities and expressions that are present in the community.
† The examples presented in this report present only a fraction of the history, the many instances of structural racism, and the resulting disparities affecting the Latino community and is not an exhaustive account.
Although it’s not the only cause of socioeconomic disparity, systemic racism is a key factor explaining the unequal social, political, and economic opportunities for the nation’s 60 million Latinos. The dynamics of entrenched structures and practices throughout the nation’s history have resulted in inequitable outcomes and harm to the well-being of children, families, and entire communities. Examples of structural racism embedded in policy and practice are wide-ranging, but clearly evident in the systems governing criminal justice, education, employment, health, housing, immigration, and voting, where disparities in Latino socioeconomic outcomes are significantly lower than those of their White counterparts. Together, these disparities continue to reinforce the separate and unequal status of Latinos in the United States by fueling a cycle of inequity where power—in terms of wealth or representation in government—remains out of reach for many Hispanics. The following sections present selected examples of systemic racism, citing history, relevant legal cases, examples of how these systems operate today, and the resulting inequity for Latinos. Examining the historical and ongoing ways in which structural racism produces disparate outcomes for Latinos and Whites can help guide policymakers, racial justice advocates, Hispanics themselves, and other stakeholders in their pursuit of effective strategies to achieve racial justice.
The U.S. criminal justice system is complex. It is made up of the agencies and processes by which federal, state, and local governments enact laws to promote public safety and welfare, investigate crime, bring charges against individuals, make arrests, adjudicate or try individuals, and impose sentences on convicted individuals.23 Structural racism is embedded throughout the system, beginning with notable differences in the racial profiling of suspects, disproportionate
arrests, court experiences, detention, and sentencing that culminate in dramatically different incarceration rates by race. The life cycle of the justice system is also vast and omnipresent for communities of color, spanning the youth justice schoolto-prison pipeline, targeted over-policing and violence fueled by racial profiling, the emergence of the carceral state, and continued criminalization coupled with racialized theories of recidivism well after release and re-entry. Furthermore, a severe lack of research and inadequate data collection on Latinos in the criminal justice systems fail to provide the necessary infrastructure to account for—and be accountable to—unequal treatment of the nation’s largest non-White demographic. This unequal treatment is particularly striking, especially given that research shows that involvement with the criminal justice system deepens inequity along racial and ethnic lines.24
Institutionalized police violence has affected Latino communities for decades. Between January 2013 and December 2020, and peaking in 2017, at least 1,500 Latinos nationwide were killed by police, although these numbers are likely highly undercounted.25 History shows that Latinos have been subject to police brutality and state-sanctioned killings since Hispanics were first subject to U.S. jurisdiction. Just over 100 years ago, Texas Rangers, local law enforcement, and civilian vigilantes killed thousands of U.S. residents and drove many more out of the United States into Mexico, typically with no semblance of due process.26 One of the most egregious examples was the “Porvenir Massacre.” On January 28, 1918, a group of White cattlemen, Texas Rangers, and United States Army cavalry soldiers entered the predominantly Mexican American village of Porvenir under cover of night. They seized 15 Mexican-origin men and boys and fatally shot them at close range.27 The perpetrators burned the town to the ground, claiming without proof that the villagers had been thieves. Later investigations by the Army and the
State Department found that Porvenir’s residents were unarmed when the Rangers and vigilantes killed them.28 Similarly, beginning soon after Puerto Rico became subject to American jurisdiction after the Spanish-American War, the provisional U.S. government on the island was responsible for numerous examples of unwarranted violence against Puerto Ricans, such as the infamous Ponce Massacre.29
This wanton violence against innocent Latinos by U.S. law enforcement, often with impunity, forms the backdrop against which the criminal justice system interacts with the Hispanic community. This pattern of violence continues today, with Latinos 1.7 times (170%) more likely to be killed by a police officer than their White counterparts.30 These estimates are likely an undercount due to the lack of ethnicity data collected by most criminal justice databases and altogether ignored by federal bodies—a form of racism known as the Black/White Binary.31 It is this systematic erasure of Latinos that underscores the deep entrenchment of structural racism in law enforcement policies and practices today. The issue of aggregated ethnic data collection extends well beyond instances of police brutality: a 2016 survey by the Urban Institute found that Alaska is the only state that regularly includes data on Latinos in reports on arrest, prison, probation, and parole populations.32
Several purportedly “color blind” policies have also embedded systemic racism into the U.S. criminal justice system. President Johnson’s 1965 Commission launched what was coined the “War on Crime” and established “a direct role for the federal government in local police operations, court systems, and state prisons.”33 Central to the endeavor was the rapid scaling and militarization of law enforcement, culminating in the 1968 Omnibus Crime Control and Safe Streets Act that brought social and public safety policy within the purview of the Department of Justice by way of the Law Enforcement Assistance Administration.34
Mandatory minimum sentencing and the “War on Drugs” followed in quick succession under President Nixon in 1971, which sanctioned disparate enforcement targeting urban areas, low-income communities, and communities of color, resulting in disproportionate incarceration rates of Blacks and Latinos.35 By 1993, this rhetoric of “law and order” fueled widespread implementation of threestrikes laws, bringing mass incarceration to new heights and incentivizing—even justifying—excessive rates of police presence within low-income communities of color in order to obtain federal grants.36 Research has demonstrated that the law’s consequences fell disproportionately on minorities but appear to have had no effect on lowering crime.37 Combined with overpolicing and racial profiling, which leads to disproportionately high arrests of Black and Latino individuals, these systemic factors, as well as individual biases among police and other criminal justice actors, inevitably lead to more disparate rates of convictions and incarceration.38
Finally, Latino immigrants have the stigma of “criminality” ascribed to them by an ever-evolving assortment of laws and immigration-enforcement mechanisms.39 It should be noted that immigrants, on average, commit fewer crimes and are actually more frequently the victims of crimes than non-immigrants.40 However, classes of “aggravated felonies,” many of which are misdemeanors when applied to U.S. citizens, have been created. According to expert researchers, “deportation has become a punishment for even minor offenses, and policies attempting to end unauthorized immigration have been made more punitive rather than more rational and practical.”41 Indeed, immigration enforcement is perhaps the only area of law where virtually all violators, no matter how trivial their offense, are subject to deportation—the maximum sentence available.42 As a result, Latinos are disproportionately subject to deportation, constituting roughly 57% of immigrants but well over 90% of deportations.43
PRESENTED BY
SILVER SPONSOR


PHOTO BOOTH SPONSOR
BRONZE SPONSORS

VIDEO PRODUCTION PARTNER FOOD SPONSORS
BEVERAGE SPONSOR
MEDIA PARTNERS