



Dax Campbell President Campbell Construction & Company

Heath Kelly Secretary Heath Kelly Construction


Austin Tenpenny 1st Vice President Adoor Properties

Paul Stanley 2nd Vice President The First Bank

Lindy Hurd Past 2nd Vice President/SMC Chair First International Title
Amir Fooladi Immediate Past President ParsCo

Steve Moorhead Legal Counsel Moorhead Law Group

Jennifer Reese Treasurer Reese Construction Services

Kevin Sluder 3rd Vice President Gene’s Floor Covering

Josh Peden Financial Officer Hudson, Peden & Associates

2024 Home Builders
Association of West Florida Board of Directors
Dax Campbell, Campbell Construction & Company, President
Austin Tenpenny, Adoor Properties, First Vice President
Jennifer Reese, Reese Construction Services, Treasurer
Heath Kelly, Heath Kelly Construction, Secretary
Josh Peden, Hudson, Peden & Associates, Financial Officer
Lindy Hurd, First International Title, Past 2nd VP, Sales Council Chair
Kevin Sluder, Gene’s Floor Covering, 3rd Vice President
Paul Stanley, The First Bank, 2nd Vice President
Amir Fooladi, Encore Homes by ParsCo, Immediate Past-President
Stephen Moorhead, Moorhead Law Group, Legal Counsel
Bill Batting, REW Materials
Jim Bouterie, Pensacola Energy
Rick Byars, Florida Power & Light
Mickey Clinard, Renasant Mortgage
Laura Gilmore, Fairway Ind. Mortgage, Affordable Housing Liaison
Chris Graye, Graye’s Granite
Thomas Hammond, Hammond Engineering, Civil Engineering Liaison
John Hattaway, Hattaway Home Design, Cost and Codes Chair
Shellie Isakson-Smith, SWBC
Mary Jordan, Gulf Coast Insurance, Tradesman/Education Council Chair
Daniel Monie, KJM Land Surveying
Alex Niedermayer, Underwood Anderson & Associates
Zach Noel, Clear Title of NW FL
Suzanne Pollard-Spann, Legacy Insurance Brokers, Ambassadors Chair
Marty Rich, University Lending Group
Wilma Shortall, The First Bank
Pam Smith, Real Estate Counselors, Pensacola Assn. of Realtors Liaison
Chris Thomas, Acentria Insurance
Janson Thomas, Swift Supply
BUILDER/DEVELOPER MEMBERS
Chad Edgar, Joe-Brad Construction
Joseph Everson, D.R. Horton
Fred Gunther, Gunther Properties
Drew Hardgrave, Landshark Homes
Alton Lister, Lister Builders, Governmental Affairs Chair
Kyle McGee, Sunchase Construction
Tomas Ondra, Ondra Home Building
Shon Owens, Owens Custom Homes & Construction
Josh Rayls, Holiday Builders
Douglas Russell, R-Squared Construction
Monte Williams, Signature Homes
Anton Zaynakov, Grand Builders
PAST-PRESIDENT/EX-OFFICIO MEMBERS
Blaine Flynn, Flynn Built
Edwin Henry, Henry Homes
Shelby Johnson, Johnson Construction
Russ Parris, Parris Construction Company
Newman Rodgers, Newman Rodgers Construction
Thomas Westerheim, Westerheim Properties
Doug Whitfield, Doug Whitfield Residential Designer
Curtis Wiggins, Wiggins Plumbing


JENNIFER MANCINI
Executive Director jennifer@hbawf.com
Publisher Malcolm Ballinger malcolm@ballingerpublishing.com
Executive Editor Kelly Oden kelly@ballingerpublishing.com
Art Director Ian Lett ian@ballingerpublishing.com
Graphic Designer/Ad Coordinator Ryan Dugger advertise@ballingerpublishing.com
Editor Morgan Cole morgan@ballingerpublishing.com
Assistant Editor Nicole Willis nicole@ballingerpublishing.com
Sales & Marketing
Paula Rode, Account Executive, ext. 28 paula@ballingerpublishing.com
Geneva Strange, Account Executive, ext. 31 geneva@ballingerpublishing.com
Cornerstone, the monthly publication of the Home Builders Associa-tion of West Florida serving Escambia and Santa Rosa Counties, is published monthly, twelve (12x) per year. Send address changes to HBA of West Florida, 4400 Bayou Boulevard, Suite 45, Pensacola, Florida 32503-1910. Cornerstone, is published in the interests of all segments of the home building industry and is distributed to its members and others associated with the HBA of West Florida. HBA of West Florida and Ballinger Publishing does not accept responsi-bility for, or endorse any statement or claims made by advertisers or authors of any articles. Every effort has been made to assure ac-curacy of information, but authenticity cannot be guaranteed. No part of this publication may be reproduced without the written consent of Home Builders Association of West Florida, Copyright ©, 4400 Bayou Boulevard, Suite 45, Pensacola, Florida 32503-1910, 850.476.0318. Advertisers and advertorials in Cornerstone do not constitute an offer for sale in states where prohibited by law.

Affordable housing has been a hot topic in our community lately, and the HBA is determined to be a part of the solution. We are currently planning to build three “Attainable Housing” projects in a unique partner shop with the City of Pensacola and the Northwest Florida Community Land Trust to showcase during our annual Parade of Homes later this Fall. More to come on these important projects next month. The HBA is currently accepting scholarship applications for students enrolling in vocational training. Our HBA staff recently met with Escambia County Schools to further strengthen our partnership in developing the next generation of skilled trades workforce. I encourage any members who would like to get more involved in these worthwhile efforts to reach out to Mary Jordan, Tradesmen Council Chair. I also encourage all members to attend as many HBA member networking events as possible. This is the best way to get more involved with the Association while marketing your business at the same time.
Dax Campbell CamCon Builders LLCDMC
Steel Building & Design


Building upon our exploration of green building trends, major practices, and resilience strategies based on The Building Sustainably: Green & Resilient Single-Family Homes 2024 SmartMarket Brief, this article now shifts focus towards ways to increase green building within the housing market.
The survey asked all respondents to select the top three factors that would increase their engagement with green building in the future. Half of respondents listed increased home buyer demand for green homes in their top three reasons. The second highest at 48% was availability of government or utility incentives in my area. Third, at 37%, was available, affordable high-quality green products.
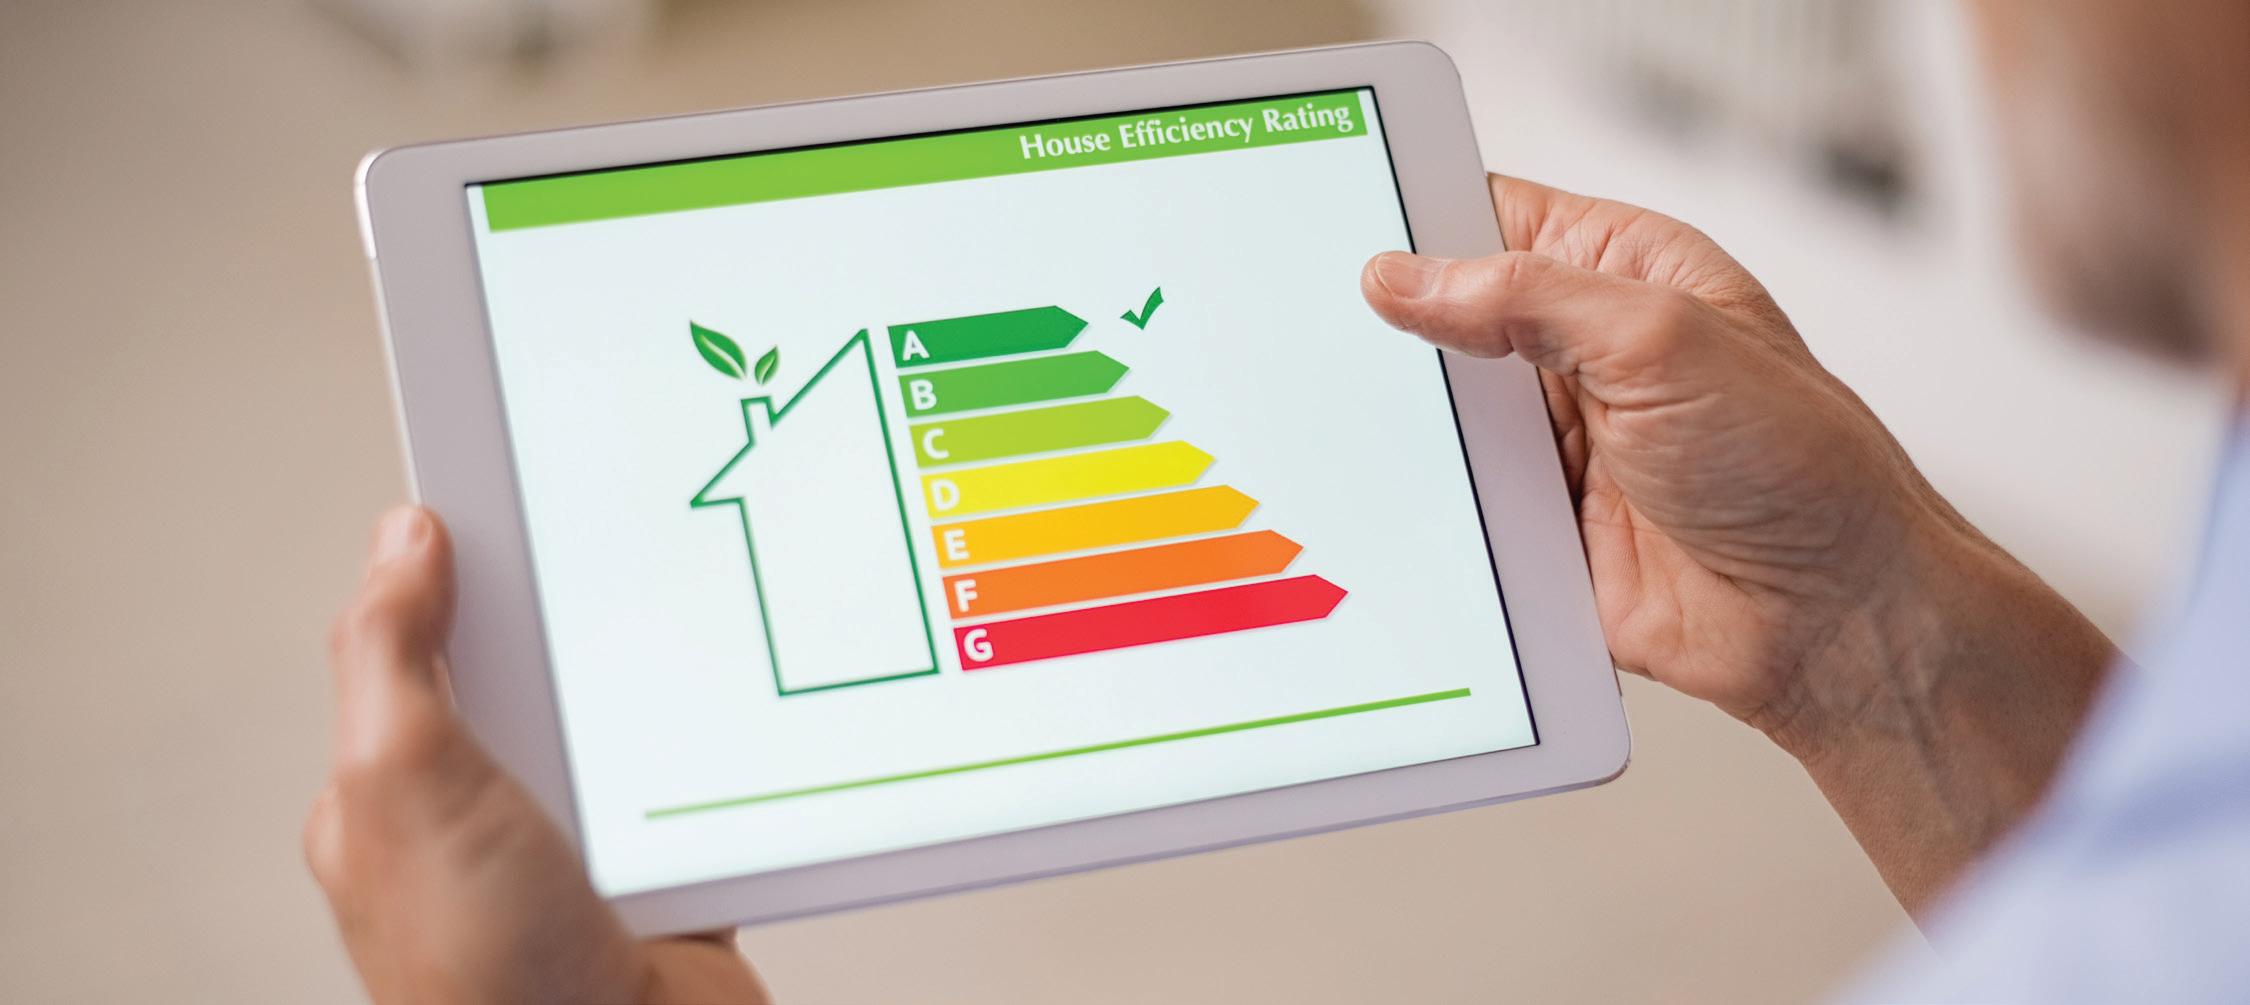
Home builders and remodelers who have built green projects were asked if they utilized any of the six approaches provided to demonstrate their projects were green. The top method was using a Home Energy Rating System (HERS) score at 39%. This was followed by website marketing at 35%, which had notable regional differences. Website marking was most used in the Northeast (60%), then the Midwest (52%) and West (43%), but it was least common in the South (20%). The other four approaches listed were: third-party certification (34%), MLS information (33%), silent salesperson signage (20%), and green appraisal form (6%).

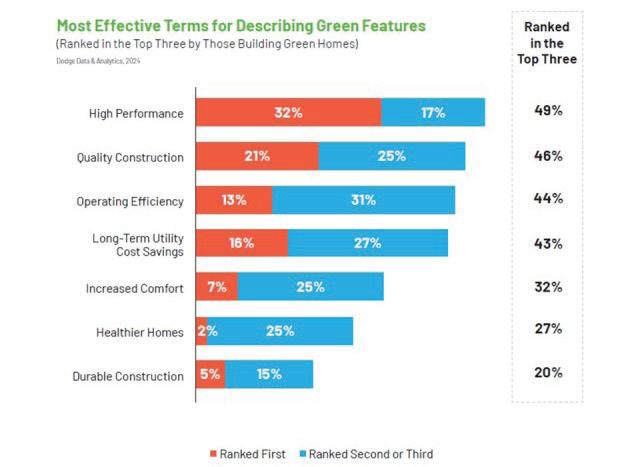
Home builders and remodelers who do green home projects were asked to rank the three most effective terms for talking to their customers about green-related features from a list of 12 options. The most effective term was “High Performance” at 49%. The second highest at 46% was “Quality Construction” while third, at 44%, was “Operating Efficiency”. The complete rankings are shown in the chart below.
Home builders and remodelers were asked how frequently home appraisals accurately reflect the added value of a green home. The majority of respondents (60%) reported that they never see this occur. The second highest were those that said infrequently at 22%. Notably, there are no significant differences between the responses of builders and remodelers or the respondents from the four regions. This suggests accurate home appraisals are a significant challenge across the green building industry.
Home builders and remodelers were also asked about the frequency with which green features are reflected in MLS listings, the database used by realtors for home sales. Less than one-third (31%) listed never, comparatively less than with home appraisals. However, infrequently was listed at 41%.


In order for builders to supply green homes, there needs to be a home buyer demand. As we have seen, the prevalence of green home construction has seen little growth over the past few years. Contributing to this is the fact that consumers are not able to reliably compare homes with green elements to those without them. This is seen when green home appraisals and listings do not accurately reflect the added value of green building. The sustainability & green building industry faces headwinds to gain appropriate recognition from consumers about the advantages of green homes.
Source: NAHB
Half of payroll workers in construction earn more than $58,500 and the top 25% make at least $79,450, according to the latest May 2023 Bureau of Labor Statistics Occupational Employment and Wage Statistics (OEWS) and analysis by the National Association of Home Builders (NAHB). In comparison, the U.S. median wage is $48,060, while the top quartile (top 25%) makes at least $76,980.
The OES publishes wages for almost 400 occupations in construction. Out of these, only 46 are construction trades. The other industry workers are in finance, sales, administration and other off-site activities.
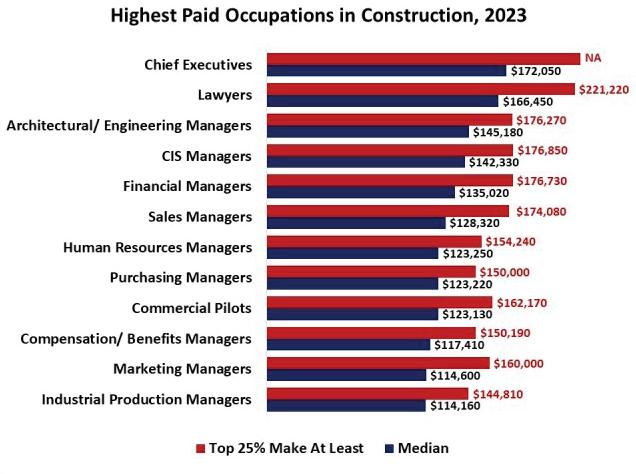
The highest paid occupation in construction is Chief Executive Officer (CEO) with half of CEOs making over $172,000 per year. Lawyers working in construction are next on the list with the median wages of $166,450, and the top 25 percent highest paid lawyers making over $221,220. Out of the next ten highest paid trades in construction, eight are various managers. The highest paid managers in construction are architectural and engineering managers, with half of them making over $145,180 and the top 25 percent on the pay scale earning over $176,270 annually.
Among construction trades, elevator installers and repairers top the median wages list with half of them earning over $103,340 a year, and the top 25% making at least $129,090. First-line supervisors of construction trades are next on the list; their median wages are $76,960, with the top 25% highest paid supervisors earning more than $97,500.
In general, construction trades that require more years of formal education, specialized training or licensing tend to offer higher annual wages. Median wages of construction and building inspectors are $65,790 and the wages in the top quartile of the pay scale exceed $88,800. Half of plumbers in construction earn over $61,380, with the top quartile making over $80,300. Electricians’ wages are similarly high.

Carpenters are one of the most prevalent construction crafts in the industry. The trade requires less formal education. Nevertheless, the median wages of carpenters working in construction exceed the national median. Half of these craftsmen earn over $57,300 and the highest paid 25% bring in at least $73,800.
The OEWS program adopted a new estimation methodology in 2021. As a result, the previously published estimates are not directly comparable to the post-pandemic editions. Nevertheless, comparing the median wages in construction over the last two years reveals that, on average, lower-paid occupations experienced a somewhat faster wage growth. Median wages of drywall installers, for example, grew 11%. Moreover, the overall construction median increased 7.3%, one of the largest increases among all industries.
Source: NAHB Eye on Housing 4/28/24


As the construction industry continues to evolve, staying up to date with the latest trends, technologies, and best practices becomes crucial for success. That’s why we’re thrilled to invite you to the Southeast Building Conference (SEBC) 2024!
SEBC 2024 will take place July 24-25 at the Orange County Convention Center, bringing together industry leaders, experts, and professionals like you for two jam-packed days of networking, learning, and innovation.
Industry Insights: Gain valuable insights in our continuing education sessions and panel discussions on current and future trends shaping the construction industry.
Networking Opportunities: Connect with fellow contractors, suppliers, and exhibitors to forge new partnerships and collaborations.
This year, SEBC returns to sunny Orlando, offering you the perfect opportunity to combine business with pleasure. Enjoy the beautiful surroundings, warm weather, and world-class amenities while expanding your professional horizons.
Continuing Education: Participate in your choice of five education tracks, covering a wide range of topics from project management and sustainability to the latest construction technologies. Plus earn all 14 hours needed for your Florida license renewal!
Expo Hall: Explore the latest products, services, and innovations showcased by leading suppliers and manufacturers in the construction industry at the region’s largest expo!
Early bird registration is now open! Take advantage of discounted rates, including a FREE EXPO HALL PASS and secure your spot at SEBC 2024 today. Visit our website www.sebcshow. com to register and learn more about the schedule, speakers, exhibitors, and special events planned for this year.
SEBC 2024 promises to be an unforgettable experience, filled with opportunities to learn, grow, and connect with industry peers. Don’t miss out on this chance to elevate your career, expand your knowledge, and take your contracting business to new heights.
We look forward to welcoming you to SEBC 2024 and celebrating the spirit of innovation, excellence, and community that defines our industry.

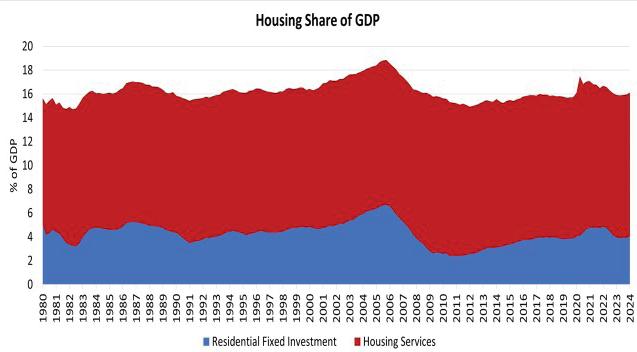
Housing’s share of the economy rose to 16.1% in the first quarter of 2024. The share remained below 16% for all of 2023 at 15.9% in each of the four quarters. This increase to above 16% marks the first-time housing’s share of GDP is above 16% since 2022.
In the first quarter, the more cyclical home building and remodeling component – residential fixed investment (RFI) – increased to 4.0% of GDP, up from 3.9% in the fourth quarter. RFI added 52 basis points to the headline GDP growth rate in the first quarter of 2024, marking three consecutive quarters of positive contributions. Housing services added 17 basis points to GDP growth in the first quarter. Among household expenditures for services, housing services contributions were behind health care (0.59), financial services and insurance (0.37) and other services (0.18).
Overall GDP increased at a 1.6% annual rate, following a 3.4% increase in the fourth quarter of 2023, and a 4.9% increase in the third quarter of 2023.
Housing-related activities contribute to GDP in two basic ways:
The first is through residential fixed investment (RFI). RFI is effectively the measure of home building, multifamily development, and remodeling contributions to GDP. It includes construction of new single-family and multifamily structures, residential remodeling, production of manufactured homes and brokers’ fees.
For the first quarter, RFI was 4.0% of the economy, recording a $1.1 trillion seasonally adjusted annual pace. RFI grew 13.9% at an annual rate in the first quarter, the highest rate seen since the fourth quarter of 2020 (30.1%).
The second impact of housing on GDP is the measure of housing services, which includes gross rents (including utilities) paid by renters, and owners’ imputed rent (an estimate of how much it would cost to rent owner-occupied units), and utility payments. The inclusion of owners’ imputed rent is necessary from a national income accounting approach, because without this measure, increases in homeownership would result in declines in GDP.
For the first quarter, housing services represented 12.1% of the economy or $3.4 trillion on a seasonally adjusted annual basis. Housing services grew 1.4% at an annual rate in the first quarter.
Historically, RFI has averaged roughly 5% of GDP while housing services have averaged between 12% and 13%, for a combined 17% to 18% of GDP. These shares tend to vary over the business cycle. However, the housing share of GDP lagged during the postGreat Recession period due to underbuilding, particularly for the single-family sector.
Source: NAHB


The two most wanted features in a home are a laundry room and a patio, according to NAHB’s latest study on buyer preferences—What Home Buyers Really Want Study*. Buyers in the study were given a list of 200+ features of the home and the community and asked to rate each one on a consistent scale (essential, desirable, indifferent, do not want) in order to produce comparable results.
The most wanted list consists of 13 features rated essential or desirable by at least 80% of all home buyers in the study (Fig. 1). In addition to the laundry room and a patio, both wanted by 86% of buyers, the list also includes:
• Three additional outdoor features: exterior lighting (82%), a front porch (81%), and landscaping (80%).
• Two in the kitchen: table space for eating (80%) and a walk-in pantry (80%).
• Two related to energy-efficiency: ENERGY STAR windows (83%) and appliances (80%).
• Plus, ceiling fans (81%), garage storage (81%), hardwood for the main level (81%), and a full bath on the main level of the home (80%).
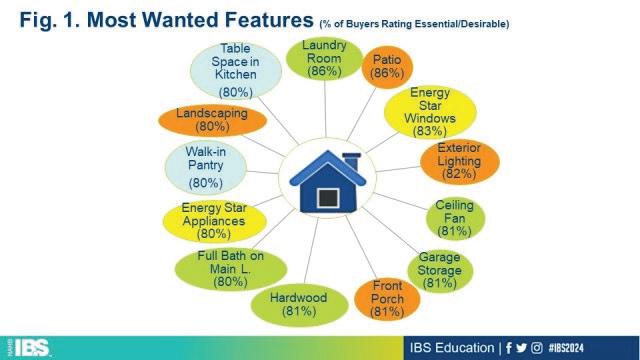
The most wanted list in Figure 1, although valuable and informative, doesn’t change much over time. Clearly, builders ought to try to incorporate as many of these features as possible, given that 80%+ of buyers have a strong preference for them. But are there other features, perhaps not as widely popular, that are growing on home buyers?
Figure 2 shows the 10 features with the most growth in popularity in the last 10 years—all have seen the share of buyers rating them essential/desirable increase by at least 25 points since 2012. At the top of this most-growth list are security cameras, now wanted by 76% of buyers, 36 points higher than a decade ago, followed by a wired home security system (up 35 points) and a programmable thermostat (up 31 points).
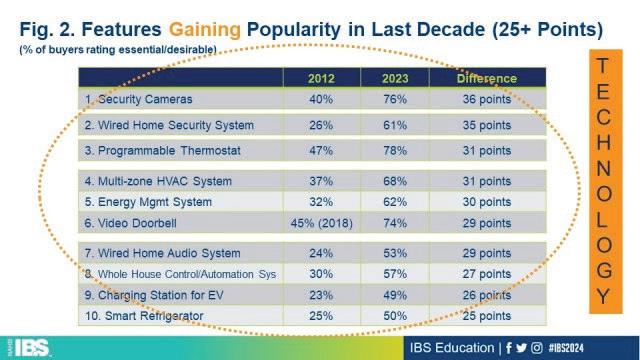
Technology is the common thread through all the features gaining the most favor with buyers in the last 10 years. Figure 2 also allows us to glean that buyers are leaning on technology primarily for two purposes: to increase the safety of their home and to save energy by efficiently controlling the temperature of their home.
* What Home Buyers Really Want, 2024 Editionsheds light on the housing preferences of the typical home buyer and is based on a national survey of more than 3,000 recent and prospective home buyers. Because of the inherent diversity in buyer backgrounds, the study provides granular specificity based on demographic factors such as generation, geographic location, race/ethnicity, income, and price point.
Source: NAHB Eye on Housing April 2024

Following a unanimous decision handed down by the U.S. Supreme Court today, California home owners, builders and developers may now challenge improper local impact fees for housing development even if the fees are authorized by legislation.
The decision is a major victory for the home owner involved in the case as well as home builders and developers, especially in California. NAHB and the California Building Industry Association (CBIA) submitted two amicus briefs in the case supporting the home owner.
The case, Sheetz v. El Dorado County, involved George Sheetz, a California resident who in 2016 applied for a permit to build an 1,800-squarefoot manufactured home on a residential-zoned lot he owned. The county imposed a $23,420
“traffic mitigation fee” on the permit. Sheetz protested the fee but ultimately paid it, and then immediately sued the county arguing the fee was improper.
At state court, Sheetz argued that the fee was not closely connected to or proportional to the actual impact his new residence would have on the roads, key tests laid out by precedent in two prior Supreme Court cases (commonly called the Nollan/Dolan test). The county countered that the test does not apply because the impact fee was authorized by legislation — from the county council in this case — rather than by bureaucracy.
A small number of state courts, including California’s, have carved out legal exceptions to the proportionality test if the fees in question are
authorized by a legislative body, as opposed to simply a permitting board or other administrative office. El Dorado County argued that this arrangement protected the fees from challenges under the Takings Clause of the Fifth Amendment. The California state court sided with the county and Sheetz appealed to the Supreme Court.
NAHB and CBIA wrote in their amicus briefs that the Supreme Court has an opportunity to “make clear that there is no such ‘loophole’ in the prohibition against governmental demands for unconstitutional conditions.” An improper taking is improper even if approved by legislation.
All nine Supreme Court Justices agreed, with Justice Amy Coney Barrett writing the unanimous opinion. Justice Barrett wrote, “there is no basis for affording property rights less protection in the hands of legislators than administrators. The


Takings Clause applies equally to both — which means that it prohibits legislatures and agencies alike from imposing unconstitutional conditions on land-use permits.”
The narrow ruling kicked the case back down to lower courts to decide if Sheetz’s $23,420 fee was a taking, and thus, improper. It did not resolve larger questions about the way permitting and impact fees are calculated and structured. It did, however, provide an avenue for home owners, builders and developers to invoke the Takings Clause in challenges to impact fees in states where the fees are authorized by legislation.
The case may have a significant long-term impact on permitting fees for home development. NAHB will closely monitor fallout from the case and communicate directly with members.

Housing starts fell in March with interest rates somewhat higher than expected last month as the latest inflation readings failed to show improvement. Builders are also still facing higher supply-side costs and tighter lending conditions. Overall housing starts decreased 14.7% in March to a seasonally adjusted annual rate of 1.32 million units, according to a report from the U.S. Department of Housing and Urban Development and the U.S. Census Bureau.
The March reading of 1.32 million starts is the number of housing units builders would begin if development kept this pace for the next 12 months. Within this overall number, single-family starts decreased 12.4% to a 1.02 million seasonally adjusted annual rate. Single-family starts are up 21.2% compared to a year ago. The three-month moving average (a useful gauge given recent volatility) is up to over 1.0 million starts, as charted below.
The multifamily sector, which includes apartment buildings and condos, decreased 21.7% to an annualized 299,000 pace for 2+ unit construction in March. The three-month moving average for multifamily construction has trended lower to a 346,000-unit annual rate. On a year-over-year basis, multifamily construction is down 44.3%.
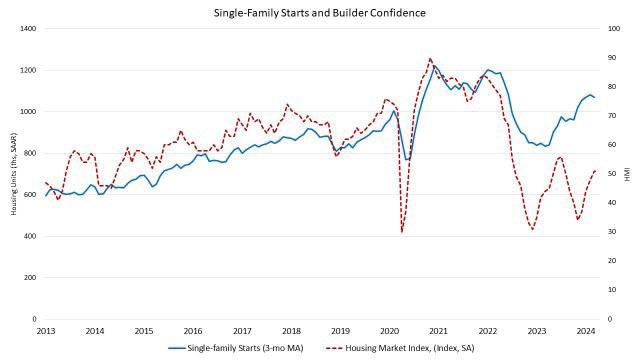
On a regional and year-to-date basis, combined single-family and multifamily starts are 14.0% higher in the West, 6.0% higher in the Midwest, 0.4% lower in the South, and 21.7% lower in the Northeast.
As an indicator of the economic impact of housing, there are now 689,000 single-family homes under construction; this is 2.7% lower than a year ago. Meanwhile, there are currently 957,000 apartment units under construction; This is down 1.5% compared to a year ago (972,000). Total housing units now under construction (singlefamily and multifamily combined) are 2.0% lower than a year ago.
While apartment construction starts are down, the number of completed units entering the market is rising due to prior elevated construction levels. The pace of completions for apartments in buildings with five or more units is up 27.4%
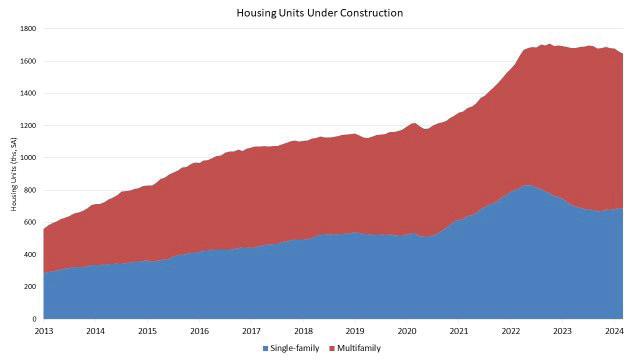
for the first quarter of 2024 compared to the first quarter of 2023. A higher pace of completions in 2024 for multifamily construction will place some downward pressure on rent growth.
Overall permits decreased 4.3% to a 1.46 million unit annualized rate in March but are up 1.5% compared to March 2023. Single-family permits decreased 5.7% to a 973,000 unit rate but are up 17.4% compared to the previous year. Multifamily permits decreased 1.2% to an annualized 485,000 pace and are down 20.2% compared to March 2023, which is a sign of future apartment construction slowing.
Year-to-date, permits are 34.5% higher in the Northeast, 11.3% higher in the Midwest, 1.0% higher in the West, and 0.9% lower in the South.
Source : NAHB Eye on Housing 4/16/24

In construction, a spike is a steel object that is essential to making a building strong. As in construction, the HBA of West Florida sees a Spike as someone that works to keep our association strong. Spikes work on the recruitment and retention of members in addition to keeping members active with the association. Anyone is eligible for Spike status. On Spike credit is awarded for each new member recruited and an additional credit is awarded for that new member’s renewal on or before their anniversary date. If you help to retain a member, you are eligible to receive a half point for each member.
Spike Candidate 1-5 credits
Blue Spike 6-24
Life Spike 25-49
Green Spike 50-99
Red Spike 100-149
Royal Spike 150-249
Super Spike 250-499
Statesman Spike 500-999
Grand Spike 1000-1499
All-Time Big Spike 1500+ Spike Club Members and their credits as of 09/30/2023.
Statesman Spike
Harold Logan
Super Spike
Rod Hurston
Royal Spike
Rick Sprague
William “Billy” Moore
Charlie Rotenberry
Kim
Spike Credits
Shelby


