24 minute read
Did SpaceX get it wrong: a systematic evaluation of potential of a flyback return mode to increase performance


Did SpaceX get it wrong? A systematic evaluation of the potential of a flyback return mode to increase performance
Rosco Jones
Barker College
Purpose: Through a comparison of first stage re-use modes in the Falcon 9 launch vehicle a viability assessment of a “flyback” (Landing horizontally under the influence of aerodynamic forces) booster can be achieved. Design: Data from the existing modes of launch demonstrated by the Falcon 9 were collected and analysed. A base set of assumptions about the Falcon 9’s performance were produced. Using assumptions produced a flyback mode of re-use was designed and comparative evaluation was performed. Findings: A flyback mode of re-use was found to produce a reduction in inert mass relative to that of a retro-propulsively landed booster, resulting in improved performance of re-usable first stages. Limitations: The experimentation was performed entirely theoretically utilizing an assumed data set. Real world properties of the Falcon 9 may differ greatly from that which was assumed. Practical validation of results produced are necessary for confirmation of validity. Practical implications: Implementation of technologies which improve launch performance results decrease in cost of launch, increasing access to space. Social implications: As a result of this cost reduction smaller groups will be capable of affording to launch their payloads. This will enable educational and scientific payloads which have no profit incentive a greater ability to launch. Originality: Minimal research into Flyback boosters has been performed. Of the comparative research undertaken almost all has centred on the usage of theoretical modelling of all booster performance. This experiment instead utilizes data from real launches to increase validity. Key words: Rockets, Re-usable launch vehicles, Booster, Re-usable booster, Retro-propulsive landing, Flyback, Falcon 9
Glossary
Booster - First stage of a rocket Expendable Booster - Booster that is not recovered Re-usable Booster - Booster that is recovered and reused for future launches Flyback - Re-usable booster that uses a plane like recovery method Glideback - Re-usable booster that uses a glider like recovery method Retro-propulsion landing - Re-usable booster the lands vertically in reverse to how it was launched Payload - Non-vehicle mass being launched Wet Mass - Mass of a loaded vehicle Dry Mass - Mass of an unloaded vehicle
Literature Review
Launch costs are a primary limiting factor in humanities expansion into space (Chow, 2022). As such many means of reducing costs are being explored. A commonly proposed means of achieving this is through re-usable spacecraft (Jones, 2018). Improving the launch efficiency of re-usable vehicles is the primary goal of this paper.
The implementation of a reusable system on a launch vehicle is inevitably to the detriment of its performance, relative to that of an expendable launch vehicle (R. Thompson, 2019). This is because reusable systems must include additional elements to enable the extended mission goal of re-use. This is most notable in its effect on payload capacity, with the SpaceX’s Falcon 9 significantly reducing its payload capacity when reusing boosters in RTLS format (SpaceX, 2021). This has a substantial effect, being reduced from 12,605kg to 9,135kg (Schilling, 2009).
Despite the detriment to overall performance Reusable Launch Vehicles have become the focus of the commercial launch market. Expensive components
form a disturbingly large portion of vehicle cost, with engines alone making up roughly 60% of all launch costs (Drenthe, Zandbergen, & Van Pelt, 2017). Components such as engines can be readily re-used as refurbishment cost is minute relative to that of construction.
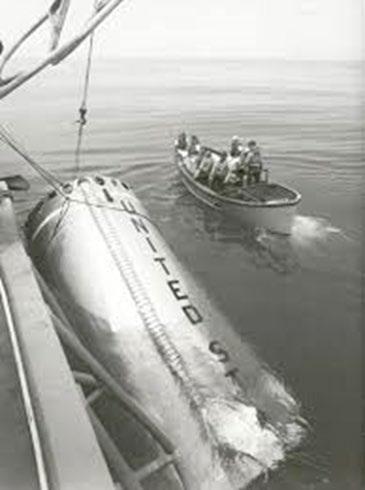
Expendable first stages are already well equipped to deal with the stresses of re-entry. This is evidenced in their remarkably intact state (see Figure 1)
Figure 1: A Gemini fist stage being recovered from the ocean. (Source: NASA, 1965) This is not the case with upper stages which tend to completely disintegrate after re-entry due to atmospheric heating because of immense speeds (See Figure 2).

Figure 3: Falcon 9 second stage debris in night sky (Source: Berger, 2021)
As such First stages will be the focus of this paper. For this paper two re-use “modes” were chosen:
1. Main engine retro-propulsion 2. Flyback utilizing plane like format
These were chosen as they are believed to be the most competitive forms of re-use for vehicles with payloads 2,000 – 20,000kg. This is the most common lift range of vehicles currently on the market (Spaceflight101, 2017).
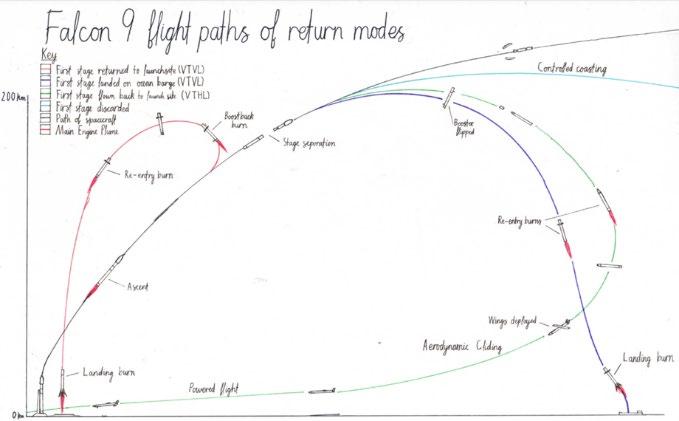
Figure 2: Falcon 9 re-use mode flight paths (After SpaceX, 2019)
Retro-propulsion
Main engine retro-propulsion utilizes the main engines of the first stage to provide oppositional thrust to the direction of movement, resulting in a decrease in momentum as shown in Figure 3. Main engine retro-propulsion necessitates additional inert mass for the first stage of the launcher. This comes in the following forms:
1. Excess fuel 2. Landing struts 3. Landing strut support mechanisms 4. Grid fins
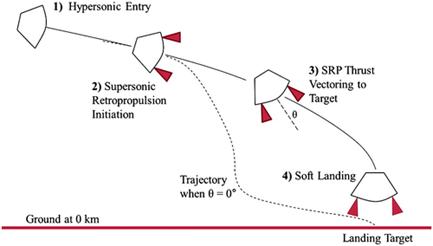
Figure 4: Supersonic retro-propulsion for mars rovers (Source: Mandalia and Braun, 2015)
SpaceX’s success in the field of Retro-propulsive landings have become the majority focus of the Spaceflight industry, leading to competing concepts being largely ignored due to the “field tested” nature of retro- propulsion. This becomes problematic as potentially superior design solutions have been abandoned. The flyback re-use mode is a prime example of a competing system that has been under-evaluated. Flybacks offer a range of unique advantages (Keith & Rothschild, n.d.) to the current launch market, with potential reductions in logistical costs and launch costs as well as their inherently safer design making them a compelling candidate.
Flyback
The Flyback re-use mode utilizes aerodynamic forces to slow the vehicle, eventually enabling it to land much in the same way a plane does. To achieve this, it utilizes the following additional components:
1. Wings 2. Control systems 3. Landing gear 4. Airbreathing engines (Glideback if not present,
Flyback if present) The mission of this paper is to estimate the ramifications of a flyback re-use mode on the performance of a booster. The Falcon 9 was selected as a model for the comparison of these two models as it’s the only re-usable booster to launch a payload to orbit. Both Flyback modes will be modelled.
The use of the Falcon 9
The Falcon 9 is a 2 stage, partially reusable space vehicle (See Figure 4). Its most notable feature is its re-use of its first stage. It was selected for use in this research paper as a case study upon which the two reuse modes can be compared. This is due to the expansive collection of data on its launches and its prevalence as the first ever reusable space vehicle to utilize retro-propulsive landings. These factors all made it particularly attractive as a basis upon which flybacks can be fairly compared.
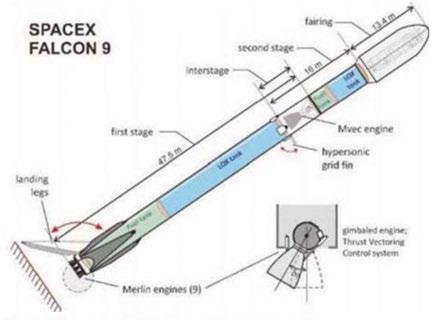
Figure 5: Falcon 9 Block 3 internal diagram (Source: Jenie, W. W. H. Suarjaya, & Poetro, 2019)
Several variants of the Falcon 9 exist. These are denoted by “Blocks”. Block 3 was selected as the ideal candidate as it has a publicly available data sheet on its characteristics (Espace and Exploration, 2017). This greatly increases experimental validity. This experiment will only utilize data from Block 3 launches. This is because there is a performance gap between variants.
Scientific Research Question
What effect will the implementation of a flyback system on a SpaceX Falcon 9 first stage in the place of a Retro-propulsive landing system have of the cost per kilogram taken to orbit?
Scientific Hypothesis
That a flyback system will generate a smaller amount of excess weight relative to retro-propulsion type
reusable vehicle and thus produce a greater payload capability.
Methodology
The following steps must be undertaken to enable a comparison of re-use modes:
1. Data on Falcon 9 Block 3 was collected 2. Retro-propulsion mode component weights were calculated 3. Retro-propulsion component weights were subtracted to estimate expendable weight 4. Flyback mode was designed for Falcon 9 Block 3 fuselage 5. Flyback component weights were calculated for powered and unpowered modes 6. Flyback component weights were subtracted from total fuel mass of expendable booster for both flyback modes 7. Performances of all modes calculated 8. Analysis of launch performances was performed comparing payload mass capacity between each vehicle.
Modelling the Falcon 9 Grid Fins
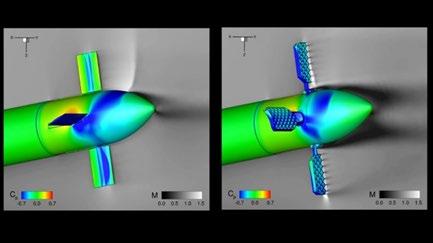
The Falcon 9 utilizes a set of 4 grid fins to assist control during the descent phase of the flight. Grid fins are a commonly used form of control surface used in place of conventional planar fins for their high level of control at subsonic and supersonic speeds (See Figure 7). Whilst ideally these would remain in place for the flyback design their drag characteristics are far too great for efficient use and will be replaced.
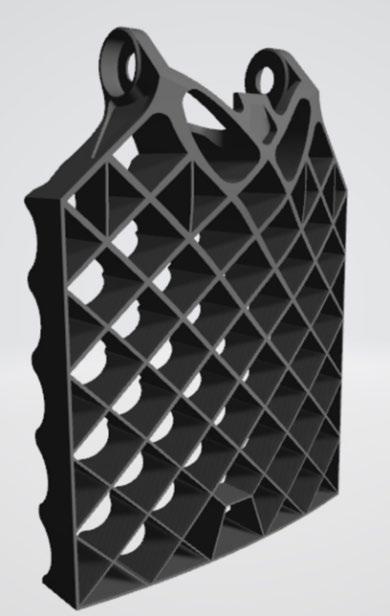
Figure 6: A 3D model of the Falcon 9's titanium grid fin (Source: Ross, 2022) Figure 7: Simulated wind tunnel testing of Callisto control surfaces (Source: DLR, 2018)
Grid fins are mounted towards the top of the Falcon 9’s first stage fuselage to provide self-correcting drag when deployed, as well as generating a greater level of control due to their distance from the centre of mass (See Figure 8).
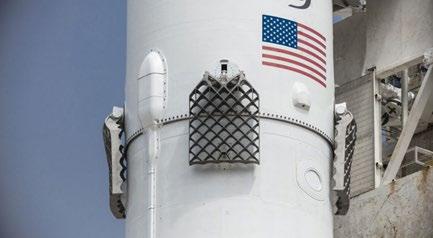
Figure 8: Falcon 9 with stowed titanium grid fins (Source: Henry, 2017)
The volume was of this model was found to be 44L when scaled appropriately. This was then used in conjunction with titanium’s accepted density of 4.5g/cm3. The weight of each Grid fin was thus found to be 198 kg, Bringing total weight of grid fins to 792kg.
Landing Legs
Landing Legs are support structures For the Falcon 9. They provide a wide base for the booster to prevent toppling and allow for inaccuracies in booster landing. Whilst large in size, as depicted in Figure 10, they are relatively light, weighing 600kg each (SpaceX, 2013).
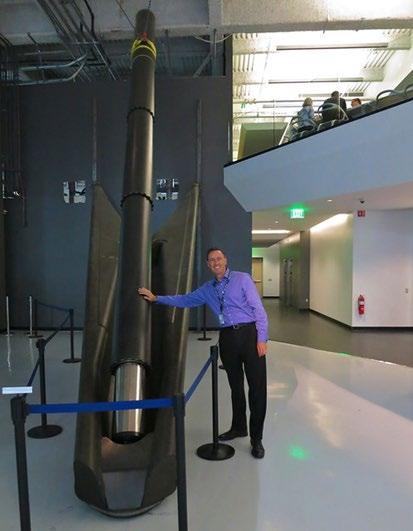
Figure 9: Falcon 9 landing leg in comparison to man (Source: Jurvetson, 2017)
Using a carbon fibre tubing calculator (Giordano, 2018) and assuming the average width to be 40cm, with tubing assumed to be 2cm thick and 12m long, weight of pistons is estimated to be 200kg.
A composite wrapped pressure vessel would also be used to store helium. This would be greater than 200kg, with an additional 100kg of fluid management systems (“Infinite Composites Pressure Vessels,” 2022). This brings the Landing legs and subsequent systems total weight to 4,400kg
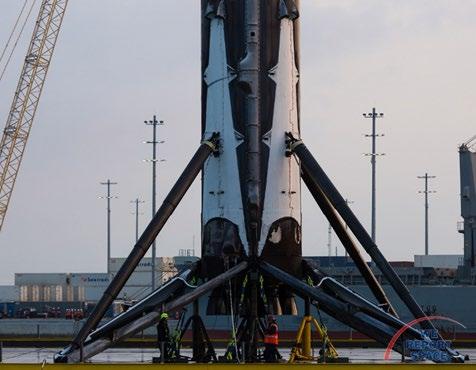
Figure 10: Falcon 9 with legs fully deployed on drone ship (Source: Jeven, 2017)
Excess Fuel
Using Schilling’s calculator and values attained, we can determine the relative performance of each mode of re-use for currently existing Falcon 9 variants, finding their maximum payload to given orbits. With the calculator, it was possible to produce the following table for the Falcon 9 block 3:
Table 1: Falcon 9 Block 3 weight performance for various modes (After Schilling, 2022)
Recovery Method
Payload to a 185km circular orbit Reduction in performance
No attempt at recovery
Ocean based drone ship recovery
Return to launch site 18,132kg (16,052 – 20,414kg, 95% confidence interval) 13,581kg (11,929 to 15393kg, 95% confidence interval) 11,410kg (10,057 – 12,763kg, 95% confidence interval) N/A
25%
37%
The Falcon 9’s second stage and fairings will remain constant regardless of the method of re-use. This means we can treat the first stages potential change in momentum, or Δν, as the only point of difference between each result. Given we have the masses of each component as indicated in table 1 we are able to determine the fuel retained for each form of landing.
Table 2: Specification sheet for Falcon 9 Block 3 booster with re-use structural mass (Espace and Exploration, 2017)
Stages Mass –dry (kg) Mass –wet (kg)
Fuel Mass (kg)
Fairing halves 4,450 4,450 0
Total 30,650 549,050 528400 This table is limited however as it is assuming the use of a re-usable first stage. Using previously calculated structural weight adjustments it was adapted into Table 3:
Table 3: Specifications sheet for expendable Falcon 9 first stage (After Espace and Exploration, 2017)
Stages Mass –dry (kg) Mass –wet (kg)
Fuel Mass (kg)
1st stage 17,008 437,908 420,900 2nd stage 4,000 111,500 107,500 Fairing halves 4,450 4,450 0
Total 25,458 543,858 528400
We are now capable of determining the Δν of each stage of the rocket. This can be achieved using Equation 1.
���������������� =∫��������1 ��������0
(1)
For all sea level engines, it is assumed there will be a constant instantaneous thrust of 6,444 Kn. Values from the tables were subbed into the equation to find the Δν of the first stage for both re-use modes.
The second stage was found to have a Δν of 11,148m/s. This does not include the fairing. Fairing separation was timed from the ignition of the second stage over 3 launches of the Falcon 9 Block 3 and was consistently 20 seconds after ignition. Δν of the second stage before separation was found to be 795m/s, and after; 9,822m/s. This brings the second stages total Δν to 10,617m/s.
The results of these equations in shown in Table 4.
Table 4: Retro-propulsion vs Expendable performance (After Espace and Exploration, 2017)
Mode
Δν –Standalone (m/s)
Δν – with upper stage (m/s)
Retropropulsion 8,083 3,814 Expendable 8,770 4014 Second stage 11,148 10,617
The retro-propulsion re-use mode has a total Δν capacity of 14,431m/s. The expendable booster has a capacity of 14,631m/s. This means that there is a 1.5% disparity between the total Δν capacity of the two rocket formats. This is a near negligible margin. As such it can be determined that the loss of 25% of payload capacity is almost entirely due to the conservation of fuel for re-use in the drone ship landing scenario. Due to time requirements properly calculated estimates were unable to be made and thus It was consequentially decided that a conservative 20% excess fuel margin for the would be employed for use in this research paper. This brings the total excess fuel weight to 84,180kg for a drone ship landing. It is assumed that 40% or 33,672kg of this fuel mass is reserved for the entry burn.
For a RTLS mission this mass fraction is even greater, with 37% of payload capacity being lost. As such a conservative 30% excess fuel margin was employed. This leads to an excess fuel weight of 126,270kg for RTLS missions.
Modelling of a flyback system
The main comparative aspect of these is to gain a weight estimate for each component as it will have the most influence on overall payload performance. To estimate the masses of each component a variety of methods must be utilized. Fortunately, as flybacks utilize common components with aircraft due to them performing a similar action. This enables accurate adjustments of fuselage weight to accommodate additional structures to support plane-like loads. The new components are
1. Fuselage weight 2. Wing weight 3. Canards 4. Landing gear 5. Optional engine and supporting systems
Fuselage weight
There is a high likelihood alteration to the fuselage will be necessary to accommodate the aerodynamic stresses during flight. This is however hard to calculate as SpaceX have already included stringers and ribs into their design (see Figure 11).
The exact weight of struts needed to accommodate for additional loads would require specific data on the Falcon 9 fuselage which is unavailable. To account for this additional mass a further 3,500kg of structural mass will be added.
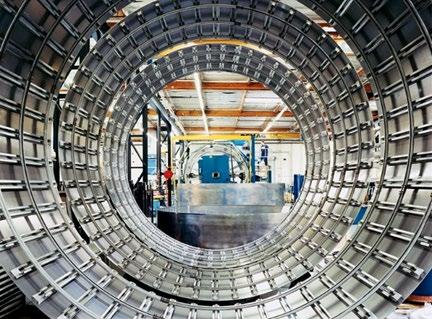
Figure 11: Internal view of SpaceX ring structure (Source: Goff, 2006)
Wing weight
The primary additional weight of the flyback booster design will be its wings, and as such needs to be calculated carefully. The Falcon 9 has a side area of roughly 150m2. The boosters’ wings are unable to deviate from the side profile of the Falcon 9 to any notable extent as in doing so they will incur immense structural stresses during re-entry as they would no longer be shielded by the fuselage itself. The wing mounting location will further limit the wing in size
however, as for ideal flight the wing will need to be mounted near the centre of gravity so as to ensure the centre of lift remains near it (see Figure 12).
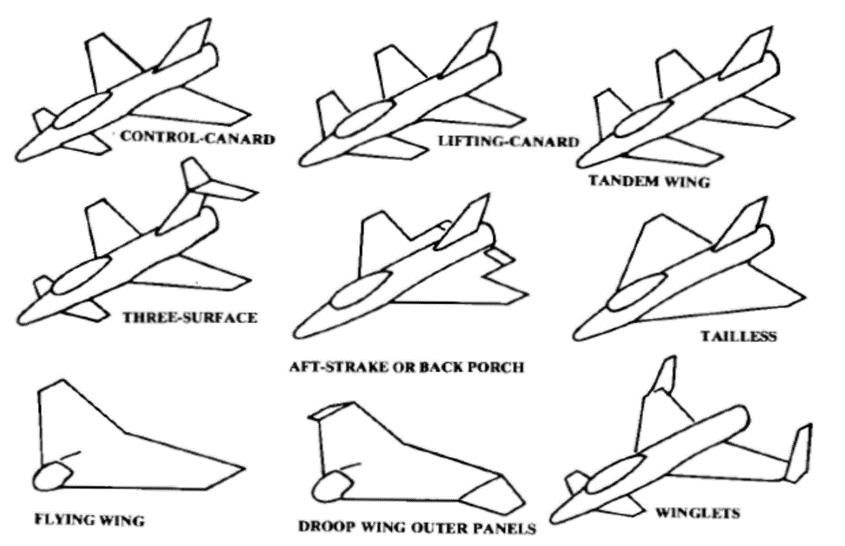
Figure 12: A selection of wing formats (Source: Ravi, 2020)
As a result of this it was decided a conventional plane design would not be optimal for these restrictions. Below are several proposed options:
It was decided a lifting canard design without a vertical stabilizer would be optimal as there would be four canards spaced evenly around the front, granting both axis of control. This can be seen in Figure13. The implementation of this design is showcased in Figure 14.
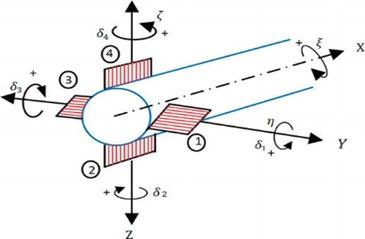
Figure 13: Diagram of Canard controls (Source: Osheku, 2018) Figure 14: from left to right: Expendable mode, Retropropulsion mode, Flyback mode (After: SpaceX, 2020)
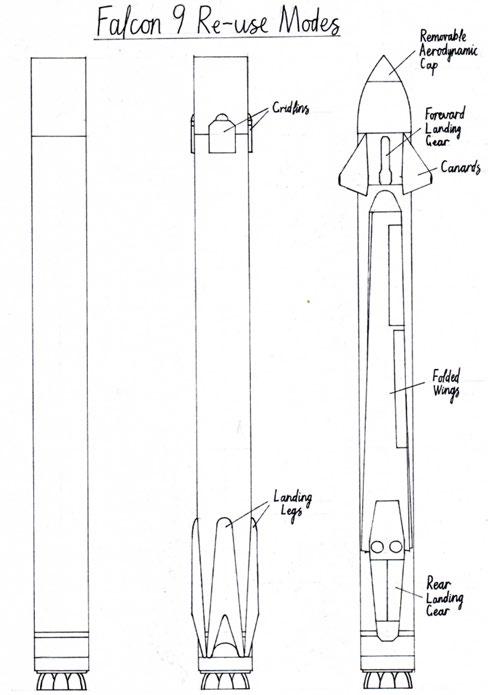
Using Figure 13 in combination with basic area equations, it is estimated that the flyback booster will have a total wing area of 120m2. Using Figure 15-17 we can determine that the plane’s wing is expected to be 15,849kg in total.
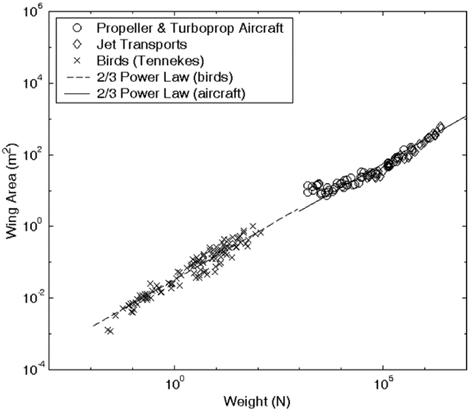
Figure 15: Wing weights vs area of Plane and bird wings (Source: Liu, 2006)
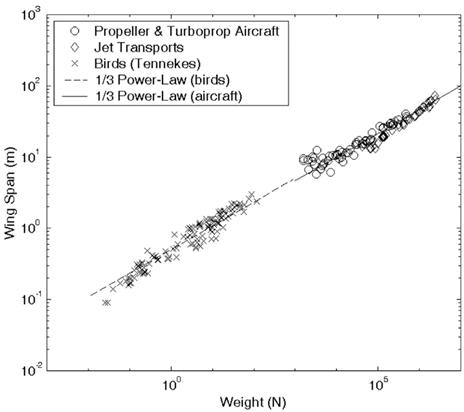
Figure 16: Wing weight and span of Plane and Bird wings. (Source: Liu, 2006)
This is subject to inaccuracy as the booster will still be required to accommodate for the hinging of the wings on the aircraft. As such the mass estimate was increased by 20% to accommodate for additional structural mass, bringing total wing weight to 19,018kg.
Canard weight
The Flyback mode Falcon 9 will utilize conventional planar Canards similar to those in Figure 17 as opposed to the grid fins previously utilized by the Retro-repulsively landing Falcon 9 variant. This reduces drag, extending the boosters range upon reentry and for the duration of flight.
Canard dimensions were determined in accordance with recommendations from the NASA technical memorandum. As such Canards were determined to be 1/10th of each wings area. Canard dimensions are as depicted in Figure 17.
The weight of the Canard was then estimated through the same process as the original fold out design. This gives us an estimated weight for each Canard of 316kg, Bringing the total weight of canards to 1,265kg.
Figure 17: Trapezoidal shape of Canard
Engine weight
The CFM56 –7 weighs 1,940kg. For a sustained flight speed of 250m/s the rocket will thus require 2,800kg of additional fuel(Almahmood, Bradley, Soret, 2022). This brings total additional engine weight to 4,740kg.
Landing gear weight
With conventional planes, it can be assumed that landing gear weight will be 2.5 – 5% of the maximum take-off weight. We will instead use the dry mass of the booster as it will be the only weight applicable during touchdown. We can estimate landing gear weight to be 1019kg for the Glideback booster and 1,138kg for the Flyback booster.
Re-entry Burn
The re-entry burn for each booster was determined to cost an additional 33,672kg. As the Flyback and Glideback boosters both require a re-entry burn this will be added to their inert weight.
Results
Total retro-propulsion additional mass
The total additional weight necessary for the falcon 9 to perform a retro-propulsive landing is 106,380 kg, assuming it can land down range. This is then increased by 42,090 kg when a return manoeuvre is employed. The final inert mass of a RTLS mission is 148,470 kg.
Total Flyback additional mass
The total mass of the flyback booster.
Finalized first stage properties
The final weight of components for the unpowered Flyback booster is 57,455kg in total. With the addition of engines and reserve fuel it becomes 62,195kg. These properties combined with those in Tables 2 and 3 were combined into Table 5 for comparison.
Table 5: Finalized flyback booster properties
Booster Inert Mass (kg) Contributed Δν (m/s)
Expendable 17,008 3,921
Glideback 74,463 2,923
Flyback 79,203 2,855
Drone Ship retropropulsion 106,380 2,496
Return to launch site 148,470 2,019
Payloads to orbit
Using the open-source calculator “Launcher” Maximum payloads to orbits between 250 – 4000km were graphed for each variant. This is shown in table 6. This indicates the expendable booster has significantly greater weight to orbit performance than that of reusable modes. The flyback modes are significantly smaller than that of the payload weight.
Discussion
This investigation’s goal was to assess the ability for a flyback system to reduce excess inert weight. Through the usage of the SpaceX Falcon 9 rocket as a framework for a re-usable booster we were able to accurately compare re-use modes. This experiment demonstrated a reduction in additional inert weight for Flyback boosters relative to that of the retropropulsion type re-usable boosters, resulting in an increase in payload. This is in support of the hypothesis.
This experiment was carried out in an effort to supplement the work of Martin Sippel, who has carried out extensive evaluations of re-usable boosters. Sippel’s work has almost always centred upon designing rockets from the ground up, creating extremely accurate Figures which can then be utilized in the comparison of re-use modes (Bussler & Sippel, n.d.). This research paper centred upon using the Falcon 9 as a case study for the re-use of rockets, taking the existing design of the Falcon 9’s first stage as well as its expendable variant and constructing a theoretical model of a Flyback stage from this foundation. This sacrifices the precision favoured by Sippel’s experimentation but enables an increase in experimental accuracy as a flight proven re-usable booster is being utilized as a point of comparison.This was done as the resources to undertake the extensive
process of developing a re-usable booster from the ground up and modelling its use were not available.
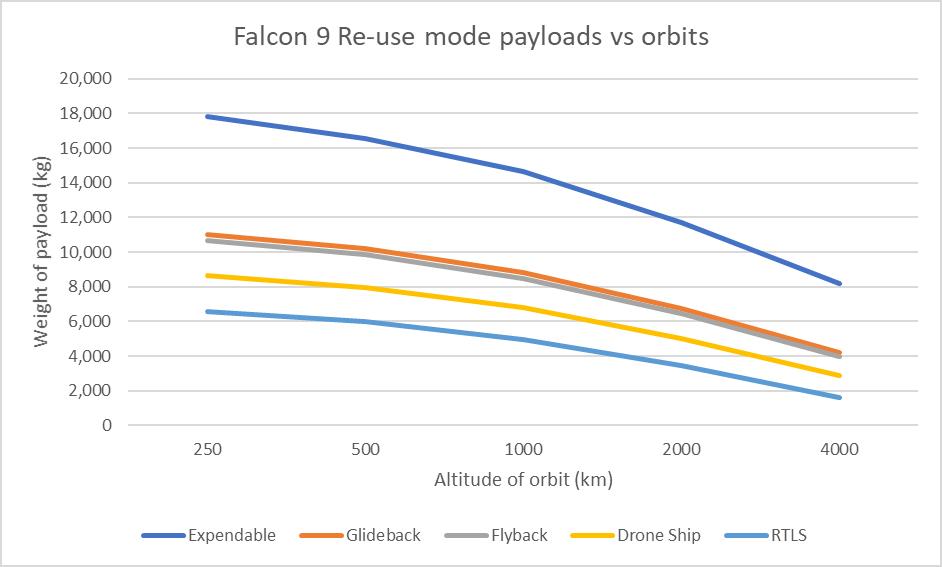
Figure 18: Weight vs altitude of Falcon 9 variants
Another point of difference this paper wished to explore was the difference in payload capacity present between each vehicle. This was seen as a valuable contribution as a large portion of flyback booster design research has had a greater focus on the economics of booster re-use rather than actual performance metrics (Stappert, Wilken, Bussler, & Sippel, n.d.). As a result of this there is little understanding potential advantages posed by the use of a flyback system to enhance or denigrate the performance of a vehicle. This paper aimed to provide the answer to this issue.
This experiment demonstrated the ability for aerodynamic forces to mitigate and re-direct the energy imparted on a rocket during re-entry with less of a toll on performance than that of retro-propulsion under the power of a rockets main engines. The findings of this study indicate a strong potential for the usage of a reusable Flyback systems in the place of retro-propulsion mode reusable vehicles. Their improvement on payload mass makes them an attractive candidate in the space launch market. Flyback type re-usable launch vehicles require further investigation and research as their potential to mitigate the cost of space travel is only increasing with each iteration of research.
The approach taken in this research paper allows for continual improvement as data collected retrospectively to be easily substituted in, improving the accuracy and reliability of results derived. There is also constant room for improvement in the component weight estimates, particularly that of wings, excess fuel and fuselage. These components should be more precisely calculated in future experimentation to provide a more reliable result. Inaccuracies in the measurement of components are a large component of experimental error present. Through the use of a case study with more publicly known specifications accuracy may be improved. This was a large source of error as the data available could not be verified.
The data was shown to be very uniform as seen in Figure 18. This is believed to be because of limitations in tools utilized. The “Launcher” calculator was unfortunately the only available means of determining maximum payload masses. This software, whilst useful, is incredibly inaccurate in its predictions, utilizing a linear scale to predict maximum payloads to each orbit. This is detrimental to the experiment as the relationship between maximum payload and orbital height is non-linear, and thus the calculator was producing incorrect results. As such table 6 should be considered a visual representation of data presented in table 5 rather than legitimate statistics. Whilst it would have been preferable to utilize Schilling’s calculator to perform a similar function this was not possible due to the calculator’s interface preventing the insertion of other vehicles for consideration.
Conclusion
This paper intended to establish a performance estimate for the payloads of re-usable variations of the Falcon 9 to various orbits. In this paper there was a demonstrated reduction in inert weight due to the implementation of a Flyback system. Flyback systems were shown to outperform retro-propulsive type reusable boosters in terms of payload for all orbits. This is through the use of aerodynamic forces to slow and direct descent in the place of fuel intensive propulsive landings. Whilst research has shown potential economic incentives for the adoption of Flyback systems this experiment has demonstrated an increase in payload performance. Though research is limited in accuracy, error can be greatly reduced through utilization of new data and more comprehensive mass estimates. It should be stressed that further research must be carried out validate results.
Acknowledgments
This paper would not have been possible if it were not for the immense support of the following people. Their contributions and sincerely appreciated.
Dr Mathew Hill for providing experience and advice in the production of this paper. Dr Cameron Dearn for assistance with physics related components of this paper. Thomas Leach for his immense help with developing potential mathematical solutions to this paper and all the remaining Science Extension staff for their understanding and assistance throughout my project.
References
Chow, D. (2022, April 8). How falling launch costs are fueling the thriving space industry. Retrieved June 21, 2022, from NBC News website: https://www.nbcnews.com/science/space/space-launchcosts-growing-business-industry-rcna23488
Jones, H. (2018). The Recent Large Reduction in Space Launch Cost. Tdl.org. https://doi.org/ICES_2018_81
Launch Vehicle Performance Calculator. (2022). Retrieved May 15, 2022, from Silverbirdastronautics.com website: http://www.silverbirdastronautics.com/cgi-
SpaceX. (2022). SpaceX. Retrieved May 14, 2022, from SpaceX website: https://www.spacex.com/
Giordano, R. (2018). Drone Tubing Calculator. Retrieved May 14, 2022, from Design215 website: https://design215.com/dcal/toolbox/tubing-calculator
Infinite Composites Pressure Vessels. (2022). Retrieved May 14, 2022, from Infinitecomposites.com website: https://www.infinitecomposites.com/infinite-compositepressure-vessels
bin/LVPcalc.pl
“Fiche Technique: Falcon-9” [Technical data sheet: Falcon 9]. Espace and exploration (in French). No.39 May 2017. Pp. 36-37. Retrieved May 18, 2022 from
Jones, H. (2018). The Recent Large Reduction in Space Launch Cost. Retrieved from https://ttuir.tdl.org/bitstream/handle/2346/74082/ICES_2018_81.pdf
Alcantarilla, A. (2022, March 18). SpaceX sets new booster reuse record on Starlink mission. Retrieved June 7, 2022, from NASASpaceFlight.com website: https://www.nasaspaceflight.com/2022/03/spacex-boosterreuse-recordstarlink/#:~:text=MVac%20ignition%20occurred%20at%2 0around,separated%20about%2020%20seconds%20later.& text=Falcon%209’s%20payload%20fairing%20is,down%2 0to%20the%20Atlantic%20Ocean.
Electron | Rocket Lab. (2022). Retrieved June 18, 2022, from Rocket Lab website: https://www.rocketlabusa.com/launch/electron/
NASA - Solid Rocket Boosters. (2022). Retrieved June 18, 2022, from Nasa.gov website: https://www.nasa.gov/returntoflight/system/system_SRB_p rt.htm
Lone, Mohammad & Saeed, Tariq & Graham, Will & Babinsky, Holger & Jarrett, Jerome & Hall, Cesare & Seffen, Keith & Eastwood, Jeremy. (2009). Conceptual Design for a Laminar Flying Wing Aircraft. 10.2514/6.2009-3616.
Berger, E. (2021, March 26). A Falcon 9 rocket making an uncontrolled re-entry looked like an alien armada. Retrieved June 20, 2022, from Ars Technica website: https://arstechnica.com/science/2021/03/a-falcon-9rockets-second-stage-just-burnt-up-over-seattle/
Stappert, S., Wilken, J., Bussler, L., & Sippel, M. (n.d.). A Systematic Comparison of Reusable First Stage Return Options. Retrieved from https://elib.dlr.de/128623/1/EUCASS2019_AKIRA_438_fi nal.pdf
Keith, E., & Rothschild, W. (n.d.). Propulsion system advances that enable liquid fly back booster (LFBB). Retrieved from https://core.ac.uk/download/pdf/10474026.pdf
Jenie, Y. I., W. W. H. Suarjaya, & Poetro, R. E. (2019). Falcon 9 Rocket Launch Modeling and Simulation with Thrust Vectoring Control and Scheduling. Retrieved June 20, 2022, from undefined website: https://www.semanticscholar.org/paper/Falcon-9-RocketLaunch-Modeling-and-Simulation-with-JenieSuarjaya/2573a201f08cc1d57b2b0dd3b6616f23688131e5
Thingiverse.com. (2022). Hypersonic Grid Fin - SpaceX Falcon 9 - 608 Bearing Edit (Flap and Pitch) by caross. Retrieved June 20, 2022, from @thingiverse website: https://www.thingiverse.com/thing:5279023/files
Steve Jurvetson. (2022, June 20). Retrieved June 20, 2022, from Flickr website: https://www.flickr.com/photos/jurvetson/13928869164
Drenthe, N., Zandbergen, B., & Van Pelt, M. (2017). Cost Estimating of Commercial Smallsat Launch Vehicles. https://doi.org/10.13009/EUCASS2017-286
Goff, J. (2021). SpaceX COMSTAC Briefing | Selenian Boondocks. Retrieved June 20, 2022, from Selenianboondocks.com website: https://selenianboondocks.com/2006/10/spacex-comstacbriefing/
Ravi, V. (2020, November). Design of a Commercial Narrow Body Aircraft. Retrieved June 20, 2022, from ResearchGate website: https://www.researchgate.net/publication/349311912_Desi gn_of_a_Commercial_Narrow_Body_Aircraft
Osheku, C. (2018). Retrieved June 20, 2022, from Intechopen.com website: https://www.intechopen.com/chapters/64567
Almahmood, Bradley, Soret (2022). Retrieved June 21, 2022, from CFM International website: https://www.cfmaeroengines.com/press-articles/cfm56-7an-in-depth-look-at-the-new-industry-leader/
Bussler, L., & Sippel, M. (n.d.). Comparison of Return Options for Reusable First Stages. Retrieved from https://elib.dlr.de/112470/1/Comparison_Of_Return_Optio ns_L.Bussler_M.Sippel.pdf
Stappert, S., Wilken, J., Bussler, L., & Sippel, M. (n.d.). A Systematic Comparison of Reusable First Stage Return Options. Retrieved from https://elib.dlr.de/128623/1/EUCASS2019_AKIRA_438_fi nal.pdf
Spaceflight101. (2017, December 31). Retrieved June 21, 2022, from Spaceflight101.com website: https://spaceflight101.com/2017-space-launch-statistics/


