


BARRY COHEN President & Broker


With three interest rate cuts of 25 basis points made to date, and two more cuts expected by the end of the year, homebuying activity is starting to percolate in the Greater Toronto Area’s (GTA) luxury segment.
Freehold and condominium sales over $5 million have remained brisk for much of the year, climbing more than eleven per cent between January and September, compared the same period in 2023. The $3 million price point experienced a modest uptick after the first rate cut in June, with a growing number of purchasers looking to make the most of softer market conditions before the Bank of Canada announces an end to quantitative tightening, but numbers still lag year-to-date figures for 2023.
The upward trend is expected to continue in coming months. Phones are ringing, appointments are on the upswing, and offers are being made. The buzz created by three consecutive cuts to overnight rates and rumours of ‘mortgage rate wars’ between chartered banks, has contributed to building optimism.

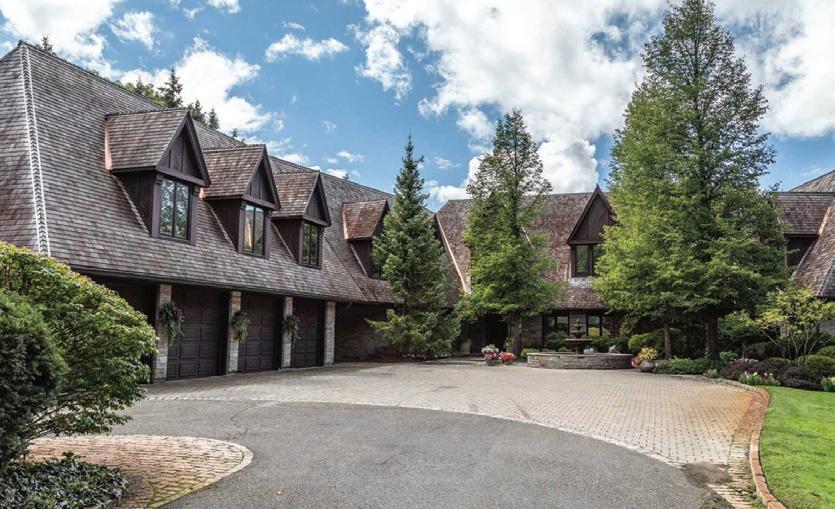
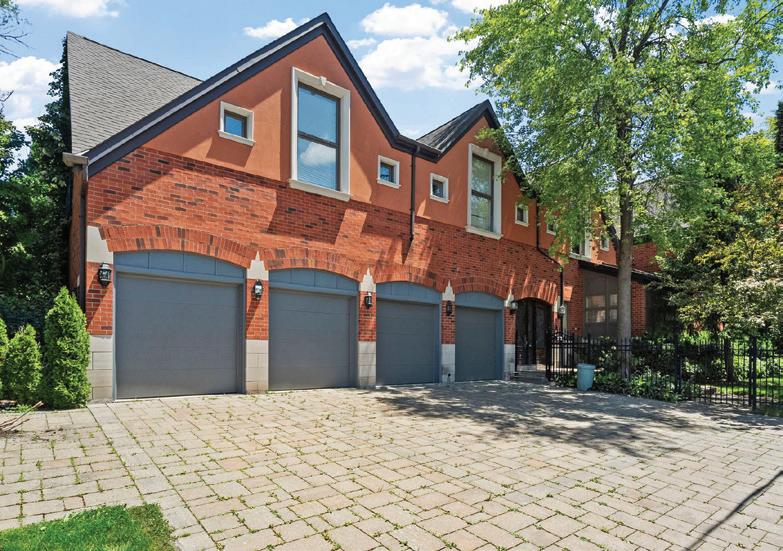
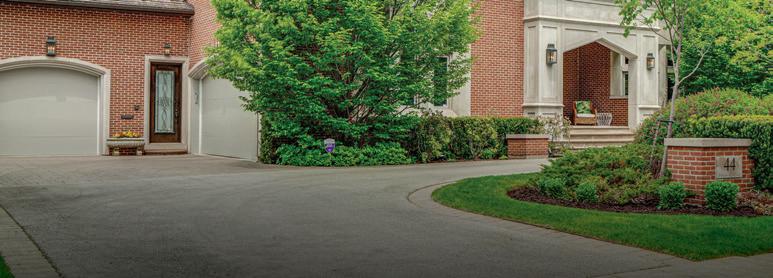
Activity over $5 million has been most robust in the traditional luxury enclaves, including Forest Hill South, Bridle Path-Sunnybrook-York Mills and St. Andrew/ Windfields-Hoggs Hollow. Greater inroads are being made in the Annex and Bedford Park-Nortown neighbourhoods where more sales are occurring over the $5 million price point. Renewed interest in uber-luxe compounds north of the city in pockets including Caledon and King City have been noted in recent weeks.
Freehold & Condominium Sales In The Greater Toronto Area January to September 2024
2023-YTD
Source: REALM, Toronto Regional Real Estate Board (TRREB) Market Watch $2 million plus
million plus
million plus
million plus
million plus


Activity over $10 million popped in September, after lagging behind throughout the first 8 months of the year, and we are now outperforming last year by 18% in the ultra-luxury price points.
While inventory challenges exist in Rosedale, where demand continues to outpace supply, there is a surplus of luxury properties in several areas of the city due to the much discussed disconnect between buyers and sellers. In many instances, properties are overpriced, and as a result, linger on the market for an indefinite period. The new adage “if the price isn’t compelling, the house isn’t selling” has taken hold with realtors, many of whom are urging their serious sellers to take advantage of this window in time.
While lower interest rates are expected to draw more buyers into the overall market, it’s clear that we are not out of the woods yet. There is still some hesitancy as buyers mull over options, with many concerned about the economy and its impact on the housing values. Economic activity has been relatively soft throughout the summer months. Unemployment rates have risen throughout the country. Inflation is winding down and the high cost of shelter is still the biggest contributor to total inflation. Though there is reason for concern, there was recently a few dramatic changes that should have positive impacts on the housing market. First, Ottawa announced a bombshell with the loosening of mortgage insurance and renewal rules. Second, inflation stunned economists by undershooting the two per cent target. Third, the United States Federal Reserve had a jumbo rate cut of 50 bps which should provide the Bank of Canada greater room for rate cuts of their own.
As buyers cautiously move off the sidelines in the months ahead, they’ll find that conditions are shifting in their favour. Rates are now three-quarters of a percentage point off peak levels; selection of properties hasn’t been this good in years with close to 25,000 active listings available in the GTA; and there is talk of at least another .50 basis point drop by year-end, which would likely coincide with closings should buyers decide to pull the trigger in October or November. Time will tell but history has shown that when interest rates go down, prices have nowhere to go but up.
If you’re looking for help with timing, or just trying to navigate the ebbs and flows of the market, feel free to give me or my team a call. We’re happy to offer our advice and expertise, and never too busy to talk real estate!
All the best,
Barry Cohen
We are the exclusive partner of Forbes Global Properties, for the GTA & Cottage Country, an invitation only platform showcasing the world’s finest homes to a targeted audience of luxury buyers.
Cohen Homes & Estates benefits from an unmatched brand halo effect and reach through Forbes Global Properties
INDUSTRY SHARE OF VOICE
83% Forbes / Forbes Global Properties
7% Berkshire Hathaway / BHHS
4% Sotheby’s/Sotheby’s Int. Real Estate
3% Christie’s/Christie’s Int. Real Estate
1% Coldwell Banker
0.7% Savills
0.7% Knight Frank
0.2% Engel & Völkers
Source: Meltwater Media Monitoring, Q1-Q4 2023.


CARPINTERIA, CALIFORNIA


LAS CATALINAS, COSA RICA Offered at $10,000,000 US


Offered at $75,000,000 US FLORENCE, TUSCANY, ITALY Offered at $19,540,440 US


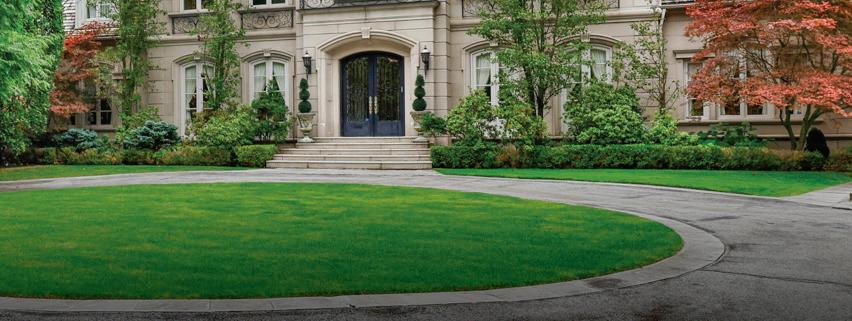
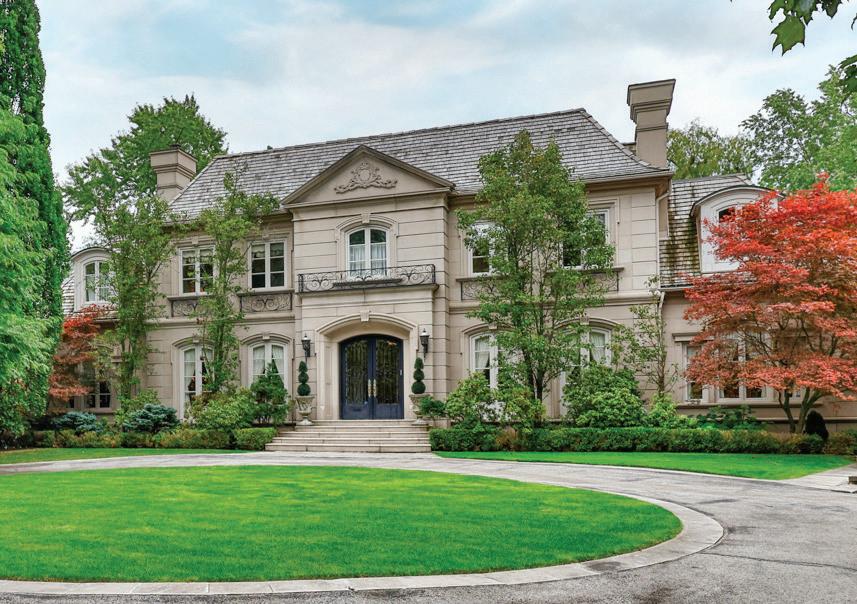
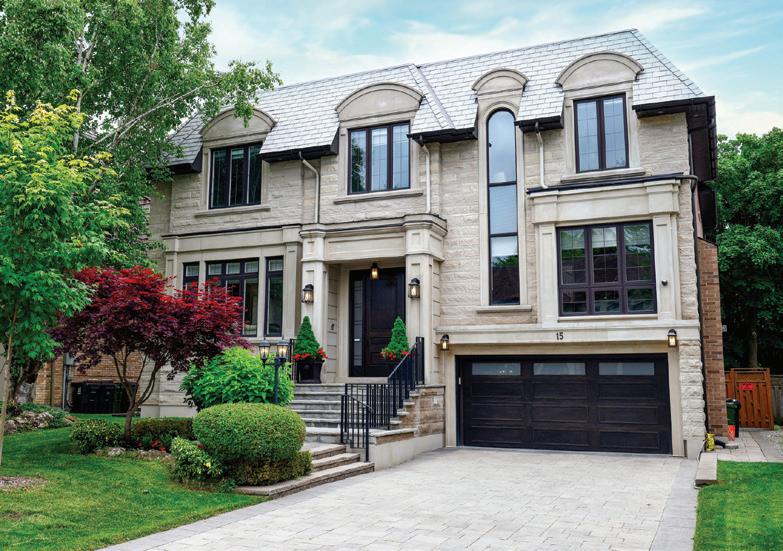
After a strong start to the year, luxury sales in Toronto Regional Real Estate Board’s (TRREB) C12 district dropped by almost 14 per cent in the first eight months of 2024, compared to the same period in 2023. Values, however, held relative steady in St. Andrew-Windfields-Hoggs Hollow at -3 per cent and soared in the Bridle Path-Sunnybrook-York Mills area by 28 per cent. Average price over the $2 million price point is now hovering at more than $6.5 million in the Bridle Path-Sunnybrook-York Mills area, highlighting the impact of higher priced sales on the overall market. Six properties moved over the $5 million price point between January and August, the highest of which surpassed $16 million.
Demand remains stable overall, with buyer’s starting to take advantage of lower interest rates, but sellers have been holding firm on listing prices. As a result, the sale-to-listing ratio for the area hovered at 94 per cent this year, with two-storey detached homes most sought-after in Bridle Path-Sunnybrook-York Mills. Days on market sat at 34 in 2024. In neighbouring St. Andrew-Windfields-Hoggs Hollow, average price has fallen below $4 million, now sitting at $3,937,406. Homes in the neighbourhood typically achieve a sale-to-listing ratio of 98 per cent, with homes selling within 34 days on average. The highest priced sale in the first eight months of the year was just under $7.5 million.
With more buyers expected to enter the market in the coming months, there are some signs that sellers are starting to thaw. Should both come to the table with more realistic expectations, more deals are expected to come together, placing upward pressure on overall housing values in both the Bridle Path-Sunnybrook-York mills and St. Andrew-Windfields-Hoggs Hollow.


January


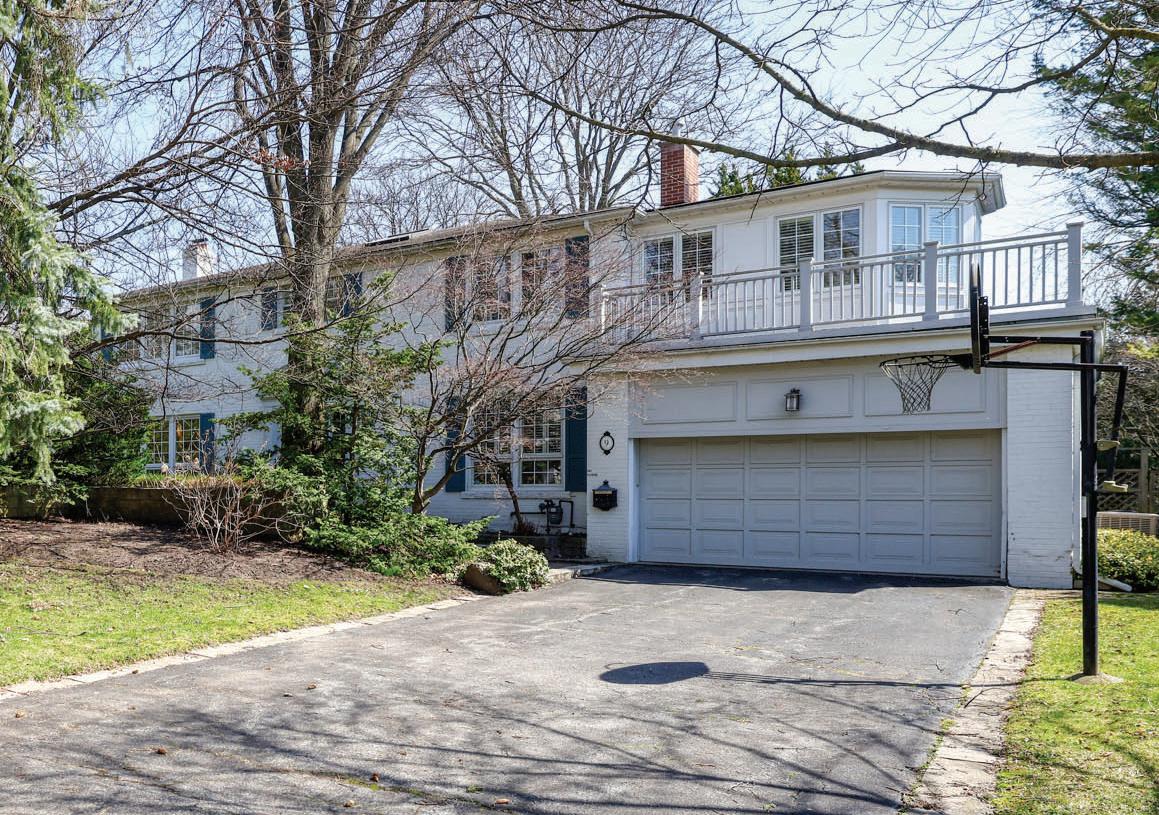
Homebuying activity in the sought-after Forest Hill South community was virtually on par with year ago levels, with 34 homes changing hands in 2024. Average price, however, rose 12 per cent to just over $4.7 million, up from $4.2 million during the same period in 2023. Not surprisingly, most sales were single-detached, with just two semidetached homes selling during the eight-month period.
Humewood-Cedarvale remained a perennial favourite with younger buyers, but high interest rates impacted homebuying activity to some extent this year. Nineteen properties changed hands, three of which were semi-detached. There was a slight increase in sales over $3 million, with five sales reported in the first eight months of the year, compared to three one year early. Detached homes were highly desired in both Cedarvale and Humewood, with yearto-date average price sitting at close to $2.9 million, up five per cent from year-ago levels for the same timeframe.
January 1st - August 31st, 2024 vs. same period in 2023
Average Sold Price 2023
$4,225,084
Average Sold Price 2024 $4,716,118 12% Year-over-year
January 1st - August 31st, 2024 vs. same period in 2023
Average Sold Price 2023
$2,577,298
Average Sold Price 2024
$2,694,079 5% Year-over-year


Luxury sales over the $2 million price point were up just over five per cent in the Toronto Regional Real Estate Board C02 district, led by strong market conditions in the Yonge-St. Clair neighbourhood where sales rose 25 per cent, followed by the Annex at 2.9 per cent, in the first eight months of the year. Casa Loma fell short of year-ago sales levels, registering 19 sales to date, compared to 21 in 2023.
These neighbourhoods continue to attract young and old alike, with two-thirds of sales this year in the Annex involving a semi-detached or attached/row/townhouse. Average price hovered at $3.25 million to date, up seven per cent compared to 2023 figures. Most properties in the Annex had a 99 per cent sales to list price ratio, with days on market over the eight-month period averaging 30.
Detached homes sales were predominant in Casa Loma, with days on market averaging 15 in 2024. Values approached $3.5 million in 2024 based on sales to date, a decline of 23 per cent from year-ago levels when five properties moved for more than $5 million. Only two sales occurred in Casa Loma over the $5 million price point this year.
Yonge-St. Clair has experienced strong demand this year, with a 22 per cent uptick in sales over $3 million. Semi-detached homes represented nearly one half of sales in the area. Average price held relatively stable at $3,220,700 in 2024, up four per cent over 2023 figures. Days on market averaged 21 throughout the year.


COVETED


January
January
January


$3,105,625
Both Lawrence Park South and North were strong out of the gate this year, with sales of homes priced at more than $2 million rising by 21.2 and 12.5 per cent respectively between January and August. The trend continued at upper price points, with sales over $3 million climbing by 38 per cent in Lawrence Park South and 12 per cent in Lawrence Park North over year-ago levels for the same period.
Upward pressure on values in Lawrence Park South pushed average price to just over $3.5 million in 2024, slightly ahead of 2023 levels. However, average price softened in Lawrence Park North, falling 10 per cent to close to $2.7 million, down from almost $3 million one year ago. Days on market in Lawrence Park North hovered at nine during the first eight months of the year, while days on market averaged 22 in Lawrence Park South.
Many younger buyers struggling with higher interest rates put their plans on hold in 2024. Areas most popular with this segment have experienced a decline in homebuying activity as a result. To illustrate, just 75 properties sold in Bedford Park-Nortown, an area known to draw young families, in the first eight months of the year, marking a decline of over 24 per cent. Average price held relatively steady in the neighbourhood, sitting at $3,265,940, down just one per cent from year-ago levels.
While the number of homes sold in Forest Hill North matched year ago levels, fewer sales were reported over the $3 million threshold this year. Average price fell eight per cent to almost $2.9 million in the first eight months of the year, compared to the same period in 2023. Days on market averaged 14 in 2024.


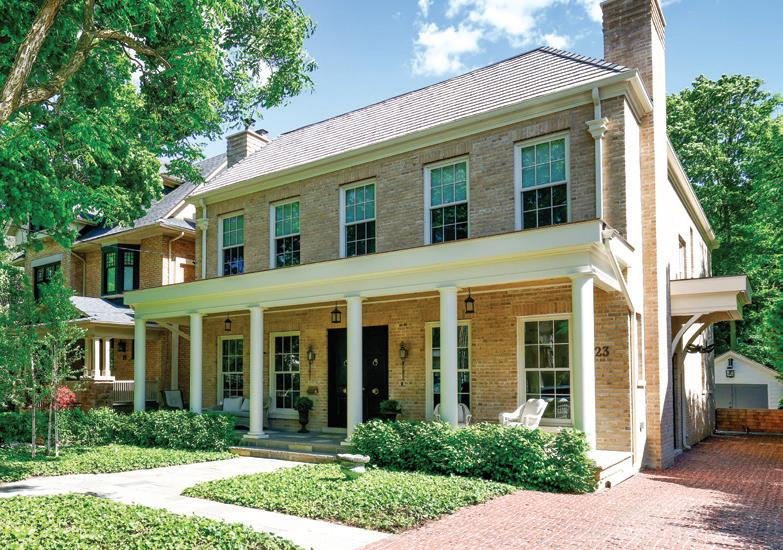


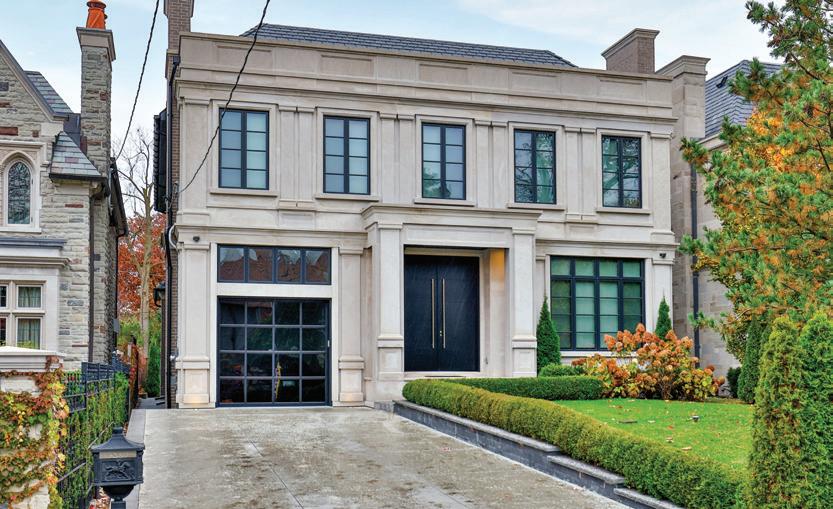
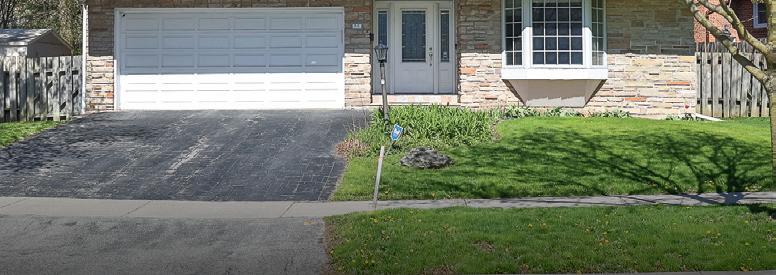
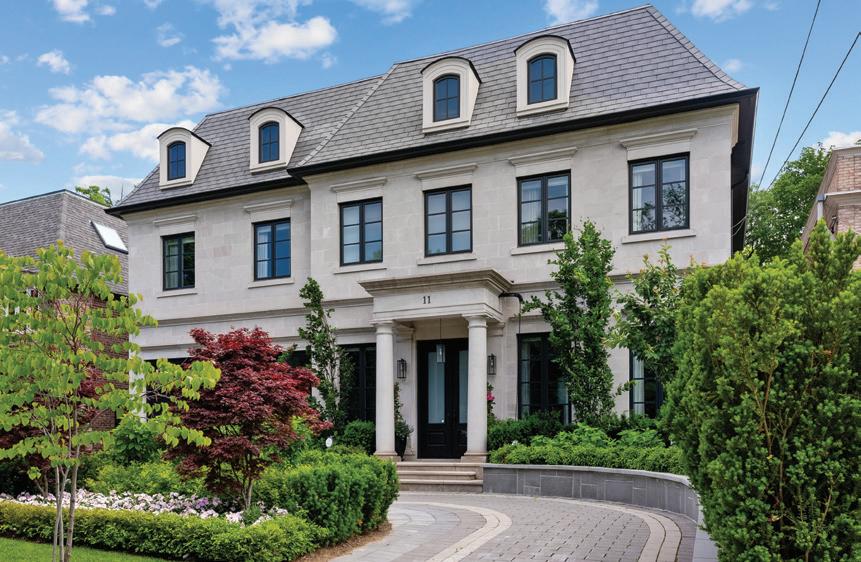
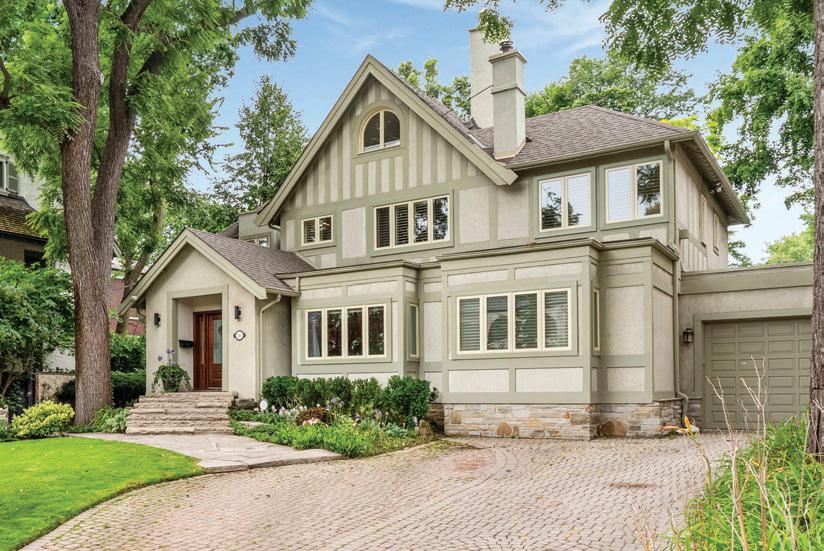
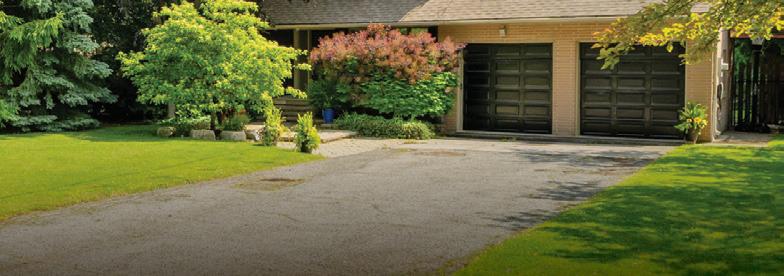
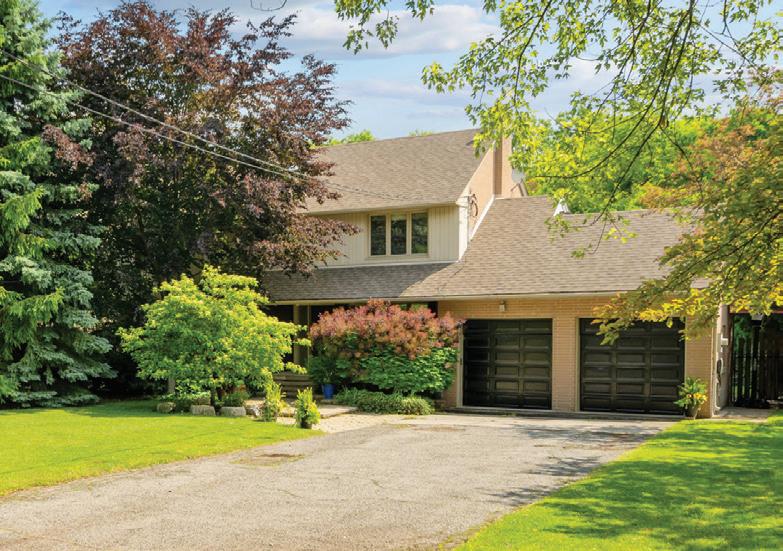
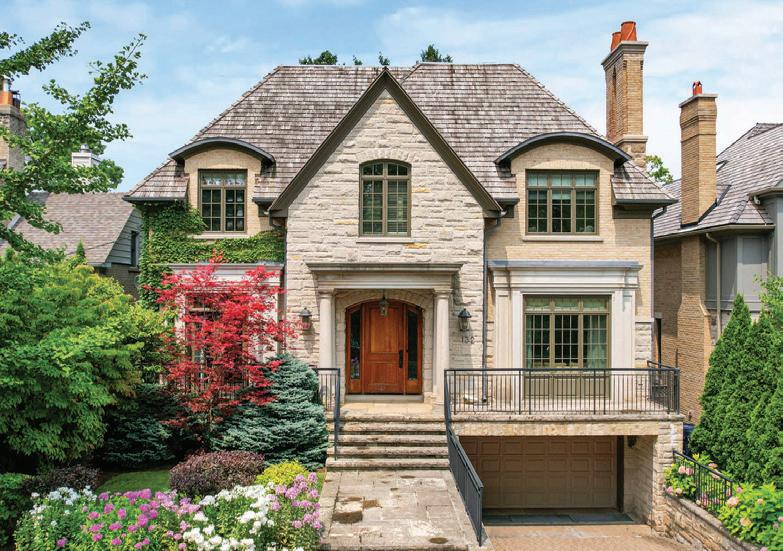
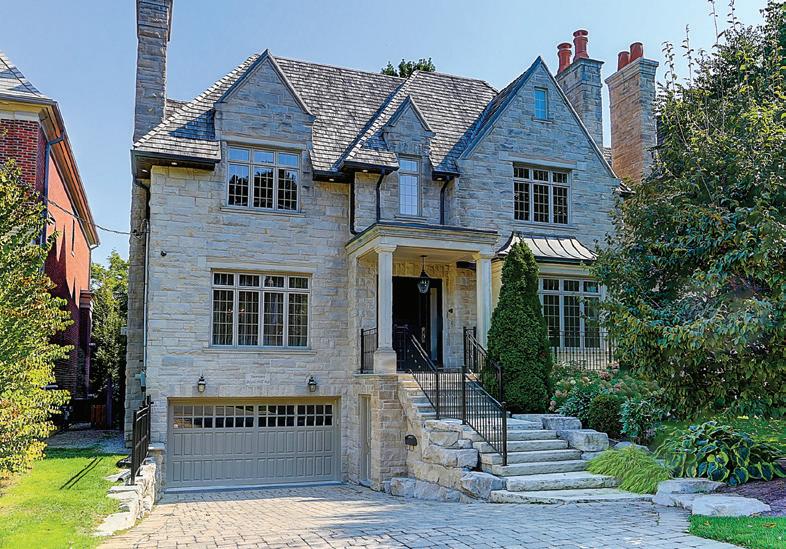
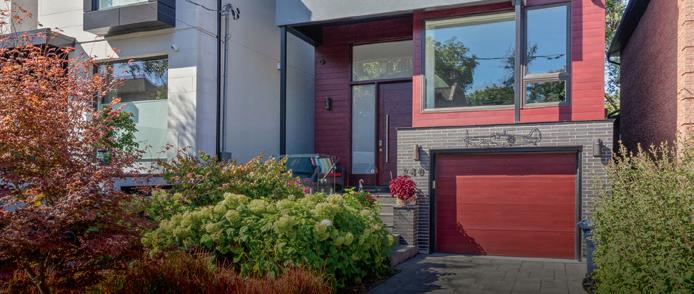
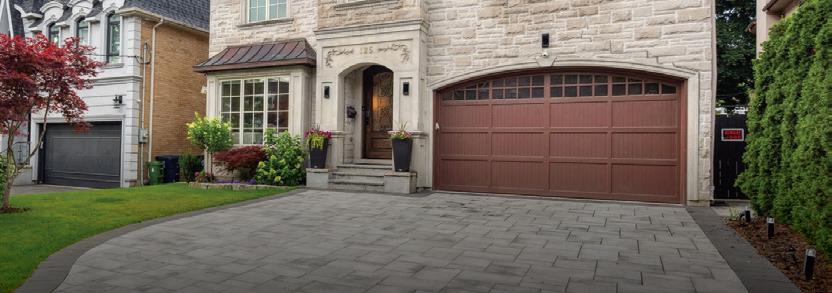
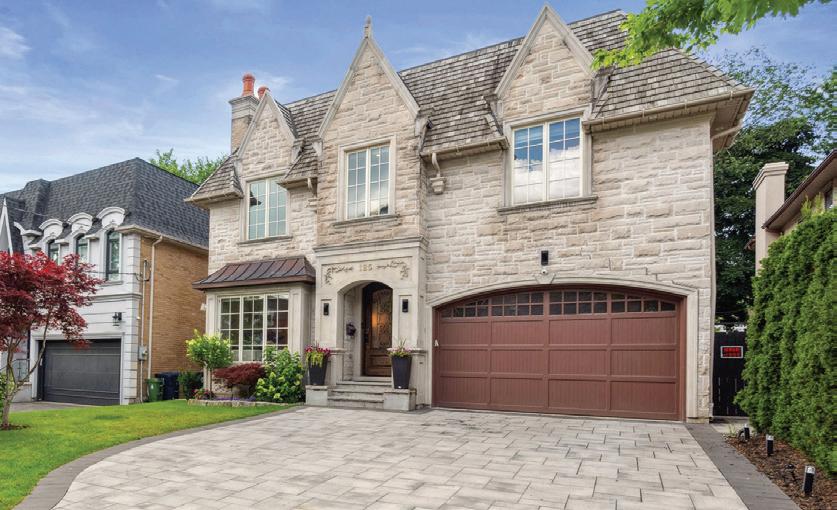
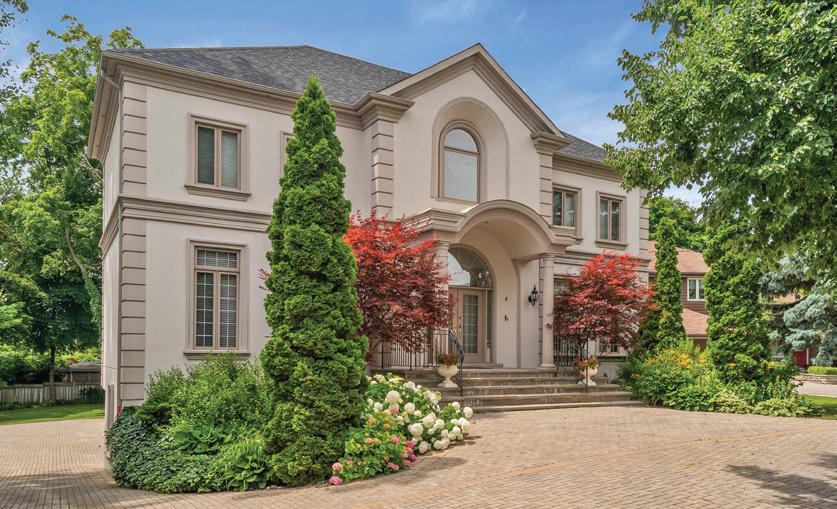
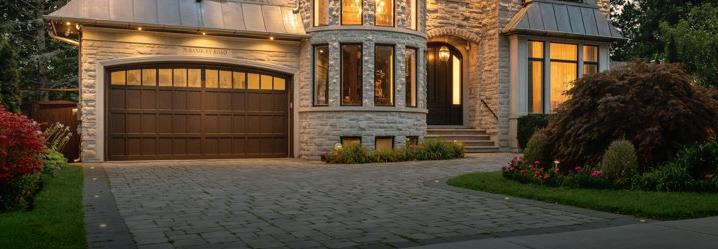
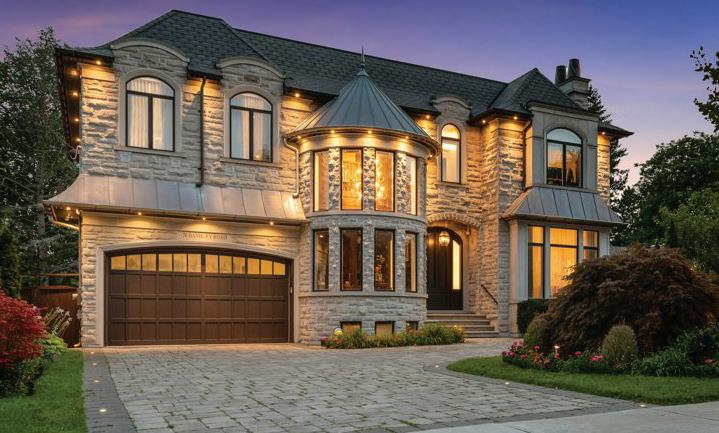
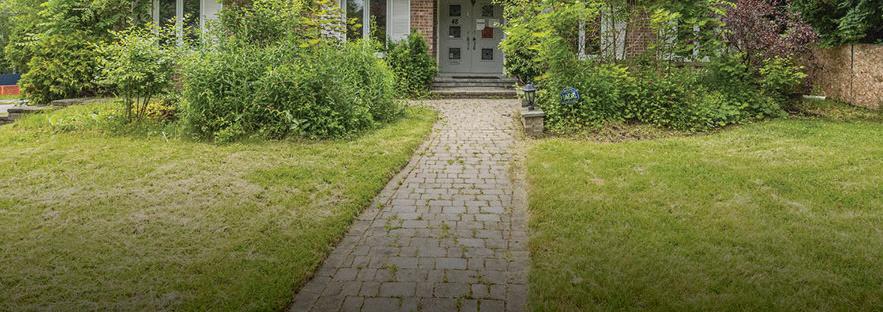
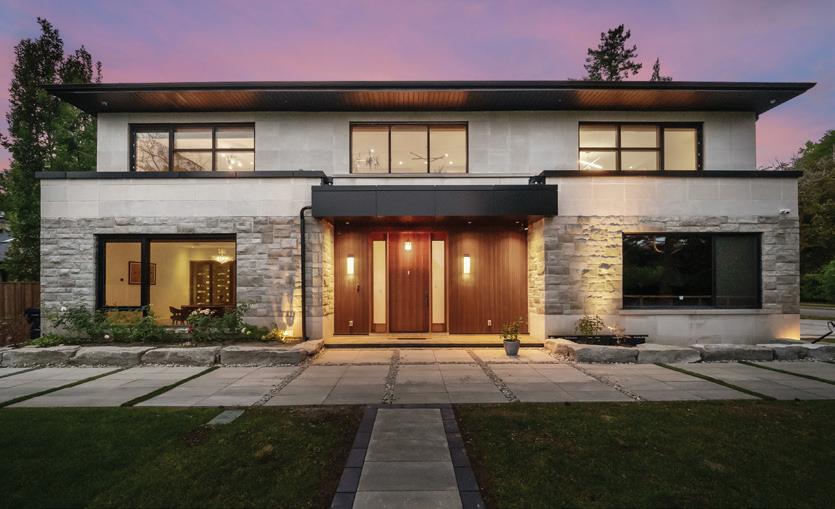
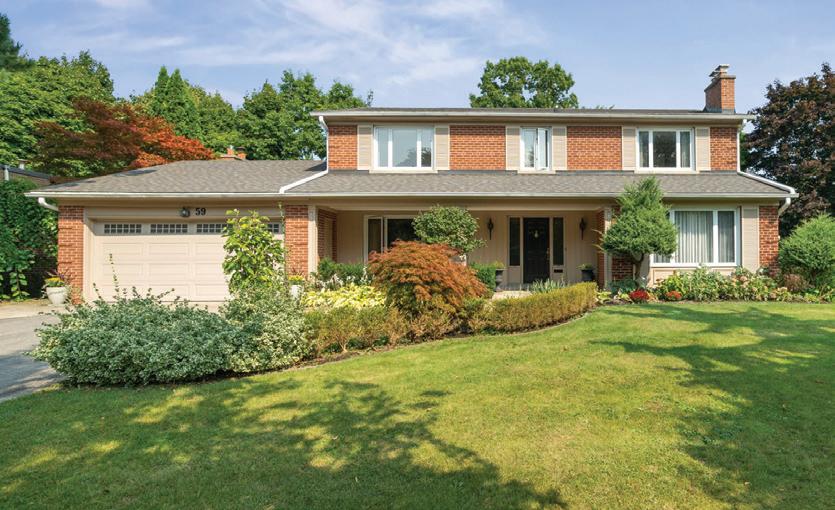
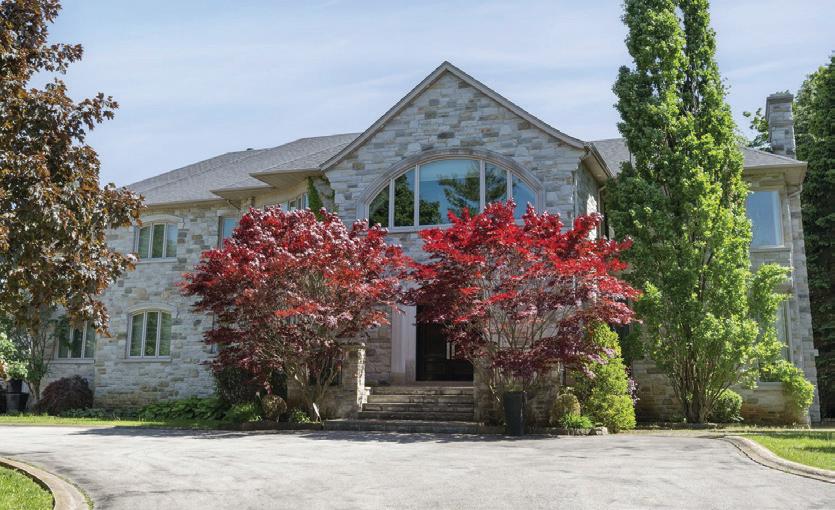
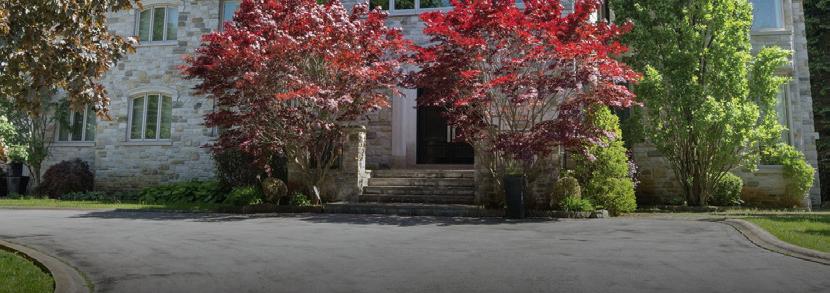
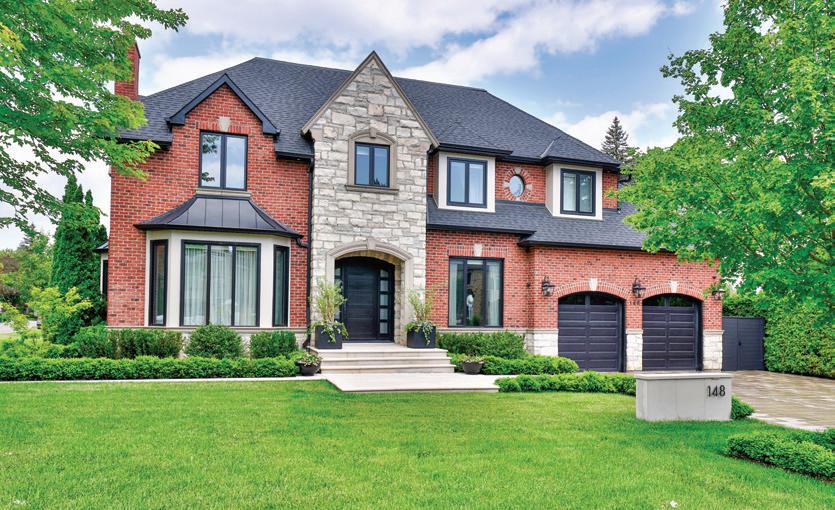
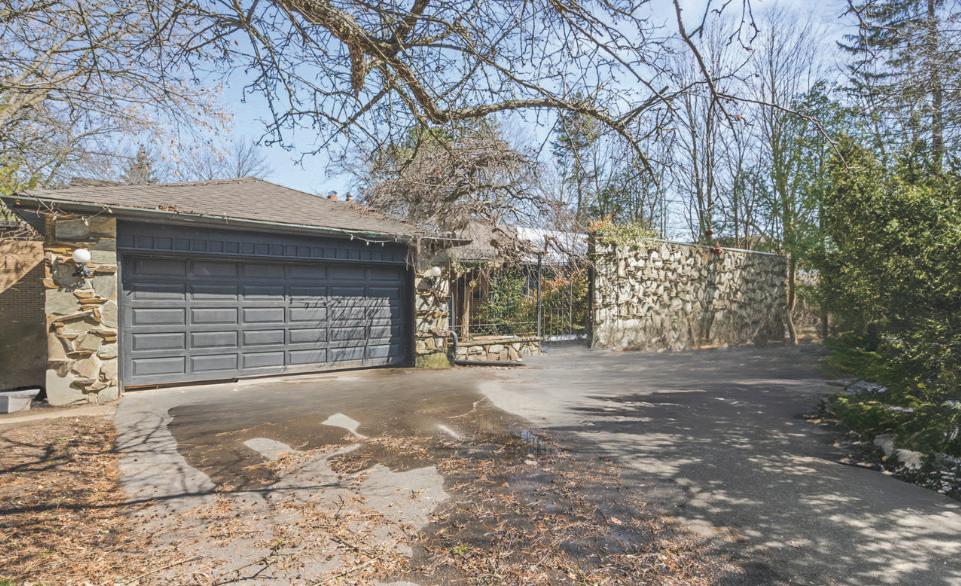
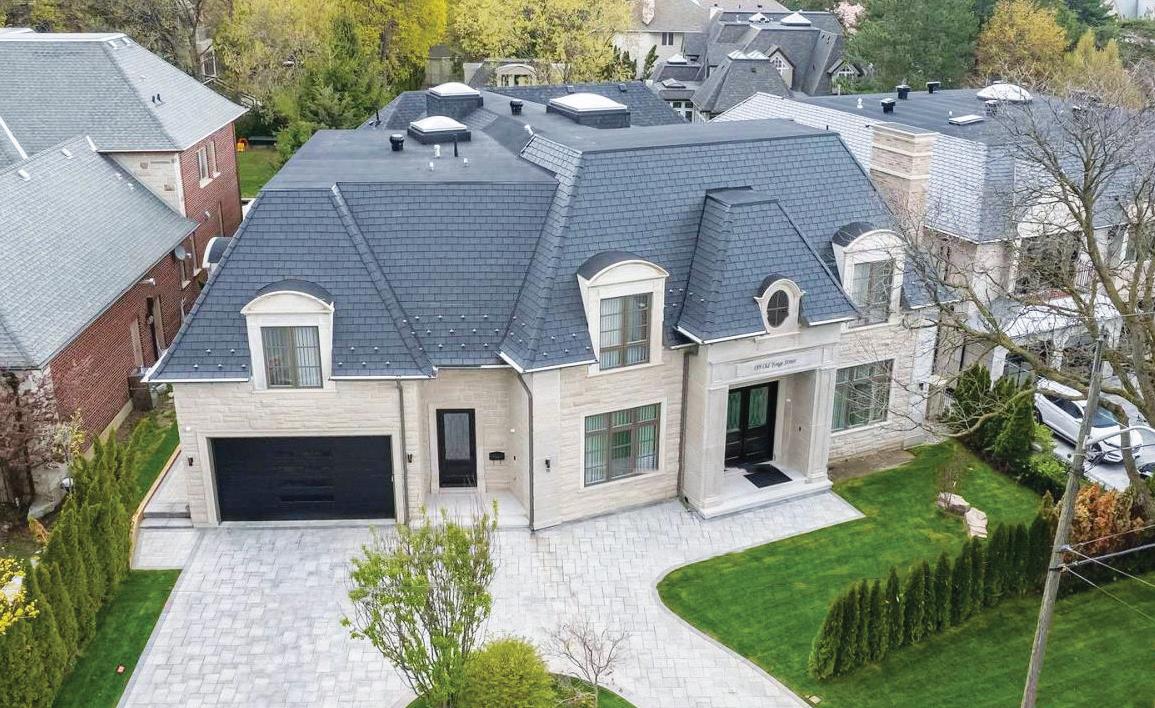
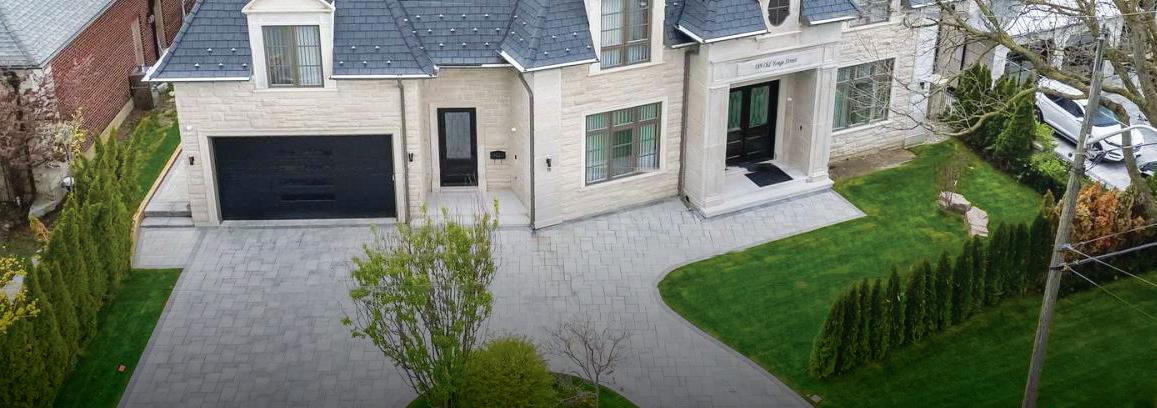
SOLD | 46 Sandringham Drive
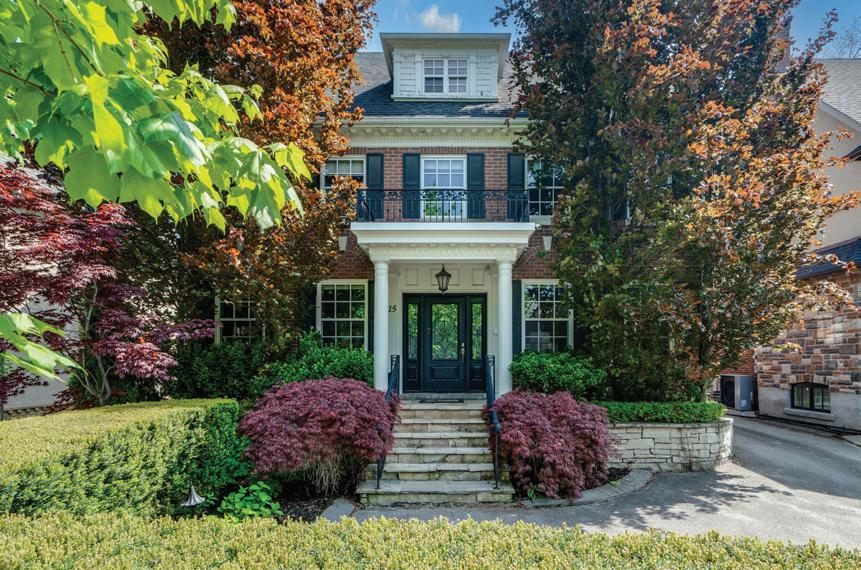
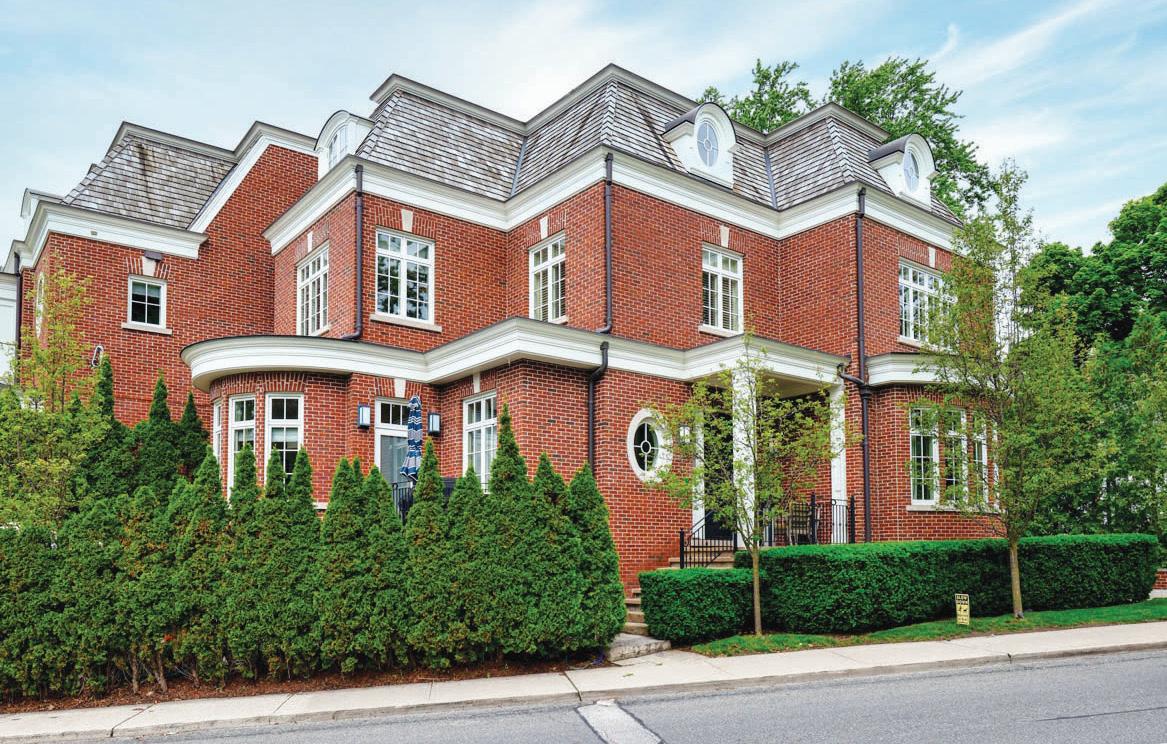
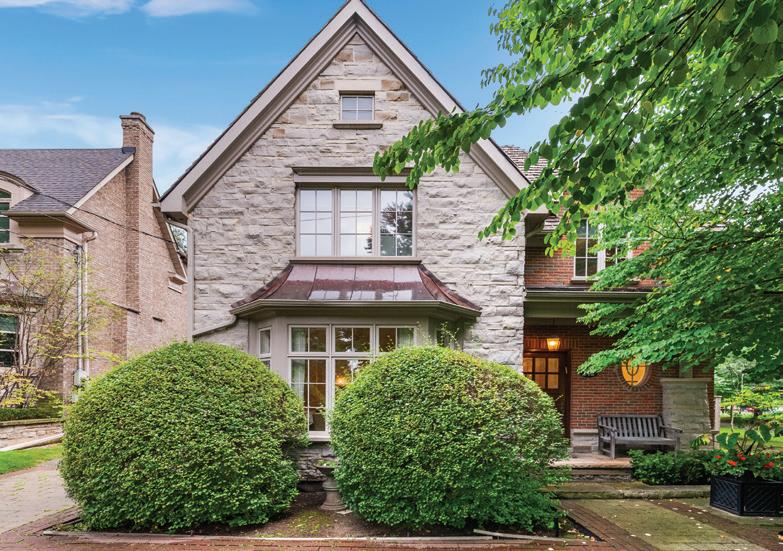
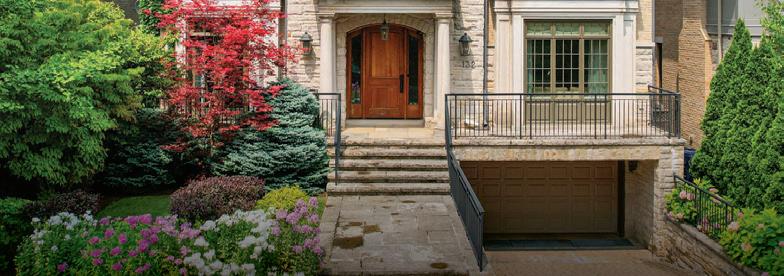
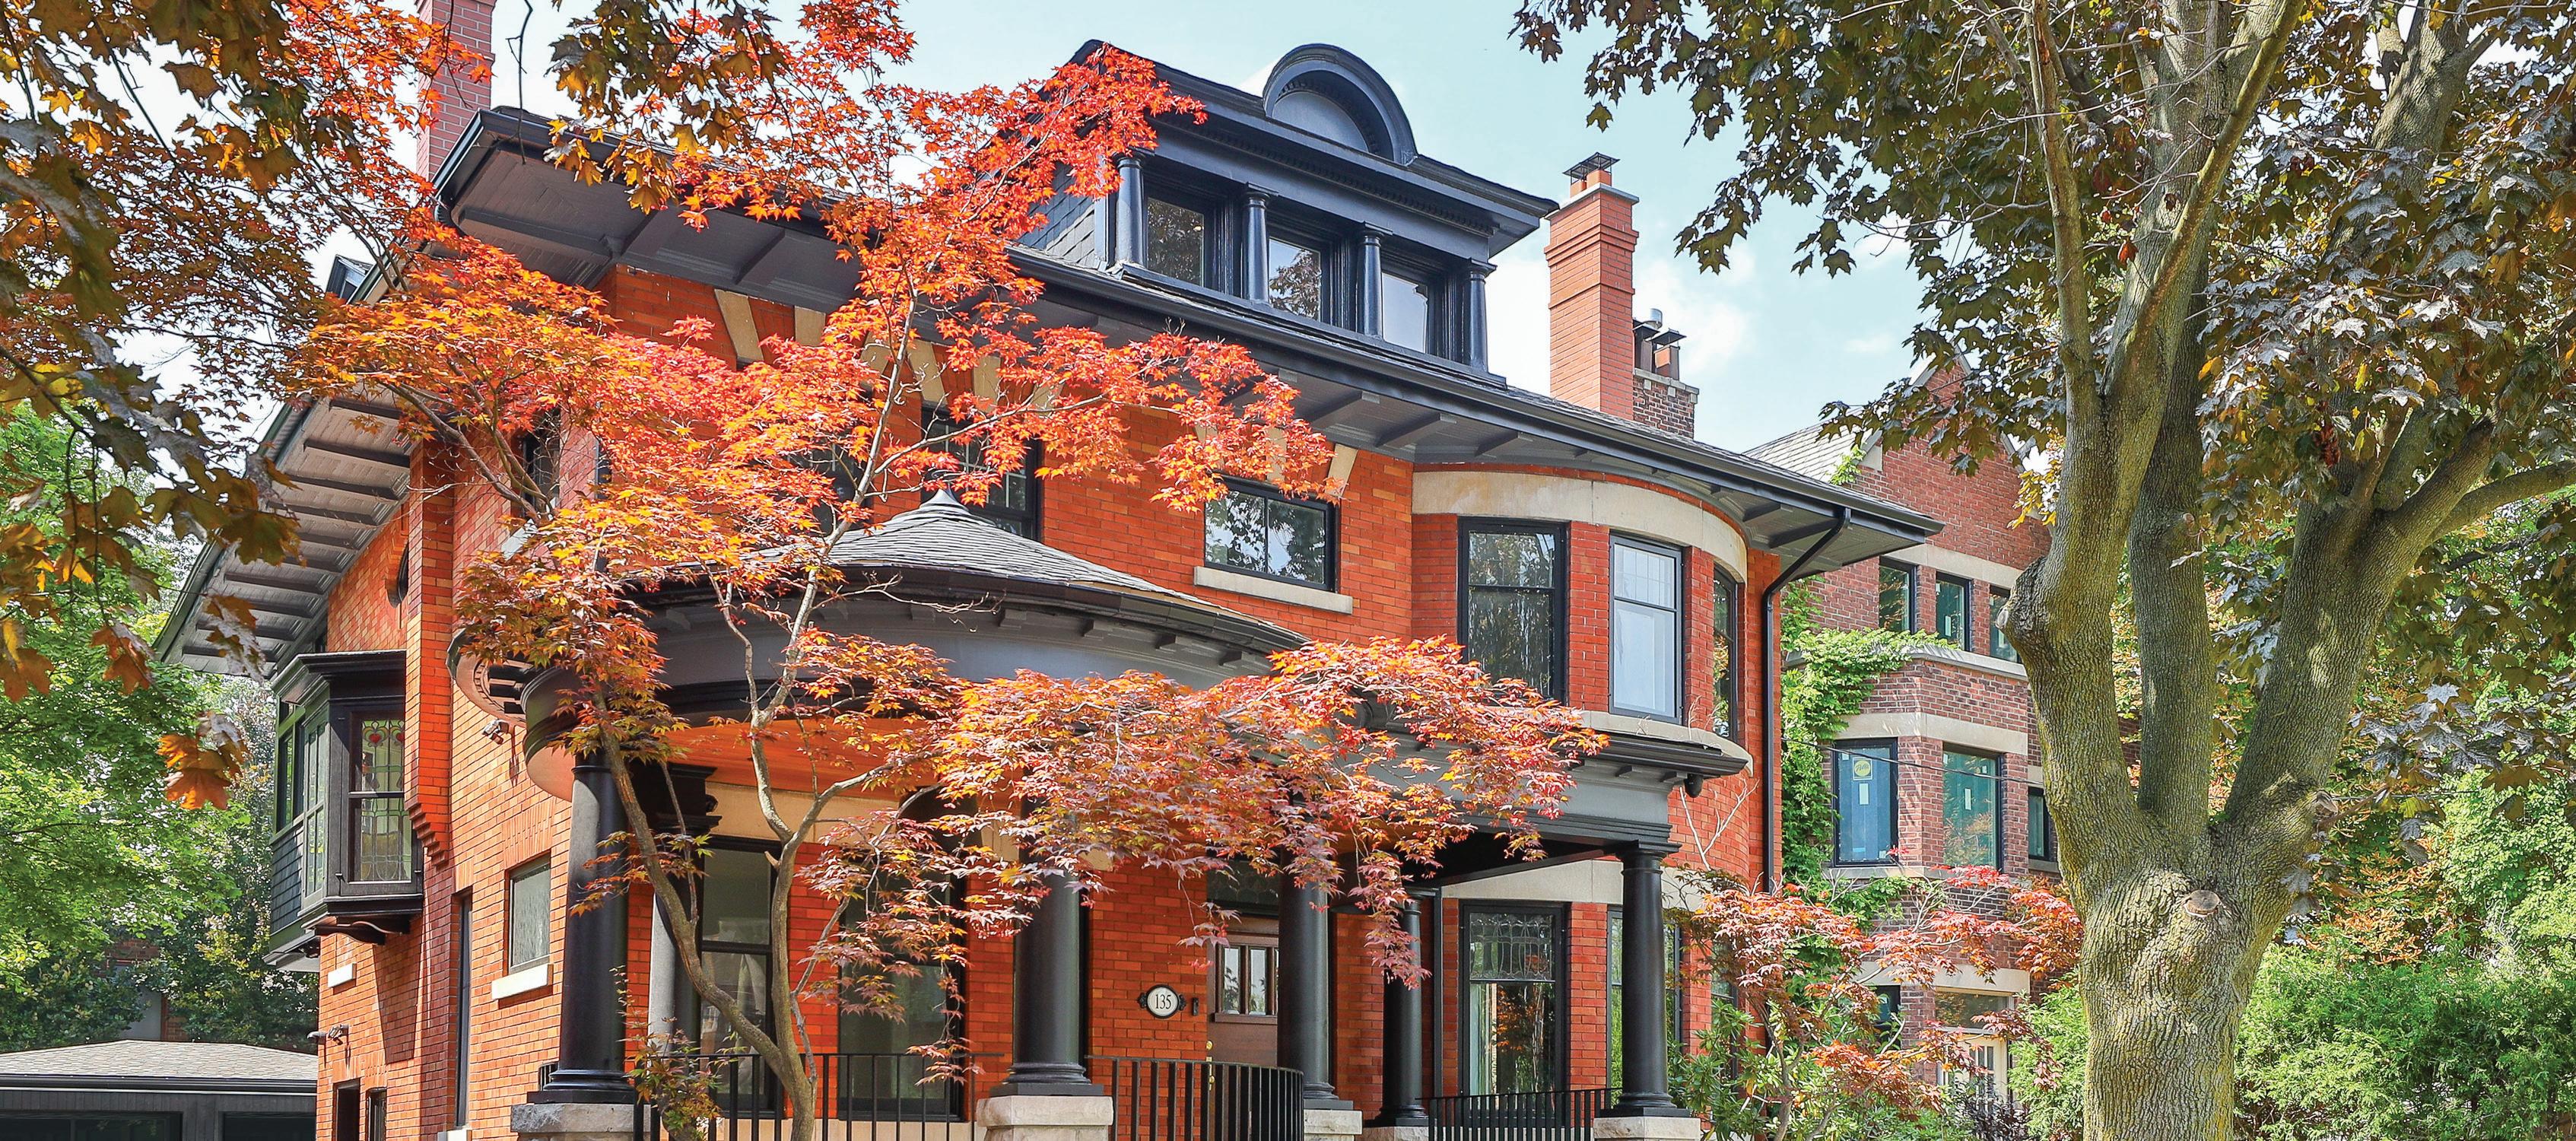
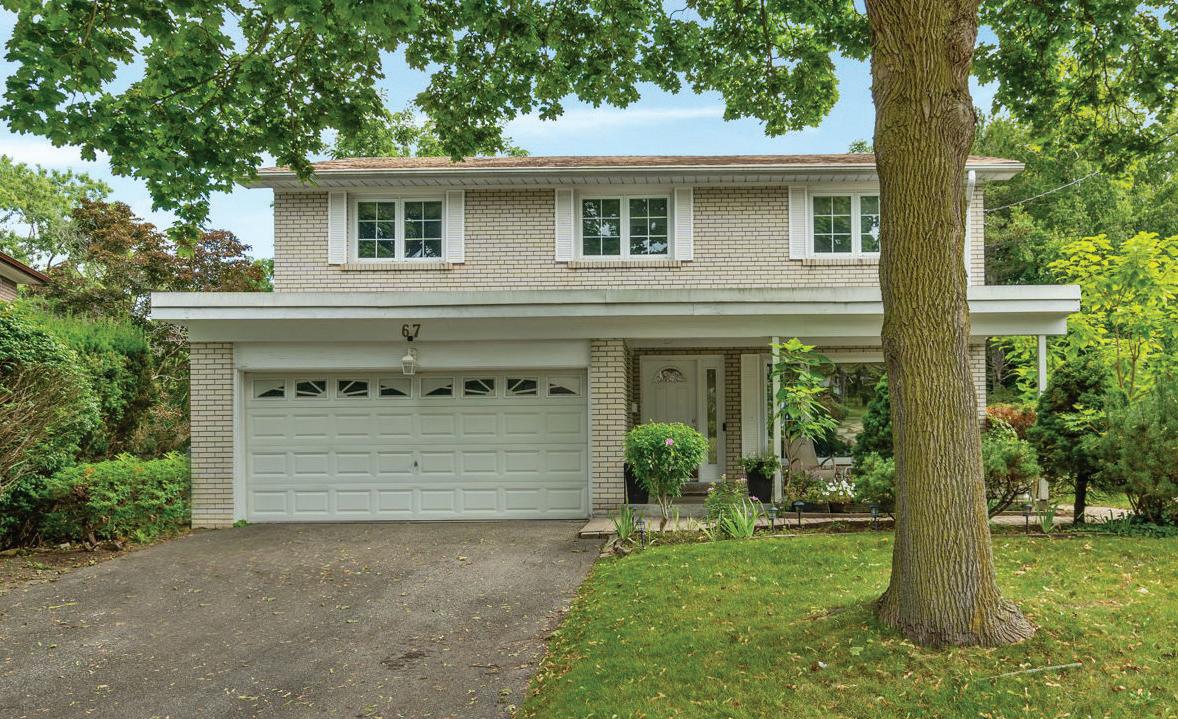
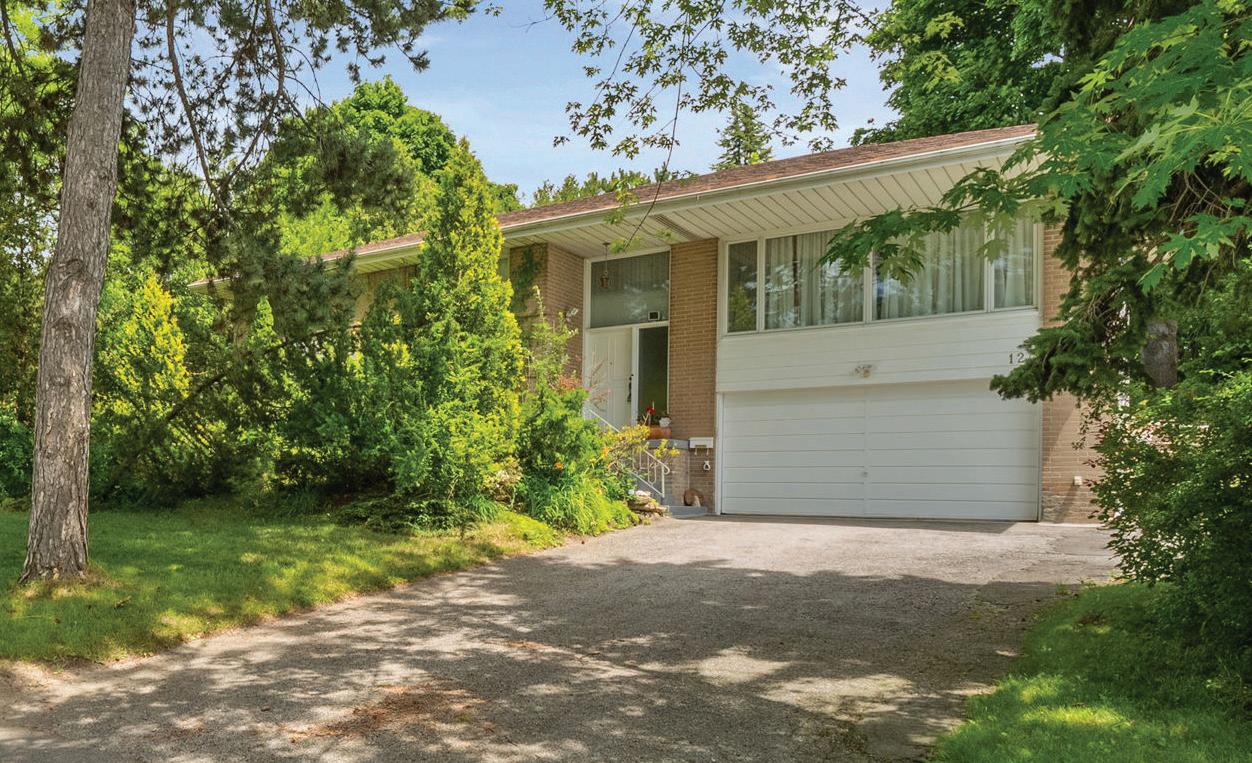
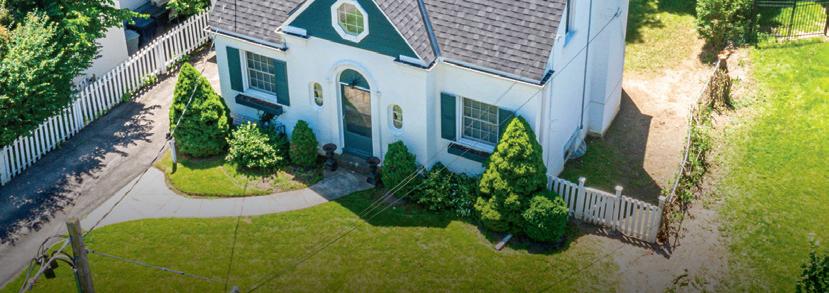
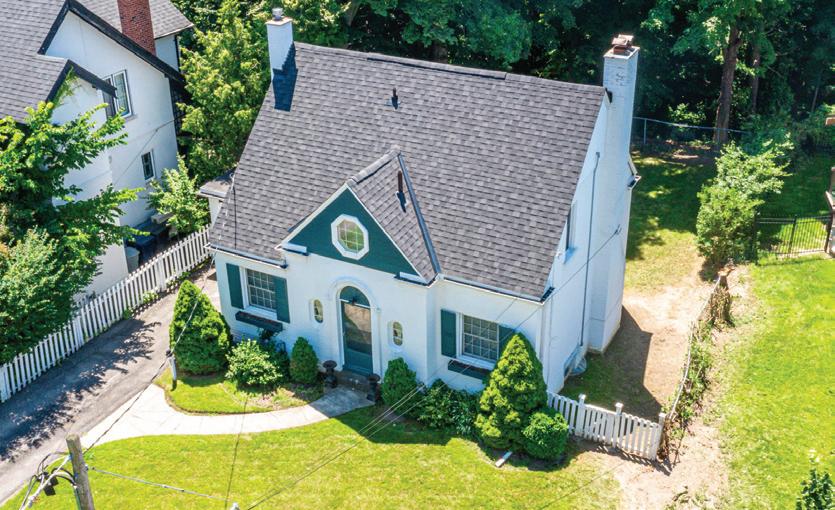
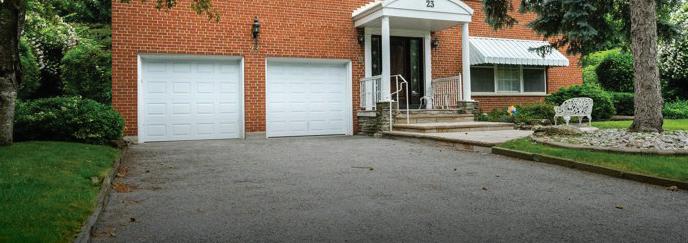
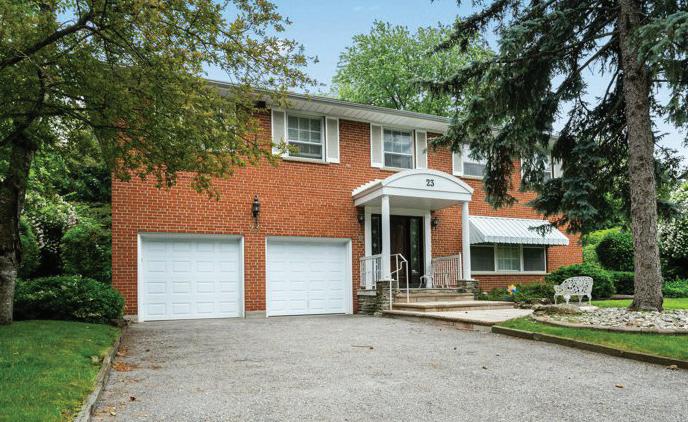
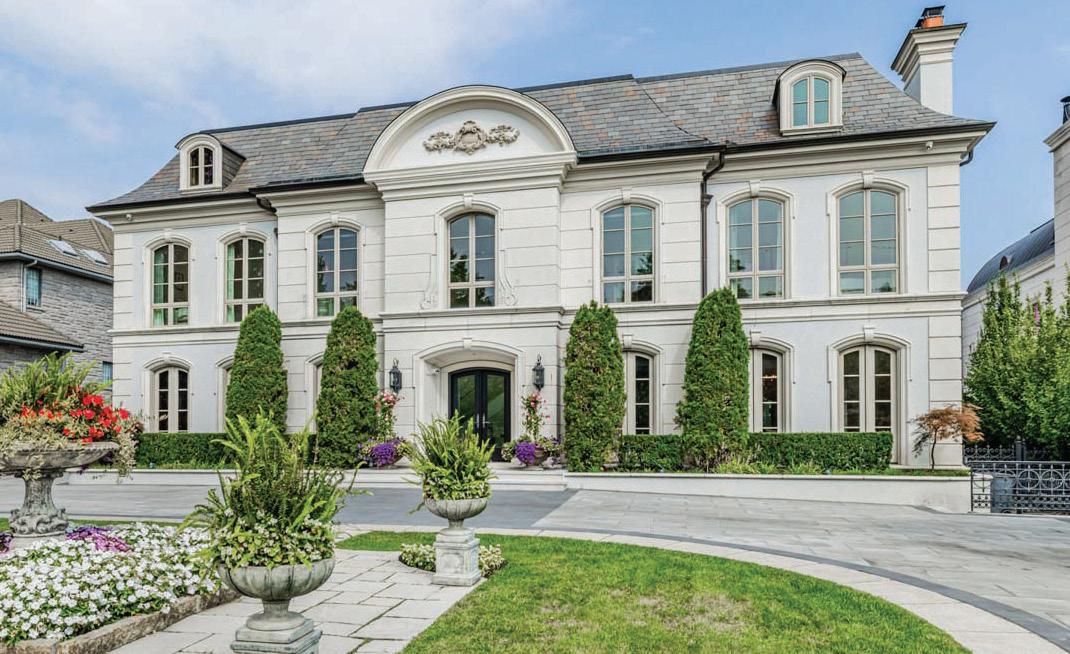
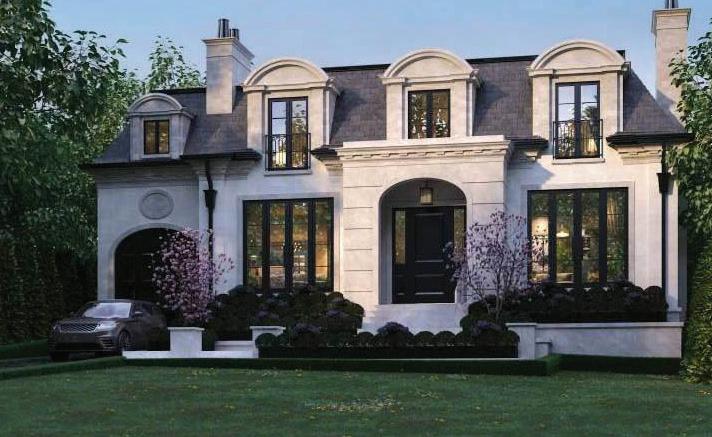
SOLD | 132 Rochester Avenue
January 1st - August 31st, 2024 vs. same period in 2023
$2
$3
Lawrence Park North
January 1st - August 31st, 2024 vs. same period in 2023
$7.5
January 1st - August 31st, 2024 vs. same period in 2023
$2
$7.5
Forest Hill North
January
$2
$7.5

$3,297,947

$2,984,501
$2,692,018

Chronically under supplied Rosedale-Moore Park saw a significant uptick in sales over $2 million as more listings became available under the $5 million price point. Sixty-five properties changed hands over $2 million in the first eight months of the year, up 20.4 per cent from the 54 sales posted during the same period in 2023. Fiftyone properties sold between $2 million and $5 million.
A lack of quality listings at the top end of the market has hampered sales over $5 million. To date, just 14 properties have changed hands over $5 million, down marginally from 15 reported in 2023. Sales over $7.5 million are on par with year-ago levels. The impact of fewer sales in the top end of the market this year is noted in the average price, which has fallen two per cent to $4.1 million, down from just over $4.2 million one year ago.
January 1st - August31 st, 2024 vs. same period in 2023
Average Sold Price 2023 $4,218,966
Average Sold Price 2024 $4,122,368 -2% Year-over-year
Homebuying activity in Leaside continues to outperform all other markets in terms of percentage increase, with the number of properties changing hands over $2 million up 46 per cent over year-ago levels in the first eight months of 2024. Seventy-three properties have changed hands to date, up from 50 during the same period in 2023, all falling within the detached housing type category.
Average price has softened somewhat year-over-year, falling seven per cent to $2,908,555. Still, the area commands a sale-to-list price ratio of 101 per cent, with properties moving within 10 days on average.
Young families continue to be drawn to the walkability of the community and proximity to high-end shops, restaurants, and childcare. The quick drive down the Bayview Extension to the heart of the downtown is also a plus for those working in the core.
January 1st - August 31st, 2024 vs. same period in 2023
$2
$5 million plus 1 1
$7.5 million plus 0 0
Average Sold Price 2023
$3,111,691
Average Sold Price 2024
$2,908,555 -7%
Year-over-year
Buyers continue to show interest in detached properties in the Banbury-Don Mills neighbourhood, but inventory remains tight, with the sales-to-list price ratio hovering at 101 per cent in 2024. Sales over the $2 million price point were off last year’s levels by 36 per cent, while the number of homes changing hands over $3 million held steady in 2024, with 25 sales reported between January and August.
While most of the sales in Banbury-Don Mills this year were detached properties, six of those sold were bungalows. The sales could potentially signal a return of builders/developers to the area after an extended hiatus brought on by higher interest rates.
January 1st - August 31st, 2024 vs. same period in 2023
$2
$7.5 million plus 1
Average Sold Price 2023
$3,562,834
Average Sold Price 2024
$3,150,125 -12%
Year-over-year
Several new condominium projects coming to market this year created somewhat of a glut in the Greater Toronto Area, placing downward pressure on overall values. While condo sales in the upper end are somewhat insulated from the influx, the number of townhomes and apartments changing hands over $2 million are down almost 12 per cent this year, with 163 sales so far this year, compared to 185 during the same period one year ago. Luxury condo values are holding steady, with average price up two per cent over 2023. Between January and August of this year, values topped $3 million, up two per cent over the $2,938,643 posted in 2023.
Eighty-three per cent of condominium sales now occur in the Toronto area, with the remaining 17 per. cent split between Halton, Peel and York. The most popular areas remain in the downtown core, with Waterfront Properties leading the way at 24 sales, followed by the Annex at 21; Rosedale at 13; and the Bay St. Corridor at 11. Midtown locations such as Yonge St. Clair (13), at Casa Loma (12), Lawrence Park (eight) and the Bridle Path (eight) are also sought-after, particularly by empty-nesters and retirees. New construction in buildings along the waterfront are also creating a buzz, with five sales in Mimico and five in Port Credit this year. Old Oakville in Halton Region is also a popular choice, with seven condo sales so far this year.
With the aging of baby boomers, the necessity for larger condominiums in established neighbourhood is becoming more apparent. New construction along major arteries in neighbourhoods such as Bedford-Nortown, Lawrence Park and the Beaches is a good start, but the city’s west end could use some high-end product in areas like the Kingsway and Bloor West Village.
January 1st - August31 st, 2024 vs. same period in 2023
Average Sold Price 2023
$2,938,643
Average Sold Price 2024 $3,006,035 2% Year-over-year


When it comes to luxury listings, RE/MAX’s network, dedicated platforms, and marketing reach find exactly the right buyer – no matter where they reside.
3 rd LARGEST
2 nd LARGEST 70 Countries 880 Offices 4 th LARGEST 45 Countries 1,200 Offices
Countries 4,000 Offices
Positioned as the only real estate company with true global reach, the Global RE/MAX portal, global.remax.net, facilitates listing marketing in nearly 100 countries and 40+ languages, from coast to coast and beyond.
RE/MAX’s online advantage, across the planet, is miles ahead of the competition, due to a marketing budget that is bigger than all other competitors combined. Additionally, Barry Cohen Homes is organically found at the top of Google for Toronto Luxury Real Estate key search words, allowing us the ability to reach the most amount of buyers for your home.


Toronto Sales Higher Than $10,000,000 (January 01, 2017 to August 31st, 2024)
Cohen Homes & Estates
Competitor A
Competitor B
Competitor C
$349,488,400 36
$143,240,000 $43,200,000 5 12 5
$113,956,668
$90,003,681
$24,550,000 $28,000,000 $203,960,349 $167,790,000 $71,200,000 $148,548,400 $498,036,800
Toronto Sales Higher Than $7,500,000 (January 01, 2017 to August 31st, 2024)
Cohen Homes & Estates
Competitor A
Competitor B
Competitor C
$582,234,900 76 $177,840,000 $113,956,668
$89,088,800 19 6 17
$51,725,000 $99,003,681 $79,994,800 $229,565,000 $212,960,349 $169,083,600 $263,104,900 $845,339,800
Toronto Sales Higher Than $5,000,000 (January 01, 2017 to August 31st, 2024)
Cohen Homes & Estates
$1,165,079,761
$114,194,800 $585,576,000 $371,663,800 $318,371,488 $433,569,900 $1,598,649,661
Competitor A
Competitor B
Competitor C
$304,579,388 $244,569,000 $1,563,596,060 $812,190,388 $740,761,385 $689,970,700 $2,449,817,547
Barry’s Market Insight
Price Validation from Brand Reputation
Custom & Effective Marketing Strategies
Unparalleled Service
Multicultural Team
Forbes’ Global Reach Exclusive to Cohen
Client Concierge for Staging & Repairs
Unrivalled Negotiation Strategies
Most importantly, we represent More Sellers than any competitor which allows us to generate More Buyers, more offers, higher prices, and ultimately More Sales!