Rural Workforce Transportation Study Report EXECUTIVE SUMMARY Prepared For:
Prepared By:
March 2020
CONTENTS Introduction .................................................................................................................................... 1 Study Purpose and Objectives .............................................................................................................. 1 Needs Assessment ........................................................................................................................... 2 Needs Assessment Findings ................................................................................................................. 2 Rural Service Area and Employment/Training Profiles ......................................................................... 3 Nodes and Corridors Development ...................................................................................................... 3 Defining Rural Service Area Profiles ..................................................................................................... 4 Transportation Strategies Development and Evaluation ...................................................................... 5 Identifying Potential Strategies ............................................................................................................ 5 Defining Measures of Effectiveness ...................................................................................................... 5 Recommendations ............................................................................................................................... 7 Implementation, Costs, and Funding Considerations........................................................................... 9 Incremental Implementation of the Regional Strategy ......................................................................... 9 Planning Level Costs .......................................................................................................................... 10 Summary of Anticipated Costs .................................................................................... 10 Funding Considerations ...................................................................................................................... 12 Potential Funding Sources and Uses ............................................................................ 13 Conclusions and Next Steps ............................................................................................................ 14 Key Steps and Milestones ................................................................................................................... 14
RURAL WORKFORCE TRANSPORTATION STUDY – EXECUTIVE SUMMARY March 2020
PAGE I
INTRODUCTION Initiated in January 2019, the Berkeley-Charleston-Dorchester Council of Governments (BCDCOG) commissioned the Rural Workforce Transportation Study in response to the 2018 Comprehensive Economic Development Strategy (CEDS), which provides strategic direction and action items to guide economic development over the next five years. Integrating transportation strategies that connect the region's labor force to job skills training and employment in the region are an important component to achieve the following CEDS goals:
Grow and support the region's economic base around existing and new sectors that provide long-term economic resiliency and growth.
Ensure that all residents of the region have access to a variety of education and training opportunities.
The region's rural areas, where public transportation options are limited or unavailable, is home to approximately 20 percent of the BCDCOG’s regional unemployed workforce. While the tri-county region of Berkeley, Charleston, and Dorchester counties has a consistently lower unemployment rate than the state as a whole, on average the rural portions of the region have approximately one percent higher unemployment rate (7.8 percent) than the region as a whole (6.9 percent), and some rural areas have unemployment rates as high as 30 percent.
STUDY PURPOSE AND OBJECTIVES The purpose of this Rural Workforce Transportation Study is to provide a regional strategy focused on improving access to job skills training and employment for the rural workforce in the Berkeley, Charleston, Dorchester (BCD) region. The study aligns with Economic Development Administration’s (EDA) investment priorities to encourage job growth and business expansion in manufacturing by developing a skilled labor force and providing employment access to underserved communities, such as those in rural areas. Employers, major industries and small companies, in the region are increasingly concerned about the shortage of available labor for available jobs. The key objectives undertaken in this study to meet this purpose included: 1. Developing an understanding of the BCDCOG regional rural workforce and skill sets; 2. Identifying existing and expanding industry training and employment gaps that could be filled by the rural workforce; and, 3. Developing and evaluating potential strategies and recommending ways to better connect the region’s rural workforce to job skills training and employment opportunities.
RURAL WORKFORCE TRANSPORTATION STUDY – EXECUTIVE SUMMARY March 2020
PAGE 1
NEEDS ASSESSMENT Existing conditions helped to establish a baseline understanding of rural area needs. The conditions also helped identify where both job skills gaps and limited transportation access are creating barriers to gaining employment in the rural communities.
NEEDS ASSESSMENT FINDINGS These findings were used to define what workforce mobility means to the region, outline the key needs and barriers that exist, identify geographic rural areas of focus, and to identify targeted sectors/ industries facing workforce shortages. The four focus areas for the needs assessment findings included:
Defining Workforce Mobility – A broad goal of the study and needs assessment included establishing a definition for workforce mobility in the BCD region as defined by project stakeholders.
Key Needs and Barriers Today – Lack of access to vehicles in rural communities; increasing congestion on roads; and the combined challenges of high living costs due to enhanced transportation costs; lack of access to vehicles and higher unemployment and underemployment rates all create barriers to obtaining employment in the rural areas of the region.
Education and Training Centers – There is a combination of public and private training opportunities, which are used to train the workforce to meet these available job opportunities and address unemployment and underemployment gaps in the region.
Defining Key Industries and Job Needs – Currently, over 75 percent of employment opportunities are concentrated in the Health Services and Private Education, Leisure and Hospitality, Professional and Business Services, Government and Trade, Transportation and Utilities sectors. Most employment growth is forecasted to be in the Production and Mechanical, Hospitality, Medical, Business Operations Support, Software and IT.
RURAL WORKFORCE TRANSPORTATION STUDY – EXECUTIVE SUMMARY March 2020
PAGE 2
RURAL SERVICE AREA AND EMPLOYMENT/TRAINING PROFILES Based on the needs assessment and additional input received as part of Stakeholder Meetings, key rural areas were mapped for employment, education, and training. Rural service area profiles were then developed to more closely understand each rural population area and potential training and employment needs and opportunities.
NODES AND CORRIDORS DEVELOPMENT Data collected through the needs assessment, and through input obtained from stakeholders during Stakeholder Meeting #1 on training, education, and job centers was used to develop a heat map identifying major nodes and corridors within the rural areas in the region and major jobs and training to be served. The heat map of nodes and corridors in the region are shown below. The heat map illustrates tri-county employer locations and densities, major colleges and training centers, major adult education centers, and private training locations.
0 to 1 per square mile
< 38 per square mile
RURAL WORKFORCE TRANSPORTATION STUDY â&#x20AC;&#x201C; EXECUTIVE SUMMARY March 2020
PAGE 3
RURAL SERVICE AREA AND EMPLOYMENT/TRAINING PROFILES
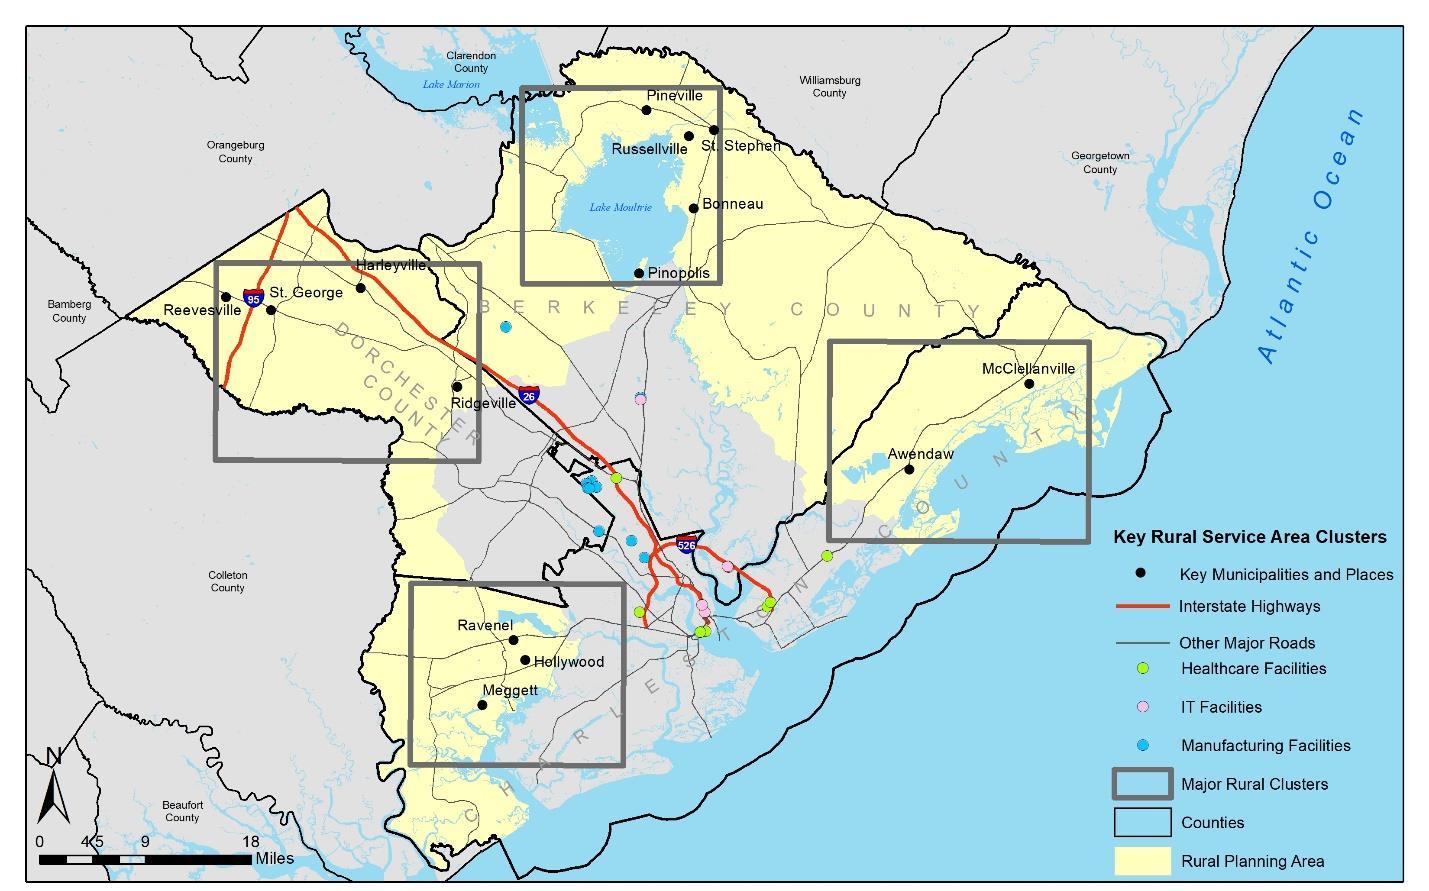
DEFINING RURAL SERVICE AREA PROFILES Based on available data and the identification of places and municipalities within rural areas as part of the initial needs assessment, four main rural clusters were identified within each tri-county area that could comprise an overall rural service area for workforce transportation solutions: Dorchester County northwest of Ridgeville, Berkeley County on the eastern shores of Lake Moultrie, western Charleston County centered near St. Paul’s Parrish, and eastern Charleston County along US 17 north of Mount Pleasant.
RURAL WORKFORCE TRANSPORTATION STUDY – EXECUTIVE SUMMARY March 2020
PAGE 4
TRANSPORTATION STRATEGIES DEVELOPMENT AND EVALUATION The needs assessment along with one-on-one interviews, rural service employment and educational profiles, and additional stakeholder outreach helped to generally define the regionâ&#x20AC;&#x2122;s rural training and workforce challenges and opportunities. Following these analyses, potential measures of effectiveness for meeting the needs of the study and evaluating transportation strategies were developed. Several potential transportation strategies and other supporting strategies were also identified.
IDENTIFYING POTENTIAL STRATEGIES Four broad initial transportation strategies were identified and reviewed with stakeholders and are described below in no particular order of importance. #
Strategy
1
Expand TriCounty Link Service Coverage and/or Frequency
2
Micro-Transit/Ride Hailing and Sharing Options
3
Car Sharing
4
New Training and Employment Specific Carpools or Vanpools
Description Enhancing the frequency, modifying existing TriCounty Link deviated fixed-routes, or creating new TriCounty Link deviated or fixed-routes to service more coverage areas Partnering with ride hailing or ridesharing companies, also known as transportation network companies (TNCs), to offer service in the rural areas or rides specific to job training and employment services Car sharing is a type of car rental where people can rent cars for short periods of time, often just hours. Car sharing can be organized through provisions of cars by companies or by public agencies, other cooperatives, or even individuals. New carpools or vanpools could provide rural communities with direct access specifically to jobs or training in the region and users could either meet up at specified locations for group pick-up service or provide direct services from rural user homes to job or training locations.
DEFINING MEASURES OF EFFECTIVENESS Measures of effectiveness (MOEs) are tools used to frame the desired results of a proposed solution and help evaluate the effectiveness of strategies comparatively. Based on stakeholder input and analyses undertaken, several measures of effectiveness were identified based on overall goals for service between rural communities and employment and training.
RURAL WORKFORCE TRANSPORTATION STUDY â&#x20AC;&#x201C; EXECUTIVE SUMMARY March 2020
PAGE 5
TRANSPORTATION STRATEGIES DEVELOPMENT AND EVALUATION
Measure of Effectiveness
Definition
Service Effectiveness/ Accessibility and Connectivity
Services need to be flexible to accommodate different training and job locations throughout the region and to provide different hours of service to accommodate different training or shift hours. Services provided to link rural communities to jobs and training needs to be available and accessible to a broad array of users.
Ease of Use/Effective Communications
Community Partnerships and Collaboration
Evaluation Factors
Directness
Direct point to point service
Travel Time & Reliability
Comparable travel time to regular automobile travel
Service Flexibility (Time of Day Services)
Provide services at any time
Services need to provide multiple ways of requesting services, from cellular or smartphones to calling by telephone or requesting services by computer.
Strategies that can help leverage partnerships to share costs for services, promote the use of services, and that create a sense of joint community ownership of services are therefore desired.
High
Partnership
Community Collaboration
Medium
Low
Provides relatively direct services using a group meet up or drop off location Similar to regular automobile travel but variable reliability
Pick up and drop off locations are only at standard stops or locations Significantly slower than regular automobile travel
Provide flexible service hours
Provide service at more limited times
Services are highly visible to potential users, can be made with little instruction, and through a variety of means
Services are generally visible to potential users, may require some searching, and through a variety of means
Services are not visible and service requests are made through less than three potential methods or require access to cell phones or smart phones and broadband access only
Cost sharing is available and directly benefits employers
Cost sharing is available but has not led to more cost sharing opportunities with private industry
Cost sharing is limited and more costly to support service
Specifically targets user cohorts
Does not target cohorts, but could foster a community of users
Does not promote interactions of users with similar training and employment travel needs
RURAL WORKFORCE TRANSPORTATION STUDY â&#x20AC;&#x201C; EXECUTIVE SUMMARY March 2020
PAGE 6
TRANSPORTATION STRATEGIES DEVELOPMENT AND EVALUATION
RECOMMENDATIONS Consensus was reached with stakeholders that moving forward with a carpool and vanpool-oriented strategy would best meet rural workforce training and job transportation needs. Stakeholders suggested that this option provided not only more flexible and reliable services but had the potential to incorporate employers to support these transportation strategies and could help to establish the types of “cohort” models desired to bring a sense of community to rural workers seeking transportation options to meet training, education, and job placement needs. There was a desire to focus on geographic and industry-specific pilot programs to better facilitate the enhanced coordination that would be needed between BCDCOG, employers, education and training coordinators, and economic and employment partners. When asked about which industries to focus on, there was consensus that focusing on manufacturing, healthcare, and/or technology/IT industries would best align with regional forecasts for growth and needs for further skills training opportunities. Two options for vanpools or carpools were further considered and evaluated with stakeholder input through this study: a BCDCOG-operated vanpool service or a privately contracted vanpool or carpool service managed through BCDCOG. An agency operated and maintained vanpool would function like other public transportation services in the region, and BCDCOG would be responsible for acquisition of new van fleets to provide the service and maintenance of vehicles. The agency would subsidize fuel, insurance, and maintenance. Drivers could be provided by BCDCOG at additional costs for drivers or drivers could consist of volunteers to lead vanpools, if they have a valid drivers’ license and meet any other requirements established by the agency to provide safe and effective services. A second option would use a contracted provider to provide vehicles on a monthly fee basis. Drivers would be users of the service, with valid drivers’ licenses and who meet any other requirements established by BCDCOG and the operator. Additional costs to provide fuel and maintenance reimbursement and for insurance coverage would be needed to subsidize full costs of the service. While still heavily subsidized by BCDCOG, the agency benefits from not needing to purchase additional fleet and more expensive costs for staff to maintain fleets. Based on national experience, vans purchased by a transit agency range from $35,000 to $60,000 depending on vehicle size, make and model. Stakeholders did not indicate a preference on the proposed operational structure of a carpool or vanpool service. Each of these types of services have been employed successfully in a variety of places across the nation. Some of the most successful vanpools in the nation, like those that operate in suburban areas outside of Seattle, Washington and Chicago, Illinois have tended to be agency-operated services. These service models allow the agency to work more closely with elected officials, other agencies and the community to tailor and customize solutions and monitor service performance more closely than privately operated models allow. Federal subsidies and grants can help to support services like these relatively easily. Disadvantages are that the agency assumes all costs and risks of the service and staff resources must be dedicated to coordinating services on a day to day basis. Privately operated options are also prevalent across the nation. Services such as these have been initiated in several places across the nation, including in rural areas of North Carolina (GoTriangle), Pennsylvania, and New Jersey. These outsourced services mean that the agency does not have to maintain and directly coordinate services, leading to a more administrative role in coordinating the vanpool program. The agency still typically addresses costs for liability and insurance and coordinates all contracts. Vanpool fleets can also RURAL WORKFORCE TRANSPORTATION STUDY – EXECUTIVE SUMMARY March 2020
PAGE 7
TRANSPORTATION STRATEGIES DEVELOPMENT AND EVALUATION
be changeable and more flexible in that users can pick a van or car size that is appropriate to the number of users of the vanpool. This model still requires regular day to day BCDCOG support to help coordinate the service, work with the vendor, and to support the successful implementation of the program. Establishing websites, call centers, and other mobile applications to match riders with available services would still need to be coordinated through the agency. Capital costs and operations and maintenance costs would have different implications for each of these options. Capital costs per vehicle for purchased vehicles can range from $35,000 to $65,000 based on national averages and procurement of vehicles by an agency generally takes between 12 and 18 months. Purchasing vehicles is costly and contains several risks for implementation of a new service like this. Each new vehicle procured represents not only an investment of capital outlay, it includes greater operational and maintenance costs associated with maintaining this asset. Operations and maintenance costs to an agency are ongoing and funding assistance at a federal level for operations and maintenance are more limited than assistance for onetime capital purchases. Other supportive strategies included:
Technology Integration and Expansion; Leveraging Partnerships through Subsidies and Incentives; and Enhancing Communication, Coordination, and Outreach.
RURAL WORKFORCE TRANSPORTATION STUDY – EXECUTIVE SUMMARY March 2020
PAGE 8
IMPLEMENTATION, COSTS, AND FUNDING CONSIDERATIONS Based on the evaluation of potential strategies, stakeholder input, and additional considerations on how to operate a new vanpool or carpool program, the preferred strategy to move forward is a new vanpool or carpool service, either by BCDCOG purchasing vehicles or through use of a private company to provide vehicles. High level planning costs for implementation and potential funding opportunities are also provided.
INCREMENTAL IMPLEMENTATION OF THE REGIONAL STRATEGY A total of 14 potential service areas from each of the four rural areas to these major employment or training locations have been identified as part of this study: four in Berkeley County, three in western Charleston County, three in eastern Charleston County, and four in Dorchester County. A variety of vanpool or carpools are possible and would focus on linking potential users to manufacturing, health care, and/or training and educational centers. Employment hubs identified included manufacturing concentrated employment along Palmetto Commerce Parkway, concentrations of healthcare providers and employment along US 17 and near North Charleston, and different training and educational centers located near each rural area as well as near these manufacturing and healthcare hubs. These are not all—inclusive of potential carpool or vanpool services that could be offered throughout the region but represent a starting place for more detailed discussions with specific employers and training or education centers to implement and identify demands for service. Establishing a demonstration pilot vanpool is recommended first to fully develop the vanpool program and needs, and then services could be expanded to serve all regions.
Demonstration of a pilot vanpool or carpool program could be established in each of the four rural service areas defined in this study and focus on further coordination and partnerships with a specific industry cluster, such as manufacturing along Palmetto Commerce Parkway or Healthcare Providers along US 17 and in North Charleston.
Alternatively, a pilot vanpool or carpool could be established in each of the rural service areas and focus on coordination with a specific employer. Volvo was identified as a nearby manufacturing employment location, for instance, in Berkeley and Dorchester counties, and is an employer that is expected to increase its needs for workers in the near-term as they expand the Volvo Berkeley County plant location. Implementation first in Berkeley and Dorchester Counties, where distances are shortest between rural areas and this employment location could be prioritized.
Demonstration of a pilot program vanpool or carpool could focus on one of the rural service areas defined (Berkeley, western Charleston, eastern Charleston, or Dorchester County) and implementation could include work with one or more the concentrated manufacturing and healthcare hubs along Palmetto Commerce Parkway or along US 17 and in North Charleston, respectively.
RURAL WORKFORCE TRANSPORTATION STUDY – EXECUTIVE SUMMARY March 2020
PAGE 9
IMPLEMENTATION, COSTS, AND FUNDING CONSIDERATIONS
PLANNING LEVEL COSTS Several costs can be anticipated depending on the level of investment and implementation of a demonstration pilot program and some of these high-level costs are identified below. While this may not be all-inclusive of cost items for specific demonstration pilot programs, these are the most important cost considerations in developing a successful program. SUMMARY OF ANTICIPATED COSTS This cost estimate provides a high-level assumption for costs of implementing services and will need to be refined as part of the implementation program. Costs have been assumed at varying levels of investment, including leasing and implementation of four, eight, or 12 vehicles. A minimum of four vehicles, which could be combination of six- to 12-passenger vehicles, is assumed based on the four major rural service areas defined in this study. CAPITAL COSTS For the purposes of establishing comparative costs, capital costs are assumed to include costs for purchasing or leasing vans/cars and initiating ride matching software costs. Some maintenance costs are embedded into the costs for leasing vehicles since leased vehicles would be replaced with other available rental vehicles if found to have deficiencies, such as when brakes are worn or age. Annual operating costs for ride matching software subscription services are included in annual operating cost assumptions and would be the same for either the purchase or lease vanpool options. These costs do not estimate how much of the actual costs for vehicles could be subsidized by employer benefit programs. While local governments and agencies may have to initially pay for these costs, the longer-term goal of these services should be to be self-sustaining with private employers helping to pay some portion of these costs incurred for providing the service and enhancing contributions over time as demands for service can be demonstrated to specific employers. Capital costs for purchasing vans are assumed at $51,000 per vehicle based on national and local experience and can vary by make, model, and year purchased. Vehicle life is assumed as eight years for purchased vans or minivans based on FTA useful life benchmarks for this vehicle type. The typical cost of leasing a van, not including fuel or maintenance costs, can range between $1,200 and $1,500 per month per vehicle to accommodate fleets holding between 7 and 15 passengers and is shared between users of the system and through the level of agency-desired subsidy to riders. An average of the anticipated range of costs associated with leasing ($1,300 per vehicle per month) are assumed for high level cost estimating purposes. For ride matching software, an initial cost of $30,000 is assumed based on BCDCOG experience with recent vendors in the region.
RURAL WORKFORCE TRANSPORTATION STUDY â&#x20AC;&#x201C; EXECUTIVE SUMMARY March 2020
PAGE 10
IMPLEMENTATION, COSTS, AND FUNDING CONSIDERATIONS
Annual Capital Costs Assumptions (For 4, 8, or 12 Vehicle Implementation) Four Vanpools
Vehicle Fleet Costs*
Vehicle Purchase Cost Leasing Vehicle Cost
Ride Matching Software GRAND TOTAL:
Purchase Option Lease Option
Eight Vanpools
Twelve Vanpools
$204,000.00
$408,000.00
$612,000.00
$62,400.00 $30,000.00
$124,800.00 $30,000.00
$187,200.00 $30,000.00
$234,000.00
$438,000.00
$642,000.00
$92,400.00
$154,800.00
$217,200.00
*Vehicle purchasing and leasing options differ in how capital costs are incurred. While purchasing vehicles requires up-front capital investment reflected here, van life extends up to 8 years. As such, while vehicle leasing costs may appear less expensive, when considered across an eight-year life cycle, they are approximately 2.5 times more expensive than purchase costs. At the same time, some larger vehicle maintenance or replacement costs are embedded in leasing prices, so if a vehicle is no longer in good condition, it is replaced for users without additional capital or maintenance cost to the agency.
If desired, park and rides would increase capital costs. Interim and low-cost solutions, such as working with and using church, or other community organization sites, are possible and further discussed in the report. OPERATIONAL COSTS Operational costs differ between purchase and leasing options. This estimate provides examples of costs associated with initial implementation of either 4, 8, or 12 vanpools for comparative purposes and to provide further insight on how the number of vans may impact operational costs over time. As can be seen, as more vehicles are operated, certain costs, such as operational and maintenance costs, emergency ride home payments, and insurance, increase. This underscores the need for developing cost sharing opportunities with employers and enhancing contributions over time to create self-sustaining services. Purchase Option: Annual Operating Cost Assumptions (For 4, 8, or 12 Vehicle Implementation)
Operations Costs (Agency) Fuel, Maintenance Costs Rideshare Software Subscription Fees Staff Support Office Equipment, Printing, Supplies Emergency Ride Home Claims/Payments Marketing Budget Additional Insurance Costs Planning Level Contingency (5% of total costs) GRAND TOTAL:
Four Vanpools $55,522.00 $15,040.00 $30,000.00 $65,000.00 $3,000.00 $2,400.00 $50,000.00 $20,800.00 $12,088.10 $253,850.10
RURAL WORKFORCE TRANSPORTATION STUDY â&#x20AC;&#x201C; EXECUTIVE SUMMARY March 2020
Eight Vanpools $111,045.00 $30,080.00 $30,000.00 $65,000.00 $3,000.00 $4,800.00 $50,000.00 $41,600.00 $16,776.25 $352,301.25
Twelve Vanpools $166,567.00 $45,120.00 $30,000.00 $65,000.00 $3,000.00 $7,200.00 $50,000.00 $62,400.00 $21,464.35 $450,751.35
PAGE 11
IMPLEMENTATION, COSTS, AND FUNDING CONSIDERATIONS
Lease Option: Annual Operating Cost Assumptions (For 4, 8, or 12 Vehicle Implementation) Fuel, Maintenance Costs Rideshare Software Subscription Fees Staff Support Office Equipment, Printing, Supplies Emergency Ride Home Claims/Payments Marketing Budget Additional Insurance Costs Planning Level Contingency (5% of total costs) GRAND TOTAL:
Four Vanpools $15,040.00 $30,000.00 $65,000.00 $3,000 $2,400.00 $50,000.00 $20,800.00 $8,272.00 $194,512.00
Eight Vanpools $30,080.00 $30,000.00 $65,000.00 $3,000 $4,800.00 $50,000.00 $41,600.00 $9,144.00 $233,624.00
Twelve Vanpools $45,120.00 $30,000.00 $65,000.00 $3,000 $7,200.00 $50,000.00 $62,400.00 $10,016.00 $272,736.00
While there are high-level cost comparisons possible between purchase and leasing options when capital and operational costs are combined and calculated. Funding availability and resources for both capital and operating expenses can differ between purchasing and leasing options and funding resources available. Addiitonally, the level of subsidy provided to users to off-set costs for either option varies over time and may influence cost comparison between options. The goal of successful carpool or vanpool services in the region should be that they are self-sustaining and pay for themselves over time. While this is a long-term goal, monitoring ridership and subsidies and incentives against the costs to provide and manage service operations is important to ongoing monitoring of a cost-effective system.
FUNDING CONSIDERATIONS In services such as these, local governments and transportation agencies can help to subsidize costs, including liability and insurance coverage and to supplement costs to users. At initial stages of development and implementation of a pilot demonstration project and as costs for the service are more accurately forecasted, coordination with specific employers and training/education centers should be undertaken to identify the level of subsidy that will be available. There are also potential state and federal funding and grant opportunities as well as other unique funding sources that could be used to help support start-up and implementation of a vanpool demonstration pilot program or programs. There are also additional non-profit sources of grant funding, which could also be leveraged to fund potential pilot projects.
RURAL WORKFORCE TRANSPORTATION STUDY â&#x20AC;&#x201C; EXECUTIVE SUMMARY March 2020
PAGE 12
IMPLEMENTATION, COSTS, AND FUNDING CONSIDERATIONS
POTENTIAL FUNDING SOURCES AND USES Below is a sample of potential funding sources along with their potential eligible uses. Type
Source
Employee/Employer
Pre-tax commuter benefit
County Government (Berkeley, Charleston, Dorchester Counties)
Local Option Sales Tax
Federal Transit Administration (FTA)
US Department of Commerce, Economic Development Administration (EDA) US Department of Transportation SC Department of Commerce, Community Development Block Grant Program (CDBG)
Integrated Mobility Innovation Access and Mobility Partnership 2017 Disaster Recovery Funds Opportunity Zones BUILD/TIGER Grant Community Infrastructure Grant Community Enrichment Grant Special Projects Program Bank of America Foundation AWS Foundation â&#x20AC;&#x201C; Welder Workforce Grants
Non-Profit Grants
Use Pre-tax deduction for employee/ FICA Tax reduction for employer Tax revenue to fund potential program costs Ride matching software, ridesharing software enhancements (Lowcountry Go) Mobility services for disadvantaged populations Infrastructure to provide jobs and skills training Tax incentives to recruit private investment into pilot projects Facilities, capital costs, vehicles, park and ride lots Central Passenger Structures Workforce Development Services Community Development Projects LMI economic mobility Training center enhancements
Walmart Foundation
Quality of life programs for work dignity
Coastal Community Foundation (CCF) or United Way
Provide access to economic opportunity
Volvo Car USA Community Investment Grant
Projects addressing safety, quality, education, and environment
RURAL WORKFORCE TRANSPORTATION STUDY â&#x20AC;&#x201C; EXECUTIVE SUMMARY March 2020
Amount $265/month max Not to exceed 1 percent $15 million available in 2019
$587 Million available to eligible grantees
$25 million maximum award $50,000-$750,000 $50,000- $500,000 $50,000-$150,000
Up to $25,000
Up to $25,000
PAGE 13
CONCLUSIONS AND NEXT STEPS Implementing a new carpool/vanpool program from the ground-up will require significant effort and buy-in from industry and other agency partners to be successful. A summary of key next steps that will help establish the foundation for the program and help to build the program in targeted ways are provided below. Continual monitoring of the program to help build an ultimately self-sustaining program will be necessary throughout the process.
KEY STEPS AND MILESTONES It is anticipated that additional planning required to fully develop a specific demonstration program will take approximately 12 to 18 months. The timeline will depend on the demonstration program selected and can vary depending on the level of implementation desired. Understanding key steps and milestones can help to further define planning needs for implementation. These steps, key milestones, and anticipated duration or schedule are shown graphically on the figure below. Generalized Schedule and Key Milestones for Demonstration Program Implementation
Foundational (Months 1-8)
Define Scope of Program and Partners •Service area definition and outreach to employers and potential users/agency partners •Work with vendors on refined technology needs and service costs and apply for funding •Establish working group(s), for the demonstration program and regional implementation •Develop educational campaign plan and materials
Building the Demonstration Program (Months 9-16)
Further Develop Program and Outreach Plan
Implementing Demonstration Program (Months 16-18)
Execute Pilot Demonstration Program
Implementation and Monitoring (Ongoing)
Capture Lessons Learned and Leverage Next Steps
•Develop and coordinate service operational Details and rideshare matching software functionality •Interagency data coordination to understand meet up location or park and ride needs •Targeted marketing and outreach program developed for demonstration project
•Define performance measures and data needs •Outreach and marketing efforts implemented •Pilot demonstration program implementation •Further technology integration, as appropriate
•Lessons Learned and changes to services identified •Ongoing performance monitoring and data collection, projections of costs for enhancing services, and benchmarking of cost sharing enhancement arrangements desired
RURAL WORKFORCE TRANSPORTATION STUDY – EXECUTIVE SUMMARY March 2020
PAGE 14