5 minute read
4. Methodology


Each scenario analysis consists of three steps: (1) overall renewable hydrogen potentials are calculated for each country (based on renewable, freshwater, and land availability; infrastructure potential; and competing demand for renewable electricity); (2) each country’s production cost curves are computed (based on local renewable electricity and electrolyzers costs); and (3) renewable hydrogen trades are optimized to evaluate overall supply costs and investment requirements.
4.1. Resource Potential Assessment
Following the methodology developed by Pflugmann and De Blasio (2020),46 the first step assesses whether renewable hydrogen production potentials for the scenario countries could meet overall EU demand. The analysis considers available renewable energy and freshwater resources, infrastructure potential, and competing demand for renewable electricity.
Available renewable energy resources in each country are calculated based on peer-reviewed databases of renewable electricity potentials.47,48 Land availability for renewables is derived by deducting protected natural areas and built urban environments for overall surface area. In addition, remote and uneconomic resources are excluded, which aligns with recent literature (See Appendix - Table 5).49 The equivalent of each country’s current primary energy consumption is assumed to be used in other sectors or remain underdeveloped to account for competing renewable electricity demand.50 The resulting renewable energy potentials are then utilized to calculate renewable hydrogen production potentials—assuming an electrolysis efficiency of 74%, as projected by the International Energy Agency (IEA).51
46 Pflugmann and De Blasio (2020) Geopolitical and Market Implications of Renewable Hydrogen.
47 Eurek et al. (2017) “An Improved Global Wind Resource Estimate for Integrated Assessment Models,” Energy Economics, 64(February), pp. 552–567. https://doi.org/10.1016/j.eneco.2016.11.015
48 Pietzcker et al. (2014) “Using the Sun to Decarbonize the Power Sector: The Economic Potential of Photovoltaics and Concentrating Solar Power,” Applied Energy, 135(December), pp. 704-720. https://doi. org/10.1016/j.apenergy.2014.08.011
49 Kakoulaki et al. (2021).
50 Primary energy data from BP (2020) “Statistical Review of World Energy,” accessed 1 December 2020. https://www.bp.com/en/global/corporate/energy-economics/statistical-review-of-world-energy.html
51 IEA (2019) The Future of Hydrogen.
Two factors could further constrain a country’s renewable hydrogen potential: freshwater resources and infrastructure availability. Assuming that 9 kg of water is needed per kg of hydrogen produced,52 water availability is limited to 5% of each country’s internal renewable freshwater resources. For reference, the average water withdrawal for industrial use worldwide equals to 13%.53
Finally, since no country today has hydrogen infrastructure deployed at scale, in order to assess a country’s ability to build and operate future hydrogen production, transportation, and distribution infrastructure, we must rely on the status of its existing infrastructure. Thus our proxy is the overall infrastructure score in the World Economic Forum’s 2019 Global Competitiveness Index.54 Countries with scores below 4 (on a 1-7 scale) are classified as infrastructure constrained.55
See Section 5 for a detailed analysis.
52 Water consumption based on the chemical reaction in the electrolyzer.
53 United Nations Food and Agriculture Organization (UN FAO) (2020) AQUASTAT Core Database, Food and Agriculture Organization of the United Nations, accessed 1 December 2020. http://www.fao.org/aquastat/en/ databases/maindatabase/
54 World Economic Forum (WEF) (2019) World Economic Forum’s 2019 Global Competitiveness Report.
55 Bulgaria and Romania were not excluded from the analysis because access to European support mechanisms could facilitate the development of hydrogen infrastructure in these EU countries.
4.2. Production Cost-Competitiveness Analysis
The second step requires calculating hydrogen production costs for every country and evaluating the cost competitiveness of each reference scenario.
Production costs are computed as the levelized cost of hydrogen (LCOH) over the lifetime of electrolysis plants.56 Economic and financial parameters, including a discount rate of 8%, are based on long-term technology cost projections by the IEA and the International Renewable Energy Agency (IRENA) (see Table 3).57 Production costs for all renewable energy resources are then compiled into cost curves.
Table 3. Economic parameters for estimating renewable hydrogen production costs
Parameter Units PV Onshore wind Offshore wind Electrolyzer
Investment costs (CAPEX) [USD/kW] 407 1,273 1,720 450
Operation and maintenance costs (OPEX) Lifetime
[% CAPEX per year] 2.5% 2.9% 2.5% 1.5%
[years] 25 25 25 20
Electrical efficiency [%]* - - - 74%
*Based on hydrogen’s lower heating value (LHV).
See Section 6 for cost-competitiveness evaluations for each scenario.
56 See 10.2 in the Appendix.
57 See 10.1 in the Appendix.
4.3. Hydrogen Trade Optimization
The methodology’s third step consists of a hydrogen trade optimization to evaluate overall supply costs and investment requirements for each reference scenario.
To this end, we developed MIGHTY (Model for International Green Hydrogen Trade), which optimizes renewable hydrogen trades between countries by minimizing supply costs—defined as the sum of production and transportation costs.58
From an infrastructure perspective, hydrogen’s low volumetric energy density and liquefaction temperatures of around -253°C (-423°F) make transportation a key variable. To address this, MIGHTY considers three different alternatives:
1. Hydrogen Gas Pipelines, in which hydrogen is dispatched as a compressed gas.
2. Liquefied Hydrogen Shipping, in which hydrogen is liquefied at export terminals, shipped, and finally regasified at import terminals.
3. Ammonia Shipping, in which hydrogen is used to produce ammonia, which is shipped and then converted back into hydrogen at the destination.
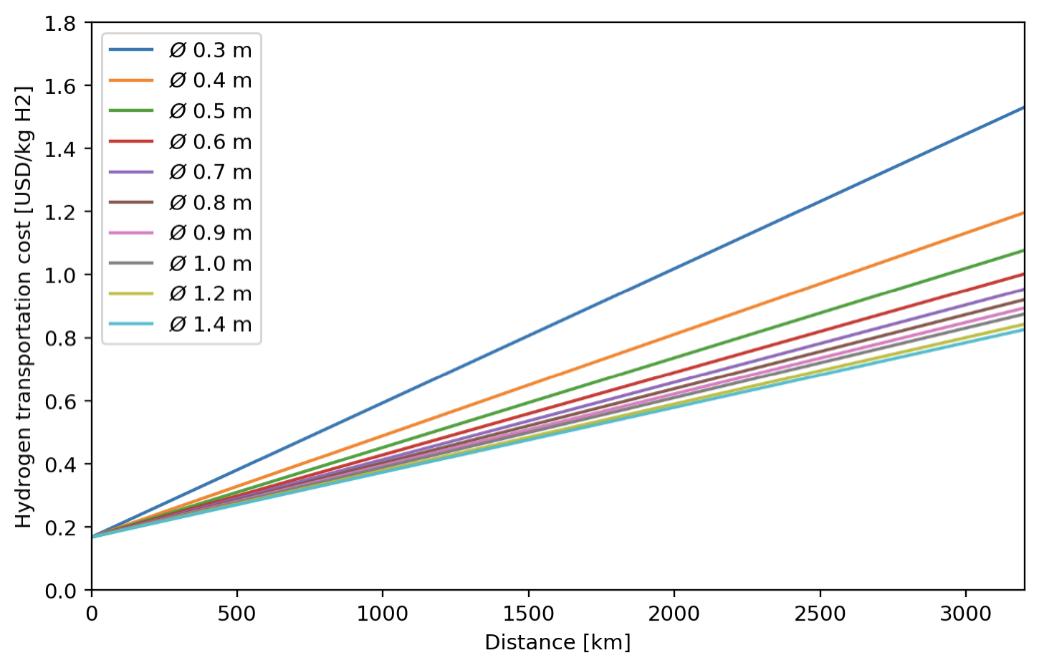
All continental member states are assumed to deliver hydrogen by pipeline instead of shipping because costs are lower for distances under 1,000 to 2,000 km (see Figures 4 and 5). In contrast, North African countries, island states, and long-distance partners are assumed to ship either hydrogen or ammonia to the EU.59
Ammonia, which contains 17.65% hydrogen by weight, is a staple in the energy sector and is mainly used to produce fertilizers and other chemicals. Ammonia is considered an alternative to liquefied hydrogen transportation thanks to its higher volumetric energy density and easier
58 See 10.3 in the Appendix for a model overview.
59 See 10.4 in the Appendix.
liquefaction at -33°C (-28°F), resulting in lower transportation costs (see Figure 5). Furthermore, it can leverage existing technologies and infrastructure.60
Economic parameters for transportation costs assume the deployment of new infrastructure and are in line with the IEA and recent literature.61
MIGHTY was explicitly designed to provide more precise evaluations of transportation costs than other mathematical models, thanks to two key features. First, enabling infrastructure needs are calculated as a function of traded volumes and distances, which significantly impact overall costs both for pipelines and ships (see Figures 4 and 5). Second, minimum volume considerations prevent mathematically correct but uneconomical routes from being part of the model’s solution.62
Figure 4. Hydrogen transportation costs by pipeline Source: Authors’ analysis
60 Global ammonia trade, including transoceanic routes, is expected to have reached 19 Mt/yr in 2021 according to Argus Media (2021).
61 See 10.1 in the Appendix. 62 Minimum trade flows set at 100 kt/yr for long-distance importers, 10 kt/yr for regional importers, and 1 kt/yr for internal EU trade.
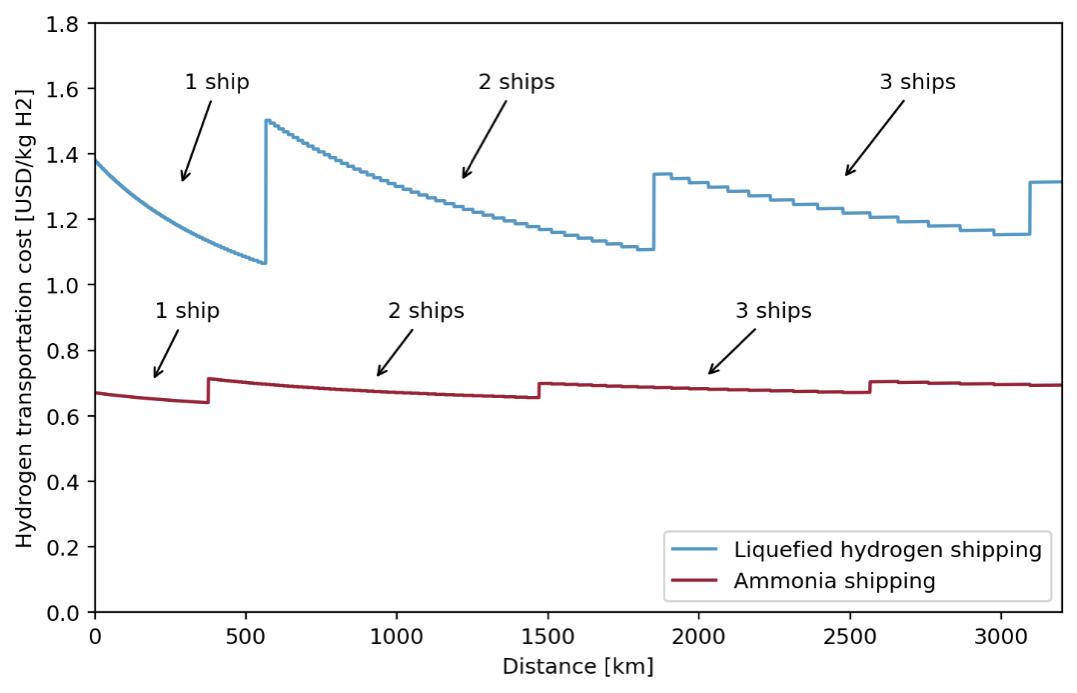
Figure 5. Hydrogen transportation costs by ship Source: Authors’ analysis for shipping 1 Mt/yr from North Africa to the EU
See Section 7 for the analysis of hydrogen trade in each reference scenario.


