53 minute read
6. Renewable Hydrogen Cost Curves


6. Renewable Hydrogen
Cost Curves
In this section, we analyze renewable hydrogen cost curves to assess the relative competitiveness of the three reference scenarios.
In general, cost curves are graphs of production costs as a function of total quantities produced. In free-market economies, stakeholders optimize production by minimizing costs associated with each level of production.
In order to highlight key cost-competitiveness factors between reference scenarios, production costs in each curve are also represented as a function of renewable electricity, electrolysis, and operating costs.
6.1. Cost Curves in the Hydrogen
Independence Scenario
EU renewable hydrogen cost curves elucidate the competitiveness of both the Hydrogen Independence scenario and overall EU hydrogen production in the scenarios that include imports. Depending on how much hydrogen can be produced internally at a competitive price, EU production will supply a larger or smaller share of total demand compared to imports.
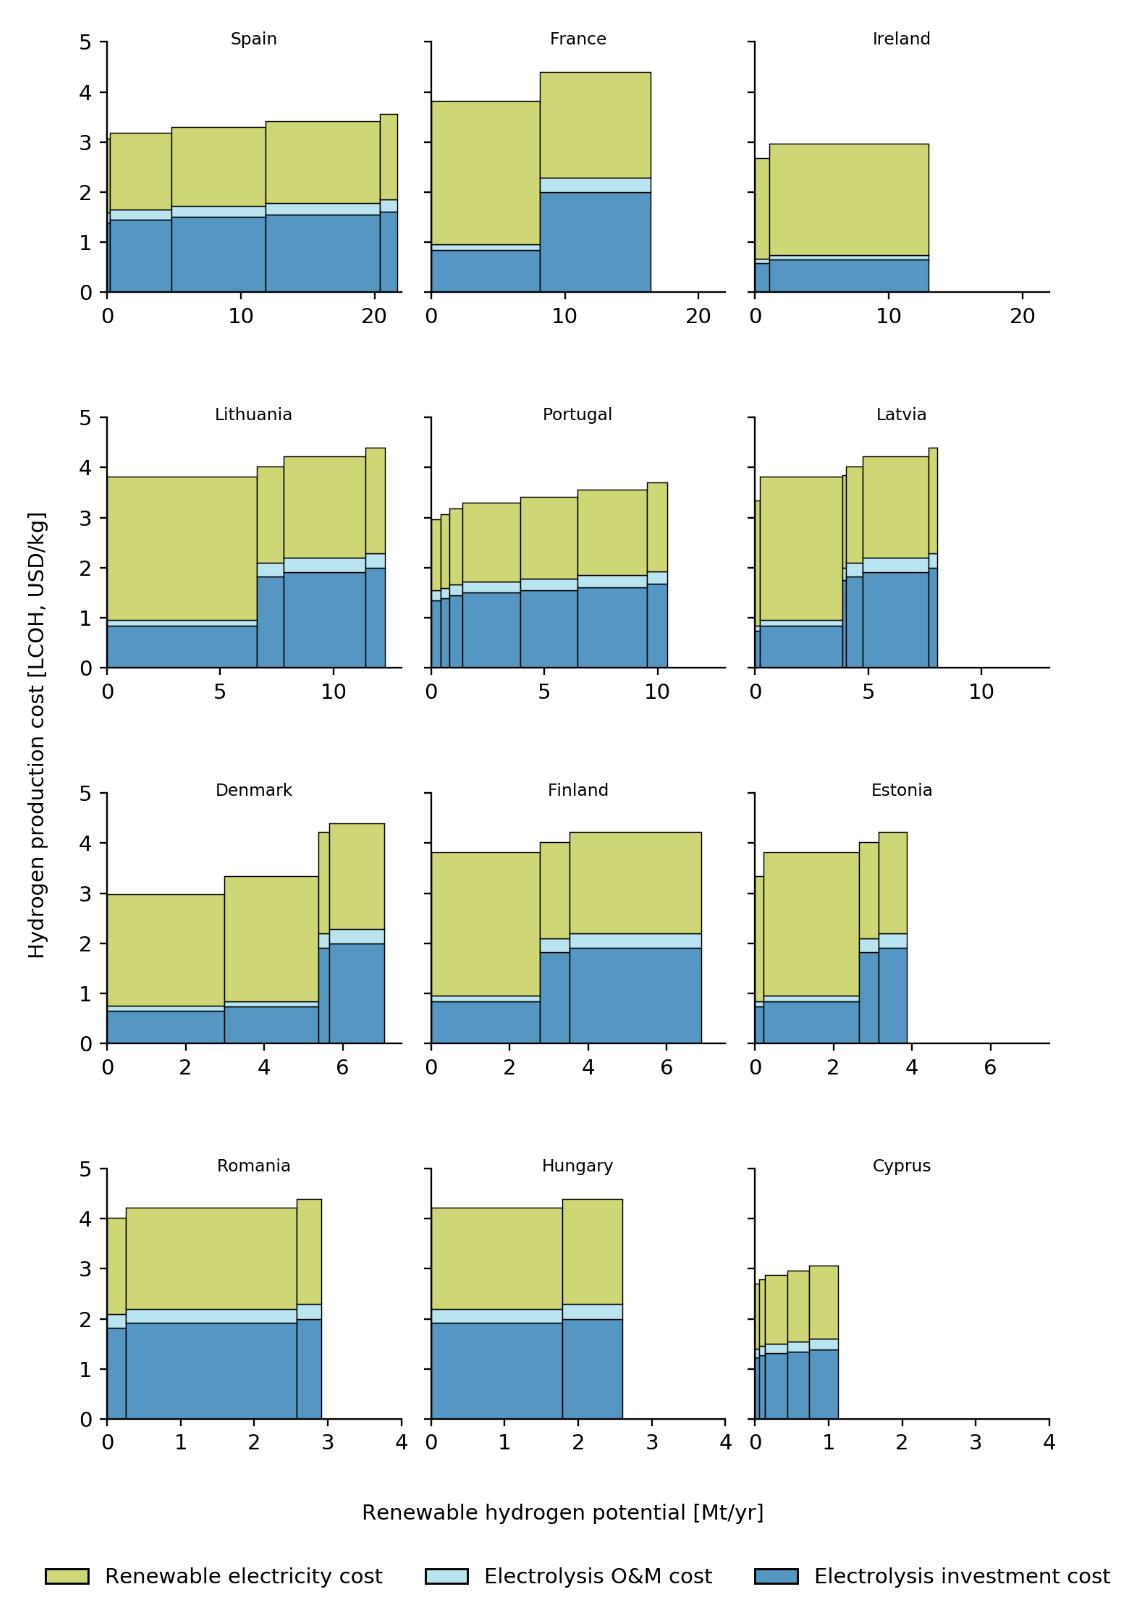
Renewable hydrogen cost curves for the member states that have the potential to become regional exporters67 show significant differences in production costs between EU countries (see Figure 8), ranging from 2.7 to 4.4 USD/kg. Ireland, Cyprus, and Portugal have the most competitive potentials with production costs below 3 USD/kg thanks to wind energy resources with high capacity factors.68 On the other hand, Romania and Hungary have the least competitive potentials due to solar energy with low capacity factors that lead to production costs of over 4 USD/kg.
67 Member states in which production potential exceeds projected internal demand of hydrogen.
68 Wind power typically allows for higher electrolyzer loads thanks to its higher capacity factors. As reported by the International Renewable Energy Agency (IRENA) (2021) Renewable Power Generation Costs in 2020, onshore wind has an average capacity factor of 36%, compared to only 16% for solar. Thus, renewable hydrogen potentials tied to wind energy yield lower electrolysis costs.
Figure 8. Renewable hydrogen cost curves in selected EU countries Source: Authors’ analysis
Low and flat renewable hydrogen cost curves highlight how countries can remain cost-competitive as they ramp up overall production. For example, Ireland and Spain could produce nearly 13 and 22 Mt/yr with costs between 2.7-3.0 USD/kg and 3.1-3.6 USD/kg respectively. In contrast, countries with steep cost curves like Denmark will experience rising costs as they scale up production. For example, growing Danish renewable
hydrogen production from 2 to 6 Mt/yr would increase costs from 3.0 to 4.3 USD/kg. In other words, countries with low and flat cost curves like Ireland and Spain would be able to develop their full production potentials with competitive pricing. In contrast, those with steep curves might be able to leverage only a fraction of their production potential before costs become uncompetitive compared to production costs in other countries.
The different production cost-competitiveness among member states highlights how an efficient market design and trade could significantly reduce supply costs. Ideally, the lowest-cost hydrogen could be made available to countries that would otherwise need to develop uncompetitive internal resources. While this consideration is valid for all reference scenarios, it is particularly relevant for the Hydrogen Independence scenario, as Figure 9 elucidates.
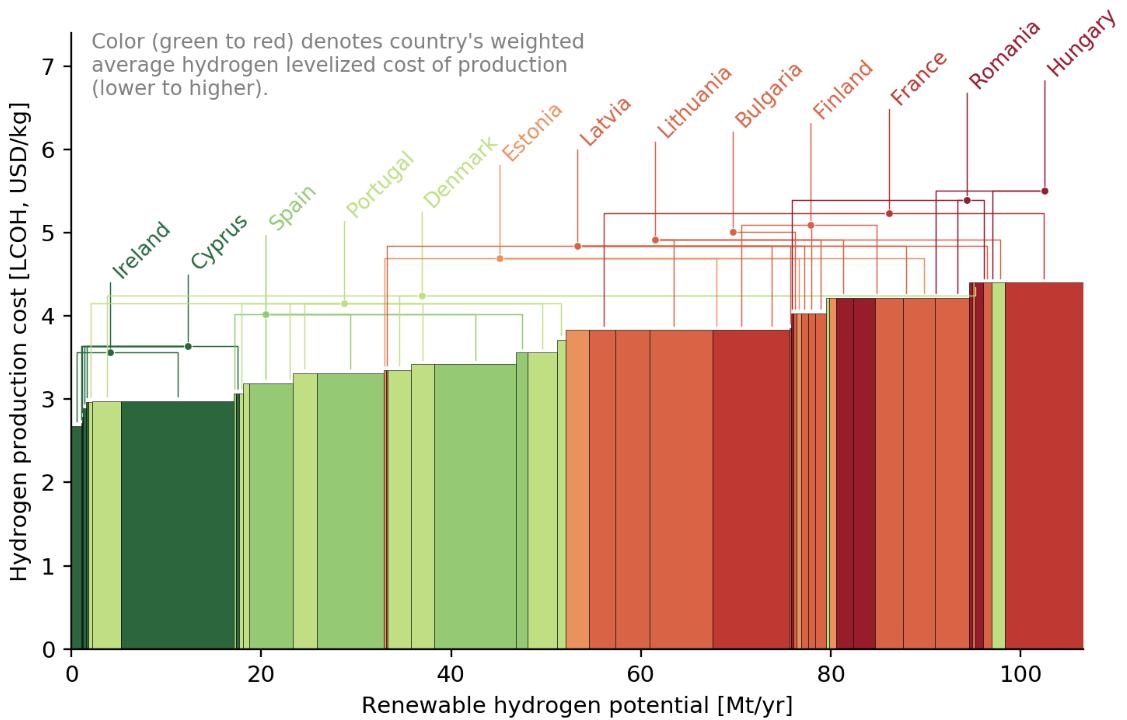
Figure 9. EU-wide renewable hydrogen cost curve Source: Authors’ analysis
Without fully integrated markets, countries like Romania and Hungary would have to meet demand with internal production costs of above 4 USD/kg instead of being able to leverage EU average costs of 3.5 USD/kg.69
69 Minimum weighted average production cost. Transportation costs excluded.
The creation of efficient EU hydrogen markets will also require the deployment of a fully integrated infrastructure across the continent - with corresponding transportation costs (see Section 7). Hence there will be a breakeven point at which local resources, even if costlier to produce, become more attractive than imports from other member states, thanks to their proximity to demand. In this way, the extent to which trades between member states could enhance the competitiveness of the Hydrogen Independence scenario will be a function not only of production costs but also of transportation costs.
Overall, the Hydrogen Independence scenario prioritizes energy independence considerations at the expense of higher supply costs, as discussed in the following sections.
6.2. Cost Curves in the Regional and Long-Distance Reference Scenarios
In line with the Hydrogen Independence scenario, cost curves for regional and long-distance partners reveal a wide range of production costs (see Figure 10)—from 2.5 to 4.4 USD/kg, but with much larger production potentials at costs below 3 USD/kg. Only Australia has a significant share of its overall potential (13%) above 4 USD/kg. Despite similar production cost ranges, regional and long-distance partners have significantly larger competitive renewable hydrogen potentials than EU countries.
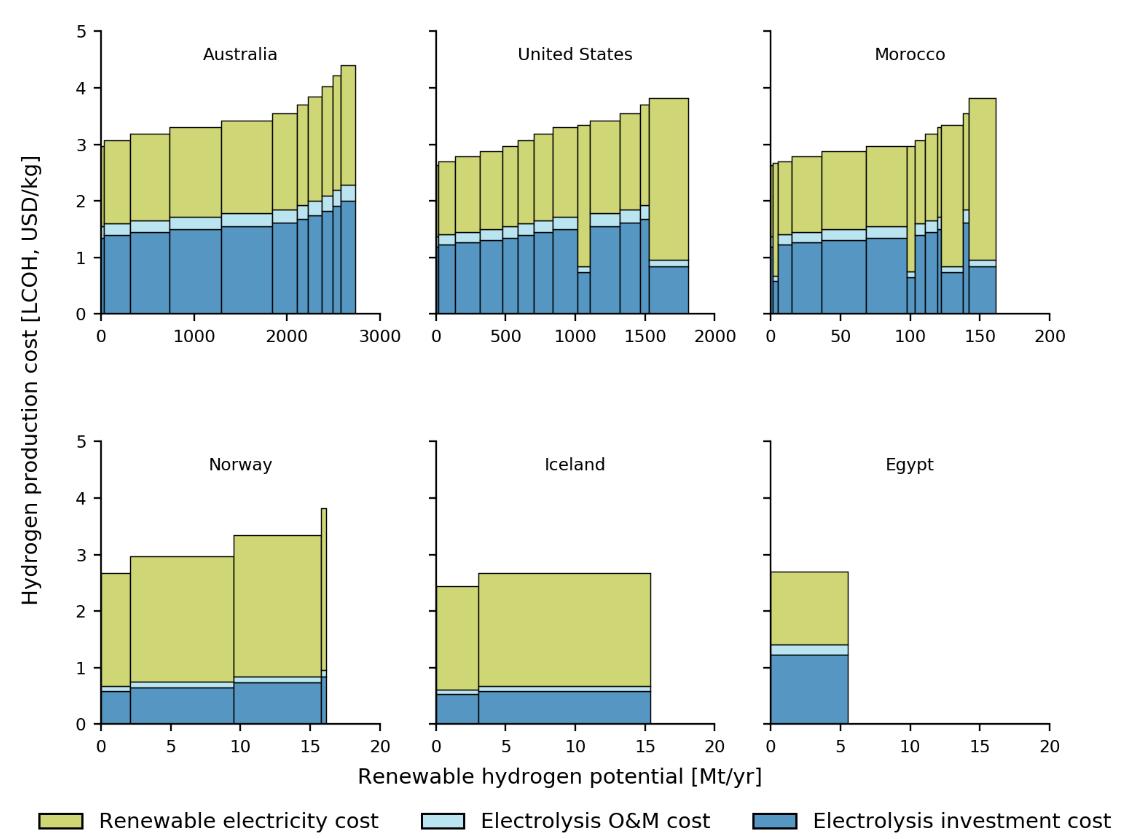
Figure 10. Renewable hydrogen cost curves in regional and long-distance partners Source: Authors’ analysis
Morocco, for example, could ramp up production up to 68 Mt/yr at costs below 3 USD/kg. On the other hand, countries with steeper cost curves, which theoretically could limit their ability to produce cost-competitively, have such large production potentials that they will still be able to supply significant amounts of renewable hydrogen at lower costs. For example, the United States could scale up production to over 587 Mt/yr with costs below 3 USD/kg despite a steeper curve than Egypt, which could only supply around 5 Mt/yr.70
Export champions like the United States and Morocco can also count on diversified renewable energy sources, making them more resilient to disruptions. However, countries with smaller potentials tend to rely on a single renewable energy source: wind in Norway and Iceland, solar in Egypt.71
70 Egypt’s renewable hydrogen potential is severely limited by the availability of internal renewable freshwater resources—around 5.6 Mt/yr.
71 Production costs of renewable hydrogen from wind energy are characterized by a higher share of renewable electricity costs and a lower share of electrolyzer investment costs due to higher investment cost and capacity factors of wind farms than solar PV plants.
Overall, renewable hydrogen imports could meet demand at lower production costs than internal EU production alone. Regional partners could meet EU demand at an average cost of 2.8 USD/kg and long-distance partners at 2.7 USD/kg.72 However, transportation costs for shipping hydrogen to the EU over long distances will be high (see Section 7).
In summary, the Regional and Long-Distance scenarios are more competitive than the Hydrogen Independence scenario, thanks to lower production costs even when taking into consideration higher transportation costs, as discussed in the following section.
72 Minimum weighted average production cost. Transportation costs excluded.
7. Renewable Hydrogen Markets
This section assesses future hydrogen markets based on supply costs (production plus transportation costs), trade flows, and investment needs for each reference scenario.
The MIGHTY model considers future EU demand, renewable hydrogen potential, cost curves, and transportation costs to optimize hydrogen trades between countries in each scenario. As discussed, hydrogen’s preferred transportation option is still unclear. Hence, the model considers two transportation alternatives for each of the reference scenarios (Hydrogen Independence [HI], Regional Imports [RI], and Long-Distance Imports [LDI]) (see Table 4):
1. Hydrogen gas pipelines plus liquefied hydrogen shipping (LH2).
Hydrogen is dispatched as a compressed gas between continental countries and as liquefied hydrogen by sea.
2. Hydrogen gas pipelines plus ammonia shipping (NH3).
Hydrogen is dispatched as compressed gas between continental countries and as ammonia by sea before being reconverted to hydrogen on arrival.
Table 4. Summary of simulated scenarios
Hydrogen transportation options
Pipelines and liquefied hydrogen shipping (LH2) Pipelines and ammonia shipping (NH3)
Hydrogen Independence (HI)
HI_LH2
HI_NH3
Regional Imports (RI) Long-Distance Imports (LDI)
RI_LH2 LDI_LH2
RI_NH3 LDI_NH3
7.1. Hydrogen Supply Costs
Our analysis shows how meeting EU renewable hydrogen demand would cost between 253 billion and 293 billion USD per year (see Figure 11).
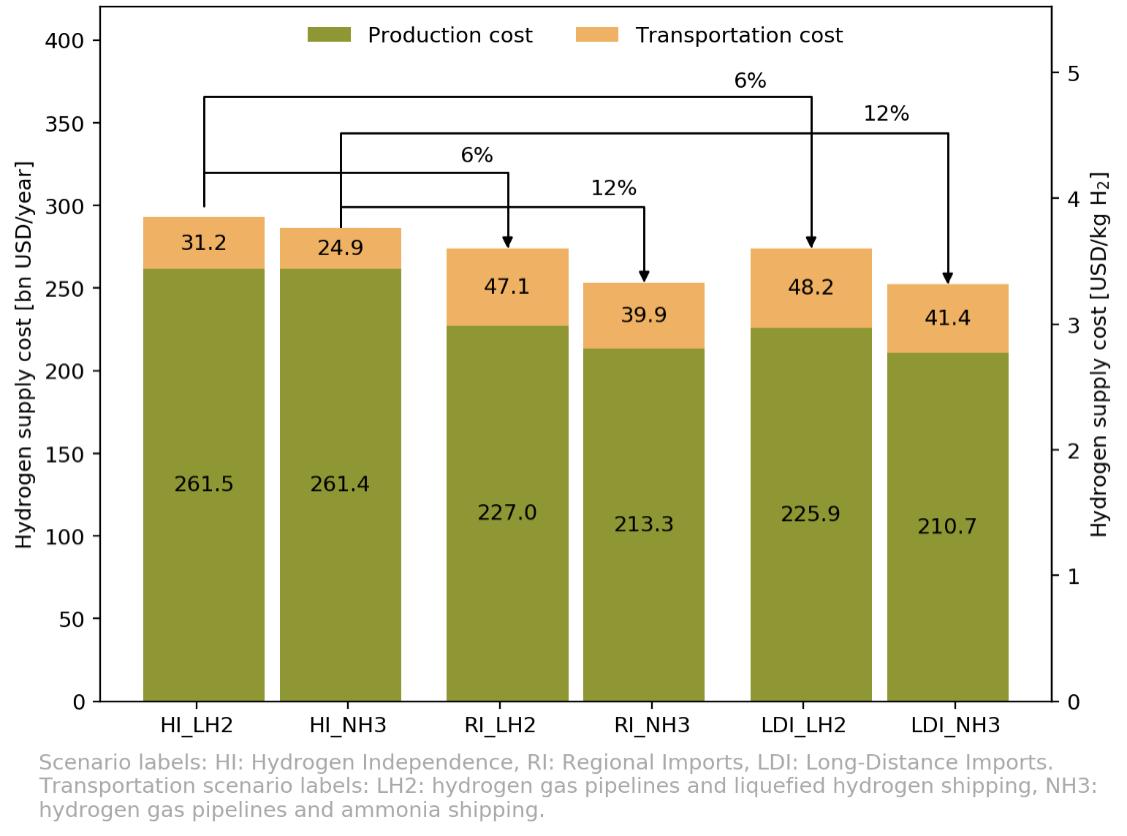
Figure 11. EU hydrogen supply costs Source: Authors’ analysis
Overall, scenarios where hydrogen is shipped as ammonia result in lower supply costs, thanks to both lower transportation costs (shipping ammonia is significantly less costly than shipping liquefied hydrogen) and higher volumes from producers with lower costs than those in EU countries.
Renewable hydrogen imports from outside the EU could lower overall supply costs between 6% and 12%, even when higher transportation costs are accounted for. Long-distance partners, however, provide no additional cost optimization opportunities because the higher transportation costs increasingly offset lower production costs.
Hence, if cost considerations are prioritized, the Regional Imports scenario is the optimal route for meeting future renewable hydrogen demand in the EU at the lowest cost possible.
7.2. Renewable Hydrogen Trade Flows
International trade of renewable hydrogen plays a significant role in all reference scenarios. Based on our analysis, trade between countries would cover between almost 70% and 86% of EU overall demand. To elucidate the associated market dynamics, we developed flow diagrams for each reference scenario, connecting supply with demand.
7.2.1. Hydrogen Independence Scenario
In the Hydrogen Independence scenario, renewable hydrogen trades between member states would account for almost 70% of demand, while the remainder would be self-consumption. Almost all hydrogen would be dispatched by pipeline, resulting in similar trade flows between countries regardless of the sea shipping choice (see Figures 12 and 13).
In this scenario, two regions—the Iberian Peninsula and the Baltic States— and two member states—Ireland and Denmark—would supply nearly nine out of ten kilograms of renewable hydrogen traded within the EU. The Iberian Peninsula would become the largest export region, with Spain and Portugal dispatching around 23 Mt/yr of renewable hydrogen to Italy, France, Germany, and Belgium. In the east, the Baltic States would supply nearly 11 Mt/yr of renewable hydrogen to other member states, with Denmark supplying about 5 Mt/yr mainly to the Netherlands and Germany. Only Ireland would deliver by ship about 12 Mt/yr to the continent.
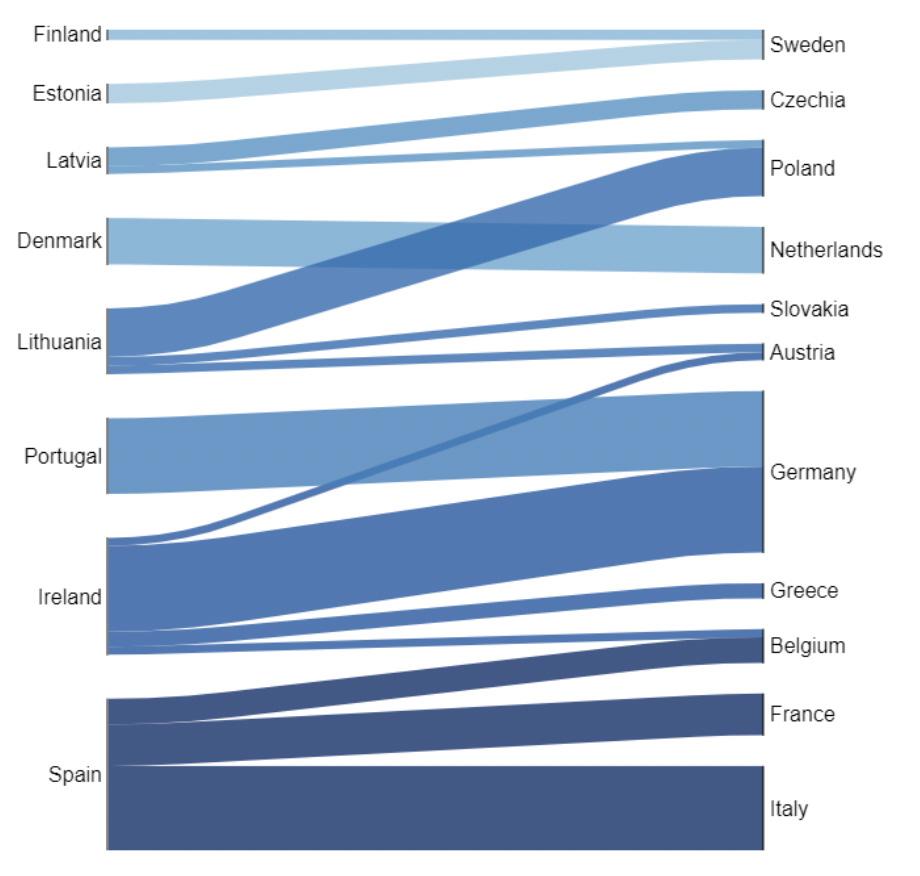
Figure 12. Renewable hydrogen trade flows in the HI_LH2 scenario Source: Authors’ analysis. Hydrogen flows from exporters (left) to importers (right). Connection width is proportional to hydrogen mass flow. Hydrogen flows below 0.5 Mt/yr are not depicted for clarity
Large hydrogen flows from the EU’s edge to central Europe again highlight the need for integrated hydrogen infrastructure and markets. In this scenario, hydrogen pipelines running from the Iberian Peninsula and the Baltic States would connect to the Netherlands, Denmark, Belgium, and Germany,73 in addition to shipping terminals connecting insular countries to the continent.
An integrated hydrogen transportation infrastructure will thus be essential for the EU to reach hydrogen independence and optimal allocation of hydrogen production, a goal which can only be achieved at higher overall supply costs.
73 Recent developments already point in this direction. The Dutch government has already commissioned studies on retrofitting 1,200 km of existing natural gas pipelines for transporting hydrogen by 2027 that would connect Germany, the Netherlands, and Belgium, as reported in Brooks (2021).
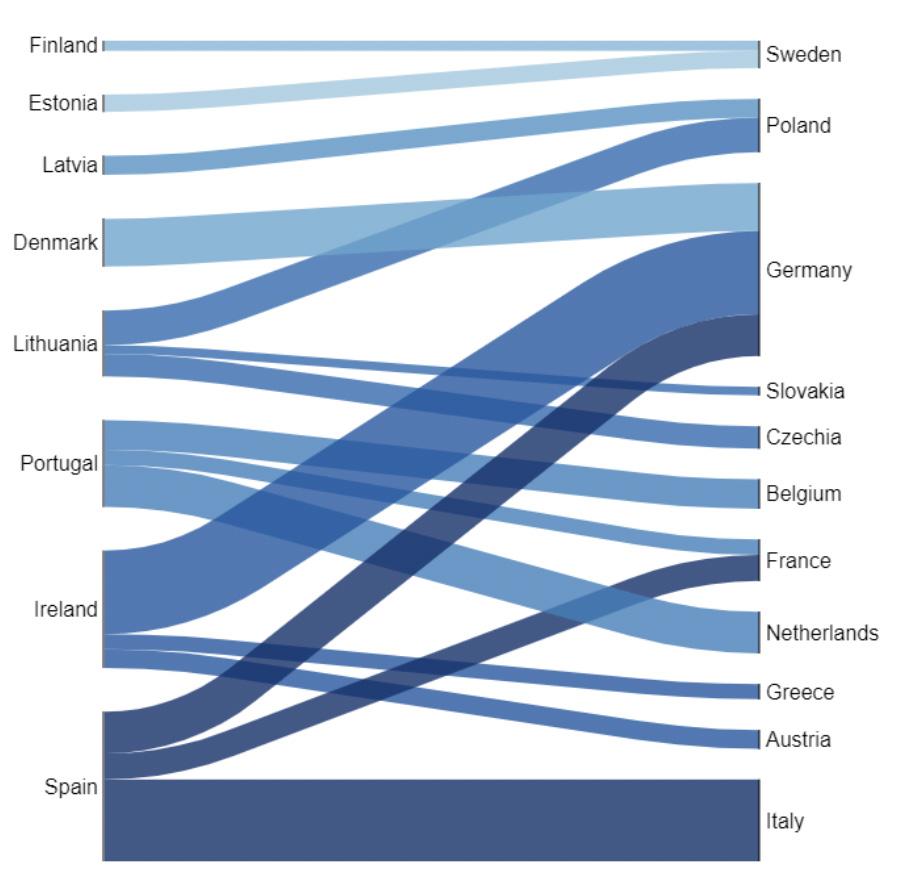
Figure 13. Renewable hydrogen trade flows in the HI_NH3 scenario Source: Authors’ analysis. Hydrogen flows from exporters (left) to importers (right). Connection width is proportional to hydrogen mass flow. Hydrogen flows below 0.5 Mt/yr are not depicted for clarity
7.2.2. Regional Imports Scenario
When considering imports from regional partners, overall supply costs decrease between 6% and 12%. In part this is because lowercost internal trade between member states and imports from regional partners account for up to 86% of EU overall demand.
Shipped hydrogen represents a more significant fraction of demand here than it does in the Hydrogen Independence scenario, and trade flows change considerably depending on the shipping choice (see Figures 14 and 15). The lower transportation costs associated with ammonia shipping increase imports from regional partners to 63 Mt/yr, while the costlier shipping of liquefied hydrogen limits imports to 47 Mt/yr.
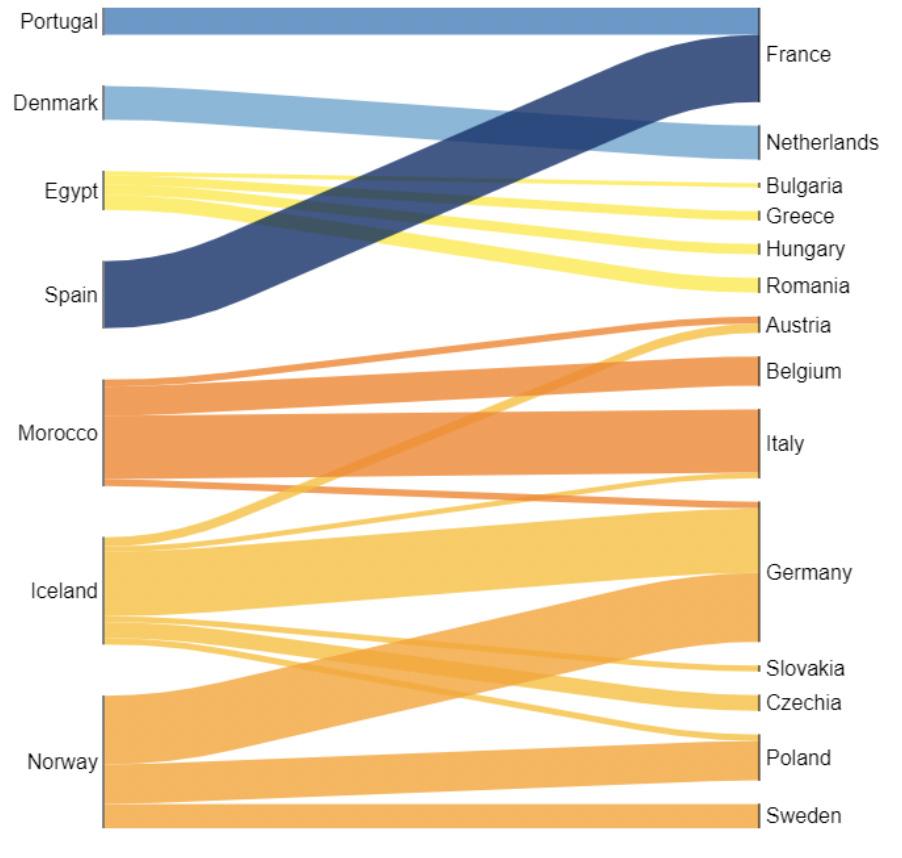
Figure 14. Renewable hydrogen trade flows in the RI_LH2 scenario Source: Authors’ analysis. Hydrogen flows from exporters (left) to importers (right). Connection width is proportional to hydrogen mass flow. Hydrogen flows below 0.5 Mt/yr are not depicted for clarity
From a country-level supply perspective, trade fluxes shift from North European to North African countries depending on the hydrogen carrier used for shipping (see Figures 14 and 15). In the case of liquefied hydrogen shipping, Norway and Iceland would become the leading suppliers with about 29 Mt/yr compared to around 19 Mt/yr for Morocco and Egypt. Regarding ammonia shipping, however, Morocco becomes the lead supplier with over 32 Mt/yr, while Norway and Iceland contribute about 25 Mt/yr. Egypt continues to supply about 5 Mt/yr since freshwater availability constraints limit its ability to increase market share.
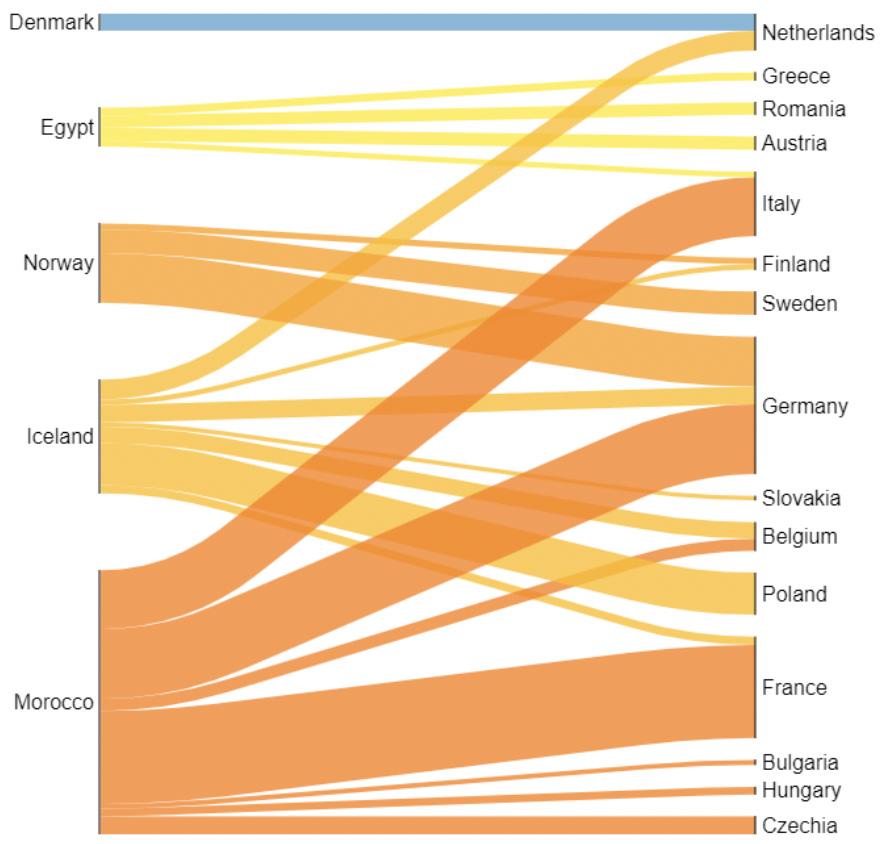
Figure 15. Renewable hydrogen trade flows in the RI_NH3 scenario Source: Authors’ analysis. Hydrogen flows from exporters (left) to importers (right). Connection width is proportional to hydrogen mass flow. Hydrogen flows below 0.5 Mt/yr are not depicted for clarity
Furthermore, in the case of ammonia shipping, imports from non-EU countries cover 83% of overall demand at much lower supply costs. At the same time, this extensive import dependency raises significant energy
security issues. For reference, the EU’s energy dependency on coal and natural gas today equals 63% and 89.5%, respectively.74
In the case of liquefied hydrogen shipping, North European and North African partners would contribute equally to EU demand. However, for ammonia shipping, Morocco alone would supply nearly 43% of EU demand. The EU could diversify supply sources by leveraging long-distance imports from global export champions, like Australia and the United States, in order to address these energy security concerns.
7.2.3. Long-Distance Imports Scenario
Our analysis shows that adding long-distance partners would increase the share of EU demand supplied by trades between EU countries and regional and long-distance partners up to 86%. Long-distance imports, however, would only play a meaningful role if competitive shipping costs were available (see Figures 16 and 17). Long-distance imports are largely uncompetitive with liquefied hydrogen shipping and amount to about 0.1 Mt/yr, while they increase to 17 Mt/yr with ammonia shipping.
In the latter case, the United States could become the largest supplier of renewable hydrogen to the EU with 17 Mt/yr. Despite Australia’s vast potential and highly competitive production costs, their imports cannot enter the supply mix due to the high transportation costs.
Compared to the Regional Imports scenario, in this scenario imports from North America would flow to France, Germany, the Netherlands, and Belgium, while Moroccan imports would be reduced by half. Other regional exporters to the EU like Norway, Iceland, or Egypt would remain unaffected by incorporating longdistance partners and would supply similar amounts of renewable hydrogen as they do in the Regional Imports scenario.
74 Based on Eurostat data for coal and natural gas supply in 2019. Eurostat (2020) ‘Coal production and consumption statistics’, last edited 3 August 2021, accessed 20 September 2021. https://ec.europa.eu/eurostat/ statistics-explained/index.php?title=Coal_production_and_consumption_statistics and Eurostat (2020) ‘Natural gas supply statistics’, last edited on 20 July 2021, accessed 20 September 2021. https://ec.europa.eu/eurostat/ statistics-explained/index.php?title=Natural_gas_supply_statistics
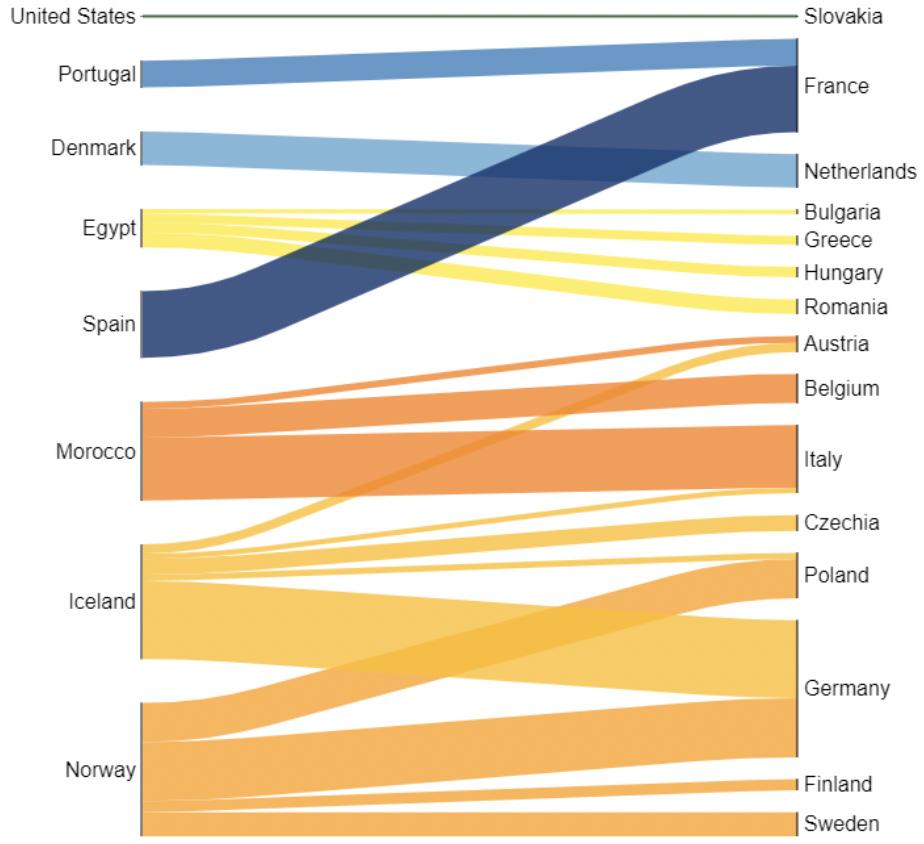
Figure 16. Renewable hydrogen trade flows in the LDI_LH2 scenario Source: Authors’ analysis. Hydrogen flows from exporters (left) to importers (right). Connection width is proportional to hydrogen mass flow. Hydrogen flows below 0.5 Mt/yr are not depicted for clarity, except for the United States
Long-distance imports would not lower the EU’s overall supply costs or the bloc’s dependence on external imports, which would account for between 63% and 83% of demand. Still, long-distance imports could have significant implications from a security of supply perspective. The emergence of the United States as the largest exporter of renewable hydrogen to the EU would limit imports from any single trade partner to about 22% of overall demand. Therefore, diversification would be an effective strategy to reduce supply security risks without increasing overall supply costs.75
75 By gaining access to low-cost renewable hydrogen potentials in global export champions, production costs decrease in the LDI_NH3 scenario compared to RI_NH3. However, due to the longer shipping distances, transportation costs increase and offset the cost advantage of the long-distance imports.
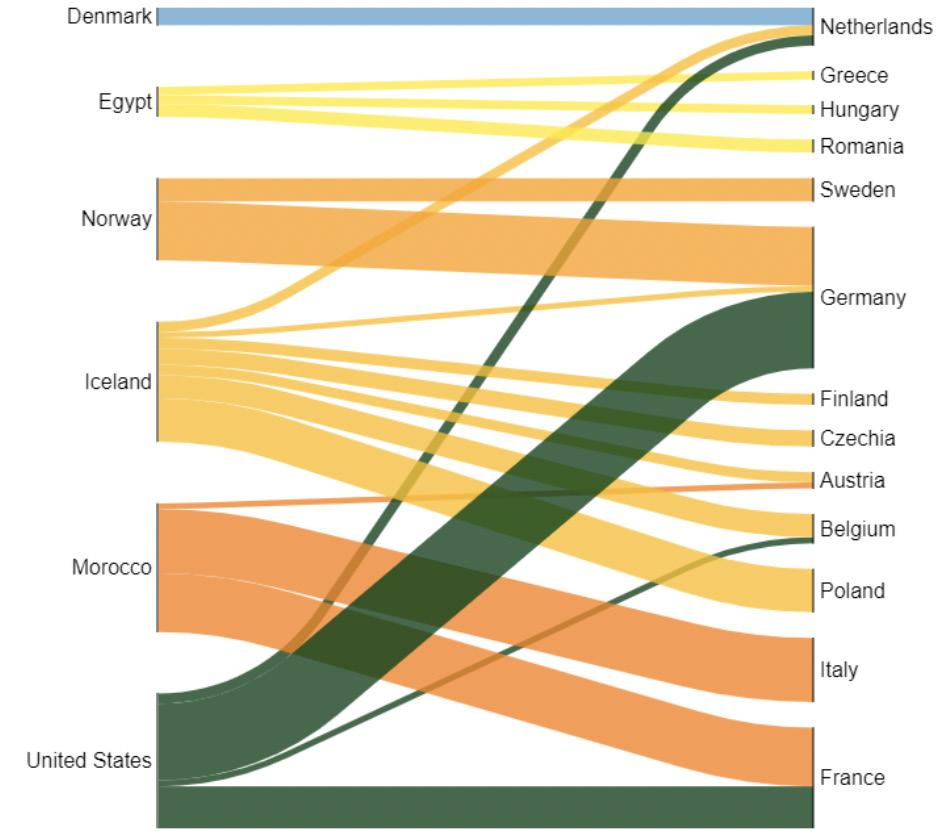
Figure 17. Renewable hydrogen trade flows in the LDI_NH3 scenario Source: Authors’ analysis. Hydrogen flows from exporters (left) to importers (right). Connection width is proportional to hydrogen mass flow. Hydrogen flows below 0.5 Mt/yr are not depicted for clarity
7.3. Investment Requirements
Investments between 2 trillion and 2.4 trillion USD in renewables, electrolysis, and enabling infrastructure would be needed to meet future EU renewable hydrogen demand. Hydrogen imports could lower total investment needs by 9% to 13%, but they would also change the physical allocation with significant market consequences (see Figure 18).
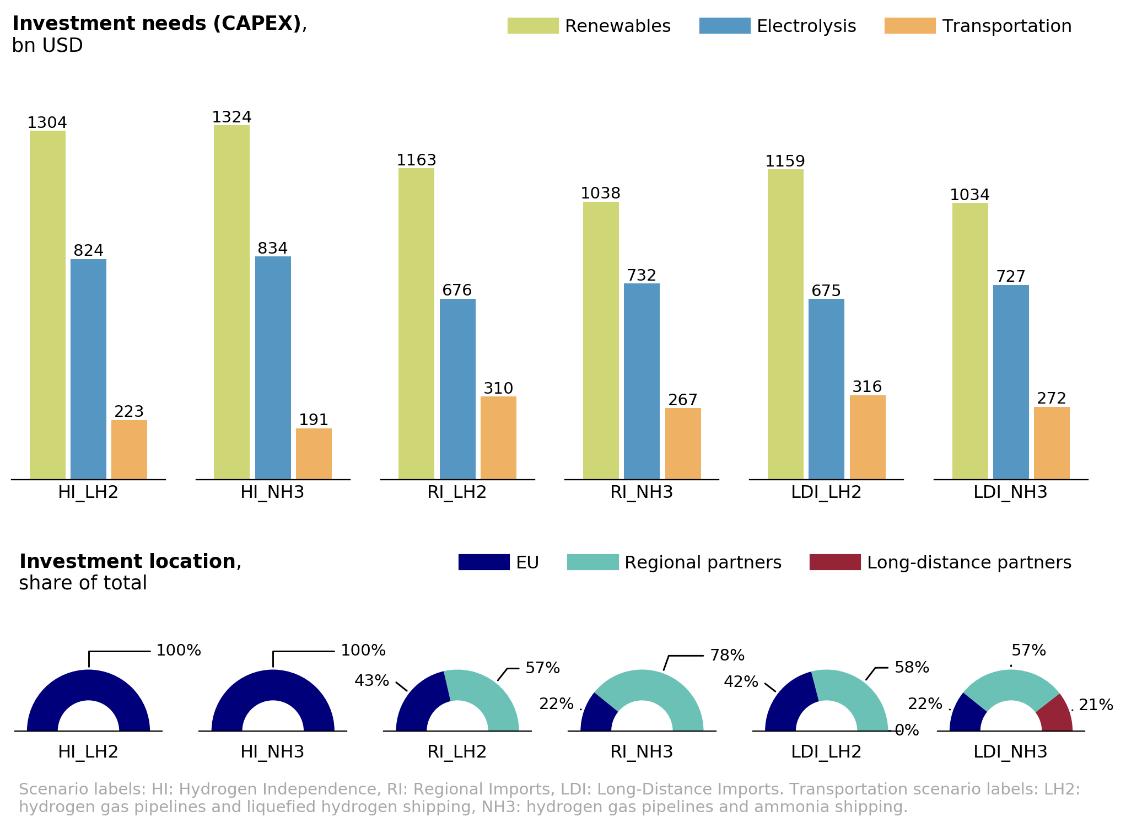
Figure 18. Investment allocation by scenario Source: Authors’ analysis
In all scenarios, investments in renewables and electrolysis account for more than 80% of overall CAPEX, reaching 90% in the Hydrogen Independence case. Investments in renewables are lower in the Regional and Long-Distance Imports scenarios for two reasons. Countries like Morocco and the United States can rely on solar power, while key EU producers like Ireland, Denmark, and the Baltic States would need to deploy costlier wind power because they lack competitive solar resources. In addition, higher capacity factors for renewable energy resources in regional and long-distance partners would reduce overall investment needs.
As expected, import scenarios require about 40% more investments in transportation infrastructure than the Hydrogen Independence scenario because of the need to deploy import and export shipping terminals to complement hydrogen pipeline networks in the EU.
The Regional and Long-Distance Imports scenarios allocate 57% to 78% of overall investments outside the EU. While this could encourage participation from a broader group of investors, it reduces the EU’s ability to control project development and introduces additional risk to a successful strategy implementation.
7.4. Sensitivity Analysis
Since underlying assumptions and estimations may vary over time due to multiple external factors, it is crucial to conduct sensitivity analyses on key variables and evaluate possible impacts on overall results. For example, in the past, technological cost reductions have been faster than anticipated in some cases, like with solar photovoltaics,76 and slower in other cases.77
As discussed, the MIGHTY model identifies key trade partners for meeting EU hydrogen demands at the lowest possible cost. Hence, renewable hydrogen production and transportation costs, a function of investment costs,78 are key drivers in the reference scenarios’ results. Consequently, a ±50% sensitivity analysis on investment costs for renewable energy, electrolyzers, pipelines, and hydrogen shipping is carried out.79 In addition, a ±50% sensitivity to the cost of capital, represented by the overall discount rate, is also carried out.
The sensitivity analyses show that while overall supply costs change significantly, the impact on the reference scenario rankings is negligible. The overall implications and considerations remain the same, because all
76 For example, see Creutzig et al. (2017) “The Underestimated Potential of Solar Energy to Mitigate Climate Change,” Nature Energy, 2(9). https://doi.org/10.1038/nenergy.2017.140
77 For example, see Lilliestam et al. (2017) “Empirically Observed Learning Rates for Concentrating Solar Power and Their Responses to Regime Change,” Nature Energy, 2(7), 17094. https://doi.org/10.1038/ nenergy.2017.94
78 Other production routes, such as blue hydrogen from natural gas with carbon capture, have much higher operational costs than renewable hydrogen that also influence production and transportation costs. See for example IEA (2019) The Future of Hydrogen.
79 See specific values 10.5 in the Appendix.
the scenarios are affected consistently by the sensitivity analyses (see Figure 19). For example, if electrolyzers were 50% cheaper than in the reference case, supply costs would decrease about 20% across all scenarios.
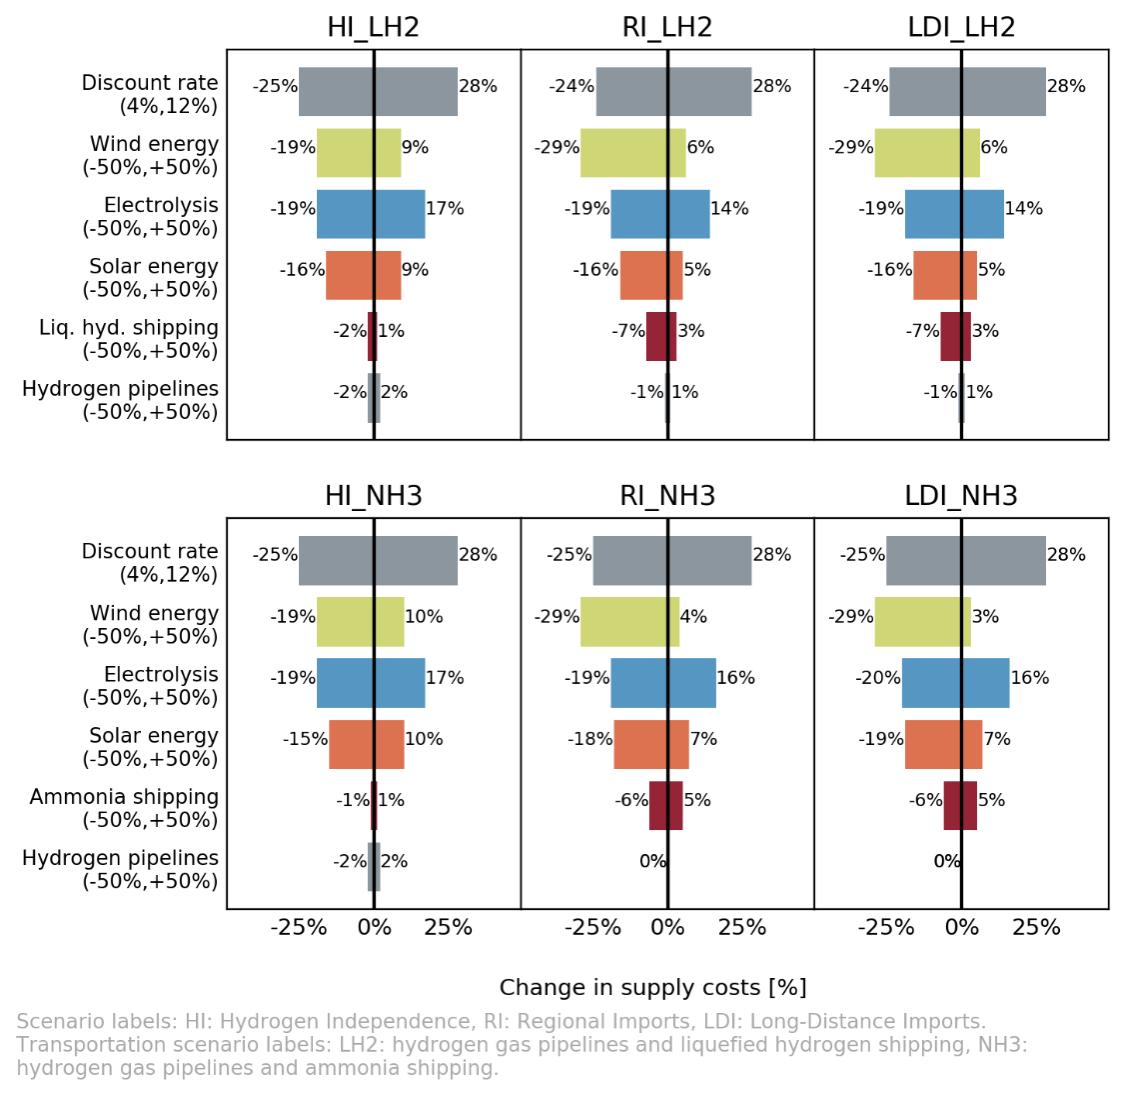
Figure 19. Sensitivity analyses Source: Authors’ analysis
Across all the scenarios, the cost of capital is the variable with the highest impact on overall supply costs, followed by renewable energy and electrolyzer investment costs. The sensitivity analysis shows how a 4% discount rate (50% lower than the base case) would reduce supply costs to between 2.5 and 2.9 USD/kg, from 3.3 to 3.9 USD/kg (see Figure 11). This trend highlights how policy measures aimed at reducing the cost of capital could be particularly effective in increasing competitiveness and driving adoption at scale.
The sensitivity analysis on renewable energy and electrolyzer investment costs also reveals a potential switch effect: costlier solar (or wind) energy with respect to the base case would drive producers to switch to wind (or
solar), thus capping increments in overall supply costs.80 In other words, costlier-than-anticipated renewables and electrolyzers would increase hydrogen supply costs less than expected (see Figure 19). Scenarios with higher renewable energy potentials are more sensitive to this effect because producers have more opportunities to switch to more competitive wind or solar energy. This is a significant additional benefit of including regional and long-distance partners in the EU’s supply mix.
Finally, changes in transportation costs with respect to the base case have only minor impacts on overall supply costs (see Figure 19). At the same time, cheaper-than-expected shipping could result in more considerable reductions in overall supply costs than cheaper-than-expected pipelines because shipping would allow for more imports at lower production costs. On the other hand, if transportation costs were to be more expensive, the EU could limit the impact by reducing trade and developing its domestic resources. Both considerations can only be elucidated thanks to the MIGHTY model, which optimizes overall supply costs based on production potentials and transportation costs.
80 The switch effect is also present for costlier wind energy than anticipated and if electrolyzer investment costs turn out to be higher than in the reference assumption. As discussed before, electrolysis investment costs typically represent a larger fraction of hydrogen production costs when electrolyzers are powered by solar energy because of lower capacity factors than for wind farms. Therefore, higher electrolyzer investment costs would impact production costs of producers using solar energy more than of those relying on wind energy. For this reason, the switch effect will incentivize producers to produce less with solar energy and more with wind energy.
8. Policy Implications
Attaining competitive and secure supplies of renewable hydrogen is becoming a key policy priority in efforts to accelerate the worldwide transition to low-carbon economies. Unconstrained by legacy infrastructure, hydrogen offers policymakers, investors, and other stakeholders the opportunity to design and deploy new and efficient energy systems. Harnessing hydrogen’s full potential will require assessing the associated economic, environmental, and geopolitical implications, identifying strategies to address them, and defining implementation plans. Today no major hydrogen pipeline networks exist, and no liquefied hydrogen ships are in commercial operation, which could have a significant impact on the needed investments in supply and demand.
To better understand these dynamics, we developed three long-term scenarios focused on the strategic variables of energy independence, cost (optimization), and energy security. The considerations outlined in the previous sections make it clear that only by working together can the EU become a global leader in renewable hydrogen innovation and simultaneously contribute to the EU’s climate and energy security goals, a more robust economy, and a more integrated union. This transformational effort will require close coordination between policy, technology, capital, and society and for EU countries to unite behind a shared long-term vision.81
Overall a successful transition will require:
• Clear regulations and standards for renewable hydrogen production, transportation, and certification82,83 that enable cross-border trade at scale. Member states should also revisit their internal regulatory frameworks to harmonize and streamline them.
81 De Blasio, N, Nuñez-Jimenez, A (2020) “Will Renewable Hydrogen Help Unite Europe?” Agenda Pública – El País, 10 November 2020. https://www.belfercenter.org/publication/will-renewable-hydrogen-help-unite-europe
82 De Blasio, N, Hua, C (2021) “The Role of Blockchain in Green Hydrogen Value Chains,” Policy Brief, November 2021. https://www.belfercenter.org/publication/role-blockchain-green-hydrogen-value-chains
83 Velazquez A, Dodds, PE (2020) “Green Hydrogen Characterisation Initiatives: Definitions, Standards, Guarantees of Origin, and Challenges,” Energy Policy, 138(August 2019), p. 111300. https://doi.org/10.1016/j. enpol.2020.111300
• Policies to lower market risk, address commercialization barriers, and achieve the required economies of scale. Examples include renewable hydrogen standards requiring stakeholders to source part of the traded hydrogen from renewable sources and mandating the labelling of CO2 intensities of products, thus spurring the emergence of green premiums.84
• Funding innovation and pilot projects to help reach the tipping point at which renewable hydrogen technologies become cost competitive.
For example, the EU could borrow the idea of the “Energy Earthshots
Initiative” from the United States Department of Energy85 and fund initiatives aimed at establishing ambitious cost-reduction targets with clear timelines and regular funding reviews.
In the remainder of this section, we outline key policy and market options for each reference scenario.
Hydrogen Independence
The EU prioritizes energy independence and develops internal, self-sufficient renewable hydrogen markets. Overall, hydrogen demand can be met with internal production but at higher costs.
Our analysis shows that hydrogen self-sufficiency is achievable. Still, success requires designing and deploying efficient and integrated hydrogen markets to enable cross-border trade between member states. Policymakers will need to define strategies to support the deployment, sharing, and operation of highly integrated infrastructure networks across the continent and, in parallel, stimulate strong growth in renewable electricity generation.
Integrated hydrogen markets will allow member states to rely on the most competitive resources available instead of more expensive domestic production. Achieving this goal will require close coordination and investment planning with member states that have the potential to become regional exporters, such as Spain, Portugal, Ireland, Denmark, and the Baltic States.
84 European Commission (EC) (2021) proposal to amend the EU Renewable Energy Directive.
85 In June 2021, the United States Department of Energy announced the first Energy Earthshot aimed at reducing the cost of clean hydrogen by 80% to 1 USD/kg in one decade. United States Department of Energy (US DOE) 2021, “Secretary Granholm Launches Hydrogen Energy Earthshot to Accelerate Breakthroughs Toward a Net-Zero Economy,” US DOE articles, 7 June 2021. https://www.energy.gov/articles/secretarygranholm-launches-hydrogen-energy-earthshot-accelerate-breakthroughs-toward-net
From a security of supply perspective, although long-term demand would be met by internal production, continent-wide periods of low renewables production and high energy demand could still disrupt supplies. A strategic allocation of production and storage facilities across the continent would help increase overall supply security.
Finally, hydrogen self-sufficiency and large-scale internal trade would trigger profound shifts in the political relations and alliances between member states. In particular, large flows of hydrogen from the Baltic States, Portugal, and Spain to central Europe would strengthen the economic and social cohesion of the Union, while at the same time transforming relationships with current energy providers like Russia.
Regional Imports
The EU prioritizes cost optimization by complementing the lowest-cost internal production with imports from neighboring countries. Regional imports would optimize overall supply costs but also reproduce energy dependence patterns of the past.
Overall supply costs can be optimized by complementing the lowest-cost internal production with imports from resource-rich neighboring countries. The feasibility of this scenario relies on the ability of exporters to develop hydrogen potentials at scale. On the one hand, this will require the EU to set policies that promote long-term contracts and direct investments in producing nations to help reduce market risk. On the other hand, producers will need to define strategies that trigger infrastructure investments and align with the EU on domestic regulations and standards for renewable hydrogen production, transportation, and certification, paving the way for a dominating position in future markets.
The price to pay for cheaper hydrogen supplies will be the possibility of reproducing past energy dependence patterns and security of supply risks. In this scenario, the EU would remain as dependent on hydrogen imports from Morocco as it is today on gas imports from Russia. While shifting the geopolitical center of gravity from East to South would have major implications, it would do little to enhance the Union’s strategic autonomy on energy.
To manage some of these risks without sacrificing the cost advantage, the EU could ensure uninterrupted supplies by extending strategic energy reserve requirements to hydrogen.86 A longer-term solution would require diversification of regional imports, for example by unlocking, through technical assistance and direct investments, large potentials in nearby countries like Algeria and Egypt that are constrained by energy infrastructure and freshwater availabilities.
Long-Distance Imports
The EU prioritizes energy security and cost optimization by combining long-distance imports from export champions like the United States with regional imports and internal production.
Adding imports from long-distance partners to its hydrogen mix would allow the EU to maintain low overall supply costs while addressing some of the security risks inherent in depending on imports from very few neighbors.
This strategy hinges on the emergence of truly global markets and requires the concerted effort of multiple players. To this end, the EU should promote the adoption of clear international regulations and standards on renewable hydrogen production, transportation, and certification. A new international forum, acting as a coordinating body, could eventually lead to the creation of agencies responsible for developing these standards and working with national regulatory bodies to facilitate implementation.
From a security of supply perspective, the emergence of global markets, standards, and certificates of origin would allow member states to develop a diversified import mix. More global and less regionalized hydrogen trade flows would also reconfigure the geopolitical balance between suppliers and consumers by making it easier to switch providers, thus ending the influence of dominant suppliers. At the same time, the role of strategic reserves would be even more relevant for weathering short-term supply disruptions.
86 European directives require EU countries to maintain reserves of at least 90 days of imports or 61 days of inland consumption, whichever is greater, of crude oil and/or petroleum products. European Commission (EC) (2009) “Council Directive 2009/119/EC of 14 September 2009.”
9. Options for Further Analysis
Beyond the direct scope of our analysis, we have identified several adjacent research topics in need of further academic analysis. Potential areas include but are not limited to:
1. Applying our analytical framework to other regions of the world, allowing decision-makers to assess better supply scenarios based on the key strategic variables of energy independence, cost (optimization), and security of supply.
2. Examining other production technology pathways and overall value chains to shed light on synergies that could accelerate low-carbon hydrogen adoption and to address questions such as: Which low-carbon hydrogen production mix suits which countries? How could technology competition change the role countries play in future hydrogen markets?
3. Assessing pathways to accelerate hydrogen adoption at scale in selected applications.
10. Appendix
This appendix collects input parameters; assumptions used throughout this report; and methodological notes on hydrogen production estimates, transportation costs, and optimization of trade flows.
10.1. Input Parameters and Assumptions
10.1.1. General Inputs and Assumptions
General inputs and assumptions apply to all calculations and variables. In the cases of hydrogen lower heating value and ammonia hydrogen content by weight, assumptions were based on available scientific estimates and composition. Capital cost and technology readiness are assumed constant across regions for simplicity and coherence, and to facilitate hydrogen production competitiveness analyses. While for globally manufactured technologies like solar photovoltaic modules, differences between countries are likely to be minor and primarily related to soft costs (e.g., labor, permitting fees, and others), cost of capital is likely to be significantly different between countries.87 As discussed, the high sensitivity of production costs to variations in the cost of capital offers a promising path for future analyses.
• Hydrogen lower heating value (LHV): 33.333 kWh/kg H2
• Ammonia’s hydrogen content by weight: 5.667 kg NH3/kg H2
• Discount rate: 8%, based on IEA assumptions88
Another set of general assumptions was employed to determine renewable electricity generation’s economic potential in countries included in the analyses (see Table 5). These assumptions consider solar and wind energy resources with low capacity factors and in remote locations as uneconomic and thus unlikely to be developed, reducing a country’s economic potential. Specific thresholds for each technology (e.g., capacity factor and
87 Egli et al. (2019) “Bias in Energy System Models with Uniform Cost of Capital Assumption,” Nature Communications, 10, 4588. https://doi.org/10.1038/s41467-019-12468-z
88 IEA (2019) The Future of Hydrogen.
distance values) were determined based on the granularity of the data sources.
Table 5. Assumptions for economic renewable electricity generation potentials
Variable Economic viability assumptions
Solar energy
Onshore wind energy
Offshore wind energy
Resources with a capacity factor higher than 11% (equivalent to 1,000 full load hours) and less than 100 km from towns are economically viable.
Resources with a capacity factor higher than 26% (equivalent to 2,278 full load hours) and less than 160 km from towns are economically viable.
Resources with a capacity factor higher than 26% (equivalent to 2,278 full load hours), less than 20 nautical miles (approximately 37 km) from the coast, and sea depths less than 30 meters are economically viable.
Data source
Pietzcker et al. (2014)
Eurek et al. (2017)
Eurek et al. (2017)
10.1.2. Renewable Technologies Input Parameters
The IEA’s World Energy Outlook 2020 projects renewable energy technology costs up to 2040.89 To project costs to 2050, IEA’s outlook was combined with cumulated installed capacity scenarios by the International Renewable Energy Agency (IRENA)90 and cost reductions estimated using experience curves (see Table 6).
Table 6. Renewable energy technology economic inputs
PV Onshore wind Offshore wind
Global cumulated installed capacity91 2040: 5,982 GW
2050: 10,651 GW 2040: 4,195 GW
2050: 6,693 GW 2040: 552 GW
2050: 1,143 GW
Learning rate92 20% 15% 15%
Investment cost93 2040: 490 USD/kW
2050: 407 USD/kW 2040: 1,420 USD/kW
2050: 1,273 USD/kW 2040: 2,040 USD/kW
2050: 1,720 USD/kW
Operation and maintenance costs94 2.5% CAPEX 2.9% CAPEX 2.5% CAPEX Lifetime95 25 years 25 years 25 years
89 IEA (2020) World Energy Outlook 2020, https://www.iea.org/reports/world-energy-outlook-2020 90 IRENA (2020) Global Renewables Outlook: Energy Transformation 2050, April 2020. https://irena.org/ publications/2020/Apr/Global-Renewables-Outlook-2020
91 Data from cumulative capacity additions in IRENA (2020).
92 Based on learning rates review in Brändle et al. (2021).
93 Investment cost in 2040 based on Stated Policy Scenario for Europe in IEA (2020).
94 Estimated from capital costs, operation and maintenance costs, and capacity factors for Europe 2040 in the Stated Policies Scenario in IEA (2020).
95 Based on IEA (2019).
10.1.3. Electrolysis Input Parameters
Input parameters for water electrolysis are based on long-term projections for polymer electrolyte membrane (PEM) electrolyzers by the IEA (see Table 7).96 While PEM electrolyzers are costlier than alkaline electrolyzers and less efficient than solid oxide electrolyzers, their greater flexibility to operate efficiently with variable power sources and more robust learning effects could make them the most competitive in the short to medium term.97 For these reasons, electrolysis input parameters were chosen based on PEM electrolyzers.
Table 7. Electrolysis input parameters (based on IEA [2019] The Future of Hydrogen)
Investment cost Operation and maintenance costs Efficiency Lifetime Water consumption
Electrolyzer
450 USD/kW 1.5% CAPEX 74% LHV 20 years 9 kg water/kg H2
96 IEA (2019) The Future of Hydrogen.
97 Böhm et al. (2020) “Projecting Cost Development for Future Large-Scale Power-to-Gas Implementations by Scaling Effects,” Applied Energy, 264(March), pp. 114780. https://doi.org/10.1016/j.apenergy.2020.114780
10.1.4. Hydrogen Transportation Input Parameters
The future evolution of hydrogen transportation remains highly uncertain. Currently, no infrastructure exists for hydrogen transportation over long distances at scale, whether as compressed gas in pipelines, liquefied in ships, or contained in other molecules like ammonia shipping.
Although there are about 3,000,000 kilometers of natural gas pipelines worldwide, only 5,000 km of hydrogen pipelines exist, most of which are part of chemical facilities or refineries.98 Pipelines transporting pure hydrogen may require different materials than those transporting natural gas.99 Compressors, valves, and sensors also need to be adapted or explicitly built for pure hydrogen. While significant investments in new and repurposed pipelines would be required, the technologies to manufacture hydrogen pipelines, compressors, and equipment exist.
In contrast, there is no commercial liquefied hydrogen shipping infrastructure anywhere in the world, and deployment at scale by 2050 will require significant investments. Today, only one liquefied hydrogen vessel100 and one import terminal101 exist as part of a demonstration project by Japanese group Kawasaki Heavy Industries. While hydrogen liquefaction and evaporation technologies are well known, they have been built only on a small scale. Therefore, the technologies required to establish liquefied hydrogen shipping routes at scale are relatively immature and require significant innovation and development efforts.
On the other hand, ammonia shipping is an established technology with long-distance commercial routes connecting producers and importers.
98 IEA (2019) The Future of Hydrogen.
99 Melaina et al. (2013) “Blending Hydrogen into Natural Gas Pipeline Networks: A Review of Key Issues,” National Renewable Energy Laboratory, NREL TP-5600-51995. https://www.nrel.gov/docs/fy13osti/51995.pdf
100 Kawasaki Heavy Industries (2019) “World’s First Liquefied Hydrogen Carrier SUISO FRONTIER Launches Building an International Hydrogen Energy Supply Chain Aimed at Carbon-Free Society,” Kawasaki Newsroom, 11 December 2019, accessed 20 September 2021. https://global.kawasaki.com/en/corp/newsroom/news/ detail/?f=20191211_3487 101 Kawasaki Heavy Industries (2020) “Kawasaki Completes World’s First Liquefied Hydrogen Receiving Terminal Kobe LH2 Terminal (Hy touch Kobe),” Kawasaki Newsroom, 3 December 2020. https://global.kawasaki. com/en/corp/newsroom/news/detail/?f=20201203_2378
Global trade of ammonia accounted for 19 Mt in 2021,102 which is significantly smaller than what future hydrogen markets would require.103 At the same time, ammonia is highly toxic and might require reconversion to hydrogen.
For these reasons, investment projections to 2050 were developed combining IEA estimates and a cost evolution scenario based on current technology maturity and commercial availability for each hydrogen transportation method (see Table 8).
Table 8. Investment cost evolution scenarios for hydrogen transportation technologies Source: Authors’ analysis
Investment cost variable
Pipeline [USD/m] (D = pipe diameter [m]) Liquefied hydrogen ship [bn USD per ship] Liquefied hydrogen export terminal [bn USD/Mt H2] Liquefied hydrogen import terminal [bn USD/Mt H2] Hydrogen liquefaction [bn USD/(Mt H2/yr)] Liquid hydrogen evaporation [bn USD/(Mt H2/yr)] Ammonia ship [bn USD per ship] Ammonia export terminal [bn USD/Mt NH3] Ammonia import terminal [bn USD/Mt NH3] Ammonia conversion [bn USD/(Mt H2/yr)] Ammonia reconversion [bn USD/(Mt NH3/yr)]
2020 2050 Cost evolution scenario
4,000•D2+ 598.6•D+329
3,200•D2+ 478.9•D+263.2 20% cost reduction
0.412 0.206
90.909 45.455
90.141 45.071
5.385 2.693
0.016 0.008
0.085 0.060 50% cost reduction
1.994 1.396
1.711 1.198
2.984 2.089
0.307 0.215 30% cost reduction
102 Argus Media (2020) “Global Ammonia Trade to Recover in 2021,” Argus Media News, 11 November 2020, accessed 20 September 2021. https://www.argusmedia.com/en/news/2158915-global-ammonia-trade-torecover-in-2021
103 IEA foresees 75 Mt of demand for low-carbon hydrogen in 2040 in the Sustainable Development Scenario in IEA (2020), while consultancy firm BloombergNEF includes a scenario with 801 Mt demand for green hydrogen in BloombergNEF (BNEF) (2020) “New Energy Outlook 2020,” October 2020. https://about.bnef. com/new-energy-outlook-2020/
Figure 20 offers a schematic representation of renewable hydrogen production and transportation by pipeline. Our analysis computed the length of pipelines by considering the distance between the countries’ centers; following a conservative approach, pipelines were assumed to be newly built (see Table 9).
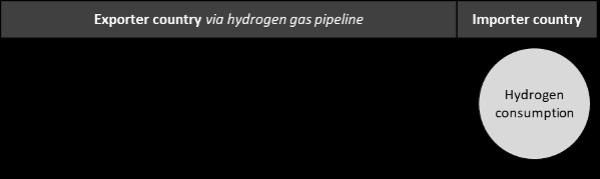
Figure 20. Schematic representation of hydrogen shipping by pipeline
Different sources estimate that retrofitting existing natural gas pipelines for transporting hydrogen could reduce investment costs significantly.104 However, routes connecting renewable hydrogen production and consumption centers are likely to differ from existing natural gas networks. Therefore, future hydrogen pipelines will be unable to rely entirely on retrofitted natural gas infrastructure. Given the difficulty of assessing which shares of existing infrastructure could be retrofitted, input parameters are based on new pipeline construction.
104 Estimates vary widely with cost reductions ranging between 20% and over 70%. For example, see Cerniauskas et al. (2020) “Options of Natural Gas Pipeline Reassignment for Hydrogen: Cost Assessment for a Germany Case Study,” International Journal of Hydrogen Energy, 45(21), pp. 12095–12107. https://doi. org/10.1016/j.ijhydene.2020.02.121; Wang et al. (2020) “European Hydrogen Backbone,” Guidehouse for Enagás, Energinet, Fluxys Belgium, Gasunie, GRTgaz, NET4GAS, OGE, ONTRAS, Snam, Swedegas, Teréga, July 2020. https://guidehouse.com/-/media/www/site/downloads/energy/2020/gh_european-hydrogen-backbone_ report.pdf ; or Tezel and Hensgens (2021) “HyWay 27,” strategy&, PwC for Gasunie, June 2021. https://www. gasunie.nl/en/news/gasunie-decision-on-hydrogen-infrastructure-is-milestone-for-energy-transition/
Table 9. Hydrogen pipeline input parameters
Value Unit Source Notes
Investment cost 3,200•D2+ 478.9•D+ 263.2 [USD/m] (IEA 2019) D = pipe diameter in meters. Includes the cost of compressors.
Operation and maintenance cost 4.0% [% CAPEX] (Reuß et al. 2017)
Operational lifetime 40 [years] (IEA 2019)
Gas density
Velocity 7.9 [kg/m3] (IEA 2019) Assumed pressure of 100 bars.
15.0 [m/s] (IEA 2019)
Average utilization 75.0% [% max flow] (IEA 2019)
Storage
Storage investment cost
Storage operation and maintenance cost Storage operational lifetime 70 [days] Assumption based on 20% of annual flow (BNEF 2020) 8.0 [USD/kg H2] (Samsatli et al. 2016)
2.0% [% storage CAPEX] (Samsatli et al. 2016) Assumed storage in salt caverns.
Reported costs for Warmingham salt cavern.
Assumed use of salt caverns.
30 [years] (Reuß et al. 2017) Assumed use of salt caverns.
Hydrogen transportation by liquefied hydrogen shipping requires additional infrastructure for liquefaction, export and import terminals, vessels connecting countries, and regasification, as shown in Figure 21.
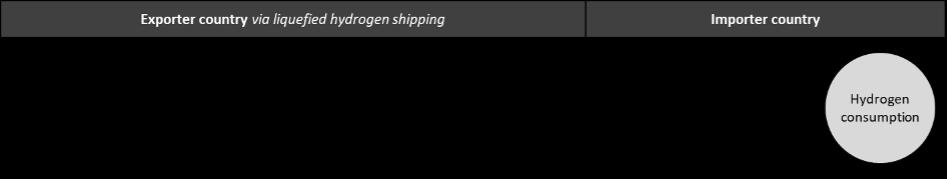
Figure 21. Schematic representation of hydrogen shipping
It is assumed that ships are fueled by hydrogen boil-off on the outgoing leg and retain part of their cargo for the return leg. Shipping fleets serve specific trade routes between exporter and importer countries, so the number of ships in one fleet depends on distances and traded volumes. However, the sizes of liquefaction, export and import terminals, and liquid hydrogen evaporation infrastructures depend on the overall volumes each
country exports or imports.105 Overall, shipping costs depend on traveled distance, transported volumes per year, and renewable electricity and hydrogen costs. Input parameters for hydrogen liquefaction are shown in Table 10, for export terminals in Table 11, for ships in Table 12, for import terminals in Table 13, and for liquid hydrogen evaporation in Table 14.
Table 10. Hydrogen liquefaction input parameters
Value Unit Source Notes
Investment cost 2.693 [bn USD/(Mt H2/yr)] (IEA 2019) Operation and maintenance costs 4.0% [% CAPEX] (IEA 2019)
Electricity demand 6.1 [kWh/kg H2] (IEA 2019)
Operational lifetime 30 [years] (IEA 2019)
Availability 7,884 [hours per year] (IEA 2019) Equivalent to 90% availability.
Table 11. Liquefied hydrogen export terminal input parameters
Value Unit
Source Notes
Investment cost 45.455 [bn USD/Mt H2] (IEA, 2019) Operation and maintenance costs 4.0% [% CAPEX] (IEA, 2019) Electricity demand 0.61 [kWh/kg H2] (IEA, 2019) Storage 3 [days] (Mizuno et al. 2016) Boil-off rate 0.1% [% capacity per day] (IEA, 2019)
Operational lifetime 30 [years] (IEA, 2019)
Availability 7,884 [hours per year] (IEA, 2019) Equivalent to 90% availability.
105 Detailed engineering design of shipping infrastructure would require a more in-depth consideration of factors such as economies of scale, overcapacity and/or storage required to supply the desired amount of hydrogen with operational hours limited by intermittent renewable energy resources, and overproduction to account for hydrogen losses along the supply route.
Table 12. Liquefied hydrogen ship input parameters
Value Unit Source Notes
Ship capacity 0.011 [Mt H2] (IEA, 2019) Investment cost 0.206 [bn USD per ship] (IEA, 2019) Operation and maintenance costs 4.0% [% CAPEX] (IEA, 2019) Boil-off rate 0.2% [% capacity per day] (IEA, 2019) Fuel consumption 12.396 [kg H2/km] (IEA, 2019) Assumes electric propulsion using a hydrogen fuel cell.
Speed 30.0 [km/h] (IEA, 2019) Load/unload time 24 [hours per trip-leg] Assumption Availability 7,884 [hours per year] (IEA, 2019) Equivalent to 90% availability.
Lifetime 30 [years] (IEA, 2019)
Table 13. Liquefied hydrogen import terminal input parameters
Value Unit Source Notes
Investment cost 45.071 [bn USD/Mt H2] (IEA, 2019)
Operation and maintenance costs 4.0% [% CAPEX] (IEA, 2019)
Electricity demand 0.2 [kWh/kg H2] (IEA, 2019)
Storage 20 [days] (Mizuno et al. 2016)
Boil-off rate 0.1% [% capacity per day] (IEA, 2019)
Operational lifetime 30 [years] (IEA, 2019)
Availability 7,884 [hours per year] (IEA, 2019) Equivalent to 90% availability.
Table 14. Liquid hydrogen evaporation input parameters
Value Unit Source Notes
Investment cost 0.008 [bn USD/(Mt H2/yr)] (Reuß et al. 2017) Operation and maintenance costs 3.0% [% CAPEX] (Reuß et al. 2017) Electricity demand 0.6 [kWh/kg H2] (Reuß et al. 2017) Operational lifetime 10 [years] (Reuß et al. 2017)
Availability 7,884 [hours per year] Assumption Equivalent to 90% availability.
Shipping hydrogen as ammonia requires a different infrastructure: renewable hydrogen is converted into ammonia, which is shipped and then reconverted to hydrogen (see Figure 22).

Figure 22. Schematic representation of ammonia shipping
For coherence across scenarios, it was assumed that all ammonia was converted back into hydrogen. All vessels were assumed to run on ammonia. Ammonia and electricity costs depend on the renewable electricity and hydrogen production costs in producing countries, while heat costs are assumed to average 0.05 USD/kWh. Input parameters can be found in Table 15 for ammonia conversion, Table 16 for an export terminal, Table 17 for ammonia shipping, Table 18 for an import terminal, and Table 19 for ammonia reconversion.
Table 15. Ammonia conversion input parameters
Value Unit Source Notes
Investment cost 2.089 [bn USD/(Mt H2/yr)] (Ikäheimo et al. 2018) Includes air separation unit and synthesis process.
Operation and maintenance costs 2.0% [% CAPEX] (Ikäheimo et al. 2018)
Electricity demand 3.627 [kWh/kg H2] (Ikäheimo et al. 2018) Operational lifetime 30 [years] (IEA 2019) Availability 7,884 [hours per year] (IEA 2019) Equivalent to 90% availability.
Table 16. Ammonia export terminal input parameters
Value Unit
Source Notes
Investment cost 1.396 [bn USD/Mt NH3] (IEA 2019) Operation and maintenance costs 4.0% [% CAPEX] (IEA 2019) Electricity demand 0.005 [kWh/kg H2] (IEA 2019) Storage 3 [days] (Mizuno et al. 2016) Boil-off rate 0% [% capacity per day] (IEA 2019) Operational lifetime 30 [years] (IEA 2019) Availability 7,884 [hours per year] (IEA 2019) Equivalent to 90% availability.
Table 17. Ammonia shipping input parameters
Value Unit Source Notes
Ship capacity 0.053 [Mt NH3] (IEA 2019) Investment cost 0.060 [bn USD per ship] (IEA 2019) Operation and maintenance costs 4.0% [% CAPEX] (IEA 2019) Boil-off rate 0.04% [% capacity per day] (Kim et al. 2020) Fuel consumption 94.575 [kg NH3/km] (Kim et al. 2020) Assumes electric propulsion using an ammonia fuel cell.
Speed 30.0 [km/h] (IEA 2019) Load/unload time 24 [hours per trip-leg] Assumption Availability 7,884 [hours per year] (IEA 2019) Equivalent to 90% availability.
Lifetime 30 [years] (IEA 2019)
Table 18. Ammonia import terminal input parameters
Value Unit Source Notes
Investment cost 1.198 [bn USD/Mt NH3] (IEA 2019) Operation and maintenance costs 4.0% [% CAPEX] (IEA 2019) Electricity demand 0.02 [kWh/kg NH3] (IEA 2019) Storage 20 [days] (Mizuno et al. 2016) Boil-off rate 0% [% capacity per day] (IEA 2019) Operational lifetime 30 [years] (IEA 2019) Availability 7,884 [hours per year] (IEA 2019) Equivalent to 90% availability.
Table 19. Ammonia reconversion input parameters*
Value Unit Source Notes
Investment cost 0.215 [bn USD/(Mt NH3/yr)] (IEA 2019) Operation and maintenance costs 4.0% [% CAPEX] (IEA 2019) Electricity demand 1.5 [kWh/kg H2] (IEA 2019) Heat demand 9.7 [kWh/kg H2] (IEA 2019) Operational lifetime 30 [years] (IEA 2019) Availability 7,884 [hours per year] (IEA 2019) Equivalent to 90% availability.
*Hydrogen recovery rate assumed 100% and heat costs assumed 0.05 USD/kWh of heat.
10.2. Renewable Hydrogen Production Cost Model
Renewable hydrogen production costs are estimated using a levelized hydrogen (LCOH) cost, which considers all costs and expected hydrogen production over an electrolysis plant’s lifetime.
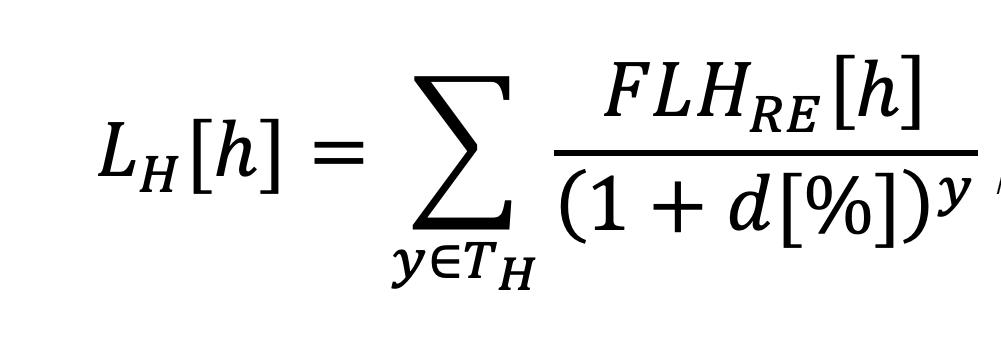
First, the levelization factor for hydrogen production LH2 is computed, which represents the hours that the electrolysis plant operates during its lifetime TH discounted over time with rate d. Co-located renewable electricity, with the same power rating as the electrolyzer, determines the number of full load hours FLHRE the plant operates at, which is dependent on each country’s wind and solar resources (see Equation 1).
Equation 1. Levelization factor for hydrogen production
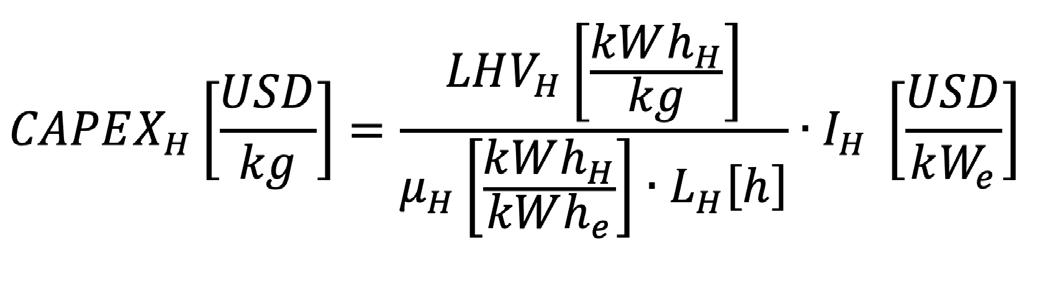
Second, capital expenditures CAPEXH were estimated by calculating the investment cost of the electrolysis plant IH for each kilogram of hydrogen produced during the plant’s lifetime, which is dependent on the levelization factor for hydrogen production LH, the electrolyzer efficiency μH, and hydrogen’s lower heating value LHVH (see Equation 2).
Equation 2. Capital expenditures of electrolysis plant
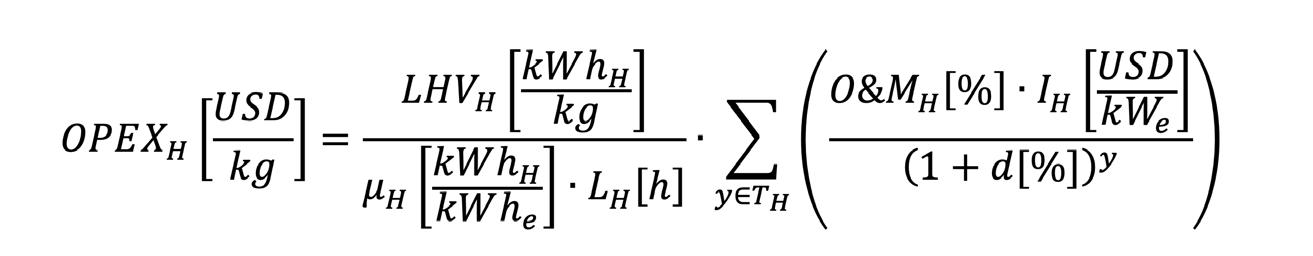
Third, operational expenditures OPEXH per kilogram of hydrogen produced were computed by estimating operation and maintenance cost O&MH as a function of investment cost IH, discount rate d, the levelization factor for hydrogen production LH, the electrolyzer efficiency μH, and hydrogen’s lower heating value LHVH (see Equation 3).
Equation 3. Operational expenditures of electrolysis plant
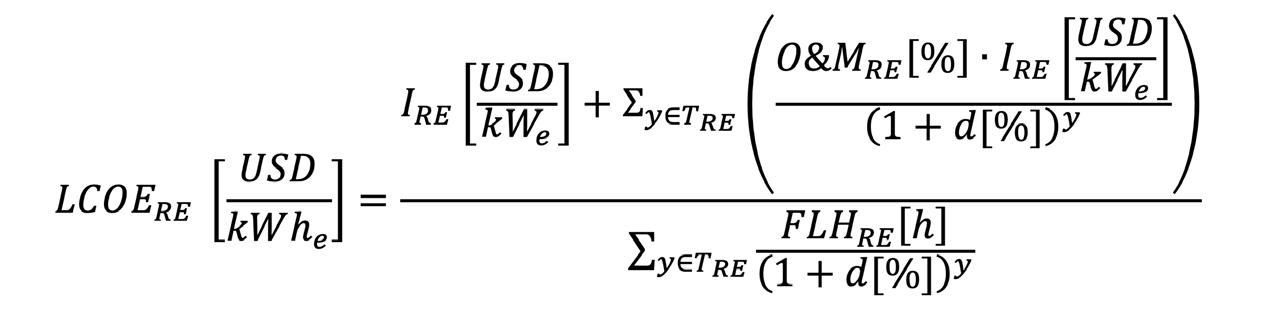
Finally, the cost of renewable electricity was estimated using the levelized cost of electricity LCOERE of the wind or solar energy resource co-located with the electrolysis plant, which depends on the investment cost of the renewable electricity plant IRE, operation and maintenance cost O&MRE, operational lifetime TRE, full load hours per year FLHRE, and discount rate d (see Equation 4).
Equation 4. Levelized cost of renewable electricity
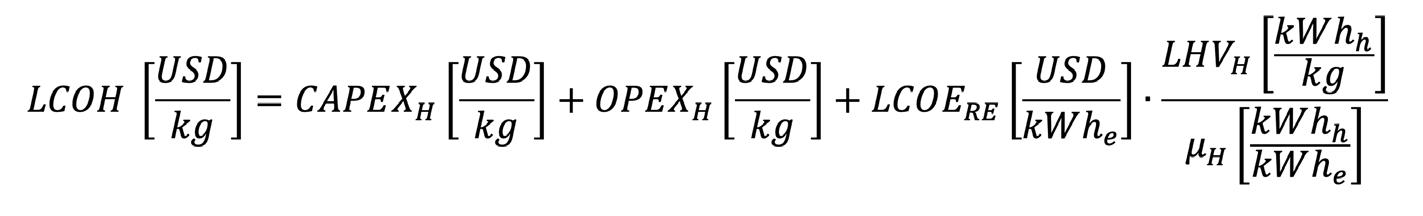
With capital and operational expenditures as well as electricity costs, the production costs of renewable hydrogen were estimated for each country’s resources following Equation 5, where the electrolyzer efficiency μH and hydrogen’s lower heating value LHVH are used to estimate renewable electricity costs per kilogram of hydrogen produced.
Equation 5. Levelized cost of hydrogen production
10.3. MIGHTY Model Overview
The Model for International Green Hydrogen Trade (MIGHTY) was developed to investigate hydrogen trades. MIGHTY is a mixed-integer linear programming (MILP) optimization model that identifies combinations of renewable hydrogen production and consumption within one country (i.e., domestic self-consumption) and international imports that minimize annual supply costs to meet demand either for one country or a group of countries (e.g., the European Union).
MIGHTY scenarios are based on demand scenarios, production, and transportation costs (see Section 10.1.4). Each producing country has an associated production cost curve and is assigned a mode of hydrogen transportation (see Section 10.4). Using these inputs, MIGHTY finds a solution that meets all selected consumer countries’ hydrogen demand at the lowest supply costs possible.
A set of constraints ensures that MIGHTY searches for viable solutions:
• a demand constraint ensures that hydrogen supply meets all consumer countries’ hydrogen demand;
• a supply constraint guarantees that producer countries do not produce more hydrogen than their renewable hydrogen potentials;
• a transportation constraint makes sure that MIGHTY solutions employ hydrogen gas pipelines by default, except for countries that need to use shipping routes (see Section 10.4);
• to avoid mathematically correct but unrealistically small hydrogen trades, another constraint requires minimum exports of 106 ,109 , and 1012 kg per year between European, regional, and long-distance producers, respectively.
Finally, MIGHTY determines pipeline diameters, the number of ships, and the scale of export and import terminals (and associated liquefaction or ammonia conversion and reconversion infrastructure), all of which depend on international hydrogen flows between countries. The model uses a
set of discrete pipeline diameter sizes based on Reuß et al. (2019)106 and a discrete number of vessels serving each shipping route that depends on how much hydrogen flows between the producing and consuming countries and their distance.
This report used the version v0.1.0 of MIGHTY formulated in Python using Pyomo and solved with Gurobi under an academic license.
10.4. Hydrogen Transportation Mode
All continental countries are assumed to have access to hydrogen pipelines. In contrast, countries in the north of Africa (Morocco, Egypt), island states (Iceland, Ireland, Malta, Cyprus), and long-distance exporters (Australia, the United States) are assumed to ship their hydrogen to the EU (see Figure 23). Distances between countries are computed based on their geographical centers.
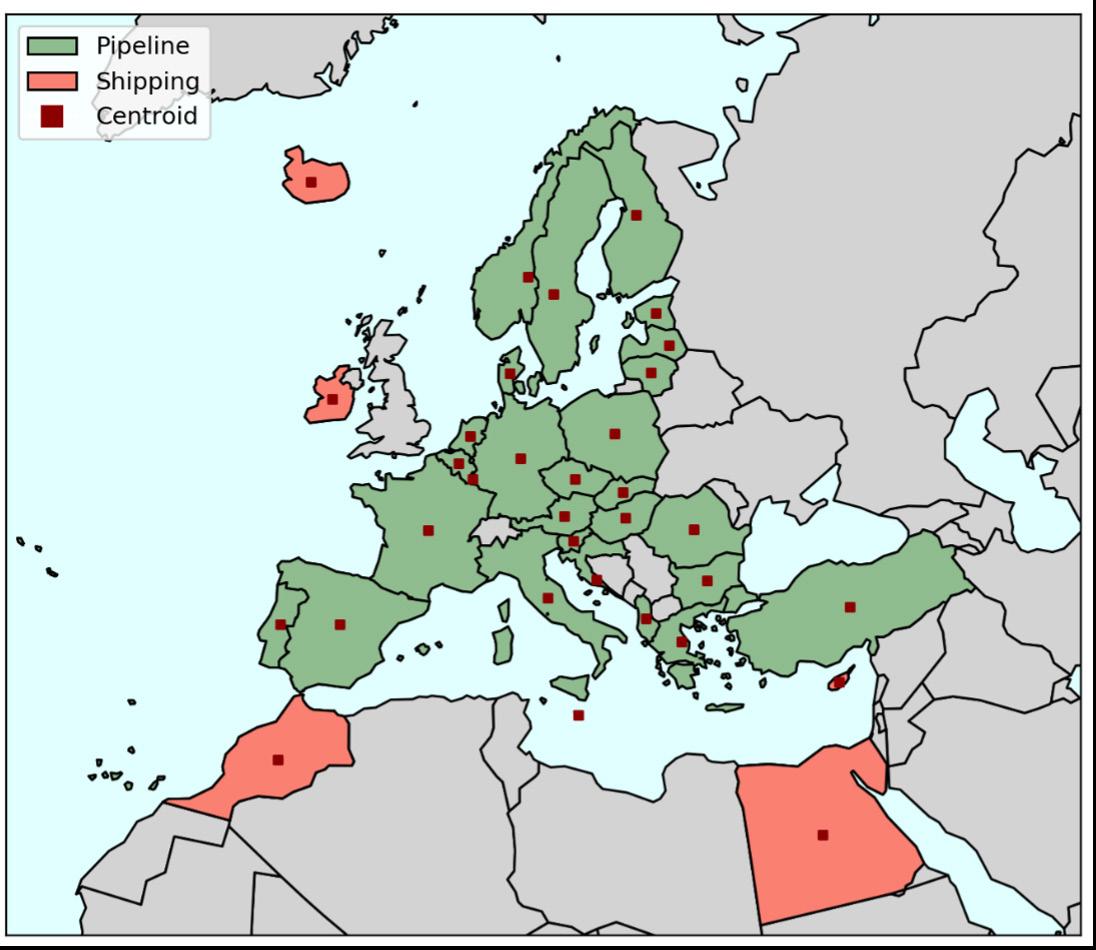
Figure 23. Hydrogen transport mode and centroid per country Source: authors’ analysis
106 Reuß et al. (2019) “Modeling Hydrogen Networks for Future Energy Systems: A Comparison of Linear and Nonlinear Approaches,” International Journal of Hydrogen Energy, 44(60), pp. 32136-32150. https://doi. org/10.1016/j.ijhydene.2019.10.080
10.5. Sensitivity Analysis Inputs
For the sensitivity analysis, all three scenarios were simulated under 16 different combinations of input parameters in which key economic parameters were increased or reduced by 50% (see Table 20). Renewable electricity resources have been extensively studied in the past and therefore there is abundant data about their availability in different countries. Thus, the main uncertainties around future renewable hydrogen production costs arise from the evolution of technology costs rather than resource potentials, which warrants the focus on capital costs (represented by a discount rate) and investment costs in the sensitivity analysis.
Table 20. Sensitivity analysis inputs
Variable Lower value Reference Higher value
Discount rate [%] 4% 8% 12%
Solar investment cost [USD/kW] 204 407
611 Onshore wind investment cost [USD/kW] 637 1,273 1,910 Offshore wind investment cost [USD/kW] 860 1,720 2,580 Electrolyzer investment cost [USD/kW] 225 450 675 Pipeline investment cost [USD/m] (D = pipe diameter [m]) 1,600•D2+ 239.45•D+ 131.6 3,200•D2+ 478.9•D+ 263.2 4,800•D2+ 718.35•D+ 394.8
Liquefied hydrogen Ship [bn USD per ship] Liquefaction [bn USD/(Mt H2/yr)] Export terminal [bn USD/Mt H2] Import terminal [bn USD/Mt H2] Liquid hydrogen evaporation [bn USD/(Mt H2/yr)] Ammonia Ship [bn USD per ship] Synthesis [bn USD/(Mt H2/yr)] Export terminal [bn USD/Mt NH3] Import terminal [bn USD/Mt NH3] Reconversion [bn USD/(Mt NH3/yr)] 0.103 1.347
22.728
22.536
0.004
0.030 1.045
0.698
0.599
0.108 0.206 2.693
45.455
45.071
0.008
0.060 2.089
1.396
1.198
0.215 0.309 4.040
68.183
67.607
0.012
0.090 3.134
2.094
1.797
0.323
11. References
Andreola, S, Menos-Aikateriniadis, C, Paxton, A, Preißler, H, Miehling, H, Rehn, M, Sarsfield-Hall, R, Unger, B, Flis, G, Deutsch, M (2021) “No-Regret Hydrogen: Charting Early Steps for H₂ Infrastructure in Europe,” AFRY Management Consulting for Agora Energiewende, https://www.agora-energiewende.de/en/publications/noregret-hydrogen/
Argus Media (2020) “Global Ammonia Trade to Recover in 2021,” Argus Media News, 11 November 2020, accessed 20 September 2021, https://www.argusmedia.com/en/news/2158915-global-ammonia-trade-torecover-in-2021
Bauer, C, Treyer, K, Antonini, C, Bergerson, J, Gazzani, M, Gençer, E, Gibbins, J, Mazzotti, M, McCoy, S, McKenna, R, Pietzcker, R, Ravikumar, A, Carmelo Romano, M, Ueckerdt, F, Vente, J, Van der Spek, M (2021) “On the Climate Impacts of Blue Hydrogen Production,” Sustainable Energy & Fuels, https://doi.org/10.1039/D1SE01508G
Baufumé, S, Grüger, F, Grube, T, Krieg, D, Linssen, J, Weber, M, Hake, JF, Stolten, D (2013) “GIS-Based Scenario Calculations for a Nationwide German Hydrogen Pipeline Infrastructure,” International Journal of Hydrogen Energy, 38(10), pp. 3813–3829. https://doi.org/10.1016/j.ijhydene.2012.12.147
Blanco, H, Nijs, W, Ruf, J, Faaij, A (2018) “Potential for Hydrogen and Power-to-Liquid in a Low-Carbon EU Energy System Using Cost Optimization,” Applied Energy, 232(June), pp. 617–639. https://doi.org/10.1016/j. apenergy.2018.09.216 BloombergNEF (BNEF) (2020) “New Energy Outlook 2020,” October 2020, https://about.bnef.com/newenergy-outlook-2020/
Böhm, H, Zauner, A, Rosenfeld, DC, Tichler, R (2020) “Projecting Cost Development for Future Large-Scale Power-to-Gas Implementations by Scaling Effects,” Applied Energy, 264(March), pp. 114780. https://doi. org/10.1016/j.apenergy.2020.114780 BP (2020) “Statistical Review of World Energy,” accessed 1 December 2020 https://www.bp.com/en/global/ corporate/energy-economics/statistical-review-of-world-energy.html
Brändle, G, Schönfisch, M, Schulte, S (2021) “Estimating Long-Term Global Supply Costs for Low-Carbon Hydrogen,” Applied Energy, 302(20), pp. 117481. https://doi.org/10.1016/j.apenergy.2021.117481
Brooks, C (2021) “The Netherlands to Refit Natural Gas Network for Pure Hydrogen’, IHS Markit, Net-Zero Business Daily News Research & Analysis, 23 July 2021, accessed 20 September 2021. https://ihsmarkit.com/ research-analysis/the-netherlands-to-refit-borderstraddling-natural-gas-grid-for.html
Cerniauskas, S, Jose Chavez Junco, A, Grube, T, Robinius, M, Stolten, D (2020) “Options of Natural Gas Pipeline Reassignment for Hydrogen: Cost Assessment for a Germany Case Study,” International Journal of Hydrogen Energy, 45(21), pp. 12095–12107. https://doi.org/10.1016/j.ijhydene.2020.02.121
Creutzig, F, Agoston, P, Goldschmidt, JC, Luderer, G, Nemet, G, Pietzcker, RC (2017) “The Underestimated Potential of Solar Energy to Mitigate Climate Change,” Nature Energy, 2(9). https://doi.org/10.1038/ nenergy.2017.140
Davis, SJ, Lewis, NS, Shaner, M, Aggarwal, S, Arent, D, Azevedo, IL, Benson, SM, Bradley, T, Brouwer, J, Chiang, YM, Clack, CTM, Cohen, A, Doig, S, Edmonds, J, Fennell, P, Field, CB, Hannegan, B, Hodge, BM, Hoffert, MI, Ingersoll, E, Jaramillo, P, Lackner, KS, Mach, KJ, Mastrandrea, M, Ogden, J, Peterson, PF, Sanchez, DL, Sperling, D, Stagner, J, Trancik, JE, Yang, CJ, Caldeira, K (2018) “Net-Zero Emissions Energy Systems,” Science, 360(6396). https://doi.org/10.1126/science.aas9793
De Blasio, N, Hua, C (2021) “The Role of Blockchain in Green Hydrogen Value Chains,” Policy Brief, November 2021. https://www.belfercenter.org/publication/role-blockchain-green-hydrogen-value-chains
De Blasio, N, Nuñez-Jimenez, A (2020) “Will Renewable Hydrogen Help Unite Europe?” Agenda Pública – El País, 10 November 2020. https://www.belfercenter.org/publication/will-renewable-hydrogen-help-unite-europe
Dos Reis, PC (2021) “Hydrogen Demand: Several Uses but Significant Uncertainty,” European University Institute Florence School of Regulation, 18 January 2020. https://fsr.eui.eu/hydrogen-demand-several-uses-butsignificant-uncertainty/
Egli, F, Steffen, B, Schmidt, TS (2019) “Bias in Energy System Models with Uniform Cost of Capital Assumption,” Nature Communications, 10(1), pp.1-3. https://doi.org/10.1038/s41467-019-12468-z El-Emam, RS, Özcan, H (2019) “Comprehensive Review on the Techno-Economics of Sustainable Large-Scale Clean Hydrogen Production,” Journal of Cleaner Production, 220, pp. 593–609. https://doi.org/10.1016/j. jclepro.2019.01.309
Energy and Climate Intelligence Unit (2021), “Net Zero Emissions Race,” Net Zero Tracker, accessed 20 September 2021 https://eciu.net/netzerotracker
EU Joint Research Center (JRC) (2019) “Hydrogen Use in EU Decarbonization Scenarios,” EU Science Hub, last update 9 July 2020, accessed 20 September 2021, JRC116452. https://web.archive.org/web/20201214082537/ https://ec.europa.eu/jrc/sites/jrcsh/files/final_insights_into_hydrogen_use_public_version.pdf
Eurek, K, Sullivan, P, Gleason, M, Hettinger, D, Heimiller, D, Lopez, A (2017) “An Improved Global Wind Resource Estimate for Integrated Assessment Models,” Energy Economics, 64(February), pp. 552–567. https://doi. org/10.1016/j.eneco.2016.11.015 European Commission (EC) (2009) “Council Directive 2009/119/EC of 14 September 2009 Imposing an Obligation on Member States to Maintain Minimum Stocks of Crude Oil and/or Petroleum Products,” last amendment 1 January 2020. https://eur-lex.europa.eu/legal-content/EN/ TXT/?uri=CELEX:02009L0119-20200101
European Commission (EC) (2020) “A Hydrogen Strategy for a Climate-Neutral Europe,” COM(2020) 301 final, 8 July 2020. https://eur-lex.europa.eu/legal-content/EN/TXT/?uri=CELEX:52020DC0301
European Commission (EC) (2021) “Proposal for a Directive of the European Parliament and of the Council Amending Directive (EU) 2018/2001 of the European Parliament and of the Council, Regulation (EU) 2018/1999 of the European Parliament and of the Council and Directive 98/70/EC of the European Parliament and of the Council as Regards the Promotion of Energy from Renewable Sources, and Repealing Council Directive (EU) 2015/652,” 14 July 2021. https://ec.europa.eu/info/sites/default/files/amendment-renewable-energy-directive2030-climate-target-with-annexes_en.pdf
Eurostat (2020) “Coal Production and Consumption Statistics,” last edited 3 August 2021, accessed 20 September 2021. https://ec.europa.eu/eurostat/statistics-explained/index.php?title=Coal_production_and_ consumption_statistics
Eurostat (2020) “Natural Gas Supply Statistics,” last edited on 20 July 2021, accessed 20 September 2021. https://ec.europa.eu/eurostat/statistics-explained/index.php?title=Natural_gas_supply_statistics Fasihi, M, Weiss, R, Savolainen, J, Breyer, C (2021) “Global Potential of Green Ammonia Based on Hybrid PV-Wind Power Plants,” Applied Energy, 294(October), p. 116170. https://doi.org/10.1016/j.apenergy.2020.116170 Fuel Cell and Hydrogen Observatory (FCHO) (2020) “Hydrogen Molecule Market,” FCHO Reports, https://www. fchobservatory.eu/sites/default/files/reports/Chapter_2_Hydrogen_Molecule_Market_070920.pdf Glenk, G, Reichelstein, S (2019) “Economics of Converting Renewable Power to Hydrogen,” Nature Energy. Springer US, 4(3), pp. 216–222. https://doi.org/10.1038/s41560-019-0326-1
Hampp, J, Düren, M, Brown, T (2021) “Import Options for Chemical Energy Carriers from Renewable Sources to Germany,” Physics and Society arXiv, Cornell University. http://arxiv.org/abs/2107.01092. This content is a preprint and has not been peer-reviewed.
Heuser, PM, Grube, T, Heinrichs, H, Robinius, M, Stolten, D (2020) “Worldwide Hydrogen Provision Scheme Based on Renewable Energy,” Energy and Fuel Technology Preprints, February 2020, pp. 1–27. https://www. preprints.org/manuscript/202002.0100/v1. This content is a preprint and has not been peer-reviewed.
Honnery, D, Moriarty, P (2009) “Estimating Global Hydrogen Production from Wind,” International Journal of Hydrogen Energy, 34(2), pp. 727–736. https://doi.org/10.1016/j.ijhydene.2008.11.001
Howarth, RW, Jacobson, MZ (2021) “How Green Is Blue Hydrogen?” Energy Science and Engineering, (July), pp. 1–12. https://doi.org/10.1002/ese3.956
Hydrogen Council (2021) “Hydrogen Decarbonization Pathways: A Life-Cycle Assessment,” January 2021, https://hydrogencouncil.com/wp-content/uploads/2021/01/Hydrogen-Council-Report_DecarbonizationPathways_Part-1-Lifecycle-Assessment.pdf Hydrogen Council (2021) “Hydrogen Insights – Executive Summary,” July 2021, https://hydrogencouncil.com/ wp-content/uploads/2021/07/Hydrogen-Insights-July-2021-Executive-summary.pdf
Ikäheimo, J, Kiviluoma, J, Weiss, R, Holttinen, H (2018) ‘Power-to-Ammonia in Future North European 100% Renewable Power and Heat System,” International Journal of Hydrogen Energy, 43(36), pp. 17295–17308. https://doi.org/10.1016/j.ijhydene.2018.06.121 International Energy Agency (IEA) (2019) The Future of Hydrogen, June 2019, https://www.iea.org/reports/thefuture-of-hydrogen International Energy Agency (IEA) (2020) World Energy Outlook 2020, October 2020, https://www.iea.org/ reports/world-energy-outlook-2020 International Energy Agency (IEA) (2020), World Energy Investment 2020, May 2020, https://www.iea.org/ reports/world-energy-investment-2020
International Renewable Energy Agency (IRENA) (2020) Global Renewables Outlook: Energy Transformation 2050, April 2020, https://irena.org/publications/2020/Apr/Global-Renewables-Outlook-2020
International Renewable Energy Agency (IRENA) (2020) Green Hydrogen Cost Reduction, December 2020, https://www.irena.org/publications/2020/Dec/Green-hydrogen-cost-reduction
International Renewable Energy Agency (IRENA) (2021) Renewable Power Generation Costs in 2020, June 2021, https://www.irena.org/publications/2021/Jun/Renewable-Power-Costs-in-2020
Jensterle, M, Narita, J, Piria, R, Schröder, J, Steinbacher, K, Wahabzada, F, Zeller, T, Crone, K, Löchle, S (2019) “Green Hydrogen: International Cooperation Potential for Germany [in German in the original],” adelphi, dena, GIZ and Navigant for the Federal Ministry for Economic Affairs and Energy (BMWi) [of Germany]. https:// www.adelphi.de/de/publikation/gr%C3%BCner-wasserstoff-internationale-kooperationspotenziale-f%C3%BCrdeutschland
Kakoulaki, G, Kougias, I, Taylor, N, Dolci, F, Moya, J, Jäger-Waldau, A (2021) “Green Hydrogen in Europe – A Regional Assessment: Substituting Existing Production with Electrolysis Powered by Renewables,” Energy Conversion and Management, Vol. 228, Jan. 2021, pp. 113649, https://doi.org/10.1016/j.enconman.2020.113649
Kawasaki Heavy Industries (2019) “World’s First Liquefied Hydrogen Carrier SUISO FRONTIER Launches Building an International Hydrogen Energy Supply Chain Aimed at Carbon-free Society,” Kawasaki Newsroom, 11 December 2019, accessed 20 September 2021. https://global.kawasaki.com/en/corp/newsroom/news/ detail/?f=20191211_3487 Kawasaki Heavy Industries (2020) “Kawasaki Completes World’s First Liquefied Hydrogen Receiving Terminal Kobe LH2 Terminal (Hy touch Kobe),” Kawasaki Newsroom, 3 December 2020, https://global.kawasaki.com/en/ corp/newsroom/news/detail/?f=20201203_2378
Kim, K, Roh, G, Kim, W, Chun, K (2020) “A Preliminary Study on an Alternative Ship Propulsion System Fueled by Ammonia: Environmental and Economic Assessments,” Journal of Marine Science and Engineering, 8(3), pp. 183. https://doi.org/10.3390/jmse8030183
Lilliestam, J, Labordena, M, Patt, A, Pfenninger, S (2017) “Empirically Observed Learning Rates for Concentrating Solar Power and Their Responses to Regime Change,” Nature Energy, 2(7), 17094. https://doi. org/10.1038/nenergy.2017.94
Lux, B, Pfluger, B (2020) “A Supply Curve of Electricity-Based Hydrogen in a Decarbonized European Energy System in 2050,” Applied Energy, 269(May), p. 115011. https://doi.org/10.1016/j.apenergy.2020.115011
Melaina, MW, Antonia, O, Penev, M (2013) “Blending Hydrogen into Natural Gas Pipeline Networks: A Review of Key Issues,” National Renewable Energy Laboratory, NREL TP-5600-51995, https://www.nrel.gov/docs/ fy13osti/51995.pdf
Mizuno, Y. et al. (2017) “Economic Analysis on International Hydrogen Energy Carrier Supply Chains,” Journal of Japan Society of Energy and Resources, 38(3), pp. 11–17. https://doi.org/10.24778/jjser.38.3_11 Pflugmann, F, De Blasio, N (2020) Geopolitical and Market Implications of Renewable Hydrogen: New Dependencies in a Low-Carbon Energy World, Belfer Center for Science and International Affairs, Harvard Kennedy School of Government, March 2020, https://www.belfercenter.org/publication/geopolitical-andmarket-implications-renewable-hydrogen-new-dependencies-low-carbon
Pflugmann, F, De Blasio, N (2020) “The Geopolitics of Renewable Hydrogen in Low-Carbon Energy Markets,” Geopolitics, History, and International Relations, 12(1), pp. 9–44. https://www.ceeol.com/search/articledetail?id=877414
Pietzcker, RC, Stetter, D, Manger, S, Luderer, G (2014) “Using the Sun to Decarbonize the Power Sector: The Economic Potential of Photovoltaics and Concentrating Solar Power,” Applied Energy, 135(December), pp. 704720. https://doi.org/10.1016/j.apenergy.2014.08.011
Reuß, M, Grube, T, Robinius, M, Preuster, P, Wasserscheid, P, Stolten, D (2017) “Seasonal Storage and Alternative Carriers: A Flexible Hydrogen Supply Chain Model,” Applied Energy, 200, pp. 290–302. https://doi.org/10.1016/j. apenergy.2017.05.050
Reuß, M, Welder, L, Thürauf, J, Linßen, J, Grube, T, Schewe, L, Schmidt, M, Stolten, D, Robinius, M (2019) “Modeling Hydrogen Networks for Future Energy Systems: A Comparison of Linear and Nonlinear Approaches,” International Journal of Hydrogen Energy, 44(60), pp.32136-32150. https://doi.org/10.1016/j.ijhydene.2019.10.080
Samsatli, S, Staffell, I, Samsatli, NJ (2016) “Optimal Design and Operation of Integrated Wind-HydrogenElectricity Networks for Decarbonising the Domestic Transport Sector in Great Britain,” International Journal of Hydrogen Energy, 41(1), pp. 447–475. https://doi.org/10.1016/j.ijhydene.2015.10.032
Tezel, G, Hensgens, R (2021) Hyway 27: Hydrogen Transmission Using the Existing Natural Gas Grid? Final Report For the Ministry of Economic Affairs and Climate Policy [of the Netherlands], strategy&, PwC for Gasunie, June 2021, https://www.hyway27.nl/en/latest-news/hyway-27-realisation-of-a-national-hydrogen-network/$274
United Nations Food and Agriculture Organization (UN FAO) (2020) AQUASTAT Core Database, Food and Agriculture Organization of the United Nations, accessed 1 December 2020, http://www.fao.org/aquastat/en/ databases/maindatabase/
United States Department of Energy (US DOE) (2021) “Secretary Granholm Launches Hydrogen Energy Earthshot to Accelerate Breakthroughs Toward a Net-Zero Economy,” US DOE articles, 7 June 2021, https:// www.energy.gov/articles/secretary-granholm-launches-hydrogen-energy-earthshot-accelerate-breakthroughstoward-net
Van de Graaf, T, Overland, I, Scholten, D, Westphal, K (2020) “The New Oil? The Geopolitics and International Governance Of Hydrogen,” Energy Research and Social Science, 70(June), p. 101667. https://doi.org/10.1016/j. erss.2020.101667
Velazquez Abad, A, Dodds, PE (2020) “Green Hydrogen Characterisation Initiatives: Definitions, Standards, Guarantees of Origin, and Challenges,” Energy Policy, 138(August 2019), p. 111300. https://doi.org/10.1016/j. enpol.2020.111300
Wang, A, van der Leun, K, Peters, D, Buseman, M (2020) European Hydrogen Backbone: How a Dedicated Hydrogen Infrastructure Can Be Created, Guidehouse for Enagás, Energinet, Fluxys Belgium, Gasunie, GRTgaz, NET4GAS, OGE, ONTRAS, Snam, Swedegas, Teréga, July 2020, https://guidehouse.com/-/media/www/site/ downloads/energy/2020/gh_european-hydrogen-backbone_report.pdf Welder, L, Ryberg, DS, Kotzur, L, Grube, T, Robinius, M, Stolten, D (2018) “Spatio-Temporal Optimization of a Future Energy System for Power-to-Hydrogen Applications in Germany,” Energy, 158, pp. 1130–1149. https://doi. org/10.1016/j.energy.2018.05.059
World Economic Forum (WEF) (2019) World Economic Forum’s 2019 Global Competitiveness Report. World Energy Council (WEC) (2020) International Hydrogen Strategies: A Study Commissioned by and in Cooperation with the World Energy Council Germany, September 2020, https://www.weltenergierat.de/wpcontent/uploads/2020/10/WEC_H2_Strategies_finalreport.pdf
Environment and Natural Resources Program
Belfer Center for Science and International Affairs Harvard Kennedy School 79 JFK Street Cambridge, MA 02138
www.belfercenter.org/ENRP