GDP/Gross Domestic Product is a yardstick that measures the total output of a state’s economy for a givenyear

GDP/Gross Domestic Product is a yardstick that measures the total output of a state’s economy for a givenyear
• For 2022, NORTH CAROLINA real GDP is expected to increase by 3.4 percent over the 2021 level.
• Nine of the state’s 15 economic sectors are expected to experience output increases during 2022. The sectors with the strongest expected growth rates are mining with a real increase of 30.1 percent, agriculture with a real increase of 26.7 percent, business and professional services with a real increase of 11.2 percent, information with a real increase of 10.4 percent, hospitality and leisure services with a real increase of 8.8 percent, education and health services with a real increase of 5.5 percent, and government with a real increase of 7.9 percent.
• For 2022, NORTH CAROLINA establishments are expected to add 181,300 net jobs during the year, an increase of 3.9 percent.
• For 2023, NORTH CAROLINA real GDP is forecast to increase by 1.2 percent over the 2022 level.
• Twelve of the state’s economic sectors are expected to experience output increases during 2023. The sectors with the strongest growth rates are agriculture with a real increase rate of 3.1 percent, mining with a real increase of 3.1 percent, hospitality and leisure services with a real increase of 2.8 percent, other services with a real increase of 2.6 percent, business and professional services with a real increase of 2.5 percent, information with a real increase of 1.9 percent, and educational and health services with a real increase of 1.4 percent
• For 2023, NORTH CAROLINA establishments are forecast to add 72,800 net jobs, an increase of 1.5 percent.
• By December of 2022, the state’s unemployment rate is expected to drop slightly to 3.6 percent.
Current Dollars
Total Gross Product
Constant (2012 Dollars)
Total Gross Product Agricultural Mining Construction Manufacturing Durable Goods Nondurable Goods TWU Wholesale Trade Retail Trade Information FIRE B & P E & H H & L Other Services Government
701,897.8 562,512.3 6,837.0 1330.7 18,045.4 86,007.5 40,652.7 45,354.8 20,965.4 32,946.0 30,154.7 30,758.8 102,379.7 86,633.7 46,801.5 19,792.3 10,554.3 70,310.2
2022* Percent Change 9.7 3.4 26.7 30.1 -7.4 -3.4 -4.4 -2.4 3.5 -0.1 -2.2 10.4 -0.2 11.2 5.5 8.8 4.8 7.9
Gross Domestic Product (GDP) is forecast to reach a level of $701,897.8 million in 2022. Real (inflation-adjusted) GDP is expected to increase by 3.4 percent over the 2021 level. This growth in 2022 will represent the second full year of growth since COVID-19.
For 2022, first quarter GDP increased by an annualized real rate of 2.8 percent. During the second quarter, GDP decreased by an annualized real rate of 0.4 percent. In the third quarter, GDP is expected to increase by an annualized real rate of 0.7 percent. In the fourth quarter of 2022, GDP is expected to increase by an annualized real rate of 0.9 percent.
For 2022, there are two big stories playing out over the year. First is the first and second quarter declines U.S. GDP. In the first and second quarters of 2022, U.S. GDP declined by 1.6 and 0.6 percent, while North Carolina real GDP bucked the national trend by increasing in the first quarter by 2.8 percent and decreasing in the second quarter by only 0.4 percent. The decline in U.S. GDP occurred because of the emergence of the Omicron variant in the first quarter but continued on through the second quarter as supply chain problems persisted in many sectors of the economy. The second big issue is the impact that inflation has had and is continuing to have on both the U.S. and North Carolina’s economy. This problem is compounded by Federal Reserve policy of rapidly raising interest rates. Inflation is having a serious impact on real GDP growth. For example, in the first and second quarters of 2022 current dollar GDP increased by 6.6 and 8.4 percent. So, while consumers and businesses spent 6.6 and 8.4 percent more on goods and services during the first and second quarters, because of inflation that increase in current dollar spending resulted in a decline of actual goods and services delivered.
In addition to inflation, the first and second quarters experienced an unprecedented decline in productivity. During the first quarter of 2022, labor productivity declined by 5.1 percent. In the second quarter, labor productivity declined by 4.1 percent. This decline is a serious issue as the U.S. economy has never experienced a two quarter productivity decline of this magnitude.
1.2
2022 Total Real GDP Growth 3.4% 0.2 3.7 7.2 8.1
Mining 30.1 Agriculture 26.7
TWU 3.5
3.2 5.9 5.4 3.5 12.3
Construction -7.4
Durables -4.4
18.2 15.4 8.3 1.9
Nondurables -2.4
The chart to the left presents the projected contributions of each major economic sector to North Carolina’s Gross Domestic Product (GDP). The real (inflation-adjusted) growth rate for 2022 is forecast to increase by 3.4 percent. Projected real growth rates for each sector (displayed in black type) are plotted on the horizontal axis. Projected percentages of GDP contributed by each sector (displayed in green type) are plotted on the vertical axis. The resulting rectangles show the expected weighted importance of each sector’s growth during 2022. All of the sector information presented in the table to the left is based on the new North American Industry Classification System (NAICS) definitions.
Wholesale Trade -0.1 Retail Trade -2.2
Information 10.4
FIRE -0.2
5.5 B&P Services 11.2 E&H Services 5.5 H&L Services 8.8 Other Services 4.8 Government 7.9
Nine of the state’s 15 economic sectors are expected to experience output increases during 2022. The sectors with the strongest expected growth rates are mining with a real increase of 30.1 percent; agriculture with a real increase of 26.7 percent; business and professional services with a real increase of 11.2 percent; information with a real increase of 10.4 percent; hospitality and leisure services with a real increase of 8.8 percent; education and health services with a real increase of 5.5 percent; government with a real increase of 7.9 percent, other services with a real increase of 4.8 percent; and transportation, warehousing, and utilities (TWU) with a real increase of 3.5 percent.
Six sectors are expected to decline in 2022, these sectors are wholesale trade with a decrease of 0.1 percent; finance, insurance, and real estate (FIRE) with a decrease of 0.2 percent; retail trade with a decrease of 2.2 percent; nondurable goods manufacturing with a decrease of 2.4 percent; durable goods manufacturing with a decrease of 4.4 percent; and construction with decrease by 7.4 percent.
Gross Domestic Product (GDP) is forecast to reach a level of $753,169.4 million in 2023. Real (inflation-adjusted) GDP is expected to increase by 1.2 percent over the 2022 level. This growth in 2023 will represent the third full year of growth since COVID-19.
For 2023, first quarter GDP is expected to increase by an annualized real rate of 1.1 percent. During the second quarter, GDP is expected to increase by an annualized real rate of 1.8 percent. In the third quarter, GDP is expected to increase by an annualized real rate of 1.7 percent. In the fourth quarter of 2023, GDP is expected to increase by an annualized real rate of 1.8 percent.
Current Dollars
Total Gross Product
Constant (2012 Dollars)
Total Gross Product Agricultural Mining Construction Manufacturing Durable Goods Nondurable Goods TWU Wholesale Trade Retail Trade Information FIRE B & P E & H H & L Other Services Government
2023* Percent Change 7.3 1.2 3.1 3.1 -1.4 -0.3 0.8 -1.4 1.0 -0.2 0.5 1.9 1.4 2.5 1.4 2.8 2.6 1.4 * Millions of dollars
753,169.4 569,146.8 7,052.1 1,372.3 17,791.3 85,710.3 40,984.4 44,725.9 21,177.0 32,876.3 30,299.4 31,329.0 103,804.1 88,782.4 47,466.6 20,341.2 10,833.6 70,310.2
The big question in 2023 is, “will the U.S. economy slip into a recession?” The answer is clearly uncertain at this time. During the first and second quarters of 2022 U.S. GDP declined and may suggest that is an indication that the U.S. economy is in recession. However, the two quarter decline in real GDP is only a rule of thumb. It is neither necessary or sufficient in indicating that we are in recession. While GDP is declining we are also seeing tremendous strength in the labor markets. Through October of 2022, the U.S. economy added 4,068,000 net jobs and North Carolina added 153,900 jobs through September of 2022. The National Bureau of Economic Research is the accepted expert on business cycle dating (recessions). The NBER's traditional definition of a recession is that it is a significant decline in economic activity that is spread across the economy and that lasts more than a few months. The current labor market strength makes it difficult to believe we are in a recession at this time.
So are we in for a recession in 2023? That depends almost entirely on what the Federal Reserve does during the first quarter of 2023. The FED meets one more time this year in December. The Fed Funds Rate target is currently between 3.75 and 4.00 percent. If we get another 75 basis point increase in December, the target rate by the end of 2022 will be 4.50 to 4.75 percent, which will have a significant impact on the economy in 2023.
The chart to the left presents the projected contributions of each major economic sector to North Carolina’s Gross Domestic Product (GDP). The real (inflation-adjusted) growth rate for 2023 is projected to increase 1.2 percent. Real growth rates for each sector (displayed in black type) are plotted on the horizontal axis. Percentages of GDP contributed by each sector (displayed in green type) are plotted on the vertical axis. The resulting rectangles show the weighted importance of each sector’s growth during 2023. All of the sector information presented in the table to the left is based on the new North American Industry Classification System (NAICS) definitions.
Twelve of the state’s economic sectors are expected to experience output increases during 2023. The sectors with the strongest growth rates are agriculture with a real increase rate of 3.1 percent; mining with a real increase of 3.1 percent; hospitality and leisure services with a real increase of 2.8 percent; other services with a real increase of 2.6 percent; business and professional services with a real increase of 2.5 percent; information with a real increase of 1.9 percent; educational and health services with a real increase of 1.4 percent; government with a real increase of 1.4 percent; and finance, insurance, and real estate (FIRE) with a real increase of 1.4 percent.
Three other sectors are expected to experience growth rates, at levels below the overall 1.2 percent GDP real growth rate. These sectors are transportation, warehousing, and utilities (TWU) with a real increase of 1.0 percent; durable goods manufacturing with a real increase of 0.8 percent; and retail trade with a real increase of 0.5 percent.
Three sectors are expected to experience declines during 2023. These sectors are wholesale trade with a decrease of 0.2 percent, nondurable goods manufacturing with a decrease of 1.4 percent, and construction with a decrease of 1.4 percent.
0.1 5.2 4.5 4.1
Mining 3.6
Construction 4.3
Durables 1.4 Wholesale Trade 4.4
1.7
15.3 13.7 3.5
Retail Trade -0.5
The sector employment analysis presented on this page is based on the new North American Industrial Classification System (NAICS). North Carolina employment is expected to reach 4,837,400 persons by December 2022, a 3.9 percent increase over the December 2021 employment level. The state is expected to add 181,300 net jobs in 2022.
TWU 1.9
Nondurables 3.7 FIRE 4.2
Information 5.9 B&P Services 7.5 E&H Services 4.2 H&L Services 8.3
5.9 Other Services 3.5
5.3 10.6 4.1 10.8 15.0 Government 1.4
Thirteen of the state’s 14 nonagricultural sectors of the economy are expected to experience employment increases during 2022. The sectors with the strongest expected employment increases in 2022 are hospitality and leisure services at 8.3 percent and business and professional services at 7.5 percent.
Total Establishment Employment Mining Construction Manufacturing Durable Goods Nondurable Goods Wholesale Trade Retail Trade
TWU Information FIRE B&P Services E&H Services H&L Services Other Services Government
Percent of Sector Employment Growth
Year-End* Percent Change 3.9 3.6 4.3 2.5 1.4 3.7 4.4 -0.5 1.9 5.9 4.2 7.5 4.2 8.3 3.5 1.4 *thousands of persons
4,837.4 5.7 249.3 477.3 258.8 218.8 200.7 511.1 198.4 84.5 286.5 742.5 661.0 523.0 171.7 725.9
0.1 5.2 4.5 4.2
Mining 0.0
Construction 1.8
Durables 1.3 Wholesale Trade 3.0
1.8
15.4 13.6 3.6
The sector employment analysis presented on this page is based on the new North American Industrial Classification System (NAICS). North Carolina employment is expected to reach 4,910,200 persons by December 2023, a 1.5 percent increase over the December 2022 employment level. The state is expected to add 72,800 net jobs in 2023.
Retail Trade 0.6
TWU 1.2
Nondurables 1.6 FIRE 1.0
Information 5.7 B&P Services 1.6 E&H Services 0.9 H&L Services 2.4
5.9 Other Services 3.6
5.3 10.5 4.1 10.9 14.9 Government 0.8
All 14 of the state’s nonagricultural sectors of the economy are expected to experience employment increases during 2023. The sectors with the strongest employment increases in 2023 are information at 5.7 percent, and other services at 3.6 percent.
Total Establishment Employment Mining Construction Manufacturing Durable Goods Nondurable Goods Wholesale Trade Retail Trade
TWU Information FIRE B&P Services E&H Services H&L Services Other Services Government
Percent of Sector Employment Growth
Year-End* Percent Change 1.5 0.0 1.8 1.5 1.3 1.6 3.0 0.6 1.2 5.7 1.0 1.6 0.9 2.4 3.6 0.8 *thousands of persons
4,910.2 5.7 253.8 484.2 262.1 222.1 206.7 514.1 200.8 89.3 289.5 754.5 667.0 535.0 177.9 731.9
FORECAST reports historical seasonally adjusted monthly unemployment rates for North Carolina and the United States and forecasts the seasonally adjusted monthly unemployment rate for North Carolina. The seasonal adjustment accounts for variations in labor market conditions that cause regular fluctuations in the unemployment level each month.
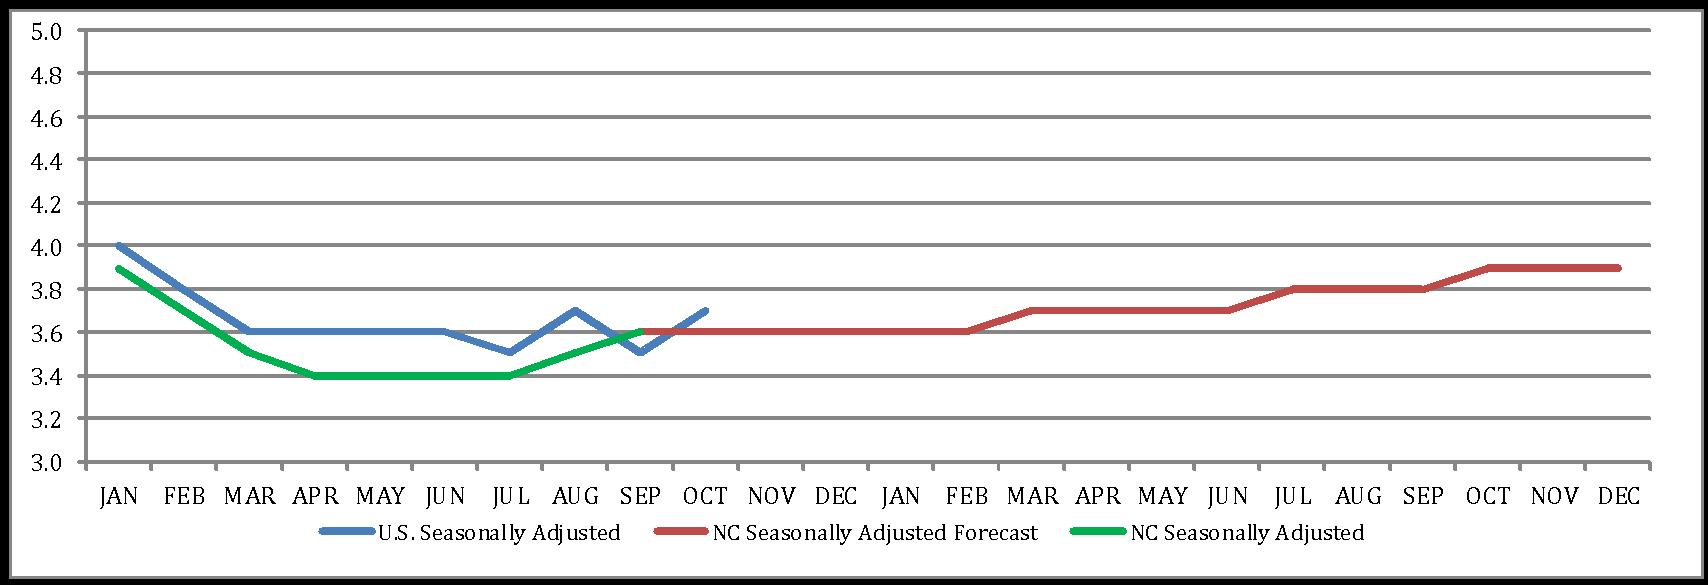
The graph at the top of this page provides a summary of the monthly unemployment rates for 2022 and 2023. The solid blue line represents the United States seasonally adjusted historic unemployment rate. The seasonally adjusted unemployment rate for North Carolina is represented by the solid green line. The North Carolina seasonally adjusted unemployment rate forecast is represented by the solid red line. The seasonally adjusted rates for the United States and North Carolina can be compared directly and provide more reliable estimates than the unadjusted rates.
The United States and North Carolina started 2022 with unemployment rates of 4.0 percent and 3.9 percent respectively. Both the U.S. and North Carolina unemployment rates have fallen consistently to 3.5 percent and 3.6 percent by September. The North Carolina rate should rise slightly through the rest of 2022 and close the year at 3.6 percent by December of 2022.
The data used in this report comes from the websites for the U.S. Department of Commerce’s Bureau of Economic Analysis and the North Carolina Employment Security Commission as of Nov. 30, 2022.