
HAMPTONS MANHATTAN SOUTH
Q1 & Q2 2023 REPORT Featured Property: 1236 S. VENETIAN WAY, MIAMI BEACH, FL
FLORIDA
BESPOKE REAL ESTATE ® TAILORED FOR $10M+. TAILORED FOR YOU. $112M+ Top Recent Bespoke Transaction $10B+ Total $10M+ Transactions $27M+ Average Sales Price
Industries change. Markets evolve. Great companies innovate.
Luxury real estate should be no exception.
Yet, the traditional brokerage model has not evolved in decades—and as a client, you’ve noticed.
Recognizing the need for change, Bespoke Real Estate launched in 2014 as the first and only firm to solely represent homes above $10 million with a revolutionary direct-to-client model.
Since our inception, we have facilitated over $9 billion in $10M+ sales. We have been unwavering in our mission to deliver the most tailored, uncompromising, result and relationship-driven experience for you, our clients.
Contact us to learn more about The Bespoke Method, our unique client-first advantages, and to list with the $10M+ experts.
HAMPTONS | MANHATTAN | SOUTH FLORIDA

Beach Lane, Wainscott, NY Oceanfront Estate 2.55 Acres+/- | 11,000 SF+/6 Beds | 10 Full and 1 Half Baths Bespoke Exclusive. $55,000,000
115

TABLE OF CONTENTS
2 INTRODUCTION
6 VISION
8 WHAT SETS US APART
10 EXECUTIVE SUMMARY
12 THE HAMPTONS $10M + MARKET
28 MANHATTAN $10M + MARKET
44 SOUTH FLORIDA $10M + MARKET
60 INVITATION
THE SYMBOL THAT REDEFINED AN INDUSTRY
Bespoke’s brand mark is the symbol of ultra-luxury, exclusivity—and impeccable service.

To provide our clients with more value, more resources, and a more personalized experience than anywhere else in ultra-luxury.
®
VISION


The allure of a luxury price point is just the beginning; discover the competitive advantages of Bespoke and the unprecedented value afforded to you.
TAILORED FOR $10M +
As the first and only firm to focus solely on selling homes above $10 million, Bespoke delivers unmatched expertise.
REVOLUTIONARY DIRECT-TO-CLIENT MODEL
With no independent agents and no franchises, Bespoke delivers the capabilities of our entire company directly to our clients—without the dilution of resources found within traditional brokerages.
POWERED BY BESPOKE
LUXURY MARKETING
Bespoke’s sister company, known for representing the worldʼs most prestigious brands, builds compelling campaigns for our clientsʼ properties.
WEALTH INTELLIGENCE
Bespoke’s Data Division uses the most exclusive wealth intelligence in the industry. With the removal of independent agents and internal competition, Bespoke controls, collects, and utilizes all incoming data and information to market and sell our clientsʼ properties.
THE BESPOKE METHOD
The Bespoke Method delivers the industryʼs most pinpoint-accurate UHNW-targeted marketing, driving powerful results for you.
IMMERSIVE INSIGHT
As the sole curator of national $10M+ market reports, we ensure that the Bespoke client is the most informed.
PERPETUALLY EXPANDING NETWORK
Bespoke’s curated roster of the worldʼs most influential UHNWIs acts as an ever-expanding advisory for our brand and the most qualified network for our clientsʼ offerings.
RESULTS
Bespoke has facilitated over $9B in $10M+ transactions for our clients and amassed a $2B+ portfolio of the worldʼ s finest offerings, with an average sales price of $27M+
Weʼre on a mission to make the industry better for you. For decades there were no other options—Now you have Bespoke.
WHAT SETS US APART
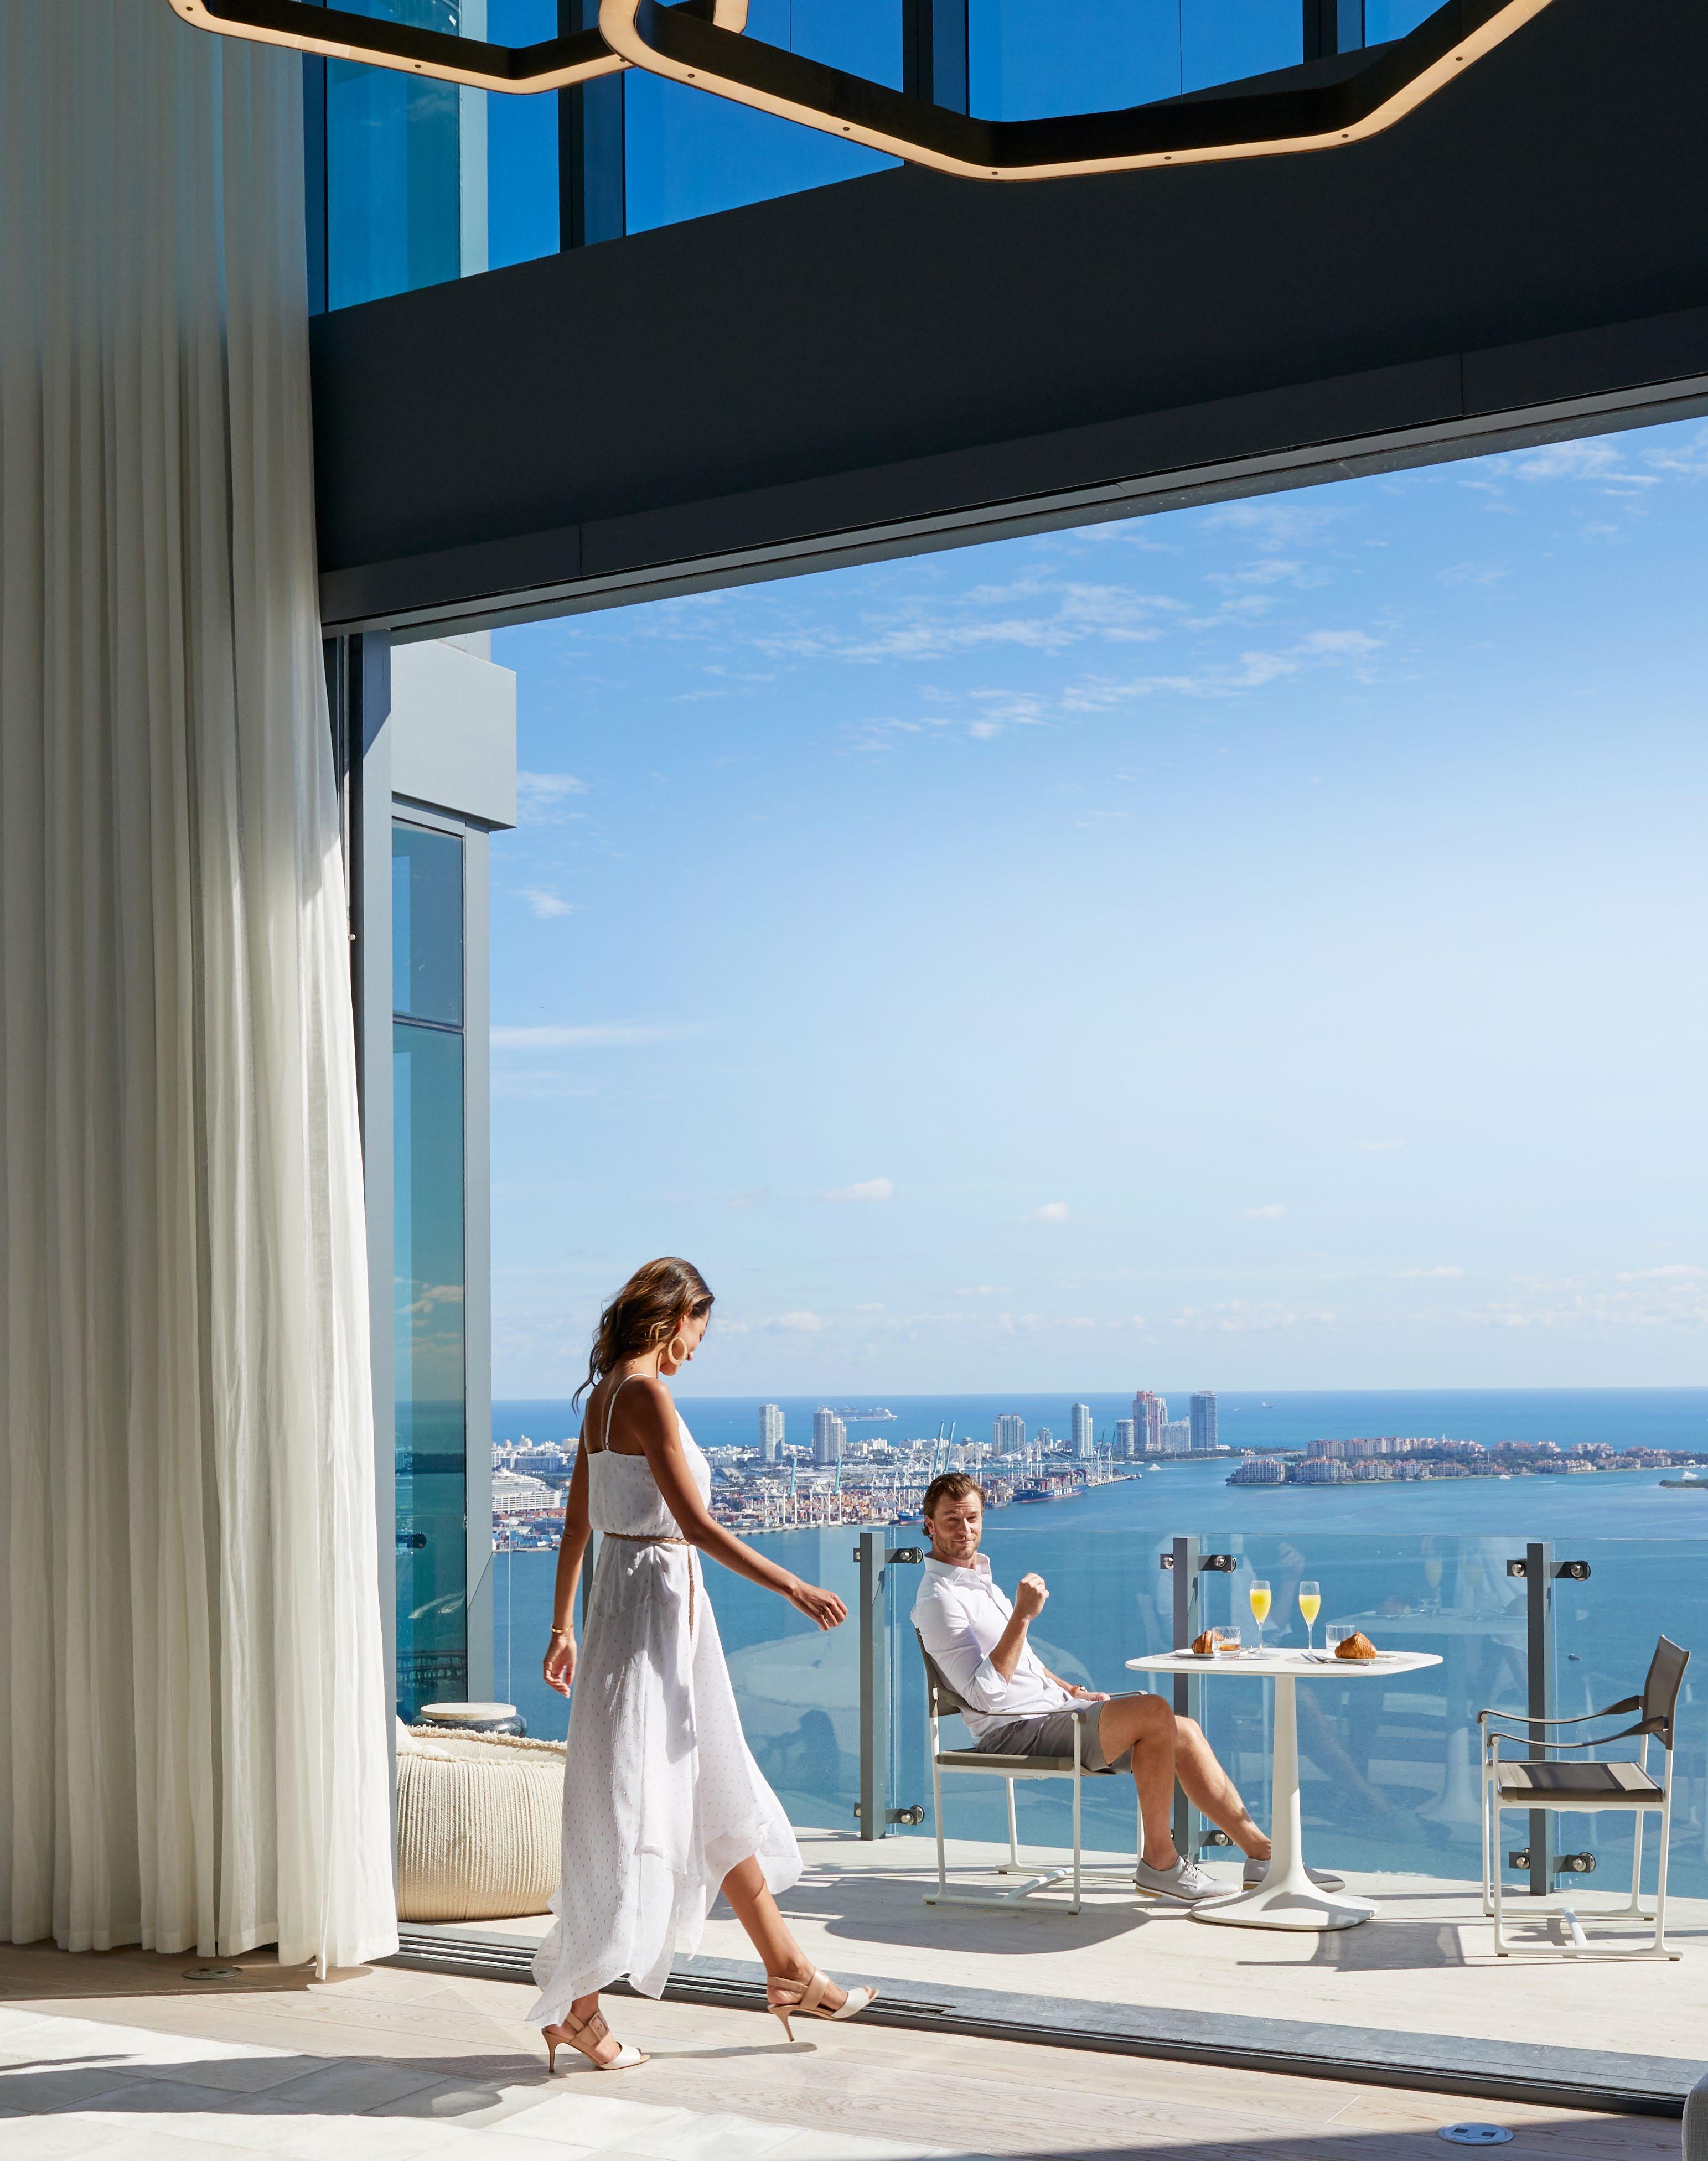
Waldorf Astoria, Miami, FL
2 Residences
$43,000,000

SOLD
10 | LUXURY MARKET INSIGHT
EXECUTIVE SUMMARY
So far this year, reports on ultra-luxury real estate reflect a tendency we’ve seen before, where pundits treat the market as a monolith without considering its nuances or cyclical nature. Fortunately, at Bespoke, our unique perspective has allowed us to see what others don’t. Given all the noise about $10 million+ real estate at large, this Market Report is uniquely important today as one of the few— if not only—voices of clarity and insight into the market.
While the first half of 2023 has witnessed a year-over-year dip across the Hamptons, New York City, and South Florida trades, there are certain clear signals that point to an overall trajectory of market stabilization, a silver lining amid generally uncertain economic conditions. Among all three markets, properties with longer investment horizons, like move-in ready homes with little work needing to be done have performed well, particularly compared to homes that intend to be resold in the next few years, like land/teardown properties. That’s been made evident by the strong performance of the turnkey segment and the $20-$30 million price segment, in all regions. This is a notable shift from buyers’ intentions before the pandemic, where land/teardown properties, particularly in the Hamptons, accounted for over nearly a third of all $10 million+ sales in the first quarter of 2020
Breaking down the markets individually, comparing the Hamptons and South Florida markets has been useful, as they were both secondary markets that boomed during the pandemic and slowed starting in 2022. In the Hamptons, turnkey trades had a 13% increase in trade dollar volume despite a 25% decrease in the number of trades between the first half of this year compared to the same time last year.
The $20 to $30 million segment, meanwhile, had 50% more sales than the same time last year, from 4 to 6 trades, suggesting that buyers who may have been looking in the $15-$20 million range were willing to pay a premium for the perfect move-in ready home, pushing transactions over the $20 million mark.
South Florida saw the same trend, with buyers in Miami and Palm Beach favoring new singlefamily homes and inland properties over condos and waterfront properties. The main reason for this is simply the absorption of waterfront that occurred during the pandemic. The first half of 2020 saw 51 $10 million+ ocean and waterfront trades combined; that number quadrupled in the first half of 2021, with 204 trades (that year ended a total of 334 ocean/ waterfront trades).
Unlike South Florida and the Hamptons, New York City trades peaked in 2022, as buyers who flocked to secondary markets returned to the city with the effective end of the pandemic. Still, like the other two markets, buyers are favoring premium trades with long investment horizons. For example, new development trades dipped in quantity, they saw a 12% increase in dollar volume in the first half of this year compared to the same time last year. This suggests a sustained demand for premium homes, despite highly limited inventory in the market as a whole.
Join us as we dive into the data of the $10 million+ alpha markets.
HOPE YOU ENJOY.
Cody Vichinsky
FOUNDING PARTNER & PRESIDENT, BESPOKE
Q1 AND Q2 2023 REPORT
HAMPTONS MANHATTAN
SOUTH FLORIDA
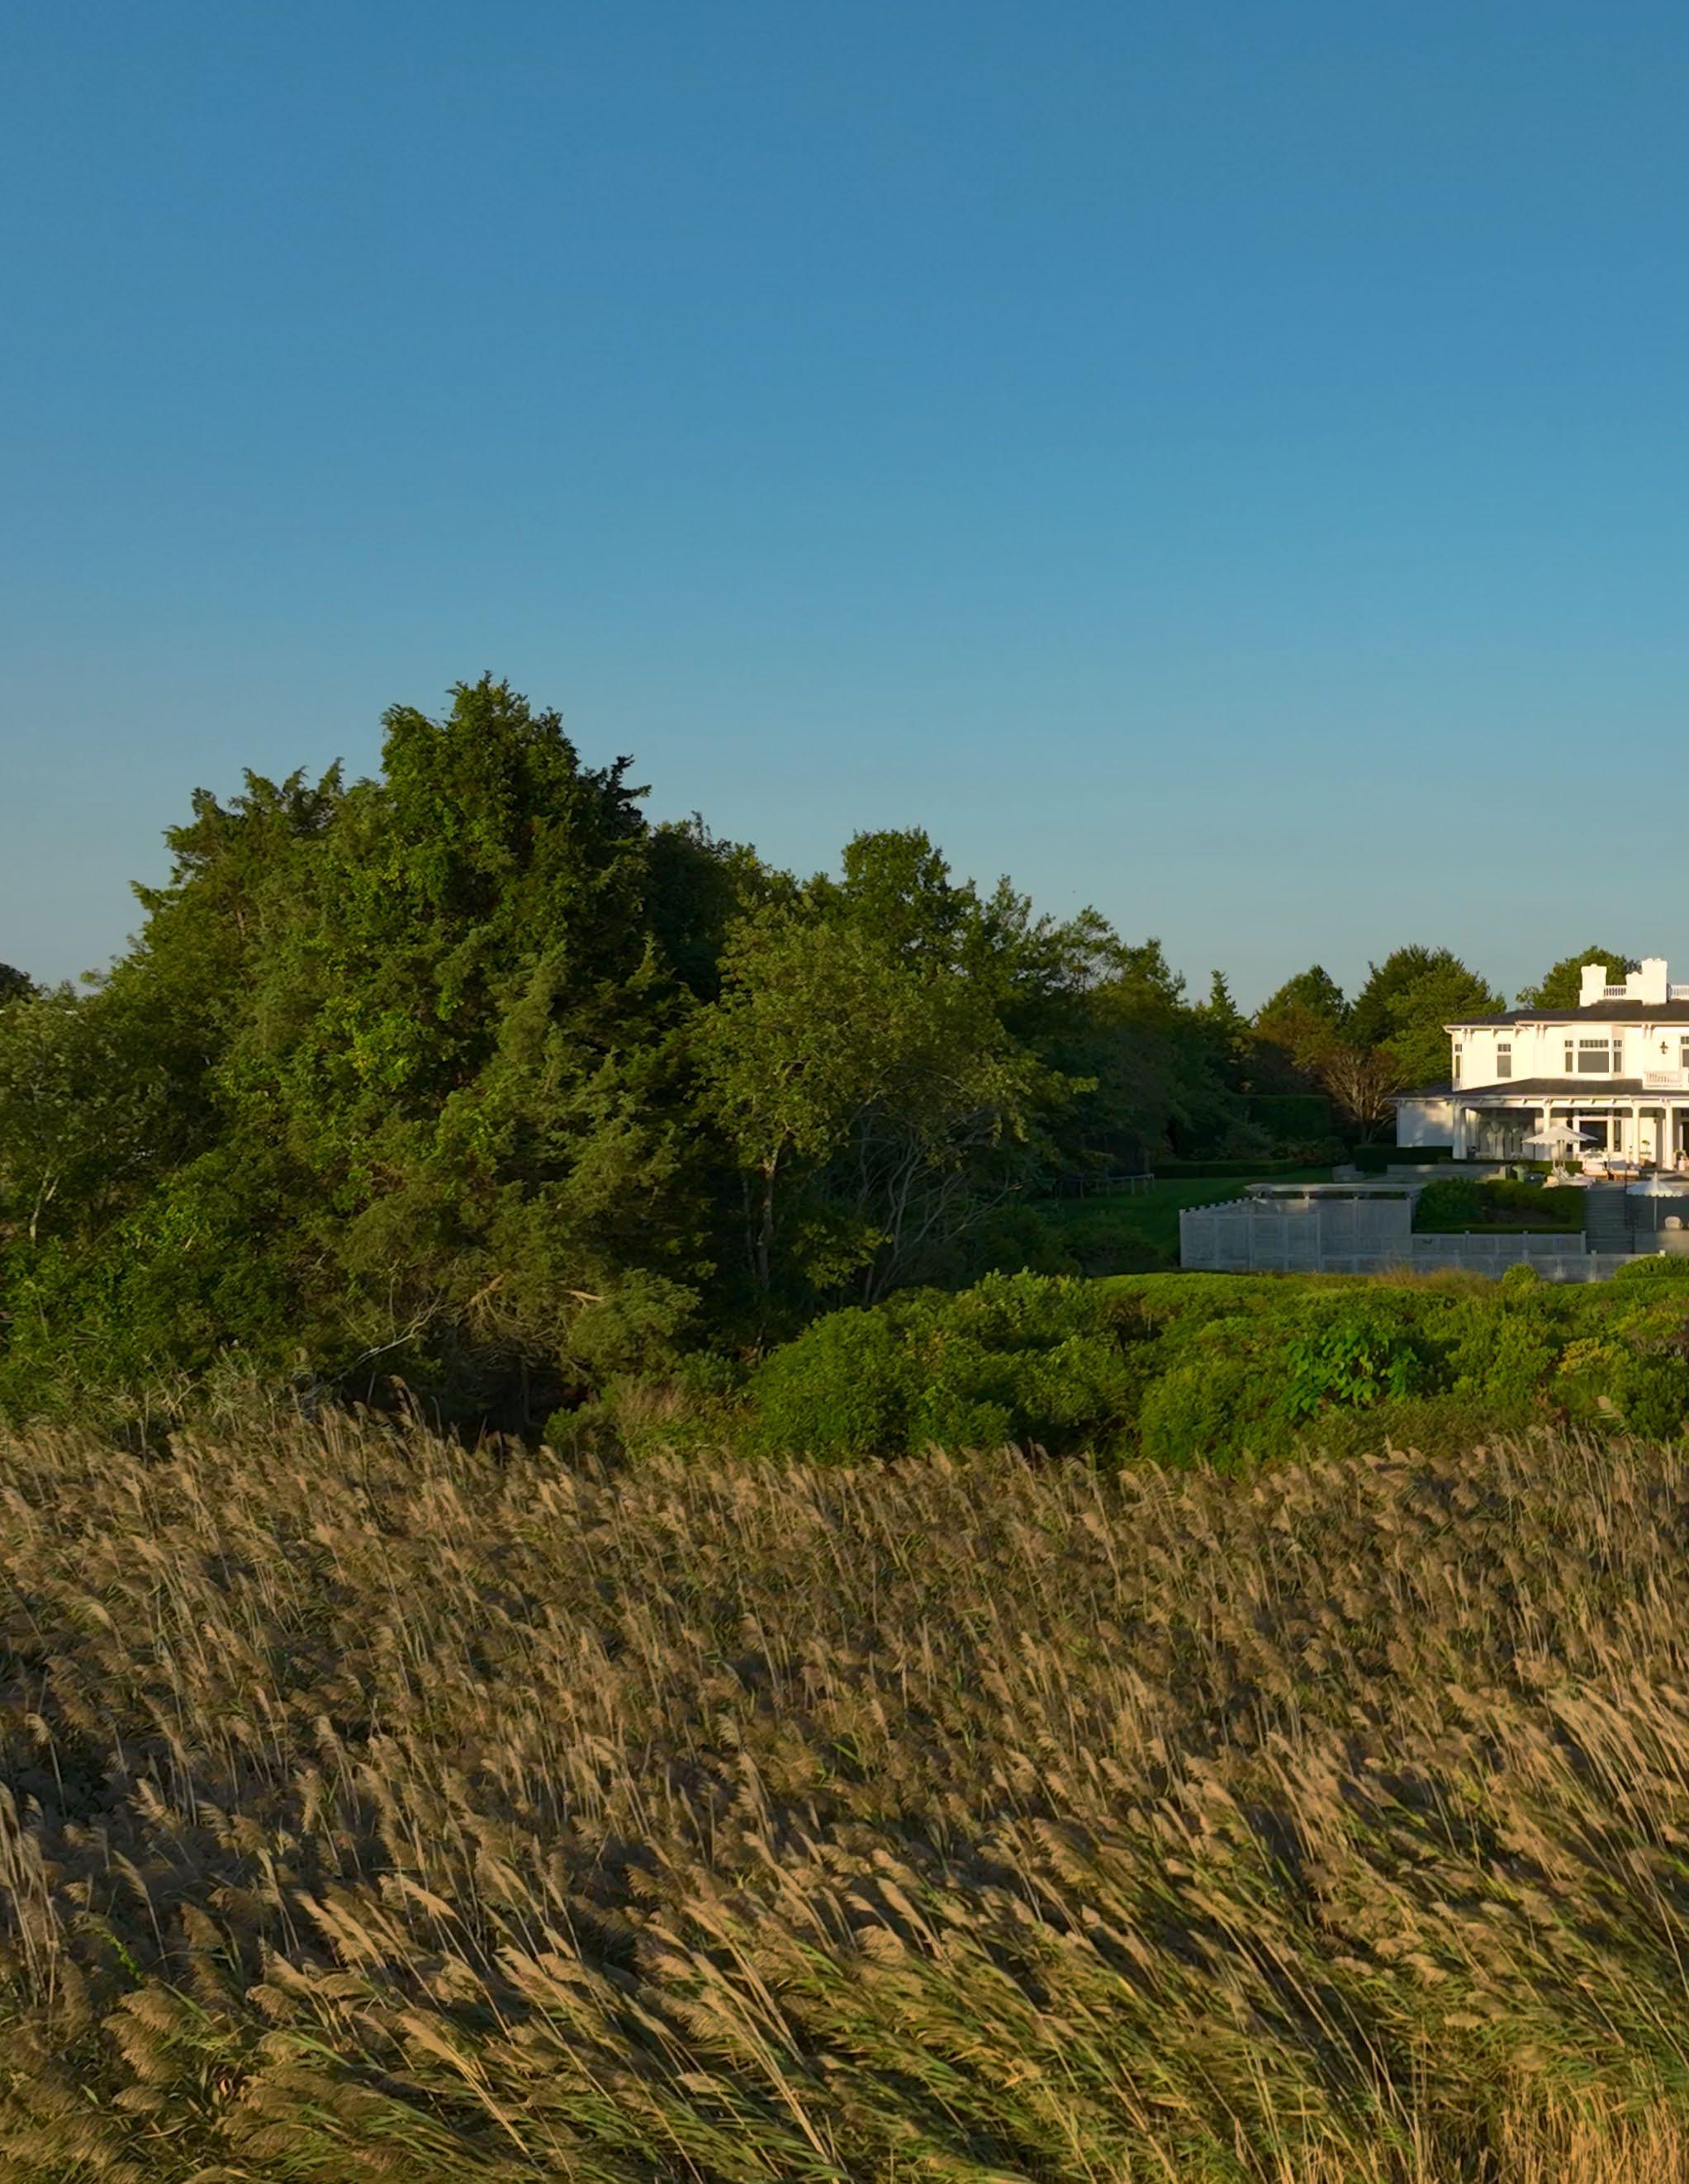
THE HAMPTONS $10M+ MARKET
12 | LUXURY MARKET INSIGHT

315 Rose Hill Road, Water Mill, NY
Waterfront Living on Mecox Bay
4.21 Acres+/- | 15,095 SF+/- | 290’ of Frontage
8 Beds | 8 Full and 3 Half Baths
Bespoke Exclusive. $29,500,000
BESPOKEREALESTATE.COM | 13
Total $10M+ Trades in Q1 & Q2 YoY
55 TRADES
46 TRADES
29 TRADES
The first half of 2023 had 29 $10M+ trades, putting 2023 on pace to beat prepandemic averages.
$10M + HAMPTONS MARKET REPORT
130
& Q2 2022
& Q2 2022
& Q2 2023 14 | LUXURY MARKET INSIGHT
Q1
Q1
Q1
The data shown below includes the 9 locations surveyed within the Hamptons $10M+ real estate market for Q1 & Q2 YoY.
2021 TRADES 2022 TRADES 2023 TRADES
*Includes Westhampton-Hampton Bays 2021 2022 2023 # OF SALES *WEST OF THE CANAL 2021 2022 2023 # OF SALES SOUTHAMPTON
2022 2023 # OF SALES WATER MILL 2021 2022 2023 # OF SALES SAG HARBOR 2021 2022 2023 # OF SALES BRIDGEHAMPTON
2022 2023 # OF SALES SAGAPONACK 2021 2022 2023 # OF SALES WAINSCOTT 2021 2022 2023 # OF SALES EAST HAMPTON
2022 2023 # OF SALES AMAGANSETT/MONTAUK 5 10 6 2 6 8 4 6 8 4 10 5 7 4 2 0 9 5 1 7 6 1 2 2 0 8 2 $10M + TOTAL HAMPTONS SALES BY LOCATION
2021
2021
2021
BESPOKEREALESTATE.COM | 15
$2.7B+
The $20-$30 million price segmented increased by 50% YoY, due to demand for premium, move-in ready homes.
$10M + HAMPTONS MARKET REPORT
Total $10M+ Trade Volume for Q1 & Q2 YoY $1.1B + $926M + $636M + Q1 & Q2 2021 Q1 & Q2 2022 Q1 & Q2 2023 16 | LUXURY MARKET INSIGHT
The data shown illustrates the total sales quantity and volume within the ultra-luxury real estate market surveyed within the Hamptons for Q1 & Q2 YoY.
2022
2021 2022 2023 # OF SALES $10M–$20M 2021 2022 2023 # OF SALES $20M–$30M 2021 2022 2023 # OF SALES $30M–$40M 2021 2022 2023 # OF SALES $40M+ 38 9 3 5 33 4 4 5 19 6 2 2 $10M + TOTAL HAMPTONS SALES BY PRICE POINT
TRADES
2021
TRADES
TRADES BESPOKEREALESTATE.COM | 17
2023

802 Town Line Road, Sagaponack, NY Grandfathered Compound 3 Acres+/- | 11,788 SF+/-
Beds | 8 Full and 2 Half Baths Bespoke Co-Exclusive. $27,500,000 18 | LUXURY MARKET INSIGHT
5
Continuing the pattern we’ve seen since late 2021, the overall $10 million+ Hamptons market has seen a dip in trade quantity and total sales volume in the first half of this year compared to the first half of 2022, with a 36% decline from 46 to 29 trades year-over-year. Nonetheless, the first half of this year is already on pace to outperform pre-pandemic rates; in 2019 there were 47 trades for the entire year.
A consistent theme in our previous Market Reports that continues to hold is lack of quality inventory. At the onset of the pandemic, trade quantity jumped 121%
year-over-year between 2019 and 2020, then continued to grow in 2021 by another 22%, to 127 trades for the year. This rush was due in part to the mass migration out of the city, and in part by historically low interest rates. For those who bought in those years, selling today would mean re-entering the market likely at a higher interest rate than they currently have. This is well demonstrated by the behavior of land/teardown buyers; in both the first half of 2020 and 2021, there were 14 trades; by 2022 there were 10, and the first half of this year saw only 5
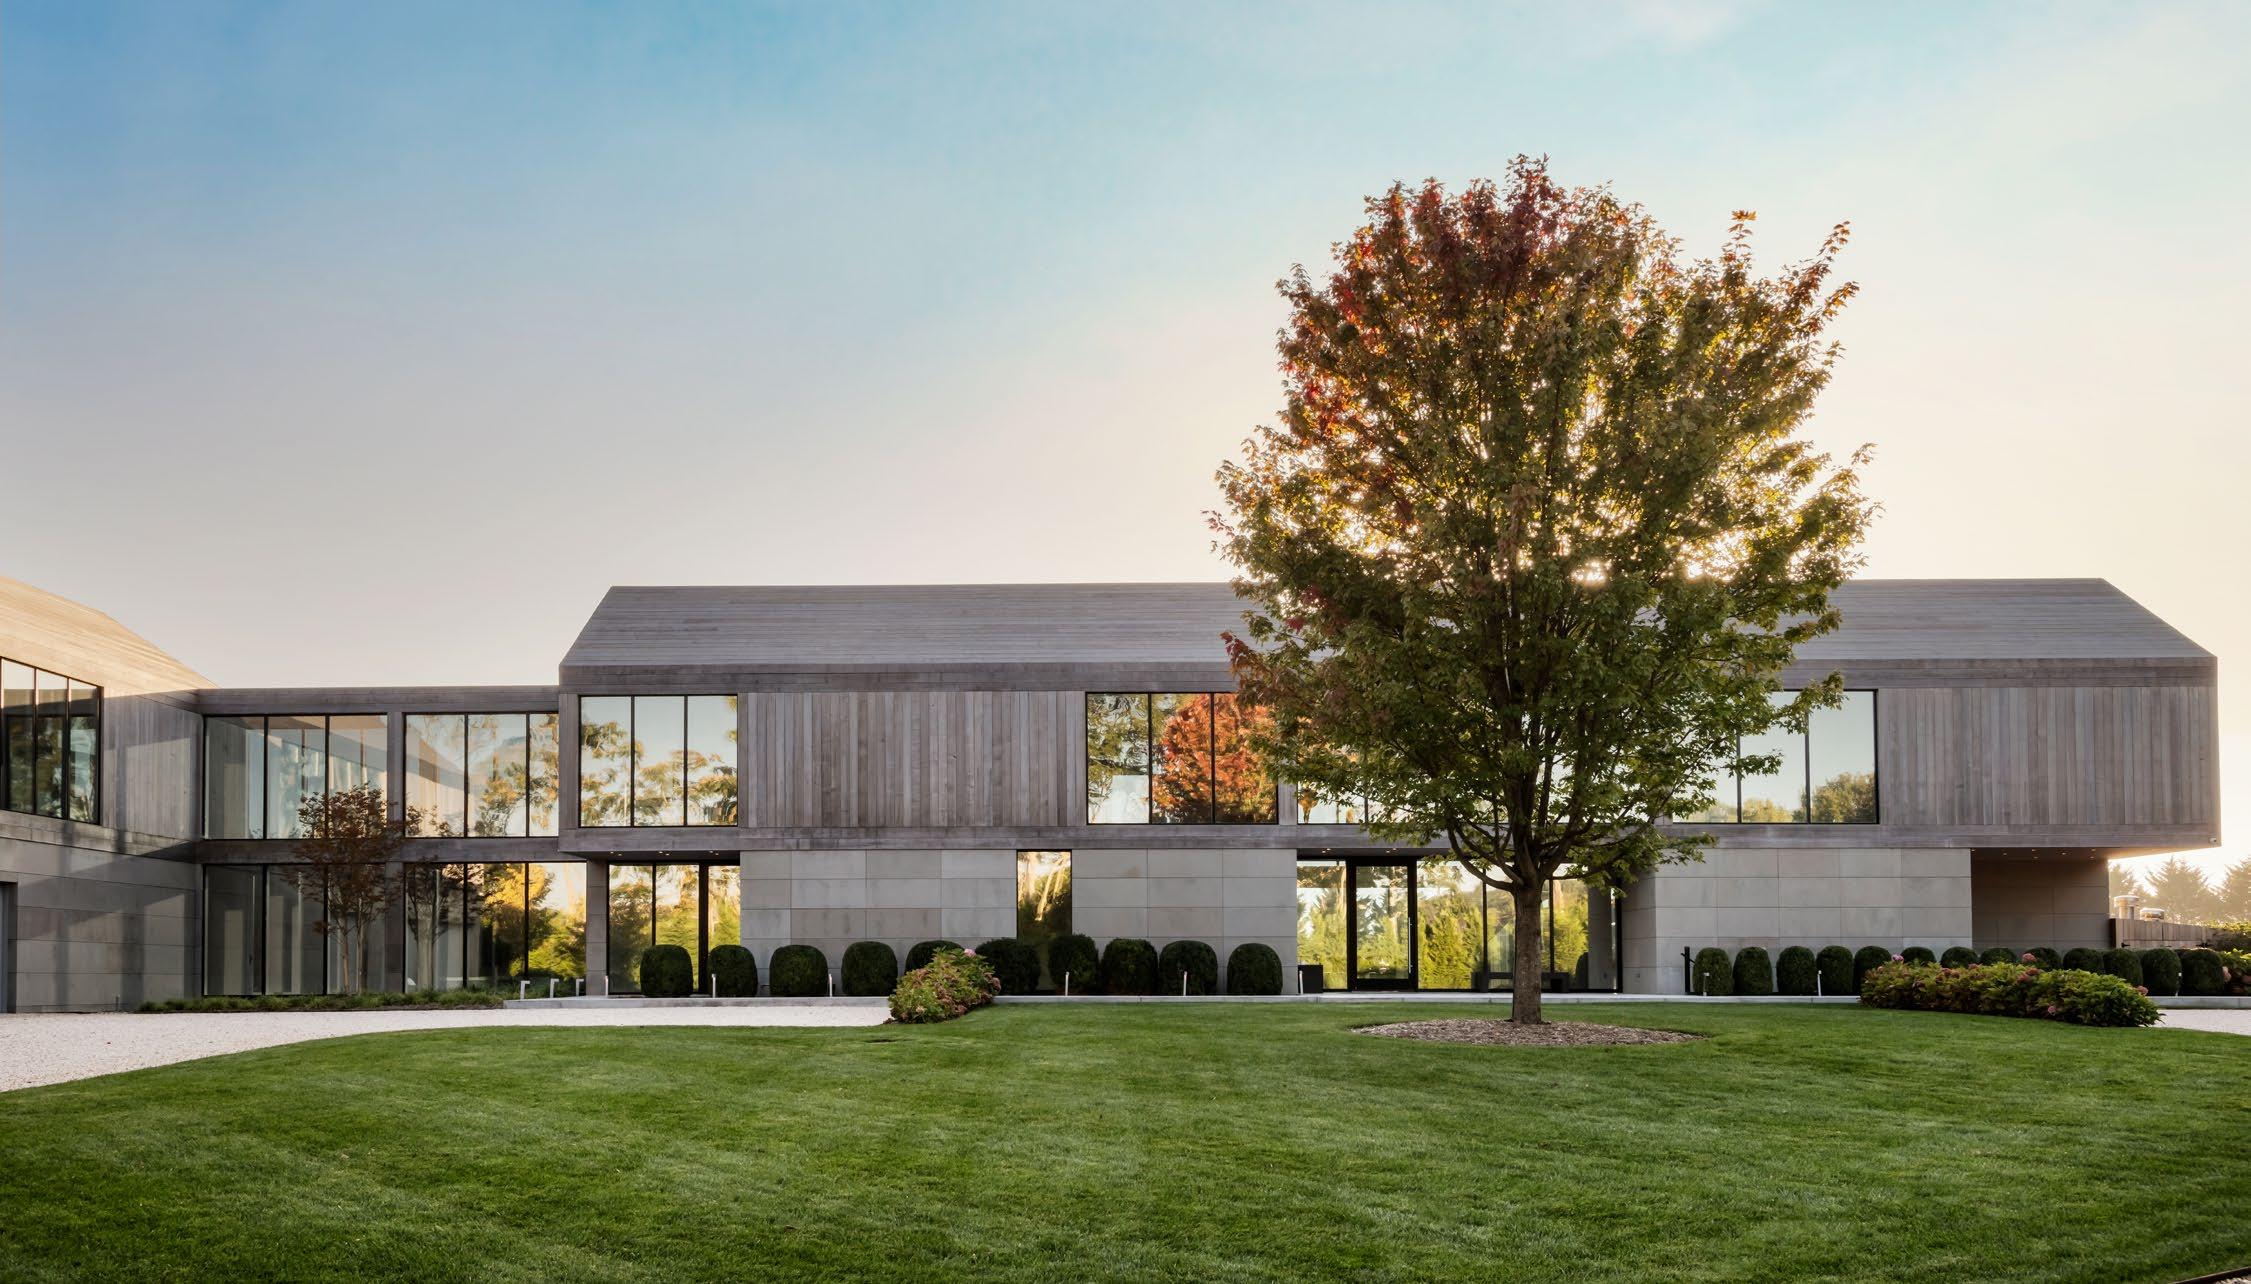
Turnkey trades grew by 13% compared to the same time last year, for a total of $463 million in trade volume.
BESPOKEREALESTATE.COM | 19
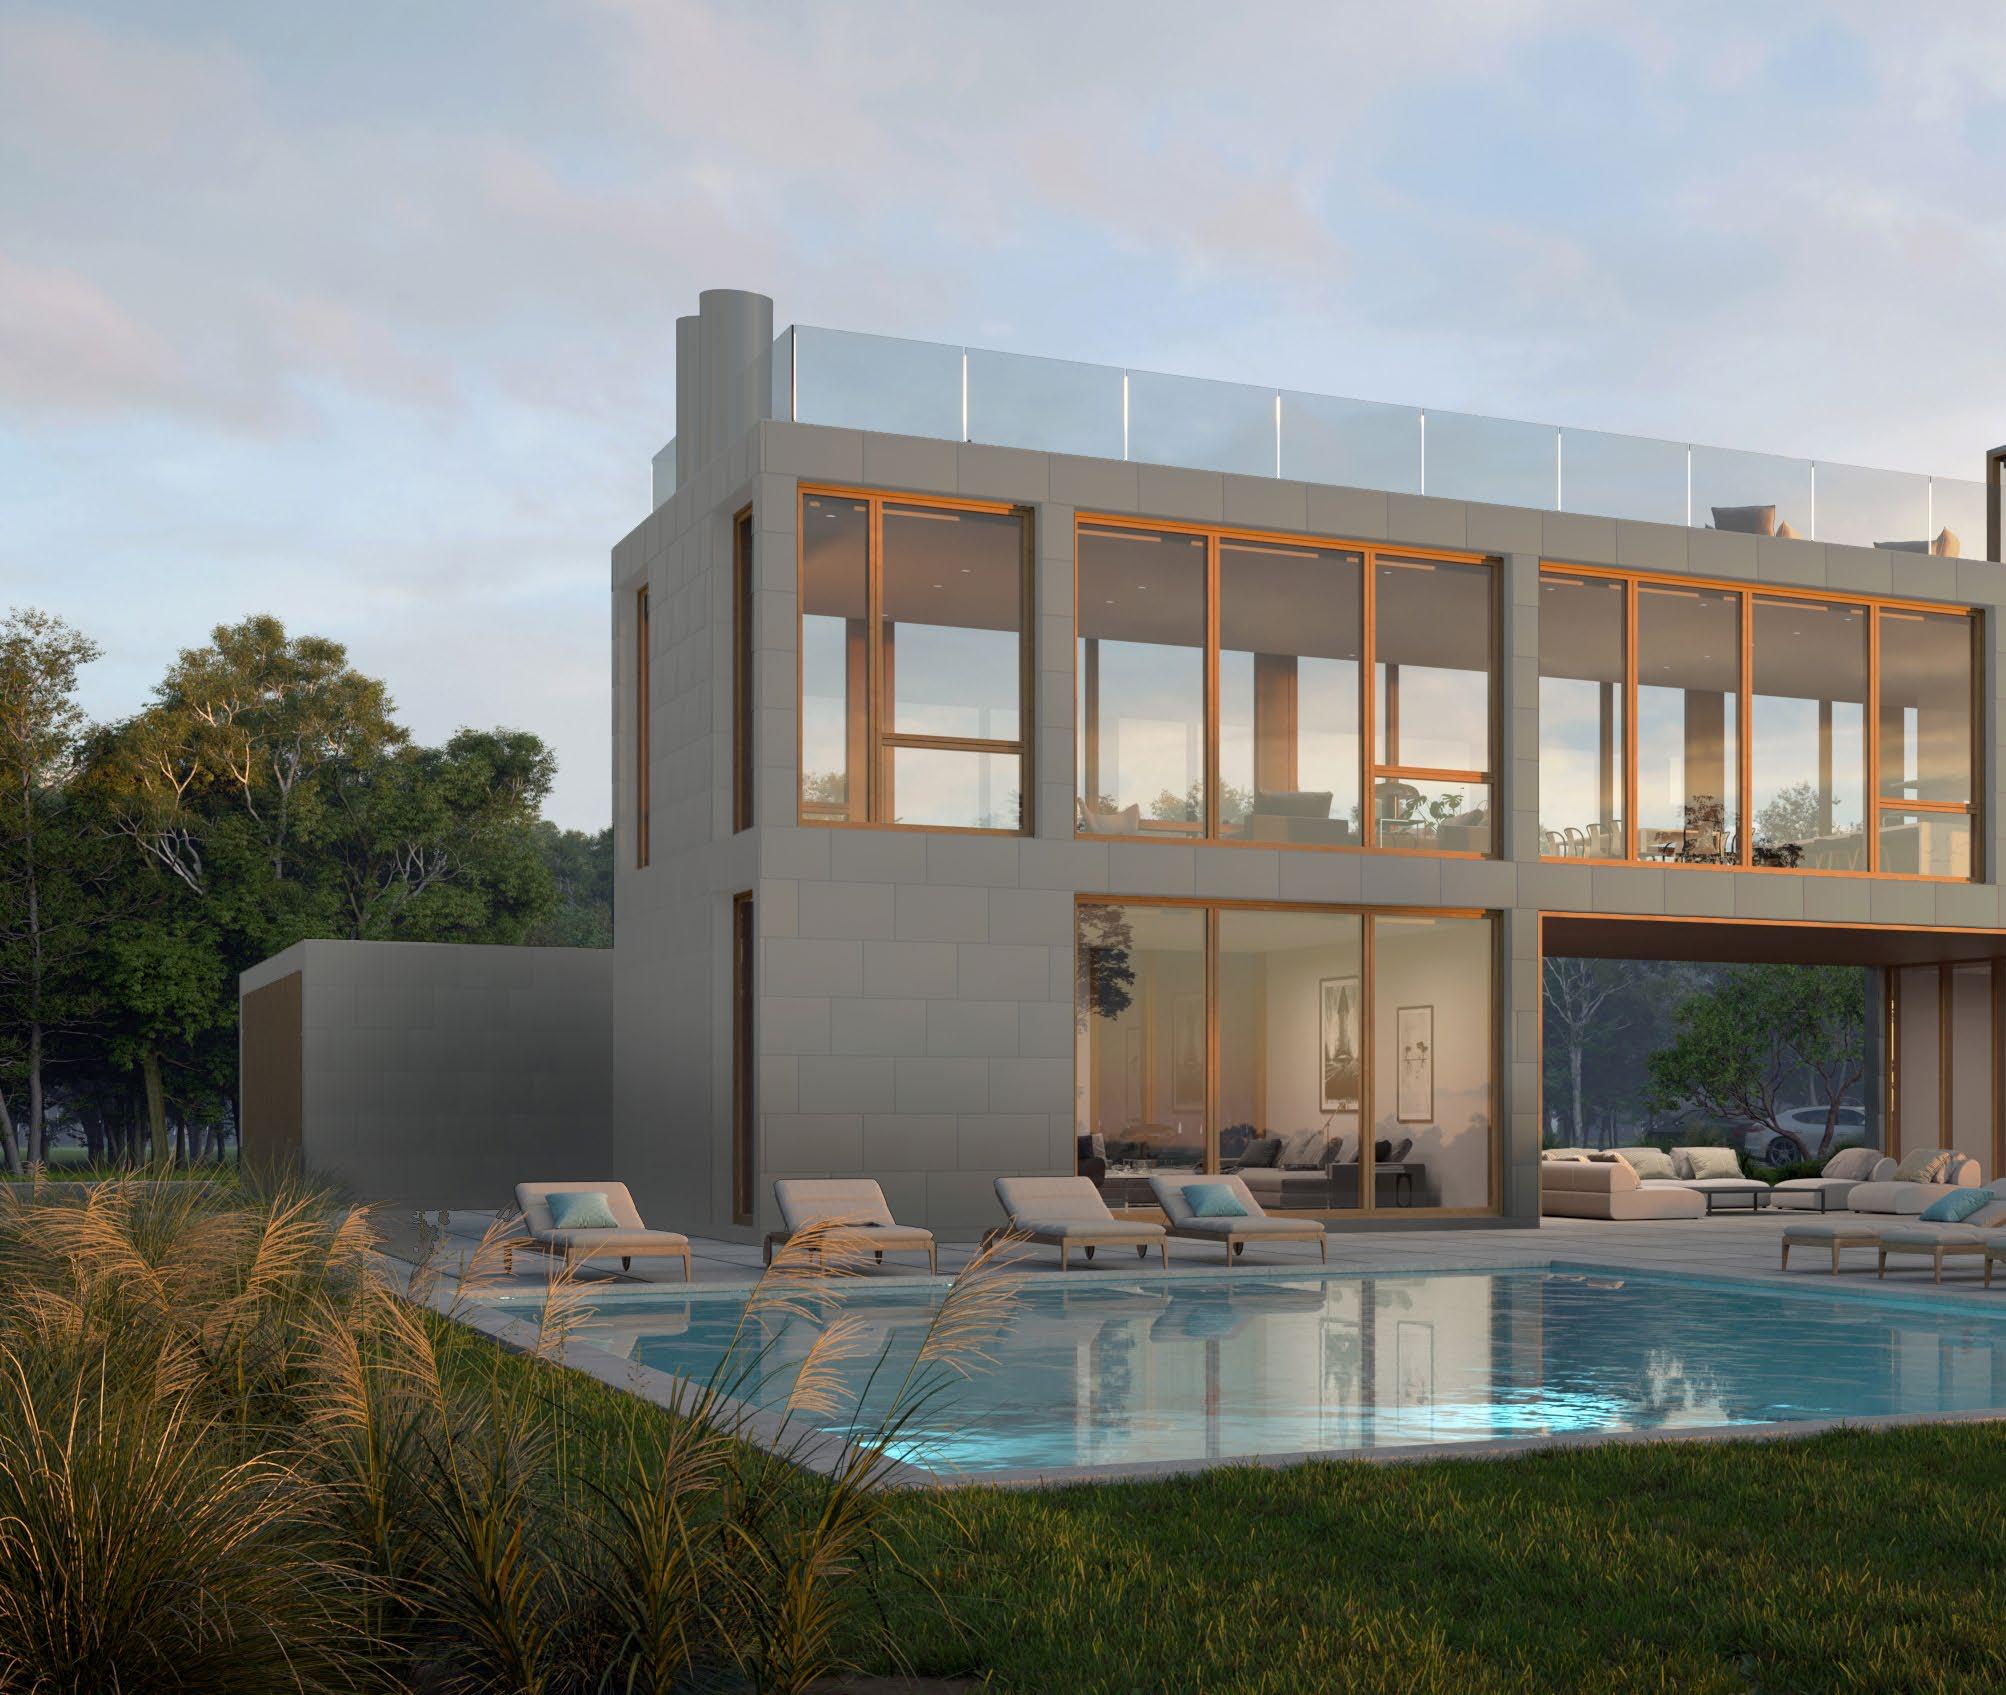
By contrast, turnkey trades stayed relatively consistent between 2021 to 2022, and have fallen the least in 2023, from 24 to 18 trades. Turnkey buyers’ investment horizons are often longer and recreational in their intent. Such buyers are willing to pay a premium for a move-in ready home, particularly if it fits a host of their individual preferences. Despite a 25%
decrease in quantity between the first half of 2022 and 2023, turnkey homes are the only category that has shown a 13% increase in dollar volume, for a total of $463 million in trade volume, compared to $408 million in 2022
“Land/teardown buyers had a shorter investment horizon,” says
Sam Kelly,
20 | LUXURY MARKET INSIGHT
31 The Bridge, Bridghampton, NY Residences at The Bridge
3.8 Acres+/- | 5,204 SF+/-
5 Beds | 6 Full and 1 Half Baths Bespoke Exclusive. $29,995,000

Senior Portfolio Manager at Bespoke.
“If they are debt financing a property today, interest rates compounded with still-high construction costs has moderated the scale of upside, and therefore their transactions have subsided until something in the market gives,” he continues. “Unlike the rapid buying of 2020 and 2021, buyers are more patient and
are willing to pay a premium for the perfect property that aligns with their criteria to a tee. Hence the increase in dollar volume on turnkey and the strength of the $20-$30 million price segment.”
BESPOKEREALESTATE.COM | 21
So far this year, Bespoke alone facilitated trades like 31 Two Mile Hollow Road, whose last ask was for $29 million, 535 and 553 Flying Point, whose last ask was $25 million, and 289 Parsonage Lane, whose last ask was $23.5 million.
With more patient buyers has come the reemergence of bidding. To be sure, it is not a reflection of lack of demand, which we believe is sustained given the speed at which homes are listed and sold. “While some buyers bid on a few other properties, they acted quickly and decisively when they found the one they were willing to pay a premium for,” says Cody Vichinsky, co-Founder and President of Bespoke.
“The trades we have facilitated, especially in the $20 million+ segment, make sense from an investment and lifestyle perspective in a market like we’re seeing today.”
Given the sustained demand, we expect about 35 or so trades for the rest of the year, with slight increase in the third quarter compared to the second, and an even stronger increase in the fourth quarter, in line with traditional yearly trade cycles. This would put the market on par with trades in the third and fourth quarter of 2022, which saw a total of 32 $10 million+ trades, and 78 for the whole year.

22 | LUXURY MARKET INSIGHT

40 Deforest Road, Montauk, NY On the Break | Ditch Plains Oceanfront 1 Acres+/- | 95’ of Frontage | 4,800 SF+/6 Beds | 5 Full and 1 Half Baths Bespoke Exclusive. $27,500,000 BESPOKEREALESTATE.COM | 23
BY SETTING 2021 TRADES 2022 TRADES 2023 TRADES LISTINGS VOLUME LISTINGS VOLUME LISTINGS VOLUME OCEANFRONT 10 $308,493,600 6 $242,860,000 7 $275,480,000 WATERFRONT 14 $358,930,000 16 $258,825,000 5 $94,375,000 INLAND 31 $453,848,500 24 $425,205,000 17 $266,149,875 TOTAL 55 $1,121,272,100 46 $926,890,000 29 $636,004,875 BY VINTAGE NEW CONSTRUCTION 13 $226,237,500 12 $246,655,000 6 $82,949,875 LAND/TEARDOWN 14 $330,835,000 10 $271,325,000 5 $89,375,000 TURN-KEY 28 $564,199,600 24 $408,910,000 18 $463,680,000 TOTAL 55 $1,121,272,100 46 $926,890,000 29 $636,004,875 BY PRICE POINT $10M - $20M 38 $497,108,500 33 $439,340,000 19 $249,424,875 $20M - $30M 9 $215,740,000 4 $89,450,000 6 $148,875,000 $30M - $40M 3 $108,500,000 4 $134,200,000 2 $68,480,000 $40M+ 5 $299,923,600 5 $263,900,000 2 $169,225,000 TOTAL 55 $1,121,272,100 46 $926,890,000 29 $636,004,875 YOY COMPARISON HAMPTONS $10M+ MARKET 24 | LUXURY MARKET INSIGHT
LISTINGS VOLUME LISTINGS VOLUME LISTINGS VOLUME WEST OF THE CANAL 5 $62,121,000 4 $57,060,000 1 $10,050,000 SOUTHAMPTON 10 $252,713,600 10 $159,950,000 7 $111,575,000 WATER MILL 6 $94,395,000 5 $69,110,000 6 $94,050,000 SAG HARBOR 2 $27,250,000 7 $124,550,000 1 $13,500,000 BRIDGEHAMPTON 6 $110,930,000 4 $47,345,000 2 $50,980,000 SAGAPONACK 8 $118,322,500 2 $96,500,000 2 $31,250,000 WAINSCOTT 4 $151,700,000 0 $0 0 $0 EAST HAMPTON 6 $158,750,000 9 $258,725,000 8 $299,450,000 AMAGANSETT/ MONTAUK 8 $145,090,000 5 $113,650,000 2 $25,149,875 TOTAL 55 $1,121,272,100 46 $926,890,000 29 $636,004,875 BY LOCATION 2021 TRADES 2022 TRADES 2023 TRADES BESPOKEREALESTATE.COM | 25
Hamptons Quarterly Transaction Quantity
Hamptons Quarterly Transaction Volume
TOTAL TRANSACTION QUANTITY QUARTER 45 40 35 30 25 20 15 10 5 0 Q1 ‘21 Q2 ‘21 Q3 ‘21 Q4 ‘21 Q1 ‘22 Q2 ‘22 Q3 ‘22 Q4 ‘22 Q1 ‘23 Q2 ‘23
TOTAL TRANSACTION VOLUME (MILLIONS) QUARTER $1,000 $900 $800 $700 $600 $500 $400 $300 $200 $100 $Q1 ‘21 Q2 ‘21 Q3 ‘21 Q4 ‘21 Q1 ‘22 Q2 ‘22 Q3 ‘22 Q4 ‘22 Q1 ‘23 Q2 ‘23 26 | LUXURY MARKET INSIGHT
Hamptons Yearly Transaction Quantity
Halfway into 2023, the Hamptons is at 39% of the average annual trade quantity since 2016, we are on track to perform just shy of the annual average due to a strong trade volume for the second half historically.
Unlike the rapid buying of 2020 and 2021, buyers are more patient and are willing to pay a premium for the perfect property”
SAM KELLY | SENIOR PORTFOLIO MANAGER, BESPOKE
TRANSACTION QUANTITY YEAR 150 125 100 75 50 25 0 2021 2022 2023 TOTAL 2023 PROJECTION “
BESPOKEREALESTATE.COM | 27

MANHATTAN $10M+ MARKET SOLD 60 Collister Street, PH, Tribeca, NY Tribeca Penthouse 5,126 SF+/- | 6 Beds | 5 Full and 1 Half Baths $26,950,000 28 | LUXURY MARKET INSIGHT

BESPOKEREALESTATE.COM | 29
Total $10M+ Trades in Q1 & Q2 YoY
106 TRADES
158 TRADES
121 TRADES
There were 121 trades in the first half of 2023, setting Manhattan squarely on pace with its historical averages of 252 trades for the whole year.
$10M + MANHATTAN MARKET REPORT 385
& Q2 2021
& Q2 2022
& Q2 2023 30 | LUXURY MARKET INSIGHT
Q1
Q1
Q1
$10M + TOTAL MANHATTAN SALES BY LOCATION
The data shown below includes the 5 locations surveyed within the Manhattan $10M+ real estate market for Q1 & Q2 YoY.
2021 TRADES 2022 TRADES 2023 TRADES 2021 2022 2023 50 55 29 # OF SALES 2021 2022 2023 15 27 12 # OF SALES UPPER WEST SIDE 2021 2022 2023 22 57 54 # OF SALES UPPER EAST SIDE 2021 2022 2023 10 13 20 # OF SALES MIDTOWN WEST 2021 2022 2023 9 6 6 # OF SALES MIDTOWN EAST BESPOKEREALESTATE.COM | 31
$6.5B+
The average trade price increased from $15.5 to $17.8 million year-over-year.
$10M + MANHATTAN MARKET REPORT
Total $10M+ Trade Volume for Q1 & Q2 YoY $1.8B + $2.5B + $2.2B + Q1 & Q2 2021 Q1 & Q2 2022 Q1 & Q2 2023 32 | LUXURY MARKET INSIGHT
The data shown illustrates the total sales quantity and volume within the ultra-luxury real estate market surveyed within Manhattan for Q1 & Q2 YoY.
2021 2022 2023 # OF SALES $10M–$20M 2021 2022 2023 # OF SALES $20M–$30M 2021 2022 2023 # OF SALES $30M–$40M 2021 2022 2023 # OF SALES $40M+ 88 11 3 4 136 14 6 2 87 24 6 4 $10M + TOTAL MANHATTAN SALES BY PRICE POINT
2021 TRADES
TRADES
TRADES BESPOKEREALESTATE.COM | 33
2022
2023


34 | LUXURY MARKET INSIGHT


165
Perry Street, #PH, West Village, NY
Penthouse Renovation Opportunity
3 Levels | 11,425 SF+/-
6 Beds | 7 Full and 1 Half Baths
Bespoke Exclusive. $29,000,000

BESPOKEREALESTATE.COM | 35

In New York City, the overall theme this year has been sustainable recovery from Covid lows. In the first half of 2023, Manhattan saw 121 $10 million+ trades, compared to 158 during the same time last year. But despite this dip, the city is performing in line with its own historical averages, including trades before the pandemic. Between 2016 and 2022 the city
saw an average of 252 trades. Therefore trades in the first half of 2023 have met 48% of this historic average, demonstrating stabilization and recovery in the market.
Analyzing the market broadly, New York City trades declined for similar reasons as the other two markets covered in this report: high interest rates coupled with
36 | LUXURY MARKET INSIGHT

low inventory due to the rapid rate of trading in late 2021 and 2022 has led to a absorption and a slowdown in the market.
But there is more nuance, as certain sections that are uniquely markers of a stabilizing market fared better than in previous years. New development
experienced an 11% increase in dollar volume, from $766 million to $852 million, despite a decrease in the trade quantity. The increase in average price from $13.4 million to $18.9 million illustrates a similar trend to the successes seen in the Hamptons: that buyers in today’s ultra-luxury markets are prizing
24 Leonard Street, #PH9, Tribeca, NY Custom Triplex Penthouse 100’ Wide Triplex | 7,300 SF+/6 Beds | 6 Full and 1 Half Baths Bespoke Exclusive. $38,000,000 BESPOKEREALESTATE.COM | 37
premium homes that fit a very specific set of individual needs. This is further demonstrated by the fact the that the $20 to $30 million price range saw a 71% increase in trade quantity, the $30 to $40 million price range remained consistent with last year, and the $40 million+ saw a 100% increase, from 2 to 4 trades.
The buyer profile has also evolved, with local families who have committed to New York City during uncertain times are now looking to expand their footprint. “In terms of square footage alone, we have seen apartments trade faster than ever before, suggesting a growing demand for the highly limited supply of spacious living properties with outdoor space and parking,” says Andrew Azoulay, Senior Portfolio Manager at Bespoke. “This is seen especially in downtown areas like Tribeca, where fewer contemporary buildings have space historically built in as an Upper East townhouse, for example, might.” One example is Sixty Collister, facilitated by Bespoke, which sold with the highest price per square foot every paid in Tribeca. The premium prices that buyers have been willing to pay for the larger apartments signals that Manhattan is still very much a primary residence for many, a key insight for further new developments coming to market.
Outside of the new development segment, the average price of the whole market increased from an average trade price of $15.5 million to $17.8 million between the first half of 2022 compared to the first half of 2023, led in part by the two additional
$40 million+ properties that transacted, with a 53% increase in dollar volume from $123 million to $193 million.
In terms of neighborhoods, the Upper West Side continued to struggle with a 55% decrease in trade quantity compared to the same time in 2022, with 15 trades, only three more than 2021’s lows. The Upper East, by comparison, had 54 trades in 2023, only three fewer than last year, reflecting its continued historical demand in the $10 million+ market. Once again the Upper East Side led the Manhattan market in terms of both quantity and volume, whereas the Tribeca and West Village group experienced a decrease in trades due to the absorption during the pandemic. Similar to the Hamptons, they are experiencing quick inventory turnover, provided the properties are priced accurately and are move-in ready, as they remain scarce in supply.
Midtown West, which has consistently been one of the fastest growing ultraluxury neighborhoods thanks to rapid new developments like Hudson Yards, continued to outperform itself with a 76% increase in sales volume, from $202 million to $357 million.
Given these many signs of a stabilizing market, we predict that the rest of the year will see a flat if not slight growth in trade quantities and volumes, with about 130 or so trades expected through the end of the year, only slightly less than the 120 $10 million+ trades that took place in the third and fourth quarter of 2022
9 East 88th Street, Carnegie Hill, NY 26’ Wide Neoclassical Mansion 15,950 SF+/- | 8 Beds | 8 Full and 2 Half Baths Bespoke Exclusive. $38,000,000
38 | LUXURY MARKET INSIGHT

The Upper East had 54 trades in 2023, only three fewer than last year, reflecting its continued historical demand in the $10 million+ market.
BESPOKEREALESTATE.COM | 39
Manhattan Quarterly Transaction Quantity
Manhattan Quarterly Transaction Volume
TOTAL TRANSACTION QUANTITY QUARTER 120 100 80 60 40 20 0 Q1 ‘21 Q2 ‘21 Q3 ‘21 Q4 ‘21 Q1 ‘22 Q2 ‘22 Q3 ‘22 Q4 ‘22 Q1 ‘23 Q2 ‘23
TOTAL TRANSACTION VOLUME (MILLIONS) QUARTER $1,800 $1,600 $1,400 $1,200 $1,000 $800 $600 $400 $200 $Q1 ‘21 Q2 ‘21 Q3 ‘21 Q4 ‘21 Q1 ‘22 Q2 ‘22 Q3 ‘22 Q4 ‘22 Q1 ‘23 Q2 ‘23 40 | LUXURY MARKET INSIGHT
Manhattan Yearly Transaction Quantity
Halfway into 2023, Manhattan’s trade volume is at 48% of the average annual trade quantity since 2019, with a projection outperform the annual average trade quantity in the second half.
In terms of square footage alone, we have seen apartments trade faster than ever before, suggesting a growing demand for the highly limited supply of spacious living properties with outdoor space and parking”
ANDREW AZOULAY | VP OF BUSINESS DEVELOPMENT, MANHATTAN
TRANSACTION QUANTITY YEAR 300 250 200 150 100 50 0 TOTAL 2023 PROJECTION “ 2021 2022 2023
BESPOKEREALESTATE.COM | 41
MANHATTAN $10M+
LISTINGS VOLUME LISTINGS VOLUME LISTINGS VOLUME CONDO/CO-OP 81 $1,326,823,373 122 $1,808,571,939 96 $1,715,219,177 TOWNHOUSE 25 $516,297,500 36 $645,202,290 25 $449,265,000 TOTAL 106 $1,843,120,873 158 $2,453,774,229 121 $2,164,484,177 YOY COMPARISON
MARKET 2021 TRADES 2022 TRADES 2023 TRADES $10M - $20M 88 $1,208,089,623 136 $1,793,962,229 87 $1,183,724,872 $20M - $30M 11 $271,250,000 14 $332,745,000 24 $584,413,217 $30M - $40M 3 $100,111,250 6 $200,567,000 6 $202,600,000 $40M+ 4 $263,670,000 2 $126,500,000 4 $193,746,088 TOTAL 106 $1,843,120,873 158 $2,453,774,229 121 $2,164,484,177 BY PRICE POINT BY TYPE NEW DEVELOPMENT 15 $262,112,500 57 $766,541,234 45 $852,234,356 TURN-KEY 91 $1,581,008,373 101 $1,687,232,995 76 $1,312,249,821 TOTAL 106 $1,843,120,873 158 $2,453,774,229 121 $2,164,484,177 BY VINTAGE 42 | LUXURY MARKET INSIGHT
LISTINGS VOLUME LISTINGS VOLUME LISTINGS VOLUME DOWNTOWN 50 $747,975,100 55 $775,399,399 29 $491,732,485 MIDTOWN EAST 9 $148,493,548 6 $162,250,000 6 $73,303,500 MIDTOWN WEST 10 $152,284,475 13 $202,068,831 20 $357,277,794 UPPER EAST SIDE 22 $520,835,000 57 $924,931,583 54 $1,021,556,648 UPPER WEST SIDE 15 $274,532,750 27 $389,124,416 12 $220,613,750 TOTAL 106 $1,844,120,873 158 $2,453,774,229 121 $2,164,484,177 BY LOCATION 2021 TRADES 2022 TRADES 2023 TRADES BESPOKEREALESTATE.COM | 43

2000 S. Ocean Drive, Hallandale Beach, FL Penthouse Residence 6,781 SF+/- | 5 Beds | 6 Full and 1 Half Baths Bespoke Exclusive. $10,800,000 44 | LUXURY MARKET INSIGHT

SOUTH FLORIDA $10M+ MARKET
BESPOKEREALESTATE.COM | 45
Total $10M+ Trades in Q1 & Q2 YoY
235 TRADES
189 TRADES
118 TRADES
South Florida saw a drop in sales volume and quantity compared to last year, with a total of 118 trades compared to 189 in 2022.
$10M + SOUTH FLORIDA MARKET REPORT
542
& Q2 2021 Q1 & Q2 2022 Q1 & Q2 2023 46 | LUXURY MARKET INSIGHT
Q1
The data shown below includes the 2 locations surveyed within the South Florida $10M+ real estate market for Q1 & Q2 YoY.
2021 2022 2023 # OF SALES PALM BEACH COUNTY 2021 2022 2023 # OF SALES MIAMI-DADE COUNTY 88 147 78 111 60 58 $10M + TOTAL SOUTH FLORIDA SALES BY LOCATION
2021 TRADES 2022 TRADES 2023 TRADES BESPOKEREALESTATE.COM | 47
$10.2B+
The market had an average of 235 trades between 2019 and 2022, putting the first half of 2023 on pace to meet its historical average.
$10M + SOUTH FLORIDA MARKET REPORT
Total $10M+ Trade Volume for Q1 & Q2 YoY $4.6B + $3.3B + $2.3B + Q1 & Q2 2021 Q1 & Q2 2022 Q1 & Q2 2023 48 | LUXURY MARKET INSIGHT
The data shown illustrates the total sales quantity and volume within the ultra-luxury real estate market surveyed within South Florida for Q1 & Q2 YoY.
2021 2022 2023 # OF SALES $10M–$20M 2021 2022 2023 # OF SALES $20M–$30M 2021 2022 2023 # OF SALES $30M–$40M 2021 2022 2023 # OF SALES $40M+ 170 12 43 10 140 13 28 8 81 7 25 5 $10M + TOTAL SOUTH FLORIDA SALES BY PRICE POINT
2021 TRADES
TRADES
TRADES BESPOKEREALESTATE.COM | 49
2022
2023

50 | LUXURY MARKET INSIGHT
Consistent with the Hamptons market, South Florida saw a drop in sales volume and quantity compared to last year, with a total of 118 trades compared to 189 at the same time last year. Again, the story here is absorption, where there is very little inventory left in Palm Beach and Miami after the massive relocation of 2020 and 2021. While the market had an average of 235 trades between 2019 and 2022, putting the first half of 2023 on pace to meet its historical average, we nonetheless expect the market to underperform throughout the rest of this year given the typically slower deal flow of the third and fourth quarters.
That all said, we believe that these decreases are okay particularly in this market, and that they do not spell out anything ominous for it. More than any other market, we believe these rates tell a story of stabilization and market maturation, continuing with what we reported last year. In 2019 there were hardly enough trades in South Florida for it to even be considered an alpha market. Then in 2020 and 2021, there was a boom in $10 million+ trades, a 327% increase from 2019.

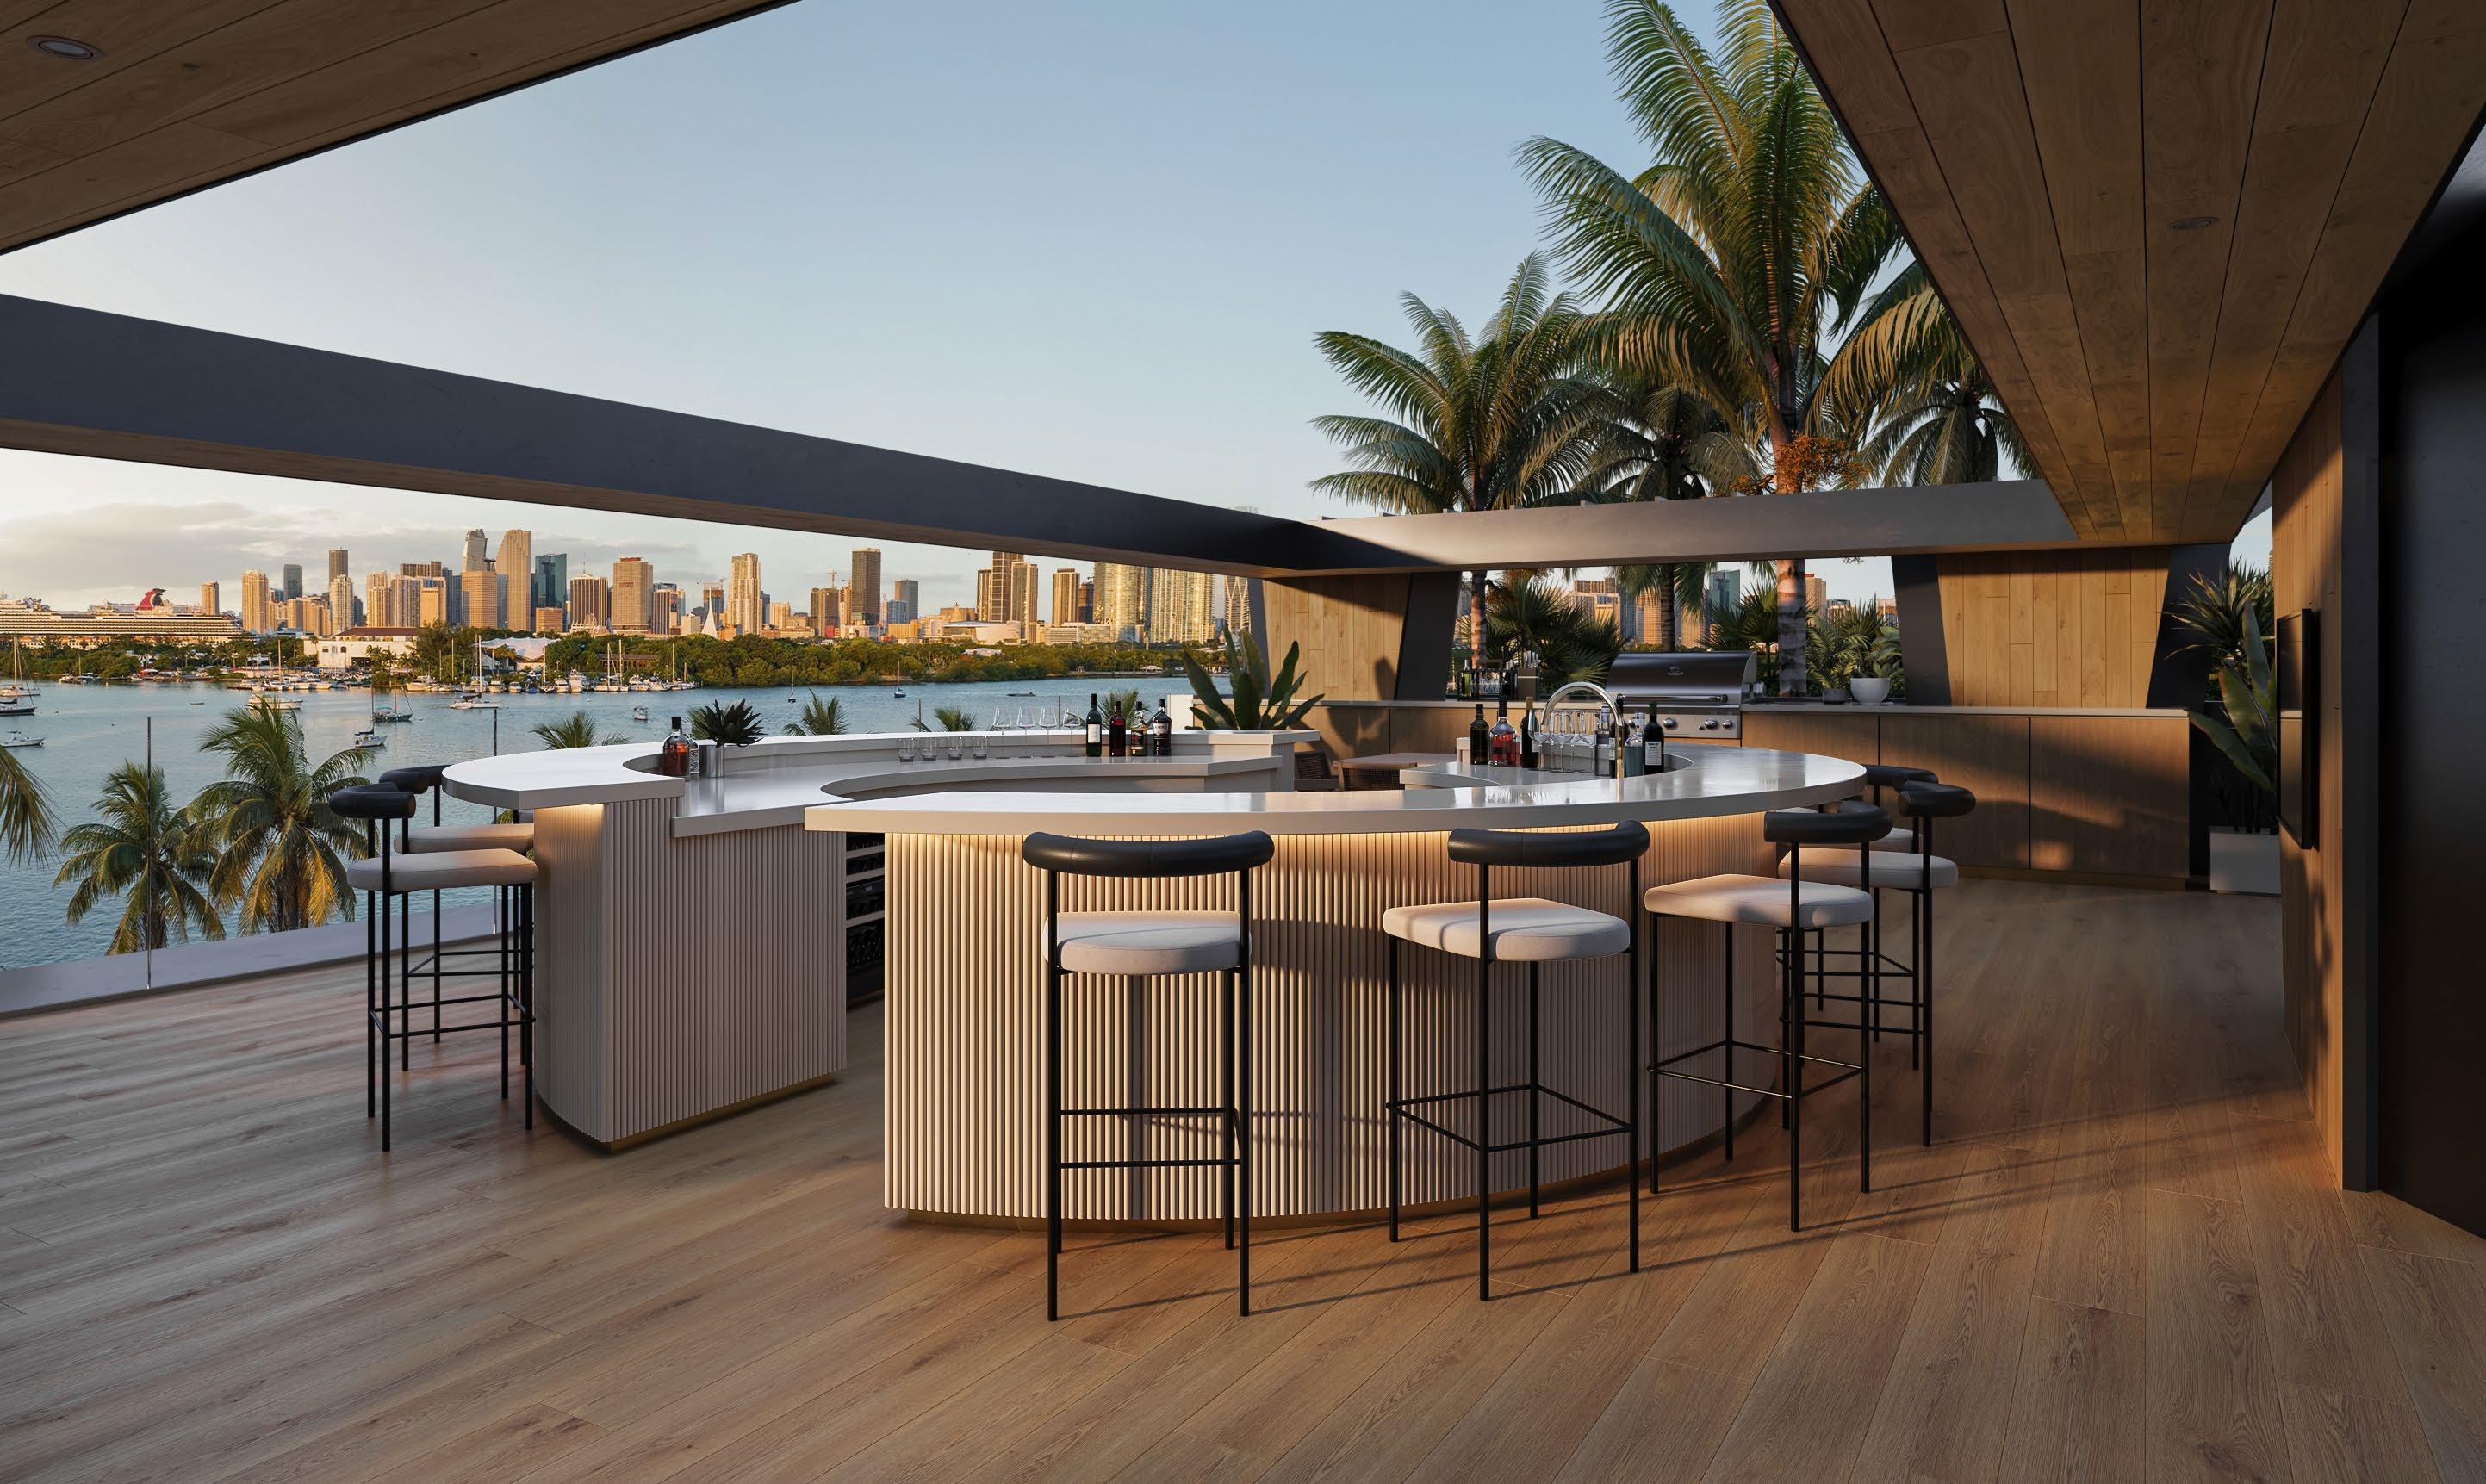
1236 S. Venetian Way, Miami Beach, FL Miami Waterfront Living 0.61 Acres +/- | 207’ of Frontage Bespoke Exclusive. $27,995,000 BESPOKEREALESTATE.COM | 51
The fact that the market has dipped in 2022 and 2023, but has not returned to 2019 levels, suggests that UHNW buyers continue to seek out properties in Florida despite the pandemic effectively being over, and many are relocating full time there. This makes the market interesting, because while it shares similarities to the Hamptons market in its booming postpandemic history, it becomes more like the New York City market to the extent that buyers are purchasing with the intent of making their new property their primary residence.
This is best demonstrated by the continued year-over-year consistency of both single-family homes over condos and inland properties over waterfront ones. Single family home trades dipped 19% from 2022 to 2023, while condo trades fell by 63%. Inland trades went from 36 to 35 year over year, an immaterial difference, while oceanfront fell by 52%, from 52 to 25 Similarly, waterfront trades declined by 42%, from 101 to 58. This suggests intent of primary residency, because while an UHNW buyer looking for a secondary vacation property in the area might lean towards an urban condo, spacious inland houses are often preferred for full time living, particularly for families with children at home.
Still, this is not to say that water or oceanfront condos are only secondary homes, or that
water/oceanfront is a market lacking in demand; absorption is the problem here again. “There are a finite number of alpha properties facing the ocean or bay, and so the limited inventory has contributed to the increased demand for inland alternatives,” says Zachary Vichinsky, co-Founder and CEO of Bespoke. “Particularly on the islands, like Indian Creek and the Venetian Islands, the jump in waterfront land sales in previous years has resulted in new construction projects, which are only still being completed this year.”
Similarly to New York City and the Hamptons, properties that did transact in Miami proper were done so at a premium, and we expect that buyers will continue to pay premiums as long as waterfront properties remain scarce. For buyers who are looking to add value, we expect some to turn their sights north, to properties like 2000 Ocean. Just one mile north of Sunny Isles, there are upwards of billions of dollars of investments.
In general, like the Hamptons and New York City, 2023 trades have favored turnkey homes that transacted quickly, where buyers were willing to pay a premium for the perfect property that met all of their individual criteria. Land/teardown sales fared poorly in Florida, where short investment horizons were more greatly impacted by high interest rates.
Inland trades went from 36 to 35 year over year, an immaterial difference.
52 | LUXURY MARKET INSIGHT


3187 Royal Road, Miami, FL Rare Double Waterfront Land Opportunity 6 Lots Available | 1.4 Acres+/806’ of Frontage | 62,713 SF+/Bespoke Exclusive. $49,950,000 BESPOKEREALESTATE.COM | 53
South Florida Quarterly Transaction Quantity
South Florida Quarterly Transaction Volume
TOTAL TRANSACTION QUANTITY QUARTER 160 140 120 100 80 60 40 20 0 Q1 ‘21 Q2 ‘21 Q3 ‘21 Q4 ‘21 Q1 ‘22 Q2 ‘22 Q3 ‘22 Q4 ‘22 Q1 ‘23 Q2 ‘23
TOTAL TRANSACTION VOLUME (MILLIONS) QUARTER $3,500 $3,000 $2,500 $2,000 $1,500 $1,000 $500 $Q1 ‘21 Q2 ‘21 Q3 ‘21 Q4 ‘21 Q1 ‘22 Q2 ‘22 Q3 ‘22 Q4 ‘22 Q1 ‘23 Q2 ‘23 54 | LUXURY MARKET INSIGHT
South Florida Yearly Transaction Quantity
Halfway into 2023, South Florida is at 50% of the average annual trade quantity since 2016, but due to the historical drop off in the second half, South Florida is on track to underperform relative to historical average.
There are a finite number of alpha properties facing the ocean or bay, and so the limited inventory has contributed to the increased demand for inland alternatives.”
ZACHARY VICHINSKY | FOUNDING PARTNER AND CEO
TOTAL 2023 PROJECTION “ TRANSACTION QUANTITY YEAR 400 350 300 250 200 150 100 50 0 2021 2022 2023
BESPOKEREALESTATE.COM | 55
SOUTH FLORIDA $10M+ MARKET
YOY COMPARISON
LISTINGS VOLUME LISTINGS VOLUME LISTINGS VOLUME OCEANFRONT 58 $1,397,589,000 52 $936,703,994 25 $625,122,000 WATERFRONT 146 $2,616,055,500 101 $1,795,317,685 58 $1,124,210,325 INLAND 31 $559,222,959 36 $563,632,397 35 $553,503,499 TOTAL 235 $4,572,867,459 189 $3,295,654,076 118 $2,302,835,824 BY SETTING 2021 TRADES 2022 TRADES 2023 TRADES NEW CONSTRUCTION 59 $1,042,105,000 41 $796,967,784 36 $646,736,774 LAND/TEARDOWN 17 $259,634,500 35 $721,912,108 9 $156,550,000 TURN-KEY 159 $3,271,127,959 113 $1,776,774,184 73 $1,499,549,050 TOTAL 235 $4,572,867,459 189 $3,295,654,076 118 $2,302,835,824 BY VINTAGE SINGLE FAMILY 54 $877,820,000 107 $1,778,882,901 88 $1,833,003,150 TOWNHOUSE 181 $3,695,047,459 82 $1,516,771,175 30 $469,832,674 TOTAL 235 $4,572,867,459 189 $3,295,654,076 118 $2,302,835,824 BY TYPE 56 | LUXURY MARKET INSIGHT
LISTINGS VOLUME LISTINGS VOLUME LISTINGS VOLUME PALM BEACH COUNTY 88 $2,063,370,959 78 $1,423,823,356 60 $1,305,199,324 MIAMI-DADE COUNTY 147 $2,509,496,500 111 $1,871,830,720 58 $997,636,500 TOTAL 235 $4,572,867,459 189 $3,295,654,076 118 $2,302,835,824 BY LOCATION 2021 TRADES 2022 TRADES 2023 TRADES $10M - $20M 170 $2,417,602,459 140 $1,728,173,240 81 $1,102,916,449 $20M - $30M 43 $1,034,085,000 28 $743,995,736 25 $589,600,375 $30M - $40M 12 $434,745,000 13 $440,522,600 7 $233,949,000 $40M+ 10 $686,435,000 8 $382,962,500 5 $376,370,000 TOTAL 235 $4,572,867,459 189 $3,295,654,076 118 $2,302,835,824 BY PRICE POINT BESPOKEREALESTATE.COM | 57
LIST WITH THE $10M+ EXPERTS
Experience the change that Bespoke represents, placing more specialized resources, more value, and more compelling results in the hands of our clients.
Over $9B in $10M+ Transactions.
INVITATION
Our client-centric brand breaks the rules and redefines industry standards; we believed you deserved better, so we built a data-driven platform that delivers unprecedented access to the most sophisticated resources and precisely pairs the world’s finest offerings with their most qualified buyers.
Contact us to learn more.
BESPOKEREALESTATE.COM
HAMPTONS: 631.500.9030 | NYC: 212.542.4582 | SOUTH FLORIDA: 305.800.9030 PM@BESPOKEREALESTATE.COM BESPOKEREALESTATE.COM TAILORED FOR $10M + . TAILORED FOR YOU. © 2024 Bespoke Real Estate LLC (“Bespoke”), a licensed real estate broker. Bespoke’s terms and conditions and may be changed at any time. Bespoke disclaims any and all warranties, express or implied, including, but not limited to, warranties as to the reliability, accuracy or currency of any information, images and/or other content herein. Bespoke fully supports and complies with the fair housing act, equal housing opportunity act and related state and local laws that prohibit discrimination.


