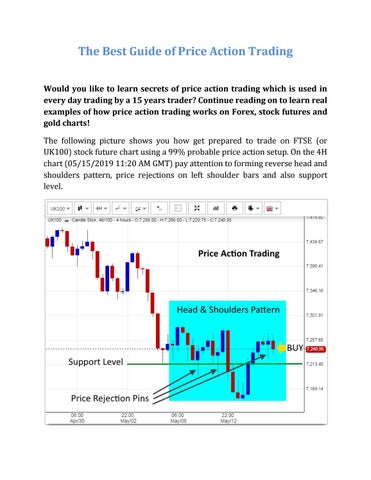
The Best Guide of Price Action Trading Would you like to learn secrets of price action trading which is used in every day trading by a 15 years trader? Continue reading on to learn real examples of how price action trading works on Forex, stock futures and gold charts! The following picture shows you how get prepared to trade on FTSE (or UK100) stock future chart using a 99% probable price action setup. On the 4H chart (05/15/2019 11:20 AM GMT) pay attention to forming reverse head and shoulders pattern, price rejections on left shoulder bars and also support level.
Now that you have captured this 99% probable trading opportunity you just have to wait the price reaches its lows on the right side shoulder in the next few hours and enter the trade. To pinpoint the exact entry, you can zoom in the chart to 1H period and study the opportunity more closely.
On 1H chart we see that a minor head and shoulders pattern is forming. Also, we can draw a minor support level just at the base of the 1H head. Now we only have to wait and see if the price breaks down this level or not. If yes, our entry will be at major support level and if no, it is a good signal that the minor
head and shoulders pattern will not completed and we can enter at the minor support level. According to the entry, we set our Stop Loss and let the trade to make us some nice profit! The following picture is an example of a 100% winning trade on NASDAQ100 stock future (4H chart) using two price action rules (price rejection pin bars at support level and price diversion from mean). We have three strong price rejections at a major support level. Also, the trend is slightly upward and if we draw an approximate regression line we see that a diversion from mean impose an upward force on the price. Hence, we conclude that a buy order as indicated by yellow BUY is a guaranteed winner trade. By daily scanning of 1H and 4H charts you can hunt similar guaranteed trading opportunities on all financial assets (including forex, gold, crude oil, stock indices and stocks).
Following picture shows a price action trade on S&P500 future (again 4H chart). Meeting support and resistance lines signals a major reversal. Also multiple price rejections guarantee an upward move at the BUY position.
And on gold 4H chart we have a consolidation zone. Tail price rejection pins and also a big pull up mean diversion force shows the price will go up at the breakout. Just buy gold and watch growing your trading account balance!
As you see, price action is the easiest, most reliable method of trading. It works like a charm on all time frames and for all assets. Many successful traders use price action rules in their daily trading and with some practice you can use this amazing trading method too.
The above information is a brief part of this book: http://learn-forex.awardspace.us/book.html To learn the best methods of Forex and stock trading including top price action rules, 90% profitable chart patterns, automated and model predictive trading I highly recommend reading this book. http://learn-forex.awardspace.us/book.html