INSIDE BFA WORKSHOPS FOR BETTER BIKING
TRACING THE ROUTE OF A JOURNEY INTO BIKE ADVOCACY GEARING UP FOR NATIONAL BIKE MONTH A WISCONSIN JUNKET WITH MINORITY MOUNTAIN BIKERS REFRAMING ROAD DESIGN: SLOW ROADS SAVE LIVES

INSIDE BFA WORKSHOPS FOR BETTER BIKING
TRACING THE ROUTE OF A JOURNEY INTO BIKE ADVOCACY GEARING UP FOR NATIONAL BIKE MONTH A WISCONSIN JUNKET WITH MINORITY MOUNTAIN BIKERS REFRAMING ROAD DESIGN: SLOW ROADS SAVE LIVES


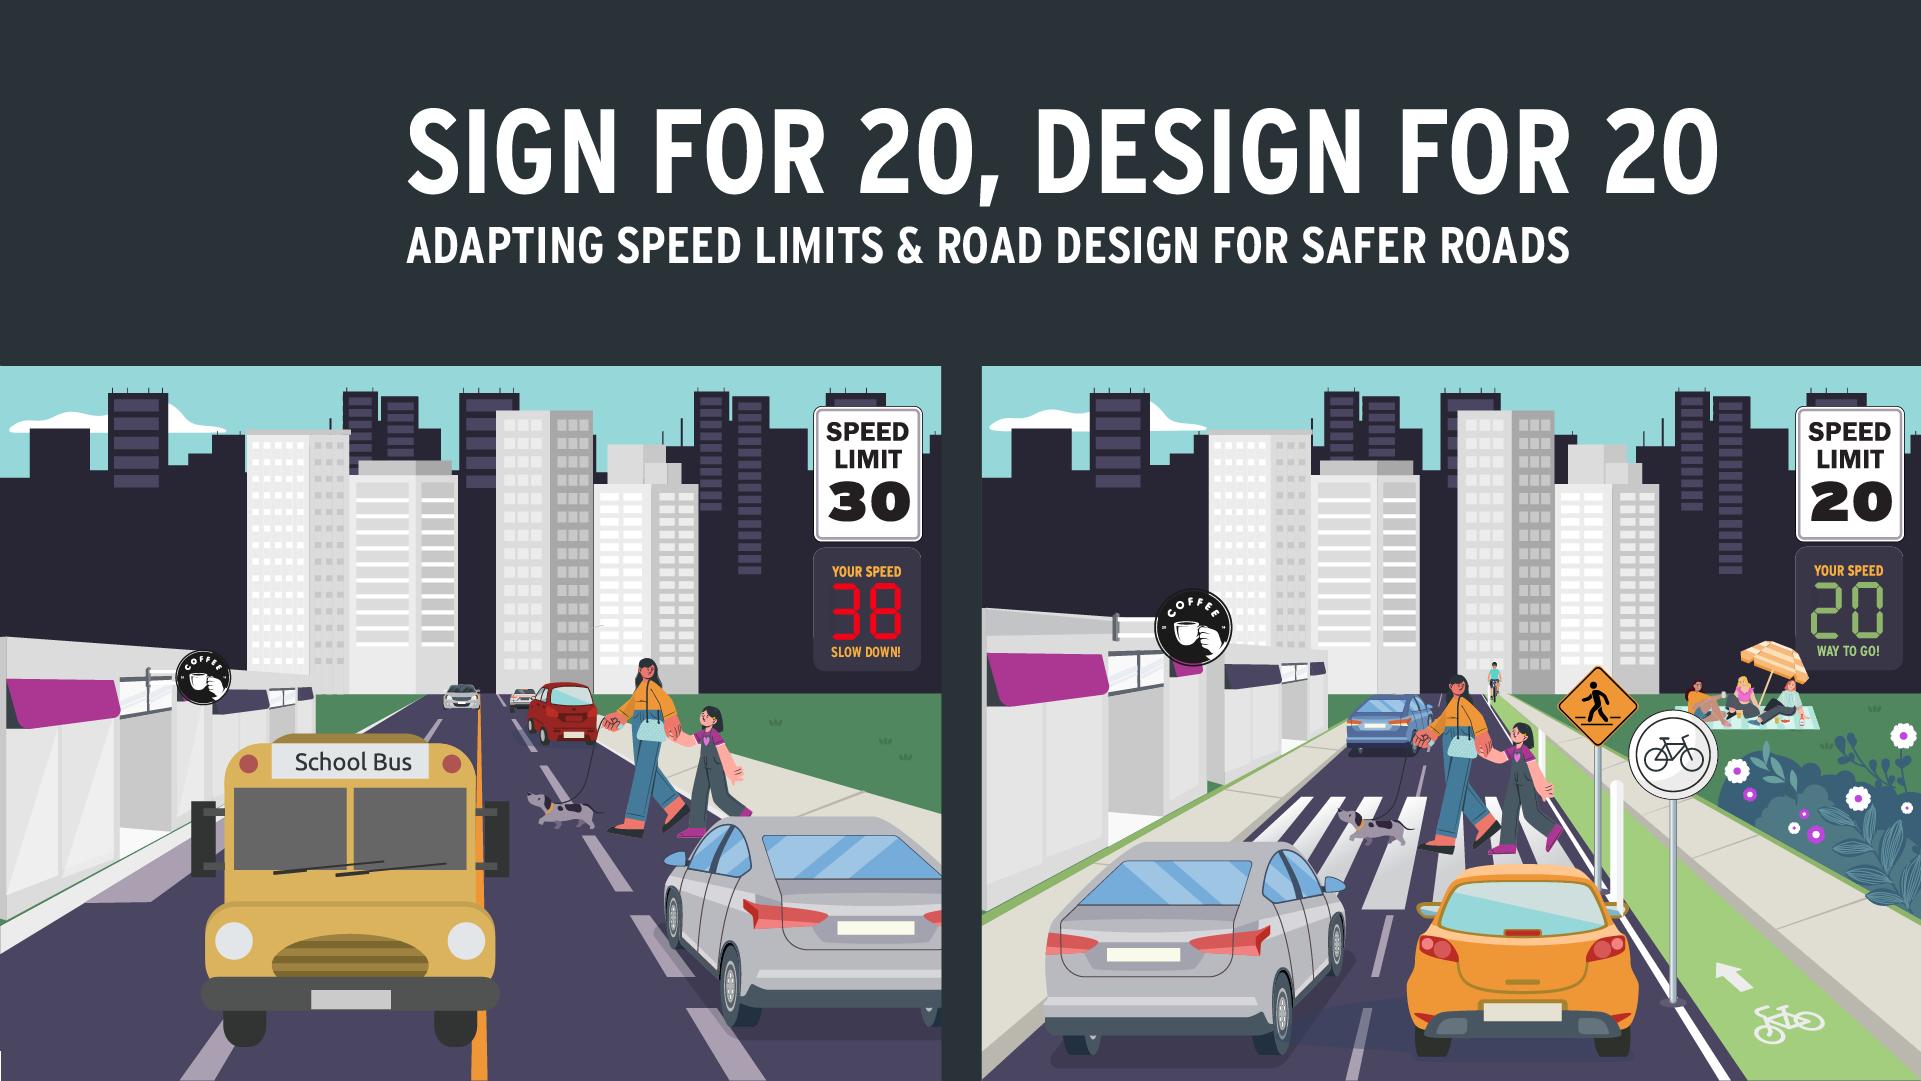
The current approach to setting speed limits prioritizes driver preference rather than safety. We need to reframe thinking around speed to incorporate all road users.
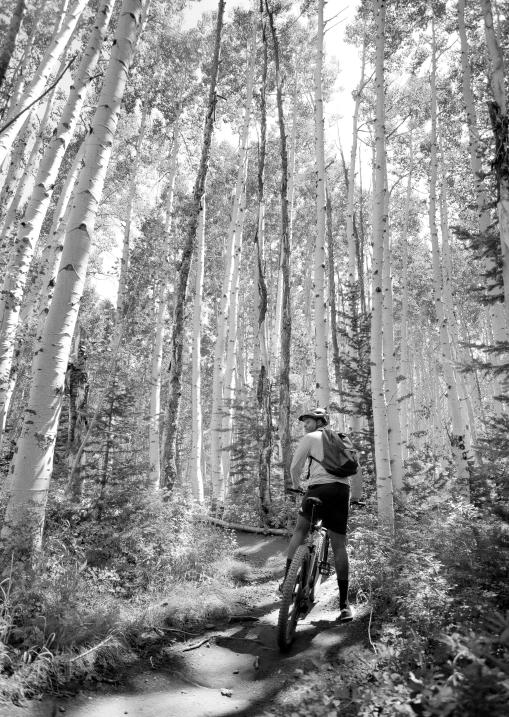
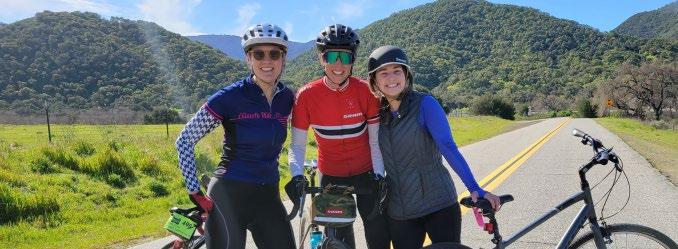
The League went off-roading in Wisconsin where federal policy fellow Connor took to the trails with Minority Mountain Bikers. Get the read-out on the trip and a taste of Midwest mud!
Learn how the League’s seven Bicycle Friendly Community Workshops in 2023 supported local efforts to build connected networks and better places for biking.
Any business can take part in Bike Month. We’ve got 10 ideas for every employer to try during May, or anytime of year, to support the health and well-being of their employees.

NOT EVERY STORY MAKES IT INTO OUR MAGAZINE. Fortunately, when the sheer amount of bike joy taking place in cities and towns across America meets the limitations of print, we have our humble blog on our website to act as a repository of information and inspiration. There, you will find frequent announcements from our programs, like the latest Bicycle Friendly America (BFA) awards or new scholarships available for aspiring League Cycling Instructors, and timely updates on the latest research and policy developments from our advocacy team.
But there are some stories you just have to read. And if you missed them on our blog, we wanted to give you a second chance to sit down with these stories and the lessons within this issue of American Bicyclist. With “Reframing Road Design”, we are doubling down on slow roads, both through educating advocates and making the case to decision makers. In our recap of the seven Bicycle Friendly Community (BFC) Workshops we put on last year, you’ll see communities taking strides to ensure biking does get better for everyone. Then, there are the real highlights: stories from people like you about their journeys in biking and in bike advocacy.
BY BILL NESPER
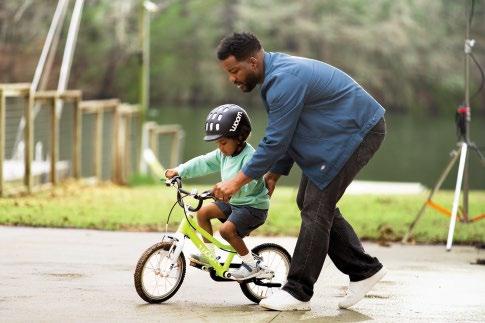
What I see and what inspires me in every story we publish, either in print or online, is that every step towards safer streets and more bike joy starts with an individual. That could be you taking our Slow Roads Save Lives pledge, or that could be a small business owner attending a boot camp for aspiring Bicycle Friendly Businesses.
Each of us powers the movement to build a Bicycle Friendly America for everyone through our everyday actions, even through the simple act of biking. Because every time you bike, you’re making the case for more bike lanes, for safer roads, for healthier communities.
As we celebrate Bike to Work Day and more bike ride-filled days, I’m grateful for all you do as advocates and as League members to support the work you’ll read about in this magazine, the work you can read about in our blog, and the work you may never read about that gets done every day in bike shops, breweries, cubicles, and countless other places all in the collective effort to make biking better for all.


BY KEN MCLEOD, POLICY DIRECTOR

15% of drivers choose to drive that speed or higher.
The 85th-percentile speed represents the speed at which 85 percent of drivers choose to drive that speed or slower, and 15 percent of drivers choose to drive that speed or higher.
85% of drivers choose to drive that speed or slower

It’s simple physics. But to fully realize the lifesaving power of slower roads, it will take more than doing the math. We must reframe how speed limits are set and how we design roads to achieve slower speeds.
Speed limits are the most common way that we regulate individual speed choices in order to control the significant risks drivers can impose on others. The Slow Roads Saves Lives campaign sees speed limits as a tool for controlling risk based upon known injury severity rates at different speeds.
How did the first speed limits come about in the United States?
The League of American Bicyclists was one of the first organizations to campaign for paved roads. At the time—the 1880s—it was so that bicyclists could go faster more safely. The Good Roads campaign delivered 100,000 signatures to Congress in 1889 and called for federal support for roadbuilding, before the widespread adoption of the motor vehicle. As that changed and motor vehicles became more common on the roads, traffic deaths became an increasingly common tragedy due to the size and speed of those vehicles. Speed limits began to emerge to combat the threat to public health caused by motor vehicles.
Speed limit setting policy has changed over time, but the basic ideas of the traditional car-centric approach to speed limit setting were established by the 1960s. Between 1926 and 1956, the Uniform Vehicle Code (UVC) underwent several revisions to create and consolidate various districts for speed limit setting, with slower speed limits recommended for school zones and residential areas only briefly. By 1956, the UVC recommended only two speed limits: 30 mph for urban districts and 55 mph for all other roads. That recommendation would continue unchanged until 2002 when the organization responsible for the UVC ceased to exist.
How do public agencies decide what speed limit to set?
The defining feature of traditional speed limit setting is a car-centric awareness of how the driver feels when driving on a road. Attitudes and research defined a framework where drivers, rather than engineers, elected officials, traffic safety or public health agencies, or policy professionals, were empowered to decide the safe and reasonable speed for a given road. This continues to be seen today in official policies, comments, and attitudes where public agencies say things like “we believe that the 85th-percentile speed… represents the speed of the prudent driver.” The 85th-percentile speed represents the speed at which 85 percent of drivers choose to drive that speed or slower and 15 percent of drivers choose to drive that speed or higher. In the words of an old brochure from the Institute of Transportation Engineers, “The 85thpercentile speed is how drivers ‘vote with their feet.’”
According to a 2019 survey of traffic professionals by AAA, “98% of survey respondents consider the 85th-percentile operating speed when raising or lowering posted speed limits.” The 85th-percentile speed limit setting method has been difficult to displace from its role because it makes a range of claims about its results.

Take the “Slow Roads Save Lives” pledge to help us show how many people across the country support slow speeds and slow roads that save lives.
The 85th-percentile method makes a claim about safety. The “Solomon curve” published in 1964 is a graph based on studies of rural roads that identified lower crash rates at the 85th-percentile of driver speeds. The 85th-percentile speed is said to promote safety because it minimizes dangerous speed differentials between vehicles. Setting speed limits lower than the 85thpercentile speed is claimed to reduce safety by increasing speed differentials between law abiding drivers and “prudent” drivers who speed.
The 85th-percentile method makes a claim about legitimacy.
The 85th-percentile speed is used to provide a means for law enforcement to differentiate “bad” drivers who are speeding from “good” drivers who are simply behaving in the way the road makes them feel is appropriate. Setting speed limits lower than the 85th-percentile speed is claimed to antagonize drivers against enforcement efforts and “create a poor community image.”
The 85th-percentile method makes a claim about objectivity.
The 85th-percentile is a quantitative and observable metric that can be measured in a site visit, providing traffic engineers a consistent metric to reference when setting speed limits.

WHEN THE PUBLIC DEMANDS SAFER ROADS, THE 85THPERCENTILE METHOD UTTERLY FAILS TO HEAR THEIR DEMANDS.
SCOPE OF 85TH-PERCENTILE
REFORMED APPROACH

According to that same AAA survey, “The top reason to lower a speed is receiving requests from the public to improve safety (76%).” When the public demands safer roads, the 85th-percentile method utterly fails to hear their demands.
The 85th-percentile method is not used when safety is a priority. When communities decide to prioritize safety for places like schools and parks, they often use statutory speed limit authority to lower speed limits for those places and do not use the 85th-percentile method. In these circumstances, the speed choice of drivers is already understood as being outweighed by the safety of others.
The 85th-percentile method has not de-legitimized speeding or legitimized agencies building roads for safer speeds.
Decades of research shows that speed limit compliance is low, so the 85thpercentile method has habituated turning “bad” speed limit violators into “good” drivers by raising speed limits based on the 85th-percentile speed chosen by drivers. The last national survey of speed limit compliance by NHTSA showed that more than 18 percent of drivers violated the post speed limit by 10 mph or more for all roadway types reviewed. The 85th-percentile method of differentiating “good” and “bad” drivers struggles to make sense of the idea that a “good” driver can still be going too fast for the safety of others and assumes a solution of enforcement rather than redesigning the road. Agencies “responsible for building and maintaining the state transportation system [with] no authority to cite vehicle violations of any kind” will nevertheless use the legitimacy of enforcement as a justification for not lowering speed limits instead of addressing how their planning and construction responsibilities can effectively manage speeds.
The 85th-percentile method promotes a limited scope of objectivity.
The 85th-percentile method identifies driver speeds, but struggles to account for people outside of vehicles, who rarely walk at a rate of more than 3 mph or bike at a rate of more than 20 mph. These speeds are always on the low-end of the speed distribution and do not meaningfully impact the 85th-percentile speed chosen by drivers.
The 85th-percentile method can be, and is, often supplemented by the consideration of other metrics but those metrics are rarely as quantitative, observable, and seemingly objective. Crash frequency is the second-most used consideration, but crash reporting is often incomplete, crash frequency is not necessarily observable in a site visit, and crashes may be attributed to driver behaviors other than speed choice. In response, some public agencies dismiss speed limits lower than the 85th-percentile as “unreasonably low speed limits, also called irrational speed limits” without seeming to consider that requests for slower safer speeds are reasonable and rational even if the slower speed cannot be achieved without redesigning the road.
Reformed approaches to speed limit setting and road design tend to start with the existing practice of car-centric speed choice and driver preferences, and look to add safety measures on the margin.
This can be seen in the diversity of considerations that supplement the dominant use of the 85th-percentile method, in designs like sharrows that can be applied without otherwise changing the roadway, and in the structure of guidance documents which identify operating speed as a primary design consideration without recognizing or attempting to correct its historic predominance.
A reformed approach is a start towards safety, but it still leaves bicyclists, pedestrians, and other non-drivers on the margins.
A REFORMED APPROACH IS A START TOWARDS SAFETY, BUT IT STILL LEAVES BICYCLISTS, PEDS, AND OTHER NONDRIVERS ON THE MARGINS.
The reframed approach proposed by the Slow Roads Save Lives campaign is to put people and safety first. The AAA survey in 2019 found only eight percent of respondents considered injury severity statistics, but injury minimization is a signature of the speed limit setting approach used by other countries with better traffic safety records than the United States. According to NHTSA, “countries with a zero deaths vision and framework…no longer rely on the 85thpercentile or other operating speed distributions, but set limits according to injury minimization principles.” The Slow Roads Save Lives campaign is necessary to encourage shifting this currently fringe consideration of people’s lives to being a central component of how speed limits are set and understood. Injury minimization principles, like the 85th-percentile method, also make claims about why they are proper.
Injury minimization principles make a claim about safety.
Injury minimization principles are based upon decades of research showing that injury severity is linked to the speed at which a crash occurs. By setting speed limits for slower speeds, the force involved in a crash is lower and the risk of serious injury or death is reduced. Physics dictate the potential harm in the crash and once a speed limit is chosen it is up to the public agencies that build and design roads to ensure that the targeted speed limit is one most drivers choose based on the road design.
Injury minimization principles make a claim about legitimacy.
According to injury minimization principles, a speed limit is legitimate because it represents the amount of risk acceptable to the community. Once the level of risk is chosen by policy makers, then it is up to public agencies to design roads, implement enforcement systems, and create a culture of driving that achieves natural compliance by most drivers with the chosen speed limits. Rather than legitimacy being an outcome of driver choice or experienced solely through the lens of enforcement, legitimacy derives from a direct discussion about the amount of risk imposed by drivers and whether that risk is acceptable.
Injury minimization principles make a claim about objectivity.
Crash severity is a quantitative and observable metric that can be measured and has been found to be directly related to the speed of a crash for decades. Crash severity is not measured through a site visit, but can be objectively considered for any site and systemwide because it is a function of physics.
THE 85TH-PERCENTILE SPEED MAY BE A MEASURE OF SPEED LIMIT COMPLIANCE, BUT IT SHOULD NOT BE AN INDEPENDENT JUSTIFICATION FOR A SPEED LIMIT.
The 85th-percentile speed may be a measure of speed limit compliance, but it should not be an independent justification for a speed limit. It is reasonable, rational, and justifiable for a community to want a slower speed limit to improve traffic safety and provide a better experience for people outside of vehicles on a street. It is up to roadway designers, planners, and engineers to design streets so that they meet those demands and support people who want to comply with the speed limit rather than people who want to speed. As FHWA said in a recent report to Congress, “changes to roadway design features and the context of the roadway have direct impacts on operating speeds.” We can and should make physical roadway changes to impact operating speeds so that they are slower and safer for people.
Speed limits matter and they matter because people will be injured or killed if they are hit by a vehicle moving at high speed. At 30 mph, the urban district speed limit recommended by the UVC from 1956-2002, nearly one-quarter of
pedestrians hit by a vehicle traveling the legal speed limit are expected to die. According to the NTSB, “lowering speed limits can lead to sustained traveling speed reductions and crash reductions in urban areas.”
The Slow Roads Save Lives campaign says that we can do better than lethal legal speed limits with an expected 25 percent risk of death when a person is hit. Community demands for slower speeds are worthy of action, regardless of the speeds drivers currently choose. Reframing road design means that people living in communities choose whether or not a speed is rational, and public agencies must be prepared to achieve those target speeds through better design that helps people drive at those community-chosen speeds.
Help the League show the broad support across the country for Slow Roads. Take the “Slow Roads Save Lives” pledge to help us show how many people across the country support slow speeds and slow roads that save lives.


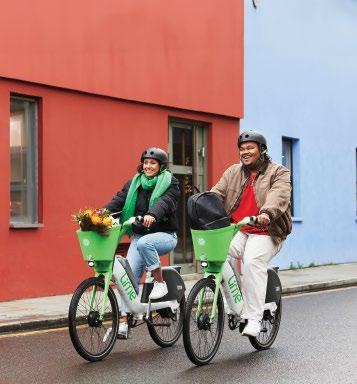
IN 2023, LIME E-BIKE RIDERS TOOK
3.8 MILLION TRIPS IN 36 CITIES ACROSS THE US.

BY JING ZHANG
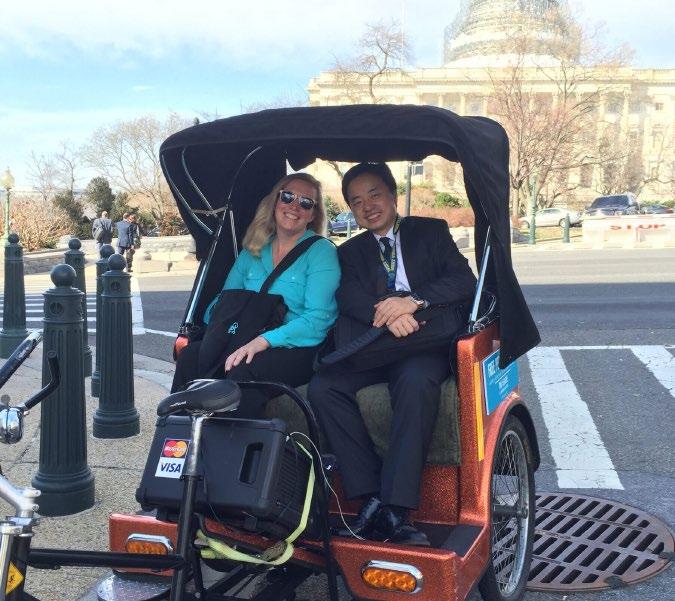
After emigrating from China in 2008, Jing Zhang began a journey into bike advocacy that continues to this day. Recently, he was selected to be on the U.S. Department of Transportation’s Advisory Committee on Transportation Equity. We asked the multi-year National Bike Summit attendee to reflect on the moments along the way. >>
Looking back on these experiences, it is interesting to trace the dots. As I look ahead, attempting to foresee the path might require a dash of faith, a belief in the unseen threads that will bind the future into a coherent picture.”
— Jing Zhang
One Thursday afternoon in early July, my phone buzzed with a call. On the other end was Irene Marion, Director of the United States Department of Transportation’s Departmental Office of Civil Rights. Irene’s voice carried the news that Secretary Buttigieg had chosen me to be part of the department’s Advisory Committee on Transportation Equity. At that moment, thoughts raced—from the prospect of meeting Mayor Pete in person to bringing my daughter Annie to visit the National Mall and dining on Jiaozi at my cherished restaurant on Wisconsin Ave in DC.
Out of over 240 applicants, I was one of the fortunate 24 chosen for the committee. All I did was submit a statement and my resume. I’m still figuring out why I got picked— perhaps a mix of factors played a role, but who knows. Maybe the “why” doesn’t matter much; what matters is that I’m set to take on the responsibility and dive into the excitement ahead.
I’d like to share some snippets of my journey so far. Though they are small, these moments are the building blocks of my growth as both a planner and an individual.
It was a spring day in 2009 when I found myself seated on a sofa, gazing at a tree through the window of the Mountainlair lounge at West Virginia University. At that moment, I made a decision—to step away from my doctoral program in piano performance and walk into something more tangible. My path led me to planning. The reason is simple: I had a penchant for sketching maps of imaginary places that existed only in my mind. In planning, I could make the imagined into reality.
Following my graduation from Clemson, my wife Tingting found a position teaching Chinese at a summer camp in Morgantown, WV. With spare time on my hands, I drove around town carrying my portfolio, in search of volunteer opportunities. A visit to the county planning office led me to Patty Booth, the county planner. I presented my portfolio. A few days later, Bill Austin, the director of Morgantown Metropolitan Planning Organization, called me, offering me a project which I could participate in. To this day, Bill remains my supervisor, and Patty’s desk is just six feet away from mine.
As a grad student in city and regional planning at Clemson, I volunteered in the International Making Cities Livable conference held in Charleston, SC, where I met Randy Wade from NYC DOT. Subsequently, I interned at Randy’s Pedestrian Project Group in the summer. Memorable were the hands-on surveys to enhance pedestrian safety at intersections in Queens and Bronx, and the hour-long subway journey from Flushing to Downtown Manhattan.
The Morgantown Bicycle Board has some amazing people. Frank Gmeindl introduced me to the basics of cycling and later LCI seminars. The board also has Chip Wamsley, the owner of Wamsley Cycles and Gunnar Shogren, a former masterslevel World Champion in cyclocross. My bicycle planning education (in the U.S.) kicked off from there.
At the 2016 National Bike Summit, I did a presentation on improving bicycle on-street facilities through highway paving projects. More interestingly, as a representative of WV Connecting Communities, I participated in the summit’s Lobby Day. Alongside Caron Whitaker, now Deputy Executive Director of the League, I visited West Virginia Senator Capito’s and Senator Manchin’s office. I still remember Caron telling me the importance of post-congressional visit follow-ups. The summit not only granted me experience of advocacy but also the know-how of navigating the Congress buildings and locating the eatery.
I failed my first LCI seminar in Lancaster, PA, because I made a dangerous in-lane left turn during my road test. Fortunately, my journey to becoming an LCI didn’t end there. My second seminar was in Greensboro, NC, taught by Jim Nicholson, and I passed it. Though time has passed, the counterintuitive lesson of hazard evasion remains vivid—taking a lean towards the opposing direction before executing a sharp turn to the direction you want to go.
In recent years, my volunteer activities are mostly with the American Planning Association, where I am chairing the American Planning Association (APA) International Division, co-chairing APA JapanUnited States Collaboration Interest Group, and am a webmaster for the APA Asian and Pacific Island Interest Group. Looking back on these experiences, it is interesting to trace the dots. As I look ahead, attempting to foresee the path might require a dash of faith, a belief in the unseen threads that will bind the future into a coherent picture.
Jing Zhang is a pianist, transportation planner, and full-stack web developer.
BY MARLEE TOWNSEND, COMMUNICATIONS COORDINATOR
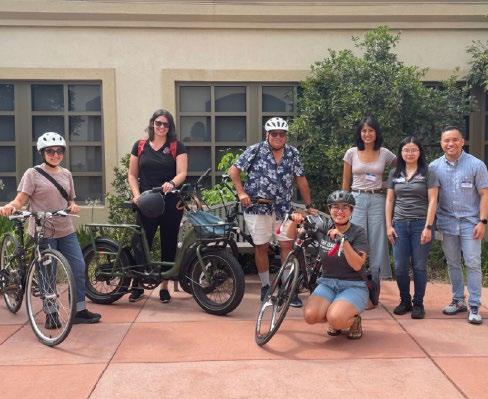
Over the spring and summer of 2023, the League led the second year of our Bicycle Friendly Community (BFC) Workshops. Our Bicycle Friendly America Program Specialist, Anna Tang, traveled across the country to help local leaders and advocates assess their current work around biking and strategize how to achieve their vision for success.
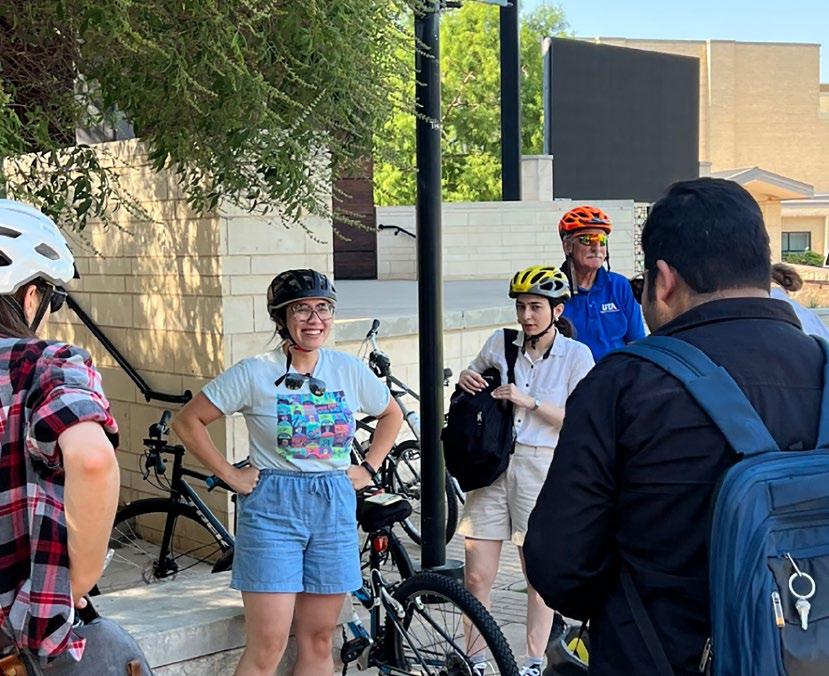
EACH BFC WORKSHOP TOOK A DEEP DIVE into benchmarking the community’s progress to date, offered concrete solutions to their issues, and provided a holistic view of how to strengthen and grow the community’s bicycling efforts through an equity lens. Each workshop also included a bike audit which you can conduct in your community!
The communities selected this year were Yuma and Chandler, AZ, Rancho Cucamonga, CA, Bowling Green, KY, Brandon, MS, Euclid, OH, and Arlington, TX. As we look back on the successes of 2023, we caught up with Anna to hear about her whirlwind tour across the nation.
Anna, what was it like to travel all over the country doing these workshops?
My travel started in April and ended in August, nearly three dozen flights later. Over the summer, I traveled to more than six states and seven communities— encompassing a mix of extremely arid climates to more lush, mountainous regions. I had been to a lot of these states before, but it was my first time visiting the state of Mississippi! Overall, it was a great experience. Meeting a range of wonderful people who all had incredibly insightful experiences into what would make their communities better for biking and overall better places to live was refreshing and energizing. I also loved being able to see some local projects in the context of each community’s perspective and hear about future endeavors. The traveling left me exhausted in the best possible way and looking forward to next year’s adventures.
The workshop is described as a hands-on needs assessment where you identify a community’s strengths, weaknesses, goals, solutions, etc. Did you find that a lot of communities had similar challenges, or were they all different?
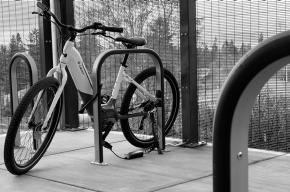
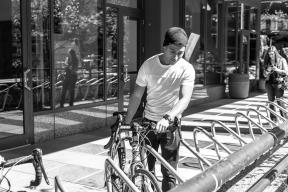
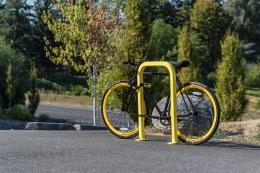
Most communities shared a lot of similar challenges. The most common issues identified were the need to have connected on-street bike networks and more on-bike learning opportunities for both youth and adults—especially bike education for school-age kids. Constant themes throughout the sessions also included more regular events that normalize bicycling and encourage the community to bike, as well as the need for better and more bike parking.
The good thing about these common needs is that they are realistically feasible to find solutions for, and once implemented these solutions will make a big impact. The last similarity I will mention is enthusiasm. Each community clearly has a deep desire to bring about the best results for their area, and the drive and integrity to make it happen runs strongly throughout every place I visited.
What were some of your favorite conversations throughout the workshop series?
I’m a big nerd so my favorite conversations were talking to folks about the intricate details of how the local city or larger government entities have found creative ways to use funding that isn’t necessarily allocated for biking/walking projects— such as in school zones or other similar areas that have broader and more flexible funding opportunities and uses. I also enjoy talking to people about their trail projects and advocacy efforts. One of my most memorable conversations was with two high-school students who attended the workshop in Ohio—they were thrilled to learn about how to get to the local bike park! The good thing about the workshops is that each community set up ways to continue the conversation, so it wasn’t truly saying goodbye when I had to leave.
How did the bike rides compare across the country?
The bike rides—which also functioned as mini bike audits to assess a small section of a community’s bikeability—were all very similar, although the number of people who joined for the ride varied a lot by each community. It seemed like the lowest attended bike rides were in communities that had the most work to do to build comfortable, safe, and connected networks. Many attendees said that the bike ride was their favorite, if not, the most eye-opening part of the workshop. Not a surprise there!
Were you able to offer assistance that directly resulted in a success story for a community?
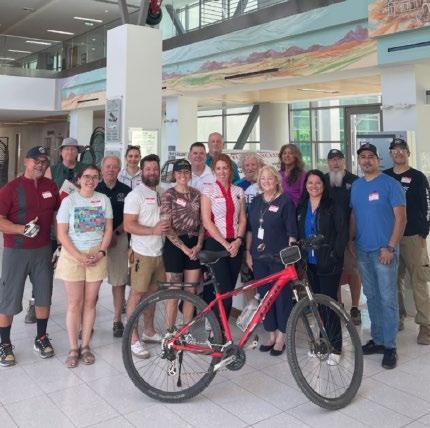
In Yuma, AZ, I was able to connect the local workshop group with our deputy executive director Caron and the Intersections Initiative team to help them learn more about federal funding opportunities. Specifically, I mentioned the SS4A grant (Safe Streets and Roads for All) and they ended up applying for it and winning some grant funds! It will help them build some of their bike networks and make their streets safer for all roadway users. Most, if not all, of the other communities have since begun to meet regularly and have put on group bike rides, formed bike subcommittees, and have plans to come to the 2024 National Bike Summit in Washington, DC!
In 2024, we’re excited to continue the work of providing Bicycle Friendly Workshops across the United States. We will be traveling to Memphis, TN, Wentzville, MO, and Roswell, GA for the next round of BFC Workshops.
Want to host one in your community? Reach out to us for more information on how to bring the League to do a workshop for your community! Email anna@bikeleague.org to learn more.
We are hosting Bicycle Friendly Workshops across the United States in 2024:
Memphis, TN
Wentzville, MO
Roswell, GA

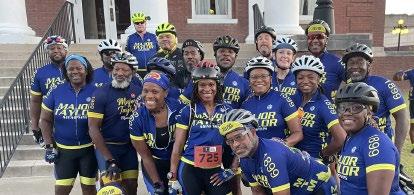
Three days of rides and fellowship await at the Major Taylor International Cycling Alliance’s Annual Convention. It brings Major Taylor Clubs together to exchange ideas on health and wellness, guide new clubs and youth chapters, provide certification for Ride Leader training, and promote best practices for cycling safety and advocacy. The convention also aims to highlight the legacy of Major Taylor in today’s cycling community. With over 85 clubs worldwide and an estimated 6,000 members, MTICA strives to keep Major Taylor’s name on the lips of cyclists and the cycling community.
majortaylorinternational.com
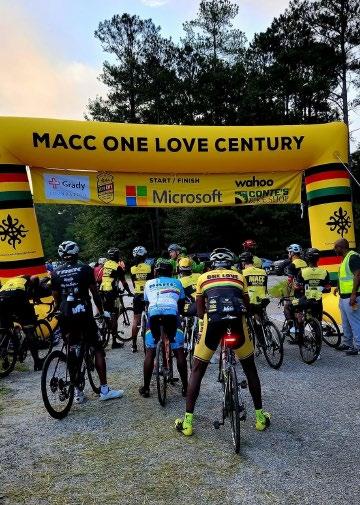
The One Love Century, hosted by the Metro Atlanta Cycling Club, is one of the most loved bicycle events in the Southeast, attracting more than 1,300 riders on the Saturday of Labor Day Weekends, since 2006. It traverses the roads of South Fulton County, in an area known to locals as Silk Sheets, taking riders on rural roads through horse farms, state parks, and small towns. Expect mostly rolling hills, with only a couple of tough ones thrown in.
onelovecentury.org


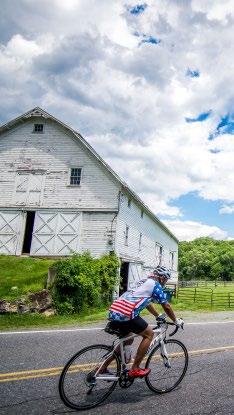
JUNE 23
Cyclists of all abilities discover the beauty of upstate New York on this scenic ride along and across the Hudson River, and over the rolling hills of the surrounding area. Whether stationed at the start/finish on the shores of the Hudson, helping folks refuel at rest areas, or fixing flats en route, volunteers play a huge role in making this a special day for some 2,000 cyclists.
bike.nyc/events/discover-hudson-valley-ride/
JULY 1
Climate Ride, in partnership with Kendall-Jackson Winery, is hosting our first one-day and timed Climate Ride Wine Country Edition, on Saturday, August 17, 2024, in Santa Rosa, California. This one-day, Gran Fondo-style ride offers options for every level of cyclist.
Race for time, or ride for fun on four different route options designed for all cycling abilities through the beautiful Sonoma County Wine Country.
climateride.org/events/wine-country/
BICYCLE FRIENDLY AMERICA
BY CONOR HERBERT
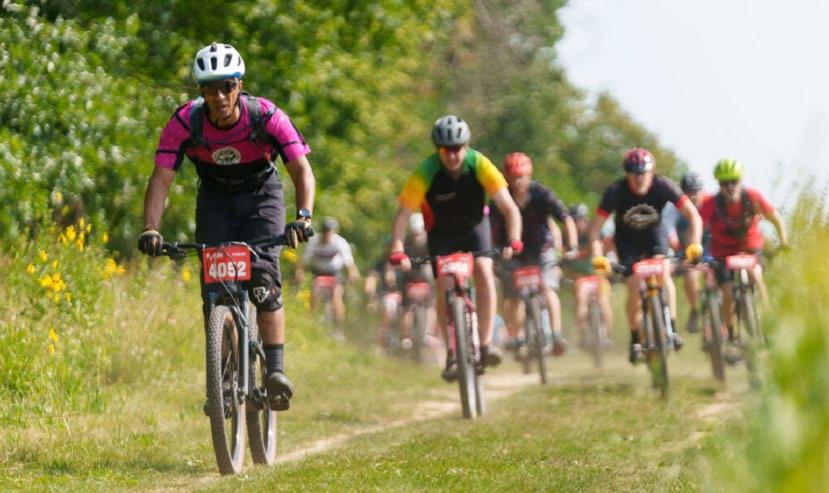
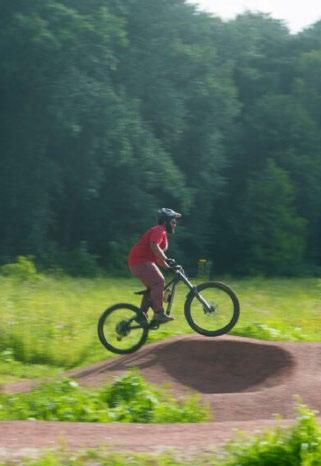
You can’t tell from the angle of the photo, but I’m actually in dead last for my age group here. • Photo by Korey Hopkins, khopshoots.com
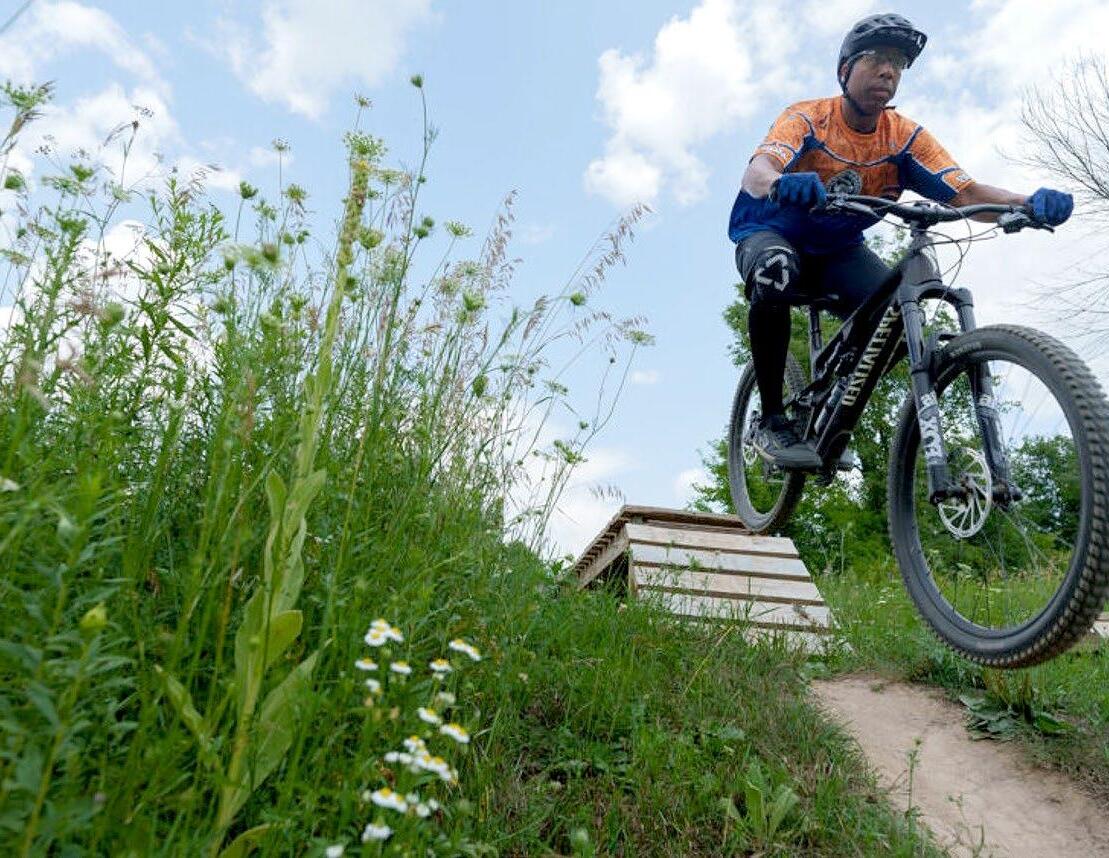
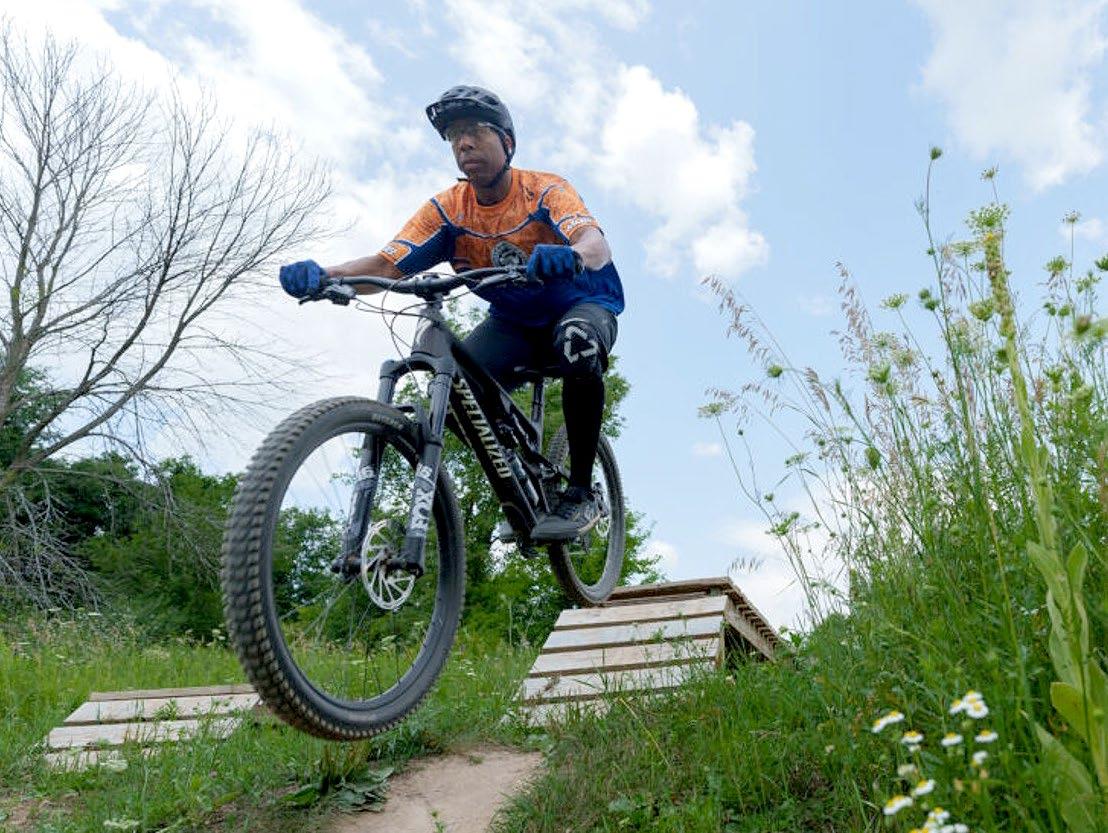
At the League, we have been engaged in building relationships with advocacy and rider groups that focus on minority experiences with cycling. So when a post about the Wisconsin Minority Mountain Biker Week came across my Instagram feed, I jumped at the opportunity to do exactly that. Minority-focused cycling events are crucial to growing the sport and making cycling more inclusive, but they can still be inaccessible for all who would like to participate. For instance, I do not own a functional mountain bike, so when I learned that event partners the Chris Kegel Foundation and their family bike shop, Wheel & Sproket, were not only providing free bike rentals for those who needed, but also providing housing for the event, I was in!
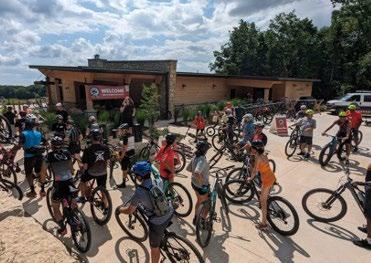
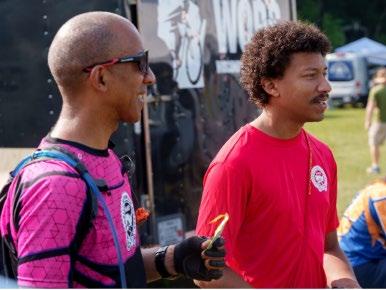
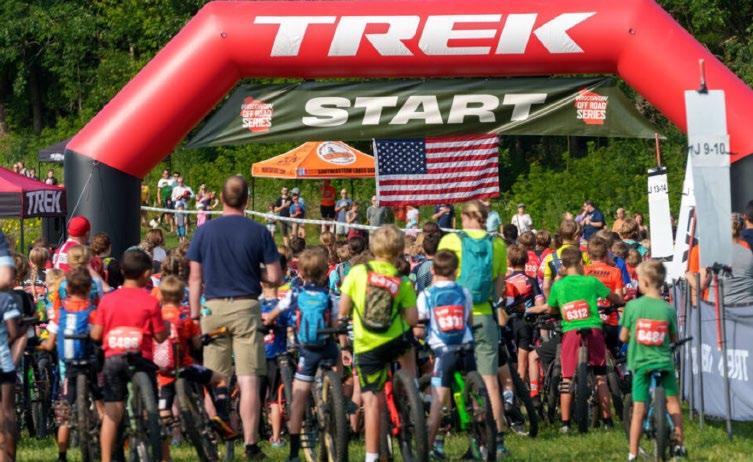
EARLIER THIS YEAR we shared an interview with the founder of Minority Mountain Bikers (MMB), Harry Hill. Last week, two BIPOC League staff members, Jamil and I, joined MMB for a trip to Wisconsin with the Chris Kegel Foundation and Wheel & Sprocket to visit Trek Bicycle Corporation’s Headquarters, ride their trails, provide some skill training to some inner city students with Milwaukee Public Schools, and participate in the Trek Red Barn Classic, part of the Wisconsin Off-Road Series and the host of the state championships.
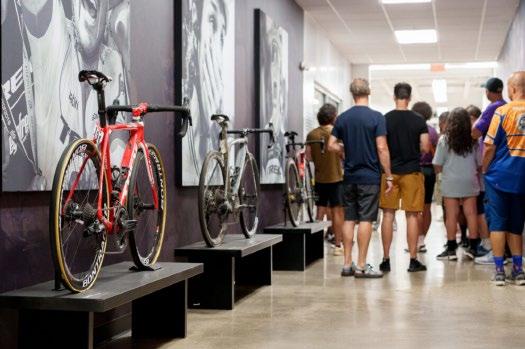
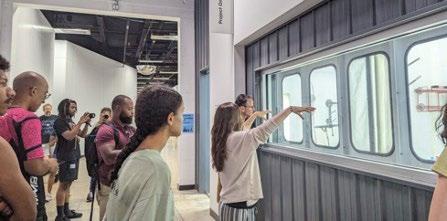
Our first stop was Trek’s Headquarters in Waterloo, which serves as a multi-use building with an office space on one side and an assembly factory on the other. I was honestly a little taken aback by how sleek and modern their building actually was.
I’m not a total stranger to corporate office spaces but this space was super open except for its design office space—and for good reason! Opposite their office space was their painting and assembly areas. This is where Trek’s Project One bikes are painted and assembled alongside some of their higher-end bikes.
While we were walking through, we also got to see some Fetch+ 4s being assembled. Those were unveiled earlier this year, and they’re Trek’s take on an electric bakfiet with enough bucket room and rack strength to support up to 5 kiddos and a rider.
Afterwards we headed over to an area in a different part of Waterloo called Trek Trails, which they operate in conjunction with some of the local farmers. The trails are for employee recreation, hosting races (obviously!), and filming some of the marketing materials they make for their bikes and products.
Not only are the trails used by Trek employees, but they are also designed and maintained by them too! They have built a little barn stocked with supplies to dig out and groom the trails for all conditions including snow. There are both traditional mountain biking trails that weave through the trees and prairies, and there are also a couple of dirt jump tracks and a poured pump track. The whole complex is actually quite cool.
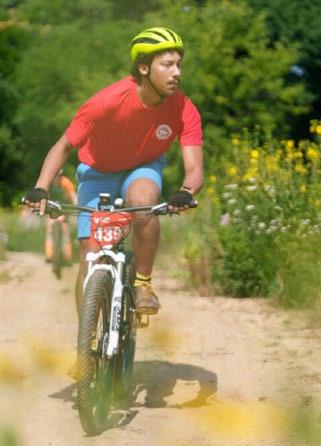
Since it was my first time properly mountain biking, you might have expected that I might have taken a fall or skidded my hands through a stand of trees, and I would be happy to inform you that, on this first day, I did exactly that. There was one instance where I got disconnected from my little group because I had to slow down a bit because of the fat bike I was riding. When I emerged to join them in a clearing a little bit later, I was covered in dust. As it turns out, tackiness plays an important role in determining when a tire does and does not stay connected to the ground.
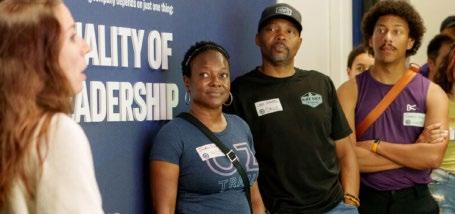
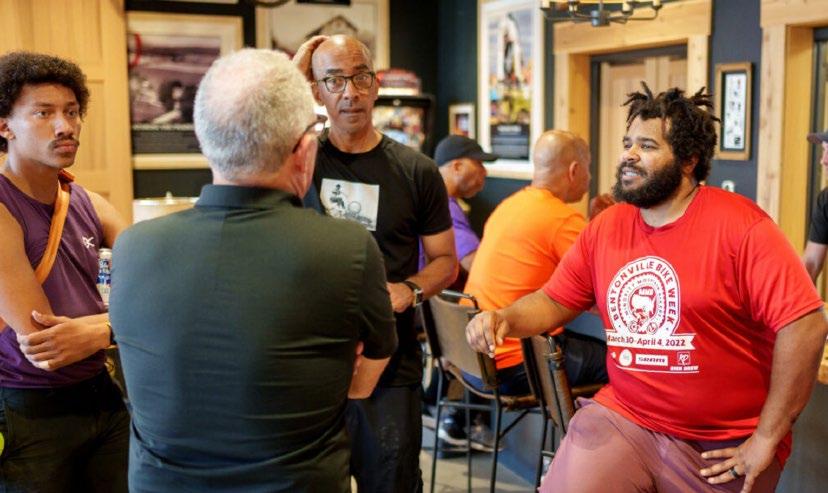
After a day of riding, we took some time to debrief at the lounge and heard from some of the Wisconsin folks who had set up the trip, Trek’s VP of Human Resources Mark Joslyn, and watched a short documentary that premiered earlier that week about Minority Mountain Bikers.
To cap the night off, the group headed over to lounge at a lakeside house where some of us were put up to sleep. This was our final destination every night, and it was quite stunning.
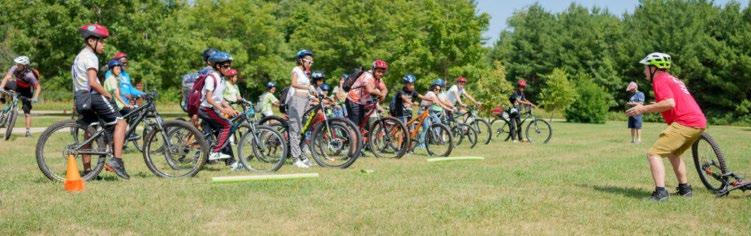
The next day we headed over to the John Muir Trails to learn and teach some mountain biking skills. For several hours of our riding, we rode with students from some of the inner city schools inside of Milwaukee Public Schools. Jed Olson, the Executive Director of Outdoor Recreation Alliance in Wisconsin and a NICA coach in Milwaukee, led a skills clinic before some of the attendees set out with groups of kids to try the trails.
We still had a bit of time after the kids left, and Jamil and I joined a group to ride one of the longer trails in the park. I learned a bit more about what the dirt in Wisconsin tastes like through this experience and I also had my first go at biking through sand.
The next morning we split up. Some of us went to two recreation areas, CamRock and Quarry Ridge, while the rest of the group went to Trek Trails to do a pre-ride of Sunday’s race route.
I was super sore and physically depleted from the two previous long days of riding by this time, so I ended up just pre-riding the course. Jamil, who has been mountain biking for two years and has attended
several MMB events, hit the trails at Quarry Ridge with the crew. These trails were more downhill-oriented with big features, and rocky natural terrain—Jamil’s favorite! After a few laps and sessioning features, the group narrowly missed getting caught in a thunderstorm and decided to call it.
After all, the next day was race day.
The next day we all convened on the Trek Trails site to watch and partake in the Trek Red Barn Classic. I raced the “Citizen” class meaning I did two laps (10 miles) altogether. I was handily passed by a lot of people, which I’m not too mad about. This was my second time participating in a race, and I still don’t know how to manage my energy and speed—or anything really. Afterwards, I heard something about this thing called “Bike-Body Separation” that NICA emphasizes for racing and mountain biking—a challenge I’ll look forward to taking on during my next mountain biking adventure.
Overall, the weekend was awesome. I learned a lot about the biking world in Milwaukee and got to share some space with some extremely fun people. While it was not Jamil’s first time at an MMB event, it was mine, so I did not know what to expect at all. The experience was absolutely awesome and I am glad we had the chance to attend. Lots of the people we met were not aware of the League, and I think meeting and speaking with NICA coaches in particular about the things we do like LCI trainings might encourage some of them to sign up so that they can be experts on helping their students be just as good as getting places as they are at competing in races.
Photos courtesy of Harry Hill and Korey Hopkins, khopshoots.com
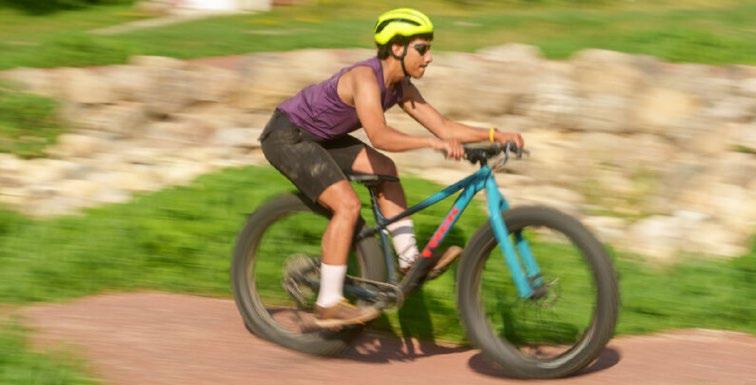
Turns out fat bikes are not the same as the road and gravel bikes I’m used to. In fact, you can see some of the dust I got all over me as a part of the adjustment process!
BY RAVEN WELLS
National Bike Month comes around every May and we want to help your business celebrate! Bike Month is a great time to support your existing bike commuters and to help others try bike commuting for the first time.
Here are ten ideas your workplace can use in National Bike Month or any time of year to celebrate biking »
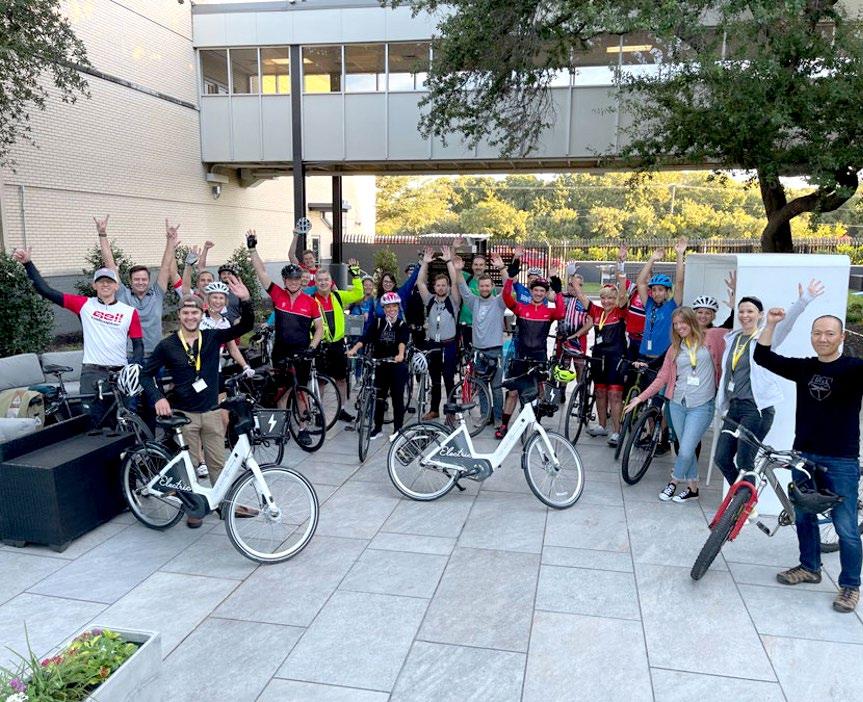
Bell Flight, a Bronze-level Bicycle Friendly Business, hosts a breakfast rally for Bike to Work Day.
1 PLAN A BIKE TO WORK DAY EVENT. Host a Bike to Work Day breakfast to celebrate and encourage commuters who arrive by bike that day or sponsor a local Bike to Work Day commuter pit stop for the whole community.
In 2021, Bronze-level Bicycle Friendly Business Bell Flight hosted a breakfast rally attended by hundreds, including many local organizations and leaders, like former Mayor Price, who participated in the ride and engaged in conversations on how to make the Fort Worth, Texas, community a better place to ride bikes.
2
SURVEY YOUR TEAM’S BIKING INTERESTS, SKILLS, AND EXPERIENCE LEVELS.
Knowing everyone’s experience level can help you plan a Bike to Work Day ride that accommodates first-time/inexperienced riders with a “no-drop” rule, meaning no rider gets left behind, or pair up newer riders with more experienced bike commuters who may be able to help their colleagues prepare and map out a comfortable route to bike to work for the first time.
3 ARE THERE PEOPLE WHO HAVEN’T BEEN ON A BIKE IN A WHILE?
Ask a local League Cycling Instructor to host a Lunch-and-Learn at your business on the basics of bike commuting and bike safety or to help lead a low-stress lunchtime ride with safety tips for your employees.
Tip: encourage your company leadership to join the lunchtime ride to help set a good example and help them understand the value of supporting more biking to/at the office!
4 BRING IN A PRO TO MAKE SURE ALL THE BIKES ARE READY TO ROLL.
Contact a local bike shop to bring in a mechanic to offer basic tune-ups or maintenance advice for your employees before Bike to Work Day.
FOR
Find an LCI near you and find local bike shops on our map, too!
Watch this webinar and learn how any business can hit the mark on an inclusive and engaging Bike Month.
Personally, my favorite part of the day was seeing the diverse group of cyclists that showed up to participate. Whether you are a hardcore cyclist or someone who just enjoys taking a stroll around the neighborhood, Bike to Work Day is about showing just how doable and fun active transportation can be.”
—Bell Flight, a Bronze-level Bicycle Friendly Business
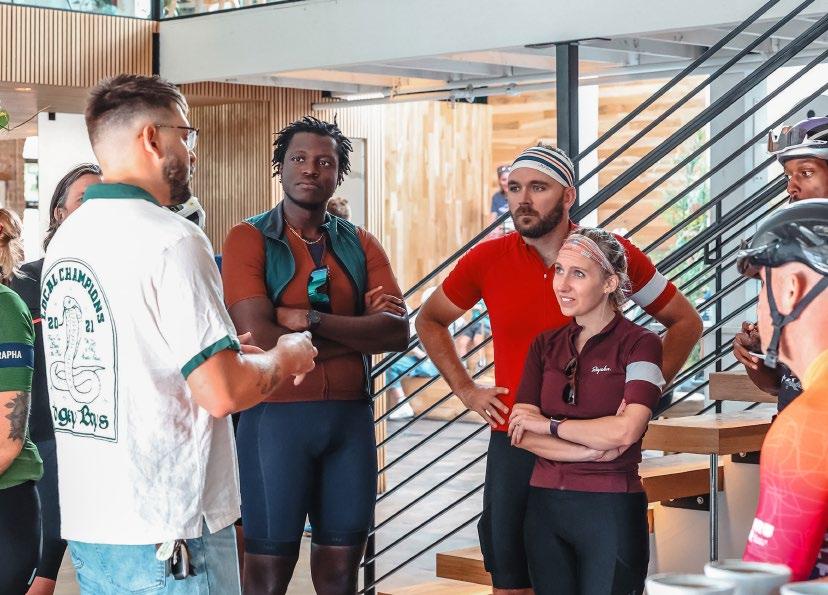
An education moment at Onyx Coffee Lab, a Bicycle Friendly Business in Arkansas.

5
Reach out to other businesses, local advocacy organizations, and local universities and schools to brainstorm a joint event that would be impactful for the entire community. Download our Bike Month Guide for more event ideas and guidance on planning a great Bike Month event.
Order Smart Cycling Quick Guides, ABC Quick Check Bookmarks and Bike Pins to share with employees, customers and guests. Place your order by April 19 to receive your materials by May 1, or order by May 1 to receive them before Bike to Work Week begins!
7 MAKE IT OFFICIAL.
If you’re already a Bicycle Friendly Business, order some BFB swag to show off your award status. If you’re not a current BFB, you can apply to the BFB program today!
8 SPREAD THE WORD.
Queue up your company’s social media account for #BikeMonth with the League’s free Bike Month promo materials and Smart Cycling videos. Our newest Smart Cycling videos are available in both English and Spanish, as are some of our Bike Month graphics.
9 PUT YOUR MONEY WHERE YOUR BUSINESS IS.
Support bike advocacy and bigger and better future Bike Months by becoming a Business Member of the League and your local and statewide advocacy group.
10
VISUALIZE YOUR PROGRESS.
Work with your employees to keep track of progress and accomplishments made during the month i.e. minutes or miles spent riding, how many employees participated in group rides, etc.
This can be done with a big chart on the wall or online tools like Love To Ride are a great way to have all employees keep track of their rides and miles. Set shared goals to motivate employees and use the data you collect to reward riders! Don’t forget to take plenty of pictures and tag the League when you post them on social media!
WHAT FIRST MOTIVATED YOU TO BECOME AN LCI?
Caryn Davis
I became an LCI after the first time I attended the National Bike Summit in DC. I went to lobby for better infrastructure, and after spending much of the week learning about the great work others were doing with bike education, I was hooked and couldn’t wait to add that to my advocacy efforts. The biggest reason I enjoy teaching is sharing the pure joy I feel when riding and helping others move from “curious” to comfortable and confident. When you see that light up in someone on a bike, it’s just the best feeling.
Brenda Yancor
In 2013, I had been doing bike advocacy work for about three years when the opportunity to become an LCI through a grant program was presented to me. I jumped at the chance to learn more about what it takes to be a certified instructor and be the person to support others in feeling empowered along their bike journey. Being certified to do something I found fun and fulfilling is something I’m grateful for 10 years later.
Tina Chan
I wanted to be more involved with the bike advocacy community and to share with others my passion for bike education. Becoming an LCI was a fantastic opportunity to do both. I am also able to use my teaching, public speaking, and interpersonal skills as an LCI.
IN YOUR EXPERIENCE, WHAT ROLE DOES BIKE EDUCATION PLAY IN EMPOWERING YOUTH?
Isabella Bustamante
Many young people feel like they aren’t good at sports. There’s just a lot of pressure and nerves around how youth sports are presented. But biking is for every person of every body type, and anyone can learn to feel super successful, have fun, and be active on a bike!

TELL US A LITTLE ABOUT YOURSELF AND WHY YOU ENJOY TEACHING OTHERS TO BIKE.
Kat Volzer
I love teaching kids how to ride bikes and ride smart because I love sharing and inspiring all the different ways to ride. I love witnessing a light bulb go off in a child’s brain when they learn what you can do on a bike or with a bike. When I’m not riding bikes or teaching others, I’m usually hanging out with my husband Jake, chasing our five-year-old son Heath around, or yelling at our two crazy dogs Waffles and Chicken.
Bevin Barber-Campbell
One notable experience was Charlotte Webb (yes, that’s her real name!) who attended my Seniors & Bicycling workshop in Montrose. She came to class with a tremendous eagerness and trepidation about getting back on her bicycle after a ten-year hiatus.
At 79, with a recent knee replacement, she was ready to try. The first challenge for Charlotte was simply getting astride her bicycle. After some scooting and gliding, we had her pedaling.
Halfway through, she and I shared an emotional private moment… Tears shed in joy as well as terror. Charlotte was determined and successful in her mission to ride again!
I enjoy teaching bike education to anyone who wants to learn. It is so important to meet our students where they are and then allow them to build their skills and knowledge for safe riding. I just give the tools necessary for the learner to become empowered to ride safely and with confidence. Their joy gives me joy and the cycle (no pun intended) repeats.
The feeling of legacy. Knowing no matter what happens to me, there will always be hundreds of people going on countless bike adventures, thanks at least in part to the work that I love to do.
It has to be the literally thousands of students who learned how to bike for the first time. Our students are diverse— some kids have never had access to a bike before, while others have learned bike skills without learning any road safety. What we do is first teach kids biking on campus so they gain skills in a safe, controlled environment. When students are ready, they put their learning into practice by riding safely on the streets and trails of Minneapolis with their class. The experience can have a lifelong impact on students and on our whole community.
Inspired by these educators’ stories? Find an upcoming LCI Seminar on our calendar and join the team!


OUR MISSION is to lead the movement to create a Bicycle Friendly America for everyone.
We envision a nation where everyone, whether they bike or not, recognizes and enjoys the many benefits and opportunities of bicycling and where everyone can experience the joy of bicycling.
Kevin Dekkinga Director of Membership & Development
Alison Dewey Education Director
Lauren Jenkins
Communications Director
Ken McLeod Policy Director
Danielle Arigoni Chair
Jim Baross
Ed Fendley
Jimmy Hallyburton
Melissa Lee
Jamil Modaffari Policy Specialist
Amelia Neptune Bicycle Friendly America Program Director
Bill Nesper Executive Director
Kelly Gray Membership Coordinator
Kecia McCullough
Ralph Monti
Vivian Ortiz
Ken Podziba
Cadesha Prawl
Lori Richman
Anna Tang
Bicycle Friendly America Program Specialist
Riley P. Titlebaum Education and Outreach Assistant
Marlee Townsend Communications Coordinator
Caron Whitaker Deputy Executive Director
Mike Sewell
Torrance Strong
Triny Willerton
Karin Weisburgh
Anna Zivarts
American Bicyclist magazine (ISSN 0747-0371) is published by the League of American Bicyclists, Inc. to help the organization achieve its mission to educate the public and promote awareness of bicycling issues. ©2024 League of American Bicyclists. Reproduction in whole or in part without permission is prohibited. Article queries should be addressed to communications@bikeleague.org. Your submission of manuscripts, photographs or artwork is your warranty that the material in no way infringes on the rights of others and that the material may be published without additional approval. Opinions expressed by writers are their own and do not necessarily reflect the policies of the League.