9 minute read
The carbon footprint of production


The carbon footprint of production, and how much it matters
In the first of two articles, Judith Thornton discusses the carbon footprint of the ‘stuff’ that we buy.
Earlier in the year I did some carbon footprint calculations with CAT members and students, and decided to make a basic carbon calculator that people could fill out on paper.
It’s relatively simple to get emission factors for domestic fuel use (electricity, gas, wood, oil etc), and for various modes of transport. Dietary emissions are tricky to do accurately, but at a simple level we can make assumptions about vegans compared to meat eaters. For most people, domestic energy, transport and diet are the categories that have the largest impacts, and they are certainly the categories which we can exert most influence over.
If you do one thing today to combat climate change, have a go at the carbon footprint calculation in the box, and act on the findings.
At a UK wide scale, Zero Carbon Britain does a detailed job of working out emissions across the major sectors and how to reduce them. But obviously these categories don’t represent our total impact; we have things like consumer goods, business impacts and public services to account for.
Typically we use a fixed value for these regardless of individual circumstances, and, for the carbon calculator above, I made a simplistic estimate of values to use. But when I did my own carbon footprint, this element was a large chunk of my overall footprint. If this is also the case for you, the obvious thing to do is to focus on doing something else that contributes to combating climate change – such as political lobbying in order to change government policies and advocacy with friends and family to encourage them to make personal changes.
However, it did get me thinking about the carbon footprint of these fixed elements, in particular the carbon footprint of physical goods, i.e. our ‘stuff’.
Calculating the carbon emissions of production Life Cycle Assessment (LCA) is the most commonly used method for working out total carbon emissions from individual goods and services. We start by defining the object or service, and then we draw a flow diagram of everything that we are going to include, expanding it outwards. But whenever we do a bottom up calculation, we are going to miss out impacts, so the answer is usually lower than it should be.
There are several reasons for this. Firstly, it’s difficult to do a complete ‘cradle to grave’ assessment of products, particularly if the lifespan is uncertain, or its disposal is going to be a long time in the future. Accounting for proportions of capital inputs are also difficult (e.g. how much of the total
Carbon footprint calculator
A Contributor
B Your Data
C Units
D Multiplication Factor
Home energy use Electricity kWh 0.352 Gas kWh 0.185 Wood tonnes 190 Oil litres 2.53 Travel car, petrol <1.41 miles 0.25 car, petrol >1.41 miles 0.457 car, diesel <1.71 miles 0.234 car, diesel >1.71 miles 0.346 Bus miles 0.197 Train miles 0.075 Air miles 0.255
E Total (kgCO 2 e)
Diet (standard) 2200kg. Diet (vegan, minimally processed, low waste) 1100
Stuff N/A 1100
Your total kg CO 2 e per year
Instructions Put your data into column B Multiply column B with column D Write total in column E Add up all the mumbers in column E to get your carbon footprint You can get KWh data for your gas and electricity from your bills. Oil and wood are in litres and tonnes respectively. You can either calculate the emissions for your whole household, or divide your home energy use by the number of occupants. The background assumptions about how diet impacts on carbon emissions could be an article by themselves, as could the factors relating to modes of transport. However a rough calculation is probably better than none at all, and for most of us the largest source of error probably relates to working out distances travelled by various means. A full set of emissions factors is available at the link below if you’d like to adapt the calculation. https://www.gov.uk/government/publications/greenhouse-gas-reporting-conversionfactors-2018

carbon impact of a vehicle comes from the impact of building the factory in which the vehicle was assembled?). How widely we cast the net also makes a difference; when we undertake LCA we draw a system boundary, and ignore environmental impacts of parts of the process that are outside that boundary. It’s also unrealistic to undertake LCA for systems that involve a lot of individual items; for example we wouldn’t want to have to list every physical item purchased by the NHS if we were analysing its impacts.
The alternative approach is to undertake a ‘top down’ calculation. We can take the total impact of a country, for example, and divide it by the number of citizens. This gets us round some of the problems described above for bottom up calculations, but other problems arise.
The principal issue is that it’s not possible to do calculations for specific objects, just general sectors or geographic regions. This is a feature of the methodology; the usual technique is to use ‘environmentally extended input-output analysis’. In this, tables are constructed of the financial inputs and outputs from each sector of the economy into and out of every other
sector. Carbon emissions from each of these sectors can then be incorporated into the table, and by use of matrix algebra we can calculate the total impacts of goods and services in an economy, and how changes in one sector impact on others.
These analyses get done at different scales. Global approaches allow us to take the emissions of the entire planet and to see how the flows of goods and services between countries are tied to environmental damage. Within regions and sectors, these analyses allow us to determine the total impact of economic sectors. Whilst most commonly done for carbon emissions, it is also possible to analyse different environmental metrics in the same way.
Production of stuff – whose emissions are they? Lots of our goods are produced in other countries. Are we responsible for these emissions, or are they the responsibility of the country in which they are produced? Hopefully, we would agree that they are our emissions; if I choose to buy a mobile phone, then just because it has been produced in another country, the emissions associated with production are my responsibility. However, this isn’t the way carbon footprints are generally reported, either at individual or country scale. Because of the likelihood of double counting and the complexity of supply chains, the IPCC requires governments to measure and report on territorial emissions; the emissions occurring within our own country.
Since the UK is less of a manufacturing nation, our carbon footprints are actually rather larger than simply our share of territorial emissions. We can use the technique of environmentally extended input-output analysis (described above) to calculate our total ‘consumption emissions’; these are our territorial emissions plus emissions from imported goods, minus emissions from exported goods.
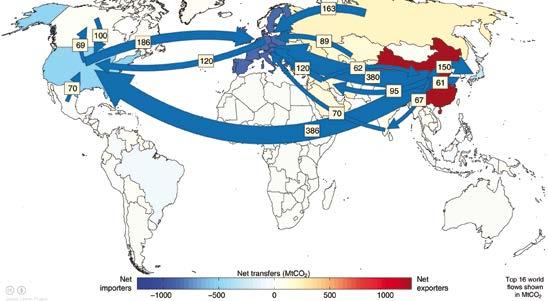
When we look at consumption emissions at a global scale, we get a geographical perspective of the carbon impact of stuff. The map above shows the 16 largest flows (in Million tonnes of CO 2 ) across the globe. For the purposes of this analysis, the EU is taken as a whole. The two largest flows across the globe are the consumption emissions of goods produced in China and exported to the US (386 Mt CO 2 )

and the EU (380 Mt CO 2 ). The colour of each individual region on the map is an indicator of its net flows; so we can see that China is the largest exporter, and the EU is the largest overall importer. Numbers from analyses like these can give us a fair approximation of the impact of our imports. So what is the carbon footprint of ‘stuff’? In my initial footprint calculation I simply took the UK emissions of public and business sectors in the UK (8.1 and 65.9 Mt CO 2 e respectively) and divided them by the UK population, which gives us around 1.1 tonnes CO 2 e per person. The emissions data came from the ‘2018 UK Greenhouse Gas Emissions, Provisional Figures’ published by the Department of Business, Energy and Industrial Strategy (BEIS). However, as we’ve seen above, this is just an approximation of territorial emissions and takes no account of imports; it’s also just a reflection of the energy used in these sectors rather than their total impacts.
If we take data from input output analysis described above then the consumption emissions for the EU-28 are around 23% higher than territorial emissions. Whilst there will clearly be variation between countries, we can estimate our total per capita emissions to be around 8 tonnes CO 2 e per person, (around 6.5 tonnes being territorial emissions, and 1.5 tonnes CO 2 e per person being additional emissions relating to imports). Another source of data on the impact of production of stuff is a report from the Ellen McArthur Foundation. They estimate that 55% of global carbon emissions are associated with energy production, with the remaining 45% of emissions being attributable to goods. However, they include agriculture, food and land use change within goods, and if we subtract these from the total, we end up with around 22% (11 billion tonnes) of CO 2 e/year of emissions coming from all non-food goods. If we divide this by the world population, we come out with a figure of 1.4 tonnes CO 2 e Shutterstock.com

per person. Obviously this masks huge differences; we might expect high income countries to have emissions 4-6 fold higher than low income countries.
Are you confused yet? If you’ve read this far, you’ll notice that I haven’t ever really defined what I mean by ‘stuff’; this has been a deliberate attempt to tackle some of the very messy middle ground between calculation types without getting bogged down in what is included in each calculation. But if we had to come out with an approximate value, we could say that the difference between our consumption emissions and our territorial emissions is a proxy for the carbon
footprint of stuff; that is around 1.5
tonnes/person. We could then add our individual share of services (public and business sectors) of around 1.1 tonnes CO 2 e. Obviously as our energy systems become decarbonised, the impact of manufacturing stuff will begin to go down, because the factories in which our stuff is
produced are using renewable fuels. This could be an argument for buying stuff made in countries with low territorial
emissions. But it is probably easier just to buy less stuff!
In the next issue of Clean Slate, we’ll look at practical measures we can take to use less stuff, how to reduce the impact of stuff we do need, and what the future impacts of
stuff might be in a more decarbonised future. CS
About the author Judith Thornton managed CAT's water and sewage systems for a number of years and was a tutor on CAT's MSc courses. After spells at the Universities of Padua, Cardiff and Leeds, she is now at Aberystwyth University. References available on request.