The Post is one of the most ambitious heritage redevelopments in Canada’s history. Occupying an entire city block, the project will feature over one million square feet of office and retail space upon completion.

VANCOUVER CHAPTER
Regional OFFICE Cost of Business Survey 23RD ANNUA l
The Post by QuadReal
Message from the President
On behalf of NAIOP Vancouver, I am pleased to present the 2022 edition of the NAIOP Cost of Business Survey (COBS). The purpose of this annual survey is to provide a scorecard to rank Metro Vancouver municipalities based on their respective entitlement approval timelines and development charges associated with constructing a hypothetical development project. This year, the focus is on office development.
The survey provides a framework to identify municipalities that have excelled in fostering entitlement and development cost regimes that support job creation and regional economic growth. The COBS awards recognize the municipalities that have outranked their peers in the following categories: Most Improved Fees; Most Improved Approval Timing; and Most Business-Friendly.
The survey also contains interviews with a member of staff from the municipalities
receiving an award, a market overview highlighting the latest statistics and trends in the office asset class in Metro Vancouver, and perspectives on the current office market from experts in the industry. Office real estate in Metro Vancouver remains an attractive asset class and is adjusting to the post-COVID era with utilization levels settling as employees return. The current delivery pipeline of creative, attractive space is adding to the overall office inventory of Metro Vancouver, however, with economic and interest rate uncertainty at play, this further drives important discussions around municipal policy, development approvals, and development costs.
With this in mind, we hope that you find the 2022 COBS report to be particularly valuable in this time of rapid change and evolving expectations in the office market.
ACKNOWLEDGMENT:
Index
Message from the President 2
2022 Highlights
Office Building Prototype 4 -5


Survey Summary
Municipal Fees
Building Permit Data
Mill Rates
Timing 8
Future of Office 9 Market Update 10
NAIOP Vancouver would like to acknowledge and thank all the municipalities that took part in this year’s Cost of Business Survey. Participation is voluntary and the time expended to respond can be significant for planning, engineering, and building departments. Development in any jurisdiction is a partnership between businesses, government, and the community. NAIOP Vancouver is pleased to be in a position to work, on behalf of our members, with all of the Metro Vancouver jurisdictions that participated in the publication of this information for the business community. NAIOP would also like to acknowledge the contributions of CBRE Limited for their office market statistics. If you have any questions regarding this year’s publication, please contact the Cost of Business Survey Committee at cobs@naiopvcr.com.
2 Regional Office Cost of Business Survey Fall 2022
I would like to thank all those who helped in the preparation of this important contribution to transparency in the industry.
Sincerely, Paul Tilbury Chief Operating Officer Dayhu Group of Companies President NAIOP 2022
3
2022 Winners 3- 4
6
7
7
8
Over65Yearsof BuildingExcellence Findoutmoreat Beedie.ca AtBeedie,we'vesteadilygrownfromhumblerootstobecomeWesternCanada'slargestprivate industrialdeveloperandpropertymanager.We’vedevelopedmorethan35millionsquarefeet ofstate-of-the-artindustrialspaceandmanageourownever-expandingportfolioofover 12millionsquarefeet.Whetheranindustrialfacilityormaster-plannedbusinesspark, weareproudtocreateopportunitieswherebusinessescanprosperandpeoplecanthrive. BUILTFORTODAY.BUILTFORTOMORROW.BUILTFORGOOD.
2022 Highlights
The 2022 NAIOP Cost of Business Survey offers annual awards to municipalities that have implemented improvements in development costs and processing times. Our assessment of 20 Metro Vancouver municipalities provides our membership and the business community at large with an essential reference tool for considering development areas. The survey is also a tool for municipalities themselves as a gauge for their own development costs and approval processes as compared to their neighbors.
This year, the 2022 NAIOP Awards for Municipal Excellence will be acknowledging municipalities that have excelled in creating environments positive to business creation. The three categories of awards are:
n Most Improved – Fees: the most improved in development fees compared to previous survey results
n Most Improved – Approval Timing: the most improved in approval timing compared to previous survey results
n Most Business-friendly: implementation of policies to support the creation of new job spaces
The 2022 winners are:
1. Most Improved – Fees: City of New Westminster
The City of New Westminster demonstrated the lowest increase to its total municipal fee from 2020 to 2022 relative to other municipalities.
2022 Winners Q & A
City of New Westminster: Most Improved Fees
Demian Rueter Manager, Development
Planning
What changes have you implemented to lower fees in New West. How have you managed to do that and what impact is that having on real estate developments in City of New Westminster?
New Westminster did not make any significant changes to our building fees in 2021/22 which means increases were fairly limited.
What are some noteworthy current and/or upcoming real estate developments in New West?
Some of the more significant developments in City of New Westminster include Douglas College student housing development at 808 Royal Avenue, Sapperton Green and Aboriginal Land Trust project at 823-841 Sixth Street.
2. Most Improved – Approval Timing: City of Surrey
The City of Surrey demonstrated the largest overall decrease to their total approval timing from 2020 to 2022 relative to other municipalities.
3. Most Business-friendly: City of Burnaby
The City of Burnaby scored high in multiple categories of the Cost of Business Survey, including reporting the lowest overall municipal fees in 2022 and being among the fastest municipalities in terms of approval timing. This has attracted office development to several neighbourhoods within the City of Burnaby.
We interviewed the winners about the improvements they have made and the impact those changes have had on businesses and the real estate community.
City of Surrey: Most Improved Approval Timing
Shawn Low, Acting Manager, Area Planning & Development - South Division City of Surrey
What changes have you implemented to improve approval timing for developments in Surrey and what impact have you seen from that increase?
The biggest change the City has made over the past year is the incorporation of the Guaranteed Permit Timeline Program, where timelines are understood to be aligned with the submission of a complete application. The program has been successful in giving applicants a clear understanding of when their projects should be presented for Council’s consideration. The program has also given staff better tools to track applications as they move through the review process which is helping to reduce permitting times in Planning.
What other noteworthy developments are coming in Surrey?
Surrey continues to see large amounts of developments in the City Centre area. In 2022, we had nine significant projects granted Final Adoption of a Rezoning By-law and Issuance of a Development Permit, representing approximately 2,985 dwelling units and approximately 36,750 square metres of commercial space.
Similarly, the City continues to experience robust growth in its employment areas. Campbell Heights, in particular, continued to see significant development in 2022 with five significant industrial projects completed, representing
Johannes Schumann, Director Development and Urban Design
What changes have you implemented to improve business in Burnaby?
There have been many changes at the City of Burnaby in the past year to improve business in the City. Our CAO, Leon Gous, initiated the ‘Burnaby Moving Forward’ initiative which took immediate action to reorganize some of our departments to improve efficiency and the delivery of our services. One significant move was the creation of a Lands and Facilities Department which consolidates our Realty and Lands, Civic Projects, Facilities Management, and City Land Leasing divisions. In addition, the CAO launched the ‘Burnaby Promise’ which is a commitment by the City to uphold a strong code of conduct, maintain high integrity and ethics, foster strong teams, and above all pursue excellence in customer service.
What noteworthy changes have there been for real estate developers?
Related to ‘Burnaby Moving Forward’ and ‘The Burnaby Promise’ through the sponsorship of the CAO’s office and the Mayor’s Office, we have initiated a Development Approvals Process Review which aims to simplify the application process, improve public transparency, and reduce application processing times. While we are one year into a two year program, we have already established 18 recommendations which are being put to action through implementation over the next year.
Regional Office Cost of Business Survey — Fall 2022 3
Continued on page 4 Continued on page 4 Continued on page 4
City of Burnaby: Most Business-Friendly
2022 Winners Q & A
What feedback have you received to date about your City’s fiscal policies around development?
Generally, New Westminster is seen as a good place to develop and we receive a lot of positive feedback from the development community.
Any advice for the real estate community wanting to develop projects in City of New Westminster?
New Westminster is open to different forms of development from industrial to rental housing. The projects that go most smoothly through the development review process are in alignment with key Council objectives such as affordable housing.
approximately 37,400 square metres of new employment lands in the City.
What feedback have you received to date from the real estate community about the improved approval process?
Surrey has had positive feedback from the development industry in response to the introduction of the Guaranteed Permit Timeline Program. There has been an appreciation of the City’s efforts to provide certainty for permitting times which can give applicants a clear understanding of the application process timing that they should expect through the Development Process.
Staff anticipate continuing to work on this program in 2023, with a specific emphasis on finding ways for staff to support applicants in getting their projects to a point where it is considered a complete submission earlier in the review process. This will further help in reducing application review times.
Any advice for the real estate community wanting to develop projects in Surrey?
Applicants should consider following densities that are permitted under land use plans, whether this be for apartment or townhouse developments. For example, many of the City’s land use plans propose maximum densities of 25 units per acre (UPA) for townhouse developments, whereas many applicants will propose much higher densities than is permitted (sometimes up to 28 UPA).
What feedback have you received from the real estate community about your business process and policies?
Feedback in the past has been consistent that Burnaby is a great place to do business, however, it takes too long and is overly complicated. We have listened to property owners and developers about the good and bad points of doing business in other municipalities in the region. We have taken from the good points and are seeking better alignment with our regional partners, including transitioning to a Development Permitting system from the current Preliminary Plan Approval system, which will provide clarity to applicants working throughout Metro Vancouver. Such changes in policy and process will help meet our goals of improving transparency and process timing. One other significant business process change desired by the development community is more control over their applications. That is why we are kicking off an upgrade to our License and Permitting system to include a customer self-service portal where developers and their consultants can make applications, submit drawings, and pay fees online.
Any advice for the real estate community wanting to develop projects in Burnaby?
Burnaby prides itself on consistency. We have several Community Plans to guide the development industry in investing in development sites that are supported by a Council adopted land use designation. While no municipality can guarantee certainty in the development process, we aim to remove a significant amount of risk in the approvals process to encourage confidence when investing in Burnaby. The Planning Department is available to answer any questions that new investors might have before developing in Burnaby.
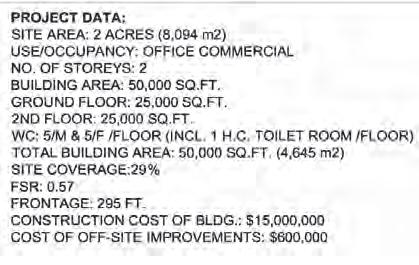
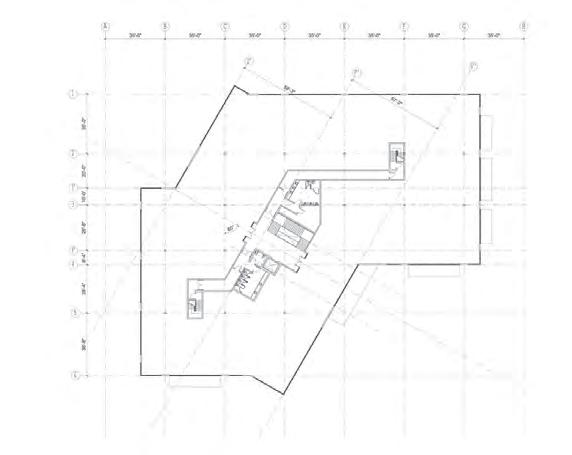
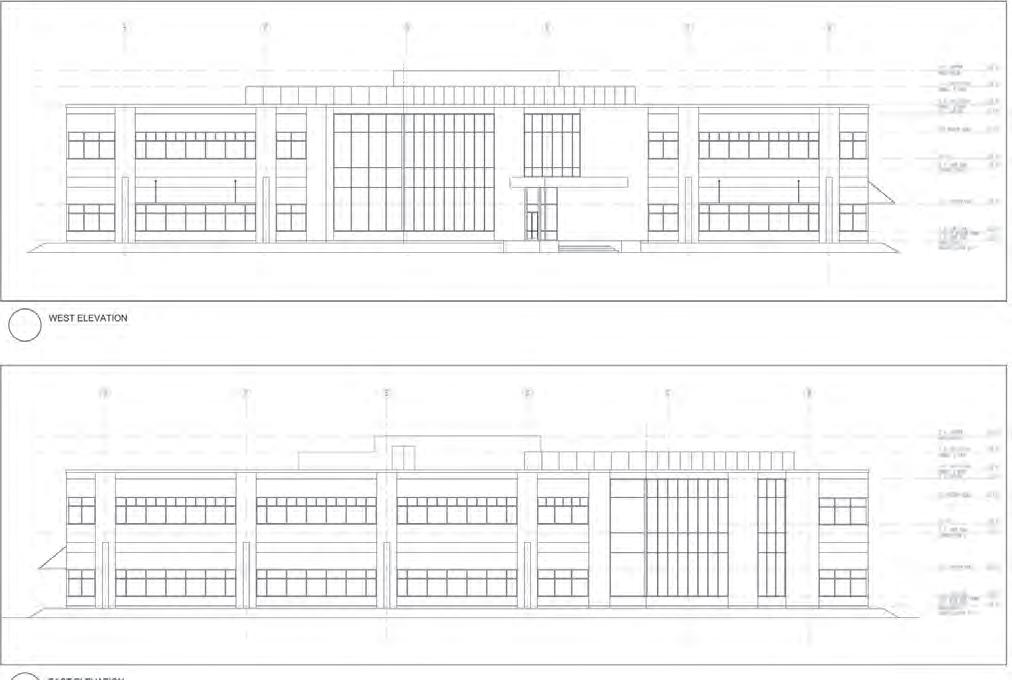
Office Building Prototype
The proposed development is for a 50,000 square foot (4,645 square metre) “Class B” office building comprising a total of two (2) storeys with a 25,000 square foot (2,322 square metre) floor plate. The building is proposed for an unsubdivided, non-office/commercial zoned 2.5-acre lot which requires a number of approvals as listed below.
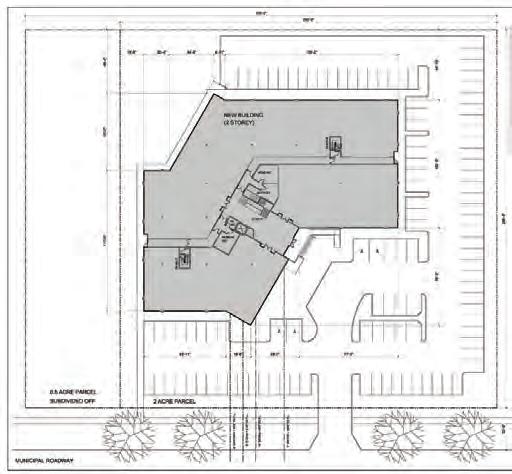
Development requirements:
• Located within an area designated in the municipality’s Official Community Plan and Metro Vancouver’s Regional Growth Strategy as suitable for office and commercial use
• Located within a DP area
• Located within a DCC/DCL-applicable area
4 Regional Office Cost of Business Survey — Fall 2022
Office Building Prototype
• 295 feet (90 metres) of lot frontage on a 15-year-old dedicated municipal roadway and interior parcel lines with adjacent lots after subdivision
• Site is assumed to have been cleared of all trees and filled to a suitable elevation
Building assumptions:
• Complies with all design bylaw regulations within the governing jurisdiction
• The application and its content have been prepared using the services of a registered architect, landscape architect and professional engineer
• Fully sprinklered throughout
Development requirements:
• Rezoning to general office zoning as per jurisdiction, assuming proposed density conforms to zoning bylaw

• Land subdivision to create one parcel of 2.0 net acres less road and other dedications
• All required permits and fees
Construction costs:
• $300 per square foot/$15,000,000
• Land subdivision to create one parcel of 2.0 net acres less road and other dedications
• $600,000 for offsite works (street and drainage improvements - not DCC rebatable)
Regional Office Cost of Business Survey Fall 2022 5
Survey
T


otal municipal fees from 2020 to 2022 for the NAIOP benchmark office development increased by an average of 8.9% across all participating municipalities. Notably, Development and Building Permit Fees are on the rise, with all participating municipalities reporting an increase in this category.
Canada’s average annual inflation rate from 2012 to 2022 YTD was approximately 2.14%, with 2022 recording notably higher inflation compared to previous years. Four municipalities managed to keep their annual average cost inflation below this point – the City of Langley, City of Mission, City of Coquitlam, and City of New Westminster. In contrast, the remaining municipalities saw annual average fee increases of over 5.0%.
W hile the average approval timeline increased approximately 20% across all municipalities, 4 municipalities showed no changes, with some even reporting improved approval times compared to 2020. Five municipalities reported a timing increase of over 50% from 2020 to 2022. Please note that these times largely rely on development permit, subdivision, and building permits being processed concurrently with rezoning; any delays in one phase of the process can significantly affect the overall approval timing for a given municipality.
Municipality
2022 Total Fee 2022 Approval Timing (days)
City of Burnaby $255,764 180
City of New Westminster $421,691 360
City of Maple Ridge $343,773 240
City of Chilliwack $381,970 120
City of Delta $277,912 240
City of Port Coquitlam $347,082 360
City of Langley $486,683 180
City of Mission $529,379 420
City of Abbotsford $588,909 365
City of North Vancouver $543,703 360
City of Port Moody $410,652 485
City of Coquitlam $425,771 425
City of Pitt Meadows $332,887 605
Township of Langley $618,477 180
City of Vancouver $1,481,957 365
District of West Vancouver $430,027 545
City of White Rock $497,815 730
City of Surrey $382,624 180
District of North Vancouver $814,229 360
City of Richmond $784,215


6 Regional Office Cost of Business Survey — Fall 2022
180 NOTES *Total fee excludes Sewer & Water Connection Fees, Regional Sewer & Drainage Fees, and Taxes. **High end of process timing estimates used to calculate 2022 Approval Timing. 1. Sewer & Water Connection Fees for the City of New Westminster are included in total, based on inclusion in other line items
Summary Specializedservicestomaximize thepotentialofyourproperty. Expertschooseexperts. Colliersmakesnoguarantees,representationsorwarranties ofanykind,expressedorimplied,regardingtheinformation including,butnotlimitedto,warrantiesofcontent,accuracy andreliability.Anyinterestedpartyshouldundertaketheir owninquiriesastotheaccuracyoftheinformation.©2022. Allrightsreserved.ColliersMacaulayNicollsBrokerageInc. Howdoyoubestensureyourproperty providesvalue? Ourexpertsofferadviceand solutionscoveringallaspects ofcommercialrealestate,from developmentadvisory,tobrokerage salesandleasing,toproperty management. Learnmoreaboutourexpertsandhow theycanaccelerateyoursuccess. collierscanada.com/ experts-choose-experts
Municipal Fees
1 City of Burnaby $20,780$223,484 $11,500 $0 $255,764 $209,958 21.8% 1140000.0% $11,400.00 $9,500.00
9 City of New Westminster $5,258 $189,496 $25,896$201,042 $421,691 $568,563 -25.8% 0.0% Incl. in other costs Incl. in other costs
4 City of Maple Ridge $12,786 $154,388 $24,000 $152,599 $343,773 $238,241 44.3% 0.0% Developer Cost 12,000
6 City of Chilliwack $5,423 $124,818 $12,000 $239,728 $381,970 $324,693 17.6% 1925000.0% $19,250.00 $24,500.00
2 City of Delta $6,250 $114,573 $24,800 $132,290 $277,912 $253,245 9.7% 0.0% Developer CostDeveloper Cost
5 City of Port Coquitlam $12,044$123,520 $24,000 $187,519 $347,082 $322,212 7.7% 1900000.0%$19,000.00$9,000.00
12 City of Langley $8,909 $108,105 $28,019 $341,650$486,683 $484,289 0.5% 4950000.0% $49,500.00$16,500.00
14 City of Mission $6,759 $110,313 $3,965 $408,342 $529,379$535,861 -1.2% 0.0% Cost of work + 15% Cost of work + 15%
16 City of Abbotsford $7,625 $93,573 $24,000 $463,710 $588,909 $535,530 10.0% 15000.0% Cost of work+Cost of work+
15 City of North Vancouver $10,426$121,806 $31,421 $380,049 $543,703 $419,421 29.6% 4500000.0%$45,000.00$45,000.00
8 City of Port Moody $14,665 $151,952 $24,000 $220,034 $410,652 $368,471 11.4% 0.0% Cost of work+Cost of work+
10 City of Coquitlam $9,846$156,219 $28,375 $231,330 $425,771 $527,593 -19.3% 0.0% Developer CostDeveloper Cost
3 City of Pitt Meadows $12,094 $154,358 $21,000 $145,435 $332,887 N/A N/A 6000000.0%$60,000.00$20,000.00
17 Township of Langley $15,603 $124,417 $32,653 $445,804 $618,477 $584,842 5.8% 0.0% Developer CostDeveloper Cost
20 City of Vancouver $268,000 $175,446 $3,012 $1,035,500 $1,481,957 N/A N/A 0.0% Cost of work+Cost of work+
11 District of West Vancouver $35,810 $151,692 $12,600 $229,925 $430,027 N/A N/A 3042000.0% $30,420.00 $17,700.00
13 City of White Rock $5,936 $190,874 $3,121 $297,884$497,815$427,431 16.5% 0.0% Developer CostDeveloper Cost
7 City of Surrey $10,079 $152,259 $39,062$181,224 $382,624$348,291 9.9% 0.0% Developer Cost $28,000.00
19 District of North Vancouver $12,440$209,503 $26,385 $565,900 $814,229 $755,270 7.8% 3416400.0% $34,164.00 $25,000.00
18 City of Richmond $3,923$155,292 $24,000$601,000 $784,215 $741,295 5.8% 1180000.0% $11,800.00 $10,800.00
*N/A reflects municipalities that did not participate in the 2020 Cost of Business Survey.
**Total fee excludes Sewer & Water Connection Fees, Regional Sewer & Drainage Fees, and Taxes
1. Sewer & Water Connection Fees for the City of New Westminster are included in total, based on inclusion in other line items
Building Permit Data
Across the Metro Vancouver and Fraser Valley regions, office development was strong, with the total value of office building permits for new construction and major renovations reported at $ 856,770,000 in 2021. This reflects a large increase over the 2019 data; however, multiple municipalities did not report building permit information that year, including the City of Vancouver.
Municipality
2021 Total Building Permit Value (New Office Buildings)
City of Burnaby $12,000,000 5
2021 Total Number of Building Permits (New Office Buildings)
City of New Westminster $13,000,000 59
City of Maple Ridge N/A N/A
City of Chilliwack $7,240,000 10
City of Delta N/A N/A
City of Port Coquitlam $419,500 4
City of Langley $0 0
City of Mission $8,053,356 38
City of Abbotsford $13,060,150 11
City of North Vancouver $13,798,954 5
City of Port Moody $49,409,305 19
City of Coquitlam $52,489,516 42
City of Pitt Meadows $0 0
Township of Langley $26,044,684 6
City of Vancouver $573,538,776 112
1 City of Coquitlam - Reflects all commercial buildings.
2 District of West Vancouver - Renovation permits only.
3 City of Surrey - Includes a new 6-storey mixed-use building with 2 floors of office and construction value of $37,725,000
4 District of North Vancouver - Total permit value on non-singlefamily building permits issued in 2021 for “Business and personal service occupancies” and “Mercantile occupancies”. Does not include minor alterations, minor additions or demolitions
District of West Vancouver $7,200,000 40
City of White Rock $0 0
City of Surrey $64,978,421 133
District of North Vancouver $8,741,600 15
City of Richmond $6,800,000 4
Regional Office Cost of Business Survey Fall 2022 7
Rezoning & Subdivision Application Fees Development & Building Permit Fees Administration, Processing & Sprinkler Inspection Fees DCC/DCL Fee 2022 Total 2020 Total % Change from 2020 Equivalent Annual Average Inflation Rate from 2011 Sewer Connection Fee Water Connection Fee
2022 Rank Municipality
NOTES NOTES
Mill Rates
1City of Burnaby 5.121 1.547 3.310
2City of New Westminster 8.994 2.611 3.445
3City of Maple Ridge 7.119 2.413 2.951
4 City of Chilliwack N/A N/A N/A
5City of Delta 5.144 2.034 2.529
6 City of Port Coquitlam 6.773 2.114 3.203
7City of Langley 5.889 2.063 2.855
8 City of Mission 10.619 2.537 4.186
9 City of Abbotsford 7.168 2.472 2.899
10 City of North Vancouver 5.109 1.570 3.253
11 City of Port Moody 3.116 1.395 2.234
12 City of Coquitlam 7.141 1.878 3.803
13 City of Pitt Meadows 7.216 2.423 2.978
14 Township of Langley 5.928 1.692 3.503
15 City of Vancouver 34.051 1.531 22.237
16 District of West Vancouver 3.329 1.532 2.172
17 City of White Rock 3.742 2.179 1.717
18 City of Surrey 4.716 1.727 2.730
19 District of North Vancouver 4.395 1.570 2.799
20 City of Richmond 4.001 1.657 2.414
Timing
1
of Burnaby
1 City of New Westminster 180-240 days Concurrent 60-120 days Concurrent 360 540 -33%
3 City of Maple Ridge 180-240 days Concurrent ConcurrentConcurrent 240 120 100%
3 City of Chilliwack 60-120 days Concurrent Concurrent N/A 120 240 -50%
3 City of Delta 180-240 days Concurrent ConcurrentConcurrent 240 240 0%
6 City of Port Coquitlam 180-240 days Concurrent Concurrent 60-120 days 360 240 50%
7 City of Langley 60-120 days Concurrent Concurrent <60 days 180 180 0%
7 City of Mission 180-240 days Concurrent Concurrent 120-180 days 420 240 75%
7 City of Abbotsford Over 365 days Concurrent ConcurrentConcurrent 365 360 1%
7 City of North Vancouver 180-240 days N/A 120-180 days 60-120 days 360 300 20%
7 City of Port Moody 240-365 days Concurrent <60 days 60-120 days 485 420 15%
12 City of Coquitlam Over 365 days Concurrent Concurrent <60 days 425 480 -11%
13 City of Pitt Meadows 240-365 days60-120 days 240-365 days60-120 days 605 N/A N/A
13 Township of Langley 120-180 days Concurrent ConcurrentConcurrent 180 150 20%
15 City of Vancouver 240-365 days Concurrent ConcurrentConcurrent 365 N/A N/A
16 District of West Vancouver 240-365 days Concurrent <60 days 120-180 days 545 N/A N/A
17 City of White Rock 240-365 days Concurrent Concurrent Over 365 days 730 240 204%
18 City of Surrey 120-180 days Concurrent Concurrent N/A 180 395 -54%
19 District of North Vancouver 120-180 days Concurrent Concurrent 120-180 days 360 240 50%
20 City of Richmond 120-180 days Concurrent ConcurrentConcurrent 180 180 0%
8 Regional Office Cost of Business Survey — Fall 2022
Residential Mill Rate
2022 RankMunicipality 2022 Commercial Mill Rate 2022
Commercial-to-Residential Tax Ratio
2022 Inprovement Rank Municipality Rezoning Process (days) Development Permit Process (days) Subdivision Approval (days) Building Permit (days) 2022 Approval Timing (days) 2020 Approval Timing (days) % Change from 2020
City
120-180 days Concurrent ConcurrentConcurrent 180 365 -51%
Future of Office Space
As many of you know, the office sector in Metro Vancouver is facing significant headwinds due to a combination of pandemic-related remote work trends, ccoupled with deteriorating equity markets and expectations of an impending recession Rising occupancy rates in office buildings, along with an increase in sublease space on the market, have created conditions not seen in many years We canvassed some experts on their thoughts and predictions ahead for the sector and how things might play out in the coming months
“Tenants in today’s office market environment are now looking for a much more curated approach in the buildings they occupy. They want to know, and sometimes want a say in, what the in-building or surrounding amenities are and how those will help them attract or retain employees. Given current economic uncertainty, tenants are gravitating towards shorter lease terms and looking for turn-key space for maximum flexibility and lower capital expenditures. One of the most
active sectors right now is suburban office, with locally headquartered companies in particular moving towards having a smaller central headquarter space downtown and one to two regional hubs closer to where employees live. It’s all still very fluid at the moment, with both landlords and tenants trying to figure out how office utilization has evolved, while at the same time dealing with increased inflation and a potential recession.”
Mitchell, Vice President, Asset Management and Development, Low Tide Properties


“Vancouver has been one of the strongest office leasing market North America since the last recession. We started the pandemic with the second lowest vacancy to Toronto at 2.2%. We got up as high as 7.7% and then, came back down when the pandemic was easing. Now, it’s up to 9.1% in Q4 2022 due to rising inflation and resulting interest rate induced recession. As a result, we’ve seen an onslaught of sub-leases; however, we are still in good shape and what we are seeing is that best in class office space will win the day. Where typically newly constructed
shell buildings are hardest to lease, in today’s market, they are the most successful . Companies are recognizing that in order to have a chance at bringing people back to the office, they need to have best in class office space. The suburban market, unlike in most other recessions, is weathering much stronger than downtown with little subleasing and low vacancy rates. But they also have little to no new development, where downtown is building an additional 2.4 million square feet of inventory.”
“There will always be some new office development in Metro Vancouver’s town centres, such as Surrey and Metrotown. However, most tenants and employees want to be closer to the city and in an urban environment. The traditional downtown core is shifting eastward and areas to watch will include False Creek Flats and Mount Pleasant. These neighbourhoods are close to transit and housing, highly amenitized, and very walkable. Another
trend to watch is the office requirements of the emerging Life Science sector, to see whether Vancouver will become a smaller version of Boston or San Francisco. In terms of the market, everyone these days is talking about interest rates and the economy. Some tenants and developers may be a bit more cautious. But in the long term, Vancouver is where the world wants to come to live, work and do business. It will all work out fine.”
“Landlords want to ensure their tenants feel safe coming back to the office and have implemented greater health and safety measures, including elevated cleaning protocols and technology upgrades such as smart thermometers, UV lamps, and HVAC systems that clean the air. Landlords are also increasing their amenity offerings and becoming more creative to entice tenants back to the office. Modernizing lobbies and turning common areas to social hubs where tenants can not only collaborate, but also find a place of respite, are two trends to watch. Demand for suburban office space remains strong, especially in areas well serviced by convenient transportation. Tenants seeking to maximize employee
retention or additional hires recognize a large part of the employee base live outside Vancouver and are offering an alternative to coming downtown. While suburban office rents in certain markets continue to rise, they are still lower than downtown Vancouver. Overall, rising interest rates, inflation, the war in Ukraine and predictions of a recession are causing employers to be more cautious on spending. However, Vancouver’s attributes and access to a skilled workforce remains attractive to employers, and the downtown Vancouver market will continue to outperform other markets across Canada. Vacancy rates will hold relatively steady within a couple of percentage points, but there will be more sublease opportunity. With
a more or less balanced market, landlords will continue to hold on to their asking rates, particularly in quality buildings, but may offer more generous inducements.
 Maureen Neilly, Director, Commercial Leasing, QuadReal Property Group

Regional Office Cost of Business Survey Fall 2022 9
Adam
Blair Quinn, Vice Chairman, The High Technology Facilities Group, CBRE
Geoff Heu, Vice President, Development - Western Canada, GWL Realty Advisors Inc.
Market Update
Vacancy Rate
6.3 %
Metro Vancouver
Vacancy rates of office product in all classes throughout Metro Vancouver dropped 60 bps quarter-over-quarter to 6.3% in Q2 2022. This marks the region’s third consecutive decline, falling 110 bps from the peak of 7.4% recorded in Q3 2021.
A consecutive decline in vacancy coupled by strong market fundamentals caused Metro Vancouver’s office rates to hold firm, reaching $34.20 per sq. ft., an 11.8% increase year-over-year.
Construction activity continues to climb as developers maintain pace to keep up with recent demand. New projects within the region have started construction this quarter bringing the Metro Vancouver total to 4.1 million sq. ft., with numerous projects already underway adding new tenants.
The downtown core experienced a 50 bps decline in vacancy rate, primarily driven by the lease up of 1280 Burrard Street by Lululemon. Average asking lease rates continue to escalate, growing 8.6% year-over-year and reaching a new high of $39.91 per sq. ft. Construction activity experienced no change and sits at 2.9 million sq. ft.; however, 83.8% of this space has been pre-leased leaving marginal relief.
The suburban office market continues to lead the downward trend as vacancy dropped 70 bps from 6.2% in Q1 2022 to 5.5%. This is the third consecutive quarter of declining vacancy, with Fortinet’s new lease in Broadway Tech Centre leading the charge. Average asking lease rates remain elevated from pre-pandemic levels of $23.88 per sq. ft. from Q1 2020, growing 13.6% and sitting at $27.13 per sq. ft.
Declining Vacancy Rates
The Metro Vancouver market witnessed increasingly large blocks of space push vacancy rates downward for the third consecutive quarter, falling 60 bps quarter-over-quarter to 6.3% overall. Most notably, Class AAA office inventory experienced a 140 bps decline quarter-over-quarter, driven primarily by Fortinet’s 175,546 sq. ft. lease at Broadway Tech Centre, which nearly
SF Net Absorption
538K
halved Burnaby’s Class AAA vacancy rate to 7.6% in Q2 2022, from 14.9% in Q1 2022. Class A space in Burnaby also witnessed a 100 bps decline to 4.5% in Q2 2022, and sits significantly below the pandemic peak of 9.0% recorded in Q2 2021. Sustained leasing activity within the Burnaby market could drive vacancy rates below the record low of 5.1% recorded in Q4 2019, though some large blocks of space and sublease inventory remain vacant and are keeping this figure slightly elevated. In other suburban regions, like the Broadway Corridor, the overall vacancy rate has held constant at 6.4% for the third consecutive quarter. Collectively, total sublease inventory within the suburban markets is at 312,149 sq. ft. equivalent to 22.5% of all vacant space which is the lowest it has been since Q3 2020. With continued deal activity we could see this ratio of sublease inventory decline to better resemble prepandemic figures of 13.0-17.0%.
Throughout the downtown core, all classes of office inventory recorded quarterly declines. Most notably, Class A product, which witnessed a 100 bps decline to 8.4%, while Class AAA and B recorded 20 and 30 bps declines to 5.7% and 6.7%, respectively. Total vacant sublease space in all classes experienced little to no change quarter-over-quarter, sitting at 462,000 sq. ft., but have decreased 17.9% year-over-year. Total vacant sublease inventory in Class AAA product has experienced three consecutive quarters of decline. Total sublease space marketed for availability with varying occupancy dates has fallen 34.4% from the pandemic peak of 852,000 sq. ft. to 559,000 sq. ft.; however, recent uncertainty in the economic markets has held this figure relatively levelled in recent months. Tenant movements within the sublease market since the start of 2022 have been active and have accumulated to an estimated 22,000 sq. ft. of net absorption in that period. Through all of 2021, an estimated net negative 30,000 sq. ft. of absorption was recorded, while through 2020 negative 556,000 sq. ft. of absorption was recorded exclusively within the downtown sublease market.
SF Under
Construction 4.1M
Market Highlights
PSF
Avg. Asking Rental Rate
• Vancouver office vacancy rates experienced their fourth consecutive quarter of downward pressure, declining 60 basis points (bps) to 6.3%. Suburban markets continue to spearhead this decrease, holding steady at a 5.5% overall vacancy rate, 120 bps below the 5-year average of 6.7%. Sustained demand within these markets could push vacancy rates below the record low of 4.5%, which was last recorded in Q4 2019.
• The steady demand for office space within the downtown core has led to numerous shell deals completed for product during our current development cycle. Nearly three-quarters of space currently under construction within the CBD has been pre-leased, leaving just over 750,000 sq. ft. available across five buildings of 2.8 million sq. ft.
• While sublease vacancy levels throughout Metro Vancouver have held at roughly 25.0% of vacant inventory for the third consecutive quarter, the total sq. ft. posts a 15.6% decline year-over-year. At the height of the pandemic, total sublease vacancy accounted for 2.3% of total market inventory; that figure has since fallen to 1.5%, the lowest since Q2 2020.
Leasing in the Construction Pipeline
Within the construction pipeline, numerous new deals have transacted in recent months leading to a total of 71.0% of the 4.0 million sq. ft. pre-leased. Recent deals within the downtown core account for over 400,000 sq. ft. in activity; however, recent construction starts in the suburban markets has lowered the pre-commitment total to 38.1%. With limited available inventory in core markets look for this figure to increase in the upcoming quarters. Looking forward, fewer options remain for tenants looking to pre-lease space within the construction pipeline as downtown deliveries within the 2023 calendar year are fully pre-committed while 64.6% of 2022 deliveries are leased. In comparison to mid-2021, only 37.0% of 2022 deliveries and 84.0% of 2023 downtown deliveries were preleased. Few large block availabilities remain within existing inventory, particularly within the downtown core, and position themselves as prime opportunities for occupiers with nearterm requirements of scale. Expect further increases in pre-commitment activity through the balance of 2022 as occupiers assess their real estate needs and absorb what little inventory remains available.
Demand in the Suburbs
While the pandemic changed the landscape of office occupancy levels throughout the region, continued adoption of hybrid work-fromhome policies has driven absorption, particularly within suburban markets. Notable factors diving this demand include increased parking accessibility, proximity to staff and existing facilities as well as larger footplates. Each of these are an added benefit to occupiers, providing fewer physical touchpoints to their employee base on a daily basis, and offer increased flexibility for their real estate needs.
Collectively, these factors, as well as others, have driven suburban vacancy rates below that of the downtown core for the first time. Initially recorded in Q3 2021, this trend is expected to continue into the near future. Just over 1.1 million sq. ft. of new supply has delivered in the suburbs in the last 3 years, and only 1.1 million sq. ft. of space is currently under construction. In comparison to the downtown core, 1.1 million sq. ft. has completed in that same time frame; however 2.9 million sq. ft. of space is currently under construction. While demand is high, look for vacancy rates in the suburban markets to approach record lows in the near term.
10 Regional Office Cost of Business Survey — Fall 2022
$34.20


Weprovideresidents withamazinghomes andservicewithin vibrantcommunities whilemaximizingclient returns. www.warringtonresidential.com


 NAIOPVancouver NAIOPVancouverNAIOP Vancouver Group

