Introduction
The City of Bloomington Community Farmers’ Market (BCFM) celebrated its 50th anniversary in 2024. The BCFM has changed over the years, with more accelerated change occurring around the Covid-19 pandemic time period. As a result, there are more options for both vendors and customers and this new landscape presented an opportunity to take a step back and examine the BCFM.
An evaluation study was performed throughout the 2024 market season that involved various research methods and this report is organized into four sections:
• Existing Data Review
• Benchmarking
• External Stakeholder Engagement
o Advisory Council
o Community Partners
o Current and Past Vendors
o Customer Survey
• Overarching Recommendations
Existing Data Review
Research Reports
Over the BCFM’s history, a couple studies/evaluations have been completed. Dr. James Farmer’s study examined why people participate (or not) in local food systems, the benefits associated with participation, and suggestions for consumer retention. People choose to participate in local food systems more often because of the ability to obtain fresh and nutritious food with fewer chemicals; however, costs, location, and time are all contributing factors to not participating. Participants note a sense of belonging, knowing where food comes from, and social aspects of participating in local food systems as reasons for doing so. To assist with customer retention, a focus on costs, space for participants, and food variety are important.
In 2020, students and experts at the University of Wisconsin-Madison explored the research question, “How can the Bloomington Community Farmers’ Market enhance its culture of inclusivity as well as its vendor and visitor diversity?” What they found was the need to make adjustments to both Market Bucks and the Vendor Point System (reserving well-placed spaces for newer vendors and offering additional points to new vendors, less represented vendors, and/or who bring unique goods/services to the Market), conduct staff training, offer vendor training, and enhance data collection capabilities.
Participation
Over the last three years, the BCFM has served over 185,000 customers (Figure 1). Annually, the BCFM serves approximately 78% of Bloomington’s total population of around 79,000 people.
Figure 1: BCFM Participation Stats (2021-2023)
Financials
In terms of financials, the BCFM’s overall cost recovery has remained relatively consistent from 2021 to 2023 (Figure 2) Of note, there was an additional $35,000 spent in 2022 for new bollards. Removing this cost would change that year’s cost recovery to 36%. Vendor fee revenues have increased by 48% while expenses have decreased by 21%. Expenditure decreases can be mostly attributed to a reduction in fulltime salaries.
Benchmarking
As part of the overall evaluation process, a benchmark analysis was conducted that included seven similar markets across the country (including Bloomington). Benchmarking is a way to examine different aspects of like-agencies to see where a particular agency compares to its peers. It is important to note that benchmarking is an imperfect science and most results lend themselves to needing additional context as no two organizations are ever exactly the same. However, benchmarking is a good way to start seeing data trends that generally lead to more self-reflection, conversations, and exploration of different potential decision points.
To obtain the data, agencies were contacted individually in mid-April 2024 with a request for benchmark participation. Agencies were provided with a benchmark form that included 20 questions/metrics spread across four overarching categories: basic market information, vendor information, features, and pricing and economics. The form had BCFM’s information inputted so the agency could see how each question was answered and/or the kind of information being sought. Agencies then completed the benchmark form and provided it for compilation.
Agencies completing the benchmark study included:
• Ann Arbor, MI (Ann Arbor Farmers’ Market)
• Bloomington, IN (Bloomington Community Farmers Market)
• Broad Ripple, IN (Broad Ripple Farmers Market)
• Charlottesville, VA (Charlottesville City Market)
• Fishers, IN (Fishers Farmers’ Market)
• Iowa City, IA (Iowa City Farmers Market)
• Madison, WI (Dane County Farmers’ Market)
The following sections provide the benchmark results by topic/subtopic and include associated observations narrative. Bloomington’s information is highlighted in yellow for quick visual reference
Figure 2: BCFM Financial Stats (2021-2023)
Basic Information Part I
The average Market age is 51 years with Ann Arbor’s being the oldest and Fishers’ being the newest (Figure 3). A noticeable trend includes offering a Market on a non-Saturday day, in addition to Saturdays (Figure 4). Three Markets are considered year-round with the others being mostly a Spring to Winter season. Market hours vary from Market to Market but the trend appears to be early morning through mid-day/early afternoon at the latest. The majority of Markets are municipally-operated with the exception of Broad Ripple and Madison.
Ann Arbor, MI
Bloomington, IN
Market Pavilion (Saturday and Wednesday)
City Hall Parking Lot (Saturday) Switchyard Park (Tuesday)
Broad Ripple, IN
Lowe's Glendale Outlot (Summer) Glendale Macy's Store - closed (Winter) Charlottesville, VA
Leased surface parking lot (Saturday) Meade Park (Wednesday)
WI Capitol Square (Saturday outdoor) 200 Block MLK Jr Blvd (Wednesday outdoor) Monona Terrace (Saturday indoor Nov-Dec) Garver Feed Mill (Saturday indoor Jan-Apr)
Figure 3: Basic Information Part I Benchmark 1 of 2
Ann Arbor, MICity of Ann Arbor Parks and Recreation (Municipal)
Bloomington, IN City of Bloomington Parks and Recreation (Municipal)
Broad Ripple, IN Broad Ripple Village Association (Non-Profit)
Charlottesville, VACity of Charlottesville Parks and Recreation (Municipal)
Saturdays: Year-Round 7am-3pm (May-Dec) 8am-3pm (Jan-Apr)
Wednesdays: May-December 7am-3pm
Saturdays: April - November
8am-1pm (Apr-Oct) 8am-12:30pm (Nov)
Tuesdays: June - September 4-7pm
Saturdays: Year-Round 8am-12pm (May-Oct) 9am-12pm (Nov-Apr)
Saturdays: April - December 9am-1pm
Holiday Market is Thanksgiving-Xmas
Wednesdays: May - September 9am-1pm
Saturday: May - September 8am-12pm
Fishers, IN City of Fishers Parks and Recreation (Municipal)
Iowa City, IA City of Iowa City Parks and Recreation (Municipal)
Madison, WI Dane County Farmers' Market, Inc. (Private)
*Discontinued Fall Market and Wednesday Summer Market
Saturdays: May - October 7:30am-12pm
Two Winter Markets: Nov 1 and Dec 1
Saturdays: Year-Round
6:45am-1:45pm (outdoor mid-Apr-mid-Nov)
7:30am-12pm (indoor holiday mid-Nov-Dec) 8am-12pm (indoor winter Jan-Apr)
Wednesdays: April - November 8:30am-1:45pm
Figure 4: Basic Information Part I Benchmark 2 of 2
Basic Information Part II
All Markets, except for Broad Ripple, have at least one dedicated full-time staff person (Figure 5) Staffing generally includes an additional mix of part-time, seasonal, and volunteer positions. Only four Markets utilize an Advisory Council and none have a Friends Group (Figure 6). Advisory Councils range from 5-11 members. All Markets target area residents and Ann Arbor, Charlottesville, and Madison report having a broader county focus as well.
Ann Arbor, MI 1 F/T 1 F/T (10 months) 1 P/T (10 months)
Yes; 5-member (will be expanding to 7)
Vendor, Customer, and Neighbor Representatives
Bloomington, IN 1 F/T 20% of 1 F/T 4-6 Seasonals Yes; 11-member
Customer, Farm Vendor, and Food and Beverage Representatives
Broad Ripple, IN
Iowa City, IA
All volunteer: 1 designated Market Manager + 4-6 others
Yes; 7-member Farm Vendor, FBA, Volunteer, BRVA, and Market Managers
Madison, WI
F/T 2 P/T (Facilitator and Vendor Specialist) 8-10 Variable
3 F/T (Market Manager, Asst. Market Manager, and Market Assistant) 2-5 Hourly Seasonals day-of
Yes; 9-member All DCFM vendor members
Figure 5: Basic Information Part II Benchmark 1 of 2
Market Overview - Part II
Market
Overview - Part II
Market Friends Group Target Audience(s)
Ann Arbor, MI No
Bloomington, IN No
Broad Ripple, IN No
Charlottesville, VA No
Fishers, IN No
Iowa City, IA No
Madison, WI No
6: Basic Information Part II Benchmark 2 of 2
Primary: Ann Arbor and Washtenaw County residents, vendors, food assistance users, and students.
Secondary: tourists/visitors
Primary: Bloomington residents, vendors, students, and those that need food access.
Secondary: tourists/visitors
Primary: Northside of Indianapolis, vendors, and SNAP recipients
Primary: Charlottesville/Albemarle County residents, vendors, students, and those that need food access.
Secondary: tourists/visitors
Primary: Fishers residents Se condary: Visitors and neighboring city residents
Primary: Iowa City residents, vendors, students, and those that need food access.
Secondary: tourists/visitors
Primary: Dane County residents, vendors, and those that need food access.
Secondary: tourists/visitors
Figure
Vendors Part I
Most Markets report utilizing both farm (i.e., a producer of grower who sells their farm products directly to consumers) and food (i.e., a person or business that sells food directly to consumers) vendors (Figure 7). Several markets also utilize artisans (i.e., a person who sells handmade, original products they have created themselves) as well. In terms of vendor representation, the Markets do not appear to have a common farm to food vendor ratio, but Ann Arbor and Bloomington have a similar ratio. Broad Ripple, Charlottesville, Fishers, and Iowa City appear to have more non-farm vendors than farm vendors. This could suggest a trending Market vendor model, but more study is warranted. Additionally, the Markets have generally added 3-20 new farm vendors each year.
Arbor, MI Producer Artisan F ood and Beverage
Bloomington, IN Farm Vendor Food and Beverage Artisan
Broad Ripple, IN Farm Vendor Food and Beverage Artisan Ready-to-Eat
Charlottesville, VA
Farm Vendor Food Vendor Artisan Vendor
Fishers, IN Farm Vendor Food and Beverage Artisan
Iowa City, IA
Madison, WI
Farm Vendor Food and Beverage Artisan Art and Craft Vendor
Farm Vendor Bakeries
2023: 67 Farm/19 Artisan/42 FBA
2022: 65 F arm/19 Artisan/35 FBA
2021: 70 Farm/21 Artisan/24 FBA
2023: 76 Farm/13 FBA
2022: 67 F arm/11 FBA
2021: 65 Farm/8 FBA
2023: 24 Farm/46 FBA/15 Ready-to-Eat
2022: 24 F arm/46 FBA/15 Ready-to-Eat
2021: 24 Farm/46 FBA/15 Ready-to-Eat
2023: 53 Farm/58 Food/125 Artisan
2022: 51 F arm/60 Food/119 Artisan
2023: 12 Farm/3 FBA
2022: 8 Farm/3 FBA 2021: 8 Farm/3 FBA
2023: 12 Farm/3 FBA
2022: 8 Farm/3 FBA
2021: 8 Farm/3 FBA
2023: 4 FBA
2022: 4 F BA
2021: 4 FBA
2021: 40 Farm/45 Food/68 Artisan N/A
2023: 18 Farm/53 FBA
2022: 11 F arm/53 FBA
2021: 11 Farm/50 FBA
2023: 43 Farm/41 FBA/46 Artisan
2022: 44 F arm/75 FBA
2021: 44 Farm/Unknown FBA
2023: 195 Farm/3 Bakeries
2022: 203 F arm/20 Bakeries
2021: 212 Farm/17 Bakeries
2023: 3 Farm Vendors
2022: Unknown 2021: Unknown
2023: 7 Farm Vendors/20 FBA
2022: Unknown
2021: 3 Farm Vendors/14 FBA
2023: 17 Farm/3 Bakeries
2022: 9 Farm/3 Bakeries
2021: N/A
Figure 7: Vendors Part I Benchmark
Market Vendor Categories
Number of Vendors for Last Three Seasons
Number of New Vendors for Last Three Seasons
Ann
Vendors Part I
Vendors Part II
Vendor recruitment most commonly involves word of mouth, dedicated website(s), and social media (Figure 8). Besides using these channels for marketing efforts as well, some Markets utilize print advertising, newsletters, and paid advertising with local outlets such as radio stations. In terms of evaluation methods, most all Markets deploy post-Market vendor surveys and conduct general intercept conversations during Market days (Figure 9). Seniority is a popular vendor booth assignment methodology utilized across all Markets; however, Bloomington is the only Market that specifies utilizing a “points system.” Ann Arbor alludes to a seniority system based on attendance and past participation but does not directly identify translating that to “points.” Most Markets do not specify they differentiate between Farm and Other vendor categories when assigning space; rather, it is seniority that is most used. Additionally, preference is given to full season vendors over daily/weekly vendors.
Vendors Part II
Market Vendor Recruitment
Ann Arbor, MI
Bloomington, IN
Word of Mouth
Park Website
Social Media
Vendor Referral
Word of Mouth
Park Website
Broad Ripple, IN No active recruitment
Word of Mouth
Parks Website
Social Media
Charlottesville, VA
Fishers, IN
Iowa City, IA
Business Outreach
LaunchPad Program (partnership)
Social Media
Word of Mouth
Parks Website
Word of Mouth
Parks Website
Market IG and Facebook
Word of Mouth
Madison, WI
DCFM Website
Vendor Booth Assignments
Seniority system based on attendance and past participation. Annual status vendors have permanent stall assignment. Daily status vendors get filled in after vendors are placed.
Points system based on attendance and past years of participation
Market Manager discretion based on need for shade and number of spaces needed
Reserve (dedicated space) vs non-reserve (weekly callin). Vendor distribution thresholds (Farmer>Food>Artisan). Sales. Previous participation (new vendors will be given a space over other nonreserves that have had multiple opportunities).
Based on space and electricity needs/space of the various types of vendors. Many request the same spot each year.
Priority given to returning full-season vendors first, new full-season vendors next, and then daily vendors.
Seniority based on consecutive years of participation.
Figure 8: Vendors Part II Benchmark 1 of 2
Market Marketing Channels
Social Media
Website
Ann Arbor, MI
Print Advertising
Word of Mouth Fliers
Social Media
Bloomington, IN
Broad Ripple, IN
Charlottesville, VA
Customer Newsletter
Website
Weekly Newsletters
Website
Social Media
Social Media
Press Releases
Live Radio Show (once per month)
Social Media
Fishers, IN
Iowa City, IA
Madison, WI
Website
Social Media
Press Releases
Iowa Public Radio
Website
Social Media
Customer Newsletter
Website Paid Advertising with Local Outlets
Vendors Part II
Vendor surveys
Evaluation Methods
MIFMA Rapid Market Assessment (includes customer survey)
Customer post-market surveys
Vendor post-market surveys
General intercept conversations during Market days
Primarily use weekly conversations with customers and vendors
Utilize Advisory Committee
Vendor post-market surveys
Customer counts (last done in 2018)
Customer survey (last done in 2017)
Customer survey (throughout the summer)
Vendor post-market survey (one time)
Conversations at the Market
Planning on doing a vendor and customer survey this year
Vendor survey (once per year, anonymous)
General intercept conversations during Market days
Figure 9: Vendors Part II Benchmark 2 of 2
Features
All Markets appear to utilize scheduled entertainment as a popular Market feature (Figure 10)
Additional offerings that are noted to bring in more customers include food trucks/carts, community group programming, art fairs, food/tasting/cooking events, radio shows, mobile libraries, dedicated children’s programming/activities, exercise opportunities, and other special events.
Market
Ann Arbor, MI
Bloomington, IN
Broad Ripple, IN
Charlottesville, VA
Fishers, IN
Iowa City, IA
Madison, WI
Features
Types of Offerings that Bring in More Customers
Live music and performances
Food trucks and carts on Market Days
Monthly cooking demos (May-Sept) at Wednesday Market
Monthly Food Truck Rallies (Jul-Oct) after Wednesday Market
Community groups and programming on Wednesdays
Location - heart of the Kerrytown Shopping District
History - second oldest Farmers' Market in Michigan; in current location since 1930
Scheduled and/or paid entertainment (more related to music) and buskers
Once a month Art Fair
Information Alley
Tasting/special events and demos
Youth day at the Market
Efficient and effective newsletter and social media (to include vendor customer outreach)
Scheduled entertainment (music)
Live radio show once per month
Mobile library once per month
Power of Produce Program (children's wellness during summer)
Exercise on stage from 8-9am
Paid entertainment on stage from 10am-12pm
Other events during the Market (Hope for Happiness, Safety Day, Health and Wellness Day)
Kids activities at the park tent
Music by local musicians
Parks staff activities and partner organizations
Special events (Halloween Market and Kid's Market)
Buskers are popular and are organized by the DCFM
The State Capitol permits 10-30 non-profit/public information organizations every Saturday
The City organizes arts & crafts vendors down one block off the Square
Figure 10: Market Features Benchmark
Financial Philosophy
Three Markets utilize sponsorships, partnerships, or naming rights with one additional (Charlottesville) pursuing this in the future (Figure 11). Cost recovery philosophies vary across the Markets ranging from not having a target to recovering all costs. In terms of revenue sources, in addition to booth/vendor fees, Markets sell merchandise, rent facilities, solicit donations, have food special events, and coordinate a Market cookbook (Figure 12)
Financial Philosophy
Market Are Sponsorships, Partnerships, or Naming Rights Used?
Ann Arbor, MI No
Bloomington, IN No
Broad Ripple, IN Yes; 1 sponsor per season
Revenue Philosophy, Cost Recovery Policy, or Other Revenue-Driving Philosophy
Aim to generate as much revenue as possible
Cost recovery level - 50%
Cover expenses associated with Market Administration (BRVA)
Charlottesville, VA No; pursuing sponsorship policy N/A
Yes; IU Health sponsorship for $20,000/year
Fishers, IN
Iowa City, IA
N/A
Other sponsorships available for $5,000/year
Yes; Green State Bank for portion of Market Music; partnership with Summer of the Arts for Market Music N/A
Madison, WI No
Figure 11: Financial Philosophy Benchmark 1 of 2
Cost recovery level - 100%
Market
Other Sources of Revenue Structure
Ann Arbor, MI
Bloomington, IN
Broad Ripple, IN
Market merchandise sales Event rentals (outside of Market days & events)
Selling of market totes and t-shirts From Farm to Table Event registration Donations
Fundraising dinner Farm dinner
Selling of market totes
Charlottesville, VA N/A
Fishers, IN N/A
Iowa City, IA Selling of merchandise
Madison, WI Selling of Market Cookbook (began in 2022)
Figure 12: Financial Philosophy Benchmark 2 of 2
Food Access Programs Utilized
EBT/SNAP
Double Up Food Bucks
Senior Market Fresh/Project Fresh WIC Project Fresh
Prescription for Health
Double Market Bucks for SNAP Triple funds for WIC and SNP
SNAP and Fresh Bucks WIC
Fresh Fund (Double Market Bucks) for SNAP
Senior Farmers Market Nutritional Program (SFMNP) voucher
Power of Produce program for children
None directly but vendors can offer SNAP, etc.
Double up Food Bucks SNAP EBT WIC F MNP
EBT/SNAP (Double Dollars used as incentive for SNAP) WIC FMNP/SFMNP
Pricing and Revenue
Pricing structures vary by Market, but season/annual/yearly rates and part-time/daily rates are most common (Figure 13). Annual revenues are not generally available for non-farm vendors. Annual revenues for farm vendors are typically attributed to stall/booth, application, and parking fees (Figure 14). The average revenue from farm vendors for 2023 is $94,000. Most of the Markets do not utilize a current method for collecting economic impact data.
Pricing and Revenue
Stall: $500 (yearly)/$35 (daily)
Ann Arbor, MI
Parking spot: $120 (yearly)/$6 (daily)
Food truck/cart: $35/day
Large space reserved: $702 ($540 Senior or Youth rate)
Small space reserved: $480 ($390 Senior or Youth rate)
Large day space: $24 ($18 Senior or Youth rate)
Bloomington, IN
Broad Ripple, IN
Charlottesville, VA
Small day space: $16 ($13 Senior or Youth rate)
FBA w/ electrical/water needs: $28/day FBA: $26/day
Stall: $420 per season
Application fee: $35
10'x10' booth: $25/day
10'x20' booth: $30/day
20'x10' booth: $40/day
20'x20' booth: $50/day
*Reserve vendors can have 25% season discount
Holiday market: $15 app fee & $25 booth
Wednesday market: $15 app fee & $10 booth
10'x10' booth full-time: $500
Fishers, IN
Iowa City, IA
Madison, WI
10'x10' booth part-time: $350
D rop-in: $35
Full-season vendor: $442 per stall
Daily vendor: $20/day per stall
Seasonal
8': $216; 8' w/ parking: $288; Inlet stall: $360; Pad stall w/ parking: $360; 16': $360; 16' w/ parking: $432
Daily
8': $24; Island stall: $24; Pad stall: $32; 16': $40; Inlet stall: $40; Parking (if available): $8
Wednesday Market
10' w/ parking: $16 (daily); 20' w/ parking: $24 (daily); 20' w/ parking: $312 (seasonal - 13-week segment)
2023: $220,219
2022: $189,617
2021: $208,261
2023: $130,482
2022: $170,034 2021: $107,265
2023: $9,700
2022: $9,700
2021: $9,700
2024: $280,401
2023: $208,351
2022: $216,904
2023: $27,343
2022: Unknown
2021: Unknown
2023: $54,896
2022: $65,748
2021: $75,896
2023: $318,524
2022: $238,953
2021: $198,360
Figure 13: Pricing and Revenue Benchmark 1 of 2
Ann Arbor, MI
Bloomington, IN
Broad Ripple, IN
Vendor payments are not tracked separately because everyone pays the same. No percentage of sales are taken.
2023: $10,010 (6.5% of gross)
2022: $11,966 (7% of gross)
2021: $11,273 (7.5% of gross)
*Changing to flat fee in 2024
2023: $52,000
2022: $52,000
2021: $52,000
Charlottesville, VA N/A; Municipal Meals Tax collected by Commissioner of Revenue
2023: $134,839 (stalls and parking fees)
2022: $128,079 (stalls and parking fees)
2021: $181,150 (stalls and parking fees)
2023: $37,575 (booth + application fee)
2022: $32,062 (booth + application fee)
2021: $29,295 (booth + application fee)
Same as previous answer + 15-20% from Ready-to-Eat vendors
Track information related to credit card sales for Market tokens and food assistance programs
No information is currently collected
Ask for annual sales by month and received information this past year from long-term vendors
Fishers, IN
Iowa City, IA
Unknown; vendors are asked to submit their gross sales either by name or anonymously but participation is low.
Unknown
Madison, WI N/A
2023: $88,506 (booth + application fee)
2022: $72,068 (booth + application fee)
2021: $82,198 (booth + application fee)
2023: $39,800
2022: $35,000
2021: $18,540
2023: $63,202 (stall fees and merchandise)
2022: $67,192 (stall fees and merchandise)
2021: $79,520 (stall fees and merchandise)
2023: $241,135 (booth + annual fee)
2022: $217,101 (booth + annual fee)
2021: $179,781 (booth + annual fee)
We have used paper receipts for sales collection in the past; since 2022, we have been utilizing MarketSpread.com to collect sales and fees in addition to some vendors that prefer paper receipts
Unknown; vendors are asked to submit their gross sales either by name or anonymously but participation is low.
No information is currently collected
No information is currently collected
Figure 14: Pricing and Revenue Benchmark 2 of 2
Revenue Detail
When examining revenue in greater detail, the average revenue per vendor (overall, not based on vendor category) is $680 (Figure 15). A slightly different revenue metric is examining the revenue per total available stall/booth. In that scenario, the average revenue per stall/booth is $816 amongst all benchmark Markets.
Expenditure Detail
When examining expenditures in greater detail, the average expenditure per vendor (overall, not based on vendor category) is $914 (Figure 16). A slightly different expenditure metric is examining the expenditure per total available stall/booth. In that scenario, the average expenditure per stall/booth is $1,081 amongst all benchmark Markets.
Expenditure Detail
Figure 15: Revenue Detail Benchmark
Figure 16: Expenditure Detail Benchmark
Booth Fee Detail
A few of the Markets offer different stall sizes to their vendors (Figure 17). Daily pricing ranges from $16 to $50 per day. All Markets, except for Bloomington and Madison, offer a season/year/annual rental discount for full-time vendors. The discounted price (based on multiplying the daily fee by the season length, if known) ranges from a 0% to 73% discount. The majority of full season discounts are a doubledigit percentage. Several of Madison, Wisconsin’s stalls also have parking fees associated with them, as applicable/available.
Bloomington, IN
Charlottesville, VA
Fishers, IN
Iowa City, IA
Madison, WI
External Stakeholder Engagement
Advisory Council
A meeting with the Advisory Council was held on May 20, 2024. Two questions in particular were posed to the group:
1. What do you like most about the BCFM that we need to build upon?
2. What opportunities exist for improvement in your opinion?
NeedtoBuildUpon
Advisory Council members noted the Farmers’ Market infrastructure, the farmers themselves, the community “feel” of the Market, and the Market’s position as a place of destination are all strengths that need to be leveraged moving forward.
Figure 17: Booth Fee Detail Benchmark
Booth Fees
OpportunitiesforImprovement
In terms of improvements, Advisory Council members noted several areas to focus on including, but not limited to, community components of the Market, site parking, farm visits, buskers and outdoor performances (currently using one busker), price sensitivity (the Market has a reputation of being “pricey” so articulating the connection between the Market and community investment may be important), advertising (informing the community the Market is back; also, advertising in the Indiana Daily Student), incentives to attract current non-users (such as discounts and/or “grant” monies to nonusers for Market spending), and including FBA vendors in the Market Handbook
Community Partners
Individual interviews were conducted with community partners that interact with the BCFM in different ways. Conversations were held with the Bloomington Chamber of Commerce, Farm to Family Fund, Downtown Bloomington, Inc., and the Monroe County Health Department. The conversations focused on three questions:
1. What do you hear about the Market within the community?
2. What role(s) do you see the BCFM playing within the community? What role(s) could it play?
3. Are there other considerations that need to be noted for this evaluation study?
WordofMouth
Community partners suggested several things they hear about the BCFM in the community including, but not limited to, the Market being professionally operated, it is a strong component of downtown Saturday mornings, attendance is increasing since 2019 and the Covid-19 pandemic, and the Market isn’t what it used to be back when it was viewed as the number one farmers’ market in the state.
CommunityRole
Community partners see the BCFM playing different roles within the community such as being the place people come to regardless of political affiliation, a place where people can meet, the center point of a local food system, a catalyst for the local economy, and the narrative the city focuses on fresh foods, the environment, and sustainability.
OtherConsiderations
Community partners indicate the Market’s hours are longer than other markets, physical site improvements could be made related to stronger Wi-Fi and more potable water access, the Market is in need of a re-brand/refresh, and the Advisory Council’s role needs to be clarified.
Current and Past Vendors
A site visit was conducted during the June 29, 2024 Market. While on site, 34 vendors provided feedback for the evaluation study. After the site visit, another 14 previous and current vendors provided comments via one-on-one interviews for a total of 48 vendors engaged. Vendors were asked to respond to five questions:
1. What do you like most about your experience with the Bloomington Community Farmers’ Market?
2. If you could change one thing about the Market’s policies, rules, and/or implementation/administration, what would that be and why?
3. How would you describe your ideal vision or state for the BCFM? What words, phrases, or attributes would you use to describe it?
4. Do you participate in other Farmers’ Markets? If so, where?
5. Is there anything else you would like to say that you think would be helpful for this Market evaluation study?
Based on feedback received, the following sections outline the main themes, points, and directions provided by vendors.
Strengths
• Community and Atmosphere. Vendors appreciate the strong sense of community and the connection between farmers and customers. The market is seen as a gathering place that fosters local food culture and brings people together.
• Infrastructure and Location. The physical setup, including accessibility, infrastructure, and the location near the B-line Trail, is valued. Features like music, events, and proximity to downtown are also seen as strengths.
• Management and Staff. Positive feedback is given to market management and staff for their support and flexibility, particularly in helping vendors with setup and space selection.
• Customer Base and Regularity. The Market's regular customer base and its reputation as a wellorganized market with quality vendors are highlighted as key strengths.
Changes
• Communication Issues. There is concern about communication between Market management and vendors, with suggestions for more transparency and better dissemination of information.
• Layout and Logistics. Vendors suggest improvements in market layout, including the possibility of reconfiguring the space to be more inviting and accessible with increased sightlines, seating areas, signage/wayfinding, walking routes, and less vendors outside the core area.
• Points System. The current points system is seen as confusing and potentially unfair, particularly for new vendors, smaller businesses, and Food and Beverage Artisans (FBAs).
• Policy Consistency. Vendors express a need for clearer and more consistent enforcement of market rules, with specific concerns about the resale of non-local products and vendor accountability.
• Market Hours. Many vendors feel that the market should close earlier (at 12:00pm instead of 1:00pm) due to declining customer traffic and product quality in the later hours.
IdealVisionorState
• Vibrant and Inclusive. Vendors envision a vibrant market that serves as a community hub and is more than just a place to buy groceries. They desire a diverse crowd and a broader customer base.
• Holistic Food System. The ideal market would be part of a larger, more integrated local food system, with a focus on nutrition, wellness, and supporting young farmers and artisans.
• Modernization. There is interest in modernizing the market with technological advances, such as online ordering or delivery systems, to adapt to changing consumer habits.
• Space and Infrastructure. A dedicated and potentially fully-covered market space is seen as ideal for extending the season and improving vendor and customer experiences.
• Community and Trust. Restoring and enhancing the sense of community and trust that existed prior to 2019 is a priority for many vendors.
OtherParticipation
• Participation in Multiple Markets. Many vendors participate in other farmers' markets, including those in Broad Ripple, Columbus, Indianapolis, and the nearby Woolery Mill. Some also attend winter markets or are involved in farm stop collectives.
• Comparative Experiences. Feedback indicates that some vendors experience higher sales at other markets, with mentions of better support from local health departments and different market policies.
FinalThoughts/OtherConsiderations
• Market Belongs to the Community. Vendors emphasize that the market is a community asset and should remain people-centric rather than focused solely on policies and procedures.
• Concerns About Change and Continuity. There is a call to balance innovation with maintaining traditions that have historically worked well for the market. Vendors express concerns about market changes and the need for more vendor input in decision-making processes.
• Advertising and Engagement. Increased advertising and better engagement with both new and returning customers are seen as crucial for the market's growth and vibrancy.
• Vendor Voices. The need for more effective communication and collaboration between vendors and market management is a recurring theme, with some calling for a more functional advisory council.
Customer Survey
A customer survey was available from June 15-August 10, 2024 to solicit a different perspective about the BCFM. A total of 124 responses were collected – seven responses more than the totals for the previous three annual customer surveys combined. The survey was hosted on Mentimeter.com and participants were free to take the survey on their own time. Eight questions were asked that included a variety of question formats including multiple choice, ranking, and open-ended comments. The following sections present the survey results by question.
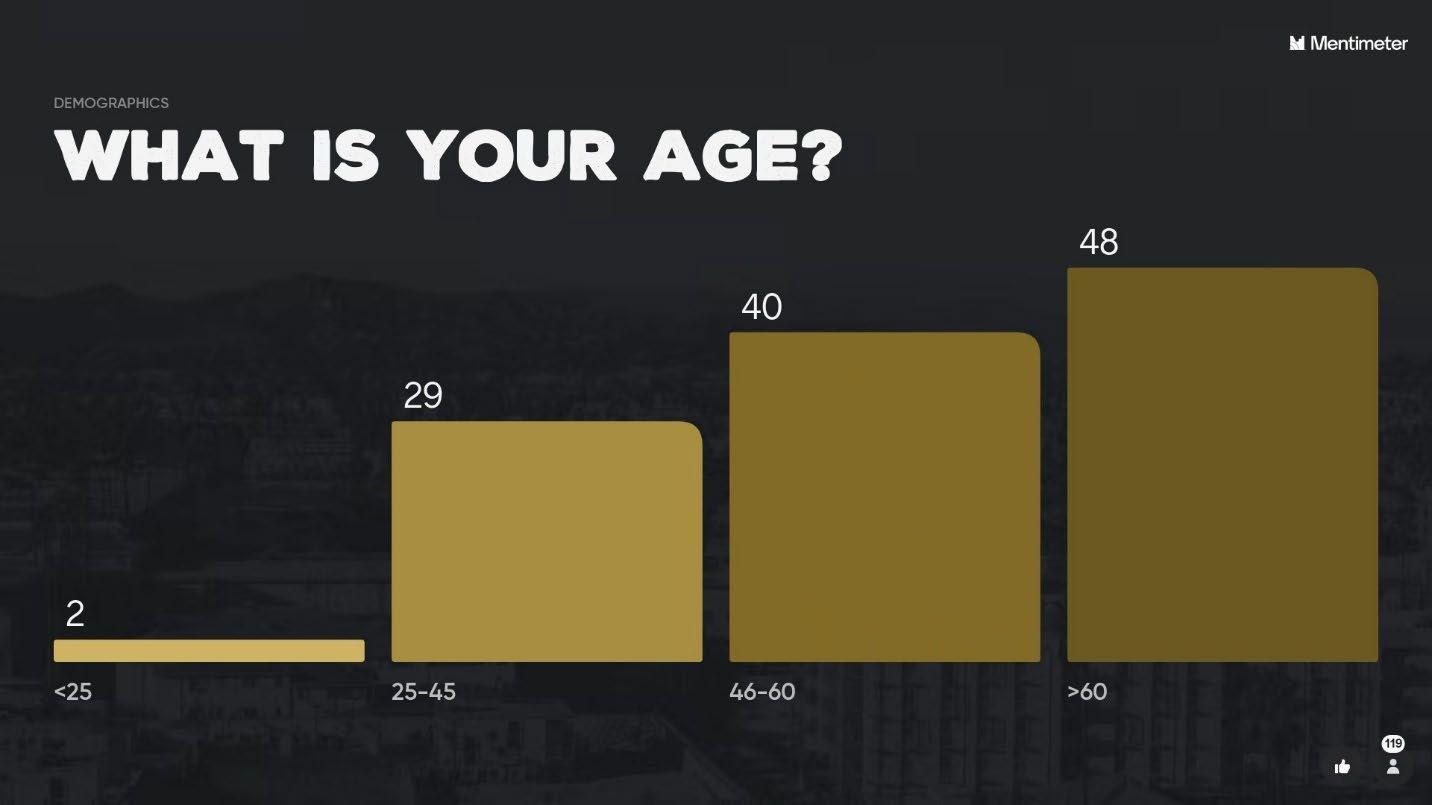
RespondentAge
The majority of respondents were over 46-years old (Figure 18)
VisitationFrequency
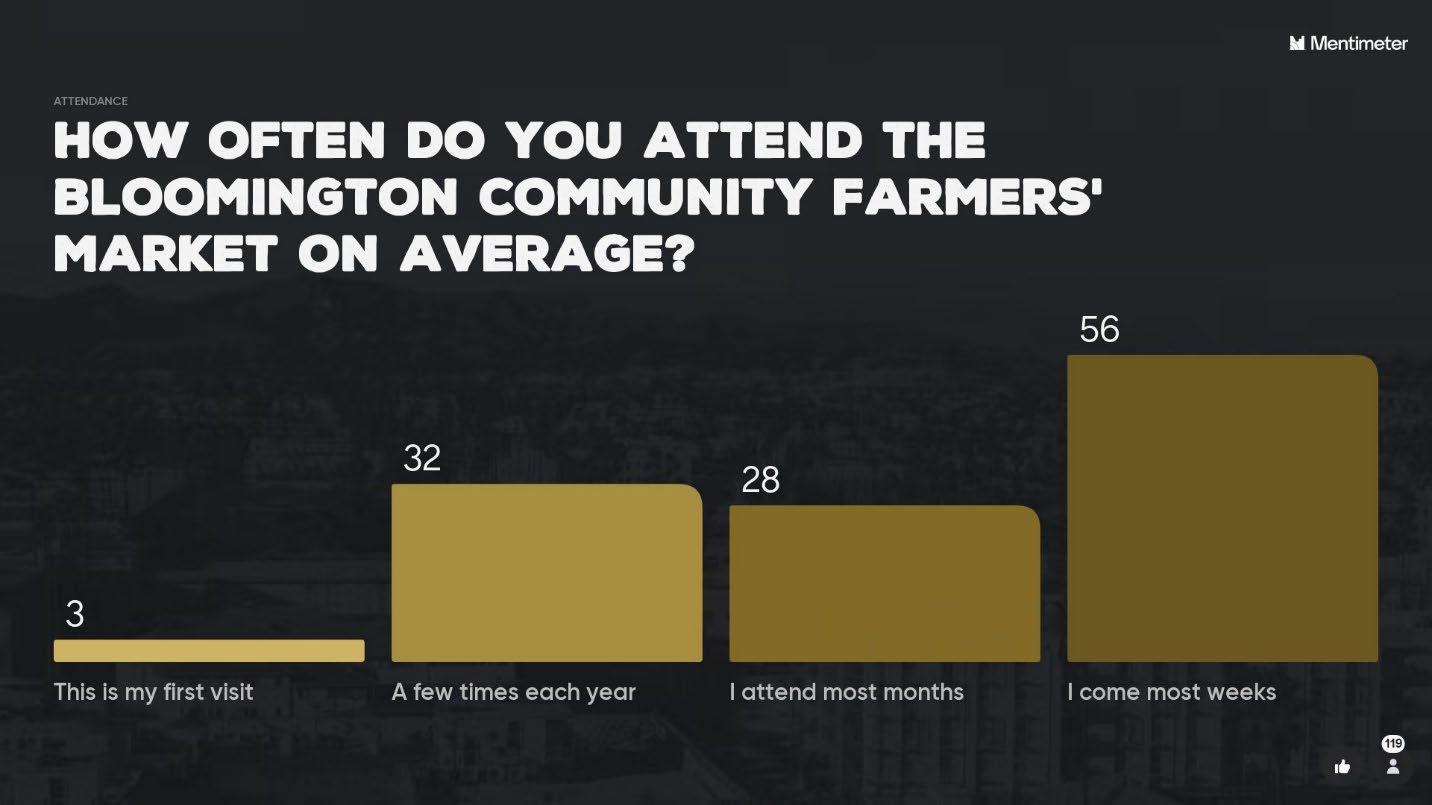
The majority of respondents indicated they attend the BCFM at least a few times a year, with 70% attending most weeks or months (Figure 19).
Figure 18: BCFM Customer Survey Respondent Age
ProductsPurchasedMostOften
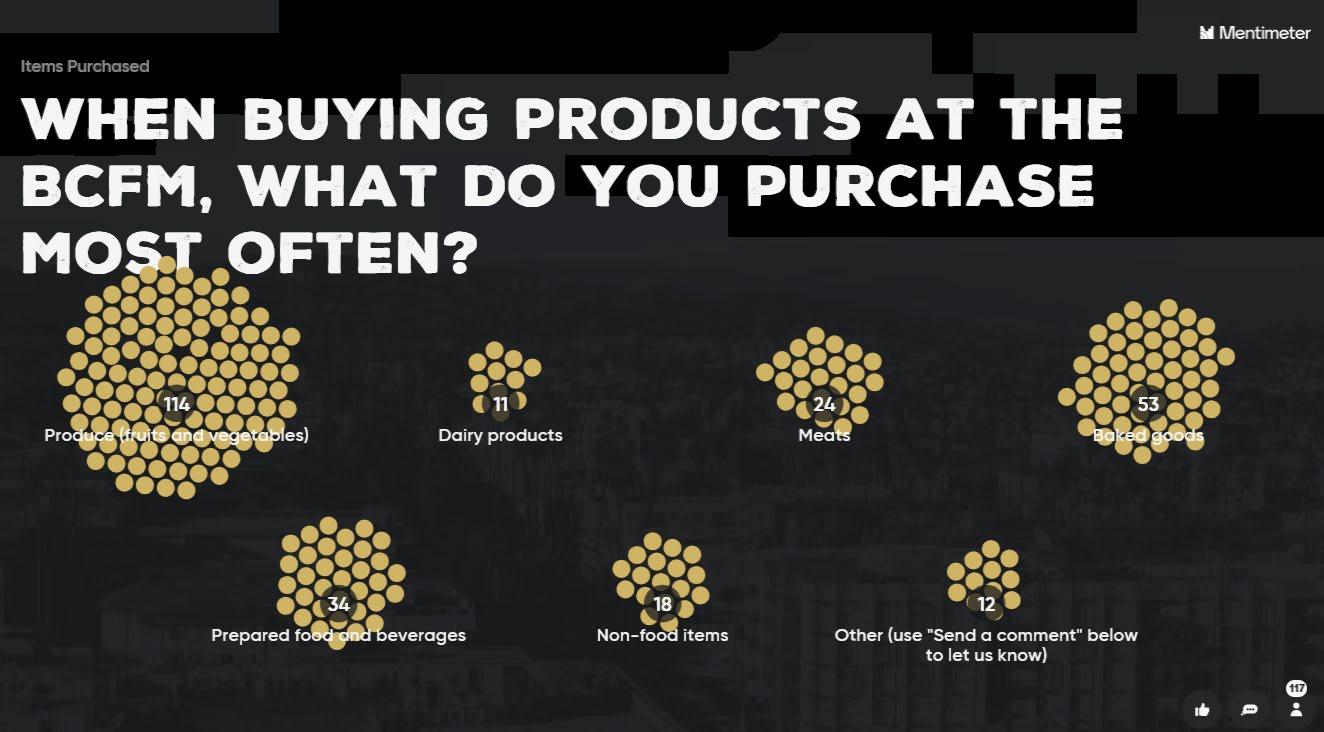
Respondents were asked to indicate what types of products they purchase most often at the Market (Figure 20). Most customers purchase produce while at the BCFM. The next most purchased products include baked goods, prepared food and beverages, and meats. Twelve respondents selected “other” but did not provide information related to what they purchase most often.
Figure 19: BCFM Customer Survey Attendance Frequency
Figure 20: BCFM Customer Survey Products Most Purchased
MarketEconomics
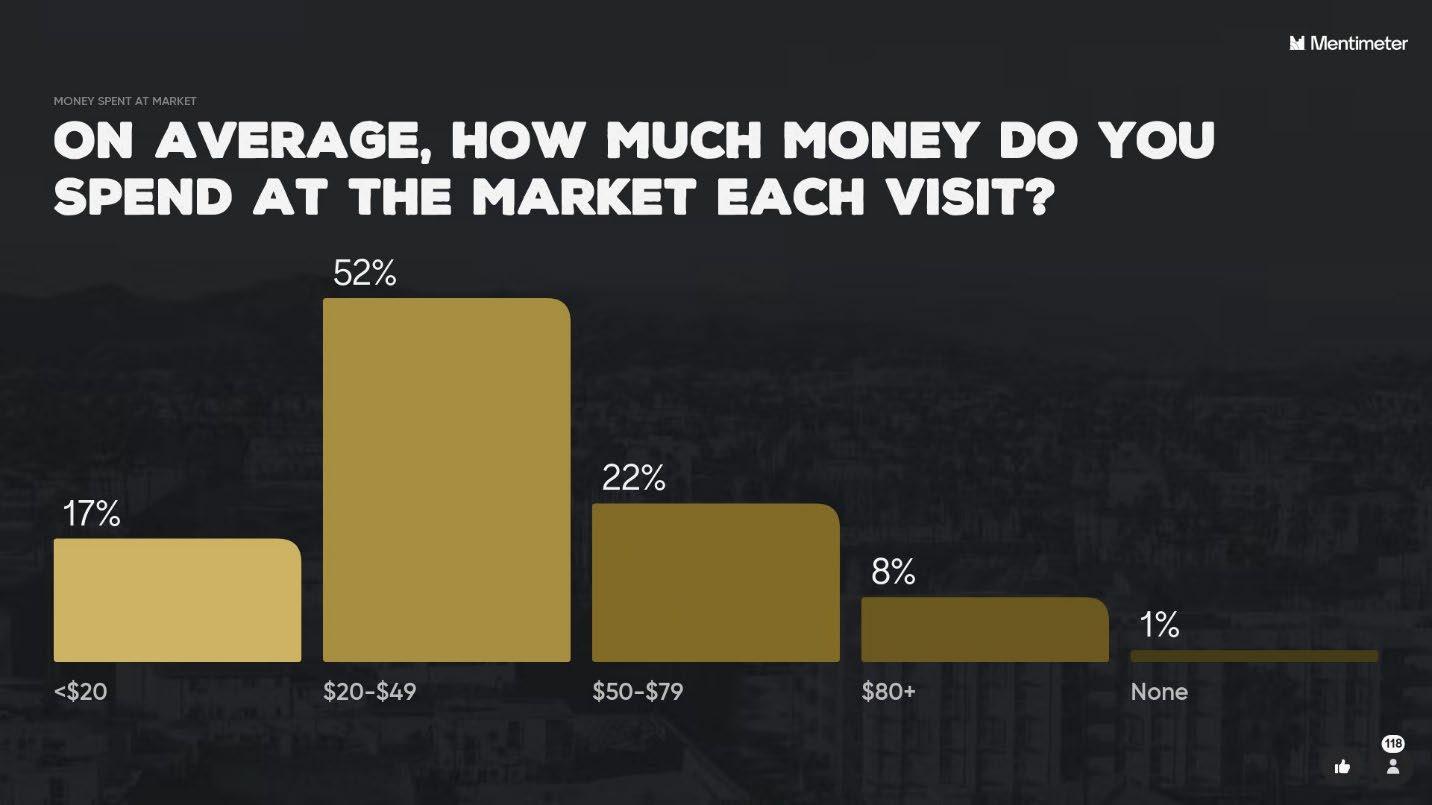
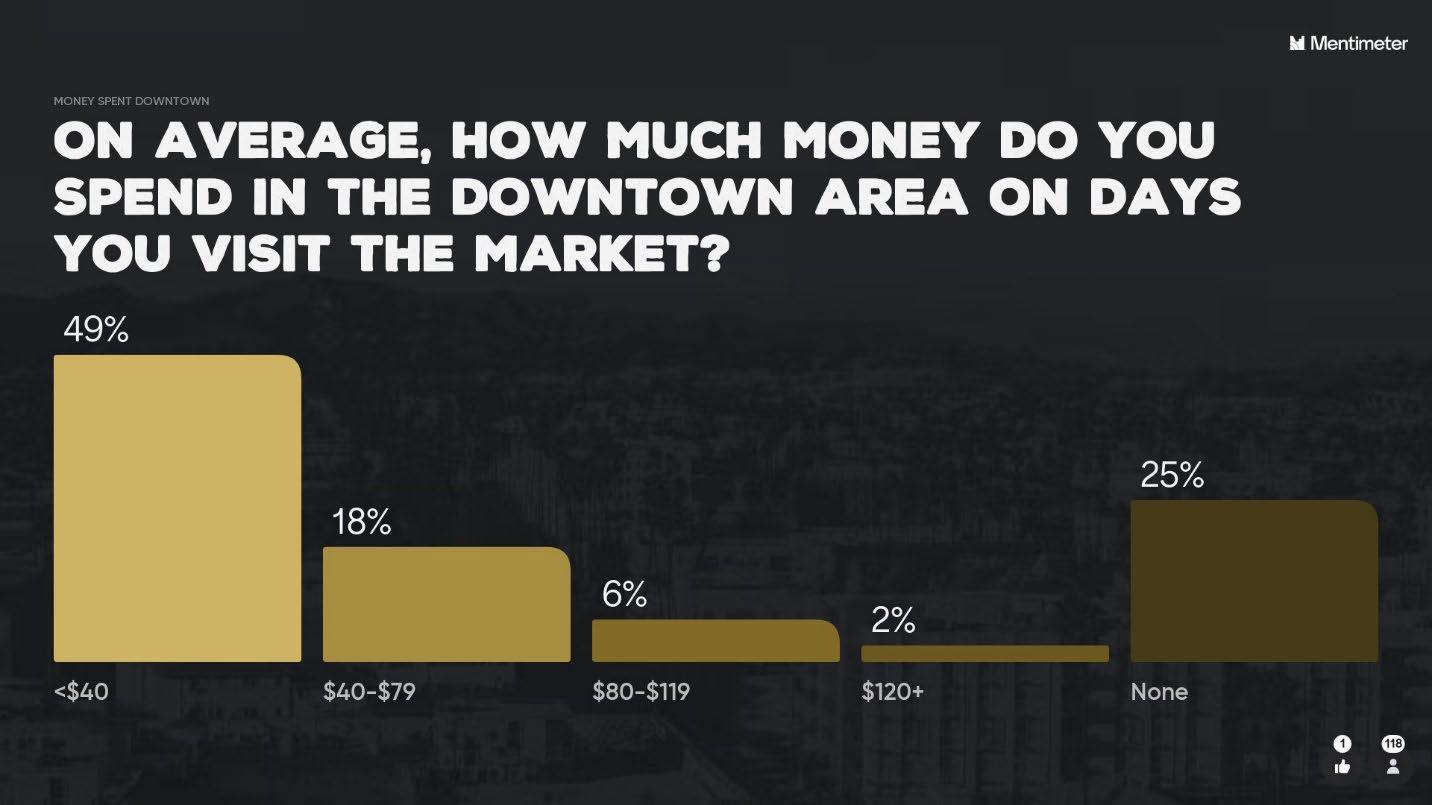
In terms of money spent at the BCFM, respondents indicated they most commonly spend between $20$49 each visit (Figure 21). Almost one-third of respondents spend $50 or more on average. Since the BCFM is located off of the Bloomington square, respondents were asked to indicate how much money they spend on average in the downtown area on days they visit the Market (Figure 22) Approximately 75% of survey respondents reported they spend money in the downtown area on days they visit the Market.
Figure 21: BCFM Customer Survey Money Spent at the Market Each Visit on Average
Figure 22: BCFM Customer Survey Money Spent in Downtown Area on Market Days on Average
MarketBenefits
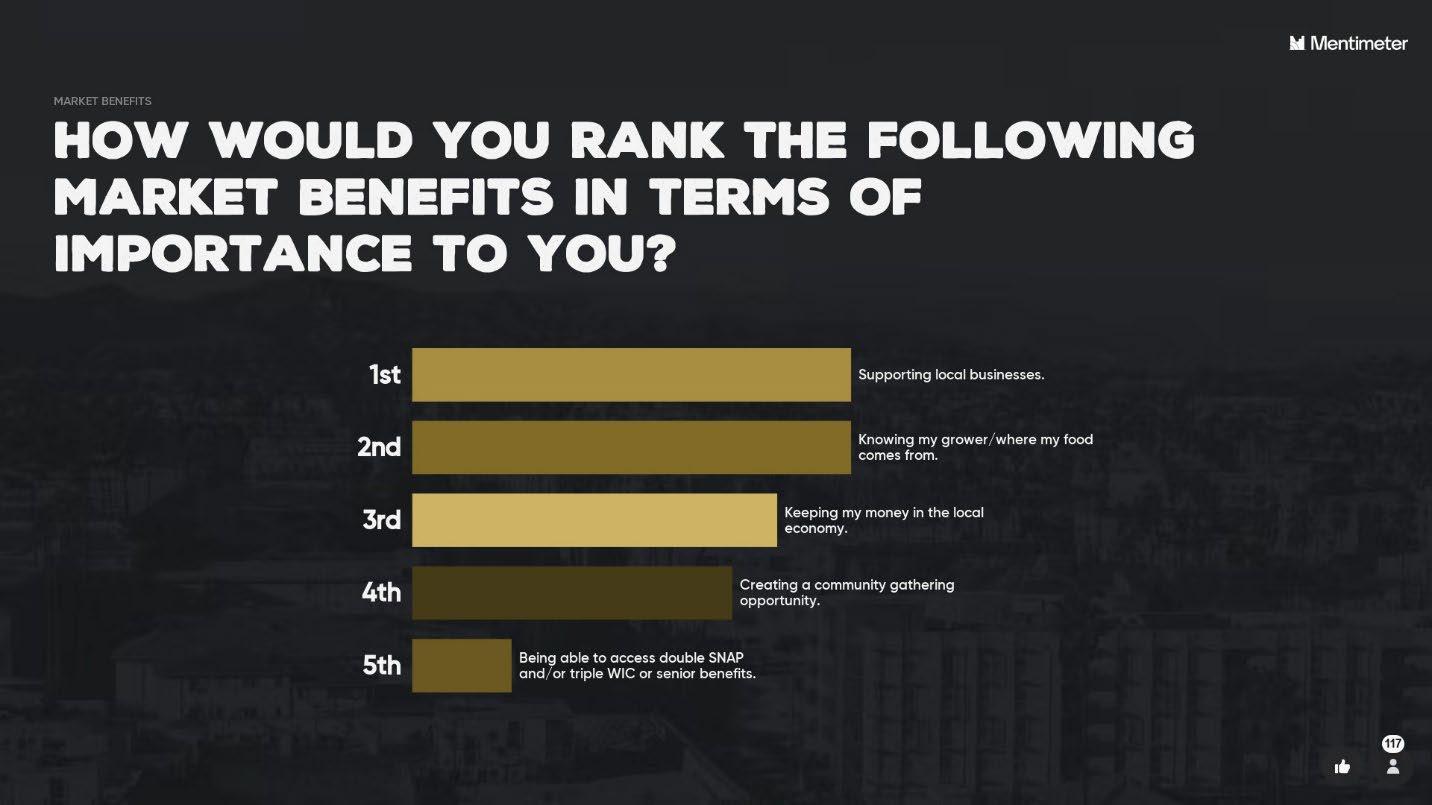
Survey respondents were asked to rank five competing benefits received from attending, supporting, and visiting the BCFM (Figure 23). Two benefits in particular, supporting local businesses and knowing my grower/where my food comes from are most important to BCFM customers. Based on survey respondents, being able to access double SNAP and/or triple WIC or senior benefits are less important.
IfCustomersCouldChangeOneThingAbouttheMarket,ItWouldBe…
Survey respondents’ most common areas of concern revolve around the need for more vendors, improved parking and accessibility, better pricing options, and a revival of the community atmosphere. Specific feedback received can be categorized into eight categories with sub-themes.
1. Market structure and reunification
a. Reunification of Markets. Several respondents mentioned the desire to reunify the BCFM with the Woolery Mill Market or bring back the unified market that existed before the split. The division appears to have had a lasting impact on survey respondents’ perception and experience of the Market.
b. Market Layout and Flow. Some comments suggested consolidating vendors, especially food and beverage artisans, in one area to improve customer experience. Others mentioned the need to reduce congestion within the Market.
2. Vendor Diversity and Offerings
a. More Vendors and Product Variety. There is a strong desire for more vendors, particularly those offering unique or diverse products, prepared foods, and more plant vendors. Respondents noted that the BCFM used to have a wider range of vendors and products.
Figure 23: BCFM Customer Survey Importance of Various BCFM Attendance Benefits
b. Specialty Products. Customers expressed interest in more gluten-free options, organic produce, and vendors who do not use chemicals. There were also suggestions for more seafood vendors, meat vendors, and plant-based prepared food options.
3. Pricing and Economic Considerations
a. Lower Prices. Multiple respondents mentioned the need for lower prices, with some suggesting bulk purchase options at discounted rates.
b. Market Bucks and Cash Handling. A few customers pointed out the mismatch between the value of Market Bucks and item prices, leading to difficulties when purchasing without exact change.
4. Accessibility and Parking
a. Parking Concerns. Many respondents expressed a need for more free parking options, more ADA parking spots, and safer parking arrangements.
b. Accessibility for Individuals with Disabilities Concerns were raised about the current ADA parking setup, with suggestions to use specific lots for this purpose.
5. Community and Atmosphere
a. Reviving Market Vibrancy. Several comments focused on bringing back the vibrancy and community feel that the BCFM used to have. Some suggested more seating areas, activities for kids, and a wider variety of music.
b. Music Preferences. There were mixed feelings about live music at the Market. While some enjoyed it, others found it either too loud or not to their taste, suggesting a broader variety of genres.
6. Market Policies and Management
a. Vendor Policies and Vetting. A few responses called for stricter vetting of vendors, especially regarding the use of chemicals and the support of local and Black farmers.
b. Elimination of Politics. Some respondents expressed frustration with the politicization of the BCFM, particularly related to past conflicts.
7. Communication and Information
a. Vendor Information. Customers expressed a need for more transparency about the vendors, such as their farming practices, whether they use chemicals, and what payment methods they accept. A dedicated place on the Market’s website for this information was suggested.
8. General Satisfaction and Suggestions
a. Positive Feedback. A few responses indicated satisfaction with the current state of the Market, appreciating its recovery after past issues.
b. Additional Suggestions. Unique suggestions included extending Market hours, allowing dogs on leashes, and starting the Market earlier.
FinalThoughts
Survey respondents were asked to provide their final thoughts. Survey responses generally reflect a deep appreciation for the BCFM, with many respondents expressing love for the market, its atmosphere, and the sense of community it fosters. However, there are also concerns about Market management, communication with vendors, and the BCFM’s accessibility and affordability. Some respondents
highlighted issues like the impact of past Market disruptions, the need for more vendors, and the desire for the Market to evolve with new ideas and inclusivity. There were also mentions of specific preferences, such as maintaining the current vendor setup and addressing issues like pedestrian congestion and the use of plastic packaging.
Overarching Recommendations
Based on all information gathered and analyzed, the following overarching recommendations and considerations are provided for the BCFM. Of note, other sections in this report may provide additional specific actions that correlate to these overarching recommendations and considerations.
Foundational
The following items are deemed to be foundational recommendations as an outcome of this Evaluation Study These items relate to critical path movements. This list is not representing a priority order; rather, these items represent a full spectrum of implementation actions.
1. Market to Vendor Communication. Vendors desire to see more meaningful statistics related to the “business” of the BCFM. Points of interest include customer trends, vendor participation (who is coming each week, especially FBAs), revenue/sales trends, and the like. Placer.aiproduced metrics may be relevant to the Market.
2. Market Staff Training, Presence, and Positioning. With a broad range of required knowledge, skills, and abilities, farmers’ markets require a different knowledge base from leadership than other types of community programming. As a result, training opportunities should be made available annually related to trends in farmers’ markets along with growing and producing techniques, theory, and applications.
3. Facilitating Accountability. Both vendors and customers desire to see enhanced accountability measures taken for those that sell at the BCFM. Considerations should be made for annual site visit audits, signage posted at individual booths representing growing methods and chemicals used (if any), and assurance all items transacted through the BCFM are producer-made.
4. Addressing the Past. A barrier can be both perceived and real; however, a perceived barrier is still a barrier until it is recognized as not. In the case of the BCFM, there is a lot of angst, negative emotions, and overall concerns stemming from a 2019 incident in which vendors did not feel as if they were supported by the City. Direct recognition of the past with a commitment to the future will most likely go a long way for rebuilding/building trust, open communication, and transparency with BCFM vendors and customers.
5. Clarify Advisory Council’s Role. The overall perception is the Advisory Council is not as helpful as it could be. Distinguishing the roles between the City and the Advisory Council is important along with facilitating more communication between vendors and the Council. This may necessitate an increased staff function to help bridge the communication gap.
6. Points System Alteration. Only a few vendors indicated they understood the existing points system and appreciated how it is used. At a baseline, vendors desire to see a points system acknowledge seniority but also include FBAs, reward participation, and encourage new vendors to the Market. Encouraging new vendors to the Market may need to include a layout adjustment and/or dedicated space such as a “new vendor showcase” area. Regardless of edits made to the current system, some sort of seniority-based system should remain.
7. Continue to Address Fees. According to benchmarking results, many other farmers’ markets offer some sort of full season discount. An ongoing review of fees is warranted. Additionally, consideration should be made for alterations to the cost recovery mandate/goal associated with the BCFM.
8. Re-examine Site Layout, Functionality, and Hours. The existing layout is not conducive to facilitating customers walking past all vendors. There is also a main corridor down the middle that allows people to cut through the Market without needing to be part of the Market. In lieu of creating a circulation route, better wayfinding is warranted so customers know the full extent of the Market vendors and locations. This idea is also supported by the fact that viewsheds are blocked by vendor vehicles within the Market. Additional customer seating would make it easier to frequent FBAs and staying in the Market area. Trash cans and recycling receptacles are also needed. Market music can be improved with paid musicians and/or more consistency. Lastly, Market hours should be reduced to an end time of 12:00pm at a minimum.
Visionary
The following items are more visionary recommendations as an outcome of this Evaluation Study. These items relate to broader perspective and long-term Market sustainability. This list is not representing a priority order; rather, these items represent a full spectrum of implementation actions.
1. Become a Catalyst for a Broader Local Food Economy. There is a strong connection between a local farmers’ market and the local food scene; however, farmers’ markets tend to transcend beyond local foods and embrace more of a local sustainability mindset. With local co-ops, food stops, and other farmers’ markets in the area, vendors and customers desire to see the BCFM position itself as the epicenter for the local food economy. This will entail embracing a philosophical position as such while simultaneously working to forge partnerships and collaborations with other organizations while educating the Bloomington public on the local food economy.
2. Create Broader Awareness. The connection local farmers’ markets have to personal and community wellbeing can be better articulated to local health organizations, economic development agencies, and Indiana University students in particular. A marketing plan should be created that details various market segments with desired messages, associated communication methods employed, and measures of success (metrics).
3. New Technology Integration. It is necessary to explore the use of online/order ahead processes for the BCFM as customer shopping experiences evolve over time. However, any technological advancements and integrations should not interfere, prohibit, or diminish any one vendor’s ability to participate in using the technology.
4. Create More Research-Oriented Opportunities. Explore the ability to create and host a local food summit which brings vendors, farmers/producers, and customers together to discuss new ideas, techniques, and trends. This would be a good opportunity to reinforce the BCFM’s position within the larger local food economy network while bringing more attention to the Market itself (locally, regionally, and possibly nationally).
5. Host an Annual End-of-the-Year Banquet. Create more of an integrated annual food celebration meal that acts as a local food showcase, provides final year-end information and metrics sharing time, and affords opportunities for real-time feedback for the year.
