Wake Forest Parks & Recreation Facility Impact Fee Update Study
I. Introduction and Methodology
Parks and recreation facility impact fees are used to fund acquisition and expansion of parks and recreation service-related capital assets required to address the additional parks and recreation service demand created by new growth. The Town of Wake Forest’s (the Town) 1989 Enabling Act allows the Town to implement impact fees for 10 services areas, including parks and recreational facilities. The Town implemented a parks and recreation facility impact fee in 1997, which was last updated in 2018 Given the time elapsed since the last study, the Town retained Benesch to update the impact fee schedule to reflect the most recent data.
Methodology
The Town’s enabling act requires that to impose impact fees, the following information needs to be prepared:
• A description of the anticipated capital cost to the Town of additional or expanded service facility generated by new construction;
• A description of relevant characteristics of construction that give rise to additional or expanded facilities; and
• A plan for providing future facilities.
The methodology used to update the Town’s impact fee program is a consumption-based impact fee methodology, which fulfills the first two requirements. A consumption-based impact fee charges new development based upon the burden placed on services from each land use (demand). The demand component is measured in terms of population per unit. A consumptionbased impact fee charges new growth the proportionate share of the cost of providing additional infrastructure available for use by new growth. In addition, a credit is subtracted from the total cost to account for the value of future contributions of the new development toward any capacity expansion projects. The credit component reflects estimates of future non-impact fee revenues generated by the new development that will be used toward capacity expansion projects. In other words, case law requires that the new development should not be charged twice for the same service. The final requirement is fulfilled with by the Town’s Parks, Recreation, and Cultural Resources Master Plan, which is currently being updated. Moving forward, impact fees will be reviewed and updated on a five-year cycle in conjunction with the department master plan.
The purpose of this study is to create a technically defensible set of impact fees for the Town’s parks and recreation program. It is important to note that, whenever possible, the most current
and localized data was utilized. All data and support materials used in this analysis are incorporated by reference as set in this document.
There are several major elements associated with the development of the parks and recreation facility impact fee. These include:
• Inventory
• Population and Service Area
• Level of Service
• Cost Component
• Credit Component
• Net Parks and Recreation Facility Impact Cost
• Calculated Parks and Recreation Facility Impact Fee Schedule
• Parks and Recreation Facility Fee Schedule Comparison
The various elements are summarized in the remainder of this report, with the result being the calculated parks and recreation facility impact fee schedule for the Town of Wake Forest.
II. Inventory
The capital inventory used in the impact fee calculations includes parks that are owned by the Town of Wake Forest and are classified into six different categories: greenway, greenway/open space, metro, mini, and neighborhood parks. The following provides a brief description of these park classifications.
• Greenway – linear natural preserve available for free and unstructured recreation to the general public. This term is not meant to be inclusive of required pedestrian/bicycle connections from adjacent development to greenways. The various types of greenways as defined in the Wake Forest Open Space & Greenways Plan are as follows:
o Type 1: Sensitive natural area with no formal greenway or trail development.
o Type 2: Greenway corridors in a primarily natural state with gravel or dirt trails intended for use by pedestrians only.
o Type 3: Corridors located outside floodplains with unpaved multi-use trails that are intended for use by pedestrians and bicyclists.
o Type 4: High-capacity off-road corridors and/or corridors located within floodplains that are paved for use by a wide variety of user groups including pedestrians, bicyclists, joggers, wheelchair users, strollers and rollerbladers.
• Open Space – areas set aside and protected from development which may be left in a generally unimproved state.
• Metro Parks – intended to provide active and passive recreation and may also contain special use facilities. Metro parks are typically 100 acres or more.
• Mini-Parks – less than two acres in size and typically serve the neighborhoods immediately surrounding them.
• Neighborhood Parks – typically 5 to 20 acres in size, usually serving the immediate surrounding neighborhood, although they can provide a town-wide service.
Table 1 provides an inventory of all parks and recreation facilities that are owned by the Town and included in the impact fee analysis, along with the facilities that are available at each park location. The parks and recreation inventory used as the basis for the impact fee analysis includes the following:
• 5 stand-alone greenway facilities;
• 16 open space parks with greenways;
• 2 metro parks;
• 4 mini parks; and
• 4 neighborhood parks.
RichlandCreekGreenway,phase 3- DurhamRoadto US1/Neuse River
III. Service Area and Demand Component
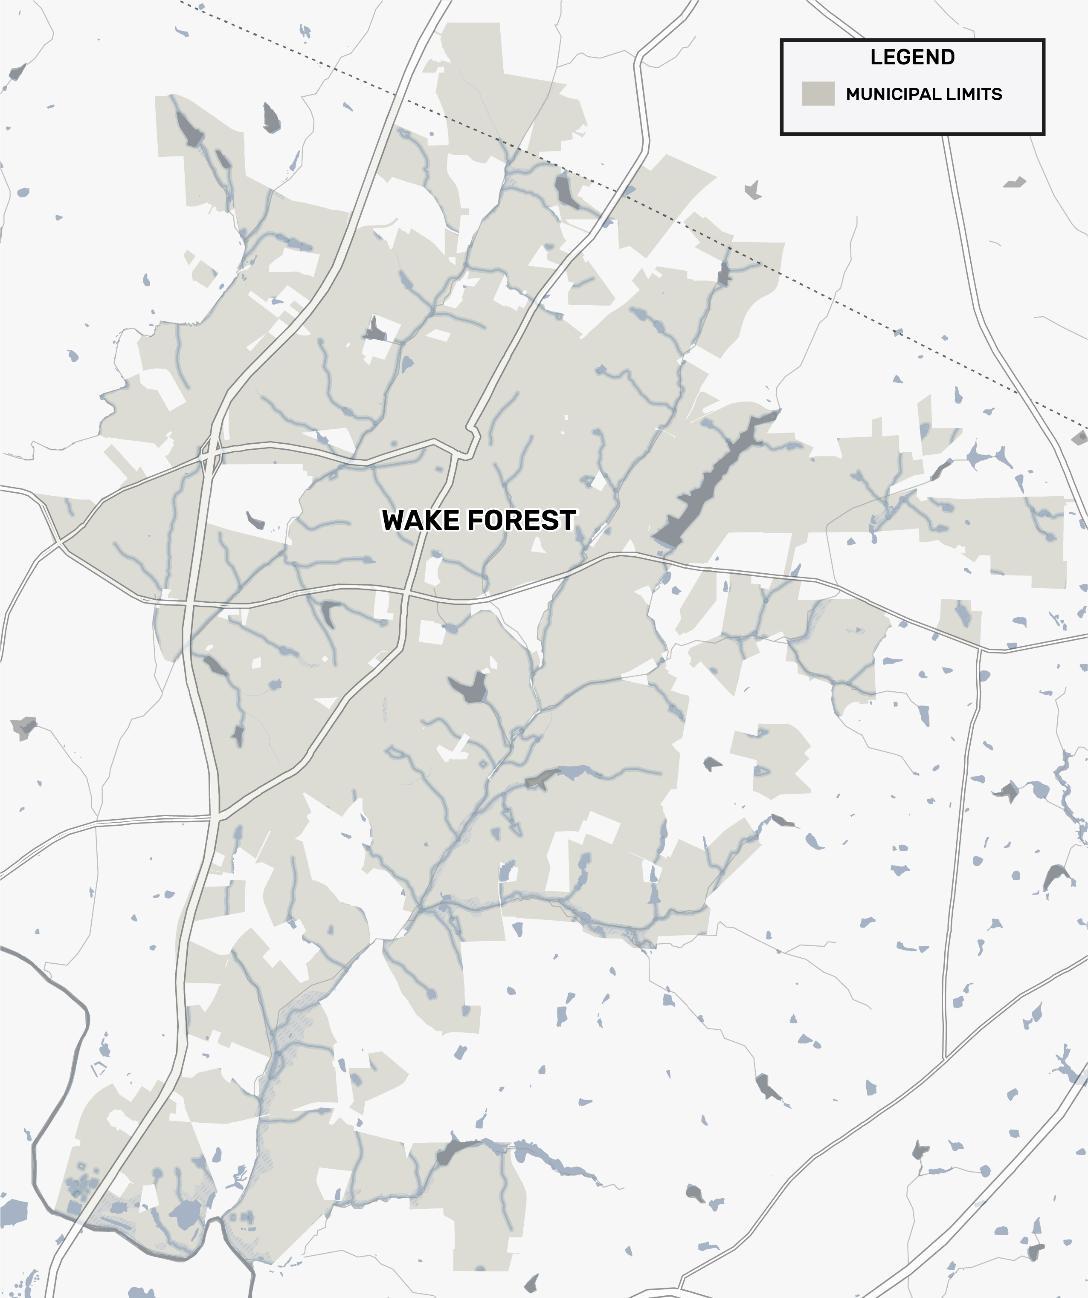
The Town of Wake Forest provides parks and recreation services to all residents. Given this, the service area for the facilities included in the impact fee calculations is the entire jurisdiction as shown in Figure 1. To accurately determine the demand for services, this impact fee study utilizes the Town’s permanent population, which is summarized in Appendix A, Table A-1 Table A-1 provides the permanent population estimate for 2024 (58,007) and the projected population through 2030. Table A-2 presents residents per housing unit, which measures demand by each residential category.
Source: Town of Wake Forest
Figure 1
Town of Wake Forest
IV. Level of Service
For impact fee calculation purposes, the level of service for parks and recreation facilities is measured in terms of asset value per resident. This figure represents the existing development’s investment into the parks and recreation infrastructure. The total asset value per resident for the Town of Wake Forest parks and recreation facilities amounts to $3,294 and includes both the value of facilities and land. Table 4 presents the calculation.
V. Cost
The total cost per resident for parks and recreation facilities consists of two components: the cost of recreational facilities and the cost of purchasing land.
Recreation Facility Value
The first step in calculating the total cost for parks and recreation services in the Town of Wake Forest involves estimating the current value of the Town’s recreation facilities. As presented in Table 2, the total value of recreation facilities amounts to $85.5 million. The value of greenway facilities makes up approximately 65 percent of this total and the remaining 35 percent consists of other recreational facilities (ball fields, picnic shelters, etc.).
The cost per mile of paved greenways was estimated based on five upcoming projects. In the case of these projects, the average cost per mile is approximately $2.2 million with a median cost per mile is $1.8 million Given these estimates, a value of $2 million per mile was used in the impact fee study. Discussions with the Town representatives confirmed that these sample projects had similar design characteristics as the greenways included in the inventory. The cost of unpaved trails was estimated at $65,000 per mile based on information provided by the Town.
To develop the Town’s remaining recreation facility value, the capital asset listing for recreational facilities that was provided by the Town was reviewed This list includes the original cost of each facility along with any expansion costs. In the absence of recent bids or construction for each type of facility, these historical costs were used to reflect the value of recreational facilities, which resulted in approximately $49,200 per acre.
Based on a total facility value of $85.5 million, and the total park acreage of 603 acres, the recreational facility value amounts to $141,800 per acre. This estimate was compared to data from other jurisdictions and was found to be within the range of recent studies completed by Benesch
For impact fee calculation purposes, the cost of recreation facilities was converted into a cost per resident by dividing the total facility asset value by the 2024 population of the Town. As shown in Table 2, the resulting asset value is $1,474 per resident.
Table 2
Recreation Facility Value per Resident
Recreational Facility Value(1)
$85,528,300
Total Park Acreage(2) 603.28
Total Recreation Facility Value per Acre(3) $141,772
2024 Population(4) 58,007
Recreation Facility Value per Resident(5) $1,474.45
1) Source: Town of Wake Forest and estimates developed for the valuation of greenway facilities. Represents the total value of greenway facilities and non-greenway recreational facilities (i.e., ball fields, picnic shelters, etc.)
2) Source: Table 1
3) Recreational facility value (Item 1) divided by total park acreage (Item 2)
4) Source: Appendix A, Table A-1
5) Total recreational facility value (Item 1) divided by the 2024 population (Item 4)
Land Value
To estimate the cost of park land several variables were evaluated, including recent land purchases, recent sales and current estimated values of vacant land similar in size to the Town’s parks based on data from the Wake County Revenue Department Property Database, value of parcels where existing parks are located, and discussions with Town representatives This review resulted in an estimated average land value of $175,000 per acre as presented in Table 3. Appendix B provides further detail regarding the land value estimate.
This land cost is converted to land value per resident by dividing the total land value by the 2024 population. As shown in Table 3, the total land value amounts to $1,820 per resident Variable Figure
Table 3
Land Value per Resident
1) Source: Appendix B
2) Source: Table 1
3) Land purchase cost per acre (Item 1) multiplied by total acres (Item 2)
4) Source: Appendix A, Table A-1
5) Total land value (Item 3) divided by the 2024 population of the Town (Item 4)
Total Impact Cost per Resident
Table 4 provides a summary of the total impact cost per resident which includes the recreation facility value per resident and land value per resident previously shown in Tables 2 and 3. As presented, the total impact cost is estimated at $3,294 per resident, which represents the existing population’s investment into the parks and recreational facility infrastructure. Also shown in Table 4 is the distribution of the Town’s assets, with recreational facilities comprising 45 percent and land the remaining 55 percent.
Table 4
Total Impact Cost per Resident
1) Source: Table 2
2) Source: Table 3
3)
4)
VI. Credit Component
To avoid overcharging new development for the capital cost of providing parks and recreation services, a review of the capital funding program for the parks and recreation program was completed. The purpose of this review was to estimate any future revenues generated by new development, other than impact fees, which will be used to fund the expansion of capital facilities and land related to the Town of Wake Forest parks and recreation program.
Capital Expansion “Cash” Credit
Between FY 2019 and FY 2028, in addition to impact fees, the Town has allocated funds from the General Fund and grants to fund capital expansion projects for parks and recreation facilities. To calculate the capital expansion expenditure per resident, the average annual capital expansion funding over the 10-year period is divided by the average population for the same period.
During this 10-year period, the Town’s parks and recreation capacity expansion projects amounted to a total of $3.6 million, resulting in an average capital expansion funding allocation of $361,900 per year. As presented in Table 5, the resulting average annual capital expansion funding is $6.37 per resident.
Table 5
Capital Expansion “Cash” Credit per Resident
Project Description(1)
General Fund
Skate Park/Pump Park
Flaherty Community Center Office
Greenway and Park Signage (Phase 2)
Joyner Park Amphitheater Irrigation and Sod
Greenway - Smith Creek Greenway - Phase 2
FY 2019 to FY 2028
$194,500
$366,500
$400,000
$155,000
$175,400
Greenway - Smith Creek Greenway - Phase 3 $23,900
Greenway - Dunn Creek Greenway Phase 3
$225,800
Greenway - Dunn Creek Greenway Phase 4 $128,300
Subtotal - General Fund $1,669,400 Grants
Holding Park Inclusive Playground $1,300,000 Skate Park/Pump Park $500,000
Subtotal - Grants $1,800,000
Miscellaneous Revenue
Restroom Installation $150,000
Subtotal - Miscellaneous Revenue $150,000
1) Source: Town of Wake Forest
2) Total expenditures divided by ten to calculate the average annual expenditure
3) Source: Appendix A, Table A-1, average annual population over the same 10-year period.
4) Average annual expenditures (Item 2) divided by the average annual population (Item 3)
Debt Service Credit
Any outstanding debt issues related to the expansion of parks and recreation facilities also results in a credit to the impact fee. Currently, the Town is paying debt service obligations that were used to fund parks and recreation capacity expansion projects such as Holding Park Pool and greenway expansion projects.
To calculate the credit of the outstanding loans, the present value of the total remaining
payments for each issue is calculated and then divided by the average annual population estimates over the remaining life of the issue. As presented in Table 6, the resulting credit is approximately $185 per resident.
Table 6 Debt Service Credit per Resident
1) Source: Town of Wake Forest
2) Appendix A, Table A-1. Average annual population over the remaining number of payments.
3) Present value of remaining payments (Item 1) divided by average annual population during remaining issue period (Item 2)
4) Sum of debt service credit per resident
VII. Net Parks and Recreation Facility Impact Cost
The net impact fee per resident is the difference between the cost component and the credit component. Table 7 presents the calculation of the net parks and recreation facility impact cost. As shown, the net impact cost amounts to $3,012 per resident.
7
1) Source: Table 4
2) Source: Table 5
3) Present value of the average annual capital expansion credit per resident (Item 2) over a 25-year period with a capitalization rate of 4.25 percent. The capitalization rate is based on the information provided by the Town of Wake Forest.
4) Source: Table 6
5) Sum of capital expansion "cash" credit per resident and "debt service" credit per resident
6) Total impact cost per resident (Item 1) less total capital improvement credit per resident (Item 5)
VIII. Calculated Parks and Recreation Facility Impact Fee Schedule
The calculated parks and recreation facility impact fee schedule is presented in Table 8 and amounts to $8,856 for single family and/or mobile homes and $4,789 for multi-family homes. Table 8 also shows the percentage change from the 2018 calculated impact fee as well as the Town’s adopted impact fee.
Table 8
Calculated Parks and Recreation Facility Impact Fee Schedule
1) Source: Appendix A, Table A-2
2) Source: Table 7
3) Residents per unit (Item 1) multiplied by the net impact cost per resident (Item 2)
4) Source: Town of Wake Forest Recreation Facility Fee Update Study, March 2018
5) Percent change between the calculated impact fee (Item 3) and the 2018 study calculated impact fee (Item 4)
6) Source: Town of Wake Forest. Adopted fees shown are 90 percent of the 2018 study's calculated rates.
7) Percent change between the calculated impact fee (Item 3) and the adopted impact fee (Item 6)
IX. Parks and Recreation Facility Fee Schedule Comparison
As part of the work effort in updating the Town of Wake Forest parks and recreation facility impact fee, a comparison of parks and recreation facility impact fee schedules is completed for communities of similar population levels or adjacent to the Town, as shown in Table 9.
In addition to impact fees, a comparison of parks and recreation in-lieu fees was developed and is presented in Table 10
Table 9
Parks and Recreation Facility Impact Fee Schedule Comparison
1) Represents the portion of the maximum calculated fee for each respective county that is actually charged. Fee may have been lowered/increased through annual indexing or policy discounts. Does not account for moratorium/suspensions.
2) du = dwelling unit
3) Source: Table 8
4) Source: Town of Wake Forest
5) Source: City of Raleigh Development Fee Guide, Zone 1
6) Source: Town of Rolesville, Impact fee for recreational development Fiscal Year 2023-2024 Adopted Budget
City of Raleigh(5)
Town of Rolesville(6)
Land Use Unit(2)
Town of Wake Forest
Table 10
Parks and Recreation Facility Fee-In-Lieu of Land Dedication Comparison
1) du = dwelling unit
2) Source: Table 8. Fees shown reflect parks and recreation facility impact fees.
3) Source: Town of Wake Forest. Fees shown reflect parks and recreation facility impact fees.
4) Source: Town of Apex, Building Inspections and Permits, Fee Schedule 2023/2024
5) Source: Town of Cary, 2023 Operating Budget
6) Source: Town of Fuquay-Varina Planning Department, all fees-in-lieu are capped at $5,000 per unit.
7) Source: Town of Garner, Adopted Annual Budget FY 2023-2024
8) Source: Town of Holly Springs, Residential Development Fee Workbook
9) Source: Town of Morrisville Development Services Department. Single family attached/detached, duplex, and manufactured homes are calculated as 1/35 of an acre (Pre-Development Cost) times the number of dwelling units
10) Source: Town of Rolesville, Adopted Budget FY 2023-2024
Appendix A
Population Analysis
Supplemental Information
Appendix A
The parks and recreation facility impact fee requires the use of population data for cost and credit calculations. To accurately determine demand for services, population projections included in the Wake Forest Community Plan are used. The population levels represent permanent residents of the Town.
As shown in Table A-1, the Town’s current population of 58,000 is projected to increase to 75,200 in 2030, an average annual growth rate of 4.7 percent.
Table A-1
Town of Wake Forest Population Estimates and Projections
Source: Town of Wake Forest Community Plan - May 2023 for 2010, 2020 and 2030 population estimates. Town of Wake Forest provided 2024 estimate. Population estimates for in between years were interpolated based on average annual growth rate.
Benesch Town of Wake Forest June 2024
Parks and Recreation Impact Fee Study
Apportionment of Demand by Residential Unit Type
The residential land uses to be used for the impact fee calculations are the following:
• Single Family and/or mobile homes
• Multi-Family homes
Table A-2 presents the population per housing unit by type for the residential categories identified above in the Town of Wake Forest’s parks and recreation facility impact fee update study. This analysis includes all housing units, both occupied and vacant.
Table A-2
Population per Housing Unit
1)Source: 2022 American Community Survey (ACS); 5-Yr Estimates, Table B25033
2)Source: 2022 American Community Survey (ACS); 5-Yr Estimates, Table DP04
3)Population (Item 1) divided by housing units (Item 2).
Appendix B
Land Value Analysis
Supplemental Information
Appendix B
This appendix provides a summary of land value estimates for the parks and recreation facility impact fee. To determine the land value for the Town of Wake Forest parks, the following information was reviewed and analyzed:
• Recent land purchases by the Town;
• Current value of existing park land based on information included in the Wake County Revenue Department Property Database;
• Vacant residential land sales of similar size to the Town’s park inventory between 2018 and 2023 obtained from the Wake County Revenue Department Property Database;
• Current appraised value of vacant residential land of similar size to the Town’s park inventory, obtained from the Wake County Revenue Department Property database; and
• Discussions with the Town representatives.
Table B-1 provides the results of this analysis.
In 2017, the Town purchased two parcels associated with greenways. The sale price of these parcels was $43,100 per acre and $26,000 per acre with a weighted average cost of approximately $29,900 per acre. The Town purchased two parcels for active park land in 2023. Cost associated with these parcels was $286,700 per acre and $375,500 per acre with a weighted average of $360,100 per acre.
The value of parcels where current parks are located ranges from $39,000 per acre to $195,800 per acre with a weighted average of approximately $54,000 per acre. Property Appraiser land value estimates for governmental entities tend to be at the low end since these properties are not subject to property tax and the values are not always updated to reflect the market conditions.
A review of vacant land sales between 2018 and 2023 of similarly sized parcels suggested a weighted average value of $79,400 with a median value of $94,100 per acre. The sale price during this time period ranged from $11,200 per acre to $991,300 per acre for all vacant land. In addition, based on Wake County Revenue Department Property Database estimates, the value of all vacant land averaged $51,700 per acre with a median value of $42,800 per acre. The value of vacant land included in the sample ranged from $10,000 per acre to $568,500 per acre.
Benesch
Town of Wake Forest June 2024 B-1 Parks and Recreation Impact Fee Study
Given this information and discussions with representatives from the Town of Wake Forest, an average land value of $30,000 per acre for greenways/open space and $350,000 per acre for other park types are determined to be reasonable estimates. Table B-2 shows the estimated land value estimate per acre by park type as well as the total acres according to the Town’s current inventory. Considering the weighted average land value of the current inventory, an average land value of $175,000 per acre is determined to be a reasonable estimate for parks and recreation facility impact fee calculation purposes.
Table B-1 Land Value Analysis
1) Source: Town of Wake Forest
2) Source: Wake County. Excludes parcels with a land value less than $10,000 per acre.
3) Source: Wake County. Excludes parcels with a sale price less than $10,000 per acre.
4) Source: Wake County. Excludes parcels with a land value less than $10,000 per acre.
Table B-2
Value Estimates
1) Source: Estimated based on the information provided in Table B-1
2) Source: Table 1
3) Estimated value per acre (Item 1) multiplied by total park acreage (Item 2)
4) Total estimated land value (Item 3) divided by total park acreage (Item 2)