6 minute read
Travel and transport
Public Transport
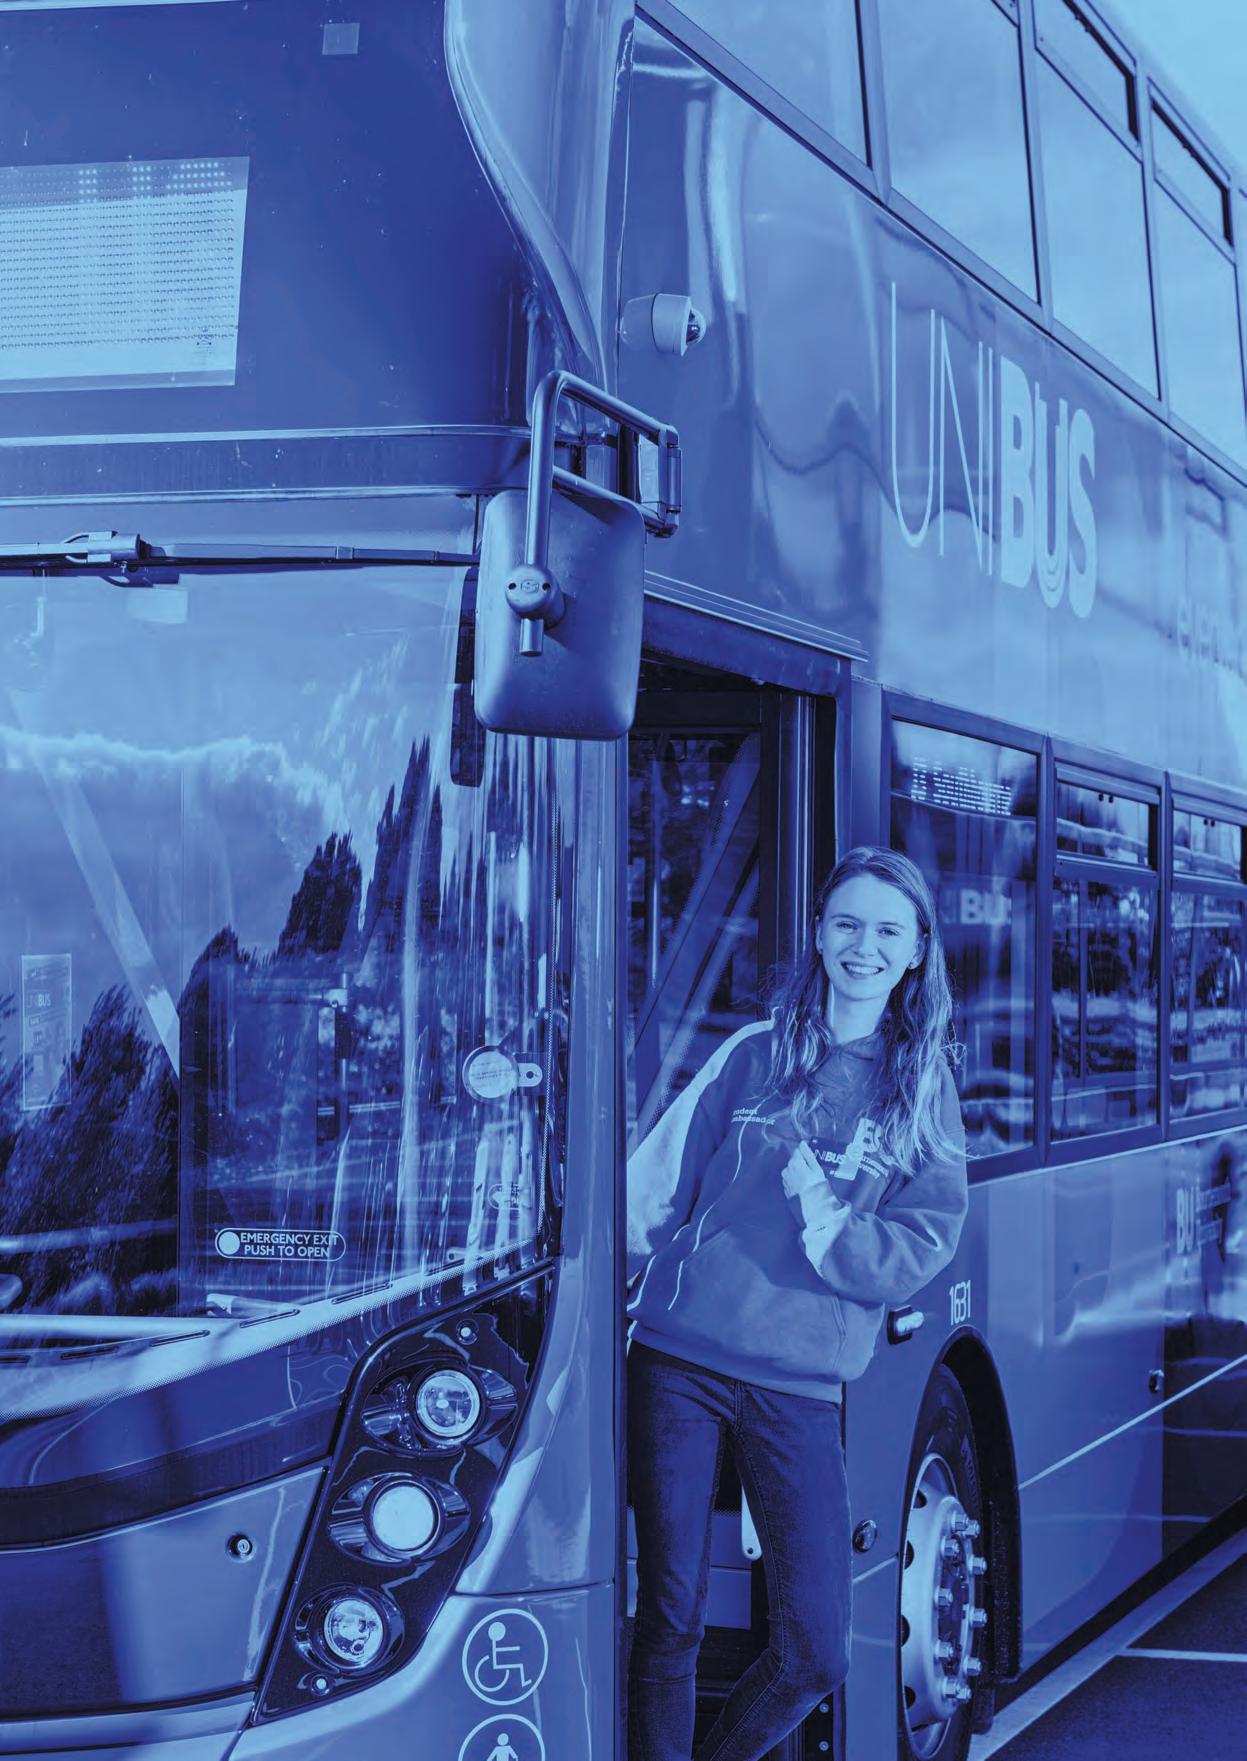
The UNIBUS service was on target to provide a record number of passenger journeys to our campus sites in 2019/20, with an additional 100,000 trips provided between August 2019 and February 2020, compared to the same period in 2018/19.
UNIBUS cumulative patronage by month: 2019/20 vs 2018/19 (August to March)
1000000 900000 800000 700000 600000 500000 400000 300000 200000 100000 0
August September October November December January
2019/20 2018/19
February t/Co2e 450
400
350
300
250
200
150
100
50
0
Total accumulative UNIBUS tCo2e: 2019/20 vs 2018/19 monthly
OctSepAug Nov Dec
JulJunMayAprMarFebJan
Total 2019/20 Total 2018/19
The impact of Covid-19 meant that the UNIBUS service was suspended from the end of March 2020 for the remainder of the academic year. This resulted in a 14% reduction in passenger journeys for the year when compared to the previous year. Passenger satisfaction remained well above the 90% threshold standard for the period August 2019 to March 2020, when the evaluations were cancelled, reflecting the high quality service provided to passengers. For the period August 2019 to March 2020, the fuel used by the UNIBUS service increased by 4.5% as a result of increased bus services. The suspension of the UNIBUS service resulted in a 20% reduction in fuel use in 2019/20 compared to the previous year, producing a GHG saving of 86 tonnes CO2e.
Better by bike
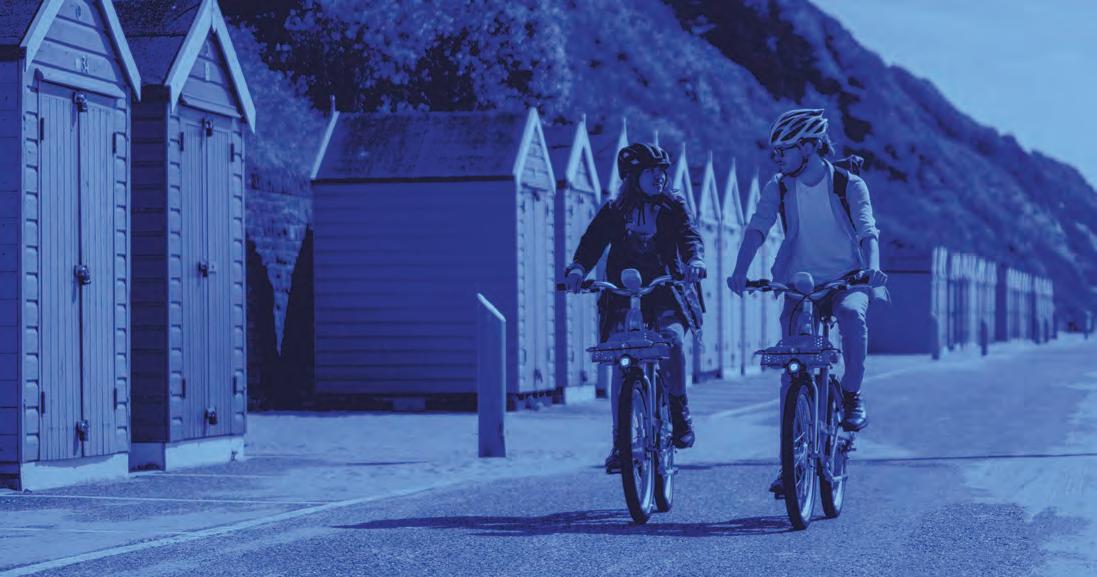
In February 2020, the staff Cycle To Work scheme limit, for the cost of bikes available, was raised to £3,000 to further promote the use of bikes and e-bikes as a sustainable travel mode. Between May and June 2020, £30,000 of bikes were ordered using the scheme; reflecting the increase in threshold, increased communications to promote cycling and national trends of high interest in cycling during lockdown.
We always offer a comprehensive range of support for staff and students wanting to travel more sustainably and after March 2020, we focused on promoting and supporting cycling: • A series of articles were published on the benefits of cycling as well as a step-by-step guide for staff and students wanting to start cycling for the first time. • The content of the BU Cycling webpages was updated, including an updated active travel map, highlighing the safest and quietest cycle routes to get to campus. • In June 2020, staff took part in the Love To Ride
Challenge for Bike Month. Our goal was to reach a total of 500 rides collectively, a total we surpassed by cycling 650 rides and a total of 7,350 miles! • A ‘Bring Your Bike’ campaign was launched to encourage new and returning students to bring their bikes with them to Bournemouth when returning in the autumn. • Beryl Bikes (local cycle hire company) offered 1,000 x 200-minute free ride bundles to BU students and staff.
In the first three months of the promotion, over 900 students and staff have benefited from the scheme, resulting in 10,000 kms of cycling to support the BU population to travel actively, sustainably and safely aroudn the local area. • A number of national standard cycle safety training courses were organised in September 2020 aimed at students and staff who were either keen to start cycling, or hadn’t ridden in a while. Although the numbers of participants was less than hoped, those that did the course found it very beneficial. • A full programme of monthly Bike Doctor sessions was delivered to repair bikes and additional Dr Bike safety check sessions were provided during the student arrivals period in September 2020 to ensure student bikes were road safe. • New cycle pumps were purchased and installed in the secure compounds on campus.
It was excellent and I learned a lot , especially how to navigate busy roads and junctions. I definitely feel more confident now cycling around and I am jumping on my bike a lot more.
Amanda, BU staff member on taking part in our free cycle safety course

Staff travel survey
In August 2020, staff were asked questions to establish pre-Covid travel patterns to benchmark the progress of the BU Travel Plan and to find out staff travel plans for the forthcoming term. 627 (36%) staff responded.
Pre-Covid travel patterns
The Pre-Covid travel data provides evidence of a significant increase in the proportion of staff choosing to travel to both Lansdowne and Talbot Campus sites by car alone, when compared to the 2018 staff travel survey data. There is evidence to suggest that the frequent wet weather conditions experienced in the autumn and winter of 2019/20 may have been a contributing factor, which resulted in a mode switch from active travel (walking and cycling) to driving alone. The predicted warmer, wetter winter weather and more extreme weather events due to climate change may pose a risk to active travel in the future.
Staff travel patterns for Semester 1 (September 2020 – February 2021)
The survey results provide evidence of a significant decrease in planned staff travel to campus during 2020’s semester 1 when compared to Pre-Covid staff travel patterns. Prior to lockdown, 96% of staff declared they travelled to work on campus 3 days per week or more. During the new semester, only 18% of staff planned to do so. Nearly a quarter of all staff don’t anticipate travelling to campus at all in Semester 1. Of those staff planning to travel to work on campus during Semester 1, 63% plan to drive by car alone as their preferred travel mode. This mode share proportion is greater than the Pre-Covid period due to some staff shifting their travel mode away from public transport use to the car. It is estimated this reported change in commuting patterns would reduce GHG emissions by 22 tCO2e each week during Semester 1, compared to pre-COVID emissions It would also help reduce air pollution and congestion in the area. The Wallisdown Road, which is the main connection route between Poole and Bournemouth and which connects the Talbot and Lansdowne campuses, is a known pollution hot spot due to congestion and poor air quality.


Business travel
Unsurprisingly, business travel in 2019/20 declined steeply (by 77%) compared to 2018/19. Staff took 2,333 business journeys, of which only four occurred after 1 January 2020. However, it should be noted the amount of travel was lower than previous years before the travel bans were introduced. Before 28 February 2020, only 2,329 journeys were taken, compared to 4,001 in the same period the previous year.
As a result GHG emissions from business travel reduced by 73%. We expect these low levels of travel to continue in 2020/21 due to the continuing travel restrictions. BU will review its Business Travel Policy to ensure the gains made by using the proven technology to reduce the need to travel, with the cost and GHG emission savings, are embedded in the operation of the business.
Fleet travel
In 2019/20 67% of the BU vehicle fleet comprised of Low Emission Vehicles (Electric or Hybrid). Total emissions (tCO2e) from BU fleet vehicles reduced by 2.5% in 2019/20 compared to the previous year.
Business Travel: Number of journeys
9000
8000
7000
6000
5000
4000
3000
2000
1000
0
2017-18 2018-19 2019-20 1800000
1600000
1400000
1200000
KgCo21000000
800000
600000
400000
200000
0
Business Travel: Number of journeys and GHG emissions


