13 minute read
PLANNING PERFORMANCE
Decisions down 11-25% on a year earlier while applications recover
Latest planning performance by English districts and London boroughs: Planning Applications in England: July and September 2020
OVERVIEW Between July and September 2020, district level planning authorities in England: • received 106,200 applications for planning permission, unchanged from the corresponding quarter of 2019; • granted 79,300 decisions, down 13 per cent from the same quarter in 2019; this is equivalent to 88 per cent of decisions, unchanged from the same quarter of 2019; • decided 88 per cent of major applications within 13 weeks or the agreed time, unchanged from the same quarter in 2019; • granted 10,000 residential applications, down 13 per cent on a year earlier: 1,300 for major developments and 8,600 for minors; • granted 1,700 applications for commercial developments, down 25 per cent on a year earlier. In the year ending September 2020, district level planning authorities: • granted 311,800 decisions, down 12 per cent on the year ending September 2019; and • granted 40,400 decisions on residential developments, of which 5,200 were for major developments and 35,300 were for minors, down by 14 and 11 per cent respectively on the year end- ing September 2019. This is equivalent to a decrease of 11 per cent in the overall number of residential decisions granted.
Planning applications
During July to September 2020, authorities undertaking district level planning in England received 106,200 applications for planning permission, unchanged from the corresponding quarter in 2019. In the year ending September 2020, authorities received 398,600 planning applications, down nine per cent on the year ending September 2019.
Planning decisions
Authorities reported 90,300 decisions on planning applications in July to September 2020, a decrease of 12 per cent on the 103,100 decisions in the same quarter of the previous year. In the year ending September 2020, authorities decided 356,800 planning applications, down 11 per cent on the number in the year ending September 2019.
Applications granted
During July to September 2020, authorities granted 79,300 decisions, down 13 per cent on the same quarter in 2019. Authorities granted 88 per cent of all decisions, unchanged from the September quarter of 2019 (Live Tables P120/P133). Overall, 82 per cent of major and minor decisions were granted, down one percentage point from the quarter ending September 2019 (PS2 development types dashboard).
Over the 12 months to September 2020, 311,800 decisions were granted, down 12 per cent on the figure for the year to September 2019.
Historical context
Figure 1 shows that, since about 2009-10, the numbers of applications received, decisions made and applications granted have each followed a similar pattern. As well as the usual within-year pattern of peaks in the Summer (July to September quarter for applications and July to September for decisions) and troughs in the Autumn (October to December quarter for applications and January to March quarter for decisions), there was a clear downward trend during the 2008 economic downturn, followed by a period of stability with reductions in more recent quarters.
Historical figures for all district level decisions dating back to 2008-09 are set out in Live Table P120, with separate breakdowns for residential and commercial decisions being shown in Live Tables P120A and P120B respectively. These latter two tables are discussed below in the sections on residential and commercial decisions.

Speed of decisions
or within the agreed time3, unchanged from the same quarter a year earlier. • In the same quarter, 84 per cent of minor applications were decided within eight weeks or the agreed time, down one percentage point from a year earlier. • Also in the same quarter, 89 per cent of other applications were decided within eight weeks or the agreed time, unchanged from a year earlier.
Figure 3 summarises the distribution of the percentage of decisions made in time across authorities for major, minor and other developments using box and whisker plots. The ends of the box are the upper and lower quartiles, meaning that 50 per cent of local authorities fall within this range. Figure 3 shows that the variation in percentage of decisions made in time this quarter is widest between authorities for major developments (0 to 100 per cent), followed by minor developments (44 to 100 per cent) and other developments (47 to 100 per cent).
Use of performance agreements
Table 4 summarises the recent use of performance agreements4. It shows that they are more commonly used for major developments than minor or Planning decisions by development type, speed of decision and local planning authority. All tables and figures can be found here: https://tinyurl.com/yxtdt78e Source: MHCLG/ONS

other developments, with 74 per cent of major decisions made during July to September 2020 involving a planning agreement, compared with 49 per cent of minor decisions. Figure 4 shows, from 2010, numbers of decisions on major developments made involving a performance agreement, both in absolute terms and as a percentage of all decisions on major developments. The underlying historical figures are available in the PS2 development types dashboard. Notwithstanding definitional changes, there has been a marked increase in the use of agreements since early 2013. In reality, this longer upward trend has been driven by both the additional scope for recording them and their additional use.

Live Tables P151a and P153 present data on the performance of district level local planning authorities against the latest published criterion in Improving planning performance: criteria for designation on the speed of decision-making for informing decisions on the designation of poorly >>>
>>> performing local planning authorities under section 62B of the Town and Country Planning Act 1990. In particular, Live Table P151a gives detailed figures for the time taken for major decisions to be made over the eight most recent quarters and Live
Table P153 presents data for the time taken by district level local planning authorities for decisions on ‘non-major developments’ (previously ‘minor and other developments’, and defined as minor developments, changes of use and householder developments) to be made over the eight most recent quarters.
Similarly, Live Table P152a, presents data on the performance of district level local planning authorities against the latest published criterion in
Improving planning performance: criteria for designation on the quality of decision-making for assessing performance under section 62B of the
Town and Country Planning Act 1990. In particular, it gives detailed figures for the percentage of major decisions subject to a successful planning appeal, by matching eight quarters of the department’s data on decisions and all available quarters of Planning Inspectorate data on appeals. This table is usually published a few weeks after the statistical release and most of the other live tables, to take account of the latest appeals data.
Live Table P154 presents data for the percentage of decisions on minor and other developments (as defined for Table P153) subject to a successful planning appeal, by matching eight quarters of the department’s data on decisions and all available quarters of Planning Inspectorate data on appeals. Like Table P152a, this table is usually published a few weeks after the statistical release and most of the other live tables, to take account of the latest appeals data.
Residential decisions
In July to September 2020, 13,400 decisions were made on applications for residential 5 developments, of which 10,000 (74 per cent) were granted. The number of residential decisions made decreased by 13 per cent from the September quarter of 2019, with the number granted also dropping 13 per cent. The number of major residential decisions granted decreased by 6 per cent to 1,300, and the number of minor residential decisions granted decreased by 14 per cent, to 8,600 (Live Table P120A, and the PS2 development types dashboard). In the year ending September 2020, authorities granted 5,200 major and 35,300 minor residential applications, down by 14 and 11 per cent respectively on the year ending September 2019. This is equivalent to a decrease of 11 per cent in the overall number of residential decisions granted.
Residential units
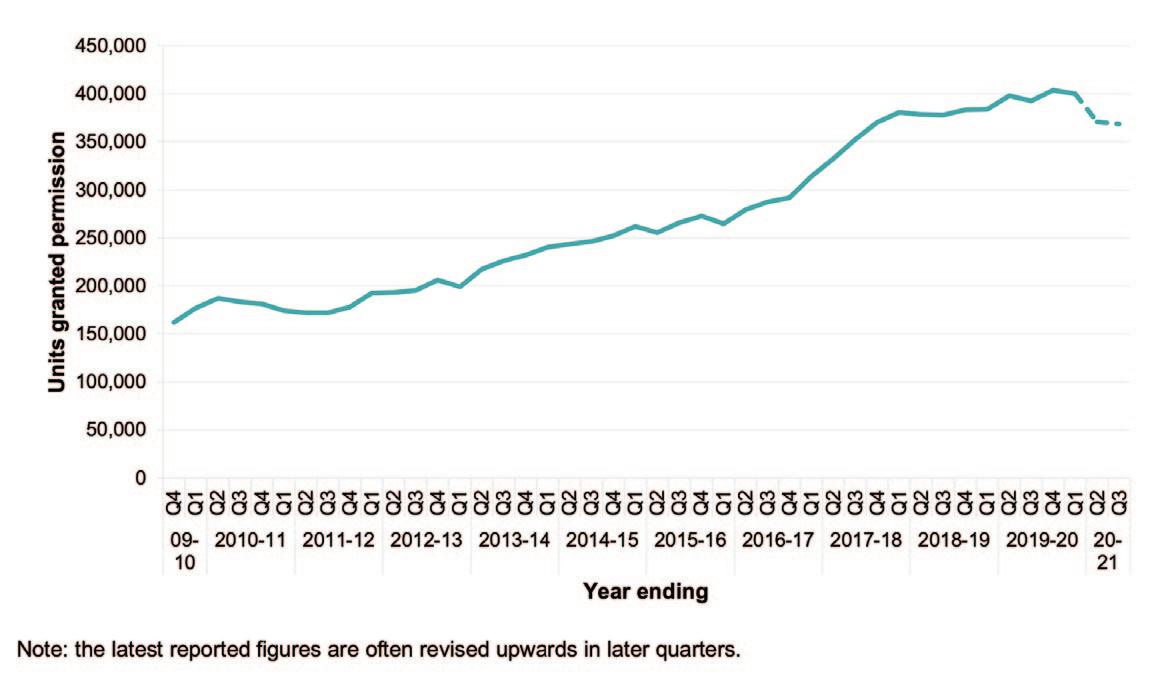
The figures collected by the department are the numbers of decisions on planning applications submitted to local planning authorities, rather than the number of units included in each application, such as the number of homes in the case of housing developments. The department supplements this information by obtaining statistics on housing permissions from a contractor, Glenigan.6 The latest provisional figures show that permission for 368,600 homes was given in the year to 30 September 2020, down six per cent from the 392,200 homes granted permission in the year to 30 September 2019.
On an ongoing basis, figures are revised to ensure that any duplicates are removed, and also to include any projects that local planning authorities may not have processed: they are therefore subject to change, and the latest quarter’s provisional figures tend to be revised upwards. These figures are provided here to give contextual information to users and have not been designated as National Statistics.
Commercial decisions
In July to September 2020, 1,800 decisions were made on applications for commercial developments, of which 1,700 (91 per cent) were granted. The total number of commercial decisions granted decreased by 25 per cent on the same quarter of 2019. In the year ending September 2020, 7,400 applications for commercial developments were granted, down 15 per cent on the year ending September 2019 (Live Table P120B).
Trends in numbers of residential and commercial decisions
The percentages of major and minor residential decisions granted increased between 2008/09 (from about 65 per cent for each type) and 2010/11 (to about 80 per cent for majors and about 75 per cent for minors) and have stabilised since then. The percentages of major and minor commercial decisions granted increased steadily, from 89 and 85 per cent respectively in 2007/08, to 94 and 91 per cent respectively in 2014/15, and have both been largely stable since then, but have increased recently.
Householder developments
Householder developments are those developments to a residence which require planning permission such as extensions, loft conversions and conservatories (more details are in the glossary accessible from the Definitions section). The number of decisions made on householder developments was 49,800 in the quarter ending September 2020, accounting for 55 per cent of all decisions, down 6 per cent from the 52,800 decisions made in the quarter ending September 2019. Authorities granted 91 per cent of these applications and decided 90 per cent within eight weeks or the agreed time.
Permission in Principle/Technical Details consent decisions
Since 16 April 2017, local planning authorities have had the ability to grant permission in principle (PiP) to sites which have been entered on their brownfield land registers. Where sites have a grant of permission in principle, applicants have been able to submit an application for Technical Details Consent (TDC) for development on these sites. In addition, since 1 June 2018, it has also been possible to make an application for PiP for minor housing-led development as a separate application, independently of the brownfield register. Where a site has been granted PiP following an application, it is possible to apply for a TDC and a determination period of five weeks applies as it is minor development. Extensions of time may be agreed. TDC applications have a 10-week determination period for major development and a five-week determination period for minor development.
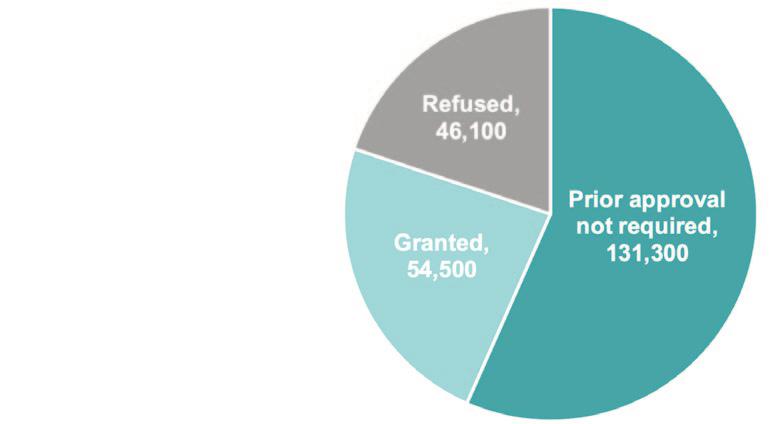
FIG 9: Applications for prior approvals for permitted development rights reported by district planning authorities.
England from April 2014 to September 2020

Figure 6: Number of housing units granted planning permission England, rolling annual totals to September 2020

Extensions of time may be agreed and where it is an Environmental Impact Assessment (EIA) development, the 16-week determination period applies.
Permitted development rights
Planning permission for some types of development has been granted nationally through legislation, and the resulting rights are known as ‘permitted development rights’. In some cases, if the legislation is complied with, developments can go ahead without the requirement to notify the local planning authority and hence no way of capturing data exists.
In other cases, the legislation requires an application to the local planning authority to determine whether prior approval is required (more details are in the Definitions section). A local planning authority can withdraw specific permitted development rights across a defined geographical area, bringing these types of development within the control of the main planning process. The results for the latest quarter for which they have been collected (July to September 2020) are included in Live Tables PDR1 (local authority level figures) and PDR2 (England totals). Of the 8,600 applications reported in the July to September quarter of 2020, prior approval was not required for 4,700 and permission was granted for 2,200 and refused for 1,800. This resulted in an overall acceptance rate10 of 79 per cent. Larger householder extensions accounted for 65 per cent of applications (5,600), with six per cent relating to agricultural to residential changes and five per cent to office to residential changes. ‘All other’ permitted development rights, accounted for 19 per cent of applications, up from 12 per cent a year earlier. Taking i) granted applications and ii) those for which prior approval was not required together, 6,900 applications were approved without having to go through the full planning process, unchanged from a year earlier. Within no change in the reported total number of PDR applications between July to September 2019 and July to September 2020: • larger householder extensions decreased by 11 per cent; • office to residential changes decreased by 2 per cent; • agricultural to residential changes decreased by 12 per cent: and • ‘all other’ permitted development rights increased by 63 per cent. Figures for the total number of permitted development right applications made for changes to residential use for quarters from July to September 2014 are given in the quarterly worksheets in Live Table PDR1. These show that a total of 1,300 applications for changes to residential use were reported in July to September 2020, of which 900 (68 per cent) were given the go-ahead without having to go through the full planning process. Overall during the twenty-six quarters ending September 2020, district planning authorities reported 232,000 applications for prior approvals for permitted developments. For 131,300 (57 per cent) of them prior approval was not required, 54,500 (23 per cent) were granted and 46,100 (20 per cent) were refused (Figure 9). Figure 9: Applications for prior approvals for permitted development rights reported by district planning authorities England, twenty-six quarters from April 2014 to September 2020. To put these recent figures into context, Live Table P128 and Figure 10 show how the number of ‘determination applications’ received remained broadly stable at around 5,000 to 8,000 per year from 2004/05 to 2012/13, but approximately doubled to 15,700 in 2013/14, following the creation of new permitted development right categories in May 2013. Since April 2014, there have been 36,500 PDR applications in 2014-15, 40,200 in 2015-16, 39,400 in 2016-17, 36,800 in 2017-18, 34,900 in 2018-19 and 29,100 in 2019-20. The quarterly pattern since April 2014 reflects a combination of both: i) the introduction of new permitted development right categories on several occasions; and ii) the seasonal peaks and troughs that have previously also been observed for planning applications, as shown earlier in this release, in Figure 1 (Live Table PDR 2 and Figure 10). The initially large increase since 2014 in reported numbers of PDR applications for a change of use (e.g. office to residential), followed by a more recent decrease, is consistent with the annual numbers of dwellings added to the net housing supply as a result of a change of use. These have shown increases of 65 per cent in 2014-15, 48 per cent in 2015-16 and 22 per cent in 2016-17, and decreases of 20 per cent in 2017-18, two per cent in 2018-19 and eight per cent in 2019-20. n


