Figure
2: Reasons for Moving 2021-2022
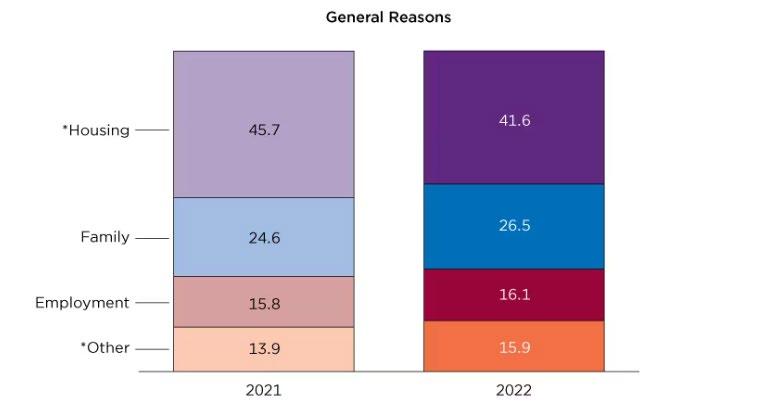
Source: United States Census Bureau
Figure 3 provides a visual to regional population growth in 2023. The South region had the most population growth at 39%. The South experienced over 10% more growth than the next highest growth region, the West. The trend south revolved around warmer weather, low cost of living, low taxes, and a robust economy. In an article by Biermeier and Allen for Forbes, South Carolina and Texas have a strong and constantly growing job market that is drawing in young people specifically. While conservative politics and low taxes are the main draw for older individuals (Biermeier and Allen, 2023).
3: United States Population Growth by Region
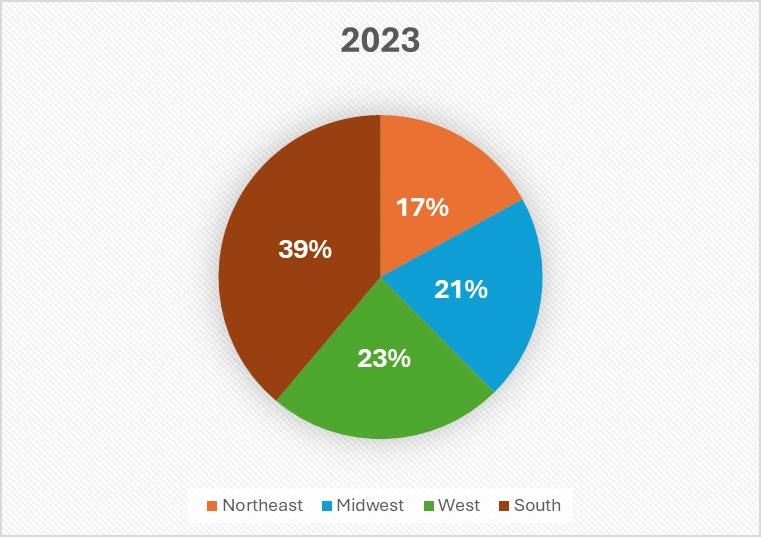
Source: United States Census Bureau (data)
Figure
17
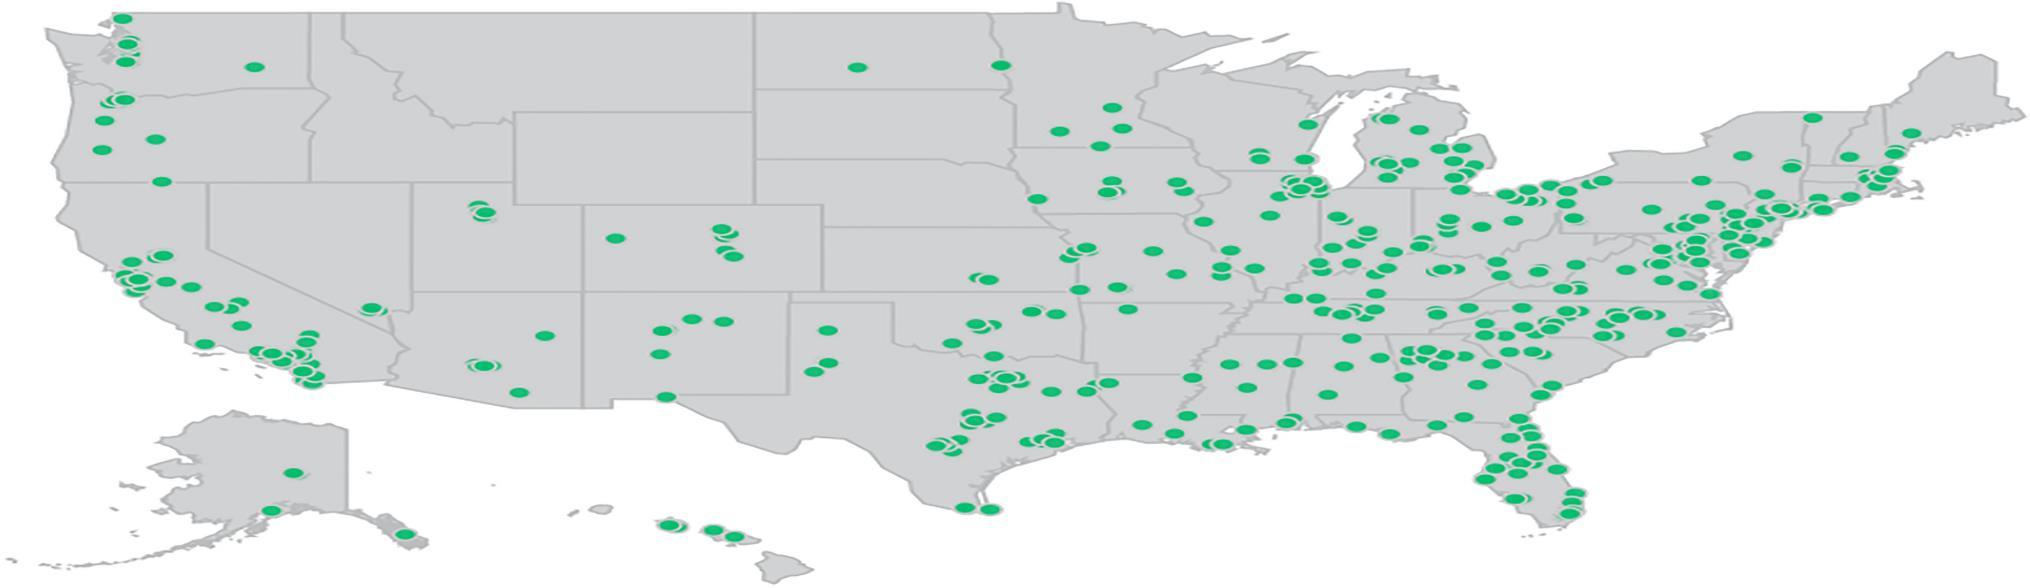
Figure 4 shows domestic migration in 2022 stratified by race. Of those that moved to a different state in 2022, those that identified as Native Hawaiian or Pacific Islander made up the largest percentage. This is followed by those that identify as Asian at 2.9%.
Stratifying migration data is important because it can help identify which people are moving and this can help determine why people are moving. It is also important to include that the percentages are based on those that self-reported their race.
Figure 4: Domestic Migration (stratified by Race) 2022
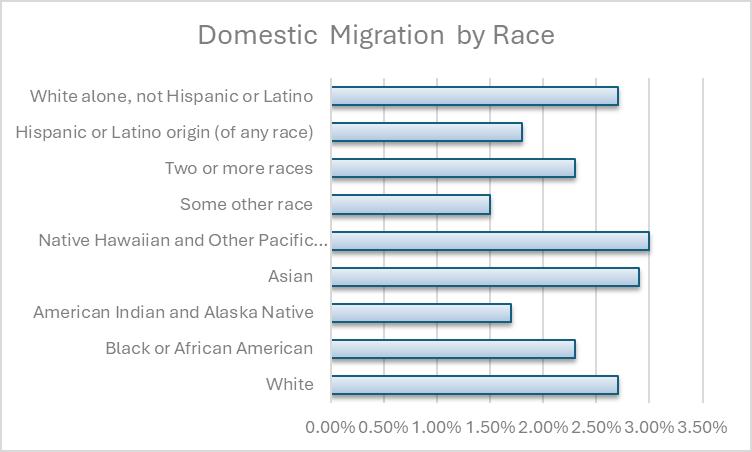
Source: United States Census Bureau
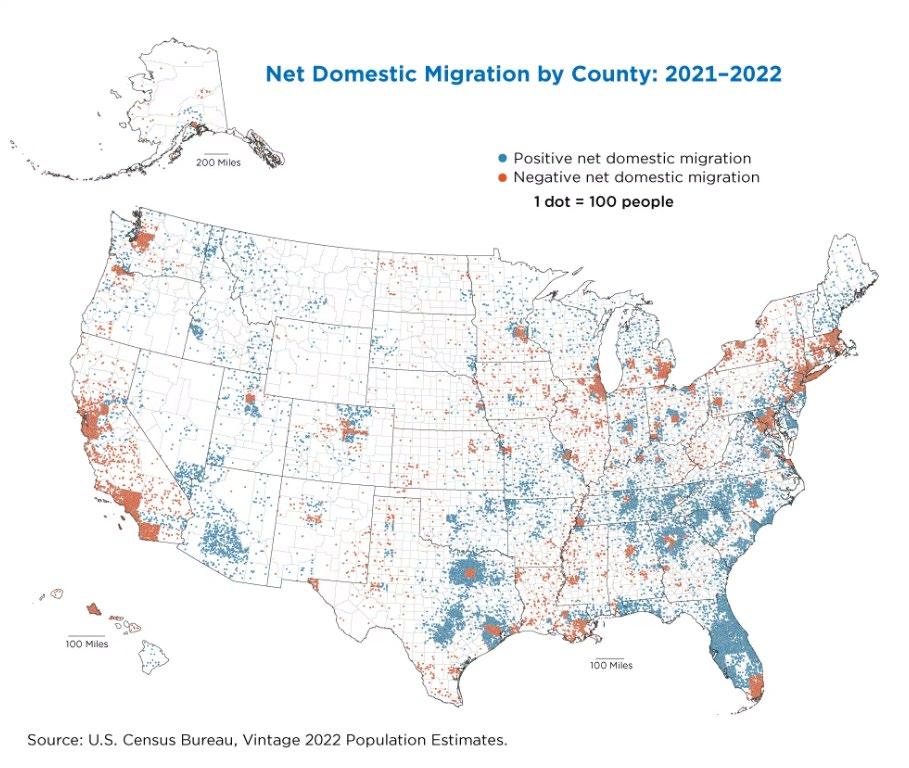
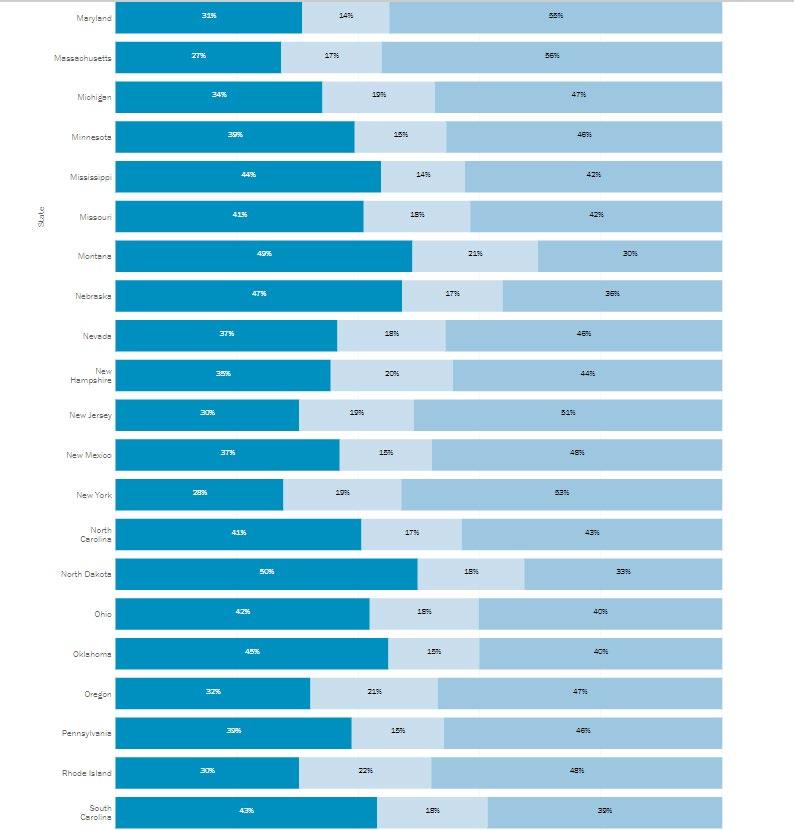
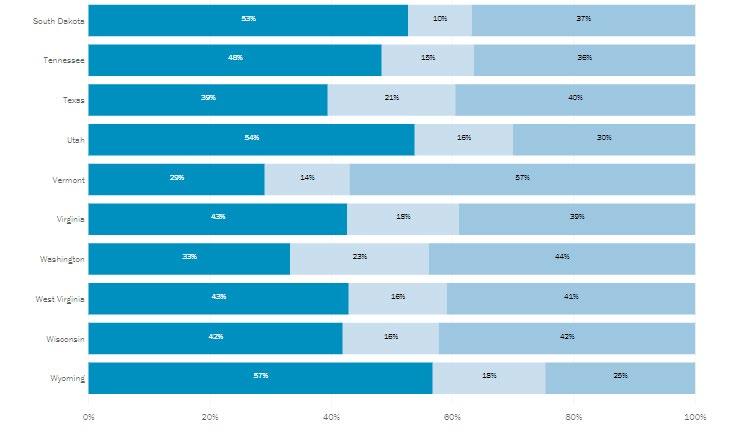
Figure 5 shows party affliation by state. This chart shows that the states that are experiecing rapid population growth are predominately home to Republican or Republican leaning voters. The states that are experiecing the most out migration, California, New York, and Illinois are predominantly Democrats or lean Democratic. While New York and California are experiencing an exodus over skyrocketing cost of living and rising taxes, Illinois is experiencing significant outmigraiton due to employment opportunities and infrastructure (Biermeier and Allen, 2023). While all factors may not be directly related to the government and their policy decision, some factors are and the trend remains the same.
18
5: Party Affliation by State
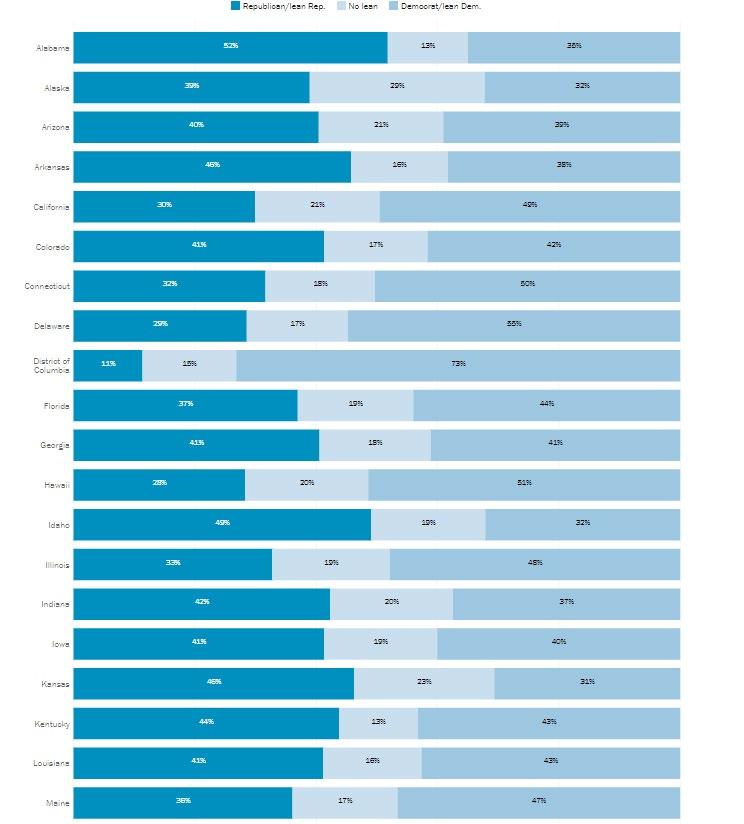
Source: Pew Research Center
(See Appendix C for the rest of chart)
Figure
19
3.0 LITERATURE REVIEW
Interstate migration in the United States has been studied from a variety of angles. The common variable investigated is expected future income as done by Cebula (2005) and Kennan and Walker (2011). Both found that expected future income had a strong effect on interstate migration decisions. Kennan and Walker’s (2011) study uniquely looked at geographic differences in mean wages which showed a positive relationship between decision making and expected future income. Cebula (2005) investigated both economic and household factors and the empirical model used is adapted from this study.
Hsieh and Wang (2022) looked into the effect of income and property tax policy in the 1980s and how that influenced domestic migration. Property tax was not found to be a factor affecting an individual’ s decision to move but income tax was a statistically significant factor. This study adds individual income tax and property tax rates from this work and adapts it to this one.
Conway and Rork (2022) examined moving van data to determine interstate migration patterns in the U.S. Examining data over a decade (2009-2019) shows a strong relationship between end of year policy changes and proposals and migration. Ihlanfedlt and Rodgers (2022) investigated property tax in the state of Florida and found that property tax had a negative relationship with moving. Similarly, Cassidy et al. (2023) looked into income tax policies and migration across states. It was found that the introduction of income tax did not change overall revenue levels in the long run due to mass outmigration to states without or very low-income tax (Cassidy et al., 2023). The migration data shows that policy changes affected the net in-migration to nearby states that had little to no income tax.
20
While these are predominantly economic factors there are several non-economic factors that influence migration across states. Cooke et al. (2022) and Mullholland and Young (2016) contended with occupational licensing as a key decision factor.
Occupational licensing as a something that bars individuals from moving was found to have no effect and thus policy changes that lead to standardization have little effect in the long run either (Cooke et al., 2022). Mullholland and Young (2016) looked at both occupational licensing as something that prevents individuals from moving but also as a factor influencing the move. In this study they also added income qualifiers to each job and subsequent license. They found that income level that the licensed job provided influenced migration to particular states more so than the licensing itself.
Gimpel and Schuknecht (2001) investigated interstate migration as a result of electoral patterns and how political leanings may influence interstate outmigration. While their findings confirmed their hypothesis there were some additional findings that were very interesting. They found that cross-state migration was more common with Democratic voters and out-migration was more common in states where the gubernational election did not conform to one individual political beliefs.
4.0 DATA AND EMPIRICAL METHODOLOGY
4.1 Data
The study uses annual data from 2012 and 2022 to perform a cross-sectional analysis. Data was obtained from various sources including the United States Census Bureau, the FBI, NOAA, FRED, and the EPA. Summary statistics for 2012 are provided in Table 1. Summary statistics for 2022 are provided in Table 2.
Table 1 Summary Statistics (2012)
21
Summary
Table 2 Summary Statistics (2022)
4.2 Empirical Model
Following the model created by Cebula (2005), the model for this paper examines average January Temperatures, expected future earnings, hazardous waste sites, and
Statistics ExpEarn PropTax IncTax Vcrime AvgJanTemp HazWaste GovAffil InMigration Mean 43499.5 0.012064 5.5621 346.43 34.542 24.08 0.4 140330.3 Standard Error 955.0372 0.000743 0.399912 17.37102 1.774180098 3.511246072 0.069985 16922.53497 Median 42591 0.0112 5.995 319.05 33.95 13 0 106786 Mode #N/A 0.0092 0 #N/A 25.1 13 0 #N/A Standard Deviation 6753.133 0.005256 2.827807 122.8317 12.54534778 24.82825908 0.494872 119660.3923 Sample Variance 45604804 2.76E-05 7.996494 15087.62 157.385751 616.442449 0.244898 14318609493 Kurtosis 0.285986 -0.63741 0.125334 -0.6963 3.013789903 3.105301255 -1.90049 3.74029316 Skewness 0.782127 0.501922 -0.61764 0.3731780.695264471 1.844590658 0.420985 1.856633829 Range 30114 0.0205 11 484.9 72.8 108 1 512717 Minimum 33441 0.0027 0 122.7 -12.8 0 0 24431 Maximum 63555 0.0232 11 607.6 60 108 1 537148 Sum 2174975 0.6032 278.105 17321.5 1727.1 1204 20 7016515 Count 50 50 50 50 50 50 50 50 Summary Statistics ExpEarn PropTax IncTax Vcrime AvgJanTemp HazWaste GovAfill InMigration Mean 63219.92 0.8418 5.3116 359.816 21.902 26.16 0.46 163328.94 Standard Error 1222.435 0.053624 0.448188 21.21697 1.769638473 3.649921442 0.0712 21039.1288 Median 61932 0.75 5.2 332.2 21.1 16.5 0 123920 Mode #N/A 0.53 0 #N/A 18.5 12 0 #N/A Standard Deviation 8643.921 0.379181 3.169167 150.0267 12.51323365 25.80884202 0.503457 148769.1065 Sample Variance 74717375 0.143778 10.04362 22508 156.5810163 666.0963265 0.253469 22132247040 Kurtosis -0.14494 -0.1757 0.14788 0.845445 1.27234934 3.086711464 -2.05657 5.77519883 Skewness 0.507124 0.745646 0.062815 0.880857 0.672486178 1.8098112 0.165522 2.188416945 Range 38191 1.49 13.3 677.2 64.9 115 1 712818 Minimum 46370 0.3 0 103.3 -2.4 0 0 26151 Maximum 84561 1.79 13.3 780.5 62.5 115 1 738969 Sum 3160996 42.09 265.58 17990.8 1095.1 1308 23 8166447 Count 50 50 50 50 50 50 50 50 22
violent crime per 100,000 people. To differentiate this study, property tax and income tax were added from Hsieh and Wang (2022) as well as governor’s political affiliation.
The model could be written as follow:

β6HazWaste+β7GovAffil + ε (1) is interstate migration categorized as those that lived in a different state as of one year ago. is used as an endogenous variable. Interstate migration is defined by the United States Census Bureau as an individual or family who had a different state of residence 1 year ago (US Census Bureau). Data used for the dependent variable comes from the Census Bureau and for this study in-migration data was used as it was more readily available than postal code requests or DMV requests.
The independent variables consist of seven variables from various sources.
Appendix A and B provide data sources, acronyms, descriptions, expected signs, and justifications for each variable. Firstly, ExpEarn represents the earnings that someone would expect to earn in the state they are moving to. Next, PropTax is the property tax in each state. IncTax is the income tax in each state. Third, VCrime represents violent crime per 100,000 people in a given state. Fourth is AvgJanTemp. This represents the average temperature in January for each state. All of the temperatures are recorded in the largest cities in each state and may not be totally representative of weather in all parts of the state. Particularly those with diverse climates. Fifth, HazWaste represents the number of hazardous waste sites located in a state. Finally, GovAffil will be a dummy variable representing the party affiliation of each state’s governors.
23
5.0 EMPIRICAL RESULTS
The empirical estimations can be found below. Table 3 is the results of the ordinary least sqares regression for 2012. This indicates a positive relationship between interstate migration and income tax rates, the average temperature in January, and the number of hazardous waste sites within a state. Table 4 is the results of the ordinary least squares regression for 2022. These results also revealed a positive relationship between interstate migration and income tax rates, the average temperature in January, and the number of hazardous waste sites. The results of the correlation matrices for both years can be found in Appendix C for governor affiliation in 2022 and expected future earnings in both 2012 and 2022. These results indicate a positive though not statistically significant relationship between these variables and interstate migration.
Table 3: Results for OLS 2012
ExpEarn 0.8309
-2.0920
PropTax 0.8524
-2910579.6122
IncTax 0.0059**
-4966.9929
Vcrime 0.8159 -106.1768
AvgJanTemp 0.0003** -1102.7488
HazWaste 4.51E-06** -543.5022
GovAffil 0.2890 -26431.1838
R-squared 0.625
F-Statistics 2.74E-07
Observations 50
2012 Interstate Migration
Intercept 0.9334 -118308.2850
24
Table 4: Results for
OLS
2022 2022 Interstate Migration
-9.06E+04 (1.52E+05) ExpEarn 0.252 (2.033)
PropTax -0.864 (5.46E+04)
IncTax 0.004** (5151.843)
Vcrime 0.91 (106.05)
AvgJanTemp 0.00037** (1431.68)
HazWaste 5.38E-05** (732.713)
GovAffil 0.585 (3.40E+04)
Observations 50
Note: ** denotes significance at the 5%. Standard errors in parentheses.
The IncTax, AvgJanTemp, and HazWaste were statistically significant at the 5% level. Average January temperatures and hazardous waste sites was in line with the study conducted by Cebula (2005). Income tax was not statistically significant in the study conducted by Hsieh and Wang (2022). But the positive effect is consistent with their study though. Based on this study and the work conducted before, it can be concluded that income tax rates in destination is states is a factor in individual migration decisions. Cebula (2005) did find that expected future earnings were significant but this study did not. Although there was a positive correlation between expected future earnings (ExpEarn) and interstate migration in both 2012 and 2022. There was also a much stronger correlation between governor’s political affiliation and interstate migration in
Intercept
F-Statistics
R-squared 0.615
9.567
25
2022 than 2012 although it was not statistically significant. This is in line with a study conducted by Gimpel and Schuknecht (2001) in which they found that policy and individual affiliation had an affect on migration but governor, senate, and representative affiliation did not. But the correlation being stronger in 2022 is in line with current partisan political trends in the United States.
6.0 DISCUSSION AND CONCLUSIONS
6.1
Limitations and Further Research
There are some limitations to this study predominantly in the areas of data collection and data sources. State-level data was used across all variables in order to unified results but state-level data may not be the most effective at identifying the true relationships between independent and dependent variables. Firstly, expected future earnings (ExpEarn) data was taken from the US Census Bureau’s wage data base. The Census Bureau uses mean wages as the basis for expected earnings. This may not be reflectively of the state as a whole as high income areas could skew the mean wages higher than say the median wages in the state. Take California for example, with high income areas like Silicoln Valley and Los Angeles raising the mean income earned but this is not reflective of the largely rural and agricultural economy in California which tend to be lower wage earners and does not reflect the levels of high income inequality within the state (Thorman and Payares-Montoya, 2024). County-level data, median wages, or median income may be more effective at outlining the true expected earnings of the state. Also stratifying for types of jobs may also be more effective in identifying relationships between interstate migration and expected future income. Secondly, governor affiliation was chosen as the data was readily available. While most governor’s can serve a maximum of two four-year terms. Some states like New York, have no term limits for their governors. This would mean that the tastes of individuals within a state may not be accurately represented. Also this creates a blanket and is not truly reflective of the political climate of a state as there are varying types and levels of each political party. Also in 2012, Rhode Island had a libertarian governor which was qualified as Republican for ease of use but this is not fully accurate. In further studies, it may be more effective to use the party with the highest percentage of
26
individual registered voters. This is more nuanced but it may be more accurate in reflecting the tastes of those in a state. Which in turn, may be more accurate in moving decisions. Another way this could be done would be by dividing the state by region and examining the regional voting patterns or voter registrations. This way voter patterns could be most accurately assessed.
Lastly, January temperatures were collected in one city in each state. The average temperature for the month is only reflective of that area. This means that for states that are geographically diverse, the temperature recorded may not be reflective of the state as a whole. Take New York, the temperature was recorded in Albany and at John F. Kennedy Airport over a period of 35+ years. But it is much warmer on average than Syracuse or Buffalo. This is the case for many states especially in the western United States, with colder mountain regions and low elevation desert basins. For the purposes of this research a general temperature was adequate but stratifying by region or county would be more accurate to determine the relationship between that and interstate migration.
6.2 Policy Implications
This data is important for both states with high in-migration and states with highoutmigration rates. States with increasing populations need to focus on housing, infrastructure planning, and energy sources. States that are facing high outmigration need to focus on tax policy, job opportunities, and scaling back extreme policies in favor of more centrist ones. Rapidly increasing populations put strain on the communities that are facing the largest amount of growth. Housing in the area may be limited and the limited supply raises costs significantly. States can take action to alleviate the housing burden by easing regulatory and zoning processes for developers of both single family homes and apartment complexes. This lowers the cost of the build, allowing more to be built while simultaneously lowering the cost (Minott and Selby, 2022). In the same vein, increasing populations need stronger infrastructure to handle the increased number of people living there. This does not just mean that current infrastructure needs to be improved but also that there needs to be some element of planning for anticipated capacity five to ten years from now as it is likely that the population, particularly in the South, will continue to grow. This includes street planning, expanding and preparing public schools, expanding
27
sewer and water, and other elements that are essential to the foundation of a local economy. Along with general infrastructure improvements and planning, there needs to be a push for increases to the energy production. More people mean more energy is needed. State and local governments need to prepare both traditional base load energy sources like coal, gas, and oil but also renewables. States that can be prepared with traditional sources of energy while also providing incentives for renewables like wind, hydropower, and solar. This will come from having a political environment that supports both.
States that are experiencing high levels of outmigration need to take steps that would encourage individuals to stay. Firstly, lowering taxes would encourage individuals to stay rather than moving to a more tax advantageous state. A trend that has increased as result of COVID-19. Lowering taxes has other benefits to the state outside of just making it more affordable for the people that live there. Lowering taxes raises after-tax rewards which encourages greater work effort, savings, and investment (Gale and Samwick, 2014). As well as lowering taxes to make it more affordable to live there, there needs to be policies in place that provide livable wage jobs particularly those in middle wage jobs. Middle wage jobs for non-college educated workers are shrinking, especially after the pandemic (Autor, 2022). In a survey conducted by the Census Bureau, this is one of the main reasons that people are moving (Kerns-D’Amore, 2023). A way to aid in this is to increase the state’s industrial base. Many corporations have moved out of certain states due to high taxes and regulatory challenges. States can attract companies by incentivizing them through tax and regulatory rollback. Industrial jobs can provide livable wages especially for middle income skilled workers. Finally, scaling back on controversial policies in favor of more mainstream, centrist policies may stop mass exodus from more left/left-leaning states. Take Oregon’s Measure 110, for example, it has caused many to move from the state particularly urban centers like Portland (Wilson, 2024). Measure 110 decriminalized possession in small amounts of virtually all drugs. The rationale behind this ballot measure was to encourage those struggling with addiction to seek recovery rather than punishing them (Wilson, 2024). But the citation and recommendation system is not working, especially in cities. Oregon does not have enough publicly funded rehabilitation facilities to handle the amount of people that need access to them and many
28
do not contact the hotline that would take the fine and citation away. The cycle continues. Since the measure passed overdoses increased 241%, 23% of which can be directly attributed to decriminalization, according to a study published in the Journal of Health Economics. Extreme policies have pushed many to move to more right/right-leaning states as seen in the trends section of this paper. Scaling back on these policies would encourage people to remain in the state as a result.
6.3 Conclusion
Interstate migration is increasing for the first time since the 70s. This change in trends is driven by the COVID-19 pandemic. This study found that income tax rates, January temperatures, and the number hazardous waste sites in a state were the significant contributors to the decision to move. Ones expected future earnings in the state they are moving to had positive effects but were not found to be statistically significant in either years. Governor affiliation had a positive effect in 2022 but was also not statistically significant. These results have significant policy implications for states experiences significance population changes in either direction. For rising populations, there needs to be focus on infrastructure and housing. For declining populations, there needs to be focus on affordability and mainstream policies. Changes to these policies may ease the burden of interstate migration in all states effected. This research can help give those within a state insights into the tastes, values, and preferences of the people that live there, want to live there, or want to leave. Knowing these things can aid in building policies and programs that can best serve the people in every state.
29
Appendix A: Variable Description and Data Source
Acronym Description
InMigration
ExpEarn
PropTax
IncTax
Vcrime
AvgJanTemp
HazWaste
Interstate migration in the United States, indicates individuals that had a home address in a different state one year prior.
Earnings an individual is expecting to earn in the state they are moving to, does not include tax, mean wages is basis in database.
Property tax rate in each state.
Income tax rate in each state.
Data source
US Census Bureau
US Census Bureau
Bankrate
Bankrate (2022) and FRED (2022)
Violent crime per 100,000 people per state. Federal Bureau of Investigation
Average temperature for the month of January
National Oceania and Atmospheric Association
Number of hazardous waste sites that exist within a state US Environmental Protection Agency
GovAffil The political affiliation of each state’s governor. Ballotpedia
Appendix B- Variables and Expected Signs
Acronym
ExpEarn
PropTax
IncTax
Vcrime
AvgJanTemp
HazWaste
Variable Description
Earnings one expects to earn in the state they are moving to
Property tax rate
Income tax rate
Violent crime per 100,000
Average temperatures for the month of January
Number of hazardous waste sites in a state
What it captures Expected sign
Effect of expected income on the decision to move +
Tax effects on decision to move -
Tax effects on the decision to move -
Effects of violent crime levels on decision to move -
Effects of temperature on the decision to move +/-
Health costs/benefits to moving
30
GovAffil Political affiliation of each state’s governor
Effects of politics in the decision to move +/-
Appendix C: Additional Items
Proportion of Registered Voters by State
-
31
Matrices
e
2012 ExpEarn PropTax IncTax Vcrime AvgJanTemp HazWaste GovAffil InMigration ExpEarn 1 PropTax 0.456588 1 IncTax -0.08025 -0.02361 1 Vcrime -0.05175 -0.11742 -0.41954 1 AvgJanTemp -0.41027 -0.41294 0.128893 0.148857 1 HazWaste 0.237026 0.422703 0.094585 0.079266 0.072860514 1 GovAffil 0.225117 -0.08301 0.361787 -0.078560.023470743 0.072086642 1 InMigration -0.00777 0.074232 -0.17008 0.222152 0.454198529 0.605471617 0.020568 1 2022 ExpEarn PropTax IncTax Vcrime AvgJanTemp HazWaste GovAffil InMigration ExpEarn 1 PropTax 0.445566 1 IncTax 0.079093 0.162296 1 Vcrime -0.23301 -0.34281 -0.20745 1 AvgJanTemp -0.27624 -0.44095 0.104739 0.148154 1 HazWaste 0.349992 0.432565 0.246739 -0.01278 0.135938792 1 GovAffil 0.358515 0.173035 0.403845 -0.0791 0.0192877 0.358605213 1 InMigration 0.1519 0.018553 -0.15579 0.099166 0.478881726 0.568554672 0.06349 1 32
Correlation
BIBLIOGRAPHY
Autor, D. (2022, March 14). The shrinking share of middle-income jobs. Econofact. https://econofact.org/the-shrinking-share-of-middle-income-jobs
Biermeier, D., & Allen, S. (2023, September 4). 10 states people are fleeing and 10 states people are moving to. Forbes. https://www.forbes.com/home-improvement/features/states-moveto-from/
Cebula, R. (2005). Internal Migration Determinants: Recent Evidence. International Advances in Economic Research, 267–274.
Conway, K., & Rork, J. (2022). On Measuring US Interstate Migration with Moving Van Data. Population Research and Policy Review, 1431–1449.
Environmental Protection Agency. (n.d.). National Priorities List . EPA. https://www.epa.gov/superfund/national-priorities-list-npl-sites-state
Federal Bureau of Investigation. (n.d.). FBI — table 5. FBI:UCR. https://ucr.fbi.gov/crime-inthe-u.s/2012/crime-in-the-u.s.2012/tables/5tabledatadecpdf/table_5_crime_in_the_united_states_by_state_2012.xls
Federal Reserve Bank of St. Louis. (n.d.). Per Capita Personal Income By State. FRED. https://fred.stlouisfed.org/release/tables?eid=257197&rid=110
Gale, W., & Samwick, A. (2014). Effects of income tax changes on economic growth. Brookings Institute. https://www.brookings.edu/wpcontent/uploads/2016/06/09_effects_income_tax_changes_economic_growth_gale_samwi ck.pdf
Gimpel, J., & Schuknecht, J. (2001). Interstate Migration and Electoral Politics. The University of Chicago Press, 63(1), 207–231. https://www.jstor.org/stable/2691899
Gleason, P. (2023, August 4). Why migration data matters so much. Forbes. https://www.forbes.com/sites/patrickgleason/2023/07/31/why-migration-data-matters-somuch/?sh=14576fa25c81
Hsieh, M.-F., & Wang, H. (2022). Do People Move to Reduce Tax Burdens? The Tax Reform Act of 1986 as a Natural Experiment. Taiwan Economic Review , 50(1), 1–50.
Hunt, M., & Probasco, J. (2023, May 17). Property taxes by State. Bankrate. https://www.bankrate.com/real-estate/property-tax-by-state/#what-are
33
Ihlanfeldt, K., & Rogers, L. (2022). Homestead Exemptions, Heterogenous Assessment, and Property Tax Progressivity. National Tax Journal, 75(1), 7–29.
Kennan, J., & Walker, J. (2011). The Effect of Expected Income on Individual Migration Decisions. Econometrica, 79(1), 211–251. https://www.jstor.org/stable/41057441
Kerns-D’Amore, K. (2023, November 1). Change in marital status became more common reason for moving from 2021 to 2022, housing/neighborhood improvement reasons declined. Census.gov. https://www.census.gov/library/stories/2023/09/why-peoplemove.html#:~:text=As%20in%20several%20recent%20years,common%20between%2020 21%20and%202022.
Minott, O., & Selby , J. (2022, August 10). Ten actions cities can take to improve housing affordability. Bipartisan Policy Center. https://bipartisanpolicy.org/blog/10-actions-tohousing-affordability/
Mulholland, S., & Young, A. (2016). Occupational Licensing and Interstate Migration. Cato Journal, 36.
NCEI.Monitoring.Info@noaa.gov. (n.d.). Climate at a glance: Statewide . National Centers for Environmental Information (NCEI). https://www.ncei.noaa.gov/access/monitoring/climateat-a-glance/statewide/time-series/50/tavg/1/1/20122013?base_prd=true&begbaseyear=1901&endbaseyear=2000
Pew Research Center. (2015, May 12). Party affiliation by state. Pew Research Center’s Religion & Public Life Project. https://www.pewresearch.org/religious-landscapestudy/database/compare/party-affiliation/by/state/
Property tax. Ballotpedia. (n.d.). https://ballotpedia.org/Property_tax
Rogers, L., Spell, L., & Perry, M. (2023, March 30). Domestic outmigration from some urban counties slowed, smaller gains in rural counties. Census.gov. https://www.census.gov/library/stories/2023/03/domestic-migration-trends-shifted.html
State individual income tax rates and brackets for 2022. Tax Foundation. (2024, February 22). https://taxfoundation.org/data/all/state/state-income-tax-rates-2022/
State individual income tax rates, as of July 1, 2012. (n.d.). https://files.taxfoundation.org/20190311152905/state_individualincome_rates-2000-201220130219.pdf
Thorman, T., & Payares-Montoya, D. (2024, April 17). Income inequality in California. Public Policy Institute of California. https://www.ppic.org/publication/income-inequality-incalifornia/
34
United States Census Bureau. (2023, September 21). State-to-state migration flows. Census.gov. https://www.census.gov/data/tables/time-series/demo/geographic-mobility/state-to-statemigration.html
United States Census Bureau. (n.d.). Geographic Mobility by Selected Characteristics. Census Data Exploration. https://data.census.gov/table?q=migration&g=010XX00US
Wilson, C. (2024, February 7). Oregon pioneered a radical drug policy. now it’s reconsidering. NPR. https://www.npr.org/2024/02/07/1229655142/oregon-pioneered-a-radical-drugpolicy-now-its-reconsidering
Yahoo! (2012). Most and least taxing states 2012. Yahoo! Finance. https://finance.yahoo.com/news/most-and-least-taxing-states-2012.html?guccounter=2
35
36
37