Oliver Barca


Oliver Barca
Abstract
This paper analyzes how beneficial stolen bases are to a team using different statistical methods throughout different eras of Major League Baseball. By conducting hypothesis tests, it is determined how likely it is for the mean stolen bases per game of the best team to vary from league average. This hypothesis test was done for the first 30 years of modern baseball and the most recent 30 years. Additionally, the correlation coefficient is calculated between wins and stolen bases throughout the years of modern baseball. A correlation coefficient was again calculated to determine the relationship between the original correlation coefficient found between stolen bases and wins, and the number of home runs per game, the number of strikeouts, and the year. This was done to determine whether the strength of the relationship
between wins and stolen bases was dependent on the number of homeruns, strikeouts, and how the strength of this relationship has changed over time. Depending on the strength of the correlations found in these analyses, general managers can use the information when assembling a team and make decisions on the personnel that they acquire. Introduction
From Babe Ruth in the early 1900s to Mookie Betts in the modern day, baseball players have changed how they play the game in a variety of ways. In response to these changing styles of play, the strategies that managers approach the game with have also changed. At the beginning of the modern era of baseball in 1900, the game looked much different than it does today. For example, from 1900 to 1910, home runs occurred 0.135 times per game on average compared to the 1.21 home runs per game this past MLB season (Baseball Reference 2023). Concurrently, stolen
bases occurred at a rate of 1.20 per game from 1900 to 1910 compared to the 0.72 (SB) per game this past season. Many other factors of the game have changed as well, but this study focuses on stolen bases and how and why they have changed throughout the course of baseball history. Additionally, this paper will analyze how beneficial stolen bases are to an MLB team as well the circumstances that make a good base stealer most valuable.
First it is important to understand what exactly a stolen base is: “A stolen base occurs when a baserunner advances by taking a base to which he isn't entitled” (MLB). This most often occurs while the pitcher begins to deliver the pitch. As he lifts his foot to begin to pitch the ball, the runner will begin to run from first to second, second to third, or, on rare occasions, from third to home. While the pitcher comes set and before the pitch is delivered, the runner will usually take a few steps away from the base they currently occupy. This is called a lead and the larger the lead is, the higher the probability of a successful steal since the
runner would have a shorter distance to run to the next base. However, if the runner takes too large of a lead, the pitcher can perform a pickoff. This occurs when the pitcher steps off the pitcher’s rubber and throws to the base that the runner is on. If the fielder catches the ball and tags the runner before the runner gets back to the base, the runner is ruled out. Stolen bases have been an important part of baseball since the beginning of the game and have been a key part of many offensive strategies that managers employ.
Throughout the history of baseball the value that stolen bases bring to a team has varied as a result of a combination of many factors. Since the beginning of modern baseball in 1901, the number of home runs per game has generally increased while the number of stolen bases has decreased (see Figures 1 and 2).
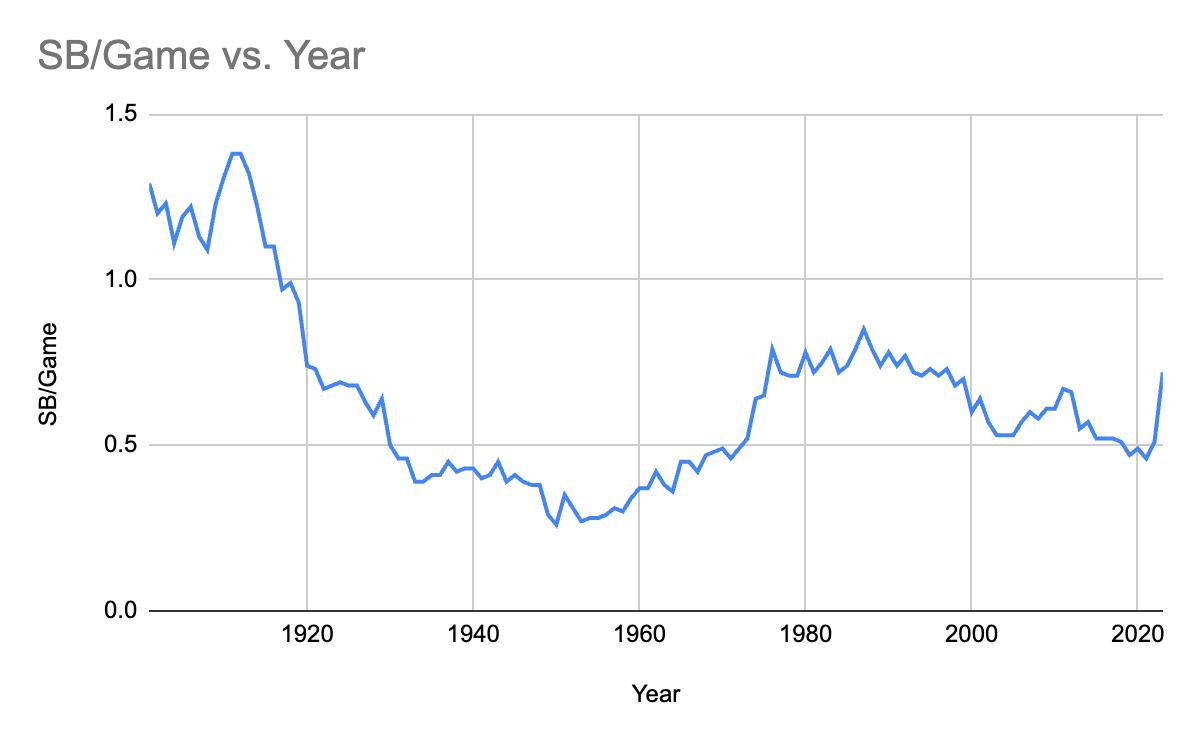
Figure 1: Stolen bases per game from 1901 - 2023

Figure 2: Home runs per game from 1901 - 2023
However, both figures have a large number of local minima and maxima, supporting the idea that baseball trends are cyclical.
The resurgence of stolen bases that occurred in the late 1960’s to early 1970’s could be the result of a change in the approach players had playing the game (McMurray). He suggests that this time period saw a resurgence in stolen bases since many players were starting to be both power hitters and a speed threat on the bases.
Russell Roberts, author of Stolen!, provides an alternative explanation for this resurgence: “The stolen base had continued to thrive in the Negro League [...] In breaking the color barrier, Jackie Robinson liberated the game itself from the predictable rhythms into which it had fallen.” When the color barrier was finally broken, and players who played in the Negro League transitioned to the MLB, they brought the culture of stolen bases back to the MLB. Despite stolen bases having been absent from the game in the MLB, they were still common in the Negro League from the 1930’s to the late 1950’s.
Although both diagrams show considerable fluctuation, stolen bases have generally decreased in frequency, whereas home runs have increased. One possible reason for this is because when a home run is hit, it doesn't matter whether the runners on base were on first, second, or third base since all of them come home and score. However, in an era where home runs were uncommon, like the “deadball era” (1900-1919), stolen bases would be significantly more valuable since hitting a single while a runner is on second would generally score a run while hitting a single while a runner is on first would result in moving him over to second or third. In this case, advancing a runner from first to second becomes much more important. This strategy, which is commonly called “small ball,” typically values putting runners on base and moving them around the bases methodically in any way possible whether it be through stolen bases, sacrifice hits, or sacrifice flies. Sacrifice hits or “bunts” occur when the batter advances the runners on the base paths while recording an out. Sacrifice flies occur when the batter
hits a deep fly ball that is caught, but the runners advance to the next base once that ball is caught. Teams that use this strategy would have a much greater use for good base stealers than teams that score most of their runs through “big hits” that bring multiple runs home in one hit.
The general decrease in stolen bases could be for a number of reasons: stadium sizes, performance enhancing drugs (PEDs), the slide step, the absence of artificial turf, and lost glory (Neyer).
He believes that since stadiums are now slightly smaller than they used to be, outfielders no longer need to be as fast, which reduces the number of fast players on the base paths. However it seems unlikely that a small decrease in field size would make a significant impact on the speed of players and the number of stolen bases that occur. And, in the late 1950s when stolen bases were at an all time low, stadiums were a similar size to what they were in the 1970s and 80s.
Additionally, it is easier to run on turf compared to grass making stolen bases easier back when turf fields were more common (Neyer). However, the peak of base stealing in the Deadball era occurred when there were no turf fields, and some of the best base stealers of all time, like Rickey Henderson, arguably the best base stealer of all time, played the vast majority of his games on grass.
The other potential reasons most likely have all had an impact on the number of stolen bases (Neyer). PEDs in the Steroid era produced a large number of power hitters and Neyer also writes that, most likely, stolen bases aren’t as important when the next batter will hit a home run and bring everybody home. The slide step has also impacted the number of stolen bases, and is when a pitcher shortens his windup to decrease the amount of time a player has to steal a base. The technique was developed in the 1980’s when there were many players like Rickey Henderson stealing a large number of bases in order to stop them from turning
nearly every single into a double (Thorburn). As a result, catching a player stealing became easier thus minimizing the impact that proficient base stealers had. Both the rise of homeruns in the steroid era and the increased difficulty in stealing bases most likely contribute to the reduced glory that base stealers earn that Neyer mentions, and all three of these reasons may have contributed to the fall of the stolen base in addition to their relationship with other statistics in baseball such as home runs and strikeouts.
Results
To test the relationship between stolen bases and home runs a graph is plotted with stolen bases per game and home runs per game as the axis (see figure 3). Additionally the R2 value is calculated to determine the strength of the correlation using ! ! = "($! $̄)((! (̄) )"($! $̄)" )"((! (̄)" . The closer the R2 value is to 1, the stronger the relationship is. The R2 value for the data is equal to 0.306, meaning that the relationship between home runs per game and stolen bases per game has a fairly weak relationship.

Figure 3: SB per game vs HR per game with trendline and R2 value of 0.306
However, by reducing the domain of the graph from 0 home runs per game to 0.5 home runs per game, it can be seen that stolen bases greatly decrease within this domain, but then remain steady as home runs per game increase past 0.5. The data was graphed again from 0 to 0.5 home runs per game (see figure 4). The R2 value was recalculated over this domain and it is equal to 0.757 . The correlation between home runs per game and stolen
bases per game is much stronger over this interval and can be considered a strong correlation from 0.1 to 0.5 home runs per game. This suggests that the correlation between stolen bases and homeruns is linear and negatively correlated within this interval, but levels out after teams exceed 0.5 home runs per game which may be influenced by other factors other than home runs. This would mean that teams that hit many home runs would generally all steal a similar number of bases once they have passed the threshold of 0.5 home runs per game for multiple different factors.
One reason for this is that stolen bases will have the benefit of eliminating the possibility of a double play no matter whether the team relies on home runs or a small ball strategy for their offensive production. This would mean that all teams should still steal a minimum number of bases no matter how many home runs they hit due to the value that stolen bases have to remove the threat of a double play. However, further analyses would need to be done to determine the exact reasons.

Figure 4: Stolen bases per game vs home runs per game with trendline and R2 value of 0.757. R2 value calculated from 0.1 to 0.5 home runs per game.
To begin to analyze the importance of stolen bases to a championship team, a right tailed hypothesis test is run with a critical value of 0.05 (α = 0.05) on the difference of the mean stolen bases per game of the world series champion and league average. From 1992 to 2023 (excluding 2020 due to COVID and
1994 and 1995 due to the players strike), the World Champion team averaged 0.63 stolen bases per game while the league average was 0.60 stolen bases per game. 1992 to 2023 is the interval chosen so that there will be 30 data points in the sample of league champions in order for the Central Limit Theorem to be applied in order to assume a normal distribution. The null hypothesis for this test (H0 ) is that the difference between the number of stolen bases per game of the world champion and league average should equal zero, and the alternative hypothesis (Ha) is that the difference is greater than 0.
The z-score is calculated with the formula z = x- where x is the actual value, μ is the expected mean, and σ is the standard deviation. From 1992 to 2023, the expected mean is 0 since the null hypothesis expects the difference in stolen bases per game of the world champion not to vary from league average. The actual value (x) is 0.0297 since that is the average difference, and the standard deviation equals 0.2. The rejection region for this
hypothesis test is z > 1.645 since the critical value for this hypothesis test is 0.05. The z score of the data set is .1485 which does not fall within the rejection region, meaning that we are unable to reject the null hypothesis that the league champion’s stolen bases per game are equal to league average. This means that we cannot conclude that the number of stolen bases that the World Champion steals is greater than league average with 95% certainty.
On the data from 1901 to 1932 this same type of hypothesis test is run. Instead of the World Champion, the team with the best record is used for this test. For a few of the years in this time period, there was no World Series, and there were no playoffs leading up to the World Series, meaning that the ability of a team to perform in the playoffs was not a factor as it is in the modern game. The stolen bases per game of the team with the best record is compared to league average. The z score of this set of data equals 0.7543 which, again, does not fall within the rejection
region of z > 1.645. Thus we fail to reject the null hypothesis that the team with the best winning percentage will have an equal amount of stolen bases per game as league average. The z score tells us how many standard deviations the sample is from the expected mean. After the z score is calculated, the z table displays to us the probability that the sample point differs from the mean. When looking at the z table for a value of .7543, this tells us that there is a 75.43% chance that mean stolen bases per game of the best team actually differs from the league average. When conducting a hypothesis test with a critical value of .05 we are checking whether there is a 95% chance or greater that the mean stolen bases of the best team differs from league average. So, while both hypothesis tests failed to reject the null hypothesis, there is a 75.43% chance that the stolen bases per game of the best team differs from league average from 1901-1932. These two time periods were chosen because of the opposite approaches to offense that were used. From 1901 to 1932, home runs were very
uncommon, while stolen bases were used frequently. From 19922023, home runs have been at an all time high and stolen bases are significantly less common than they once were.
Continuing the analysis of the value in terms of run production that being a good base stealing team has, the R2 value was calculated between winning percentage and stolen bases per game from 1900 to 2023 (figure 5). This analysis was done between winning percentage and stolen bases per game because in the early days of baseball, not all teams played the exact number of games, and teams that played in the Negro League did not play the same number of games as MLB teams, however they are included in this study since they were a large part of professional baseball at the time. They continued to steal bases at a high rate even when the MLB did not. In 1961, both the National League and the American League, the two leagues that comprise the MLB, began playing the 162 game schedule that we see today.

Figure 5: R2 value of winning percentage and stolen bases per game vs year from 1900 - 2023. 2020 is excluded from all calculations due to the season being abbreviated to only 60 games instead of the usual 162.
Throughout the history of the game, the correlation between winning percentage and stolen bases per game has been positive except for a few years in the past decade and in the 1960’s. However, the strength of the correlation has varied greatly. This could be for a few different reasons. The sheer number of
stolen bases that a team performs may not influence the success of a team as much if they are also caught stealing more often. For example, if a team were to steal 1.5 bases per game, but was also caught stealing once per game, the team would likely be less successful then if they were to not steal at all which is observed in the 1960’s, one of the only times the correlation between winning percentage and stolen bases was negative. In this decade, on average, teams were caught stealing nearly the same amount as they succeeded in stealing a base from the late 1940’s to the mid 1960’s. Typically, a stolen base percentage of 0.75 is considered helpful because being caught stealing is much more detrimental to a team than a successful stolen base is beneficial (MLB).
According to Cade Stanley and his calculations of expected runs, “a successful stolen base attempt would add about 0.25 expected runs, while an unsuccessful attempt would subtract about 0.61 expected runs” (Stanley). Therefore, it would make sense that in an era where successfully stealing a base and being caught stealing
are, on average, almost equally probable, that winning percentage and stolen bases would be negatively correlated. A team that steals more bases most likely also gets caught stealing more frequently meaning that the more stolen bases that a team attempts, the more it negatively impacts their success.

Figure 6: R2 value of winning percentage and stolen bases per game vs home runs per game from 1900 - 2023. 2020 is excluded from all calculations due to the season being abbreviated to only 60 games instead of the usual 162.
This same correlation calculation was done again, with strikeouts per game instead of home runs per game (see figure 7). The strength of the correlation is slightly weaker than it is with home runs, but the trend is similar. As strikeouts rise, generally the correlation between winning percentage and stolen bases decreases. This may be due to the fact that strikeouts are highly correlated (see figure 8) with home runs, and transitively has a similar R2 value to home runs when plotted against the R2 value between winning percentage and stolen bases per game. Another reason for this may be that stolen bases are much less valuable when batters strike out more often. When a batter grounds out to record an out, the out has the possibility of being a productive out by advancing the runners on base. Doing so after a successful stolen base may result in a run batted in (RBI) despite still recording an out. However, if a batter strikes out, the out cannot be productive and will not advance any runners. Because of this, the
more strikeouts that are recorded, generally, the less beneficial a stolen base will be.
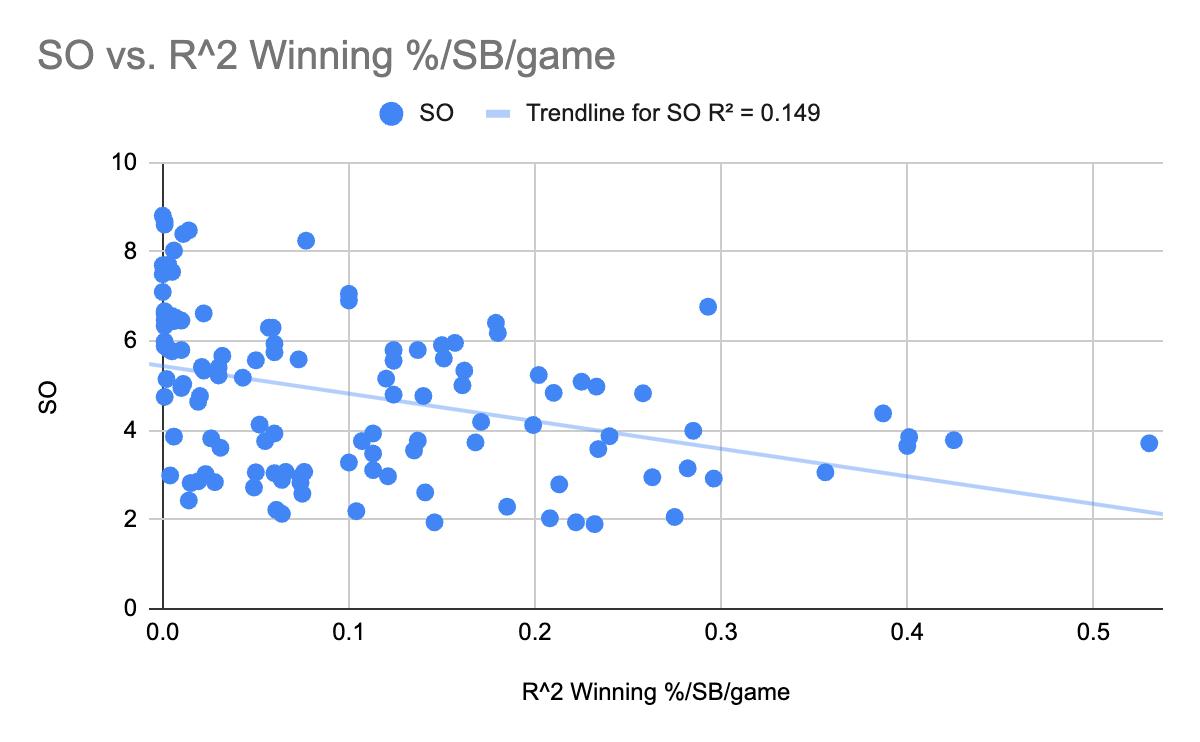
Figure 7: R2 value of winning percentage and stolen bases per game vs strikeouts per game from 1900 - 2023. 2020 is excluded from all calculations due to the season being abbreviated to only 60 games instead of the usual 162.

Figure 8: Strikeouts vs home runs from 1901 to 2023. R2 = 0.673)
Discussion
For all three of the graphs that analyze the R2 value of winning percentage and stolen bases per game, there are multiple values that fall outside the 1.5 times the interquartile range (IQR). If a value is outside the range of Q1 -1.5(IQR) and Q3 + 1.5(IQR), then it can be considered an outlier. These numbers on the outside of the range are called the inner fence. For this study, outliers were calculated within the different eras. The data points were grouped
into the different eras and the interquartile range was determined for each era. If a data point fell outside of the inner fences, it would be labeled an outlier. These outliers were not removed because they were most likely a rare chance event, rather than a calculation error. Outliers can occur for multiple reasons: Observation, recording, or data entry error; item is from a different population; or a rare chance event. The outliers that occurred in this study are intriguing to look into and find out why they might have occurred. There are a variety of factors that could contribute to producing these outliers. Some possible reasons may include a lower success rate for a stolen base or a trend in offensive strategy. Future research can be done to determine the reasons for these outliers, however their exact causes are outside of the scope of this study.
A similar study done in Herman Demmink III’s article “Value of Stealing Bases in Major League Baseball: ‘Stealing’ Runs and Wins" mentioned many of the side effects that good base stealers have on a team even if they don't directly show up in the
stat sheet. Demmink claims in his article, “[i]n addition to recognizing that the threat of stealing a base can make pitchers less effective, we must understand that virtually anyone who attempts base stealing are good defensive players as well because of their greater field range” (Demmink). A good base stealer is often a good fielder as well because of their speed as well as their potential effect on the pitcher's confidence when they are on base regardless of whether they steal a base or not. Good base stealers cause a distraction for the pitcher and will often make pitchers take additional measures to prevent them from stealing (slide step, pickoffs, and pitch outs). These additional benefits that good base stealers add to a team won’t show up in the stolen base column in the stat sheet, but will have a great impact on a team's success. This could partially explain why the strength of the correlation is weak in the analyses done on the R2 value between stolen bases and winning percentage.
When assembling a baseball team as a general manager, it is important to assemble a team that works well together.
Understanding exactly how beneficial a stolen base is and their relationship to home runs and winning percentage is useful in determining whether a good base stealer would fit within a given offensive system. Early in the 1900s, when stolen bases were common and home runs were not, the correlation between winning percentage and stolen bases per game was much higher than it is today. Back then, a proficient base stealer would fit into a much larger percentage of teams’ offensive systems making them more sought after.
While stolen bases no longer have as strong of a correlation with winning percentage as it once did, it is important to note their relationship with home runs. If a team in the modern day consisted mainly of contact hitters who rarely struck out, it would make sense to acquire a good base stealer. Despite the league trending upwards in home runs on average, a good base stealer would be
beneficial for a team constructed in this way. Bursik and Quinn point out a great example of a team like this in their article “Whither or whether the stolen base?”. They state “Whitey Herzog's St. Louis Cardinals of the 1980s were perhaps the best example of a pure speed team in modern baseball history. While stealing over 20% more bases than the next closest NL team, they were second in runs scored despite being dead last in home runs” (Bursik and Quinn). Teams like this demonstrate the effectiveness of stolen bases when executed correctly. However, for a team with many power hitters, especially those who often either strike out or hit a homerun, stealing bases would be significantly less useful and most likely not worth the risk of being caught.
Additionally the correlation for all three of the analyses that study the R2 values is considerably low. This may be the result of general managers constructing teams with different offensive strategies in mind. One manager may want to score through big hits (doubles, triples, and home runs), while others may construct
their team to be successful using small ball. Both of these hypothetical teams would have a high winning percentage, but would have used wildly different methods of achieving that. Stolen bases have the ability to impact a teams overall success if the team is built for that, however there are a variety of other ways to achieve success thus resulting in a fairly low R2 value between stolen bases and winning percentage.
Another possible reason for the low strength of the correlation is that managers may order their batting line ups in such a way that they can both hit a good number of home runs while also stealing a good amount of bases while keeping both effective. For example, a line up, which consists of 9 players, could contain 4 power hitters who have a high number of both strikeouts and home runs and 5 contact hitters. The manager could order the line up in such a way that the proficient base stealers hit before the contact hitters thus making the bases they steal more valuable since the hitters that follow them are more
likely to hit singles. After stealing a base the base stealer would most likely be on second base and would likely score off a single. By ordering hitters this way, a team can both score through both small ball tactics (stolen bases, sacrifice hits, and singles) and also power hitting (doubles, triples, and home runs).
The value and usage of stolen bases have drastically changed since the beginning of the modern era of baseball when the American league was formed in 1901. From the dead ball era where stolen bases occurred around 1.15 times per game to the integration era which followed 2 decades later, and stolen bases occurred at an all time low of 0.33 times per game, stolen bases have undergone rapid changes in the way that managers approach them as well as how effective they are. Their frequency and value have been influenced by a number of factors.
Building a successful team requires general managers to make a number of well-calculated decisions. They must decide the offensive strategy they want to use, who to acquire to execute that plan, and determine the costs and benefits that each individual player brings to a team. Understanding the benefits that stolen bases can bring and how to build a team around good base stealers to maximize their potential can be useful information for general managers building a team. And, with the new rules implemented in 2023 that have made stealing bases easier, stolen bases may make a return to prominence in the coming years, and teams will once again build their rosters around proficient base stealers to generate their offense.
Works Cited
“MLB Stats, Scores, History, & Records.” Baseball Reference, www.baseball-reference.com/. Accessed 1 Oct. 2023.
Bursik, Paul, and Kevin Quinn. "Whither or whether the stolen base?" Nine, vol. 17, no. 2, spring 2009, pp. 122+. Gale Academic OneFile, link.gale.com/apps/doc/A202295232/AONE?u=mlin_oweb &sid=googleScholar&xid=4a4412ee. Accessed 25 Mar. 2024.
Demmink, Herman. “Value of Stealing Bases in Major League Baseball: ‘Stealing’ Runs and Wins.” Public Choice, vol. 142, no. 3/4, 2010, pp. 497–505. JSTOR, http://www.jstor.org/stable/40541986. Accessed 1 Oct. 2023.
McClave, James T., and Terry Sincich. Statistics. Pearson Education, Inc., 2021.
McMurray, John. "Examining stolen base trends by decade from the deadball era through the 1970s." The Baseball Research Journal, vol. 44, no. 2, fall 2015, pp. 25+. Gale Academic
OneFile,
MLB. (n.d.-a). Stolen-base percentage (SB%): Glossary. MLB.com. https://www.mlb.com/glossary/standardstats/stolen-base-percentage
link.gale.com/apps/doc/A433878472/AONE?u=mlin_b_bumml&si d=googleScholar&xid=d0b86e15. Accessed 1 Oct. 2023.
Neyer, Rob. “Don’t Believe the Stolen Base Is Dead.” ESPN, ESPN Internet Ventures, 30 Apr. 2009, www.espn.com/mlb/columns/story?columnist=neyer_rob& id=4116668 .
Roberts, Russell. Stolen!. Jefferson NC, McFarland, 1999.
Stanley, Cade. “Modeling the Probability of a Successful Stolen Base Attempt in Major ...” Scholar Commons , 2023, https://scholarcommons.sc.edu/cgi/viewcontent.cgi?
article=1607&context=senior_theses
Thorburn, D. (2012, June 22). Raising aces: A slide step in the wrong direction. Baseball Prospectus. https://www.baseballprospectus.com/news/article/17445/rai sing-aces-a-slide-step-in-the-wrong-direction/