
Sudeep Chitrothu
Senior Thesis | 2024

Patient Sex Drives Differential Transcriptional Regulation in Pancreatic Cancer
Chitrothu, Sudeep, HSPH, sudeepch@bu.edu
Ben Guebila, Marouen, HSPH, marouen.bg@gmail.com
Quackenbush, John, HSPH, johnq@hsph.harvard.edu
Introduction
Pancreatic cancer is one of the most common types of cancer in the world, especially in countries with high Human Development Index (Ilic et al., 2022). According to the Global Cancer Observatory, pancreatic cancer accounted for 4.7% of all global cancer deaths in the year 2020 and 2.6% of new cancer cases (Ilic et al., 2022). Pancreatic cancer is incredibly lethal; about 4% of patients are alive five years after diagnosis (Vincent et al., 2011). Pancreatic cancer rates have been increasing in both biological sexes in the last few decades. Many risk factors have been identified, including smoking, family history of chronic pancreatitis, old age, obesity, high-fat diet, diabetes, non-O blood type, exposure to chlorinated hydrocarbon solvents and nickel, and African American ethnic origin (Vincent et al., 2011). Pancreatic adenocarcinoma makes up about 85% of tumor cases, while pancreatic endocrine tumors make up less than 5% (Patel et al., 2019).
However, pancreatic cancer has a higher incidence rate in men, and men have a lower survival rate compared to women (Pijnappel et al., 2022). Differences in exposure to pancreatic cancer risk factors might only be able to explain an increased rate of pancreatic cancer in males partially. A study conducted in the Netherlands concluded that even after accounting for potential causes, females had a lower rate of occurrence of pancreatic cancer than men. However, this difference – 0.3 months – is considered
small on a clinical timescale (Pijnappel et al., 2022). Also, females are less likely to get pancreatic cancer at a younger age than males, but at an older age, the likelihood of developing cancer is equal in both sexes. However, some studies suggest that biological hormones are at play, as the presence of estrogen has been shown to decrease the risk of developing cancer (Pijnappel et al., 2022). It has been hypothesized that older men and women have the same chance of developing pancreatic cancer because women have lower levels of estrogen at an older age (Pijnappel et al., 2022).
A common type of pancreatic cancer is pancreatic ductal adenocarcinoma. Cachexia, which is characterized by muscle wasting and weight loss, is a condition that arises in patients with pancreatic ductal adenocarcinoma (Zhong et al., 2022). Cachexia has been found to be sexually dimorphic in mice, and Activin, a reproductive hormone, has been found to be a cause of muscle wasting. In a recent study on mice, male mice that started with mutations that caused pancreatic ductal adenocarcinoma started to lose lean mass within 20 weeks, while females never lost lean mass (Zhong et al., 2022). In addition, while male mice started to lose fat mass within 11 weeks, female mice started to lose fat mass within 20 weeks. Also, the organs of male mice were more wasted in male mice in the early stages than in female mice. This suggests that the effects of pancreatic ductal adenocarcinoma differ by sex, and treatments should vary by sex (Zhong et al., 2022).
Gene expression is regulated in many ways, such through transcription factors, lincRNAs (long intergenic non-coding RNAs), and miRNAs (microRNAs). A long intergenic non-coding RNA (lincRNA) is an RNA transcript longer than 200 nucleotides that does not encode proteins. RNA polymerase II first transcribes lincRNA genes, and then transcripts are spliced and polyadenylated (Deniz et al., 2016). Even though lincRNAs are not
protein-coding and are expressed much less than protein-coding genes, they play a significant role in the cell, such as interacting with DNA and other RNAs. In addition, the long length of lincRNAs enables them to fold and form complex tertiary structures. It has been found that lincRNAs play an important role in processes such as cell proliferation, development, and pluripotency. However, one important quality of lincRNAs is their role in gene expression. LincRNAs can recruit enzymes that modify chromatin at certain locations, causing gene expression to be either activated or repressed (Deniz et al., 2016). Also, it has been found that dysregulation of lincRNAs plays a role in tumorigenesis. For example, the lack of expression of the lincRNA TUG1 has been linked to the advancement of prostate cancer (Deniz et al., 2016). Also, a pattern of gene expression that causes the progression of breast cancer by causing an increase in metastasis and cancer invasiveness has been associated with the dysregulation of the lincRNA HOTAIR (Deniz et al., 2016). However, lincRNAs have also been associated with tumor suppression. The lincRNA MEG3 activates the p53 tumor suppressor (Deniz et al., 2016). Because of the role of lincRNAs in tumors, targeting them is now being considered when developing chemotherapeutic drugs (Deniz et al., 2016). By considering the correlations between lincRNAs and protein-coding genes, we can understand their role in pancreatic tumors and normal pancreatic tissue and the differences in the expression of lincRNAs between sexes.
Another important type of RNA is microRNA (miRNA). Like lincRNAs, miRNAs are non-coding RNAs that play an important role in gene regulation, but miRNAs are significantly shorter than lincRNAs, with an average length of 22 nucleotides (O’Brien et al., 2018). miRNAs can repress translation by binding to the 3’ untranslated region (UTR) of messenger RNAs (mRNAs).
Binding to the 3’ UTR can also cause mRNA deadenylation, which is a step in the degradation of mRNA (O’Brien et al., 2018). miRNAs can also bind to the 5’ UTR and coding regions of mRNAs, which represses gene expression. miRNAs have been known to play a role in cancers (O’Brien et al., 2018). At least 28 miRNAs have been found to target the tumor suppressor CDKN1A. It has been found that many of these miRNAs are upregulated in cancer, while CDKN1A is downregulated (O’Brien et al., 2018). Because of the evidence of miRNA’s essential roles in cellular processes, gene expression, and diseases such as cancer, we consider the correlation between lincRNAs and protein-coding genes.
Transcription factors (TFs) play a significant role in regulating gene expression and cancer. They can either promote or inhibit gene expression. TFs bind to specific sequences of DNA, and mutations in the DNA that codes for TFs or the DNA that they bind to can cause abnormalities in gene expression. Sometimes, multiple TFs work together to regulate genes; the binding of one TF may change the shape of DNA and allow other transcription factors to bind (Lambert et al., 2018).
Given the question of whether there are sex differences in cancer, and keeping in mind the regulators of gene expression, we wanted to identify the genetic underpinning of differential transcriptional regulation by sex in pancreatic cancer. Our central hypothesis is that patient sex drives differential transcriptional regulation in pancreatic cancer through sex-specific regulatory elements, which would be in agreement with other solid tumors, such as colon tumors (Lopes-Ramos et al., 2018).
We conducted various differential gene expression analyses to find differentially expressed pathways that may cause sex
differences in pancreatic cancer. However, because differences in gene expression do not always indicate causal processes, we constructed gene regulatory networks to find regulators in pancreatic cancer. The gene regulatory networks consist of a selection of the top 100 edges representing differential correlations between various regulatory elements (transcription factors, long intergenic non-coding RNAs, and microRNAs).
Methods
Data Processing and Normalization
The analysis detailed in this paper was done using the programming language R (version 4.3.1). As R is a programming language commonly used for statistical analyses and has a variety of packages useful for work in bioinformatics, it was a natural choice for this project. The code was run in the integrated development environment (IDE) RStudio (version 2023.06.1+524). The versions of all packages used in this project were the latest version as of September 1, 2023.
The first step was importing the tumor sample and the normal tissue sample data. The data attached to each sample includes genomic, epigenomic, transcriptomic, and proteomic data. The tumor data used in this project is from the TCGA (The Cancer Genome Atlas Program), while the normal data is from the GTEx (Genotype-Tissue Expression) project. The Cancer Genome Atlas (TCGA) Research Network analyzed various tumor samples to find abnormalities in DNA, RNA, proteins, and epigenetics in various tumors (The Cancer Genome Atlas Research Network et al., 2013). The goal of The Genotype-Tissue Expression (GTEx) project is to characterize the human transcriptome across many individuals and different cell types (GTEx Consortium, 2017). A
transcriptome is the set of transcripts in a sample. RNA-seq is a tool that is able to precisely identify the level of transcripts (Wang et al., 2009).
The data used in this project were not directly obtained from the TCGA and GTEx; they were obtained from an online tool called recount3. Recount3 contains publicly available, uniformly processed RNA sequencing data (including data from the TCGA and GTEx) from human and mouse samples (Wilks et al., 2021). The data from the TCGA and GTEx have been uniformly transformed in recount3 for ease of data analysis by removing confounders introduced by different sequencing platforms (Wilks et al., 2021). The recount3 website provides R code that can be used to import Range Summarized Experiment (RSE) objects with uniformly processed human pancreas data from the TCGA and GTEX. Before filtering, the RSE object with the TCGA data consisted of 183 samples with 63856 genes, and the RSE object with the GTEx data consisted of 360 samples with 63856 genes. Each sample had metadata associated with it, including the sex of the human from which the sample was derived.
To prepare for differential gene expression analyses, we filtered the RSE objects with the TCGA and GTEx data to remove all genes on the X and Y chromosomes. These genes were removed because the genes on these chromosomes will always be differentially expressed between males and females. Lists of genes on the X and Y chromosomes were obtained from the HUGO Gene Nomenclature Committee’s website (Seal et al., 2023). Furthermore, all genes except for protein-coding genes were removed (metadata included in the RSE objects indicated the type of each gene, such as whether it was a protein-coding gene or a miRNA gene). Samples that were neither labeled as male nor female were also removed since these samples would be useless
for our analysis. Samples that were of the type “Solid Tissue Normal” or “Metastatic” were removed from the TCGA RSE object so that only samples of the type “Primary Tumor” remained. In both RSE objects, genes with less than or equal to one count across samples were removed. After filtration, the RSE object with TCGA data contained 18857 genes and 178 samples, and the RSE object with GTEx data contained 18939 genes and 360 samples.
A count matrix is a 2-dimensional matrix with genes along one dimension and samples along the other. The cells of the matrix consist of the number of transcripts of a particular gene in a particular sample. We created a mean-standard deviation plot from the count matrix from the filter TCGA data using the meanSdPlot function provided by Bioconductor’s vsn (Variance stabilization and calibration for microarray data) package (Figure 1) (Huber et al., 2002). The ranks of the mean counts of genes across all samples are on the horizontal axis, while the standard deviation of the counts of a particular gene is on the vertical axis. The data is heteroscedastic; genes with a high rank mean have a large standard deviation. Homoscedasticity would ensure that it is more amenable to analysis and comparisons.
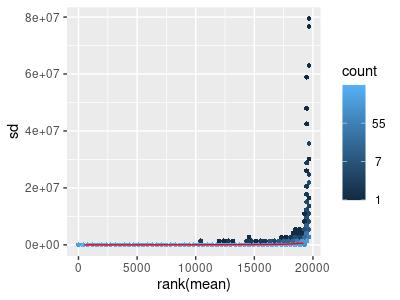
Figure 1: Mean-sd Plot: Count Matrix with Tumor Data. Sd: Standard deviation.
To correct for this, we applied a logarithmic transformation, meaning that we added one to each count and then took the base 10 logarithm of it (Figure 2). Means are on the horizontal axis, while the standard deviation is on the vertical axis. The standard deviation is largest when the mean is between 0 and 5; heteroscedasticity is still present.
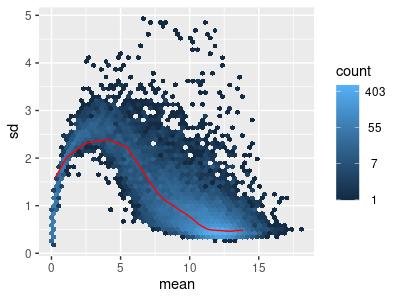
Figure 2: Mean-sd Plot: Log Transform on Count Matrix with Tumor Data. Sd: Standard deviation.
The Variance-Stabilizing Transform (VST) method provided by Bioconductor’s DESeq2 R package was used on the original filtered RNA-seq data to ensure the RNA transcript counts are homoscedastic (Figure 3) (Love et al., 2014).
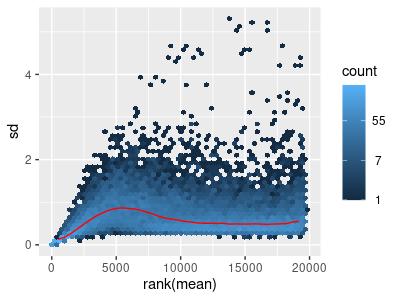
Figure 3: Mean-sd Plot: Variance-stabilizing transform on Count Matrix with Tumor Data. Sd: Standard deviation.
The same set of transformations was applied to the filtered GTEx data, with similar results (Figures 4-6).
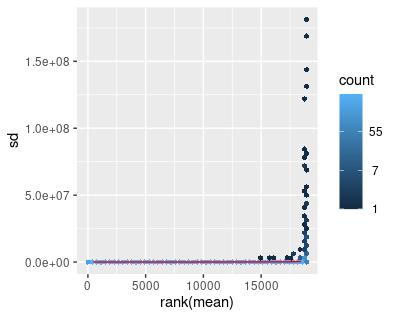
Figure 4: Mean-sd Plot: Count Matrix with Normal Data. Sd: Standard deviation.
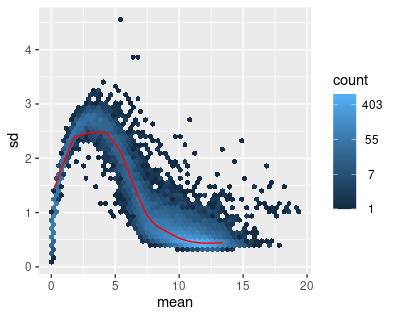
Figure 5: Mean-sd Plot: Log Transform on Count Matrix with Normal Data. Sd: Standard deviation.
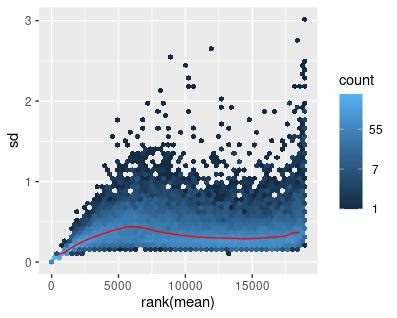
Figure 6: Mean-sd Plot: Variance-stabilizing transform on Count Matrix with Normal Data. Sd: Standard deviation.
Differential Gene Expression Analyses
The most differentially expressed genes between tumor and normal pancreatic samples, male tumor and male normal samples, female tumor and female normal samples, female tumor and male tumor samples, and female normal and male normal samples were found. Then, we determined the functional pathways related to the differentially expressed gene sets in each case.
Bioconductor’s limma is an R package that is used to analyze gene expression from RNA-seq or microarray technology (Ritchie et al., 2015). We used the lmFit function provided by limma to fit a linear model to our data. The eBayes function provided by limma helps to squeeze gene-wise variances towards a common variance. The makeContrasts function creates a contrast matrix for each group (case vs. control, such as tumor vs. normal) using a fitted linear model, and contrasts.fit uses the fitted model and the contrast matrix to make pairwise comparisons and compute log2-fold-changes and t-statistics to determine differential gene expression (Ritchie et al., 2015).
We used the plotMA and plotSA functions present in the limma package to generate MA-plot and SA-plots. The plotMA function generates MA-plots, which have estimated log-foldchanges on the vertical axis and mean log-expression on the horizontal axis for each gene (Ritchie et al., 2015). The plotSA function creates SA-plots, which are useful for checking the fit of a linear model. Gene-wise residual standard deviations (on the vertical axis) are plotted against average log-expression (on the horizontal axis) (Ritchie et al., 2015). The SA-plots allow for identifying any mean-variance trends (Ritchie et al., 2015). The first set of graphs show the data (we are comparing tumor samples
to normal samples – higher log-fold-changes mean more expression in tumor samples) after the VST transform has been applied, and the second set show the data before the VST transform has been applied (Figures 7-10).
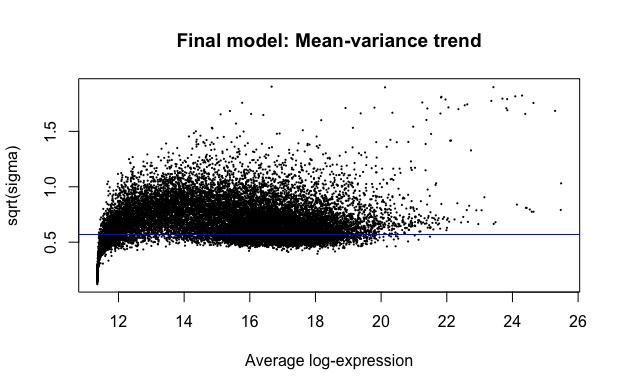
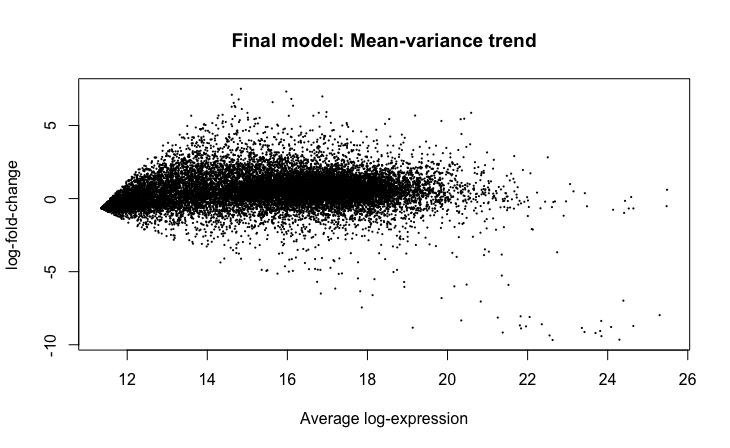
Figure 7: SA-plot generated after application of VST
Figure 8: MA-plot generated after application of VST
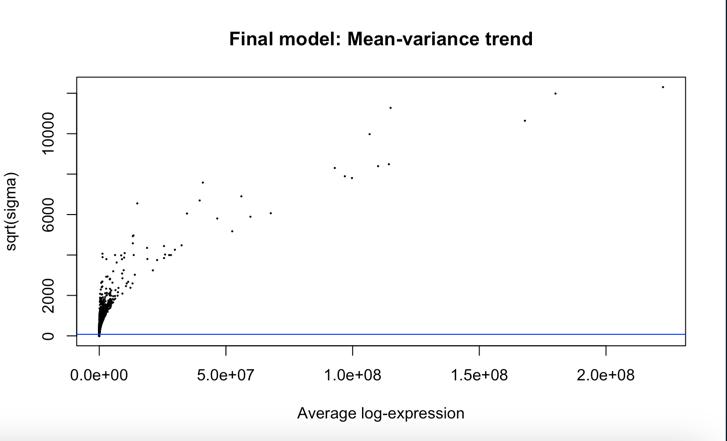
Figure 9: SA-plot generated before application of VST
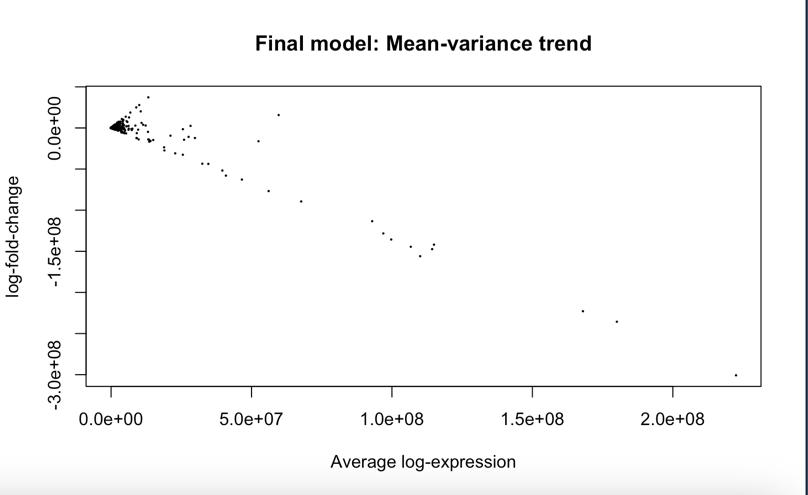
Figure 10: MA-plot generated before application of VST
We considered a gene to be differentially expressed between normal and tumor samples, between male tumor and normal samples, and between female tumor and normal samples if the absolute value of the logarithm base 2 of the fold change was greater than five and the adjusted p-value of the gene is less than 0.05. These bounds were chosen so that approximately 100 statistically significant genes are differentially expressed.
For similar reasons, we considered a gene to be differentially expressed between female and male tumor samples if the absolute value of the base 2 logarithm of the fold change was greater than 0.4 and the adjusted p-value of the gene was less than 0.05. We considered a gene to be differentially expressed between female and male normal samples if the absolute value of the base 2 logarithm of the fold change was greater than 0.3 and the adjusted p-value of the gene was less than 0.05. The volcano plots (log 10 of p-value vs. log 2 of fold change) were created using the ggplot2 R package (Figures 11-15a) (Wickham, 2016).
We conducted Gene Set Enrichment Analysis (GSEA) to derive functional association in highly differentially expressed genes using the online tool Enrichr (Subramanian et al., 2005; Chen et al., 2013; Kuleshov et al., 2016; Xie et al., 2021). For each differential gene regulation analysis, we added the list of upregulated genes and the list of downregulated genes separately into Enrichr and then analyzed the results. Enrichr contains gene set libraries, which compile existing knowledge about the functions of functionally related groups of genes and can be used to analyze any new gene lists that we generate (Chen et al., 2013; Kuleshov et al., 2016; Xie et al., 2021). Enrichr also uses a statistical test similar to the Kolmogorov-Smirnov test to rank the terms in gene set libraries based on the gene list entered into it (Chen et al., 2013; Kuleshov et al., 2016; Xie et al., 2021). Other
GSEA programs use the Fisher exact test, but this test has been associated with bias based on the size of the inputted list (Chen et al., 2013; Kuleshov et al., 2016; Xie et al., 2021).
Differential Gene Regulatory Networks
To construct the differential gene regulatory network comparing tumor samples and normal samples, we first created filtered RSE objects from TCGA and GTEx data in the same way they were created for differential gene expression, but instead of subsetting such that only protein-coding genes remain, we subsetted such that only protein-coding (which include transcription factors), lincRNA, and miRNA genes remain. We then created and subsetted count matrices with TCGA and GTEx data so that they only included the genes present in both count matrices.
We then ran R’s built-in correlation function (cor) on each count matrix. Running the correlation on a matrix finds the correlation between every pair of genes. We then subtracted the GTEx correlation matrix from the TCGA correlation matrix to obtain a differential correlation matrix. A value close to 0 in this matrix indicates that two genes are correlated equally in both the GTEx and TCGA data; a value further from 0 indicates that two genes are differentially correlated.
The gene regulatory network graphs are bipartite, each consisting of a source node (regulator node) and a target node. Each gene regulatory network graph only contains 100 edges, each representing a pair of genes whose magnitude (absolute value) is one of the 100 largest magnitudes between two genes. The arrows point from a regulatory element (lincRNA, miRNA, or TF) towards a protein-coding gene. The arrow is red if the differential correlation is negative and green if the differential correlation is
positive. The visNetwork R package was used to create visuals of the gene regulatory networks (visNetwork, n.d.). To differentiate transcription factor genes from protein-coding genes (which the metadata provided by recount3 does not do), we used a list of transcription factors obtained from a website called “The Human Transcription Factors” (Lambert et al., 2018). The list of TFs was created by combining TF lists from sources such as previous studies and Gene Ontology (Lambert et al., 2018).
For the network comparing male and female tumor samples, we created a TCGA RSE object and then a count matrix in the same way it was created for the network comparing normal and tumor samples. We then created two separate count matrices from this count matrix: one count matrix containing the gene counts for female patients, and another count matrix containing the gene counts for male patients. We then created correlation matrices from each count matrix and created a differential correlation matrix by subtracting the female correlation matrix from the male correlation matrix. The gene regulatory network and the graph were produced in the same way as in the previous comparison. For the network comparing male and female normal samples, we did the same as the previous comparison, but we used a GTEx RSE object instead of a TCGA RSE object.
For the network comparing male tumor and male normal samples, we created TCGA and GTEx RSE objects and then count matrices in the same way it was created for the network comparing normal and tumor samples. We then subsetted the count matrices such that they only included the genes present in both count matrices and only male patients remained. The gene regulatory network and the corresponding graph were prepared similarly to the previous comparisons. For the network comparing female tumor and normal samples, we did the same as we did for creating
the network comparing male tumor and normal samples but we subsetted the count matrices so that only female samples remained instead of male. To conduct GSEA, we added the genes in each gene regulatory network into the online tool Enrichr (Subramanian et al., 2005; Chen et al., 2013; Kuleshov et al., 2016; Xie et al., 2021).
Results and Discussion
To find sex differences in pancreatic cancer, we took the upregulated and downregulated genes for each of the five differential gene expression analyses and ran the gene lists into Enrichr. We then selected the most relevant pathways related to the upregulated and downregulated gene lists in each comparison (Tables 1-5). For each of the five gene regulatory networks, we ran the genes it contains into Enrichr.
Tumor vs. Normal Samples
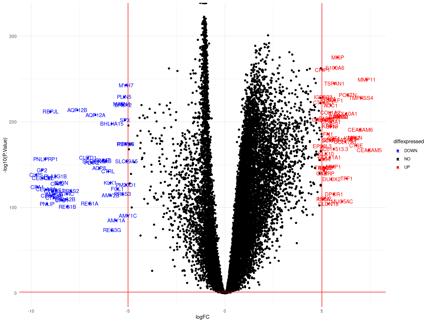
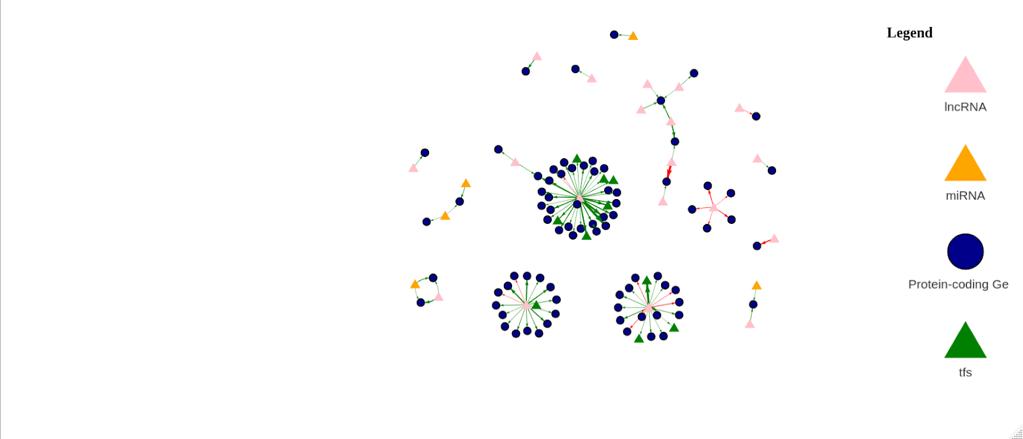
Figure 11a: Differential Gene Expression Volcano Plot between Tumor and Normal Samples. Upregulated (expressed more in tumor samples) genes are labeled and colored red, while downregulated (expressed more in normal samples) genes are labeled and colored blue.
Figure 11b: Differential Gene Regulatory Network between Tumor and Normal Samples. lncRNA are denoted by a pink triangle, miRNAs are denoted by orange triangles, transcription factors are denoted by a green triangle, and protein-coding genes are denoted by the blue circles. Arrows between regulator elements are red if the differential correlation is negative and is green if the differential correlation is positive.
The upregulated genes in the volcano plot (Figure 11a) are those that are expressed more in tumor samples than in normal samples. The downregulated genes are those that are expressed more in normal samples than in tumor samples. There are 51 upregulated genes and 49 downregulated genes. In the gene regulatory network (Figure 11b), there are 114 genes.
Differential Gene Expression Analysis between Tumor and Normal Samples
Table 1: Selected Pathways and Ontologies from Tumor vs. Normal Sample Differential Gene Expression Analysis
Gene Set LibraryPathway
Upregulated Pathways
Downregulated Pathways
Reactome 2022 Extracellular Matrix Organization R-HSA1474244
Bioplanet 2019 Syndecan 1 pathway
WikiPathway 2023 Human Pancreatic Cancer Subtypes WP5390
KEGG 2021 Human Protein Digestion and Absorption
Reactome 2022 Digestion Of Dietary Lipid R-HSA-192456
BioPlanet 2019 Pancreatic secretion
WikiPathway 2023 Human PTF1A Related Regulatory Pathway WP4147
KEGG 2021 Human Pancreatic Secretion
Elsevier Pathway Collection
GO Biological Process 2023
GO Cellular Component 2023
GO Molecular Function 2023
Proteins involved in pancreatic cancer
Proteolysis (GO:0006508)
Zymogen Granule (GO:0042588)
Serine-Type Endopeptidase Activity (GO:0004252)
The upregulated “Pancreatic Cancer Subtypes WP5390” pathway and downregulated “Proteins involved in pancreatic cancer” pathway provide evidence that the methods used to conduct our research are valid as genes related to pancreatic cancer have been found to be differentially expressed. Furthermore, the “Pancreatic secretion” pathways also confirm our methods as the differentially expressed genes are related to normal physiological pancreatic function. The presence of the pathway “PTF1A Related Regulatory Pathway WP4147” also makes sense as PTF1A stands for Pancreas transcription factor 1 subunit alpha and is associated with pancreatic development and prevention of apoptosis of pancreatic cells (Sakikubo et al., 2018).
The Syndecan-1 pathway is also upregulated. Syndecan-1 is a heparan sulfate proteoglycan found on the cell surface. Like other members of the Syndecan family, Syndecan-1 is made up of
a core protein with chondroitin sulfate (CS) chains and glycosaminoglycan (GAG) side chains (Szatmári et al., 2015). Specifically, Syndecan-1 has heparan sulfate (HS) as well as chondroitin sulfate (CS) chains (Szatmári et al., 2015). The GAG side chains are the primary mechanism by which Syndecan-1 exerts its function. It plays an important role in the prognosis and differentiation of tumors (Szatmári et al., 2015). There is data to suggest that Syndecan-1 plays a role in tumor cells by altering the expression of certain enzymes (Szatmári et al., 2015).
The pathway “Extracellular Matrix Organization” is also differentially expressed between tumor and normal samples. This supports existing research that the composition of the extracellular matrix is different in tumor tissue compared to normal tissue and that the extracellular matrix plays an important role in the development of cancer. The extracellular matrix consists of macromolecules that provide support to the cells. In normal tissue, fibroblasts contribute to the development of the extracellular matrix, but in tumor tissue, the cancerous cells themselves play an important role. The tumor cells recruit stromal cells and secrete proteins, lipids, and nucleic acids, which play roles in activating the fibroblasts and tumor progression and growth (Popova & Zücker, 2022). The differential expression of this pathway suggests that many of the TCGA samples have already metastasized.
The Zymogen Granule is a secretory organelle within the exocrine pancreas where large enzymes are stored. It plays a role in exocytosis, granule trafficking, and digestive enzyme sorting (Chen et al., 2008). The downregulation of the “Zymogen Granule” pathway suggests function characteristic of normal samples.
Differential Gene Regulatory Network between Tumor and Normal Samples
The pathway “Signaling events mediated by T cell protein tyrosine phosphatase (TC-PTP)” is associated with the genes in the gene regulatory network, and this finding aligns with existing research. T cells are activated via the signaling pathways downstream from T-cell receptors. T-cell receptors are transmembrane receptor complexes on the cell surface with chains that bind ligands and chains that contain motifs that can be phosphorylated on tyrosine residues (Stanford et al., 2012). Protein tyrosine phosphatase can either increase or decrease a target protein’s function. Because of the role of tyrosine phosphatases in activating T cells, they can be seen as part of the immune response related to cancer (Stanford et al., 2012).
We now perform analyses based on sex. We will first compare female normal and male male samples, and then we will compare female tumor and male tumor samples.
Female Normal vs. Male Normal
Before conducting a tumor analysis, we perform a Female Normal vs. Male Normal analysis to see if the most regulated pathways are the ones that we would expect and validate our pipeline in a normal tissue analysis.
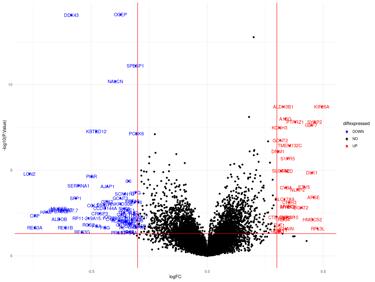
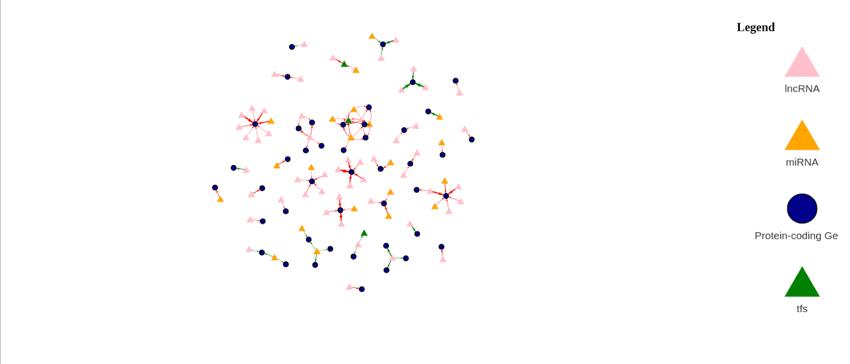
Figure 12a: Differential Gene Expression Volcano Plot between Female Normal and Male Normal samples. Upregulated (expressed more in female samples) genes are labeled and colored red, while downregulated (expressed more in male samples) genes are labeled and colored blue.
Figure 12b: Differential Gene Regulatory Network between Female Normal and Male Normal samples. lncRNA are denoted by a pink triangle, miRNAs are denoted by orange triangles, transcription factors are denoted by a green triangle, and protein-coding genes are denoted by the blue circles. Arrows between regulator elements are red if the differential correlation is negative and is green if the differential correlation is positive.
The upregulated genes in the volcano plot (Figure 12a) are those that are expressed more in female samples than in male samples. The downregulated genes are those that are expressed more in male samples than in female samples. There are 32 upregulated genes and 60 downregulated genes. In the gene regulatory network (Figure 12b), there are 122 genes.
Differential Gene Expression Analysis between Female Normal and Male Normal Samples
Table 2: Selected Pathways from Female Normal vs. Male Normal Sample Differential Gene Expression Analysis
Gene Set LibraryPathway
Upregulated Pathways
Downregulated Pathways
Reactome 2022 Metabolism Of Lipids R-HSA556833
BioPlanet 2019 Glycosphingolipid biosynthesis: lacto- and neolacto- series
KEGG 2021 Human Histidine metabolism GO Biological Process 2023 Transmembrane Receptor Protein Serine/Threonine Kinase Signaling Pathway (GO:0007178)
Reactome 2022 Innate Immune System R-HSA168249
Bioplanet 2019 Complement and Coagulation Cascades GO Biological Process 2023 Positive Regulation Of Apoptotic Cell Clearance (GO:2000427)
The downregulated pathways “Innate Immune System,” “Complement and Coagulation Cascades,” and “Positive Regulation of Apoptotic Cell Clearance (GO:2000427)” suggest that there is a greater level of immune response in males than in females.
The pathway “Metabolism of Lipids R-HSA-556833” is upregulated in males. Research shows that irregularities in the uptake of lipids play a role in cancer progression and tumorigenesis. Low expression of fatty acid translocase (CD36) plays a role in the initiation of metastasis and the proliferation of metastatic cancer cells. Cancer cells can activate lipogenesis (lipid synthesis), which is a metabolic source for tumor growth. Increased oxidation of fatty acids and peroxidation of lipids also play a role in tumor growth (Yin et al., 2022). Treatments for pancreatic cancer could potentially target pathways related to lipids, especially in males.
The pathway “Histidine metabolism” is also upregulated. Methotrexate is a drug that inhibits the enzyme dihydrofolate reductase, which plays a role in the production of tetrahydrofolate, which is necessary for DNA and RNA synthesis and,
consequently, cell survival. Formimidoyltransferase cyclodeaminase, an enzyme needed to catabolize the amino acid histidine, has also been found to make cancer cells respond to methotrexate. Histidine catabolism reduces the amount of tetrahydrofolate in the cell (Kanarek et al., 2018). Based on our results, histidine metabolism differs between males and females.
Differential Gene Regulatory Network between Female Normal and Male Normal Samples
The genes in the differential gene regulatory network are associated with LINC02681 and LINC02756. These two lincRNAs may mediate sex effects in tumors, making them potential candidates for experiments on tumor treatments.
Female Tumor vs. Male Tumor
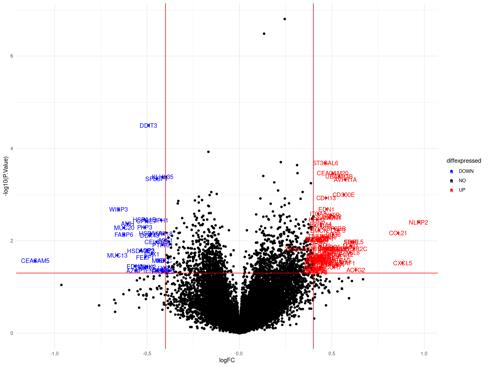
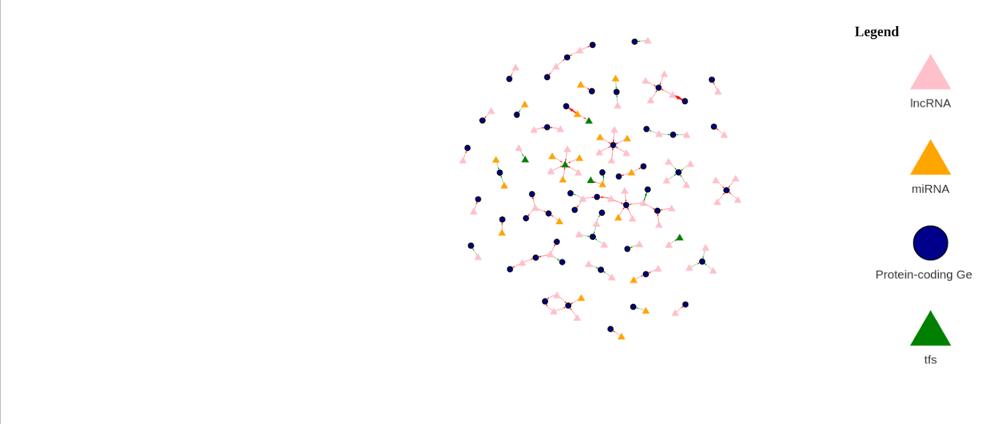
Figure 13a: Differential Gene Expression Volcano Plot between Female Tumor and Male Tumor samples. Upregulated (expressed more in female samples) genes are labeled and colored red, while
Figure 13b: Differential Gene Regulatory Network between Female Tumor and Male Tumor samples. lncRNA are denoted by a pink triangle, miRNAs are denoted by orange triangles, transcription factors are
downregulated (expressed more in male samples) genes are labeled and colored blue.
denoted by a green triangle, and protein-coding genes are denoted by the blue circles. lncRNA are denoted by a pink triangle, miRNAs are denoted by orange triangles, transcription factors are denoted by a green triangle, and protein-coding genes are denoted by the blue circles. Arrows between regulator elements are red if the differential correlation is negative and is green if the differential correlation is positive.
The upregulated genes in the volcano plot (Figure 13a) are those that are expressed more in female samples than in male samples. The downregulated genes are those that are expressed more in male samples than in female samples. There are 80 upregulated genes and 33 downregulated genes. In the gene regulatory network (Figure 13b), there are 137 genes.
Differential Gene Expression Analysis between Female Tumor and Male Tumor Samples
Table 3: Selected Pathways from Female Tumor vs. Male Tumor
Downregulated Pathways
KEGG 2021
B Cell Activation By SARS CoV 2 WP5218
Human Cytokinecytokine receptor interaction
MSigDB Hallmark 2020 Inflammatory Response
GO Biological Process 2023 Inflammatory Response (GO:0006954)
GO Molecular Function 2023 Cytokine Activity (GO:0005125)
GO Cellular Component 2023 Plasma Membrane Raft (GO:0044853)
Reactome 2022 Defective GALNT12 Causes CRCS1 R-HSA5083636
Bioplanet 2019 BDNF Signaling Pathway
KEGG 2021
Human Estrogen signaling pathway
Upregulated pathways such as “Immune System R-HSA168256,” “Inflammatory Response,” “Inflammatory Response (GO:0006954),” and “Cytokine Activity (GO:0005125)” suggest that males might have a greater immune system response to cancer. A strong immune response is often associated with cancer. Early in tumor development, cytotoxic immune cells, including CD8+ T cells and natural killer cells, can kill some immunogenic (relatively detectable by immune cells) cancer cells. Less immunogenic cancer cells then survive. Macrophages are immune cells that play a role in inflammation throughout all stages of cancer. Tumorassociated neutrophils (TANs) play a role in cancer by secreting cytokines such as IL-10 and TGF-β, which lead to immunosuppression. TAMs also secrete epidermal growth factors (EGFs), leading to cell proliferation and angiogenesis (Gonzalez et al., 2018).
The BDNF Signaling Pathway and the Estrogen signaling pathway are expressed more in male samples. BDNF (brainderived neurotrophic factor) is a growth factor that plays a role in regulating neural function, development, function, and plasticity in the central and peripheral nervous system (Meng et al., 2019). BDNF and the associated tropomyosin receptor kinase have been found to be upregulated in many types of cancer, including pancreatic cancer (Meng et al., 2019). The activation of the tropomyosin receptor kinase leads to the activation of pathways
associated with cancer, such as PI3K/Akt, Ras-Raf-MEK-ERK, and transactivation of EGFR (Meng et al., 2019). The downregulation of the BDNF signaling pathway suggests that treatments that target these pathways might help address pancreatic cancer in males.
Differential Gene Regulatory Network Analysis between Female Tumor and Male Tumor Samples
The differential gene network analysis found that LINC02681 and LINC02756 drive differences between male and female tumors. This highlights the importance of extending this study of the non-coding regions of the genome in the future by going beyond looking at expression levels and incorporating sequence data.
We now compare tumor and normal samples based on sex.
Male Tumor vs. Male Normal
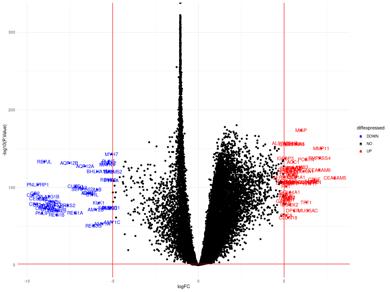
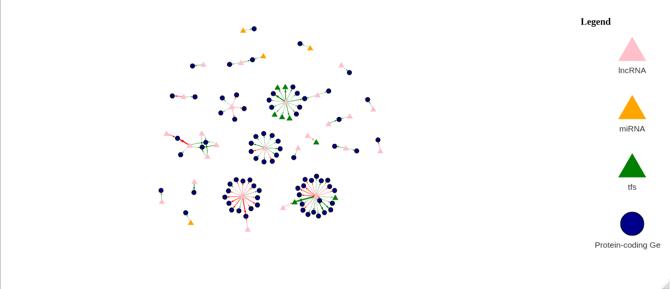
Figure 14a: Differential Gene Expression Volcano Plot between Male Tumor and Male Normal samples. Upregulated (expressed more in tumor samples) genes are labeled and colored red, while downregulated (expressed more in normal samples) genes are labeled and colored blue.
Figure 14b: Differential Gene Regulatory Network between Male Tumor and Male Normal samples. lncRNA are denoted by a pink triangle, miRNAs are denoted by orange triangles, transcription factors are denoted by a green triangle, and proteincoding genes are denoted by the blue circles. Arrows between regulator elements are red if the differential correlation is negative and is green if the differential correlation is positive.
The upregulated genes in the volcano plot (Figure 14a) are those that are expressed more in tumor samples than in normal samples. The downregulated genes are those that are expressed more in normal samples than in tumor samples. There are 52 upregulated genes and 49 downregulated genes. In the gene regulatory network (Figure 14b), there are 118 genes.
Differential Gene Expression Analysis between Male Tumor and Male Normal Samples
Table 4: Selected Pathways from Male Tumor vs. Male Normal
Sample Differential Gene Expression Analysis
Gene Set Library
Pathway
Upregulated Pathways
Reactome 2022
Bioplanet 2019
WikiPathway 2023
Human
Extracellular Matrix
Organization RHSA-1474244
Syndecan 1 Pathway
Pancreatic Cancer Subtypes WP5390
KEGG 2021 Human Protein digestion and absorption
MSigDB Hallmark 2020
GO Biological Process 2023
GO Cellular Component 2023
Epithelial Mesenchymal Transition
Extracellular Structure
Organization (GO:0043062)
CollagenContaining Extracellular
Downregulated Pathways
GO Molecular Function 2023
Reactome 2022
Matrix (GO:0062023)
Platelet-Derived Growth Factor Binding (GO:0048407)
Digestion R-HSA8935690
Bioplanet 2019 Pancreatic Secretion
Elsevier Pathway Collection Proteins Involved in Pancreatic Cancer
WikiPathway 2019
PTF1A Related Regulatory Pathway WP4147
GO Biological Process 2023 Proteolysis (GO:0006508)
GO Cellular Component 2023 Zymogen Granule (GO:0042588)
GO Molecular Function 2023
Serine-Type Endopeptidase Activity (GO:0004252)
MGI Mammalian
Phenotype Level 4
2021
abnormal pancreas physiology MP:0002693
Human Phenotype Ontology Steatorrhea (HP:0002570)
Jensen TISSUES Pancreatic juice
Jensen DISEASES Pancreatitis
These pathways are very similar to those found in the Tumor vs. Normal sample differential gene expression analysis. This makes sense as we are still comparing tumor and normal samples (but only those of a certain sex).
Once again, differentially expressed pathways such as “Pancreatic Secretion,” “Protein digestion and absorption,” “abnormal pancreas physiology,” “Pancreatic Juice,” and “Pancreatitis” support the notion that the methods that we used produced reasonable results, as these differentially expressed pathways are related to pancreatic function.
The pathway “Extracellular Matrix Organization” was found to be upregulated along with “Collagen-Containing Extracellular Matrix (GO:0062023),” which is not surprising for the reasons outlined in the Tumor vs. Normal section. Also, the “Syndecan 1” pathway is upregulated like it was in Tumor vs. Normal sample differential gene expression analysis.
Platelet-derived Growth Factor (PDGF) and PlateletDerived Growth Factor Receptors (PDGFRs) have been associated with a variety of diseases, including cancer (Andrae et al., 2008).
PDGFR genes have been found to be expressed in the stromal compartment of various cancers, including pancreatic cancer, and PDGF has been found to be expressed in the neoplastic component of tumors (Andrae et al., 2008). Therefore, it makes sense that this pathway is associated with genes upregulated in cancer.
Differential Gene Regulatory Network Analysis between Male Tumor and Male Normal Samples
The “Hedgehog Signaling Pathway” and “Voltage-gated Potassium channels” were found to be related to the genes in the gene regulatory network. The Hedgehog Signaling Pathway plays a role in signal transmission from the cell membrane to the nucleus. It plays a role in the change between activator and repressor forms of glioma-associated oncogene transcription factors. Deregulation of the pathway has been associated with the progression and development of many types of cancers, including pancreatic cancer (Skoda et al., 2018).
Voltage-gated Potassium channels have also been found to play a role in cancer. They are proteins on the cell membrane that facilitate ion flow based on electrochemical gradients. Kv1.3 channels have been found to be overexpressed in pancreatic cancer. Suppression of Kv1.3 channels leads to apoptosis. Kv11.1 channels have also been found to be overexpressed in pancreatic cancer, and they regulate apoptosis and cell proliferation in cancer cells (Zúñiga et al., 2022). Future research could look into targeting potassium channels and the Hedgehog Signaling pathway. These seem to play a role in cancer, especially in males.
Female Tumor vs. Female Normal
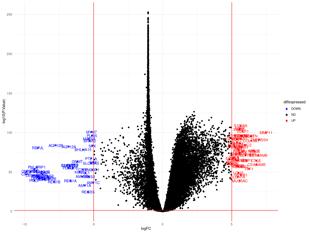
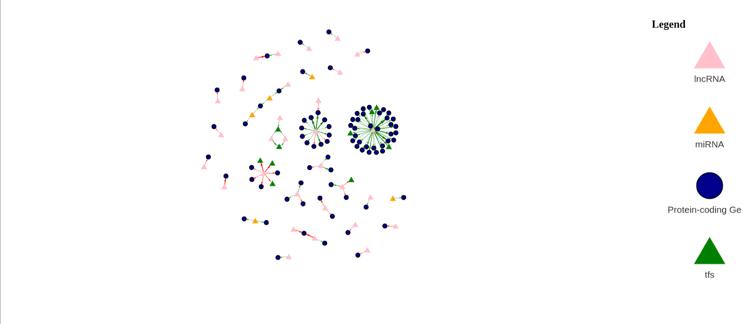
Figure 15a: Differential Gene Expression Volcano Plot between Female Tumor and Female Normal samples. Upregulated (expressed more in tumor samples) genes are labeled and colored red, while downregulated (expressed more in normal samples) genes are labeled and colored blue.
Figure 15b: Differential Gene Regulatory Network between Female Tumor and Female Normal samples. lncRNA are denoted by a pink triangle, miRNAs are denoted by orange triangles, transcription factors are denoted by a green triangle, and protein-coding genes are denoted by the blue circles. Arrows between regulator elements are red if the differential correlation is negative and is green if the differential correlation is positive.
The upregulated genes in the volcano plot (Figure 15a) are those that are expressed more in tumor samples than in normal samples. The downregulated genes are those that are expressed more in normal samples than in tumor samples. There are 51 upregulated genes and 49 downregulated genes. In the gene regulatory network (Figure 15b), there are 118 genes.
Differential Gene Expression Analysis between Female Tumor and Female Normal Samples
Table 5: Selected Pathways from Female Tumor vs. Female Normal Sample Differential Gene Expression Analysis
Gene Set Library Pathway
Upregulated Pathways
Reactome 2022 Extracellular Matrix Organization RHSA-1474244
BioPlanet 2019
Beta-1 integrin cell surface interactions Syndecan 1 pathway
WikiPathway 2023 Human Pancreatic Cancer Subtypes WP5390
KEGG 2021 Human Protein digestion and absorption
MSigDB Hallmark 2020 Epithelial Mesenchymal Transition
GO Biological Process 2023 Extracellular Structure Organization (GO:0043062)
Downregulated Pathways
GO Cellular Component 2023
GO Molecular Function 2023
Reactome 2022
Bioplanet 2019
WikiPathway 2023
KEGG 2021
CollagenContaining Extracellular Matrix (GO:0062023)
Platelet-Derived Growth Factor Binding (GO:0048407)
Digestion R-HSA8935690
Pancreatic Secretion
PTF1A Related Regulatory Pathway WP4147
Pancreatic Secretion
Elsevier Pathway Collection Gastric and Pancreatic Lipase Function
GO Biological Process 2023
GO Molecular Function 2023
Proteolysis (GO:0006508)
Serine-Type Endopeptidase
Activity (GO:0004252)
MGI Mammalian Phenotype Level 4 2021 abnormal pancreas physiology MP:0002693
Jensen Tissues Pancreatic Juice
Jensen Compartments Extracellular Space
Jensen Diseases Pancreatitis
The differentially expressed pathways between Female Tumor and Female Normal samples are almost the same as those between Male Tumor and Male Normal samples.
Differential Gene Regulatory Network Analysis between Female Tumor and Female Normal Samples
Although we did not find many differences at the level of gene expression, there is a notable pathway in the gene regulatory network: “HIF1A And PPARG Regulation Of Glycolysis WP2456.” Treatments targeting HIF1A and PPARG may be particularly effective in females. HIF1A (Hypoxia inducible factor 1 alpha) is a transcription factor that interacts with other transcription factors to increase gene expression in hypoxic cancer cells (cancer cells in a low oxygen environment) (Zhang et al., 2022). HIF1A has been found to play a role in activating increased glucose uptake and angiogenesis, which promote cancer cell survival (Zhang et al., 2022).
The gene PPARG encodes for proliferator-activated receptor γ, which regulates adipocyte differentiation and has also been found to play a role in many types of cancer (including pancreatic cancer), particularly as a tumor suppressor (HernandezQuiles et al., 2021).
Conclusions/Future Directions
The results confirmed previous knowledge about pancreatic cancer and offered a few possible pathways that might be differentially expressed between males and females with pancreatic cancer.
Future directions include experimentally confirming these results using methods such as ChIP-Seq and CRISPR. Alternatively, we could look at other factors that may affect the presentation of pancreatic cancer. The metadata provided by recount3 provides information about each sample other than sex, such as patient location, race, and age.
Treatments could be developed that target the pathways that have been found to have been upregulated in pancreatic cancer. We could also develop new therapeutic agents that target sex-specific genetic elements in pancreatic cancer, potentially improving the quality of treatment.
Code and Data Availability
All code used in this project is publicly available on GitHub: https://github.com/chit-sudeep/pancreatic-cancer-sexfinal.
Bibliography
Andrae, J., Gallini, R., & Betsholtz, C. (2008). Role of plateletderived growth factors in physiology and medicine. Genes & development, 22(10), 1276–1312. https://doi.org/10.1101/gad.1653708
Chen, E. Y., Tan, C. M., Kou, Y., Duan, Q., Wang, Z., Meirelles, G. V., Clark, N. R., & Ma’ayan, A. (2013). Enrichr: interactive and collaborative HTML5 gene list enrichment analysis tool. BMC Bioinformatics, 14(1), 128. https://doi.org/10.1186/1471-2105-14128
Chen, X., Ulintz, P. J., Simon, E. S., Williams, J. A., & Andrews, P. C. (2008). Global topology analysis of pancreatic zymogen granule membrane proteins. Molecular & cellular proteomics : MCP, 7(12), 2323–2336. https://doi.org/10.1074/mcp.M700575MCP200
Deniz, E., & Erman, B. (2016). Long noncoding RNA (lincRNA), a new paradigm in gene expression control. Functional & Integrative Genomics, 17(2–3), 135–143. https://doi.org/10.1007/s10142-016-0524-x
Gonzalez, H., Hagerling, C., & Werb, Z. (2018). Roles of the immune system in cancer: from tumor initiation to metastatic progression. Genes & development, 32(19-20), 1267–1284. https://doi.org/10.1101/gad.314617.118
GTEx Consortium. (2017). Genetic effects on gene expression across human tissues. Nature, 550, 204–213. https://doi.org/10.1038/nature24277
Hernandez-Quiles, M., Broekema, M. F., & Kalkhoven, E. (2021). PPARgamma in Metabolism, Immunity, and Cancer: Unified and Diverse Mechanisms of Action. Frontiers in Endocrinology (Lausanne), 12, 624112. https://doi.org/10.3389/fendo.2021.624112
Huber, W., von Heydebreck, A., Sültmann, H., Poustka, A., & Vingron, M. (2002). Variance stabilization applied to microarray data calibration and to the quantification of differential expression. Bioinformatics, 18(Suppl 1), S96–S104. https://doi.org/10.1093/bioinformatics/18.suppl_1.s96
Ilic, I., & Ilic, M. (2022). International patterns in incidence and mortality trends of pancreatic cancer in the last three decades: A joinpoint regression analysis. World journal of gastroenterology, 28(32), 4698–4715. https://doi.org/10.3748/wjg.v28.i32.4698
Kanarek, N., Keys, H. R., Cantor, J. R., Lewis, C. A., Chan, S. H., Kunchok, T., Abu-Remaileh, M., Freinkman, E., Schweitzer, L. D., & Sabatini, D. M. (2018). Histidine catabolism is a major determinant of methotrexate sensitivity. Nature (London), 559(7715), 632–636. https://doi.org/10.1038/s41586-018-0316-7
Kuleshov, M. V., Jones, M. R., Rouillard, A. D., Fernandez, N. F., Duan, Q., Wang, Z., Koplev, S., Jenkins, S. L., Jagodnik, K. M., Lachmann, A., McDermott, M. G., Monteiro, C. D., Gundersen, G. W., & Ma'ayan, A. (2016). Enrichr: a comprehensive gene set enrichment analysis web server 2016 update. Nucleic acids research, 44(W1), W90–W97. https://doi.org/10.1093/nar/gkw377
Lambert, S. A., Jolma, A., Campitelli, L. F., Das, P. K., Yin, Y., Albu, M., Chen, X., Taipale, J., Hughes, T. R., & Weirauch, M. T.
(2018). The Human Transcription Factors. Cell, 172(4), 650–665. https://doi.org/10.1016/j.cell.2018.01.029
Lopes-Ramos, C. M., Kuijjer, M. L., Ogino, S., Fuchs, C. S., DeMeo, D. L., Glass, K., & Quackenbush, J. (2018). Gene Regulatory Network Analysis Identifies Sex-Linked Differences in Colon Cancer Drug Metabolism. Cancer research, 78(19), 5538–5547. https://doi.org/10.1158/0008-5472.CAN-18-0454
Love, M.I., Huber, W. & Anders, S. (2014). Moderated estimation of fold change and dispersion for RNA-seq data with DESeq2. Genome Biol 15, 550. https://doi.org/10.1186/s13059-014-0550-8
Meng, L., Liu, B., Ji, R., Jiang, X., Yan, X., & Xin, Y. (2019). Targeting the BDNF/TrkB pathway for the treatment of tumors. Oncology letters, 17(2), 2031–2039. https://doi.org/10.3892/ol.2018.9854
O’Brien, J. A., Hayder, H., Zayed, Y., & Peng, C. (2018). Overview of MicroRNA biogenesis, mechanisms of actions, and circulation. Frontiers in Endocrinology, 9, 402. https://doi.org/10.3389/fendo.2018.00402
Patel, K., Siraj, S., Smith, C., Nair, M., Vishwanatha, J. K., & Basha, R. (2019). Pancreatic Cancer: An Emphasis on Current Perspectives in Immunotherapy. Critical reviews in oncogenesis, 24(2), 105–118. https://doi.org/10.1615/CritRevOncog.2019031417
Pijnappel, E. N., Schuurman, M., Wagner, A. D., de Vos-Geelen, J., van der Geest, L. G. M., de Groot, J. B., Koerkamp, B. G., de Hingh, I. H. J. T., Homs, M. Y. V., Creemers, G. J., Cirkel, G. A., van Santvoort, H. C., Busch, O. R., Besselink, M. G., van Eijck, C.
H. J., Wilmink, J. W., & van Laarhoven, H. W. M. (2022). Sex, Gender and Age Differences in Treatment Allocation and Survival of Patients With Metastatic Pancreatic Cancer: A Nationwide Study. Frontiers in oncology, 12, 839779. https://doi.org/10.3389/fonc.2022.839779
Popova, N. V., & Jücker, M. (2022). The Functional Role of Extracellular Matrix Proteins in Cancer. Cancers, 14(1), 238. https://doi.org/10.3390/cancers14010238
Ritchie, M. E., Phipson, B., Wu, D., Hu, Y., Law, C. W., Shi, W., & Smyth, G. K. (2015). limma powers differential expression analyses for RNA-sequencing and microarray studies. Nucleic Acids Research, 43(7), e47. https://doi.org/10.1093/nar/gkv007
Sakikubo, M., Furuyama, K., Horiguchi, M., Hosokawa, S., Aoyama, Y., Tsuboi, K., Goto, T., Hirata, K., Masui, T., Dor, Y., Fujiyama, T., Hoshino, M., Uemoto, S., & Kawaguchi, Y. (2018). Ptf1a inactivation in adult pancreatic acinar cells causes apoptosis through activation of the endoplasmic reticulum stress pathway. Scientific Reports, 8(1), 15812. https://doi.org/10.1038/s41598018-34093-4
Seal, R. L., Braschi, B., Gray, K., Jones, T. E. M., Tweedie, S., Haim-Vilmovsky, L., & Bruford, E. A. (2023). Genenames.org: the HGNC resources in 2023. Nucleic Acids Research, 51(D1), D1003–D1009. https://doi.org/10.1093/nar/gkac888
Skoda, A. M., Simovic, D., Karin, V., Kardum, V., Vranic, S., & Serman, L. (2018). The role of the Hedgehog signaling pathway in cancer: A comprehensive review. Bosnian journal of basic medical sciences, 18(1), 8–20. https://doi.org/10.17305/bjbms.2018.2756
Stanford, S. M., Rapini, N., & Bottini, N. (2012). Regulation of TCR signalling by tyrosine phosphatases: from immune homeostasis to autoimmunity. Immunology, 137(1), 1–19. https://doi.org/10.1111/j.1365-2567.2012.03591.x
Subramanian, A., Tamayo, P., Mootha, V. K., Mukherjee, S., Ebert, B.L., Gillette, M. A., Paulovich, A., Pomeroy, S. L., Golub, T. R., Lander, E. S., & Mesirov, J. P. (2005). Gene set enrichment analysis: A knowledge-based approach for interpreting genomewide expression profiles. Proceedings of the National Academy of Sciences, 102(43), 15545-15550. https://doi.org/10.1073/pnas.0506580102
Szatmári, T., Ötvös, R., Hjerpe, A., & Dobra, K. (2015).
Syndecan-1 in Cancer: Implications for Cell Signaling, Differentiation, and Prognostication. Disease markers, 2015, 796052. https://doi.org/10.1155/2015/796052
The Cancer Genome Atlas Research Network., Weinstein, J. N., Collisson, E. A., Mills, G. B., Shaw, K. R. M., Ozenberger, B. A., Ellrott, K., Shmulevich, I., Sander, C., & Stuart, J. M. (2013). The Cancer Genome Atlas Pan-Cancer analysis project. Nature Genetics, 45(10), 1113–1120. https://doi.org/10.1038/ng.2764
Vincent, A., Herman, J., Schulick, R., Hruban, R. H., & Goggins, M. (2011). Pancreatic cancer. Lancet (London, England), 378(9791), 607–620. https://doi.org/10.1016/S01406736(10)62307-0
visNetwork, an R package for interactive network visualization. Datastorm Open. (n.d.). Retrieved April 12, 2024, from https://datastorm-open.github.io/visNetwork/
Wang, Z., Snyder, M., & Gerstein, M. (2009). RNA-Seq: a revolutionary tool for transcriptomics. Nature Reviews. Genetics, 10, 57–63. https://doi.org/10.1038/nrg2484
Wickham, H. (2016). Ggplot2: Elegant graphics for data analysis (2nd ed.) [PDF]. Springer International Publishing.
Wilks, C., Zheng, S. C., Chen, F. Y., Charles, R., Solomon, B., Ling, J. P., Imada, E. L., Zhang, D., Joseph, L., Leek, J. T., Jaffe, A. E., Nellore, A., Collado-Torres, L., Hansen, K. D., & Langmead, B. (2021). recount3: summaries and queries for largescale RNA-seq expression and splicing. Genome Biology, 22(1), 323–323. https://doi.org/10.1186/s13059-021-02533-6
Xie, Z., Bailey, A., Kuleshov, M. V., Clarke, D. J. B., Evangelista, J. E., Jenkins, S. L., Lachmann, A., Wojciechowicz, M. L., Kropiwnicki, E., Jagodnik, K. M., Jeon, M., & Ma'ayan, A. (2021). Gene Set Knowledge Discovery with Enrichr. Current protocols, 1(3), e90. https://doi.org/10.1002/cpz1.90
Yin, X., Xu, R., Song, J., Ruze, R., Chen, Y., Wang, C., & Xu, Q. (2022). Lipid metabolism in pancreatic cancer: emerging roles and potential targets. Cancer communications (London, England), 42(12), 1234–1256. https://doi.org/10.1002/cac2.12360
Zhang, Y., Wang, S., Hu, H., & Li, X. (2022). A systematic study of HIF1A cofactors in hypoxic cancer cells. Scientific Reports, 12(1), 18962. https://doi.org/10.1038/s41598-022-23060-9
Zhong, X., Narasimhan, A., Silverman, L. M., Young, A. R., Shahda, S., Liu, S., Wan, J., Liu, Y., Koniaris, L. G., & Zimmers, T. A. (2022). Sex specificity of pancreatic cancer cachexia phenotypes, mechanisms, and treatment in mice and humans: role
of Activin. Journal of cachexia, sarcopenia and muscle, 13(4), 2146–2161. https://doi.org/10.1002/jcsm.12998
Zúñiga, L., Cayo, A., González, W., Vilos, C., & Zúñiga, R. (2022). Potassium Channels as a Target for Cancer Therapy: Current Perspectives. OncoTargets and therapy, 15, 783–797. https://doi.org/10.2147/OTT.S326614