
Aparna Deokar
Senior Thesis | 2024

Investigating HIV Defective Viruses through CRISPR-Cas9 and Self Inactivating Vectors
Aparna Deokar Boston University Academy
Abstract:
Antiretroviral therapies (ART) have drastically helped human immunodeficiency virus (HIV) patients live healthier and longer lives. However, these treatments only prevent viral replication and are not able to eliminate all infected cells, a step necessary to cure and eradicate HIV. Specifically, a subset of targeted cells become latently infected, establishing a persistent proviral reservoir. Upon the discontinuation of treatment, these cells reactivate and rebound disease progression, contributing to the chronic aspect of the disease. Defective proviruses, which are unable to produce infectious virus particles due to deleterious mutations primarily in the LTR regions, have been found to make up over 90% of this latent reservoir. So, determining whether defective proviruses are expressed and if they contribute to HIV chronic disease is crucial. We have generated two main tools to generate defective proviruses in order to gain insights into their contribution, CRISPR-Cas9 gene editing and self-inactivating (SIN) vectors. In the first part of these experiments, CRISPR-Cas9 was used to engineer T-cells and Jurkat cells with defective HIV proviral genomes lacking 5’ LTRs, and real-time quantitative polymerase chain reaction (RT-qPCR) was used to quantify the expression of the isolated cDNA. A second method was SIN vectors, which generate defective proviruses upon infection. Mutations were induced in the viral genome in order to prevent 3’ LTR-mediated transcription and force transcription only from intragenic elements downstream. The SIN vectors were then used to infect jurkat cells, and isolated DNA
and RNA was tested for integration and expression. Both methods were found to be at least partially successful and should be explored more; in the CRISPR experiment, defective proviruses were shown to induce specific parts of both types of interferon responses, and in the SIN vector experiment, high levels of integration were observed.
Introduction:
With 39 million people living with human immunodeficiency virus (HIV) worldwide and 1.3 million new diagnoses each year as of 2022, HIV has been one of the world’s most significant epidemics since the first reported case in 1981.
The replication cycle of HIV, as seen in Figure 1, includes seven steps: binding, fusion, reverse transcription, integration, replication, assembly, and budding. HIV infection is initiated by the binding of the virion envelope (Env) to the CD4+ receptor and the chemokine coreceptors, CXCR4 or CCR5, on the surface of the host cell. This binding then triggers fusion of the virion and host cell lipid membranes. Next, as with all retroviruses, the reverse transcriptase contained by the virion makes a complementary DNA copy of the proviral RNA genome. Then, another retroviral enzyme, integrase, catalyzes the integration of the proviral cDNA into the host genomic DNA, establishing itself in the host cell permanently. Through the host cell, the virus can now produce copies of its proviral genome. The HIV-1 promoter is located in the long terminal repeat (LTR) and contains cis-acting sequences that regulate transcription. The 5’-end acts as an enhancer and promoter to begin transcription, and while the 5’ LTR activity is inefficient at first, formation of the trans-acting response region and polyadenylation in the 3’ LTR region dramatically enhances transcription. At the surface of the cell, the viral RNA copies are
assembled into immature HIV, and corresponding proteins. Lastly, these particles are released from the host cell, and HIV protease in the new provirus is activated, making the virion fully mature.1
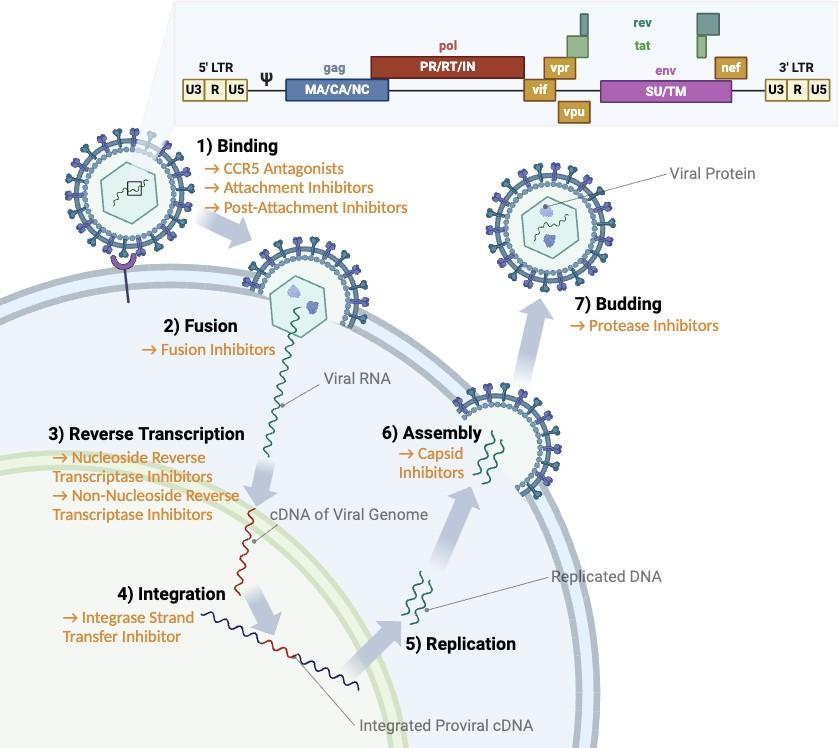
Fig. 1: Replication Cycle of HIV with Current ART Treatments. The main steps are indicated, as well as antiretroviral therapies targeting specific processes. The callout shows the main regions of the HIV-1 genome, including the 5’ LTR (targeted by CRISPR-Cas9 editing), the 3’ LTR (targeted by SIN vectors), Gag (used in the Alugag PCR), and Env (deleted as a positive control for the CRISPR experiment).5
Infection of host cells triggers cell death, and this response is rapidly amplified as the mature virions spread infection. Since host cells are typically CD4+ T-cells, lymphocytes that regulate multiple immune functions, compromising these cells and their functions leads to immune deficiencies. Untreated, HIV infection will progress to Acquired Immunodeficiency Syndrome (AIDS). As shown in Figure 1, antiretroviral therapies (ART) prevent viral replication by targeting crucial proteins, like reverse transcriptase, which reduces viral load and restricts disease progression. ART helps patients live healthier lives and has drastically increased patient life expectancy. However, ART has drawbacks. Even during treatment, patients can experience serious comorbidities, especially of the central nervous system and heart.2 Furthermore, HIV can only be fully eradicated from the host through the elimination of infected cells, and antiretroviral therapy is slow at diminishing the viral reservoir. A subset of targeted cells become latently infected, establishing a persistent proviral reservoir that reactivates and and rebounds disease progression upon the discontinuation of treatment, contributing to the chronic aspect of the disease.3
Over 90% of cells in this latently infected reservoir have been found to be defective, unable to produce infectious virus particles, even with an integrated HIV proviral genome, due to deleterious mutations primarily in the LTR regions.3 However, as Kuniholm et al. discovered, intragenic promoters in the HIV genome of defective proviruses induce transcription as well as the expression of RNA and proteins.4 We hypothesize that the transcription and expression of defective proviruses via intragenic promoters may be contributing to inflammation, which we see in patients chronically infected with HIV and with comorbidities, even those being treated by ART.
To address the above hypothesis, two different tools were used to engineer cells with defective proviral genomes, specifically genomes with LTR mutations. CRISPR-Cas9 was used in the first part of these experiments to engineer cells with defective HIV proviral genomes lacking 5’ LTRs, and real-time quantitative polymerase chain reaction (RT-qPCR) was used to quantify the expression of genes related to inflammation from these genetically edited T-cell and Jurkat samples. Another path of studying defective viruses is through self-inactivating (SIN) vectors, which were investigated in the second part of this experiment. Mutations were induced in the viral genome, specifically the 3’ LTR region, in order to induce mutations in the 5’ LTR region and force transcription only from intragenic elements downstream; these SIN vectors were used to infect Jurkat cells. Isolated DNA and RNA from these viruses was then tested for integration, a necessary step for the efficient spreading of infection that should be particularly studied in defective viruses.6 So, both of these experiments explored expression of defective viruses and if they contribute to chronic HIV pathogenesis, including persistent inflammation.
Methods:
Cell Culture
CD4+ T cells, used for the CRISPR experiment, were isolated from peripheral blood mononuclear cells (PBMCs) from leukapheresis packs, using Lymphoprep Ficoll density gradient separation to isolate monocytes followed by negative immunomagnetic cell selection with EasySep™ Human T-Cell Isolation Kit beads. Then, T-cells were activated with CD3/CD28 beads, added at a 1:1 bead to cell ratio and magnetically separated from the cells. Both Jurkat cells, used for both experiments, and Tcells were maintained and cultured in Dulbecco’s Modified Eagle Medium (DMEM) with 10% fetal bovine serum (FBS).
Viruses
For the CRISPR experiment, NL43-VSVg-ΔEnv-GFP (a control lacking the Env region containing intragenic promoters) and NL43-VSVg, which are both molecularly cloned HIV, were used. These virus stocks were prepared by transfecting HEK293 T-cells using PEI transfection reagent, concentrating viruses by layering viral supernatant on PBS+20% sucrose, and titrating virus using CEM-GFP cells. For the SIN vector experiments, a positive control HIV-1 Bru virus (non-replicating HIV isolate) was used along with the two SIN vectors (5’ deficient HIV-1 LTR proviral plasmids).
Gene-Editing with CRISPR-Cas9
In the T-cell experiment, 6 conditions were used: a scrambled mock, a mock with the LTR deletion, a scrambled wild type, a wild type with the LTR deletion, a scrambled envelope deletion, and an envelope deletion with the LTR deletion. In the Jurkat experiment, these same conditions were used. The methods of preparation, including the virus used for infection and gRNA sites.
Cells were infected through spinnocculation; after plating the cultures in a 12-well plate, DNAse was added, and 30 minutes later, virus, either 4 μL of NL43-VSVg or 1 μL of NL43-VSVg-ΔEnv-GFP, was added, and the mixture was centrifuged at 1,200 xg for 90 minutes. These infected cells were then resuspended in 1 mL RPMI + 10% FBS, replated, and incubated overnight.
At this time, the ribonucleoproteins (RNPs) were prepared by mixing 36 μL of 1 μM Cas9 stock, 36 μL of 1 μM guide RNA (either 18 μL LTR + 18 μL GAG or 36 μL scrambled), and 528 μL Optimem medium. Then, lipofection was performed; 400 μL of a lipofection mix consisting of 600 μL RNPs, 28.8 μL Lipofectamine
reagent, and 571.2 μL Optimem was added to each well to attain either the scrambled or LTR deletion conditions.
Table 1. Preparation of conditions for T-cell and Jurkat CRISPR experiments by virus infection and guide RNA specified sites.
Conditions
Virus Used for Infection gRNA type
Scrambled mock None Scrambled
LTR-deleted mock None LTR + GAG
Scrambled wild-type
LTR-deleted wildtype
Scrambled Envdeletion wild-type
LTR-deleted Envdeletion wild-type
NL43-VSVg Scrambled
NL43-VSVg LTR + GAG
NL43-VSVg-ΔEnvGFP Scrambled
NL43-VSVg-ΔEnvGFP LTR + GAG
Infection with the SIN vectors
Jurkat cells were spinfected with the spinnocculation protocol above on two six-well plates. The following virus conditions were implemented: SIN vector 1 (4 replicates), SIN vector 2 (4 replicates), Bru-virus as a positive control, and negative controls (3 replicates). The two SIN vectors were very similar, both including mutations in the 3’ LTR region, and only had small differences in the way they were cloned; while SIN vector 1 targeted only the NF-kB binding site, SIN vector 2 additionally targeted the SP1 binding site.
DNA/RNA Isolation
Cells were lysed in Zymo Kit Lysis buffer and RNA (for the CRISPR experiment) and DNA (for the SIN vector experiment) were harvested using the Zymo Kit.
cDNA Preparation and RT-qPCR for CRISPR Experiment
Since the RT-qPCR is run on cDNA samples, the isolated RNA was converted into complementary DNA. In this procedure, 500 ng (13 μL) of diluted RNA samples and 4 μL of RT1 mastermix (Random primers, Polyd(T) primers, dNTP mix) was mixed together in a PCR strip; 4 μL of this mixture was added to empty PCR strip wells, which were designated the NRT condition. All of the strips then underwent PCR. Next, 8 μL of RT2a mastermix (5x 1st strand buffer, DTT, RNAsein/RNAseout, nuclease free water, and Superscript II RT enzyme) was added to half of the wells (RT wells), while 2.66 μL of RT2b mastermix (5x 1st strand buffer, DTT, RNAsein/RNAseout, and nuclease free water) was added to the other half of the wells.
Another, longer, PCR program was run on these samples.
Then, the RT-qPCR was performed to quantify gene expression levels. As in any PCR, the objective of this assay is to rapidly amplify a specific segment of DNA through three main steps: denaturation, annealing, and extension. First, the samples are heated to a point where they denature: the two strands of DNA separate. Next, the primers are added to the samples and anneal to the DNA strands, with forward and reverse primers annealing to complementary strands. Third, the DNA polymerase enzyme added to the samples extends complementary strands from the primers forward, and this process repeats. qPCR additionally has a quantitative aspect; during each amplification cycle, the amounts of DNA are recorded. A cycle threshold (CT) value, the number of cycles needed to exceed a background level of DNA amplification,
is calculated and can be compared across samples.
Each well included 5 μL of cDNA samples and 10 μL of mastermix, where the mastermix includes 37.5 μL of 10 μM forward primer, 37.5 μL of 10 μM reverse primer, and 187.5 μL of SYBR green master mix, which in turn is a mix of buffer, dNTPs, thermostable hot-start DNA polymerase, and SYBR green dye. For the T-cell experiment, there were 6 samples, as well as 4 primers for the genes of interest, IP10, ISG15, MX1, and RPL13a, (primer sequences found in Table 2) and there were triplicates of each condition. RPL13a was used as the “housekeeping gene,” an internal control. For the Jurkat experiment, there were 16 samples, 8 normal versions in addition to 8 versions without reverse transcriptase to be used as controls, as well as three primers, IP10, ISG15, and the housekeeping RPL13a; the normal conditions each had triplicates, while the NRT versions had no replicates. The Thermo Fisher QuantStudio™ 3
Real-Time PCR System was used to run the PCR.
Table 2. Primer sequences (forward and reverse) for RT-qPCR.
Primer
Primer Sequences
IP10 F CGAAGGCCATCAAGAATTTACTG
IP10 R CCATCCTTGGAAGCACTG
ISG15 F TCCTGGTGAGGAATAACAAGGG
ISG15 R GTCAGCCAGAACAGGTCGTC
MX1 F GTTTCCGAAGTGGACATCGCA
MX1 R CTGCACAGGTTGTTCTCAGC
RPL13a F CAAGCGGATGAACACCAAC
RPL13a R CGCTTTTTCTTGTCGTAGGG
Alu-gag PCR for SIN Vector Experiment
An Alu-gag PCR was used to determine whether integration of the SIN vectors occurred, using the protocol described in Lizewski et al.6,7 In this assay, two nested PCRs are performed. After isolating genomic DNA from HIV-infected cells, the first PCR is performed with two primers, one that anneals to Alu, and one that anneals to gag. Alu is a sequence in the human genome that repeats approximately every 5000 base pairs, and gag is an HIV-specific gene that encodes the structural components of the HIV virion particle. So, in gDNA with integrated HIV DNA, the region between Alu and gag is amplified by PCR as shown in Figure 2.
In the first reaction, 10 μL of mastermix (with 1% DreamTaqpolymerase) and 10 μL of samples were added to each well. The first five rows of the plate had Alu-gag mastermix, while the last three had Gag-only mastermix. Four columns had sample added to them: one had a serially diluted Integrated Standard (IS) stock DNA diluted with 10 mM tris-HCl and 2 μg/mL PBMC DNA at a 1:5 ratio where the topmost dilution was 3 μg/mL, and the other three columns included the three DNA samples that had been extracted from cells infected with the two SIN vectors and the Bru control. This plate was run on a thermocycler with a hold stage of 95 C for 4 minutes, a PCR stage of 20 cycles (93 C for 15 seconds, 60 C for 15 seconds, 72 C for 2 minutes and 15 seconds), and a hold stage at 4 C. The second PCR reaction had 10 μL of R-U5 mastermix added and 10 μL of sample added to all wells. The four columns from the previous PCR were transferred to this plate as well as two additional columns, a serially diluted NL43
standard at a 1:10 ratio starting with 250,000 copies and a serially diluted non-preamplified IS standard. This plate was run on the
qPCR machine for a hold stage of 95 C for 2 minutes, a PCR stage of 50 cycles (95 C for 15 seconds, 60 C for 30 seconds, 72 C for 1 minute), and a hold stage at 4 C. Although the original protocol included an Albumin PCR to determine DNA concentration following extraction, this was replaced by using a NanoDrop spectrophotometer, since it was more efficient.
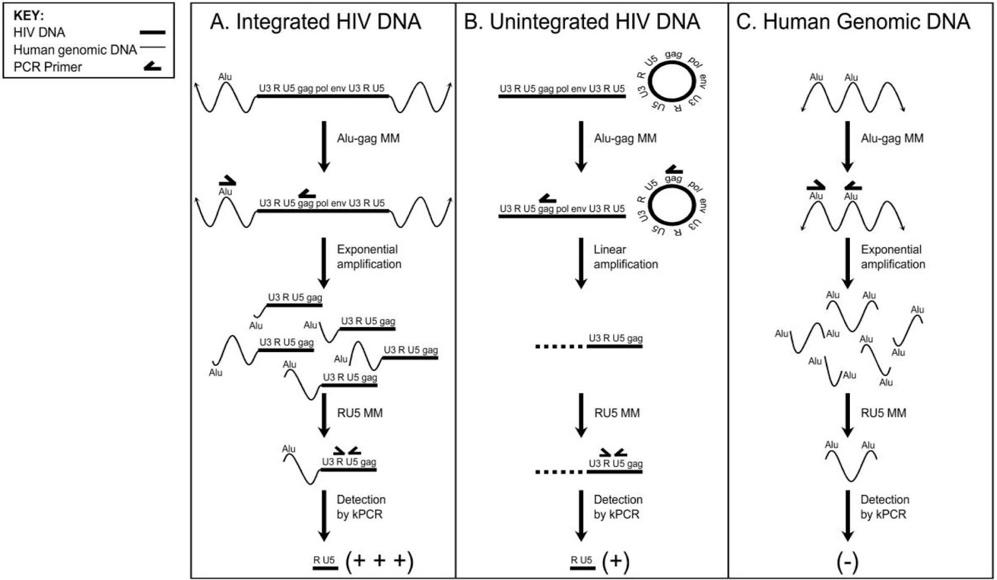
Fig. 2: Expected results of A) Integrated HIV DNA, B) Unintegrated HIV DNA, C) Human gDNA. In integrated DNA, the sequence between Alu and gag will be amplified exponentially; in unintegrated DNA, the sequence in the HIV genome before gag will be amplified linearly; and in human genomic DNA, the sequence between two Alu elements will be amplified exponentially. Then, another PCR is used to detect the HIV genomespecific sequence between the R and U5 regions of the long-terminal repeat (LTR).6
Through linear regression and basic statistical analysis, the raw data in terms of average CT values for each sample was converted
to average values for HIV copy number/cell for each sample with corresponding confidence intervals. The natural logarithm of these CT values was plotted against the natural logarithm of copy numbers, which is the concentration of provirus/well. This graph for the NL43 standard, shown in Figure 5, is linear with the equation ln(copy number, NL43) = -15.5 ln(ct, NL43) + 55.3, indicating an exponential relationship between the CT value and copy number R^2=0.995. Based on this equation, a counterpart was found for the IS No Pre samples, ln(copy number, IS) = -15.5 ln(CT, IS) + 55.3, which can then be used to find predicted ln(copy number, IS) values from the IS CT value data. Since the concentrations were the same for corresponding IS No Pre and IS Pre samples, ln(copy number, IS) = ln(copy number, IS Pre). The ln(copy number, IS Pre) and ln(CT, IS Pre) values were used to find the equation ln(copy number, IS Pre) = -3.51 ln(CT, IS Pre) + 13.6, which has R^2= 0.888. This last equation, written as ln(copy number, sample) = -3.51 ln(CT, sample) +
13.6, along with the sample CT values were used to find the copy number and then the HIV copy number/cell values. The 95% confidence intervals were found by the equation e^(3.51×(average(ln(CT,sample))±stdev(ln(CT,sample))+13.6)).6
Results and Discussion:
CRISPR-Cas9 T-cell RT-qPCR Experiment:
To test the hypothesis that transcription and expression of defective proviruses via intragenic promoters contributes to inflammation, CRISPR-Cas9 was used to engineer T-cells and Jurkat cells with defective HIV proviral genomes lacking 5’ LTRs, and RT-qPCR was used to quantify the expression of genes related to host interferon response, a major innate immune pathway that is
induced by viral infections and has been associated with initiating inflammation.
The general procedure of the CRISPR-Cas9 technique is as follows. A specific guide RNA is created to recognize the sequence of the genome in question that will be edited, here, the HIV proviral genome. This guide RNA is attached to the Cas9 endonuclease, which cleaves the DNA. Then, deletion, modification, or insertion is induced. Here, the 5’ LTR sequence at the start of the HIV genome, which is the canonical promoter and enhancer for transcription of the HIV provirus, is deleted by cleavage at gag and LTR sites to create defective proviruses.
Scrambled guide RNA, which does not have a specific complementary sequence to recognize and direct the Cas9 protein to cleave, was used as a negative editing control. Mock conditions, which are not infected with virus, were used as controls for the background signal of our assay and are expected to have no expression, as opposed to wild-type conditions, which are infected and are expected to have expression based on other conditions they are subjected to.
Env-deletions, in which the Env gene is replaced, were used as positive controls; if the condition lacks the Env gene, and thus does not contain the intragenic promoters required for replication and expression, then no antiviral response should be present. NRT counterpart conditions, which lacked the reverse transcriptase necessary for the PCR, were used as negative controls for the PCR and showed the expected extremely low expression.
Through RT-qPCR of the six conditions listed in Table 1, we investigated the expression of IP10, ISG15, and MX1 genes, which are indicative of interferon responses, in these genetically-edited cells. Both IP10 and ISG15 are biomarkers of a host’s innate
immune response. But while ISG15 is a cytokine secreted in response to type I interferon, which is a rapid first line of defense that functions as a warning to uninfected cells, IP10 is a chemokine secreted in response to type II interferon, which is involved in later immune and inflammatory responses.8 MX1 is a GTP-binding protein involved in both type I and type III interferon responses.9
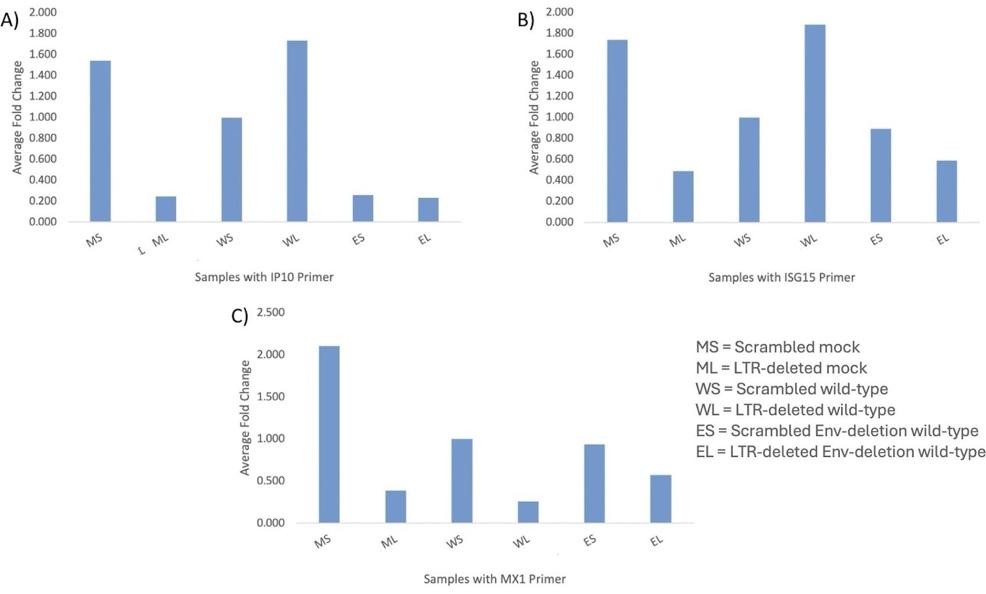
Fig. 3: T-cell experiment. Average standardized fold changes for a scrambled mock, LTR-deleted mock, a scrambled wild-type, LTRdeleted wild-type, scrambled Env-deletion wild-type, and LTRdeleted Env-deletion wild-type conditions for the A) IP10, B) ISG15, and C) MX1 primer with LTR-deleted mock as the baseline condition.
We first did this in T-cells, which, having been isolated directly from blood packs rather than being an immortalized cell line, were most accurate. The key observation from the results in Figure 3 is that the LTR-deleted wild-type condition had a high average fold
change in the IP10 and ISG15 genes. This data was consistent among the triplicates of each condition as well as among the three primers, indicating that results from the PCR step are reliable. Fold change was used as the primary statistic to calculate relative changes in gene expression. It is not directly proportional to expression level, but rather calculated as 2^(-(ΔΔCT)) and doubles with every reduction of a single cycle in ΔCT values.
For example, in a sample with high expression, fewer PCR cycles are needed to reach a threshold value of DNA amplification, indicated by a low CT value and a high fold change. This high expression ultimately indicates that CRISPR-Cas9 was successfully used to model cells which have defective HIV proviral genomes without the 5’ LTR region yet have expression through the use of intragenic promoters.
Furthermore, this was specifically observed in the samples with IP10 and ISG15 primers, indicating a high level of expression of IP10 and ISG15. This suggests that defective proviruses expression can be characterized as influencing both main types of interferon responses, type I and type II. The LTR-deleted wild-type conditions with the MX1 primer did not display this result, with the WL sample having the lowest expression in graph C. MX1 is induced by the type I interferon response, and as suggested by high expression of ISG15 and IP10, this response is
present. However, there are many different signaling pathways associated with the interferon responses, and MX1 seems to not be one of the activated genes; this result provides some specificity as to what parts of the interferon response are affected by the engineering of cells with defective proviral genomes via CRISPR.
Although most other conditions, including the LTR-deleted mock condition, have an expected low level of expression, the scrambled mock condition has an unexpectedly high level of expression. One possible explanation is that none of the samples, mock or wildtype, were actually infected due to a low multiplicity of infection (MOI), and the results seen are background noise. Since other mock and scrambled conditions have low expression, contamination of the sample is a more likely possibility. But, a lack of infection is still possible and could be tested for in future experiments that would include repeating the experiment with a higher MOI and comparing results.
CRISPR-Cas9 Jurkat RT-qPCR Experiment:
This experiment was repeated using the same six conditions in Jurkat cells, an immortalized line of human CD4+ T-cells.
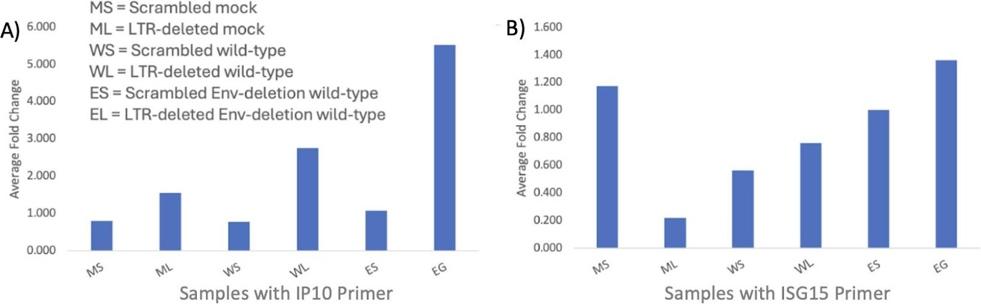
Fig. 4: Jurkat experiment. Average standardized fold changes for each of the six conditions: scrambled mock, a scrambled wild-type, LTR-deleted wild-type, scrambled Env-deletion wild-type, and LTR-deleted Env-deletion wild-type conditions for the A) IP10 and B) ISG15 primers with LTR-deleted mock as the baseline condition.
Both primers, IP10 and ISG15, since MX1 was not tested in this experiment, show higher levels of expression in the LTR-deleted
wild-type condition as compared to the scrambled wild-type condition, supporting the hypothesis and above conclusion that interferon responses are associated with defective proviruses. However, similar to the results of the mock condition in the T-cell experiment, several mock and Env conditions in the Jurkat experiment, shown in Figure 4, have unexpectedly high levels of expression, so future experiments should also include repeating the Jurkat experiment with a higher MOI.
SIN Vector Alu-gag PCR Experiment:
The other tool we used was generating SIN vectors, and to confirm that these SIN vectors integrated and had diminished expression because of LTR mutations, an Alu-gag PCR with the protocol described in Lizewski et al. (illustrated in Figure 2) was used. This assay was used rather than other integration assays like gel separation, inverse PCR, and linker ligation PCR, because the first is laborious with an unclear efficacy, and the latter two lack rigorous background controls for unintegrated DNA.6 Also, due to the abundance of regular Alu sequences, most integration events would be adjacent to an Alu sequence.
Data from the qPCR, which is the last step of the Alu-gag PCR, is in terms of average CT values for each sample. Through linear regression and the basic statistical analysis described in the methods section, the average values for HIV copy number/cell for each sample and corresponding confidence intervals can be determined; these statistics are shown in Table 3 below.

Fig. 5: A) ln(copy number, NL43) vs. ln(CT, NL43); B) ln(copy number, IS Pre) vs. ln(CT, IS Pre); C) ln(CT) vs. ln(copy number) for the SIN Vector 1, SIN Vector 2, and Bru Control samples. As explained above, these plots are used to find the values for HIV copy number/cell, and their linearity shows the expected exponential relationship between copy number and CT values.
It is expected that in integrated DNA, there will be large amounts of this sequence detected; in unintegrated DNA, there will be small amounts, since it was initially only linearly amplified; and in human genomic DNA (the negative control), this will not be present, as in Figure 4. Each of the samples had linear regression plots of ln(CT) vs. ln(copy number) with high R2 values, shown in Figure 5, showing that there is an exponential relationship between CT and copy number values, exactly as expected for integrated DNA samples.
Additionally, the values for HIV copy number/cell for both SIN vector samples indicate that approximately 86% and 49% of the cells in the sample showed integration. These values were in fact larger than the integration in the Bru control sample (31%), an HIV isolate. The optimal result would be significant integration in all samples, and this is what was observed.
Table 3. Average HIV copy number/cell values and copy numbers/sample for the three samples: SIN vector 1, SIN vector 2, and the Bru-infected control.
Sample Type
SIN Vector RNA Products Experiment:
The next step after this SIN vector integration experiment was to investigate RNA products of the SIN vectors. An RT-qPCR doing this was performed by Andrew Leal in the Henderson Lab, resulting in the data shown in Table 4.
Table 4: Average standardized fold changes for SIN vector 1, SIN vector 2, Bru-infected control, and mock negative control.
Sample
SIN Vector 1
SIN Vector 2
It was observed that none of the samples showed significant amounts of expression. For the SIN vectors, this is consistent with the objective of inactivating the 3’ LTR and therefore, along with the Alu-gag PCR data above, indicates that the SIN vector was engineered effectively.
However, there was also low expression in the Bru positive control, which was unexpected. To investigate this, an RT-qPCR was run on Bru samples from three different virus preparations. The Bru sample used to obtain the data in Table 4 was found to be invalid due to problems in preparing that specific sample, since that sample yielded a standardized fold change of 1.2, and the other Bru samples yielded values of 1795.2 and 1300.1, which are significantly larger and match the expected high expression. So, the RT-qPCR performed was accurate, and the conclusion of effectiveness remains intact.
Conclusion:
The CRISPR-Cas9 and SIN vector subprojects both aim to engineer cells with defective proviral genomes, specifically genomes with LTR mutations, in order to study intragenic promoters and effects on interferon response. But, the way in which they do this is different. In the CRISPR method, the 5’ LTR region that contains the main promoters is deleted. In contrast, in the SIN vector method, inactivating mutations are induced in the 3’ LTR, forcing transcription from intragenic promoters.
In this project, it was found that both of these avenues of investigation are at least partially successful. The key observation from the the CRISPR T-cell subproject is that the LTR-deleted wild-type condition had a high level of expression of IP10 and ISG15 in both the T-cell and Jurkat experiments, but not of MX1 in the T-cell experiment, showing that defective proviruses expression influences both types of interferon responses, with specificity not including the activation of the MX1 gene. The SIN vector experiments show consistently high levels of integration through the linearity of the regression plots and the values of HIV copy number/cell.
Although they have the same overall goal, from what these findings suggest, the SIN vector method is more efficient, since every virus is expected to be defective, whereas using CRISPR typically leads to limiting infection and a non-100% transfection rate. SIN vectors have also been investigated and been used as a gene delivery method for longer.7
The next step for the CRISPR avenue of investigation would be verifying the efficacy of CRISPR integration using an Intact Proviral DNA Assay (IPDA), which utilizes digital droplet PCR
(ddPCR) to separate defective and intact proviruses,10 or an RTqPCR with primers of the regions surrounding the edited site, and the specifics of the cytokine expression should also be further explored. This, as well as additional replicates, would address the main limitations of the CRISPR experiments by determining whether the unexpectedly high level of expression of mock conditions was caused by a lack of infection. For the SIN vector method, the expression of specific cytokines has yet to be investigated, likely through an RT-qPCR assay similar to the one conducted for the CRISPR-edited cells in this project.
References:
1. The HIV Life Cycle. HIVinfo.NIH.gov. Published August 4, 2021. Accessed January 8, 2023. https://hivinfo.nih.gov/understandinghiv/fact-sheets/hiv-life-cycle
2. Farhadian S, Patel P, Spudich S. Neurological Complications of HIV Infection. Curr Infect Dis Rep. 2017;19(12):50. doi:10.1007/s11908-017-0606-5
3. Kuniholm J, Coote C, Henderson AJ. Defective HIV-1 genomes and their potential impact on HIV pathogenesis. Retrovirology. 2022;19(1):13. doi:10.1186/s12977-022-00601-8
4. Kuniholm J, Armstrong E, Bernabe B, et al. Intragenic proviral elements support transcription of defective HIV-1 proviruses. Swanstrom R, ed. PLoS Pathog. 2021;17(12):e1009982. doi:10.1371/journal.ppat.1009982
5. Van Heuvel Y, Schatz S, Rosengarten JF, Stitz J. Infectious RNA: Human Immunodeficiency Virus (HIV) Biology, Therapeutic Intervention, and the Quest for a Vaccine. Toxins. 2022;14(2):138. doi:10.3390/toxins14020138
6. Liszewski MK, Yu JJ, O’Doherty U. Detecting HIV-1 integration by repetitive-sampling Alu-gag PCR. Methods. 2009;47(4):254260. doi:10.1016/j.ymeth.2009.01.002
7. Miyoshi H, Blömer U, Takahashi M, Gage FH, Verma IM. Development of a Self-Inactivating Lentivirus Vector. J Virol. 1998;72(10):8150-8157. doi:10.1128/JVI.72.10.8150-8157.1998
8. Interferons Overview. ThermoFisher Scientific. Published August 4, 2021. Accessed January 10, 2023. https://www.thermofisher.com/us/en/home/life-science/cellanalysis/cell-analysis-learning -center/immunology-at-work/interferons-overview.html
9. Verhelst J, Parthoens E, Schepens B, Fiers W, Saelens X. Interferon-Inducible Protein Mx1 Inhibits Influenza Virus by
Interfering with Functional Viral Ribonucleoprotein Complex Assembly. J Virol. 2012;86(24):13445-13455. doi:10.1128/JVI.01682-12
10. Gaebler C, Falcinelli SD, Stoffel E, et al. Sequence Evaluation and Comparative Analysis of Novel Assays for Intact Proviral HIV-1 DNA. Silvestri G, ed. J Virol. 2021;95(6):e01986-20. doi:10.1128/JVI.01986-20