
Daschel Koh
Senior Thesis | 2024

Modeling the Impacts of Climate Change on Tuberculosis
Daschel Koh
25 March, 2024
Abstract:
Tuberculosis is one of the world’s leading infectious diseases both in terms of cases and deaths, rivaling the recent Wuhan Coronavirus pandemic. One of the primary risk factors of tuberculosis is undernutrition, with some studies reporting up to double the risk in malnourished patients. Climate change is another pressing issue, causing higher rates of extreme weather, coastal flooding, and increases in temperature extremes. However, to this point, the relationship between tuberculosis and climate change has not yet been analyzed. This study attempts to determine a correlation between rates of climate change and TB rates using current body mass index (BMI) data, and then extrapolate using projections of future rates of food production from sources such as the FAO and prior research.
1. Introduction:
Tuberculosis (TB) is currently the second most lethal infectious disease behind COVID-19, with 10.6 million active cases and 1.6 million deaths in 20221 . The infection is caused by a group of genetically related bacteria called mycobacterium tuberculosis (mTB)2 and is spread primarily through airborne droplets from the infected individuals from coughing, sneezing, speaking, etc. Once an individual is infected, there is a high likelihood that the infection progresses to latent TB (lTB), with inactive but alive bacteria within the body. About five to ten percent of infections will progress to active3 within 2 years, resulting in symptoms ranging from chest pain and coughing to a loss of appetite, chills, or fever4, though TB can remain in the body for decades.
For the general population, the incidence rate of TB can vary. However, many factors can increase the risk of contracting TB, including but not limited to age, coinfections of diseases (HIV,
AIDS, COVID), and malnutrition. In particular, malnutrition and coinfections pose huge threats when combined with TB, with 60% of individuals in a 2020 study being both malnourished and having active TB5 . Another study reported double the incidence rate in individuals infected with TB when comparing normal BMI patients with underweight patients, reporting 0.92 infections per 1000 people for normal BMI, and 1.8 per 1000 for underweight6 . Similarly, over 25% of tuberculosis-related deaths are in people with HIV/AIDS, while they represent only 6% of the infected population7 . On top of existing risk factors, a majority of TB infections occur in underdeveloped countries with nations with significant portions of residents living under the poverty line representing a disproportionately large proportion of the international disease burden.
Like TB, climate change also presents a huge issue to the future of humanity. It threatens loss of habitat and biodiversity, increases in maximum and minimum temperatures, and longer and
more frequent droughts and flooding. As a result of climate change, we are likely to face several issues resulting from these adverse effects, one of which is loss of food production. Temperature increases can cause less productive crops8, less available land for farming9, and a decrease in the supply of staple crops such as rice and potatoes, which leads to the intersection of climate change and TB rates. The reduction in available land, productivity of plots, and overall decreases in supply can lead to increased rates of malnutrition.
In 2015, the WHO created the End TB strategy, an ambitious plan with the goals to reduce the TB incidence rate by 50% by 2025, and by 90% by 2035. However, these goals seem further and further out of reach for several reasons. The 2020 goal still has not been attained, and reducing rates by another 30% in one year to reach the 2025 goals simply is not feasible. Additionally, in the near future, there is a potential for the combination of the current and future impacts of climate
change on access to food and the close connection between food security and TB to cause an increase in TB rates, especially in areas with already high risk for the disease. As such, in order to reach the goals proposed by the WHO, new action needs to be taken to reduce rates of TB globally, which is where predictive modeling comes into play. By comparing the areas with the current highest risk of TB rate to those with the highest loss in food security due to climate, it is possible to act preventatively to reduce future rates of TB.
This study uses BMI as a metric to determine food security - as it is industry standard, effective, and simple to measure and analyze - and its correlation to current TB rates to determine the weight placed on food access to TB transmission. The study has two goals: First, to examine whether current TB rates can be predicted using nutritional factors using India’s states as a model and to verify the accuracy of these predictions against literature. Second, to map the estimates for future rates of TB and identify the
areas at the highest risk of increase in disease burden for 2035, a benchmark year for the End TB Strategy, and evaluate the realism of the proposed goals.10
2. Data and Methods
2.1
Nutritional Data
For nutritional data, we used the Demographics and Health Survey Program’s public data sets. The Demographics and Health Survey (DHS) is an international organization that originated from a reproductive health survey in 1984 and has since expanded into broader categories. Questionnaires have been consistently updated since the inception of the program in order to improve the relevance of the data gathered. There are several “recodes” that detail specific demographics, such as gender, age, or occupation. Information on data collection and specific questions asked are available on the DHS website and as downloadable PDFs. In particular, this study will focus on the “Individual
recode” and uses the most recent questionnaire available for data analysis. For most cases, this will be the DHS7 survey, though in some cases, the DHS8 survey will be used.
In order to generate a value for the BMI of a given state/country, first the data set was cleaned. This involved removing significant outliers and error codes, which in the case of this data set, were often noted as 998, 9998, etc. Following this, two methods were used in which one applied a sample weight and the other did not. The weighting applied will be structured as recommended in the DHS’s Guide to DHS Statistics DHS-8, which states, “The individual weight for women (v005) is the household weight (hv005) multiplied by the inverse of the individual response rate for women in the stratum” and “The individual weight for men (mv005) is the household weight for the men’s subsample (hv028) multiplied by the inverse of the individual response rate for men in the stratum”11 . Following the application of sample weights, the
population is further divided into groups based on the state/territory/country from which the response was recorded.
2.2 Tuberculosis Data
Data concerning TB rates across Indian states was sourced from the 2023 India TB Report. The TB report is an annual report the Indian government publishes concerning the state of TB. It reports a vast quantity of relevant information on TB in India, including the structure of the National Tuberculosis Elimination Programme (NTEP), the health services the government provides, and patients infected with the disease. Data is recorded in cases per 100000, or lakh, and is used as the primary metric for determining disease burden in this study.
2.3 Projection Data
In reference to the projections, the main sources used will be the FAOSTAT World Food Projections. In 2012, the Food and Agriculture Organization, a subcommittee of the United Nations, made a series of predictions for the state of the world until 2050,
which was followed in 2018 by a publication named The Future of Food and Agriculture: Alternative Pathways to 205012 . The website is interactive and predicts the future conditions of several factors of relevance to this study, including the percentage of undernourished individuals, which will be the main metric used in this study to determine the food security of a given region or country. For this study, we will be using the predictions for the years 2035 and 2050 for their connections to the End TB strategy and the end of the FAO projections, respectively.
Additionally, this study will use the predictions from the 2016 study Modelling Impacts of Climate Change on Global Food Security13 (Dawson et. al.) as a secondary model. In their study, Dawson et. al. created a modeling software called FEEDME based on the FAO’s metrics for food insecurity which they then used to predict the percentage of undernourished in countries. They then ran the model several times and took the average of the predictions for the percentage of undernourished in each country to produce an
estimate of malnutrition rates across the globe. The percentage of undernourished found in this study’s models will also be used to model the potential future impacts of climate change on TB rates.
2.4 Why India
India, as of April 2023, is the world’s most populous nation, boasting 1.428 billion residents. Additionally, it is one of the most densely populated countries and has a relatively high poverty rate of 21.9%. These factors contribute to it representing the highest proportion of TB infections globally (~20%) and making it a valuable region to focus on for this study.
The country is composed of 28 states, which have their own separate governing organizations, and 8 union territories, which are run directly by the Indian government, including the National Capital Territory of Delhi. The DHS survey recorded responses from 36 territories to varying extents, with the greatest number of respondents from Uttar Pradesh (n = 93124) and the least from Chandigarh (n = 746).
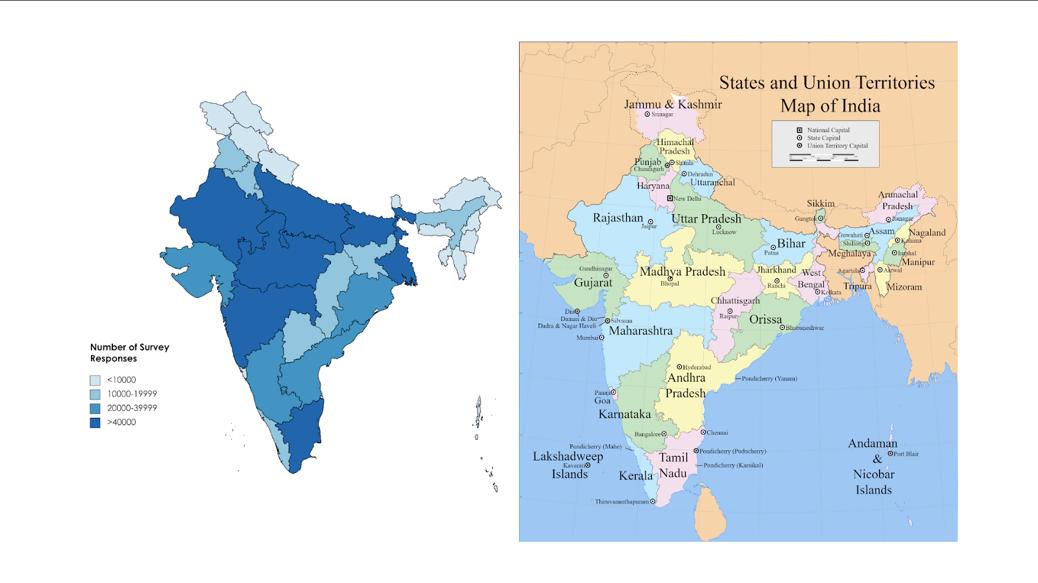
Figure 1: Right: Map of India and its states and territories Left: corresponding number of DHS survey responses.
3. Analysis
3.1 Raw BMI Statistics
Data was imported into Excel from the file
IAIR7EFL.DTA as available on the DHS’s resource site for processing. DHS codes were used to determine the state of origin of a given sample. In total, 724116 responses were recorded (with 794 rows with BMI = 9998 - flagged as invalid - before any further
cleaning/weight applications), divided into 36 groups of varying size. The variable name that records BMIs is v445.
For v445, average BMI had a range of 3.98, with the greatest average being 24.16 kg/m^2 (Puducherry), and the lowest being 20.18 kg/m^2 (Madhya Pradesh). The average BMI among states is 22.14 kg/m^2, with a standard deviation of 1.068. The average BMI of unsorted samples is 21.52 kg/m^2, with a standard deviation of 5.85. Overall, average BMI falls well within the range regarded as healthy, with some slight outliers tending towards over or underweight values. For reference, the average BMI in the United States is 28.8 kg/m^2.
3.2 Correlation Between BMI and TB
To test the correlation between the average BMI of a state/territory and the TB incidence rate, we used Pearson’s Correlation Coefficient to determine the relationship between variables. Upon calculation, the Pearson correlation coefficient was found to be -0.033 for v445. Thus, there is little to no
relationship, at least within these study variables, which relates the average BMI of a state/territory to its TB rates.
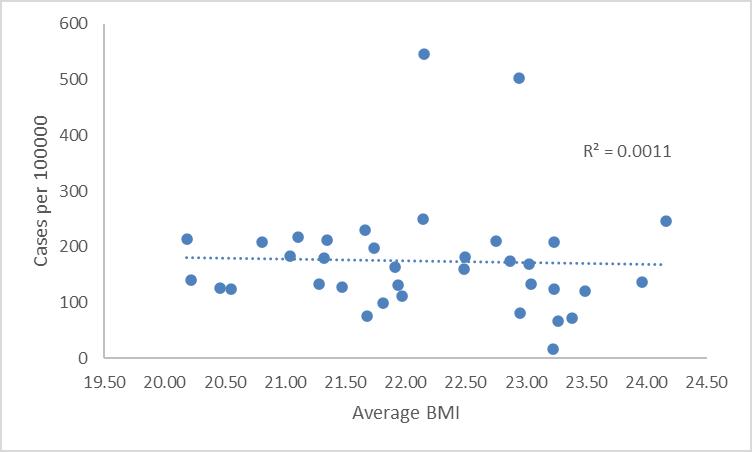
Figure 2: a) Scatter plot of average BMI of women against cases per lakh/100000. A line of best fit is applied, with the r^2 value displayed. As shown by the Pearson correlation coefficient, there is little to no correlation between the variables using these methods.
3.3 Data Cleaning
Following the initial results, significant measures were used with the goal of improving the accuracy of the results. The first step in this was to remove any values where BMI = 0 (n =
24753). Additionally, outliers were further reduced by conducting a z-test and removing any values where z 5 (n = 196). At this point, there were some notable changes in some of the statistics of the data. First, the average value of the unsorted data increased to 22.27 kg/m^2 and the standard deviation decreased to 4.273. Additionally, the average of the sorted groups increased to 22.88 kg/m^2 and the standard deviation increased slightly to 1.167. On average, there was a 3.3% increase in values after cleaning versus before cleaning. Overall, data cleaning improved the precision of the data set, and along with this, the Pearson correlation coefficient increased to 0.37, suggesting a much clearer correlation between the average BMI of a state and its TB burden. We also created a linear regression from this data, which comes out to +33.885 TB cases per unit increase.
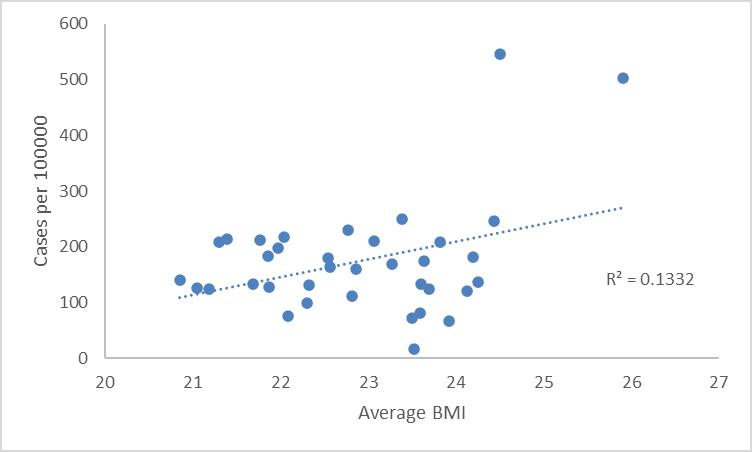
Figure 3: Scatter plot of the relationship between the revised BMI values and TB rate per lakh/100000. Following the revisions as implemented in section 3.3, significant improvements are seen in the strength of the connection between a state’s average BMI and TB burden.
3.4 Application of Sample Weights
For the next stage of this study, sample weights were applied to the data to hopefully further increase accuracy and precision. This study used RStudio for the application of sample weights. As referenced earlier, all sample weights come from the DHS’s Guide to DHS Analytics DHS-8. For this study, two sample
weights will be used. The first is based on whether a given respondent completed the survey, and will be defined as
wg = !!"!#$ !%
where:
nc is the number of respondents with a completed survey, defined as v015 = 1
ntotal is the total number of respondents
wg is the corresponding weight that will be applied.
The second weighting used in this study is a weighting based on the BMI of respondents. This formula refers to whether or not a proper measurement was taken for a respondent’s BMI and includes additional factors concerning women’s BMIs, such as excluding pregnant or postpartum women from those with measured BMI. The equation is as follows:
wBMI = 1 / !% !!"!#$ !&
where:
nc is the number of respondents of a given gender with a completed survey, defined as v015 = 1
ntotal is the total number of respondents
no is the number of outliers, as calculated in 3.3.
Additionally, since this study uses standard deviations, complex sample weighting will be implemented. The DHS outlines the procedure for this in detail. In order to perform analysis with complex sample weighting, three indicators must be kept in mind: the primary sampling unit variable, stratification variable, and weight variable. All of these variables and the procedures for applying them in various languages are outlined in the DHS guide. The weighted BMI values used in this study are detailed in Table A, along with the averages throughout the process.
After the application of sample weights, correlation trends were unchanged, with an identical Pearson Correlation coefficient
and r^2 value. However, the standard deviation of states was slightly improved to 1.127.
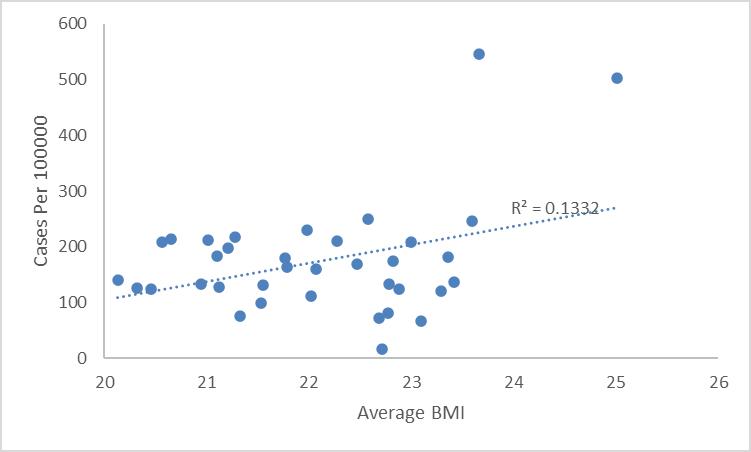
Figure 4: Correlation of BMI to weight after application of sample weights. Pearson correlation and r^2 values remain unchanged from 3.3.
3.5 Literature Comparison
For comparisons, we searched systematically for papers that reported on the correlation between BMI and TB incidence rates and provided numerical estimates for the increase/decrease in infection likelihood for a unit increase in BMI. Upon review, we
selected one study for comparison. The study was published in 2009 and performed a literature review of studies researching the impacts of BMI on TB (Lönnroth et. al.)14 .
In their study, Lönnroth et. al. reviewed the literature up to 50 years prior to their study which related BMI and TB incidence rates. After searching through available literature with many search terms, such as TB and malnutrition, nutrition, wasting, etc. the group ultimately found 6 studies that contained the information they were interested in. Researchers then performed some analysis, such as trendlines, t-tests, and other measures of association to test if there were any statistically significant relationships between the variables. Upon review, Lönnroth et. al. found a consistent negative correlation between variables, reporting a 14% decrease in TB rate per unit increase in BMI.
Relative to our study, there are a few discrepancies. First, our sample used a linear relationship between variables, whereas the study by Lönnroth et. al. reported a log-linear correlation
between nutritional status and TB rates, implying an exponential relationship. While an exponential fit was examined for this study, there was a notable decrease in Pearson correlation and r2 values as opposed to the linear fit, so the linear approach was favored. Additionally, where Lönnroth et. al. found a negative correlation between variables, in our case, we determined the correlation between nutrition and BMI to be positive. While initially, this conclusion may seem strange, given the significant correlation between malnutrition and TB rates, there are some plausible reasons for this. One explanation could be contributing some amount of weight towards population density. TB is a shortlived bacteria outside of the body, and so generally spreads less in areas with lower concentrations of people. Thus, its ideal environment is one full of potential hosts in close proximity and with frequent contact with one another. Many of the states and territories of India with the highest TB rates also tend to be the most densely populated: The Nct. of Delhi, Chandigarh, and
Puducherry, which are the first, second, and third most densely populated states/territories in India respectively. These states and territories also tend towards the higher side of TB rates, with the Nct. of Delhi being the most infected state, and Chandigarh and Puducherry following close behind (Figure 5). Another potential reason, though less plausible, could be related to obesity. Obesity represents an interesting conundrum when related to TB rates, as obesity without comorbidities has been shown to generally decrease the risk of infection, but comorbidities such as diabetes have been related to increased TB rates. However, the potential impact of this on our study is irrelevant - as found in a 2018 study, the direct pathway of obesity to TB is associated with a ~70% reduction in risk (calculated via hazard ratios)15 .
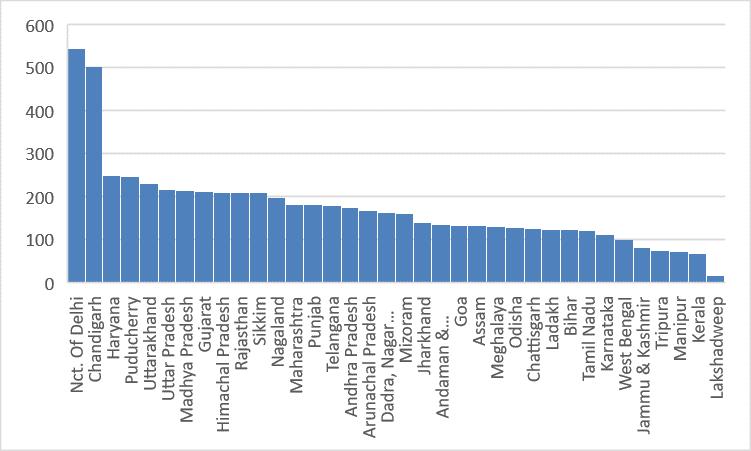
Figure 4: Pareto chart of TB rates per 100000 as reported by the 2023 India TB Report 2023.
4. Projections
4.1 Climate predictions
As previously mentioned, we will be using our current data to project TB rates using projections from two sources: the FAOSTAT projections to 2050, and the study performed by Dawson et. al. For our projections, we will be using the linear estimate of BMI to TB rate per 100000 to predict how the TB rates
would change given a change in the average BMI. First, we will predict based on the FAOSTAT projections. On the FAOSTAT Website, there are 3 different “scenarios” for which data is provided: Stratified Societies (SS), Business as Usual (BU), and Towards Sustainability (TS). Each represents different courses of action undertaken by the world in the hypothetical scenario - i.e. BU means no change, TS means positive change, and SS means negative change. The exact details of each scenario are detailed in The Future of Food and Agriculture: Alternative Pathways to 2050. For our purposes, we will be averaging the three scenarios to estimate the percentage of undernourished.
In 2035, the FAO predictions average out to 8% of the population being undernourished. Given the FAO’s current estimates of 17% of the population being undernourished16, and assuming the average weight of an undernourished person is roughly 18 kg/m^2, a decrease down to 8% would result in a roughly 0.4 kg/m^2 increase in BMI. The increase in TB rates
given such an increase in BMI would be approximately 13 cases per 100000.
In the study by Dawson et. al., they predicted roughly 510% of the population would be undernourished in India. This study assumes the average is roughly 7.5%. In this scenario, BMI would increase to roughly 21.8 kg/m^2, which would result in an increase of about 10 cases per 100000. Overall, while these increases are relatively small, even this amount of change would be straying further from the End TB Strategy’s goals of a 90% reduction in cases by 2035.
5. Discussion/Conclusion:
In the DHS-7 individual recode, we found a weak correlation between BMI and TB rates in a survey of 724115 respondents, which we then used to model the potential future impacts of climate on TB rates. Before controlling/cleaning responses, there was a negligible correlation between the two
variables. However, after the removal of outliers, a stronger relationship was observed between variables, and a positive linear correlation was seen. After sample weighting, the correlation between variables remained the same, but the variance was reduced.
After a correlation between variables was found, we used the linear approximation to determine how much a change in the percentage of undernourished would change average BMI, and by extension TB rates. We used 2 models produced from other studies to predict the loss of food resources, one from the FAO and another from Dawson et. al. Both models predicted a similar loss in food production in India, though the models disagreed on the state of other nations.
The positive correlation between BMI and TB rates is inconsistent with other studies examining the relationship between nutritional factors and TB. As previously cited, the study by Hsien-Ho et. al. found that overall, the negative correlation
between BMI and TB risk overpowers the increased risk on account of comorbidities such as diabetes. However, this study did not account for immunocompromising disorders such as HIV/AIDS, which may be a reason for the discrepancy in results. As referenced in the introduction, diseases such as HIV/AIDS represent a disproportionate amount of deaths and infections relative to their proportion in the population at large for several reasons. HIV/AIDS hinders the production of CD4+ TCells, which increases the likelihood of infection and renders them ineffective, which increases the ability of TB to worsen a host’s health17 .
There were a few restrictions in this study which may have skewed results. Firstly, the use of a linear approximation may have led to less-than-accurate results. However, an exponential approximation was also attempted, but led to a lower r^2 value, suggesting the exponential model is weaker compared to the linear approximation used in this study. While this does disagree with
Dawson et. al., none of the studies used in that review contain the population of this study. The combination of the Indian topography, people, and innovations in medicine and public health may allow for a degree of contradiction between the results.
In terms of the future direction of this project, the first step would likely be to expand the sample population of this study. Potentially widening the scope to include other surveys and being able to apply more specific sample weights (i.e. gender specific sample weighting) could help with further improving the accuracy of the results. Additionally, finding projection data with state/territory-specific predictions for future food security would allow for the estimation of TB rates for individual provinces, rather than the entire country. Likewise, we could include survey data for other countries and perform similar analyses on other developing nations, such as countries in central Africa or the Middle East, which already have higher rates of TB and large populations of poor and/or undernourished people.
Also, many different improvements could’ve been made in terms of the predictions. There is potential to train a predictive model or an AI to be able to estimate TB rates based on average BMI rather than using a simple linear regression. Also, using something like a boosted regression tree could better approximate the true relationship between variables.
Another potential improvement to the current method could be to create a program that can factor in more than just BMI. There are many factors other than BMI that contribute to TB. As mentioned above, comorbidities such as HIV/AIDS and diabetes are significant contributors to the risk of infection. Additionally, on a state level, accounting for population density, the proportion living in rural vs. urban areas, access to clean water, electricity, heating, and many other characteristics could help with making a more accurate model. In short, there are certainly some limitations to this study, but there is also space to
further explore the connection between climate and TB rates, especially in developing nations.
This study was able to find a weak positive correlation between the average BMI of a given state/territory and its TB incidence rate. While this was somewhat inconsistent with similar studies relating nutritional diagnostics with TB rates, there are potential explanations for this variance, such as population density and other risk factors that impact TB rates. Future directions may include performing a study that can factor in more of these variables, perhaps using a multivariate linear model, or finding another correlative factor between TB and climate change.
Table A: Index of Indian States with the average BMI at several stages in the study, with TB incidence displayed in the rightmost column.
References:
1. Tuberculosis. (2023, November 7). World Health Organization (WHO). Retrieved March 4, 2024, from https://www.who.int/news-room/factsheets/detail/tuberculosis
2. Tuberculosis: Causes, Symptoms, Diagnosis & Treatment. (2022, May 24). Cleveland Clinic. Retrieved March 4, 2024, from https://my.clevelandclinic.org/health/diseases/11301tuberculosis
3. Fact Sheets | General | Latent TB Infection vs. TB Disease | TB | CDC. (n.d.). Centers for Disease Control and Prevention. Retrieved March 4, 2024, from https://www.cdc.gov/tb/publications/factsheets/general/ltbi andactivetb.htm
4. Fact Sheets | General | Latent TB Infection vs. TB Disease | TB | CDC. (n.d.). Centers for Disease Control and Prevention. Retrieved March 4, 2024, from https://www.cdc.gov/tb/publications/factsheets/general/ltbi andactivetb.htm
5. Ayiraveetil, R. et. al. (2020, February 28). Household food insecurity among patients with pulmonary tuberculosis and its associated factors in South India: a cross-sectional analysis. PubMed. Retrieved March 4, 2024, from https://pubmed.ncbi.nlm.nih.gov/32114470/
6. Choi, H. et. al. (2021, December 1). Body Mass Index, Diabetes, and Risk of Tuberculosis: A Retrospective Cohort Study. NCBI. Retrieved March 4, 2024, from https://www.ncbi.nlm.nih.gov/pmc/articles/PMC8671831/
7. TB disease burden. (n.d.). World Health Organization (WHO). Retrieved March 4, 2024, from https://www.who.int/teams/global-tuberculosis-
programme/tb-reports/global-tuberculosis-report-2023/tbdisease-burden
8. Abbas, S., & Mayo, Z. A. (2023, January 6). Impact of temperature and rainfall on rice production in Punjab, Pakistan. Springer Link. Retrieved March 4, 2024, from https://link.springer.com/article/10.1007/s10668-02000647-8
9. Singh, K., McClean, C. J., Buker, P., Hartley, S. E., & Hill, J. K. (2023, January 6). Mapping regional risks from climate change for rainfed rice cultivation in India. ScienceDirect. Retrieved March 4, 2024, from https://www.sciencedirect.com/science/article/pii/S030852 1X16302311
10. Neumann, J. (2013). World Bank Document. World Bank Document. Retrieved March 4, 2024, from https://documents1.worldbank.org/curated/en/67660146824 9642651/pdf/Looking-beyond-the-horizon-how-climatechange-impacts-and-adaptation-responses-will-reshapeagriculture-in-Eastern-Europe-and-Central-Asia.pdf
11. Croft, Trevor N., Allen, Courtney K., Zachary, Blake W., et al. 2023. Guide to DHS Statistics. Rockville, Maryland, USA: ICF
12. Vos, R. (2018). The future of food and agriculture –Alternative pathways to 2050. Food and Agriculture Organization of the United Nations. Retrieved March 4, 2024, from https://www.fao.org/3/I8429EN/i8429en.pdf
13. Dawson, T. P., Perryman, A. H., & Osborne, T. M. (2017, November 9). Modelling impacts of climate change on global food security. Springer Link. Retrieved March 4, 2024, from https://link.springer.com/article/10.1007/s10584-014-1277y
14.. Lonnroth, K., Williams, B. G., Cegielski, P., & Dye, C. (2017, November 9). A consistent log-linear relationship between tuberculosis incidence and body mass index. ResearchGate. Retrieved March 5, 2024, from https://www.researchgate.net/publication/26885863_A_con sistent_loglinear_relationship_between_tuberculosis_incidence_and_b ody_mass_index
15. Lin, H.-H. et. al. (2017). Association of Obesity, Diabetes, and Risk of Tuberculosis: Two Population-Based Cohorts. NCBI. Retrieved March 5, 2024, from https://www.ncbi.nlm.nih.gov/pmc/articles/PMC5850624/
16. The World Bank. (n.d.). Prevalence of undernourishment (% of population) - India | Data. World Bank Data. Retrieved March 5, 2024, from https://data.worldbank.org/indicator/SN.ITK.DEFC.ZS?loc ations=IN
17. Bruchfield, J., Correia-Neves, M., & Kallenius, G. (2015). Tuberculosis and HIV Coinfection - PMC. NCBI. Retrieved March 5, 2024, from https://ncbi.nlm.nih.gov/pmc/articles/PMC4484961/