
Olga Meserman
Senior Thesis | 2024

Validation of pPDH as a Marker for Inhibition of Serotonergic Neurons
Olga Meserman
Abstract:
Phosphorylated Pyruvate Dehydrogenase complex (pPDH) was tested to support or refute the claim that it was a sufficient marker for neuronal inactivation in the serotonergic area of the brain. Yang et. al in ‘Phosphorylation of Pyruvate Dehydrogenase Marks the Inhibition of In Vivo Neuronal Activity,’ presents pPDH as a potential marker of neuronal inactivation, which would enable scientists to use it in experiments to analyze the effects of various medicines and diseases on the brain. For this experiment, mice were injected with transgenic material to inactivate a subpopulation of the 5HT (serotonergic) neurons. After taking cross-sections of the brain, antibody staining was used to identify if pPDH was a released chemical in the brain in substantial
amounts during inactivation, which would support the claim that it's an inactivation marker. This is because a significant presence of pPDH in the brain of the experimental mice as opposed to the control mice (with still active 5HT regions) would indicate that the neurons are inactivated according to Yang’s paper.
Validating pPDH as an inactivation marker has great importance because it could improve the ability of genetic researchers to ensure that their inactivation methods are working. There have long been markers for neuronal activity but neuronal inactivation can be difficult to discern, making it harder to perform experiments without actually knowing if one properly inactivated the target population.
Discussion of Literature/Introduction to Paper:
Every living organism has a genetic code (referred to in its entirety as a genome) that dictates all aspects of the existence of that being. This code is housed in the nucleus of every cell on
DNA strands and presents as nucleotides which create genes that are further used to create proteins in the cell. Without these proteins, the body would not be able to function and there could be pathology marking these deficiencies. The creation of these proteins by the human body can correlate to a specific signal or cell state. For instance, a cell can mark activation, or stress by translating a specific type of protein that then goes on to remedy the stressor and bring the cell back to desired conditions.
Studying the protein products of specific genes, particularly which proteins are generated when these genes are activated or deactivated, is done in mouse models. These animal studies are widely used in scientific research because of the belief that all organisms evolved from a common ancestor. The mouse and human brain have many homologous genes and very similar organization, making mice the ideal animal on which to test the effects of various neural modifications, including altering their genetic code (Beauchamp, 2022). Thus, although this experiment
was performed with a mouse, the similarities between the nervous systems could present the same conditions in humans.
pPDH, or phosphorylated pyruvate dehydrogenase, is predicted to be a marker of neuronal inactivation in the brain (Yang, 2023). This has not been confirmed in serotonergic cells, however, which are a specific subpopulation of neurons. This paper addresses whether or not pPDH can be used to localize neuronal inactivation for the serotonin-producing cells of the brain.
The Dymecki lab focuses on studying serotonin neurons in a mouse model. Serotonergic (serotonin-producing) neurons reside in the midbrain as pictured in Figure 1 below, and can be active or inactive depending on the health of the neuron and the needs of the body at a given time. The primary focus of this study was to determine if a specific chemical was released by these neurons in their inactive state. Thus, testing sought to answer whether or not serotonergic (5-HT) cells of the brain released phosphorylated pyruvate dehydrogenase complex (pPDH) when inactivated. Using
mouse models and inactivating their serotonergic cells with genetic tools, antibodies were employed to assess whether or not there was a significant increase in pPDH presence in inactivated serotonergic cells as opposed to activated ones.
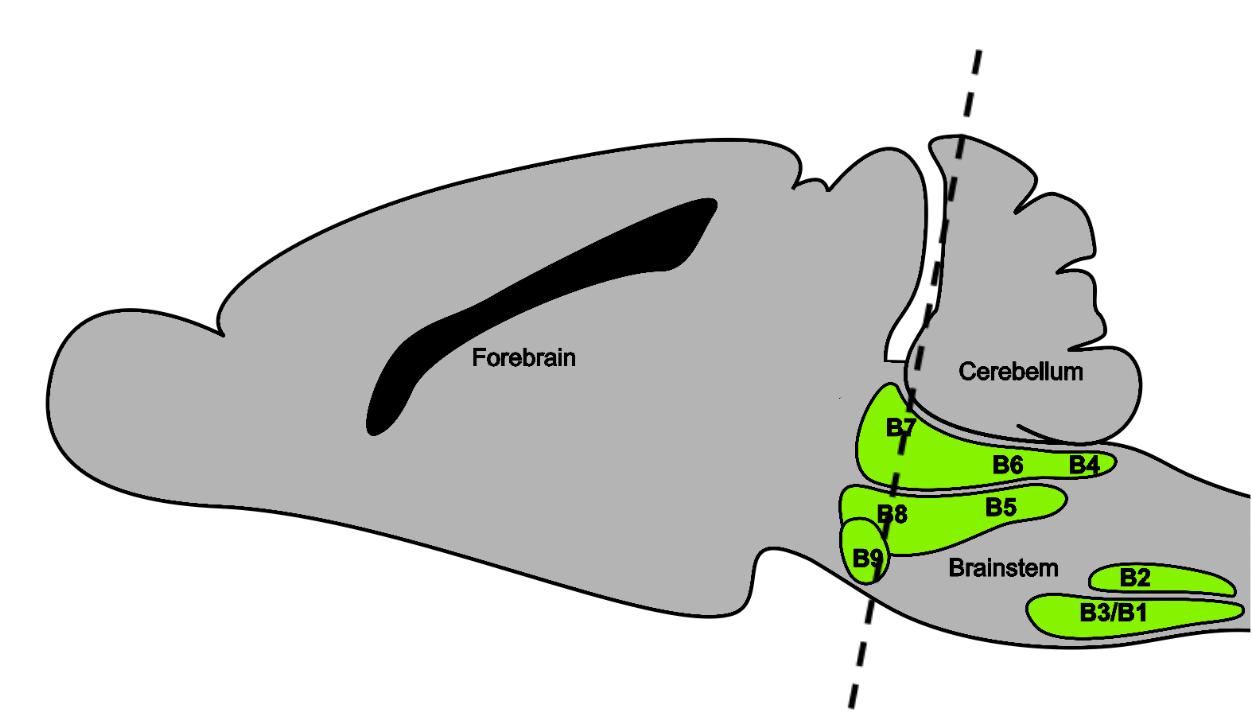
Figure 1: Cross section of 5-HT neurons in the midbrain. The paper “Phosphorylation of pyruvate dehydrogenase marks the inhibition of in vivo neuronal activity” (Yang, 2023) details an experiment performed by a group of scientists who asserted that pPDH can be used to visualize inactivated neurons throughout the brain through antibody staining. According to the
paper, inactive neurons would exhibit increased pPDH expression. Thus, scientists could use the presence of pPDH to visualize specific neural inactivation in the serotonergic population. Because Yang’s paper did not focus on a specific region of the brain, it left room to assess pPDH as a marker for this specific cell type and neural region.
Genetic engineering refers to the process of altering the DNA sequences of organisms using genetic tools (Smith, 2024). One of the ways to alter DNA sequences is to delete a gene from the host. In the lab, mice who have had a gene deleted from their genome are referred to as knockout mice and can be further studied to determine the impacts that the gene had on things like behavior, physical characteristics, disease development, and more. Besides conventional knockouts, scientists can also generate conditional knockout mice, where the genotypes result in the ability to delete the gene at any moment in the development of the mouse. Not only do conditional knockout mice have the ability to control the timing
of gene knockout, but these mice also allow scientists to study the effects of knockouts in vivo (in a living organism) since, sometimes, the development of conventional knockouts can result in developmental lethality (Hall, 2009).
The specific genetic engineering that creates conditional knockout mice requires the use of transgenes (referring to genes that are not typically found within a host). To carry out this experiment, genes were harvested from bacteriophage and used to cleave out a sequence that blocked the inhibition of serotonergic cells. With the help of transgenes, the response of the cell to a deletion can be analyzed in depth by scientists and provide meaningful insights regarding the cell's function. In this experiment, the knockout was used to test whether or not pPDH was released from serotonergic cells upon inactivation, making it possible to affect this specific class of neurons at a designated time.
Once the gene is knocked out, the cell can continue the processes of transcription and translation, producing proteins that can then be analyzed using antibody staining. The analysis of these chemicals can be used to determine the state of the neuron they are released from. For instance, the presence of the protein Fos is a potential indicator of neuronal activation, so when it is seen near a neuron, it can lead to the conclusion that it is in an active state. Similarly, TPH2 is a crucial chemical for creating serotonin, thus, it indicates the presence of a serotonergic neuron when observed near a neuron.
Antibodies are created when a host organism gets infected with a foreign pathogen. For example, a cow can be injected with a certain antigen normally found in pigs (foreign pathogen), and then produce antibodies against it as part of a natural immune response. These antibodies can then be harvested and purified from the blood of the host animal and used in a lab to identify specific chemicals in samples. The lock-and-key relationship between antibodies and
antigens (where an antibody recognizes and binds to its specific antigen) is especially useful for my experiment. Coupling the knowledge that neurons release specific chemicals, and that antibodies can be made to bind to these chemicals, scientists can use antibodies to bind to specific chemicals that can help them determine the state of a neuron. For instance, if the antibodies designed against Fos or TPH2 are seen under a microscope, it can be inferred that the presence of Fos or TPH2 is in the same areas, thus determining neural activation or serotonin production, respectively.
If validated to mark neuronal inhibition, pPDH could present massive benefits to scientists. At the moment, scientists can induce specific diseases into mouse populations, then give treatments and test the effectiveness of the introduced drugs. If validated, pPDH staining could reveal the impacts of the disease, or the benefits of the medicine when it comes to preserving neural subtypes. Expanding beyond disease, scientists could test the
effects of certain chemicals, environments, or activities on neurons, leading to a better understanding of brain longevity. The ability to localize inactive neurons would thus give scientists a more robust understanding of neural activity in different circumstances.
Overview of Procedure
The brain samples from mice are rinsed with buffer, donkey serum, primary, and secondary antibodies. This process ensured optimal accuracy in the staining process and a greater color range in the antibodies.
Primary antibodies bind to antigens using a lock and key mechanism. Their binding can be visualized under a microscope but lacks an extensive color range and an intensity that secondary antibodies provide. Secondary antibodies are created against the proteins expressed by the host in which the primary antibodies are created. They attach to the protein remains from the hosts of the
primary antibody. The antibody nomenclature is (host animal) (pigment) anti-(antigen) (antibody concentration). Since the secondary antibodies are created against a host animal, no primary antibody used in the experiment was created in the same animal, as it would cause overlapping recognition from the secondary antibodies.
Furthermore, secondary antibodies were beneficial to this experiment because primary antibodies come with a limited range of colors whereas you can customize the wavelengths of secondary antibodies (helpful when analyzing under a microscope) and create more color varieties to allow for more use in every sample. A great benefit also lies in signal amplification because, as opposed to the primary antibodies, more than one secondary antibody binds to the protein leftovers.
Samples were then analyzed under a microscope and the resulting antibody presence in cells was quantified to statistically
determine whether there was a significant difference in pPDH expression in experimental and control mice.
Procedure
Four mice were used in this experiment, the experimental ones created through a cross of transgenes. One of the parental mice was created and genotyped to contain the Pet1:Flpe transgene (Figure 2). Flpe is a transgene and codes for a restriction endonuclease (RE), cleaving all genetic material between two identical sequences (referred to as FRT). Pet1:Flpe was created by fusing the promoter sequence of this RE with Pet1, a gene expressed in all 5-HT neurons of the mouse brain (Liu, 2010). Pet1 acts as a serotonin-specific driver when fused with Flpe, targeting the expression of the RE to the 5-HT region of the brain.
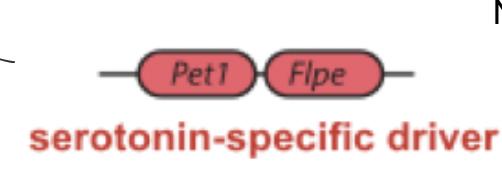
Figure 2: The Pet1:Flpe transgene, with Pet1 directing Flpe expression. When Pet1 is expressed in the 5-HT neurons, so is Flpe. When Flpe locates its target sequence, it splices out all genetic code between the target sequence and its next occurrence (Figure 3).
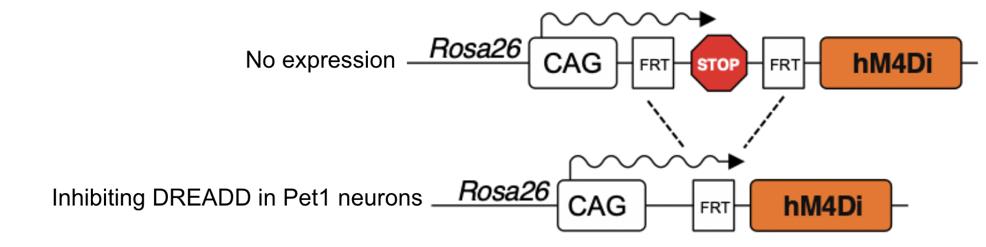
Figure 3: Two genetic cassettes (lab-produced genetic sequences) before and after being digested with Pet1:Flpe. The first cassette
shows the FRT sequences flanking a stop codon, the second shows the deletion of the stop codon after the FRT sequences have been processed by Pet1:Flpe. Simultaneously, one parental mouse was injected with a Npy2r:Cre, a transgene with Npy2r driving Cre expression to a specific 5-HT subpopulation. The Cre transgene, also a restriction endonuclease, recognizes consecutive Lox-P sequences and splices out the genetic material in between them.
The other parent mouse was created with hM4Di, a DREADD (Designer Receptors Exclusively Activated by Designer Drugs). The presence of the hM4Di receptor has been shown to reversibly inactivate neurons in the brain upon the injection of CNO (Zhu, 2014).
Once the parental mice were crossed, four mice were produced. J181 only had the FDI (hM4Di) genotype, indicating the successful transfer of DREADD to the offspring, whereas J182
only had the Pet1:Flp transgene. J183 and J184 had the Pet1:Flp/FDI genotype, indicating that they were the experimental mice.
The genetic cassette in the experimental mice (J183,4) contained a stop codon in between two FRT sequences. Run without the Pet1:Flpe transgene present (J181), translation runs into the stop codon, inhibiting the expression of the DREADD and keeping the cell active. Without the DREADD (J182), cutting out the FRT sequence doesn’t change anything for gene expression.
Figure 4 demonstrates the effects of Pet1:Flpe/FDI genotypes. Once digested with Pet1:Flpe and Np2yr:Cre, the 5-HT neurons lose the stop codon and activate the DREADD once injected with CNO, halting neural activity in all serotonergic cells. By using mice expressing both of these transgenes (Pet1:Flipe and Npy2r:Cre), we could target a specific cell population for our experiment, which was better visualized under a microscope.

Figure 4: Above is a genetic cassette starting with the CAG (promotor) sequence, then with the FRT sequence, and then the DREADD (LoxP sequence not pictured).
Post-CNO injection, the mice were subjected to a swim test. The swim test is a method better to analyze the proteins in the brain under a microscope. The two control mice and two experimental mice were then subjected to a swim test meant to activate the serotonergic neurons before being injected with CNO to activate the DREADD, silencing their serotonergic activity. In theory, the test should induce 5-HT activation for cells that are unaffected by DREADD, providing a better contrast to the inactive cells when viewed under a microscope postmortem. This method
makes it easy to quantify the inactivated and activated cells (count the cells expressing pPDH and the cells expressing Fos to see how many of each there are in the brains of control and experimental mice).
After the swim test, the mice were anesthetized and perfused to stabilize the brain tissue before imaging. After tissue extraction, the brains were preserved in optimal temperature cutting compound (OTC) and stored at -85 degrees Celsius.
After the perfusion, the brain samples were extracted and frozen in OTC, a material that stabilizes the brain sample and protects it while frozen and in the process of being sliced. Using a cryostat machine, the brain samples were sliced into 40 nm thin slices. Figure 5 below shows the samples (preserved in OTC) mounted in the machine which maintained a temperature of -15 to -30 degrees Celsius. This temperature range was preserved while slicing as it is the optimal temperature for slicing a brain sample in
OTC, which begins to melt and destabilize at higher temperatures than this.
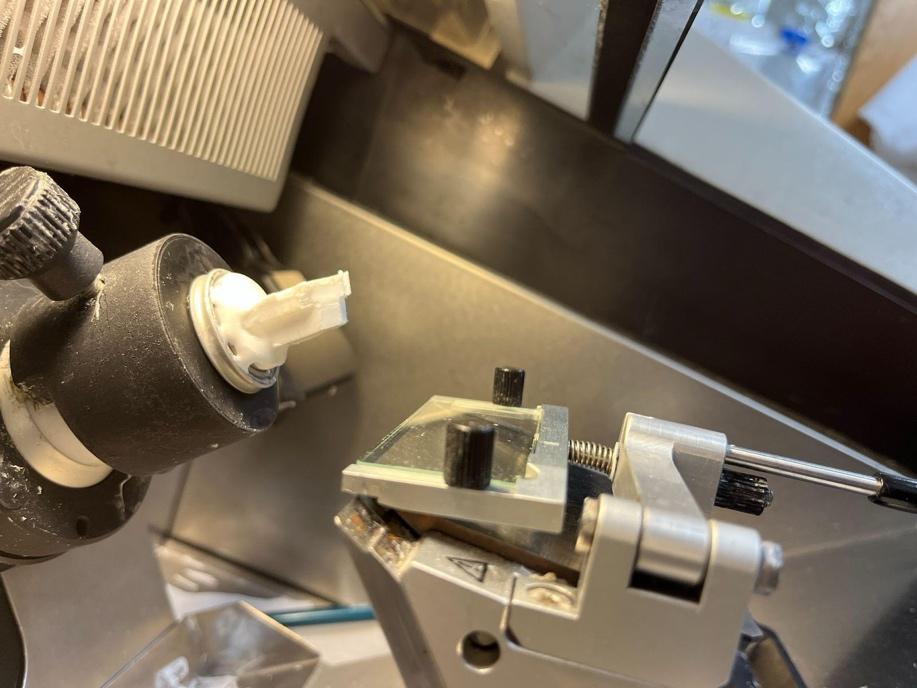
Figure 5: The cryostat chamber mounting the preserved sample on a moving base. As the wheel on the machine’s side is cranked, this base moves towards a razor, cutting the sample and preserving it under a glass panel. After being sliced, the glass panel is lifted and samples are placed into wells of PBS buffer.
Before slicing, a PBS buffer was poured into a stand with six wells and sieves. After being sliced, the cross-section was quickly removed from the cryostat and placed in one of the six wells, alternating wells for each slice. As a sample enters contact with room temperature, the OTC begins to dissolve but leaves a trace. The wells are thus filled with a PBS buffer, purifying the sample and removing excess OTC. The stand was placed onto a shaker and rinsed twice, switching the sieves into new stands with fresh PBS for two cycles. The samples from each of the six wells were then preserved at -80 degrees Celsius in preparation for antibody staining.
Once at room temperature, the samples from one of the six wells were chosen for imaging and subsequently rinsed with PBS twice in five-minute increments. Then, the samples were rinsed in PBS-T (PBS with .1% triton) for 5 minutes. The samples were then rinsed with 1% BSA, 5% normal donkey serum in .1% PBS-T at room temperature for approximately two hours.
Three primary antibodies were used to stain the sample.
Guinea pig monoclonal anti-c-Fos (1:2000), rabbit anti-pPDH (phosphorylated-Pyruvate Dehydrogenase alpha-1) (1:5000), and goat anti-TPH2 (1:1000) stained for Fos, pPDH, and TPH2 expression, respectively.
After this, the antibodies were rinsed with PBS-3 for two, ten-minute increments, then incubated with a secondary antibody mix in 2% NDS, .1% PBS-T for 2 hours. The secondary antibody mix consisted of donkey AF488 anti-rabbit (1:500), donkey AF594 anti-goat (1:500), donkey AF647 anti-guinea pig (1:500), and stained for protein remains of the primary antibodies’ host. The samples were rinsed with PBS-T for two rounds, incubated with DAPI (1:1000 concentration in PBS) for 3 minutes, and then finally rinsed twice for 10-minute cycles in PBS.
The samples were then frozen overnight, placed in a large, PBS-filled petri dish, and unfolded. Then, ordered from anterior to
posterior, the samples were mounted and sealed onto microscope slides and analyzed.
The initial imaging process was done using a light microscope in order to determine the similarities between the cross sections. In an experiment requiring quantitative analysis between cross-sections, the sections analyzed needed to be comparable, enabling a more solid foundation for identifying similarities and differences. Thus, the cross sections were numbered and organized according to brain region. The regions of interest included the dorsal raphe (DR), media raphe (MR), and caudal dorsal raphe (cDR). Extensive imaging was performed to then quantify the chemical presence of Fos, TPH2, and pPDH in neurons.
The Nikon Ti2 Eclipse microscope was used for imaging and was able to analyze individual cross sections on the x, y, and z planes, then splice the axes together to compose a more detailed image. The microscope contained an Okolab enclosure cage used to block the samples from being damaged by external light. Once
the slide was placed into the microscope The plane (x,y,z) boundaries were set up and the amount of images per plane was input into the machine. The benefit of using the Nikon Ti2 Eclipse as opposed to the one used previously, is that this approach scans the samples throughout their entire thickness. Doing this ensures that no cells are missed, seeing as the 15nm cross-sections had the potential to just reach the end of a cell, or graze the start of one. Thus, this ensured a more accurate data collection and statistical analysis. Ultimately, it took approximately five hours to image the slides which included setting the planes, downloading the files, rearranging the slides, and reimaging various cross sections.
Results
The goal of this experiment was to observe whether or not there was a significant increase in pPDH presence in inactivated 5HT neurons. Inhibited using DREADD and genetic engineering, the experimental mice’s (J191, J192) serotonergic neurons should
have significantly more green coloring (pPDH) present than in the images of the control mice. The control mice did not have the proper combination of transgenic material to inactivate the 5-HT neurons, so quantifying the pPDH staining should have yielded substantially more cells according to Yang’s theory (Yang, 2024). The cells were manually counted to determine the localization of the tested chemicals. TPH2 presence, represented in red, indicates that the cells are serotonin-producing. Fos presence, represented in teal, marks generally active cells but is not specific to serotonin. Thus, crossing Fos and TPH2 in one image represents the active serotonin-producing cells, and, given the other processes worked correctly, there should be a blue spot in the middle of the red-stained cells to indicate active serotonergic-producing cells in the control cells. pPDH staining, pictured in green, was the primary focal point of my analysis, as it supposedly marked inactive serotonergic cells in the experimental mice.
Next, the TPH2 was overlaid with the pPDH to analyze the active serotonergic cells against the supposedly inactive cells. There ended up being an overlap between the TPH2 and pPDH staining, as opposed to the expected complementary stain pattern indicating that either some part of the experimental process was faulty, or that pPDH is not an adequate marker of inactivation. The quantification was done manually by analyzing the microscope imaging and manually counting the cells in which the stain was intense enough to generate a spark, rather than just slight remnants of the color being present, indicating residual dye rather than relevant binding. Cells are shown with stains for TPH2, pPDH, and Fos (were also stained with DAPI).
In Figure 6, 18 cells were counted with overlapped TPH2 and Fos staining, 12 cells had TPH2 and pPDH overlap, and two cells had all three overlap, which shows that either an error occurred in the experimental process or pPDH should not be used
to indicate inactivation in this cell population. The calculated pPDH intensity for the area was 267.933.
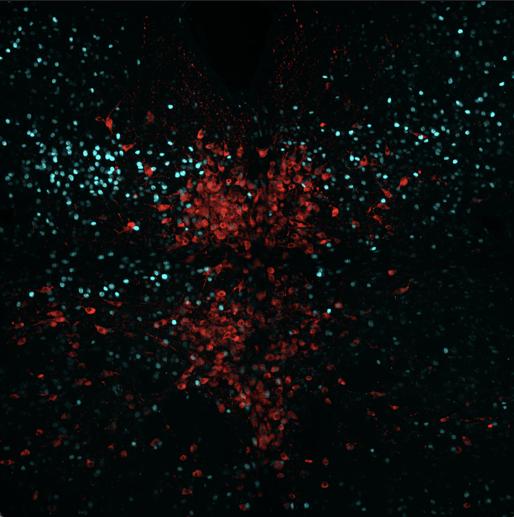
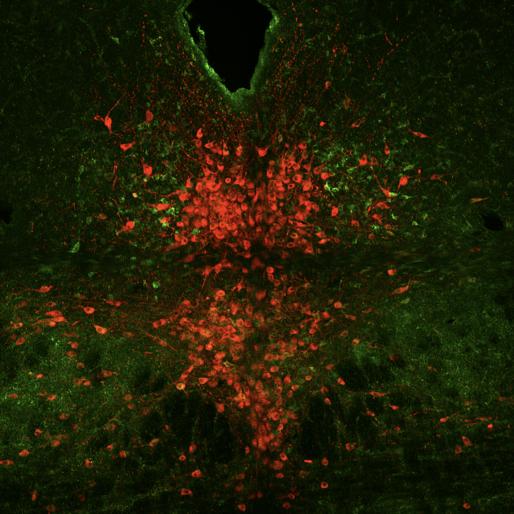
Figure 6: Mouse J181 cross-section with Fos stain marked in teal, TPH2 stain marked in red, and pPDH stain marked in green.
In Figure 7, 17 cells were counted with overlapped TPH2 and Fos staining, 15 cells had TPH2 and pPDH overlap, and three cells had all The calculated pPDH intensity for the area was 270.087, similar in value to the intensity found in J181.
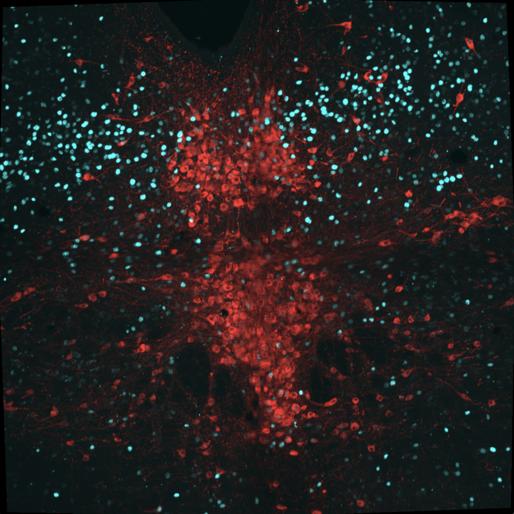
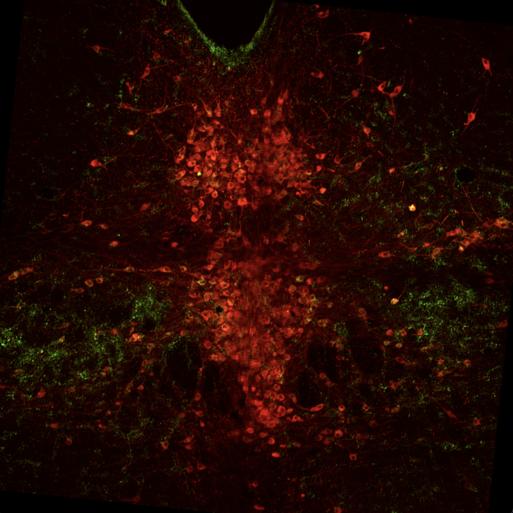
Figure 7: Mouse J182 cross-section with Fos stain marked in teal, TPH2 stain marked in red, and pPDH stain marked in green.
Figure 8 represents the brain of the first experimental mouse (J191). 15 cells were counted with overlapped TPH2 and Fos staining, 25 cells were calculated with TPH2 and pPDH overlap, and seven cells had a pPDH, TPH2, and Fos overlap. Ultimately, the calculated intensity was 249.973 which was lower than the control mice, indicating lower pPDH presence.
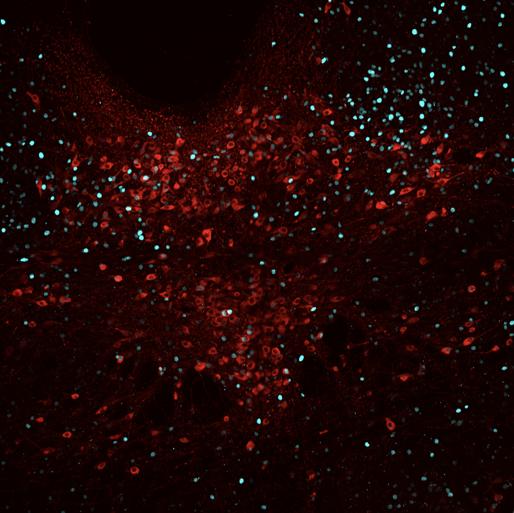
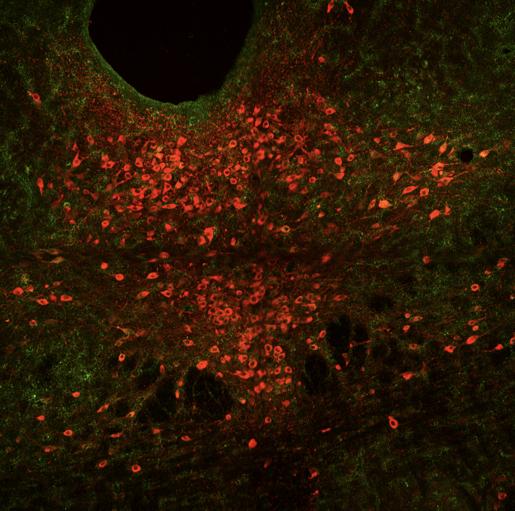
Figure 8: Mouse J191 cross-section with Fos stain marked in teal, TPH2 stain marked in red, and pPDH stain marked in green.
Fig 9 represents the brain of the second experimental mouse, J192, which showed 18 cells with overlapping pPDH and Fos, 40 overlapped pPDH and TPH2, and 8 cells with TPH2, Fos, and pPDH overlap. Ultimately, the intensity of pPDH expression was again lower than the control mice, indicating no significant difference in pPDH expression between control and experimental individuals.
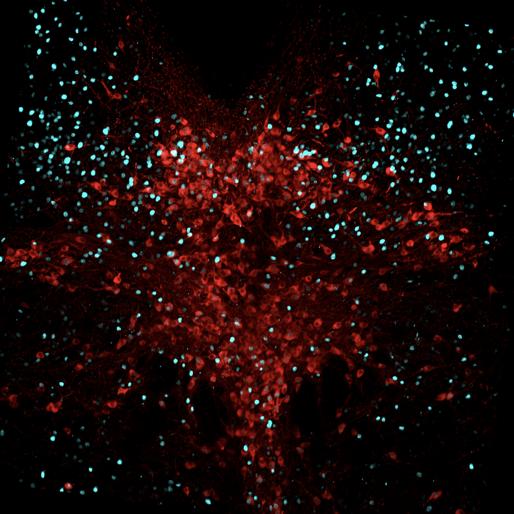
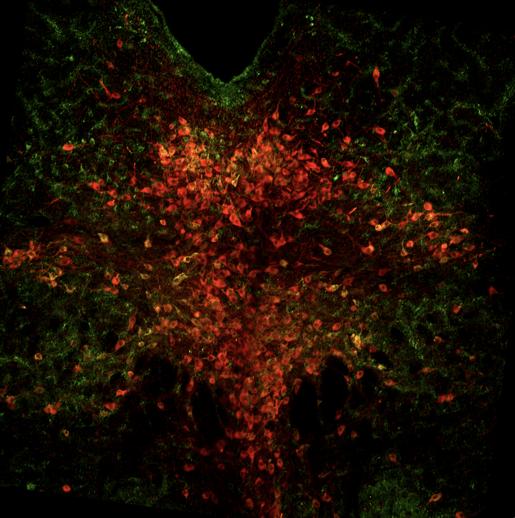
Figure 9: Mouse J184 cross-section with Fos stain marked in teal, TPH2 stain marked in red, and pPDH stain marked in green.
Through calculations of the area and intensity of the pPDH in all of the images, it was found that the intensity of the control animals (~268, ~270) was not significantly lower than the intensity of the experimental animals (~250, ~256). This information is presented in Table 1 below. Furthermore, it does not show any significant differences in pPDH expression between the control and experimental mice.
Table 1: This table shows the quantification of various attributes of the microscope analysis.
Discussion
The results of this experiment were unexpected according to Yang’s findings because the experimental animals expressed lower pPDH intensity as opposed to the higher intensity Yang would have predicted. Although the results did not support Yang’s hypothesis, some issues could have arisen throughout the experiment that could have generated these unexpected results.
To figure out which mice were controlled or experimental, a PCR test was performed. The test was used to detect whether or not the mice took up the transgene. The PCR test ‘runs’ the genetic material from the mice through a gel, and based on the length of the gel, it ‘runs’ faster or slower towards the positive electrode (a longer DNA strand is slower, enabling detection of various genes). The DNA combined with dye and other chemicals is placed into a well cut out from a block of agarose gel. Based on the length that the strands traveled, J191 and 192 were detected to have both Pet1:Flpe and the DREAD taken up. Because of this, they were
deemed the experimental mice in this experiment. If this PCR was performed incorrectly, it could have led to a misinterpretation of the results. Since a minimal amount of DNA is needed to perform the test, any contamination between wells on the gel, or pipettes when mixing the chemicals, could have potentially skewed the results and led to the assumption that a transgene is expressed in an animal that didn’t possess it.
Other issues that could have arisen are with the activation markers. Fos activity has long been assumed to be a marker of neural activation, however, its role is still speculated seeing as scientists are not sure of its other functions in the brain (Chung, 2015). If Fos is not really a good marker of neural activation, then comparing it against pPDH would not be a helpful way of analyzing active and inactive neurons.
Additionally, there could have been issues in the DREAD or Pet1:Flpe transgene, leading to an inaccurate or incomplete neural inactivation, thereby skewing the results in the experiment.
Ultimately, there were many procedural elements that could have interfered with the results of the experiment, and if that was the case, then subsequent experiments could be conducted testing the efficacy of the DREAD and Pet1:Flpe with multiple trials of PCR.
Despite the results not supporting Yang’s hypothesis, it is still useful to understand that pPDH might not function in one area of the brain as it does in another. Similarly, this procedure for testing inactivation will be able to allow scientists to perform similar experiments and test other potential markers. Regardless of the results, this experiment proved useful in understanding which chemicals to use when testing for neural inactivation.
Bibliography
1. Beauchamp A, Yee Y, Darwin BC, Raznahan A, Mars RB, Lerch JP. Whole-brain comparison of rodent and human brains using spatial transcriptomics. Elife. 2022 Nov 7;11:e79418. doi: 10.7554/eLife.79418. PMID: 36342372; PMCID: PMC9708081.
2. Yang D, Wang Y, Qi T, Zhang X, Shen L, Ma J, Pang Z, Lal NK, McClatchy DB, Wang K, Xie Y, Polli F, Maximov A, Augustine V, Cline HT, Yates JR, Ye L.
Phosphorylation of pyruvate dehydrogenase marks the inhibition of in vivo neuronal activity. bioRxiv [Preprint]. 2023 Mar 14:2023.03.13.532494. doi: 10.1101/2023.03.13.532494. PMID: 36993270; PMCID: PMC10054949.
3. Smith, Mike. “Genetic Engineering.” National Human Genome Research Institute.
4. Hall B, Limaye A, Kulkarni AB. Overview: generation of gene knockout mice. Curr Protoc Cell Biol. 2009
Sep;Chapter 19:Unit 19.12 19.12.1-17. doi: 10.1002/0471143030.cb1912s44. PMID: 19731224; PMCID: PMC2782548.
5. Liu C, Maejima T, Wyler SC, Casadesus G, Herlitze S, Deneris ES. Pet-1 is required across different stages of life to regulate serotonergic function. Nat Neurosci. 2010
Oct;13(10):1190-8. doi: 10.1038/nn.2623. Epub 2010 Sep
5. PMID: 20818386; PMCID: PMC2947586.
6. Zhu H, Pleil KE, Urban DJ, Moy SS, Kash TL, Roth BL. Chemogenetic inactivation of ventral hippocampal glutamatergic neurons disrupts consolidation of contextual fear memory. Neuropsychopharmacology. 2014
Jul;39(8):1880-92. doi: 10.1038/npp.2014.35. Epub 2014
Feb 14. PMID: 24525710; PMCID: PMC4059896.
7. Chung L. A Brief Introduction to the Transduction of Neural Activity into Fos Signal. Dev Reprod. 2015
Jun;19(2):61-7. doi: 10.12717/DR.2015.19.2.061. PMID: 27004262; PMCID: PMC4801051.