
Adam Quackenbush
Senior Thesis | 2024

Developing and Applying an Inclusive
Polygenic Risk Score to Alzheimer’s Related Traits
Adam Quackenbush Boston University Academy, Boston, MA USA
adamq@bu.edu
Abstract
Although we often think of genetics in the context of Mendel’s laws with the inheritance of single genetic variants leading to distinct physical traits, modern genetics has taught us that most traits are controlled not by single variants but by hundreds or thousands of variants, each exerting small effects that combine to influence traits including the risk of disease. Polygenic Risk Scores (PRSs) are a way of estimating the cumulative effects of large numbers of genetic variants and have become a standard tool in modern genetics. However, they suffer from being highly biased toward populations of European descent, reflecting biases in earlier genetic data. In this study, we present an evaluation of Inclusive Polygenic Risk Scores (iPRS) for brain MRI and biomarkers within the context of the UK Biobank. Our work extends upon existing methodologies, notably the Batch Screening Iterative Lasso (BASIL) algorithm, to refine predictive models for brain-related traits. By focusing on the inclusion and analysis of diverse ancestry groups, we address a critical gap in current iPRS models, which predominantly center on European ancestry data sets. Our study evaluates brain MRI data from individuals with Alzheimer’s disease and matched controls,
comparing our inclusive models’ performance against existing benchmarks, primarily those established by Tanigawa et al., 2022. We will use advanced statistical tools, including penalized regression models, to assess the predictive performance of these traits systematically. These findings reveal significant implications for the transferability of iPRS models across various ancestries, offering insights into the potential improvements over existing, more limited demographic models.
Introduction
Alzheimer’s disease is a significant and debilitating neurodegenerative disorder that primarily affects the elderly population. It is the most common cause of dementia, accounting for approximately 60-80% of all dementia cases. The disease is characterized by the progressive loss of cognitive abilities, including memory, thinking, and reasoning, leading to functional impairment and a decline in daily living activities. The impact of Alzheimer’s disease extends beyond the affected individuals to their families, caregivers, and society as a whole. The disease places a heavy emotional, physical, and financial burden on caregivers who often provide round-the-clock support to their loved ones. Alzheimer’s also poses a significant economic burden on healthcare systems and society due to the high costs associated with diagnosis, treatment, and long-term care.
Alzheimer’s is a complex condition with both genetic and environmental factors contributing to its risk. Advancing age is the most significant risk factor for Alzheimer’s disease, but certain lifestyle and environmental factors have been associated with an increased Alzheimer’s risk. Conditions that affect the heart and blood vessels, such as high blood pressure, high cholesterol, diabetes, and obesity, may increase the risk of Alzheimer’s. Sleep apnea and chronic sleep deprivation have been associated with a higher risk of cognitive decline and Alzheimer’s disease; these have also been linked to an increased risk of cardiovascular disease, and there may be associations between the three conditions. The biological sex of an individual also plays a significant role in disease risk, with women being twice as likely to
develop the disease, even correcting for the fact that women, on average, live longer than men.
Scientists have long known that having a family history of Alzheimer’s disease is a significant risk factor for Alzheimer’s. People who have a first-degree relative, such as a parent or sibling, with Alzheimer’s have a higher risk of developing the disease themselves. The risk increases further if multiple family members are affected. This is strong evidence that there is a genetic component to the disease, and scientists have used family-based genetic mapping studies and genome sequencing to identify potential genetic factors contributing to disease risk.
The most well-known and significant genetic risk factor is a mutation in the apolipoprotein E (APOE) gene.1 There are three common forms of the APOE gene known as APOE2, APOE3, and APOE4. The APOE4 variant is associated with an increased risk of developing Alzheimer’s disease,2, 3 while APOE3 is neutral, and APOE2 may have a protective effect. However, it’s important to note that having the APOE4 gene does not guarantee that a person will develop Alzheimer’s, and some individuals without the APOE4 gene may still develop the disease. Ultimately, what this indicates is that the genetic factors contributing to disease development go beyond a single gene and instead arise from multiple genetic factors meaning that Alzheimer’s is an example of a polygenic trait.
The Evolution of
Genomic Studies and the Emergence of Genome-Wide Association Studies (GWASes)
Uncovering the genetic causes of diseases that have an inherited component was greatly advanced by the sequencing of the human genome, which is the collection of DNA within a human cell. DNA is a long-chain polymeric nucleic acid made of subunits called nucleotides (or bases), which are arranged in two long strands that form a spiral called a double helix. Each nucleotide contains a base (adenine [A], cytosine [C], guanine [G], or thymine [T]), a sugar molecule, and a phosphate group. The sequence of these bases along the DNA strand determines the genetic information available for building and maintaining an organism, similar to the way letters of the alphabet appear in a particular order to form words and sentences.
The Human Genome Project was an ambitious undertaking to determine the sequence of a reference portion of the human genome, which contains more than three billion DNA bases in total. After the publication of the draft genome sequence in 2001, including a catalog of the nearly 25,000 human genes encoded within, scientists turned their attention to understanding what differences existed between the genome sequences of individuals and to identifying those differences that might lead to the diversity of traits we observe in people, including their risk for various diseases. Surprisingly, scientists were not able to link most diseases to single genetic differences and quickly realized that rather than a single genetic variant affecting a single trait, there must be many genetic variants that work together to influence each individual’s manifestation of traits, or their phenotype.
As scientists began to explore the human genome sequences of additional individuals, they quickly discovered that the most common type of genetic difference is what is known as a single nucleotide polymorphism (SNP), a location in the genome where any individual might have a single base letter difference from the most common, reference genome sequence. A large-scale study called the 1000 Genomes Project began to identify common SNPs, meaning that they were genetic variants that appeared in at least 5% of the population. The goal was to find variants that were common enough that they might be linked to phenotypic traits, but not so rare that they were unlikely to play a role in determining common traits. Although scientists discovered that any two human genomes are approximately 99.9% identical (that is, one SNP difference out of 1000 nucleotides within the genome between them), given that every individual carries two copies of the genome (one inherited from their mother, the other from their father), that means that each of us has approximately at least six million locations in our genomes where we might carry differences from the genomes others.
The landscape of genomic research has undergone a significant transformation with the advent of the GWAS (Figure 1).
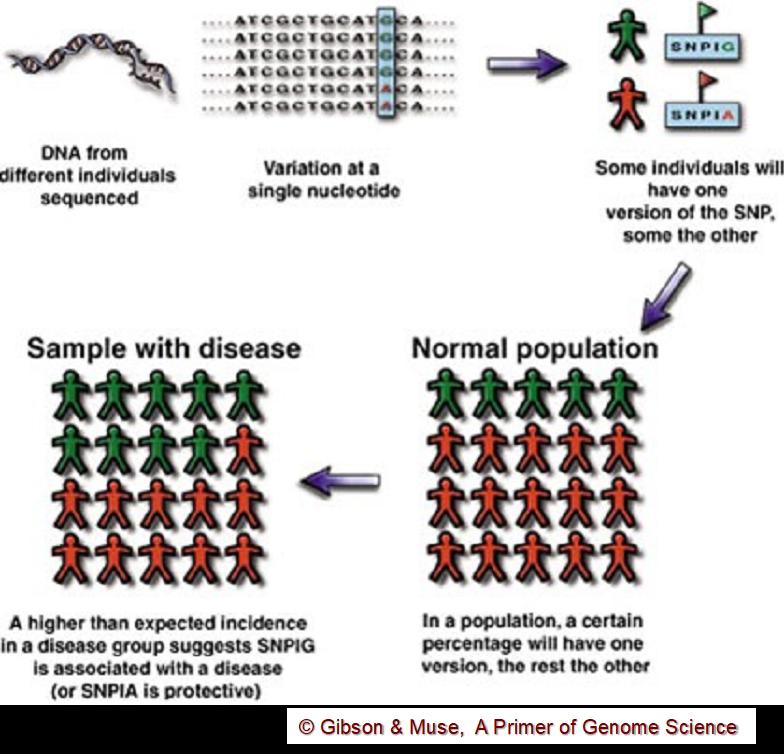
Figure 1. Conceptual overview of a GWAS study. A location where a common genetic variant exists is identified in the genome. To determine whether that SNP is associated with a particular trait (such as a disease), a population of individuals with the disease and a “control” normal population are both “genotyped” at that SNP location. A GWAS study looks for variants that occur in the disease population with a greater frequency than expected by chance.
GWASes start with a catalog of common genetic variants that will be used to test for the association of variants with a
particular trait. A “test” study population and a matched population of normal “control” individuals are identified and their SNP profile, or genotype, are measured at each of the variant locations. For each SNP variant, the frequency in the test population is compared to that in the control population, and those SNPs that are found in the test population more frequently than expected by chance are determined to be associated with the trait of interest (Figure 2).
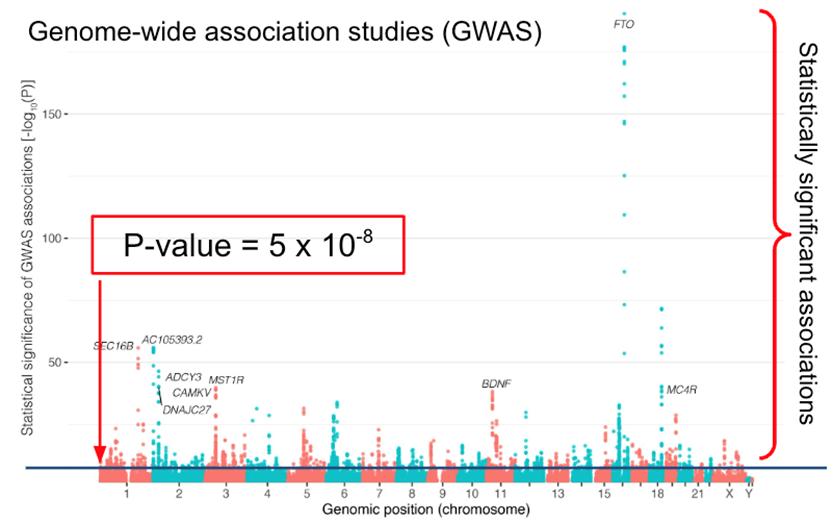
Figure 2. A “Manhattan Plot” showing SNPs distributed across the genome and the estimated statistical significance of each SNP and its association with obesity. Because of the “multiple testing problem” genome-wide significance is set at p < 5⋅10-8. Two of the most significant genes have an obvious connection to obesity. The fat mass and obesity associated (FTO) gene is associated with the brain derived neurotrophic
factor (BDNF) pathway. FTO is a nuclear protein that regulates body weight. It is capable of demethylating both DNA and RNA and may be involved in epigenetic modulation of DNA and the regulation of RNAs. FTO may also play a role in appetite regulation and resting energy expenditure.4
Because of a statistical issue known as the multiple testing problem that occurs when many more hypotheses are being tested (in this case, the association of 6 million SNPs with disease) than individuals being tested, an extremely stringent statistical significance is required to conclude that there is an association (p < 5⋅10-8).
GWASs have enabled researchers to identify genetic variants associated with various diseases and traits by scanning genomes from different populations to identify SNP variants that are more common in populations with a particular trait than one would expect by chance. This approach has been pivotal in unraveling the complex genetic architectures underlying numerous conditions, including disorders such as Alzheimer’s. However, GWASes for complex traits (including most diseases) typically find hundreds, if not thousands, of significantly associated genetic variants. The National Human Genome Research Institute at the National Institutes of Health and the European Bioinformatics Institute established a GWAS Catalog; as of July 2022, more than 45,000 individual GWASes had been conducted that together identified approximately 400,000 SNP-trait associations (Figure 3).5
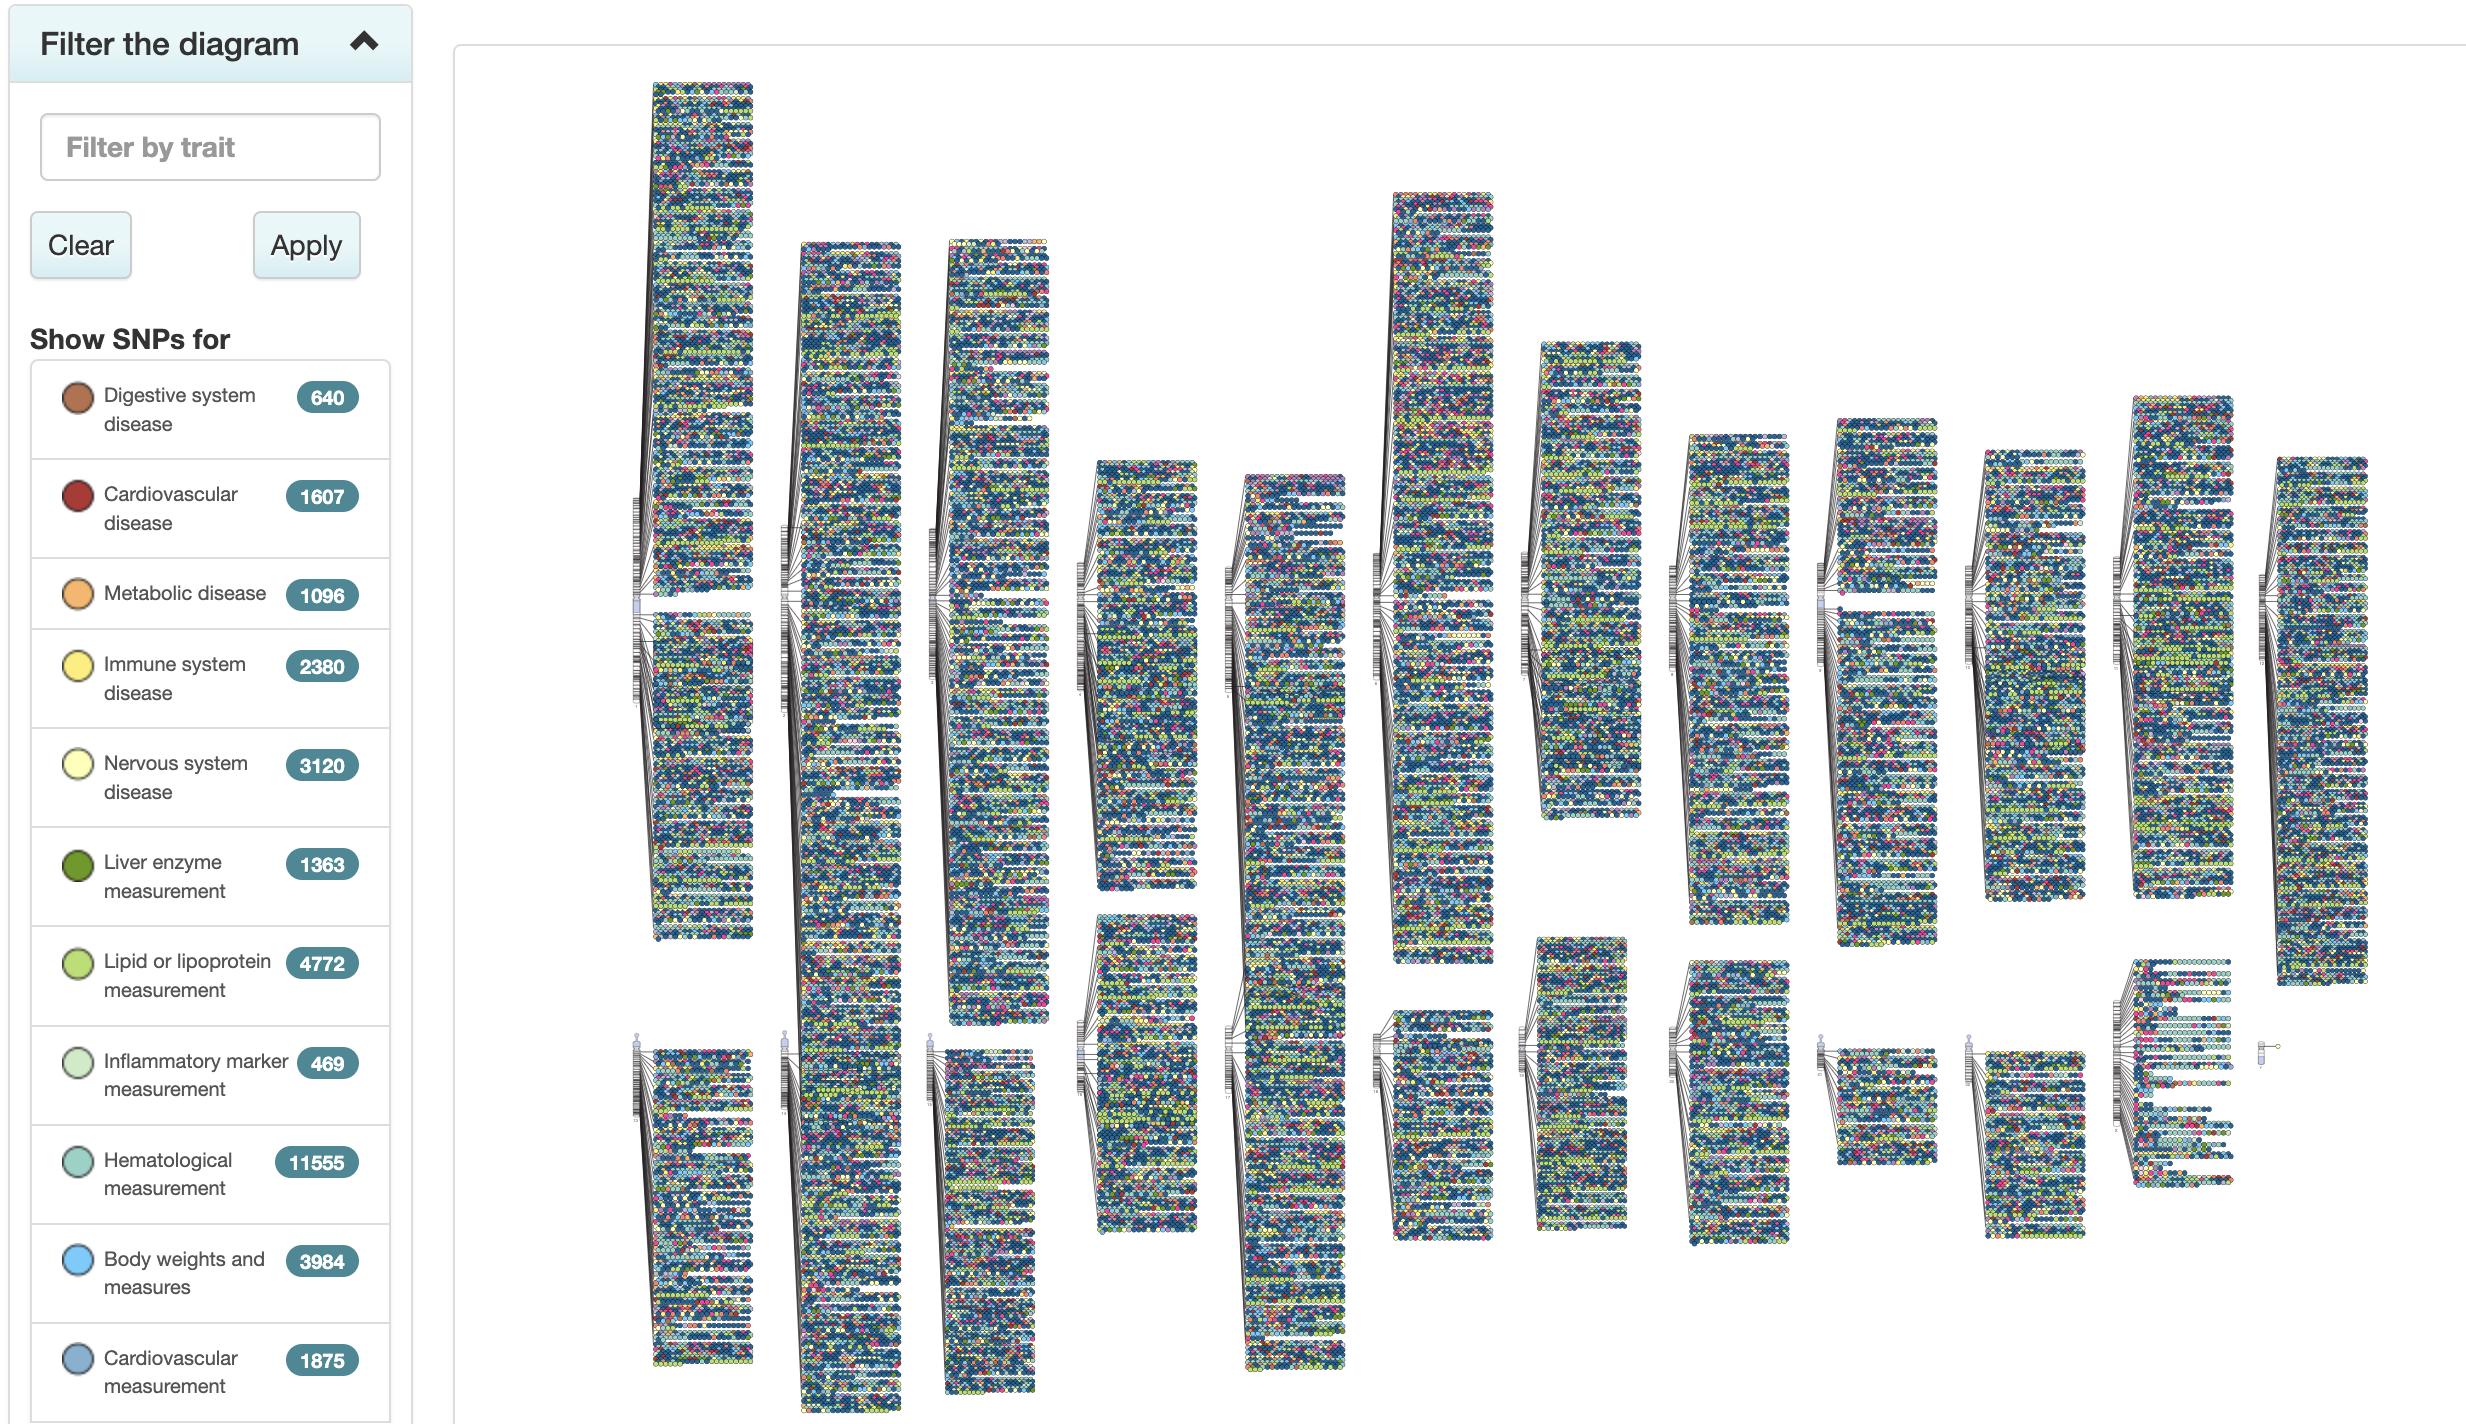
Figure 3. The NHRGI-EBI Catalog of human genome-wide association studies (The GWAS Catalog) has more than 400,000 SNP-trait associations. The diagram here shows these associations mapped back to the region of the genome where the SNP lies. The 22 “autosomes” and the X and Y chromosomes are shown as vertical bars to the right of which are circles representing SNP-trait associations. The color of the circle indicates the general type of trait as shown in the index on the left.5
Although these genetic variants can often be linked to genes, it can be difficult to understand how many of the genes might play a role in the trait in question. More importantly, however, is the fact that any individual in the case group will only carry some, but not all, of the GWAS-identified variants and, in fact, each of the individuals in the control group are likely to carry many of these variants. What that means is that the traits we see arise due to subtle effects of many genetic variants working together. The challenge then is to estimate the combined effects of
individual SNPs and, more importantly, to develop a predictive model that will allow a person’s pattern of SNP genetic variants to predict their disease risk.
Polygenic Risk Scores
Polygenic Risk Scores (PRS) are a method of estimating an individual’s genetic risk of developing a particular phenotypic trait, such as the risk of developing a particular disease or the likelihood of being tall. PRSs are derived from a set of independent risk variants found through GWAS studied to be associated with a trait. For a particular individual, the genetic risk variants they carry are cataloged and a weighted score is calculated by adding together the GWAS effect size for each associated variant; this helps one obtain an estimate of that individual’s genetic predisposition to the relevant trait. The calculation of PRS assumes an additive genetic architecture, meaning that the effects of individual variants are independent and therefore the total risk due to a person’s genetic background is simply the sum of the effects of the individual variants they carry.
Although this is a somewhat simplistic model, it reflects the current best understanding of how variants contribute to complex disorders. PRSs may be useful for estimating an individual’s lifetime genetic risk of disease, assisting in early stages of diseases for diagnosis, or informing treatment choice. Indeed, PRSs have shown promise in a variety of clinical and research settings. For example, PRS has been used in differentiating between type 1 and type 2 diabetes–identifying individuals at preclinical stages of type 2 diabetes and in improving upon HLA typing for celiac disease.6
In 2022, Tanigawa et al. performed a systematic assessment of the predictive power of polygenic risk scores (PRSs) for 1,565 traits cataloged for more than 269,000 individuals of white British ancestry in the UK Biobank.7 They were able to identify 813 sparse PRS models that were significantly better (p < 5⋅10-5) than simpler models that consider age, sex, types of genotyping arrays, and combinations of SNPs identified using principal component analyses. They also found that the performance of the PRS improved as they included more SNPs. However, the most striking finding was that PRS developed using data from individuals of European descent were far less accurate when evaluated on individuals of non-European descent, failing to accurately predict traits.
Their results are consistent with other reports that performance of PRS can vary widely in admixed individuals (those of mixed racial backgrounds) or other demographic groups (Figure 4) as well as by age and sex.
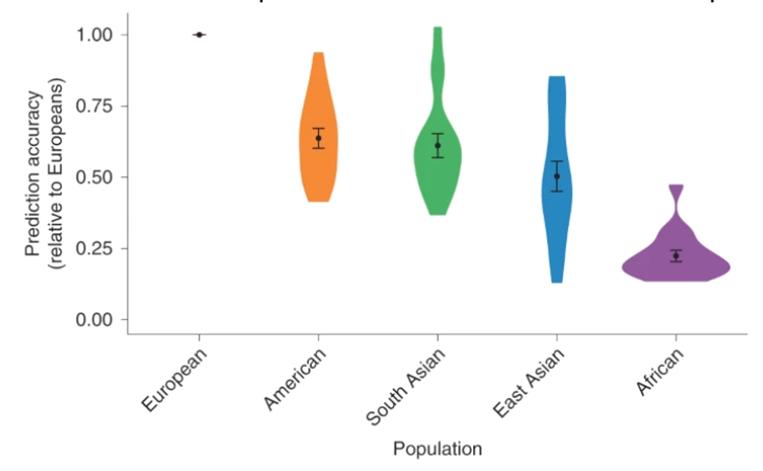
Figure 4. Although polygenic risk scores may perform extremely well in populations of European ancestry, their predictive accuracy falls when used to predict traits based on genotype for non-European individuals. Violin plots from Martin et al. showing that PRSs developed in European populations do not perform well in other populations; the genetic prediction accuracy was 1.6-fold lower in Hispanic/Latino Americans, 1.6-fold lower in South Asians, 2.0-fold lower in East Asians and 4.5fold lower in Africans. The dots in each plot show the average accuracy (and the standard deviation) while the width of each plot shows the distribution of individuals at that prediction accuracy.8
Most importantly, PRSs are susceptible to biases, particularly if the individual’s genetic background is not adequately represented by the original study population, which is often the case for individuals of non-European ancestries.8,9 This bias against non-Europeans is largely due to the fact that most GWASes have been conducted in populations that are dominated
by people of European descent, with Asians, Africans, Indigenous peoples from around the world, and others underrepresented (Figure 5).8,10
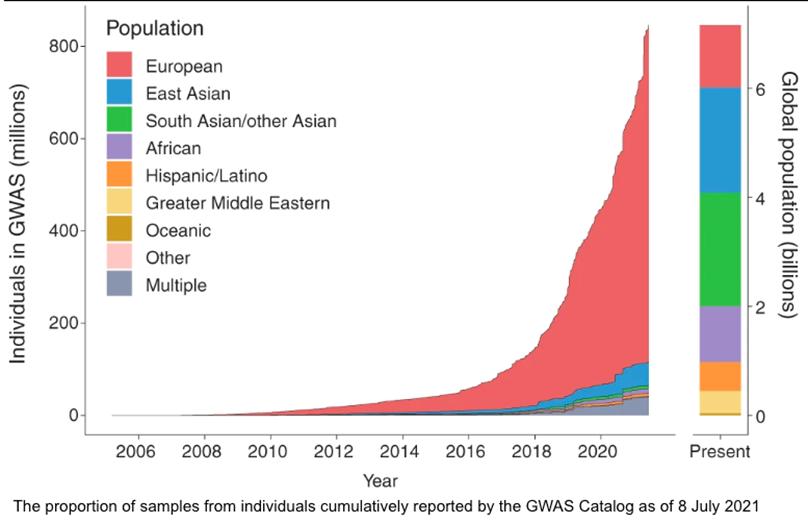
Figure 5. The representation of individuals from various ethnic groups that have been profiled in GWASes from Fatumo et al.11 Given the way in which study populations have been dominated by inclusion of individuals of European descent, it is not surprising that PRSs perform better in this group.
Inclusive Polygenic Risk Scores (iPRS)
Inclusive Polygenic Risk Scores (iPRS) are an evolution of PRS designed to address the lack of diversity in genetic studies and represent an important advance towards personalized medicine that
is more inclusive and representative of global genetic diversity. By incorporating genetic data from a broader range of populations, iPRS can offer more equitable and accurate health risk assessments, contributing to better health outcomes across all populations. iPRS is a computational approach that improves PRS transferability by modeling ancestry-shared genetic effects by directly applying penalized regression on individual-level data across admixed individuals. Across 60 hematologic and anthropometric traits in UK Biobank, Tanigawa and Kellis previously demonstrated that iPRS could achieve an average improvement of 60.8% for African, 11.6% for South Asian, 7.3% for non-British white, 4.8% for white British, and 17.8% for the other individuals.12
Recognizing the need for broader representation in genetic studies, this study focuses on the development of improved Inclusive Polygenic Risk Scores. These models aim to incorporate a more globally representative genetic diversity by utilizing data sets that include substantial participation from various ethnic and racial backgrounds. Our approach is not just a response to the inclusivity gap but also an exploration into the potential improvements that such diversity can bring to the accuracy and efficacy of iPRS models.
The Role of the UK Biobank in Diversifying Genetic Data
The UK Biobank project is a keystone study, encompassing an extensive data set of approximately 500,000 individuals aged 40 to 69 from the United Kingdom.13 The initiative is an incredible resource, offering extensive phenotypic and health-related
information about each participant. This data set includes diverse biological measurements, lifestyle indicators, biomarkers, and comprehensive body and brain imaging. The genetic data analysis within the UK Biobank project involves performing genotype quality assessment and population structure analysis, efficient phasing (separating maternal and paternal genotypes in an individual) and genotype imputation (estimating missing data), as well as identifying of genetic associations and complex trait bases. The genetic data set comprises genotypes from 488,377 participants, with high-quality control standards to ensure high genotype concordance and comparable allele frequencies to independent sources. Apart from the genotypic data, the UK Biobank includes extensive phenotypic insights, objective measures of physical activity, repeat assessments, and multi-modal imaging assessments. Such comprehensive data allows precise definitions for different measures of health and disease (including disease subtypes) and provides an opportunity to tease out genetic and environmental contributors to disease. The impact of the UK Biobank project is widespread across numerous projects and studies. From unraveling immune-mediated disease associations with known HLA connections to conducting genome-wide association studies (GWAS) for standing height, the data set serves as a vital nexus between genetic variation, disease susceptibility, and environmental influences.
Our study specifically was designed to use the UK Biobank to examine brain MRI data, exploring the predictive performance of iPRS models across different ethnicities. Our study aims to bridge the existing gap in genetic research in three ways: (1)
developing iPRS models for brain MRI and biomarkers by leveraging the UK Biobank, (2) assessing and comparing the performance of these models against commonly used PRS models predominantly based on European data sets (which is based on the work by Tanigawa et. al. 2022)7, and (3) considering the implications of using diverse data sets on the accuracy and applicability of iPRS, particularly in non-European populations.
Materials and Methods
Data Acquisition and Preliminary Setup
This project was designed to use extensive brain MRI data and biomarkers from the UK Biobank, a comprehensive biomedical database encompassing genetic and health information from approximately 500,000 UK participants.8 The project was conducted under the guidance of Yosuke Tanigawa from the Kellis Lab at the Massachusetts Institute of Technology during the Summer of 2023. Initial data acquisition involved securing access to the UK Biobank database, with a focus on identifying and extracting relevant phenotypic fields and imaging data. To facilitate data analysis and collaboration, a GitHub repository (ID: adamq06) was used for code sharing and version control. Secure shell (SSH) commands were essential to the project’s remote computing needs and accessing computational resources hosted on luria.mit.edu. This setup ensured a secure and efficient pipeline for data processing and analysis that allowed us to safely analyze potentially identifiable data that included individual genotype associations.
Phenotype Definition and Data Parsing
Performing a robust GWAS and developing a PRS requires that one have robust phenotypes that can be used in the analysis since we need to accurately classify each individual. We used tools such as PHESANT (PHEnome Scan Analysis Tool), which was helpful in automating the association analysis between various phenotypic traits and genetic data. PHESANT’s rule-based system categorizes and tests associations across diverse phenotypic data types.14 Additionally, we incorporated digital phenotyping methods, which involved both self-reported and digitally collected data, serving to augment the traditional approaches and expand the horizons of phenotype-genotype associations. This approach was beneficial in providing a more comprehensive understanding of the data. For the analysis of brain MRI data, our approach focused on selecting MRI-derived phenotypes that were either highly predictive or biologically significant. We then categorized these phenotypes, allowing for more detailed and accurate genetic association studies. This process was essential in ensuring the precision and relevance of our research findings.
Lasso and Elastic Net Regression and PRS Modeling
In analyzing our GWAS data, we chose the Batch Screening Iterative Lasso (BASIL) framework as a platform for estimating polygenic risk scores.15 BASIL is designed to allow users to build a scalable solution for identifying SNPs that are associated with traits in very large data sets. BASIL was appropriate as our goal was test each of millions of SNP variants in populations to identify those that are most predictive of physical
characteristics of the brain, identified from MRI data and associated with Alzheimer’s. This would be done in both European and non-European populations with the goal of comparing these to find groups of SNPs that have a high predictive power irrespective of the ethnic origins of each individual. The selected group of SNPs, selected from the millions of SNPs measured in each individual, would then be used as “features” to build an inclusive polygenic risk score (iPRS) that could be used to predict the likelihood of the physical traits identified in the MRI and, ultimately, to predict risk of Alzheimer’s.
One advantage of BASIL is that it can use two methods for testing SNP-trait associations and building predictive models while accommodating the large-scale nature of the UK Biobank data.15 To do this, BASIL iteratively refines the model by selecting informative genetic variants while penalizing the inclusion of less contributory ones, thereby enhancing the performance and interpretability of the resulting iPRS predictors.
Linear regression is a statistical method that can determine the relationship between a dependent variable and one or more independent variables by fitting a linear equation to observed data. In its simplest form linear regression involves a single independent variable and finds a linear function that predicts the dependent variable as accurately as possible. This function is represented by the equation,
" = $! + $" ' + ( ,
where " is the dependent variable, ' is the independent variable, "! is the " -intercept, "" is the slope of the line (showing the effect of the independent variable on the dependent variable), and # represents the error term, accounting for any variation not explained by the linear relationship.
The goal in performing linear regression is to get a “best fit” of a line to the available data by minimizing the sum of the squared differences between the observed values and the values predicted by the model, a process known as least squares estimation. This requires minimizing the “residual sum of squares” (also called its “objective function”) which for ) data points is given by
($! + $" '" ))$ % # &" , or for / “predictor” variables by
,
where we imagine that the phenotype y depends on two or more different variables that are measured in i distinct individuals (note that when p is set to 1, this equation reduces to the previous one).
Lasso (Least Absolute Shrinkage and Selection Operator) is an extension of linear regression that introduces the concept of “shrinkage,” a process in which data values are shrunk towards a central point such as the mean. Lasso is often used in statistics and
machine learning to predict outcomes by selecting a subset of important features while penalizing less important ones. Unlike standard linear regression, which minimizes a residual sum of squares, Lasso regression adds a penalty equal to the absolute value of the magnitude of coefficients. This penalty term is what sets Lasso apart, as it encourages the reduction of the coefficients of less important features (measurements) to zero, effectively selecting the most predictive feature and producing in a model that is easier to interpret. This is achieved by introducing a “tuning” (or “regularization”) parameter, $, that imposes a penalty on the size of the regression coefficient so that the objective function becomes,
where "# is the observed value of the dependent variable for the ith observation, '#' the value of the jth predictor for the ith observation, "! is the intercept term, "' is the coefficient for the jth predictor, and n is the total number of observations.
The Elastic Net is a further modification of Lasso that introduces a second tuning parameter to try to tease out subsets of correlated features and select representatives of each by minimizing the extended objective function:
In analyzing GWAS data, where there are millions of potential SNPs measured that might contribute to the expression of a particular phenotype, technique such as Lasso and Elastic Net regression can be important for reducing the number of genetic variants to the smallest number that are predictive of whatever trait we are trying to measure and in doing so, to improve our ability to understand what genes or genetic variants might be driving the physical traits or disease risk.
We used the Snpnet function in BASIL to fit both Lasso and also Elastic Net penalized linear and logistic regression models to large-scale genetic data with the goal of identifying the association between genetic variants and phenotypic traits derived from MRI scans8. We also used Lasso regression in linear models, the “glmnet” package in R, to address the challenges posed by the high dimensionality of the genomic data. The project’s statistical analysis also included the use of “ggplot2” in R for data visualization, comparison between our results and existing models, and in the interpretation of our findings.
Defining Brain MRI Phenotypes
GWASes and the PRSs that are derived from them are based on testing for the association between genetic variants and traits, including physical characteristics, disease risk, disease subtype, or other factors. Although our goal was to understand the
genetic factors that influence Alzheimer’s, the disease is typically late-onset and so relatively few people with samples in the UK Biobank have as yet developed the clinically defined disease. However, there are many brain-based phenotypic measures based on MRI data that have been recorded in the UK Biobank and so our next step in the research was to define and select brain MRI phenotypes for analysis. This process was based on the process established by Tanigawa et al., which entailed selecting the 100 highest scoring predictive performance traits related to brain function, excluding mental health traits (Table 1).12 Unfortunately, as is the case with much biomedical data, particularly data derived from health records (and even electronic health records), there are often places where data are entered incorrectly or inconsistently so that software programs have trouble processing the data. This required a great deal of manual curation during which I meticulously selected and cleaned the data, ensuring the terminology was consistent and could be used in the analysis; this involved, for example, correcting inconsistencies such as replacing “Vol.” with “vol.” to maintain uniformity within and across data sets.
Installation of Analytical Software and Tools
Because this analysis required many data processing and analysis steps that must be performed in a consistent manner, we used several software packages and tools that have become essential for genetic data analysis. This included Conda for managing packages and environments, virtual machines for creating isolated environments in which I could securely analyze protected data that could identify an individual such as their
genome-wide SNP profiles, and the Tidyverse16 collection of R packages for data manipulation and visualization. Additionally, tools like PLINK2,17 a whole-genome association analysis toolkit, were essential for managing and analyzing genotype/phenotype data.
Area Under the Receiver Operating Characteristic Curve (AUC)
One critical method for assessing the performance of a predictive method is the Area Under the Receiver Operating Characteristic Curve (AUC). In making any sort of binary classification (such as Alzheimer’s or healthy control), we want to test whether our prediction for each sample actually captures the true state of that sample. For each prediction, we have four possibilities. First, we might call the sample as one belonging to an Alzheimer’s patient and discover that our call is correct, a True Positive (TP). However, we might call the sample as one belonging to an Alzheimer’s patient and discover that our call is correct as the individual is healthy control, so a False Positive (FP). The two other alternatives are that we might call a sample a healthy control and discover we are correct, so a True Negative (TN), or we might call the sample a healthy control when it is in fact from an Alzheimer’s patient, so a False Negative (FN). In statistics, we then define a “Confusion Matrix” that captures the results of our predictions (Figure 6A).
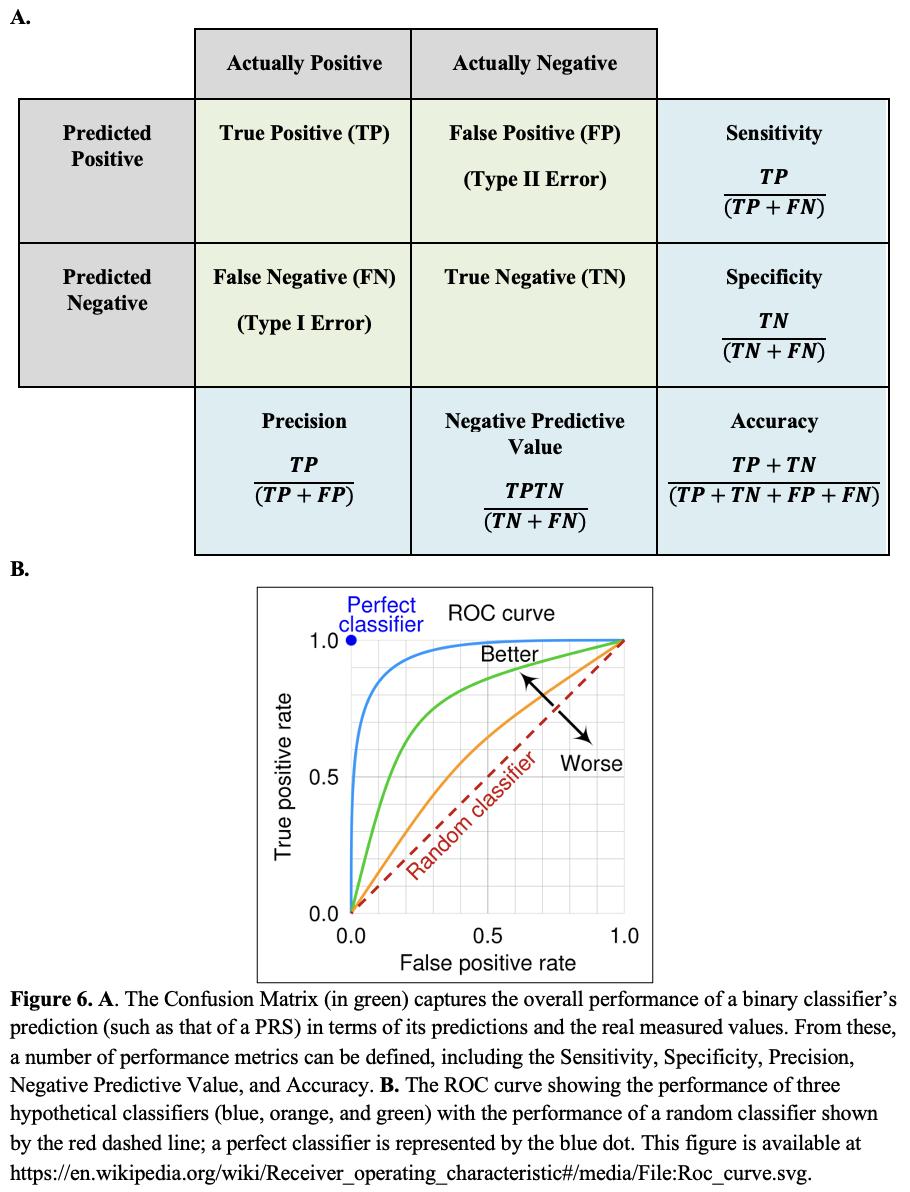
Specificity, Precision, Negative Predictive Value, and Accuracy. B. The ROC curve showing the performance of three hypothetical classifiers (blue, orange, and green) with the performance of a random classifier shown by the red dashed line; a perfect classifier is represented by the blue dot. This figure is available at
https://en.wikipedia.org/wiki/Receiver_operating_characteristic#/media/ File:Roc_curve.svg.
From our measurements of the number of TP, TN, FP, and FN calls, we can define several measures of the performance of our classifier. These include the Sensitivity (also known as the True Positive Rate or Recall), the Specificity (True Negative Rate), the Precision, the Negative Predictive Value, and the Accuracy (Figure 6A). These values can also be used to construct a Receiver Operating Characteristic (ROC) curve, The ROC curve is a plot that displays the trade-off between the true positive rate (Sensitivity) and the false positive rate (1 - Specificity) across a series of thresholds, such as the parameters in a PRS. Essentially, the ROC curve shows how well a model can distinguish between two classes (Figure 6B).
The Area Under the Curve (AUC) is what it sounds like, the area beneath the ROC curve, and it provides a single measure of how well a classifier performs. The AUC value ranges from 0 to 1, where a value of 0.5 suggests that the model has no discrimination capacity, effectively performing no better than random guessing. A value closer to 1 indicates that the predictor is good at distinguishing between classes while a value closer to 0 implies that the classifier consistently makes the wrong predictions (although in practice, AUC values below 0.5 suggest that one might simply need to reverse the predictions to achieve a model with good predictive capabilities). One of the key benefits of using AUC as a performance metric is its independence from the classification threshold and the prior probabilities of the classes. This makes AUC a useful measure for comparing the inherent
performance of models across different data sets or problem contexts. It is particularly advantageous when dealing with imbalanced data sets, where one class significantly outnumbers the other, which is the situation we are attempting to address in creating an iPRS with the imbalances that exist in our genetic databases.
Data Analysis and Phenotyping Code Organization
We adapted UK Biobank data export scripts developed in the Kellis Lab at MIT to export relevant fields from the database and define phenotypes for analysis. These scripts allowed the extraction and categorization of phenotypes, laying the groundwork for subsequent genetic analyses. The phenotyping code we developed was organized and uploaded to GitHub for version control and collaboration so that others working on similar projects could use it for their work.
Results
Fitting an Inclusive Polygenic Risk Score Model
As noted previously, the issue with the standard PRS is that it is based on the assumption that there is a single population in which we are evaluating the link between genetic background and particular traits. However, we recognize that there are many different subpopulations that we may be studying, including those defined by factors such as age, sex, or racial or ethnic group. While we understand that race is a societal construct and that there is typically more genetic variation within racial and ethnic groups
than between them, we also acknowledge that there are often different distributions of SNP variants within populations that could potentially interact to influence the expression of traits, and so race and ethnicity (as are sex and gender) are approximations that can help account for those interactions.
Consequently, we can imagine recasting the creation of an inclusive polygenic risk score (iPRS) as the modification of the least squares objective function to include additional factors that capture demographic information as additional variables, so we have,
where "# is the observed value of the dependent variable (the phenotype the ith individual in the study), '#' the value of the jth predictor (in this case, each SNP) for the ith individual, "! is the intercept term, "' is the coefficient for the jth predictor, and n is the total number of observations as before. In comparison with the Elastic Net model presented earlier, we replace $" and $$ by 4, %# , and & , which is essentially equivalent up to the addition of a constraint on the coefficients of the two final terms. Finally, we also add a population-specific term as an additional constraint on the model where 7#* are “covariates” that capture additional
potential variables such as age, sex, gender, or racial or ethnic group and '#* are the additional coefficients that we want to estimate that help to weight effects of these covariates on the expression of a particular trait.
Our goal in this project was to test whether an iPRS would do a better job of predicting MRI features related to Alzheimer’s disease in populations of mixed ethnicity than did the standard Eurocentric PRS score derived from the UK Biobank. And so, we began by adapting the Snpnet code in BASIL to include these additional parameters and validated the code using the blood data from Tanigawa et. al.7
We anticipate that the newly developed iPRS models will exhibit a significant enhancement in predictive accuracy for Alzheimer’s disease risk across various ethnic groups compared to models developed in 2022. Specifically, we expect the Area Under the Receiver Operating Characteristic Curve (AUC) values to increase, indicating more reliable Alzheimer’s risk prediction in a diverse population. This expected improvement is predicated on the incorporation of a wide range of genetic backgrounds into the risk scoring models, aiming to mitigate the bias towards populations of European descent. By training the iPRS model and then analyzing its performance in various subgroups, what we aim to show is an enhanced predictive power that is particularly pronounced in populations previously underrepresented in genetic studies. This would be a critical finding, highlighting the potential for more equitable and accurate genetic risk assessments across diverse populations. The improvement in predictive performance in these subgroups would not only validate the iPRS approach but
also indicate a step towards a more inclusive future in genomic medicine.
Testing of the of BASIL Snpnet Pipeline and Debugging
In developing new software and analytical methods, the starting point is to run existing methods to ensure the data, software, and analytical pipelines are performing properly and to provide a benchmark against which new methods are evaluated. As a start, we chose to recreate the analysis of Tanigawa et. al.7 focusing on the prediction of traits based on analysis of white blood cells. My initial attempts to run the baseline Snpnet pipeline revealed numerous bugs, particularly with a routine called PLINK2 that provides the overall framework in which the PRS would be calculated. All the tools I used in this analysis are open-source software that are made freely available to members of the research community. While this ensures that the methods are widely used, it also means that the tools can, at times, become incompatible as the programming languages are updated and the tools themselves lag in the updating process. Errors can also occur if the format of public databases changes and the software is no longer compatible with the data format. Consequently, I had to undertake a thorough debugging process in which I found many issues, ranging from errors in sub-setting various columns that arose because the columns no longer existed in the UK Biobank data, problems with data formatting causing errors in reading and performing calculations (for example, numbers now being interpreted as characters and so incomputable), and memory management issues that arose due to the growing number of individuals with data in the UK Biobank. Through iterative testing and troubleshooting,
these challenges were systematically addressed, allowing me to successfully apply the pipeline for analysis of trial white blood cell data.
Genetic Analysis and Visualization of MRI data in Alzheimer’s
Having successfully gotten the Snpnet to run, and after downloading and standardizing the quantitative MRI data features. We used the Snpnet pipeline with both the original PRS and the iPRS models to analyze genetic associations with on the brain MRI phenotypes. Our goal was to look at various ethnic groups within the UK Biobank to understand how well our improved iPRS performed in various ethnic groups.
We began with by using one of the features derived from the MRI data, INI25890, which measures the volume of gray matter in the Left Ventral Striatum which had previously been analyzed by Tanigawa et. al.12 (Table 1).
T1_structural_ brain_MRI INI25005
T1_structural_ brain_MRI INI25000
Vol. of gray matter (normalised for head size) gaussian 4.49E-01
Volumetric scaling from T1 head image to standard space gaussian 4.17E-01
GM Vol. Norm.
Volumetric scaling from T1 head image to standard space
T1_structural_ brain_MRI INI25001
Vol. of peripheral cortical gray matter (normalised for head size) gaussian 4.11E-01
T1_structural_ brain_MRI INI25010 Vol. of brain, gray+white matter gaussian 3.85E-01
Peripheral cortical GM Vol. Norm.
Brain, GM+WM Vol.
T1_structural_ brain_MRI INI25008 Vol. of white matter gaussian 3.62E-01 WM Vol.
T1_structural_ brain_MRI INI25006 Vol. of gray matter gaussian 3.62E-01 GM Vol.
T1_structural_ brain_MRI INI25009 Vol. of brain, gray+white matter (normalised for head size) gaussian 3.50E-01
T1_structural_ brain_MRI INI25002 Vol. of peripheral cortical gray matter gaussian 3.50E-01
Diffusion_brai n_MRI INI25445
Mean ISOVF in fornix on FA skeleton gaussian 3.12E-01
T1_structural_ brain_MRI INI25012 Vol. of thalamus (R) gaussian 3.02E-01
T1_structural_ brain_MRI INI25011 Vol. of thalamus (L) gaussian 2.93E-01
Brain, GM+WM Vol. Norm.
Peripheral cortical GM Vol.
Mean ISOVF in fornix on FA skeleton
Thalamus Vol. (R)
Thalamus Vol. (L)
T1_structural_ brain_MRI INI25004 Vol. of ventricular cerebrospinal fluid gaussian 2.87E-01 VC Fluid Vol.
T1_structural_ brain_MRI INI25016 Vol. of putamen (R) gaussian 2.78E-01
Putamen Vol. (R)
Diffusion_brai n_MRI INI25061
T1_structural_ brain_MRI INI25003
T1_structural_ brain_MRI INI25015
T1_structural_ brain_MRI INI25853
T1_structural_ brain_MRI INI25782
T1_structural_ brain_MRI INI25846
T1_structural_ brain_MRI INI25025
T1_structural_ brain_MRI INI25890
Mean FA in fornix on FA skeleton gaussian 2.68E-01
Vol. of ventricular cerebrospinal fluid (normalised for head size) gaussian 2.58E-01
Vol. of putamen (L) gaussian 2.55E-01
Vol. of gray matter in Lingual Gyrus (R) gaussian 2.38E-01
Vol. of gray matter in Frontal Pole (L) gaussian 2.38E-01
Vol. of gray matter in Frontal Orbital Cortex (L) gaussian 2.36E-01
Vol. of brain stem + 4th ventricle gaussian 2.35E-01
Vol. of gray matter in Ventral Striatum (L) gaussian 2.22E-01
Mean FA in fornix on FA skeleton
V.C. Fluid Vol. Norm.
Putamen Vol. (L)
GM in Lingual Gyrus Vol. (R)
GM in Frontal Pole Vol. (L)
GM in Frontal Orbital Cort. Vol. (L)
Brain stem + 4th ventricle Vol.
GM in Ventral Striatum Vol. (L)
Table 1. A list of traits represented in the UK Biobank and identified by Tanigawa et al., 2022 using a general linear model to identify those features that were most significantly associated with
patterns of genetic variation. Note that these traits are all MRIderived volume estimates for different brain regions.
While Alzheimer’s disease is primarily known for its impact on memory and cognitive functions due to the degeneration of the hippocampus and cortex, there is increasing evidence that it also affects brain areas involved in emotion, reward processing, and motivation well before cognitive symptoms become apparent. Neuroimaging studies have found changes in the striatum of Alzheimer’s patients that include reduced volume and altered activity patterns.18 Since the ventral striatum is connected to other parts of the brain affected by AD, such as the hippocampus and prefrontal cortex, disruptions in these networks could contribute to the disease’s symptomatic presentation, including apathy, which is a common non-cognitive symptom of AD. As such it is considered a potential biomarker of early AD.
Given that the goal of GWASes is to link an individual’s genetic background to traits, and that polygenic risk scores (PRS) are designed to identify combinations of genetic variants that are predictive of a particular trait, the volume of gray matter in the Left Ventral Striatum is an ideal candidate both for assessing PRS methods and for investigating how best to estimate PRS in both European and non-European populations. Our plan was to analyze the data to fit various models (PRS, iPRS) for multiple imaging features related to Alzheimer’s and then to evaluate the performance of those models on the entire population as well as on subsets of the data.
The plan called for us to identify PRS and iPRS models, to test their performance by creating a confusion matrix, plotting ROC curves, and assessing the AUC to determine both which models performed the best and to understand how performance depended on various parameters appearing in the data. The performance of the PRS and iPRS would have been visualized using violin plots and the relative change in performance between iPRS and the older PRS would have been measured and reported. To that end, I created several data analysis and visualization scripts in R using ggplot2 for visualizing and interpreting the resulting data.
However, while we were able to recreate the 2022 analysis of white blood cell data using our improved method (ignoring ethnicity), our attempt to analyze the MRI data failed. When we downloaded the covariate data for INI25890, we discovered that the software repeatedly crashed. After attempting to debug the code, we recognized that the covariate data itself was corrupted and incomplete, causing the software to throw an error code. We reached out to the Biobank staff and they were unable to resolve the issue. In fact, we were not able to obtain covariate data for any of the brain measurements that had previously been linked to Alzheimer’s.
We then attempted to analyze other traits but found that covariate data related to sex, age, self-reported ethnicity, and selfreported race were all corrupted. Consequently, as of the submission date of this Thesis, we have not been able to complete the planned analysis.
Anticipated Brain MRI Phenotype Results
In the analysis of brain MRI phenotypes, we hypothesized that distinct patterns of gray matter volume changes would be correlated with and predicted by specific genetic variants identified by creating the iPRS models. Although we began with the Left Ventral Striatum, many regions of the brain, including the hippocampus and the prefrontal cortex, are known to be affected in Alzheimer’s disease and these regions are expected to manifest physical changes in morphology that can be detected by MRI. We believed that many of the genetic markers linked to Alzheimer’s disease would also be found to be predictive of brain MRI morphology. This correlation was expected to be more pronounced in patients with Alzheimer’s compared to controls, suggesting a shared genetic influence on both brain structure and Alzheimer’s.
Consequently, we planned to test this hypothesis by comparing the SNPs predictive of brain morphology through the iPRS to SNPs that had been linked to Alzheimer’s in GWASes. Finding these associations would not only validate the iPRS methodology, but it would provide additional evidence correlating morphological changes in brain regions with the risk for Alzheimer’s and potentially allowing MRI features to be used as biomarkers to predict Alzheimer’s risk. The advantage relative to genome-wide SNP profiling, is that the use of biomarkers derived from imaging studies are easier to integrate into a clinical workflow.
More important than linking SNPs to Alzheimer’s risk, however, is the development of iPRS that are more highly
predictive of MRI brain morphology measures across racial and ethnic groups that are the current PRS models which perform best in the European populations that form the bulk of their training data. Using ROC curve analysis for the entire study population and then stratified in subgroups based on self-reported ethnicity, our plan was to compare the predictive power of the iPRS to the older PRS model and to use violin plots and other visualization tools to display the results.
Discussion
Interpreting Our Expected Findings
When the Human Genome was sequenced, scientists began to catalog genetic variants across human populations with the goal of identifying SNPs that could help explain phenotypic traits, including those associated with disease risk. While there are very few diseases or traits that can be explained by the presence of a single SNP or even a small number of SNPs but rather by hundreds, or even thousands, of SNPs that together help to determine the phenotypes we observe. Given this setting, it would not be surprising to discover that there are differences in which SNPs are most predictive based on other SNPs that comprise their genetic background.
The work we had planned to carry out would have allowed us to determine whether our improved inclusive polygenic risk score (iPRS) would have greater predictive power than PRSs based on a majority racial or ethnic group. If, as expected, we were to discover that the iPRS did allow a more accurate prediction of
disease risk, the findings would have underscored the importance of integrating genetic data from diverse populations into any genetic studies and the imperative to include individuals from historically underrepresented groups. Doing so would not only improve the results for everyone by improving PRS accuracy, but it would also represent a major advancement toward the goal of equitable genetic research which should be seen as an ethical imperative in genetic research and healthcare provision.
Comparative Analysis: Expected Differences Between PRS and iPRS Model Performances
At the heart of methods for estimating polygenic risk scores is the use of Lasso regression. By modifying that regression to include covariates such as age, sex, self-identified race, and selfreported ethnicity the Lasso regression model, we believed that the resulting iPRS would outperform PRS estimates that ignored these and other biologically relevant covariate factors. Using ROC curve analysis, we had hoped to see dramatic improvements in the sensitivity and specificity of the iPRS relative to the PRS. In applying this to brain morphology measures linked to Alzheimer’s, and through careful comparison of SNPs predictive or morphology, we had hoped to establish the genetic links between brain morphology and cognitive disorders such as Alzheimer’s. This would have the potential to improve the detection of dementia and, by analyzing the genes affected by the causative genetic variants, may have led us to testable about the biological mechanisms of Alzheimer’s and other types of dementia.
Addressing Disparities in Polygenic Risk Scores
Most importantly, our anticipated results would have added to the growing body of evidence that PRS models based primarily on European ancestry data sets are less effective and potentially misleading when applied in individuals from non-European populations. Our failure to include more ethnically and racially balanced populations into genetic studies represents a critical gap in genetic research with the potential to diminish both the performance and relevance of genetic biomarkers for predicting health and disease. By investing in genetic studies that prioritize the inclusion of underrepresented groups, we can improve the accuracy of genetic predictions and ensure the benefits of genetic research are equitably shared.
However, it should be noted most genetic studies fail to include sex as a biological variable, and that many GWAS or PRS analyses do not even account for genetic variants falling on the X and Y chromosomes. This is also a significant oversight particularly knowing that there are many diseases such as Alzheimer’s that exhibit strong disease sex biases and the iPRS we proposed here should be able to incorporate sex as a biological variable in the Lasso model.
Methodological Reflections
Despite the expected advancements, we acknowledge that there is still room for improvement, especially regarding computational efficiency and refining phenotype definitions. Future research should explore more advanced machine learning
techniques and new statistical models to further enhance the precision and applicability of iPRS models. The methods used in this study, most notably the adaptation of the Lasso and Elastic Net regression to at least estimate the effects of being a member of a particular ethnic or racial group. As described in the previous section, our failure to include sex as a biological variable represents the next shortcoming we would plan to respect.
It was rewarding to see that the regression model we incorporated into Snpnet pipeline proved to be effective at managing and analyzing data from the large, highly complex UK Biobank. As the cost of genome sequencing continues to fall (now less than $1000), it is likely that, in the foreseeable future that each of us will have our genomes sequences and available to aid in making healthcare decisions. Before long, resources such as the UK Biobank with its 500,000 enrolled patients will be dwarfed by other genetic disease repositories at the national, state, and local levels.
One other element that this study did not attempt to address is the need for better, more precise phenotype definitions. The iPRS model we proposed incorporated covariates as discrete groups members of one sex or a particular racial or ethnic group but all of these exist in a continuum. In the same way, we often group individuals by the disease they are suffering from but fail to account for the fact that diseases such as Alzheimer’s also represents a continuum of traits and that there may even be distinct subgroups within the disease population that are due to differences in background genetics. Refining these disease phenotypes and
determining quantitative measures of health and disease will provide a stronger foundation for future studies.
From a scientific perspective, it would also be interesting to explore advanced machine learning or new statistical models as a way of continuing to refine our predictive methods. As new data and techniques become available, our analytical methods must continue to evolve to ensure that methods are effective not only in a research setting but also in the clinical practice of medicine where the stakes of making accurate conclusions are significantly higher.
Conclusion and Future Directions
Our research lays a foundation for more inclusive genetic studies that better represent global genetic diversity. The development of iPRS models that accurately reflect this diversity is not just a scientific challenge but a global health imperative with ethical and moral dimensions. As we continue to unravel the complex genetic foundations of diseases like Alzheimer’s, our commitment to inclusivity and precision in genetic research will pave the way for more personalized and effective healthcare solutions, benefiting all people around the world and including those already well represented in genetic studies. The implications of this research extend beyond the realm of genetics into the broader fields of medicine, public health, and even socioeconomic policy. By acknowledging and addressing the genetic diversity of human populations, we can foster a healthcare system that is more responsive to the needs of all individuals, regardless of their genetic background.
Table of Abbreviations
AUC Area Under the Curve
BASIL
Batch Screening Iterative Lasso
BDNF Brain derived neurotrophic factor
FN False Negative
FP False Positive
GWAS
Genome-Wide Association Study
PHESANT PHEnome Scan Analysis Tool
PRS Polygenic Risk Scores
ROC Receiver Operating Characteristic
SNP Single nucleotide polymorphism
TN True Negative
TP True Positive
References
1. Kim J, Basak JM, Holtzman DM. The role of apolipoprotein E in Alzheimer’s disease. Neuron. 2009;63(3):287-303. doi: 10.1016/j.neuron.2009.06.026. PubMed PMID: 19679070; PubMed Central PMCID: PMC3044446.
2. Corder EH, Saunders AM, Strittmatter WJ, Schmechel DE, Gaskell PC, Small GW, Roses AD, Haines JL, Pericak-Vance MA. Gene dose of apolipoprotein E type 4 allele and the risk of Alzheimer’s disease in late onset families. Science. 1993;261(5123):921-3. doi: 10.1126/science.8346443. PubMed PMID: 8346443.
3. Strittmatter WJ, Saunders AM, Schmechel D, Pericak-Vance M, Enghild J, Salvesen GS, Roses AD. Apolipoprotein E: highavidity binding to beta-amyloid and increased frequency of type 4 allele in late-onset familial Alzheimer disease. Proc Natl Acad Sci U S A. 1993;90(5):1977-81. doi: 10.1073/pnas.90.5.1977. PubMed PMID: 8446617; PubMed Central PMCID: PMC46003.
4. Spychala A, Ruther U. FTO affects hippocampal function by regulation of BDNF processing. PLoS One. 2019;14(2):e0211937. Epub 20190207. doi: 10.1371/journal.pone.0211937. PubMed PMID: 30730976; PubMed Central PMCID: PMC6366932.
5. Sollis E, Mosaku A, Abid A, Buniello A, Cerezo M, Gil L, Groza T, Güneş O, Hall P, Hayhurst J, Ibrahim A, Ji Y, John S, Lewis E, Jacqueline, McMahon A, Osumi-Sutherland D, Panoutsopoulou K, Pendlington Z, Ramachandran S, Stefancsik R, Stewart J, Whetzel P, Wilson R, Hindorff L,
Cunningham F, Samuel, Inouye M, Parkinson H, Laura. The NHGRI-EBI GWAS Catalog: knowledgebase and deposition resource. Nucleic Acids Research. 2023;51(D1):D977-D85. doi: 10.1093/nar/gkac1010.
6. Hahn SJ, Kim S, Choi YS, Lee J, Kang J. Prediction of type 2 diabetes using genome-wide polygenic risk score and metabolic profiles: A machine learning analysis of populationbased 10-year prospective cohort study. EBioMedicine. 2022;86:104383. Epub 20221130. doi: 10.1016/j.ebiom.2022.104383. PubMed PMID: 36462406; PubMed Central PMCID: PMC9713286.
7. Tanigawa Y, Qian J, Venkataraman G, Justesen JM, Li R, Tibshirani R, Hastie T, Rivas MA. Significant sparse polygenic risk scores across 813 traits in UK Biobank. PLOS Genetics. 2022;18(3):e1010105. doi: 10.1371/journal.pgen.1010105.
8. Martin AR, Kanai M, Kamatani Y, Okada Y, Neale BM, Daly MJ. Clinical use of current polygenic risk scores may exacerbate health disparities. Nat Genet. 2019;51(4):584-91. Epub 20190329. doi: 10.1038/s41588-019-0379-x. PubMed PMID: 30926966; PubMed Central PMCID: PMC6563838.
9. Martin AR, Kanai M, Kamatani Y, Okada Y, Neale BM, Daly MJ. Publisher Correction: Clinical use of current polygenic risk scores may exacerbate health disparities. Nat Genet. 2021;53(5):763. doi: 10.1038/s41588-021-00797-z. PubMed PMID: 33510478.
10. Adeyemo A, Balaconis MK, Darnes DR, Fatumo S, Granados Moreno P, Hodonsky CJ, Inouye M, Kanai M, Kato K, Knoppers BM, Lewis ACF, Martin AR, McCarthy MI, Meyer
MN, Okada Y, Richards JB, Richter L, Ripatti S, Rotimi CN, Sanderson SC, Sturm AC, Verdugo RA, Widen E, Willer CJ, Wojcik GL, Zhou A. Responsible use of polygenic risk scores in the clinic: potential benefits, risks and gaps. Nature Medicine. 2021;27(11):1876-84. doi: 10.1038/s41591-02101549-6.
11. Fatumo S, Chikowore T, Choudhury A, Ayub M, Martin AR, Kuchenbaecker K. A roadmap to increase diversity in genomic studies. Nat Med. 2022;28(2):243-50. Epub 20220210. doi: 10.1038/s41591-021-01672-4. PubMed PMID: 35145307; PubMed Central PMCID: PMC7614889.
12. Tanigawa Y, Kellis M. Power of inclusion: Enhancing polygenic prediction with admixed individuals. Am J Hum Genet. 2023;110(11):1888-902. Epub 20231027. doi: 10.1016/j.ajhg.2023.09.013. PubMed PMID: 37890495; PubMed Central PMCID: PMC10645553.
13. Bycroft C, Freeman C, Petkova D, Band G, Elliott LT, Sharp K, Motyer A, Vukcevic D, Delaneau O, O’Connell J, Cortes A, Welsh S, Young A, Effingham M, McVean G, Leslie S, Allen N, Donnelly P, Marchini J. The UK Biobank resource with deep phenotyping and genomic data. Nature. 2018;562(7726):203-9. Epub 20181010. doi: 10.1038/s41586018-0579-z. PubMed PMID: 30305743; PubMed Central PMCID: PMC6786975.
14. Millard LAC, Davies NM, Gaunt TR, Davey Smith G, Tilling K. Software Application Profile: PHESANT: a tool for performing automated phenome scans in UK Biobank. Int J Epidemiol. 2018;47(1):29-35. Epub 20171005. doi:
10.1093/ije/dyx204. PubMed PMID: 29040602; PubMed Central PMCID: PMC5837456.
15. Qian J, Tanigawa Y, Du W, Aguirre M, Chang C, Tibshirani R, Rivas MA, Hastie T. A fast and scalable framework for largescale and ultrahigh-dimensional sparse regression with application to the UK Biobank. PLoS Genet. 2020;16(10):e1009141. Epub 20201023. doi: 10.1371/journal.pgen.1009141. PubMed PMID: 33095761; PubMed Central PMCID: PMC7641476.
16. Wickham H, Averick M, Bryan J, Chang W, McGowan LDa, François R, Grolemund G, Hayes A, Henry L, Hester J, Kuhn M, Pedersen TL, Miller E, Bache SM, Müller K, Ooms J, Robinson D, Seidel DP, Spinu V, Takahashi K, Vaughan D, Wilke C, Woo K, Yutani H. Welcome to the tidyverse. Journal of Open Source Software. 2019;4(43):1686. doi: 10.21105/joss.01686.
17. Chang CC, Chow CC, Tellier LC, Vattikuti S, Purcell SM, Lee JJ. Second-generation PLINK: rising to the challenge of larger and richer datasets. Gigascience. 2015;4:7. Epub 20150225. doi: 10.1186/s13742-015-0047-8. PubMed PMID: 25722852; PubMed Central PMCID: PMC4342193.
18. Ruan Y, Zheng D, Guo W, Cao X, Qi W, Yuan Q, Zhang X, Liang X, Zhang D, Xue C, Xiao C. Shared and Specific Changes of Cortico-Striatal Functional Connectivity in Stable Mild Cognitive Impairment and Progressive Mild Cognitive Impairment. Journal of Alzheimer’s disease : JAD. 2024. Epub 20240322. doi: 10.3233/jad-231174. PubMed PMID: 38517789.