Let’s Talk About Bias: Measurement Bias
Improving the Uncertainty of DC Current Measurements
Stumbling Upon a Best Calibration Practice


Let’s Talk About Bias: Measurement Bias
Improving the Uncertainty of DC Current Measurements
Stumbling Upon a Best Calibration Practice


DANISENSE HIGH PRECISION CURRENT
± 50A to ± 10000A DC/AC precision fluxgate current transducers for power measurement, battery test systems, high-stability power supplies, and current calibrations.
• Current Ranges 50A ... > 10000A
• Linearity Error down to 2 ppm
• Very high absolute amplitude and phase accuracy from dc to over 1kHz
• Low signal output noise
• Low fluxgate switching noise on the pimary
Your ability to deliver accurate and reliable measurements depends on the stability of your equipment, and your equipment depends on the accuracy and quality of its calibration.
With over 25 years of calibration experience, GMW offers AC and DC NIST Traceable and/or ISO/IEC 17025:2005 Accredited* current calibration services for Current Transducers at our San Carlos, CA location and On-Site for minimal disruption of daily operations.
Transducers manufacturers calibrated by GMW include, but not limited to, Danisense, LEM, GE, ABB, Danfysik, Hitec, AEMC, VAC, PEM, Yokogawa.
* See gmw.com/current-calibration for Scope of Accreditation


The following event dates and delivery methods are subject to change. Visit the event URL provided for the latest information.
May 8-11, 2023 Sensor and Measurement Science International (SMSI). Nürnberg, Germany. The Sensor and Measurement Science International (SMSI) brings scientists and researchers from all concerned scientific fields together to secure the success of these ideas in the future. https://www.smsi-conference.com/
May 9-11, 2023 SENSOR+TEST . Nürnberg, Germany. SENSOR+TEST is the leading forum for sensors, measuring and testing technologies worldwide. https://www.sensortest.de/
May 15-18, 2023 CCM & IMEKO International Conference on Pressure and Vacuum Metrology. Washington, DC. https:// www.nist.gov/news-events/events/2023/05/2023ccm-imeko-international-conference-pressure-andvacuum-metrology
May 22-25, 2023 International Instrumentation and Measurement Technology Conference (I2MTC). Kuala Lumpur, Malaysia. The Conference focuses on all aspects of instrumentation and measurement science and technology research development and applications. https://i2mtc2023. ieee-ims.org/
May 29-31, 2023 IEEE International Workshop on Metrology for Living Environment (MetroLivEnv). Milan, Italy. MetroLivEnv aims to discuss the contributions of the metrology for the life cycle (design, development, use, demolition, recycling) of the living environment and the new opportunities offered by the living environment for the development of new measurement methods and apparatus. MetroLivE aims to gather people who work in developing instrumentation and measurement methods for the living environment at whole. https://www.metrolivenv.org

MICHAEL L. SCHWARTZ
EDITOR
SITA P. SCHWARTZ
CAL LAB PO Box 111113 Aurora, CO 80042
TEL 303-317-6670 • FAX 303-317-5295 office@callabmag.com www.callabmag.com
E DITORIAL ADVISORS
CHRISTOPHER L. GRACHANEN NATIONAL INSTRUMENTS
MIKE SURACI
SURACI CONSULTING SERVICES LEAD ASSESSOR, ANAB
MARTIN DE GROOT MARTINDEGROOT CONSULTANCY
JESSE MORSE MORSE METROLOGY
JERRY ELDRED TESCOM
Subscription fees for 1 year (4 issues)
$50 for USA, $55 Mexico/Canada, $65 all other countries. Visit www.callabmag.com to subscribe.
Printed in the USA. © Copyright 2023 CAL LAB. ISSN No. 1095-4791
The MSC/ITS10 event in Anaheim, California was a nice change this year. There was a lot of activity on the floor of the exhibit hall, as well as international participation in attendance and new faces! As shows lose the attention of companies and industry in general, combined events seem more worthwhile for volunteers and attendees. Most importantly, combined events can continue to deliver effective technician training to a single venue.
After a COVID hiatus, many events have returned this year, so be sure to check out the Calendar. The Calendar is also online at: callabmag. com/calendar.
In this issue, we begin with Henry Zumbrun’s conversation about measurement bias, “Let’s Talk About Bias: Measurement Bias.” The author talks about the effects related to measurement errors/offsets and how they can be passed down the Measurement Traceability Pyramid.
Our friends at Measurements International contributed an article on “Improving the Uncertainty of DC Current Measurements.” They show us how high current measurements can also be accurate, using a technique with potential to have a lasting effect on the industry for years to come.
Then, Christopher Grachanen shares a best practice he found online which shows a great way to show all of the elements of your measurement data in a clean and simple reporting method.
Finally, don’t forget to check out “In Days of Old” and “Automation Corner”; while Dan Wiswell measures time with the dates found on vintage and antique test equipment, Mike Schwartz tests ChatGPT and wonders what the implications are for those who write automation software.
Happy Measuring,
Sita P. Schwartz
Jun 6-8, 2023 IEEE International Workshop on Metrology for Industry 4.0 & IoT (MetroInd4.0&IoT). Brescia, Italy. IEEE International Workshop on Metrology for Industry 4.0 & IoT (MetroInd4.0&IoT) aims to discuss the contributions both of the metrology for the development of Industry 4.0 and IoT and the new opportunities offered by Industry 4.0 and IoT for the development of new measurement methods and apparatus. https://www. metroind40iot.org/
Jun 11-16, 2023 International Microwave Symposium (IMS). San Diego, CA. The IEEE International Microwave Symposium (IMS) is the world’s foremost conference covering the UHF, RF, wireless, microwave, millimeterwave, terahertz, and optical frequencies. https://www. ims-ieee.org/
Jun 12-16, 2023 IEEE International Conference on Advancements in Nuclear Instrumentation Measurement Methods and their Applications (ANIMMA). Lucca, Italy. The International Conference on Advancements in Nuclear Instrumentation Measurement Methods and
their Applications (ANIMMA) conference aims at uniting, consolidating and organizing an international network of scientific researchers and experts from industry, research institutes, academic dealing with nuclear instrumentation and measurement methodology activities. https://animma. com/
Jun 14-15, 2023 CEESI Gas Ultrasonic Meter User’s Conference. Colorado Springs, CO. This conference brings together ultrasonic meter manufacturers and end users in order to share information about measurement challenges in the hydrocarbon measurement industry. https://ceesi. com/Ultrasonic2023
Jun 19-22, 2023 IEEE International Workshop on Metrology for Aerospace (MetroAeroSpace). Milan, Italy. IEEE International Workshop on Metrology for Aerospace (MetroAerospace) aims to gather people who work in developing instrumentation and measurement methods for aerospace. Attention is paid, but not limited to, new technology for metrology-assisted production in aerospace industry, aircraft component measurement, sensors
1 TO 1 P
STATE-OF-THE-ART DESIGN
LOW TEMPERATURE COEFFICIENTS
HIGH STABILITY OVER TIME
ACCREDITED CALIBRATION INCLUDED
CAL SERVICE FOR RESISTORS


and associated signal conditioning for aerospace, and calibration methods for electronic test and measurement for aerospace. http://www.metroaerospace.org/
Jun 25-30, 2023 SPIE Optical Metrology. Munich Germany. The World of Photonics Congress, which includes SPIE Optical Metrology, will be held in person in 2023. This event highlights the the latest advances in optical measurement systems. It is the meeting for emerging photonics fields within measurement systems, modeling, imaging, sensing, and inspection. https://spie. org/conferences-and-exhibitions/optical-metrology
Jul 8-12, 2023 NCSL International Workshop & Symposium. Orlando, FL. The Annual Conference will promote research in measurement science and foster scientific exchange between researchers, practitioners, scientists, students, engineers and all metrology professionals and their affiliated disciplines. We will feature technical paper presentations, invited speakers, tutorials, poster sessions, learning labs, and the best tradeshow ever. https://ncsli.org/
Jul 10-14, 2023 Coordinate Metrology Society Conference. Mobile, AL. The Coordinate Metrology Society brings the users of 3D portable and stationary measurement technologies, service providers, and OEM manufacturers of close-tolerance industrial coordinate measurement systems, peripherals and software developers together in one area. The professional organization offers the Level-One certification program, Metrologist in Training assessment for career enhancement through training classes, hands-on workshops and competitive measurement competitions. https://www.cmsc.org/
Aug 28-31, 2023 IEEE AUTOTESTCON. National Harbor, MD. AUTOTESTCON is the world’s premier conference that brings together the military/aerospace automatic test industry and government/military acquirers and users to share new technologies, discuss innovative applications, and exhibit products and services. https://2023.autotestcon. com/
Visit www.callabmag.com for upcoming metrology events & webinars!
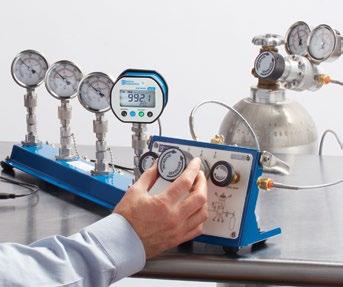
As an ISO 17025 accredited lab, Ralston’s quality management systems are held to the highest globally-recognized standards for calibration labs.
All gauges and calibrators now come with ISO 17025 accredited calibration certificates from our calibration lab, along with an added level of confidence in the quality of the Ralston Instruments name and all our pressure and temperature calibration instrumentation.

SEMINARS & WEBINARS: Dimensional
May 16-18, 2023 Dimensional Gage Calibration. Aurora, IL. Mitutoyo. The course combines modern calibration and quality management ideas with best practices and “howto” calibration methods for common calibrations. https:// www.mitutoyo.com/training-education/classroom/
Jun 7, 2023 EDU-V111: Introduction to Dimensional Gage Calibration. Virtual Classroom. Mitutoyo. This course is taught in the Mitutoyo Institute of Metrology’s Training Lab in Aurora, IL and broadcast live in a virtual session. The course combines modern calibration and quality management ideas with best practices and “howto” calibration methods for common calibrations of micrometers and calipers. https://www.mitutoyo.com/ training-education/classroom/
Jun 13-15, 2023 Seminar #114: Dimensional Gage Calibration. Aurora, IL. Mitutoyo. The course combines modern calibration and quality management ideas with best practices and “how-to” calibration methods
Humidity Generation and Calibration Equipment
for common calibrations. The course is ideal for those operating in ISO/IEC 17025 accredited laboratories or in gage labs supporting manufacturing operations.https:// www.mitutoyo.com/training-education/classroom/
SEMINARS & WEBINARS: Education
Aug 17, 2023 Metric System Education Resources. Adobe Connect Pro. NIST. This 1.5 hour session will explore NIST Metric Program education publications and other resources that can be downloaded and freely reproduced by teachers, parents, and students. These resources are helpful to students as they become familiar with metric units, develop measurement quantity reference points, and learn more about SI basics. https://www.nist.gov/pml/owm/training
SEMINARS & WEBINARS: Electrical
Jun 12-15, 2023 Basic Hands-On Metrology. Everett, WA. Fluke Calibration. This Metrology 101 basic metrology training course introduces the student to basic measurement concepts, basic electronics related to
Web: www.thunderscientific.com


Humidity Source ®
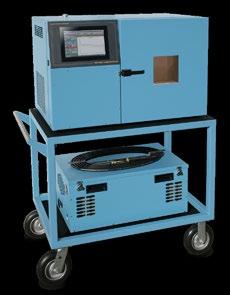
Model 2900 “Two-Pressure” Humidity Generation System
Email: sales@thunderscientific.com
Phone: 800.872.7728
Model 2900 FEATURES
• Traceable to SI
• Multi-point Touch LCD
• 0.5% of Reading RH Uncertainty
• High Flow Capability of 50 L/min
• Externally Driven Chamber Fan
• Fluid Jacketed Chamber Door
• Optional Window Chamber Door
• Ability to Operate Using External Computer
• Embedded ControLog® Automation Software
Use of the NVLAP symbol does not imply product certification, approval, or endorsement by NVLAP, NIST, or any agency of the U.S. Government.
Thunder’s calibration laboratory offers NVLAP accredited humidity calibration services which adheres to the guidelines of ISO/IEC 17025:2017 and ANSI/NCSL Z540-1-1994; Part 1. Ask for Guard Banding options.
• Based on NIST Proven “Two-Pressure” Principle
• HumiCalc® with Uncertainty Mathematical Engine
Model 3920 Low Humidity Generation System
• Generate: RH, DP, FP, PPM, Multi-point Profiles
Calibration Services
Technical Support
Sales & Service
Model 3920 FEATURES
• Traceable to SI
• Multi-point Touch LCD
• Calculated Real-Time Uncertainty
• High Flow Capability of 10 L/min
• Diaphragm-sealed Control Valves
• Calculated Water Capacity/Usage
• VCR® Metal Gasket Face Seal Fittings
• Ability to Operate Using External Computer
• Embedded ControLog® Automation Software
• Based on NIST Proven “Two-Pressure” Principle
• HumiCalc® with Uncertainty Mathematical Engine
• Generate: RH, DP, FP, PPM, Multi-point Profiles

CalLab-Ad-2022.indd 1 11/16/2022


• Coil diameters from 350mm to 2m
• Orthogonality correction using PA1
• Active compensation using CU2
• Control software available

distributor: gmw.com
Telephone: 650 802-8292
measurement instruments and math used in calibration. https://us.flukecal.com/training
SEMINARS & WEBINARS: Flow
Jun 28-29, 2023 Calibration of Liquid Hydrocarbon Flow Meters. Online. National Measurement Institute, Australia. This two-day course provides training on the calibration of liquid-hydrocarbon LPG and petroleum flow meters. It is aimed at manufacturers, technicians and laboratory managers involved in the calibration and use of flowmeters. https://shop.measurement.gov.au/collections/physicalmetrology-training
Sep 19-21, 2023 Flow Measurement and Calibration Seminar (in English). Neufahrn, Germany. TrigasFI. Measuring principles of flow meters for liquids and gases. Accuracy, performance, calibration techniques and procedures. Featuring networking event with Lunch hosted at the Munich Oktoberfest. https://www.trigasfi.de/en/ training-and-seminars/
SEMINARS & WEBINARS: General
Jun 1, 2023 Calibration and Measurement Fundamentals. Online. National Measurement Institute, Australia. This course covers general metrological terms, definitions and explains practical concept applications involved in calibration and measurements. The course is recommended for technical officers and laboratory technicians working in all industry sectors who are involved in making measurements and calibration process. https://shop. measurement.gov.au/collections/physical-metrologytraining
Aug 7-11, 2023 Fundamentals of Metrology. Gaithersburg, MD. The 5-day Fundamentals of Metrology seminar is an intensive course that introduces participants to the concepts of measurement systems, units, good laboratory practices, data integrity, measurement uncertainty, measurement assurance, traceability, basic statistics and how they fit into a laboratory Quality Management System. https://www. nist.gov/pml/owm/training

Sep 1, 2023 Calibration and Measurement Fundamentals. Online. National Measurement Institute, Australia. This course covers general metrological terms, definitions and explains practical concept applications involved in calibration and measurements. The course is recommended for technical officers and laboratory technicians involved in making measurements and calibration process. https://shop. measurement.gov.au/collections/physical-metrology-training
SEMINARS & WEBINARS: Industry Standards
May 16-17, 2023 Laboratories: Understanding the Requirements and Concepts of ISO/IEC 17025:2017. Live Online. ANAB. This introductory course is specifically designed for those individuals who want to understand the requirements of ISO/IEC 17025:2017 and how those requirements apply to laboratories. https://anab.ansi.org/ training
May 16-18, 2023 Internal Auditing to ISO/IEC 17025:2017 (Non-Forensic) . Live Online. ANAB. ISO/IEC 17025 training course prepares the internal auditor to clearly
HV CALIBRATION LAB CAPABILITIES:
• UP TO 450kV PEAK 60Hz
• UP TO 400kV DC
• UP TO 400kV 1.2x50 μ s LIGHTNING IMPULSE
DESIGN, MANUFACTURE, TEST & CALIBRATE:
• HV VOLTAGE DIVIDERS
• HV PROBES
• HV RELAYS
• HV AC & DC HIPOTS
• HV DIGITAL VOLTMETERS
• HV CONTACTORS
• HV CIRCUIT BREAKERS
• HV RESISTIVE LOADS
• SPARK GAPS
• FIBER OPTIC SYSTEMS

understand technical issues relating to an audit. Attendees of Auditing to ISO/IEC 17025 training course will learn how to coordinate a quality management system audit to ISO/ IEC 17025:2017 and collect audit evidence and document observations, including techniques for effective questioning and listening. https://anab.ansi.org/training
May 30-31, 2023 Understanding ISO/IEC 17025 for Testing and Calibration Labs. Scheduled online for M-East India and South Asia. This 2-day Training Course examines structural components of the standard. Quality system and technical requirements are grouped in a manner that makes them clear and understandable. https://www.iasonline.org/ training/ias-training-schedule/
Jun 1-2, 2023 Understanding ISO/IEC 17025 for Testing and Calibration Labs. Scheduled online for the Americas. This 2-day Training Course examines structural components of the standard. Quality system and technical requirements are grouped in a manner that makes them clear and understandable. https://www.iasonline.org/training/iastraining-schedule/


HV LAB CALIBRATION STANDARDS
ISO/IEC 17025:2017 ACCREDITED ANSI/NCSLI Z540-1-1994 ACCREDITED
ISO 9001:2015 QMS CERTIFIED
N.I.S.T. TRACEABILITY
N.R.C. TRACEABILITY


Jun 6-7, 2023 Internal Auditing for all Standards. Scheduled online for M-East India and South Asia. IAS. This 2-day Training Course examines auditing principles and techniques and facilitates the practice of required internal audit skills. It is based on internationallyrecognized approaches to conducting conformant internal audits. The techniques learned by participants promote the involvement of all types of staff as auditors and auditees. https://www.iasonline.org/training/ias-trainingschedule/
Jul 4-5, 2023 Internal Auditing for all Standards. Scheduled online for the Americas. IAS. This 2-day Training Course examines auditing principles and techniques and facilitates the practice of required internal audit skills. It is based on internationally-recognized approaches to conducting conformant internal audits. The techniques learned by participants promote the involvement of all types of staff as auditors and auditees. https://www.iasonline.org/training/ ias-training-schedule/
Jul 11-12, 2023 Understanding ISO/IEC 17025 for Testing and Calibration Labs. Scheduled online for M-East India and South Asia. This 2-day Training Course examines structural components of the standard. Quality system and technical requirements are grouped in a manner that makes them clear and understandable. https://www.iasonline.org/ training/ias-training-schedule/
Jul 15-26, 2023 Laboratories: Understanding the Requirements and Concepts of ISO/IEC 17025:2017. Live Online. ANAB. This introductory course is specifically designed for those individuals who want to understand the requirements of ISO/IEC 17025:2017 and how those requirements apply to laboratories. https://anab.ansi.org/ training
Jul 25-27, 2023 Internal Auditing to ISO/IEC 17025:2017 (Non-Forensic) . Live Online. ANAB. ISO/IEC 17025 training course prepares the internal auditor to clearly understand technical issues relating to an audit. Attendees of Auditing to ISO/IEC 17025 training course will learn how to coordinate a quality management system audit to ISO/ IEC 17025:2017 and collect audit evidence and document observations, including techniques for effective questioning and listening. https://anab.ansi.org/training
SEMINARS & WEBINARS: Mass
Jul 17-27, 2023 Advanced Mass Seminar. Gaithersburg, MD. NIST. The 9-day, hands-on Advanced Mass calibration seminar focuses on the comprehension and application of the advanced mass dissemination procedures, the equations, and associated calculations. It includes the operation of the laboratory equipment, review of documentary references,
reference standards, specifications, and tolerances relevant to the measurements. https://www.nist.gov/pml/owm/ training
SEMINARS & WEBINARS: Measurement Uncertainty
May 24 & 26, 2023 Introduction to Estimating Measurement Uncertainty. Online. NMI Australia. This course will give you a clear step-by-step approach to uncertainty estimation with practical examples; you will learn techniques covering the whole process from identifying the sources of uncertainty in your measurements right through to completing the uncertainty budget. https:// shop.measurement.gov.au/collections/physical-metrologytraining
Jun 12-13, 2023 Uncertainty of Measurement for Labs. Online training scheduled for M-East India and South Asia. IAS. The training includes case studies and discussions, with application of statistical components in practical examples that are frequently encountered by testing laboratories. https://www.iasonline.org/training/ uncertainty-of-measurement/
Jun 14-15, 2023 Measurement Confidence: Fundamentals. Online. ANAB. This Measurement Confidence course introduces the foundational concepts of measurement traceability, measurement assurance and measurement uncertainty as well as provides a detailed review of applicable requirements from ISO/IEC 17025 and ISO/IEC 17020. https://anab.ansi.org/training
Jul 11-13, 2023 Measurement Uncertainty: Practical Applications. Live Online. ANAB. This course reviews the basic concepts and accreditation requirements associated with measurement traceability, measurement assurance, and measurement uncertainty as well as their interrelationships. https://anab.ansi.org/training
Aug 7-9, 2023 Introduction to Measurement Uncertainty. Everett, WA. Fluke Calibration. This course will teach you how to develop uncertainty budgets and how to understand the necessary calibration processes and techniques to obtain repeatable results. https://us.flukecal.com/training
May 8-12, 2023 Principles of Pressure Calibration WebBased Training. Fluke Calibration. This is a short form of the regular five-day in-person Principles of Pressure Calibration class. It is modified to be an instructor-led online class and without the hands-on exercises. It is structured for two hours per day for one week. https:// us.flukecal.com/training


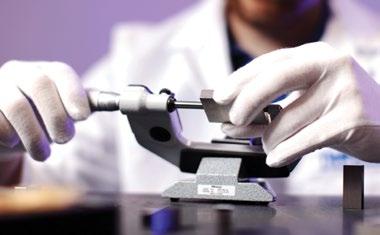

Aug 14-18, 2023 Principles of Pressure Calibration WebBased Training. Fluke Calibration. This is a short form of the regular five-day in-person Principles of Pressure Calibration class. It is modified to be an instructor-led online class and without the hands-on exercises. It is structured for two hours per day for one week. https:// us.flukecal.com/training
May 9-11, 2023 VNA Tools Training Course . BerneWabern, Switzerland. Federal Institute of Metrology METAS. VNA Tools is free software developed by METAS for measurements with the Vector Network Analyzer (VNA). The software facilitates the tasks of evaluating measurement uncertainty in compliance with the ISO-GUM and vindicating metrological traceability. The software is available for download at www.metas.ch/vnatools. The three day course provides a practical and hands-on lesson with this superior and versatile software. https://www. metas.ch/metas/en/home/dl/kurse---seminare.html
May 15-19, 2023 MET/TEAM® Basic Web-Based Training. Fluke Calibration. This web-based course presents an overview of how to use MET/TEAM Test Equipment and Asset Management Software in an Internet browser to develop your asset management system. https://us.flukecal. com/training
Jun 5-9, 2023 MET/CAL ® Procedure Development Web-Based Training. Fluke Calibration. Learn to create procedures with the latest version of MET/CAL, without leaving your office. This web seminar is offered to MET/ CAL users who need assistance writing procedures but have a limited travel budget. https://us.flukecal.com/ training
Jul 17-21, 2023 Basic MET/CAL ® Procedure Writing. Everett, WA. Fluke Calibration. In this five-day Basic MET/ CALProcedure Writing course, you will learn to configure MET/CAL software to create, edit, and maintain calibration solutions, projects and procedures. https://us.flukecal.com/ training
Aug 14-18, 2023 MET/TEAM® Basic Web-Based Training. Fluke Calibration. This web-based course presents an overview of how to use MET/TEAM Test Equipment and Asset Management Software in an Internet browser to develop your asset management system. https://us.flukecal. com/training
Aug 22-24, 2023 Temperature Measurement. Lindfield NSW. NMI Australia. This three-day course (9 am to 5 pm) covers the measurement of temperature and the calibration of temperature measuring instruments. It incorporates extensive hands-on practical exercises. https://shop. measurement.gov.au/collections/physical-metrologytraining
SEMINARS & WEBINARS: Time & Frequency
May 8-9, 2024 Time and Frequency Measurement. Lindfield, NSW. National Measurement Institute, Australia.
This two-day course covers the broad range of equipment and techniques used to measure time and frequency and to calibrate time and frequency instruments. https://shop. measurement.gov.au/collections/physical-metrologytraining
Aug 14-18, 2023 Volume Metrology Seminar. Gaithersburg, MD. NIST. The 5-day OWM Volume Metrology Seminar is designed to enable metrologists to apply fundamental measurement concepts to volume calibrations. Time is spent on hands-on measurements, applying procedures and equations discussed in the classroom. https://www. nist.gov/pml/weights-and-measures/training
Let us know what we’ve missed, so we can include it here! Email office@callabmag.com
For the first time, the NIST-4 Kibble balance directly incorporates a quantum standard for electrical resistance.
NIST News, January 18, 2023 — In a brightly lit subterranean lab at the National Institute of Standards and Technology (NIST) sits a room-sized electromechanical machine called the NIST-4 Kibble balance.
The instrument can already measure the mass of objects of roughly 1 kilogram, about as heavy as a quart of milk, as accurately as any device in the world. But now, NIST researchers have further improved their

The NIST-4 Kibble balance is an electromechanical machine that measures the mass of objects roughly 1 kg. Here, you can see the top of the balance, which includes a wheel that rotates back and forth as the two sides of the balance move. Just visible on the left side of the image are a set of thin electrical wires that connect the electromagnetic coil (not pictured) to other key parts of the balance. Incidentally, the reason the thin wires are coiled like springs instead of being pulled straight is so that as the wheel moves back and forth, the wires stretch without touching each other. Credit: Jennifer Lauren Lee/NIST
Kibble balance’s performance by adding to it a custombuilt device that provides an exact definition of electrical resistance. The device is called the quantum Hall array resistance standard (QHARS), and it consists of a set of several smaller devices that use a quirk of quantum physics to generate extremely precise amounts of electrical resistance. The researchers describe their work in a Nature Communications (https://doi.org/10.1038/ s42005-022-01088-7).
The improvement should help scientists use their balances to measure masses smaller than 1 kilogram with high accuracy, something no other Kibble balance has done before.
NIST-4 measurements were used to help scientists redefine the kilogram, the fundamental unit of mass in the International System of Units (SI), in 2019. Everything that must be weighed, from market produce to the ingredients in your cold medicine, relies on this new definition of mass.
The new custom-built QHARS device is an example of a measurement standard — an object or instrument that has some predefined relationship to a physical quantity such as length or time or brightness. The standard in this case is an electrical device that uses quantum principles to generate a precise amount of electrical resistance. This generated resistance then serves as a reference during the Kibble balance’s operation.
Before this work, the NIST-4 Kibble balance relied on a different standard instrument that also provided an exact definition of electrical resistance. But that device could not be directly incorporated into the balance for technical reasons.
To get around this problem, researchers had to take another object — called an artifact — and use the standard to calibrate or assess that artifact. They then used the artifact directly with the NIST-4 Kibble balance.
The new setup eliminates the need for a resistance artifact and improves the accuracy of the balance.
“Doing the extra step of calibrating a resistor reduced the accuracy of the mass measurements,” said NIST’s Darine Haddad. “Because we’re now using a quantum standard directly instead of an artifact, we’re eliminating the calibration step entirely. That cuts down the resistance uncertainty,” meaning there is a significant improvement in resistance accuracy.
‘Current’ Dilemma
The NIST-4 Kibble balance machine works by comparing mechanical force to electromagnetic force. In a nutshell, a mass sits on the balance, and gravity pulls it down. Researchers then pump current through a coil of wire sitting in a magnetic field, and that electrical current pushes the mass upward, effectively levitating it in midair. Scientists measure the amount of current that’s needed to float the object, balancing it exactly. If you can measure the current, you can work out the object’s mass.

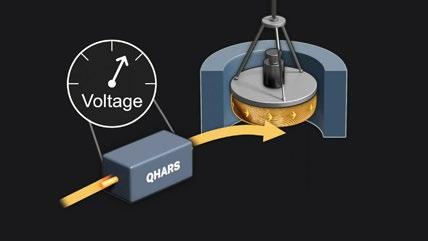
For the first time, scientists have integrated a quantum resistance standard directly into mass measurements made with the one-of-a-kind NIST-4 Kibble balance. Using the quantum standard in this way increases the accuracy of the measurements. This animation shows how the new quantum resistance standard, called QHARS, works. The QHARS device uses a sheet of graphene (a single layer of carbon atoms) attached to superconducting electrical contacts. When cooled to low temperature and placed in a strong magnetic field, electrons in the graphene begin moving in closed loops, a phenomenon known as the quantum Hall effect. This behavior results in the graphene having a specific resistance, providing an absolute reference for measuring current in the NIST-4 Kibble balance.
Credit: Sean Kelley/NIST
But for this to work, measurement scientists need to know exactly how much current flows through the coil with a high degree of accuracy. They do this by measuring two other easier-to-measure values: the voltage and the resistance.
A quantum voltage standard is already integrated into the device. But the quantum resistance standard could not be used directly because the traditional device, made of gallium arsenide (GaAs), cannot function correctly with the relatively large amounts of current needed to levitate a macro-scale object like a 50- or 100or even 1,000-gram mass. So instead, the GaAs device was used separately to measure the resistance of a freshly calibrated object that is then inserted into NIST-4 and used in the actual measurement.
To address this problem, NIST has been designing and testing a new type of quantum resistance device: the QHARS. Instead of GaAs, this instrument is made of graphene — the single atomic layer-thick sheet
of carbon atoms that has been a hot topic for many years for its promise in a variety of uses, including faster and flexible electronics.
The new graphene QHARS developed at NIST passes current through an array of 13 smaller elements in parallel. These elements work based on something called the quantum Hall effect, in which the electrical resistance is “quantized” — that is, it can have only a few possible, very specific and predictable, values. That makes the device a resistance standard that is accurate on a quantum level.
Using 13 quantum Hall resistor units together further increases the amount of current the new QHARS can handle.
“We need about 700 microamperes [millionths of an ampere] flowing in the coil to levitate a 100-gram mass,” Haddad said. “In the gallium arsenide resistance standard, you can’t do that.”
To prove this new quantum resistance standard could work in NIST-4, Haddad and her team used
multiple QHARS devices, one at a time, and compared their results indirectly to the GaAs quantum resistance standard. The results for the 50-gram mass measurements all closely agreed with one another — “it’s as good as it gets,” Haddad said.
Future models of the new resistance standard might see further improvements. In order to work, both the traditional GaAs device and the graphene QHARS must be cooled to just a few degrees above absolute zero and be exposed to their own high magnetic fields. Someday, a QHARSstyle device could be developed to work at room temperature and zero magnetic field, which would make the whole system much more compact.
Also, unlike the old resistance standard, a next-generation QHARS could be programmable, meaning the instrument would be more versatile: Scientists could use one device to generate different amounts of resistance depending on what they needed for a particular experiment.
“A quantum resistance standard that is programmable and that works at room temperature with a low magnetic field: This is what the physicists are trying to push for,” Haddad said.
-- Reported and written by Jennifer Lauren Lee
Paper: Frank C. Seifert, Alireza R. Panna, I-Fan Hu, Lorenz H. Keck, Leon S. Chao, Shamith U. Payagala, Dean G. Jarrett, Chieh-I Liu, Dipanjan Saha, Randolph E. Elmquist, Stephan Schlamminger, Albert F. Rigosi, David B. Newell and Darine Haddad. A macroscopic mass from quantum mechanics in an integrated approach. Nature Communications Published Dec. 10, 2022. DOI: https: 10.1038/s42005-02201088-7
Source: https://www.nist.gov/ news-events/news/2023/01/artifactsbegone-nist-improves-its-flagshipdevice-measuring-mass
NIST researchers “tickle” a gas with acoustic waves to measure how fast it exits a vessel.
NIST News, March 31, 2023Researchers at NIST have developed a new — and sound — way to accurately measure the rate at which gas flows in and out of a vessel. The technique, which uses acoustic waves to determine the average temperature of the gas and microwaves to ascertain the volume of the vessel, can measure gas flows and leaks from large containers particularly well.
The method could enable workers to more accurately calibrate gas flow meters used in natural gas pipelines. The monetary value of natural gas in U.S. pipelines exceeded $90 billion in 2016, so the accuracy of these measurements is a key concern for both consumers and providers of natural gas.
“We believe that the acoustic technique, once perfected, could be adopted as a new standard at NIST, and potentially around the world,” said NIST researcher Jodie Pope.
To determine the amount of gas flowing out of a vessel, researchers need to know several quantities, including the volume of the vessel and the pressure and temperature of the gas.
In the current method of measuring gas flow, developed at NIST and now the national standard for calibrating flow meters [https:// www.nist.gov/laboratories/toolsinstruments/gas-flow-standards], workers determine the temperature of the gas by submerging the vessel in a temperature-controlled water bath. Because the technique allows enough time for the temperature of the gas to come to equilibrium with the temperature of the water bath, the gas temperature can be determined with high accuracy.
However, measuring the
temperature of gas flowing from large vessels poses a problem because the containers can’t easily be submerged in a water bath. An alternative — relying on numerous temperature sensors placed inside the vessel — can be impractical due to the sheer number of sensors, each of which would require a separate calibration.
To calibrate large gas flows using the current national standard, metrologists must use a bootstrap strategy: They calibrate multiple flow meters that measure relatively small flows and pressures, then mount the meters in parallel to achieve bigger flows and pressures in multiple steps that require up to 48 calibrations. This procedure adds both cost and uncertainty to the measurements.
The new method employs acoustic waves to determine the average gas temperature in large vessels. This technique, which does not require extra temperature sensors, is reliable even if the temperature varies across the volume of the gas, said Pope. Because of these advantages, the technique could significantly decrease the number of steps in the calibration chain and thereby reduce the uncertainty in the final flow measurement.
To demonstrate the new technique, the NIST team mounted a source of sound waves (a speaker) at one end of a cylindrical vessel and a microphone at the opposite end of the system. The microphone receives the sound waves, which are modified and then fed back into the system to
reinforce and strengthen the source waves.
This arrangement, known as a positive feedback loop, creates a self-sustained acoustic oscillation at the natural, or resonance, frequency of the gas, much the way an organ pipe reverberates at particular set of frequencies. The resonance frequency depends on the speed of sound in the gas, which in turn is proportional to the average temperature of the gas. By tracking the resonance frequency, the sound waves measure the average temperature of the gas — without the need for a water bath or a large number of temperature sensors. Even if the temperature of the gas in the vessel changes, which it will when gas flows in or out of the container, the acoustic system’s ability to lock onto the resonance frequency guarantees that the instantaneous temperature of the gas is always known. For instance, when gas exits a vessel, the temperature of the remaining gas decreases. But because the resonant frequency of the gas decreases in sync with the decreasing temperature, the system is able to record the lower temperature.
The researchers combined their precision temperature measurements with measurements of the volume of gas, using microwaves, and the gas pressure, to determine the flow rate.
One advantage of the acoustic technique is that it’s relatively simple, said NIST researcher Keith Gillis. “There are no moving parts; the only thing that is moving is the gas.”

Before the acoustic method can become a standard, researchers will have to test the technique with larger vessels and gas flows.
Pope, Gillis and James Schmidt reported their findings online in the March 21 issue of Review of Scientific Instruments
Paper: Jodie G. Pope, James W. Schmidt and Keith A. Gillis. Dynamic Measurement of Gas Flow using Acoustic Resonance Tracking. Review of Scientific Instruments. Published online March 21, 2023. DOI: 10.1063/5.0143819
Source: https://www.nist.gov/newsevents/news/2023/03/sounding-outnew-way-measure-gas-flow
PTB-News 1.2023 — Real-time capable controlling and monitoring systems are necessary when it comes to ensuring the stability of future electrical distribution and transmission grids. Also required are meters that can accurately and with high temporal resolution measure energy flows that are relevant to energy billing. In the future, the measuring equipment needed for this purpose may be based on digital, i.e., sampled-value (SV) technologies whose high-voltage sensors and downstream measuring electronics have to be very accurately
synchronized. For verifying SVbased electrical energy meters, PTB has developed a measuring setup based on an SV protocol generator that serves as a calibrator.
In Germany, PTB is responsible for the metrological traceability of measuring instruments in highvoltage power grids. By tracing measuring instruments to national standards, PTB ensures that the energy transmitted is correctly recorded by means of adequate measuring instruments.
The new calibration setup developed at PTB is based on an SV generator that allows emulated high AC voltages (or currents) to be temporally synchronized and transmitted in accordance with the IEC 61850-2 LE network protocol to an electrical energy meter undergoing verification. The sampling rates between 4000 and 14400 samples per second are defined by the network protocol. In the calibration setup for SV-based measuring instruments, the generator therefore emulates the digital instrument transformers.
The software controlling the SV generator essentially acts as an SV wave form generator, controls the sequential measurement protocol, and calculates electrical power and energy. In doing so, the voltage and current signals generated emulate the power and energy flow of a threephase grid. Based on this, reference power and reference energy values

are calculated for calibration.
The International Electrotechnical Commission (IEC) is currently preparing a special standard for digital electrical energy meters (IEC TS 62053-25 ED1). PTB therefore first used the existing IEC 62053-22 standard for Static meters for AC active energy (classes 0,1S, 0,2S and 0,5S) in order to develop a test schedule for electrical energy meters to be calibrated. It was then possible to use the recently developed setup to perform the first test on a commercially available digital energy meter of accuracy class 0,2S produced by a European manufacturer at a grid frequency of 50 Hz, a nominal voltage of 100 kV and a nominal current of 1000 A. The measurements performed according to the developed test schedule have shown that the measurement errors of the energy meter for active energy were lower by one order of magnitude than the tolerance limits defined by the meter’s accuracy class.
With a view to the expected change in the standardization situation in the next few years, the measurement setup will be constantly adapted to future requirements. Moreover, the greater meter reading efficiency provided by an optical interface will be included in the evaluation in the short to medium term.
Contact: Enrico Mohns Department 2.3 Electrical Energy Measuring Techniques Phone: +49 531 592-2300 (enrico.mohns@ptb.de).
Scientific publication: Y. Chen, E. Mohns, M. Seckelmann, S. de Rose: Precise amplitude and phase determination using resampling algorithms for calibrating Sampled Value instruments. Sensors 20, 7345 (2020)
Source: https://www.ptb.de/ cms/en/presseaktuelles/journalsmagazines/ptb-news.html
Calibrate meters that measure AC/DC volts, current resistance, capacitance, and inductance all with the same calibrator. Featuring 30 A continuous current output with extended AC/DC measurement ranges and a 4:1 test TUR for the most popular 6.5-digit multimeters, this new class of multiproduct calibrators can calibrate the most demanding workloads.


Digital Calibration Certificates with a digital accreditation symbol are machine-readable, resistant to manipulation and verifiable.
Joint press release from DAkkS and PTB, March 1, 2023 – The Deutsche Akkreditierungsstelle (DAkkS) and the Physikalisch-Technische Bundesanstalt (PTB) have kicked off the pilot phase of the Digital Calibration Certificate with a digital accreditation symbol. As central stakeholders of the German quality infrastructure, they are both taking an important step toward digital transformation and the automation of manufacturing and quality monitoring processes.
Both partners have announced the official start of the pilot phase today at the 3rd International DCC Conference that is taking place as an online event from 28 February to 2 March 2023. The project will initially be limited to the customers participating in the pilot phase. After the end of the pilot phase, the services will be made available in practice to all interested conformity assessment bodies, such as accredited calibration and testing laboratories. With this step, DAkkS and PTB are substantiating their close cooperation in terms of groundbreaking digitalization projects in the fields of accreditation, conformity assessment and metrology.

Calibration certificates are used as proof of the metrological traceability of measurement results in many fields, and especially in industry. The Digital Calibration Certificate (DCC), which has primarily been developed by PTB as the national metrology institute, serves to perform the electronic processing and dissemination of calibration results as well as their uniform interpretation.
The upcoming pilot phase is intended to investigate in which way these human- and machine-readable calibration certificates can be integrated into the processes of accredited conformity assessment bodies and those of their customers. The participating accredited bodies will receive the new digital accreditation symbol from DAkkS. Such a symbol can be used for marking both the DCC as well as PDF-based result reports and conformity attestations. This digital national emblem provided by DAkkS is cryptographically secured and electronically verifiable. Due to the process being linked to the digital accreditation symbol, the identity of the conformity assessment body and the status of its accreditation can be read out, and the authenticity of the content can be confirmed in the form of an “eAttestation” in a way that is resistant to manipulation.
With the piloting of the DCC and of the digital accreditation symbol, DAkkS and PTB are setting the course for the future and are also taking possible steps in this field on a global scale. By integrating the accreditation symbol into the DCC, all relevant information issued by accredited calibration laboratories is, for the first time, being made available in its entirety in a machine-readable format. Based on this, production processes and their quality assurance can be automated, efficiency can be increased and costs can be saved in the production process in the future.
The aim is to use the results of the pilot phase directly for the further development of the two digitalization projects. In addition, the determination of the necessary interfaces and processes is to lead to the compilation of best-practice guidelines that will facilitate the use of the Digital Calibration Certificate for calibration laboratories. The pilot phase will lay the foundations for making the Digital Calibration Certificates and the digital national emblem of the DAkkS available on a broad scale and in a timely manner.
The project offers the possibility of digitalizing further processes within the quality infrastructure (QI). It is part of the “QI-Digital” initiative in which DAkkS and PTB are working on viable digital solutions in the different areas of QI (metrology, standardization, accreditations, conformity assessments and market surveillance) together with other partners. The objective is to seamlessly integrate the individual process steps of QI.
Together with DAkkS and PTB, the following institutions are involved in the “QI-Digital” initiative: the Bundesanstalt für Materialforschung und -prüfung (BAM) (Federal Institute for Materials Research and Testing), the Deutsches Institut für Normung (DIN) (German Institute for
Standardization) and the Deutsche Kommission Elektrotechnik Elektronik Informationstechnik in DIN and VDE (DKE) (German Commission for Electrical, Electronic & Information Technologies). The Federal Ministry for Economic Affairs and Climate Action (BMWK) is therefore supporting the “QI-Digital” initiative as an essential contribution to the success of innovative technologies, products and processes to strengthen Germany as an industrial base.
The Deutsche Akkreditierungsstelle (DAkkS)
DAkkS is the national accreditation body of the Federal Republic of Germany. By issuing an accreditation, DAkkS confirms that a laboratory or a certification body is qualified to perform its work according to the requirements of internationally valid standards, legal bases and relevant rules. DAkkS also monitors whether these requirements are met. This is its legal mandate. With the accreditations it issues, DAkkS contributes to making products, processes and services safer and to facilitating trade in Europe and worldwide by means of mutual agreements.
by Ted Green
Physikalisch-Technische Bundesanstalt (PTB)
The Physikalisch-Technische Bundesanstalt (PTB) is the national metrology institute of Germany and the supreme technical authority of the Federal Ministry for Economic Affairs and Climate Action (BMWK). It is therefore Germany’s highest authority when it comes to correct and reliable measurements. PTB employs a total of approximately 2,100 staff members at its two sites (Braunschweig and Berlin). They conduct research on fundamental questions concerning the physical units, they calibrate measuring instruments to meet the most demanding requirements, and they perform conformity assessments – many of these with a legal mandate. In cooperation with other stakeholders, PTB is working on a digital quality infrastructure that is geared to the future.
Contact: Ing. Prof. Dr. iur. Raoul Kirmes, DAkkS, Head of Accreditation Governance, Research and Innovation, afi@ dakks.de; Dr.-Ing. Prof. h.c. Frank Härtig, Vice President of PTB, Phone: +49 531 592-2000, Email: frank.haertig@ptb.de
Author: Imke Frischmuth
Source: https://www.ptb.de/cms/en/presseaktuelles/ journalisten/news-press-releases.html

Henry Zumbrun Morehouse Instrument Company
What can happen when we use an accuracy specification and assume all the measurements are centered in relation to the specification limits? It is a typical problem in the metrology community, where many papers assume a centered process or Measurement.
When the Measurement deviates from the true value, it is said to have bias. More specifically, measurement bias refers to systematic errors in a measurement or measurement process that consistently cause the measured values to deviate from the true value of the quantity being measured. Measurement bias can be caused by various factors, such as the design or calibration of the measurement equipment, the skill of the operator, or the conditions under which the Measurement is made. Measurement bias can lead to inaccurate or unreliable calibration and test results, affecting the quality and integrity of the data and leading to incorrect conformity assessments.
Making a conformity assessment might mean the measured value could be anywhere within the specification. In cases of simple acceptance, the
measured value could even be at the tolerance limit.
The reason this matters is that when a known bias is ignored, meaning not corrected or not included in the Statement of Measurement Uncertainty on the Calibration Certificate, measurement traceability may not be fully achieved, and all subsequent measurements are suspect.
In this paper, we will discuss the importance of correcting for any bias in relation to the location of the Measurement to ensure metrological traceable measurements and adherence to ISO/IEC 17025:2017 requirements.
Why do we care about the location of the Measurement if the device is within tolerance? If a device has a specification of 0.1 % of full scale and the calibrating laboratory reports a value within 0.1 %, the device is “Within Tolerance,” when in reality, it depends on all parties being in agreement per contractual requirements (contract review) on how measurement uncertainty is being taken into account via an acceptable and agreed-upon decision rule.
Henry Zumbrun
It also depends on the uncertainty of the Measurement and whether the lab performing the calibration followed the proper calculations in evaluating the Uncertainty of Measurement (UOM) when making a statement of conformity.
Making a conformity assessment of “In Tolerance” is all about location, location, location of the Measurement. It’s also about the Uncertainty of the Measurement because anything other than a nominal measurement will significantly raise the risk associated with the Probability of False Accept (PFA).
The probability of a false accept is the likelihood of a lab calling a measurement “In Tolerance” when it is not. PFA is also commonly referred to as consumers risk (β: Type II Error).
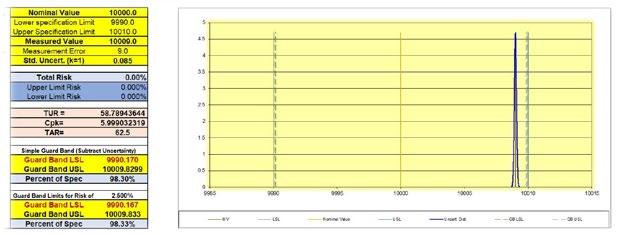
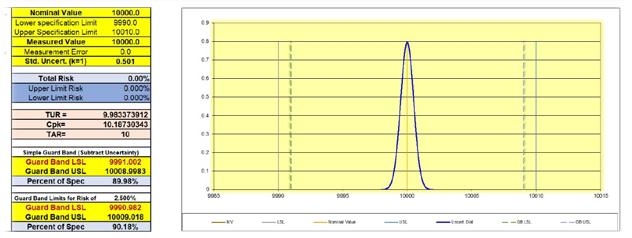
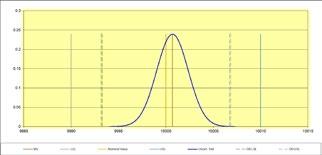
The measurement location we are referring to is how close the Measurement is to the nominal value. If the nominal value is 10 000.0 N and the instrument reads 10 009.0 N, the instrument bias is 9.0 N, as shown in Figure 1. The bias is 0.09 % of the measured value or 90 % of the overall tolerance.
The higher the measurement bias from the nominal, the higher the Measurement Uncertainty of subsequent measurements unless the measurement bias is corrected. In Figure 1, if the unit under test becomes the reference standard, and the measurement bias is not corrected, future measurements made with this Reference Standard will introduce additional Measurement Risk that is not accounted for in the reported Measurement Uncertainty.
Note: NIST SOP 291 has additional information on
1 https://www.nist.gov/document/sop-29assignment-uncertainty-20190506pdf
bias and gives further examples of how to account for any measurement bias in an uncertainty budget.
“Introduction to Statistics in Metrology” addresses bias (measurement bias) in section 5.2 by stating, “There are important assumptions associated with using TUR as a metric and the requirement of a TUR of 4 or 10. Using a TUR assumes that all measurement biases have been removed from the measurement process and the measurements involved follow a normal distribution. If there are significant biases that cannot be removed, the TUR will not account for the increased risk” [1].
When the process distribution is centered between the specification limits and does not overstate or understate the nominal value of the Measurement, higher TURs produce wider acceptance limits. In comparison, lower TURs, such as 1:1, will reduce acceptance limits.
When the measurement bias is corrected, these limits can easily be calculated as a percentage of the specification when the Measurement Uncertainty is known. Acceptance Limits (with the appropriate guard band) based on decision rule applied are covered in detail later. The Metrology Handbook, 3rd edition, Chapter 30 covers the topic on Decision Rules [2].
When the reference standard measurement value is centered (nominal value), the calibration laboratory can still say the device being tested is within tolerance. A laboratory’s scope of accreditation indicates its best capability to call an instrument in tolerance when any measurement bias is observed in the measurand (quality being measured).
Let’s Talk About Bias: Measurement Bias
Henry Zumbrun
Note: The scope of accreditation likely does not take into account the measurement uncertainty contribution of the equipment submitted for calibration. The laboratory’s scope of accreditation only includes the contribution from the best existing device to be calibrated and may not be what is used for the customer’s device submitted for calibration.
In Figure 2, the measured value is centered (nominal value). With the measured value at the nominal, assuming a PFA of 2.5% (based on the decision rule employed), the measurement result is considered to be in conformance (“Pass”) as long as it is within the acceptance limits. Please note that the acceptance limits are calculated, taking measurement uncertainty into account and implementing the appropriate decision rule.
What if we switched calibration providers, for whatever reason, to someone with a higher calibration and measurement capability uncertainty parameter? Switching calibration providers may make sense for several reasons. However, if one does not understand the relationship between measurement uncertainty, decision rules, and acceptance limits, shopping on price alone might mean more failed measurements. More failed measurements often result in an overall higher cost and increased risk to companies and their customers. These decisions should not be made without properly evaluating the supplier’s capabilities and reputation. The recommendation for overall risk reduction is to use accredited calibration suppliers with
High-Risk Scenario

low uncertainties appropriate to the risk tolerance.
An example of understanding overall risk happened when Morehouse had a customer that would send in two bolt testers periodically for calibration. One was always centered (low to no bias), similar to Figure 2. The other slowly approached the acceptance limits (not specification limits), similar to Figure 1, showing a high bias.
Eventually, the bolt tester with the non-centered measurements (high bias) failed calibration. Morehouse was informed that this out-of-tolerance Measurement resulted in a one-million-dollar plus recall. The Measurement was approaching the acceptance limit and eventually failed. If the customer had corrected for the bias, the one-million-dollar plus recall would have been avoided. It is important to note that selecting a provider with a larger uncertainty would have resulted in no hope or potential to correct the problem before it worsened, resulting in increased risk.
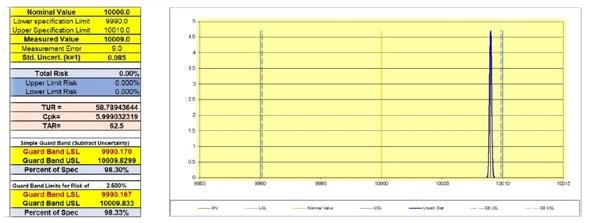
Figure 3 shows the comparison between two different suppliers, resulting in different TUR values. The bottom graph shows the higher risk level using a different supplier. The new provider has a higher Measurement Uncertainty of 0.025 % than shown in Figure 1, where the calibration provider had a 0.0016 % Measurement Uncertainty. Everything else has remained the same. However, the overall measurement risk is now 21.19 %.
The assumption is that the measurement bias is known (+ 9 N). Although the risk is 21.19 %, the bias can usually be corrected (adjusting the measuring system) or incorporated in a measurement model as a correction. Using the high-risk scenario, we will discuss what happens when bias is not corrected.
Henry Zumbrun
Let us look at the high-risk scenario in Figure 3. When 10 000.0 N of force ± 2.50 N was applied, the measured value was 10 009.0 N.
The right thing for the end-user to do is to load the device to 10 009.0 N to apply 10 000.0 N of force. Let us assume they do not do that and use this device to calibrate another 10,000 N instrument.
If we look at the minimum Measurement Uncertainty for the device that read 10 009.0, assuming the bias is corrected, the Measurement Uncertainty would have to be greater than that of the Measurement Uncertainty used for the calibration of the device, which was ± 2.50 N.
The Measurement Uncertainty for this device would be ±2.5 N plus additional Measurement Uncertainty contributors for repeatability, reproducibility, resolution, environmental, stability between calibrations, and other error sources. Likely our measurement uncertainty assuming stability of 0.02 % as the second highest contributor would become around 5.178 N. For more information on how to calculate Measurement Uncertainty for Force, see A2LA Guidance Document G126 [3].
• Scenario 1: Bias is corrected by loading the reference standard to 10 009.0 N to apply 10 000.0 N.
Figure 4 shows a subsequent measurement being made with the calibrated device that read 10 009.0 N when 10 000.0 N ± 2.5 N was applied. This device is now used as a reference standard to calibrate other devices (UUT).

Let’s Talk About Bias: Measurement Bias
Henry Zumbrun

The graph represents correcting the reference standard for the + 9 N bias and using it to calibrate another device (UUT). The measured value of the Unit Under Test reads 9,996 N. The reference standard is being loaded to 10 009.0 N to apply 10 000.0 N ± 5.178 N. The UUT reads 9996.0 with a Total Risk of 1.02 %.
• Scenario 2: The reference standard is not loaded to 10 009.0 N to apply 10 000.0 N. Instead, the device is loaded to 10 000.0 N, which means only 9 991.0 N is applied (10 000.0 – 9.0 = 9 991.0).
We show not correcting for this +9 N bias graphically by subtracting 9 N (9 996.0 – 9.0 = 9 987.0) from the measured value. The UUT reads 9 987.0 N, which could result in the lab failing the instrument and deciding to adjust the device within the acceptance limits (the measured value of this calibration is now off by 9 N and transferred to the UUT).
The result of not correcting for the +9 N bias is a failed instrument that has been adjusted using a reference standard with a high bias and a measurement risk above 87 %.
Let’s Talk About Bias: Measurement Bias

Global consumer’s risk is defined in JCGM 106:2012 [4]. The role of CPU in conformity assessment is defined as “the probability that a non-conforming item will be accepted based on a future measurement result” [4].
The acronym CPU is Calibration Process Uncertainty, which is used in the calculation of risk, and a requirement for any ISO/IEC 17025 accredited calibration provider to take into account when making a conformity assessment using a decision rule. Section 3.7 of the ISO/IEC 17025 defines a decision rule as a “rule that describes how measurement uncertainty is accounted for when stating conformity with a specified requirement” [5].
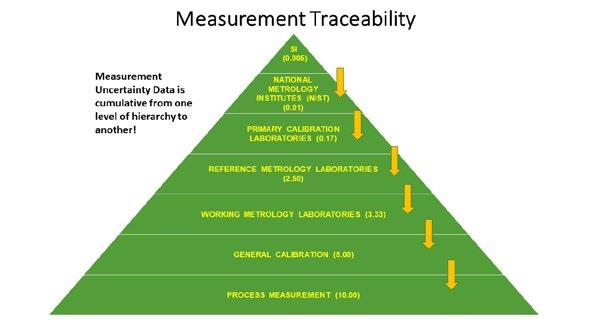
Suppose we follow this logic further, following the progression from the initial calibration at the Primary level through the pyramid, correcting for bias and not correcting at each step. In that case, we can generate random variations due to the measurement uncertainty at each level.
When we do not correct for bias, measurement uncertainty might be underestimated, and therefore may not align with the definition of metrologically traceability, undermining measurement confidence.
Metrological traceability is defined in JCGM 200:2012 as “property of a measurement result whereby the result can be related to a reference through a documented unbroken chain of calibrations, each contributing to the measurement uncertainty” [6].
If we do not correct for the bias and fail to calculate the impact of the bias to our measurement uncertainty,
we no longer have metrological traceability as required in ISO/IEC 17025 section 6.5 [5].
Figure 7 above shows what could happen when the reference laboratory does not correct for bias and applies 9 991.0 N (10,000.0 – 9.0) versus what could happen when Bias is Corrected.
Bias Not Corrected Measured values are generated using Upper and Lower Specification Limits that are modified by the 9.0 N bias taking into the Measurement Uncertainty at each tier.
Remember: When 10 000.0 N was applied, the device read 10,009 N. When the laboratory only loads the device to 10 000.0 N, 9 991.0 is the actual force applied.
In this scenario, not correcting for bias can result in making an incorrect conformity statement when stating conformity to the Tolerance/specification limit (e.g., pass/fail, in-tolerance/out-of-tolerance).
When measurement bias is not corrected, a conformity statement of “Fail” might result in the calibration laboratory adjusting an instrument that should have passed calibration to the wrong nominal value.
If we continue to generate data randomly with and without measurement bias corrected, we might end up with the table and risk scenarios in the graphs below.
By the time we get to the process measurement, the device might have a bias of -20 N from nominal. In our simulation using the measurement uncertainty at each tier, a starting measured value of 9 991.0, and randomly generating numbers within the tolerance of 0.1 %, we prove that not correcting for bias raises the total risk at each measurement tier.
Let’s Talk About Bias: Measurement Bias
Henry Zumbrun
When the bias is not corrected , the starting measured value is 9 991.0; the difference becomes 9 N or 9/10th of the specification limits of ± 10 we are trying to maintain throughout the process with our TUR ratios. (For these graphs, bias is the difference from the nominal value, measured value minus the nominal value.)
If Primary Standards calibrate the Reference with a 58.79:1 TUR (shown in Figure 1), the total risk is 0.0 %. When the next level uses this Reference, if they correct for bias, the risk with a 4:1 TUR is 0.0 %, as shown in Figure 9. If they do not correct for the bias, as shown in Figure 8, the risk is 78.81 %. Randomly generating numbers and not correcting for bias at a 2:1 TUR, the total risk becomes 65.54 %, compared to
0.0 % when bias is corrected in Figure 9. Figure 9 shows randomly generated numbers assuming each tier from the Reference tier to the General calibration tier is correcting for bias. In each scenario, the measurement risk is drastically different.
The larger the measurement uncertainty becomes, the greater the measurement risk. When the bias is corrected, the total risk should follow the percentage of specification in Figure 10. Meaning at a 4:1 TUR, if the measured value falls between 9 992.45 and 10 007.55, the total risk will be less than 5 %.
Earlier, we mentioned how knowing the TUR makes it easy to calculate acceptance limits. In Figure 10, we use the ILAC G8 guard banding method that


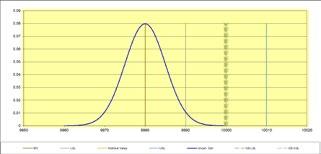
8. Randomly Generated Differences in not correcting for bias total risk graph.


allows for a maximum of 5 % total risk [7].
The assumption here is that the Measurement is centered. At our 58.79:1 TUR we achieved at Morehouse, we know our deadweight machine’s uncertainty is ± 0.0016 %, including any bias added to the uncertainty in the calibration by NIST on our weights.
The TUR formulas work for us; however, if the end-user has not considered (and corrected) for the contribution of the effect of bias in their evaluation

of Measurement Uncertainty, the acceptance criteria may be skewed. Skewed acceptance criteria can increase measurement risk at all tiers, starting from the first tier of the pyramid that did not correct for bias correctly.
Using the manufacturer’s accuracy specification and not correcting for bias can further increase
Let’s Talk About Bias: Measurement Bias
Henry Zumbrun
Measurement Risk. Morehouse did the sampling by varying the TUR and using randomly generated values after the initial calibration by correcting for bias and then by not correcting for bias, which showed a significant difference in Measurement Risk.
Not correcting for bias seems to be a problem many in the calibration deal with, and their unsuspecting customers are likely getting calibrations that carry too much overall Measurement Risk.
The risk of not correcting for this offset (Bias) should concern anyone making measurements. Furthermore, the habit of insisting on a 4:1 TUR, shown in Figure 10, only works if the measurement process is centered (known significant measurement bias is corrected).
In all cases, paying attention to the location of the Measurement and calculating Measurement Risk is imperative to making accurate measurements. Anyone wanting more accurate measurements (measurements with less Measurement Uncertainty) should have a defined process to account for and correct bias. They should also examine their calibration providers’ practices on how they handle and correct their measurement biases.
The reason this is important is JCGM 106 references that when a measuring system is used in conformity assessment, the measuring system has been corrected for all recognized significant systematic errors (Bias) [8]. When bias is not corrected, the risk of making a measurement that does not properly account for bias can result in an underestimation of measurement uncertainty and therefore disagrees with the metrologically traceability definition and undermines measurement confidence.
References
[1] Introduction to Statistics in Metrology Section 5.2
[2] The Metrology Handbook, 3rd edition, Chapter 30
[3] A2LA G126 Guidance on Uncertainty Budgets for Force Measuring Devices
[4] JCGM 106:2012_E clause 3.3.15 “Evaluation of measurement data – The role of measurement uncertainty in conformity assessment.”
[5] ISO/IEC 17025:2017 “General requirements for the competence of testing and calibration laboratories.”
[6] JCGM 200:2012 International vocabulary of metrology – Basic and general concepts and associated terms (VIM) 3rd edition
[7] ILAC G8:09/2019 Guidelines on Decision Rules and Statements of Conformity
[8] JCGM 106:2012_E clause A.4.3.3 “Evaluation of measurement data – The role of measurement uncertainty in conformity assessment.”
For Figures 7 – 9, random numbers were generated. The Excel function to generate numbers randomly is NORM.INV(RAND(),Measured Value, Measurement Uncertainty at k = 1)
After the initial calibration, the measured values after Tier 1 (Primary) were generated randomly using =RANDBETWEEN(USL, LSL). Both the USL (10 010.0 and LSL 9 990.0) were adjusted to the 9 N difference at tier 2 (Reference) and then, at each tier, adjusted using the measured value from the previous tier. Thus tier 2 used USL of 10 001.0 and LSL of 9 981.0)
The term bias in this paper is the nominal value minus the measured value. It is a known systematic error where a correction can be applied to compensate for this error, such as adding ± 9 N to the 10 000.0 N measurement to generate 10 000.0 N.
Of course, no correction would need to occur if the device is loaded to 10 009.0 N to apply 10 000.0 N, as that is the value needed to generate 10 000.0 N in our example.
The associated Measurement Uncertainty of the system, including resolution, repeatability, reproducibility, reference standard uncertainty, reference standard stability, environmental factors, and other error sources would still need to be calculated.
Henry Zumbrun (hzumbrun@mhforce.com), Morehouse Instruments, York, Pennsylvania, https:// mhforce.com/.
Kai Wendler, Roberto Roca Profet, Keil Gallinger, Kyle Coleman, and Alessio Pollarolo
Measurements International1
The accurate measurement of dc current from 1 A to 3000 A is of interest in many fields, including metrology, power generation, and multiple industries. Current measurement is often performed using Hall sensors, Anisotropic Magneto-Resistive (AMR) sensors, and dc resistance shunts. Each of these devices have limitations and all require calibration to provide traceable current measurements. This paper examines the difficulties encountered when making accurate current measurements using dc resistance shunts at currents up to 300 A. The shunt measurements are compared with measurements made using a direct current comparator transformer (DCCT) and the advantages in stabilization time, stability and reduced uncertainties are discussed.
The accurate measurement of dc current at values of 1 A and above is challenging. When using a traditional style meter, the uncertainties increase significantly, even with an 8 ½ digit meter, as the current approaches 1 A. Current clamps, Hall sensors and AMR sensors allow for the measurement of higher currents but with larger uncertainties. For greater accuracy highcurrent, low-resistance shunts have been used to measure large unknown currents. By measuring the voltage drop across a resistive shunt and knowing the value of the shunt, the unknown current is calculated. The accuracy of such a measurement is largely dependent upon having a thorough understanding of the characteristics of the resistive shunt.
All current measurements made using a standard shunt require the shunt to be calibrated and the calibration to be traceable to the System International (SI). The conditions under which the shunt will be used should be duplicated at the time of calibration. If the
1 Correspondence email: sales@ mintl.com
current shunt is used to measure multiple currents, for example, 5 %, 30 %, 50 %, and 70 % of the standard maximum current, the shunt should be calibrated at all four measurement currents. These measurements are used to determine the current dependence of the shunt.
Figure 1 shows the current dependence of a 0.001 Ω shunt being measured at two different currents; 100 A and 300 A. The difference in the value of the shunt between the two measurement currents is approximately 40 × 10 -6. For accurate current measurements, this change in value must be considered. This raises the obvious question: is

Figure 1. Measured values of a 0.001 Ω resistive shunt at 100 A (blue curve) and 300 A (orange curve) vs a 1 Ω standard resistor. The measurement setup and environmental condition are equivalent in both measurements.
Kai Wendler, Roberto Roca Profet, Keil Gallinger, Kyle Coleman, Alessio Pollarolo

change in value linear between the two currents? To determine the linearity between two measurement currents requires more measurements be made at values between the two currents of interest. Much effort is required to understand the actual effects of a shunt’s power coefficient since the change observed is associated to the temperature coefficient of the shunt.
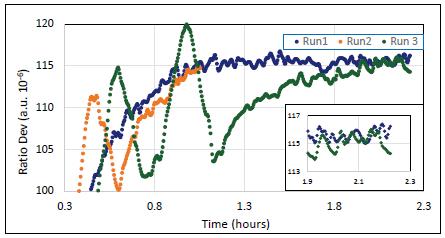
All standard resistors have a temperature coefficient. The effect is minimal for some standards, such as Evanohm® 1 Ω resistors. Current shunts tend to have larger temperature coefficient. The self-heating effect is easily observed when current is first applied to a shunt. Consequently, one must wait to reach a state of equilibrium before using the shunt to make accurate measurements. Once this state is reached, the shunt is referred to as having reached stability. The data in Figure 1 illustrates that the shunt takes approximately 0.8 hours to reach stability, and its value changes by more than 60 × 10-6 over the that time.
It should also be noted that the shunt is more stable with a lower current, likely at the larger current changes in the room temperature have a greater effect on the value of the shunt.
Figure 2 shows the data for the shunt being measured at room temperature three separate times with a two-hour delay between measurements. The shunt takes
approximately 1.5 hours to reach stability for the two 2.2 hour runs (blue and green). The value from when the current is applied until the shunt reaches stability changes by more than 60 × 10-6.
In Figure 3, the scale has been changed to highlight the agreement between the three measurements. Although Run2 (orange) was shorter, it looks consistent with Run1 (blue). However, Run3 (green) behaves differently from the other two measurements, this is believed to be due to environmental conditions. Nevertheless, Run3 approaches the same equilibrium as Run1.
It should also be noted that even after reaching stability, the value of the shunt continues to vary by approximately 3 × 10⁻⁶. This raises the question, will the shunt behave the same way if the room temperature is different from the room temperature during calibration?
Standard resistors are often maintained in air and oil baths to provide a stable environment and greatly reduce the effects of the temperature coefficient. Due to the power dissipated by a high current shunt, running a shunt in an air bath is of no use, as it will overpower the air bath’s ability to regulate the temperature. Using an oil bath presents similar challenges, but the effects of the shunt’s power dissipation are reduced. Choosing to calibrate a shunt in an oil bath is only of value if the end user is also using the shunt with an oil bath.
Kai Wendler, Roberto Roca Profet, Keil Gallinger, Kyle Coleman, Alessio Pollarolo

Standard resistors drift over time. The drift tends to be linear, but this is not always the case. Multiple measurements over time are required to calculate an accurate drift rate. Using the drift rate, the value of the current shunt can be projected to the date of use. The uncertainty associated with the projection will need to be included in the uncertainty budget. If these added calculations prove impractical, an uncertainty component for the drift will need to be added to the uncertainty budget.
Along with the shunt’s calibration uncertainty, the uncertainties due to current dependence, the temperature coefficient of the shunt, the shunt’s drift, and the repeatability of the measurement need to be included in the uncertainty budget when measuring an unknown current. These uncertainty components are often much larger than the calibration uncertainty.
With the advent of quantum voltage (PJVS) and resistance standards (QHR), the calibration uncertainties for dc Zeners and
standard resistors are now below 1 × 10 -7 . Very accurate measurements of dc current below 100 mA should be achievable using a calibrated standard resistor and an accurate digital multimeter (DMM). At low current levels, the problems that arise when using current shunts, while still present, are very much reduced or become so small as to be inconsequential. If unknown currents above 1 A could be accurately divided to a lower level, the high currents could be measured with greater accuracy. The uncertainty of the measurement would become dependent upon the accuracy of the current division.
The DCCT is a complex 1:100 and 1:1000 transformer. By the nature of design, a DCCT will not have a temperature or current dependence. The division of current is based on transformer turns, and these turns will not change over time, thus, there will be no drift over time.
Combining multiple DCCTs enables the measurement of currents in the several thousand Ampere range. For instance, using a DCCT rated for 3000 A, a current of 2000A can divide by 1000 down to 2 A. This 2 A current can be further divided by 100 using a second DCCT to 20 mA. The 20 mA is

Kai Wendler, Roberto Roca Profet, Keil Gallinger, Kyle Coleman, Alessio Pollarolo
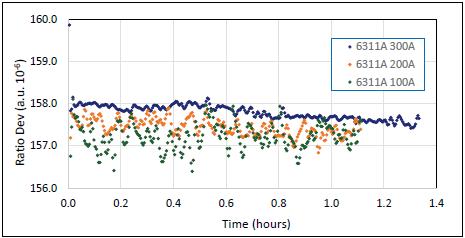
applied to a well characterized 1 Ω standard resistor and an 8½ digit DMM is used to measure the voltage across the resistor. An accurate value for the current is calculated using the measured voltage and the known value of the resistor. Multiplying this current by the calibrated ratios of the two DCCT provides an accurate value of the 2000 A being measured with uncertainties of a few ppm.
In the following measurements, a DCCT is connected to a high current shunt measurement system in a manner that emulates a resistive shunt. The DCCT output current is connected to the current terminals of a standard resistor (RDCCT) as shown in Figure 5. The measurement system includes a DCC bridge, a range extender, and a current source. The DCCT input current is supplied by the range
extender and the output voltage of the RDCCT is connected to the DCC bridge.
The input current applied to the DCCT ranged from 100 A to 300 A, this corresponds to a DCCT output current variation from 100 mA to 300 mA. By selecting different values of standard resistors ( R DCCT ) based on the DCCT output current, the DCCT emulated shunt values of 0.001 Ω and 0.0001 Ω.
The resulting measurements provide the ratio between the DCCT and a known standard resistor (Rs) connected to the Rs terminals of the DCC bridge.
Figure 6 illustrates how the DCCT has no current dependency. For this measurement the same Rs and RDCCT were used for all three measurements. The slight difference in ratio observed between the three measurements is believed to be caused by the power coefficient of RDCCT. The data also illustrates how the current measurement is stable almost as soon as the current is applied.
Figure 7 shows the repeatability and stability of the precision current divider with a measurement current of 100 A. Each measurement is more than two hours and in each case without delay between them. It is important to notice how no warm-up time is required. The RDCCT for these measurements is a 1 Ω resistor rather than the 0.1 Ω resistor used in the previous measurement (result in Figure 6), resulting in a different ratio deviation. When measuring a dc current of 100 A, the DCCT behaves much like a standard resistor rather than a high current shunt.
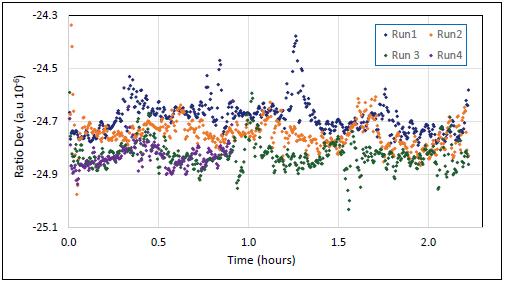
Table 1 lists, for each input current, the expected output current, and the ideal standard resistor (R DCCT) to minimize the measurement uncertainty. This enables the user to emulate a resistive shunt from values of 0.1 Ω to 0.0001 Ω.
Therefore, the ratio of the DCCT is
where the RDCCT is given by the calibration of the standard resistance and RSEq is measured with a high current measurement system.
The deviation from the nominal ratio is .
The calibration of the DCCT is required to determine what the offset is from exactly 1:1000 and 1:100. When a standard resistor is connected to the output current of the DCCT, the DCCT will act exactly like a current shunt, see Figure 8.
The shunt equivalent value of the DCCT is
where
RDCCT is the value of standard resistor connected to the DCCT in Ω, RSEq is shunt equivalent value in Ω, EDCCT is the voltage measured across the standard resistor RDCCT in V, IIN is the current applied to the DCCT in A, and rNOM is the comparator ratio.

The calibration of the DCCT as described provides an accurate ratio value for the device and uncertainties of a few parts in ten to sixth or better, depending on the laboratories capabilities. For example, MI is accredited to calibrate 1 Ω resistors with an uncertainty of 0.1×10⁻⁶ and 0.001 Ω shunts with an uncertainty of 0.9×10⁻⁶. The calibration of a DCCT as a 0.001 Ω shunt, carried out at 100 A, is shown in Figure 9, where one can see the low scatter of the points.
A DCCT provides a solution for improving the accuracy of dc current measurements. The DCCT does not suffer from the shortcomings found with dc resistance shunts, is easy to calibrate and is uncomplicated to use. The current can be measured directly at the output of the DCCT using a variety of DMMs. The measured current is multiplied by the calibrated ratio value for the DCCT, which equals the input current. The DCCT output current can be applied to a standard resistor for more accurate measurements. By measuring the voltage across the resistor and knowing the value of the resistor, the current is calculated using Ohm’s law and then multiplied by the calibrated ratio of the DCCT.

Once in a while, during your normal workday, you stumble across a best practice that a client, vendor, supplier or competition has incorporated which really stands out as a superior practice worthy of replicating. Such an occurrence happened while I was reviewing a supplier’s calibration certificates.
One of the most confusing aspects of calibration certificates for customers has to do with compliance statements and associated decision rules used in reporting calibration conformity test results. Decision rules describe how measurement uncertainty will be accounted for when stating whether a unit or system complies with specified requirements, i.e. limits.
Much has been written about compliance statements and associated decision rules, so it will suffice to say compliance statements and their use in
Christopher L. Grachanen
assessing calibration test point results simply indicate whether a unit or system is:
• Operating as intended
• Not operating as intended
• Operation cannot be determined, i.e. borderline
Borderline in this guise is when a test result is found to be closer to the tolerance limit than half of the measurement uncertainty. This situation is commonly referred to as “undefined” or “conditional” congruent with the following (see Figure 2):
A test result is considered to be a fail when its error plus or minus its measurement uncertainty is greater than the tolerance limits.
A test result is considered to be a pass when its error plus or minus its measurement uncertainty is less than the tolerance limits.
Simple right? Well not so simple when trying to assess

whether a borderline test result is something to be concerned about. Most calibration certificates which include a compliance statement will almost certainly contain a diagram similar to the following from the ILAC document, G8:09/2019 Guidelines on Decision Rules and Statements of Conformity to graphically show test point results with associated measurement uncertainty relative to a specification.
The technical paper by Michael Dobbert and Robert Stern, entitled “A Pragmatic Method for Pass/ Fail Conformance Reporting,” published in NCSL International Measure in March 2010 contains the following diagram (Figure 2 ) which shows the complexity associated with assessing borderline cases [2].
Test point conformity reporting is typically flagged with an ASCII character i.e., *, ?, ‡, etc., to report borderline cases. It can be readily determined, from Figures 1 and 2, that a simple ASCII character indication of a conditional pass or a conditional failure does not give insight as to the severity of “conditional,” requring customers to perform some type of analysis to determine severity. Calibration service customers typically are not versed in performing this type of analysis.
At this time, you have probably figured out from the title of this paper, along with the
Stumbling Upon a Best Calibration Practice
Christopher L. Grachanen

Figure 2. "Acceptance limits for ≤ 2 % probability of false accept guard band (ANSI/NCSL Z540.3)" [2]. Credit: M. Dobbert and R. Stern above discussion on test results reporting, that I stumbled on to what I would consider a best practice for reporting test results for a calibration certificate, and you would be spot on.
esz (yes, in lower case) is a leading European calibration supplier with headquarters in
Eichenau, located on the outskirts of Munich, Germany. esz has a best practice of reporting calibration test results utilizing a graphic representation of measurement data making it very easy to quickly determine how well a device is performing relative to a nominal value (see the following figure
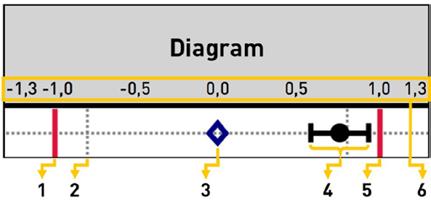
Figure 3. “1:Lower specification limit | 2:Intervention/warning threshold | 3:Nominal value | 4:Measured value incl. measurement uncertainty | | 5:Upper specification limit | 6:Standardized tolerance field" from esz's website [3].

4.
from esz’s website)[3].
This simple graphic not only gives a quick indication of how well a unit is performing relative to its published specifications (tolerances) but also shows:
• Measurement uncertainty (error bands) around the measured value
• Intervention/warning thresholds (acceptance limits)
With this information one can easily assess whether a device’s test result falls within a realm of a conditional pass or a conditional fail condition.
Pretty neat, huh? I applaud esz’s approach to reporting test results in a intuitive graphical format as a best practice that gives customers a quick, easy way of answering the question, “What is the severity of my conditional pass or conditional fail test result?”
In the future I foresee other calibration providers following esz’s lead for reporting calibration test results in a customer friendly, graphic format.
[1] ILAC G8:09/2019 Guidelines on Decision Rules and Statements of Conformity, https://ilac. org/?ddownload=122722
[2] M. Dobbert, “A Pragmatic Method for Pass/Fail Conformance Reporting that Complies with ANSI/NCSL Z540.3, ISO/IEC17025, and ILAC-G8,” NCSLI Measure, Vol. 5 No. 1, pp. 46-51, https://doi.org /10.1080/19315775.2010.11721504
[3] https://www.esz-ag.com/ service/calibrationdocuments. html
Christopher L. Grachanen, ASQ Fellow, 2017 Wildhack and Woodington Award Winner
Dan Wiswell Cal-Tek Company, Inc.
When people see some of the equipment that I’ve been tucking away over the years, the first question that most ask is: “How old is it?” We also hear this question at our lab when a customer receives a repair quote for an old piece of equipment. Armed with this information, some people enter a sort-of anthropomorphic logic state to determine whether the equipment owes them anything anymore. There are many reasons for determining when to junk, repair, or buy new equipment. As we know, obsolescence happens fast. In our own lab there are a few pieces of equipment that have been lovingly shepherded through the past few decades because for whatever reason we just don’t want to part with them. The rate of change must appear to be moving forward at an ever-accelerating rate to anyone that has ever lived in the past few hundred years. A consequence of society’s urge to move forward is the
steady stream of equipment that becomes relegated to the scrap heap of time. Unless of course, someone cherry-picks from the pile and puts them on display. Back in the 1970s, I would often hear the older metrologists in labs that I work in use the terms “High-Tech” or “State-of-the-Art.” They seemed to have a fascination with the subject, but as I was just starting out, I remember being confused by it. Why was it called the State of the Art? Shouldn’t it be more accurately described as the State of the Science? How, or even more to the point, why would they be confused with each other? I wondered if there was some defining attribute that separated the two. I reasoned that the scientific equipment that surrounded me each day was rather anonymous, whereas artwork was more-or-less a personal creation. Artwork gains provenance when the artist adds a signature to the piece; even better, a

signature with a date or some other hallmark that can affix a work of art to a specific moment in time. Art historians can then describe them in the context of the contemporaneous events occurring at the time of their creation.
My perspective on this apparent dichotomy between art and science was completely upended one day when I watched a talented metrologist as he repaired an old piece of equipment. It was an analog phase-angle meter that had extensive wear in the pivots and jewels of its meter movement. As he worked, he seemed to speak of the instrument in front of us with a sort of reverence that drew me in, and I began taking notes. He broke the meter movement down and polished its pivots and jewels. Next, he removed iron filings from its airgap and then quickly reassembled it. I remember his satisfaction during testing when he said, “Good as new.” I asked him why he thought this unit was so special. He looked at me for a moment and said that he considered it to be a work of art, because it had been built during a time when electrical instruments were all hand-made.
As a work of art, he told me that there was a strong probability that he could also show me how old it was. That’s when he had me, and what he showed me next literally cemented me onto the path that I am still on forty-five years after this conversation occurred. Fortunately, years later I was lucky enough to be in the right place at exactly the right time, because now I own this specific instrument. It has a very special spot in my personal collection and is pictured on the previous page.
The metrologist training me that day was John Ribeiro. He was the Quality Manager at the Mancib Company, located in Burlington, Massachusetts. The year was 1978. Just before his demonstration began, he came to my bench in the value-added production department and said with a smile, “You do good work. Not much, but good.” Then he invited me to join the group of metrologists that worked in the repair department. I was thrilled. I was less than half the age of anyone else in that department. Mr. Ribeiro removed the scale from the meter that he was working on and showed me its obverse side. Pictured below is that specific instrument and the information that was written on the back of its scale, which includes the signature of the person that drew its scale and the date that it was made. That date is October 27, 1941.
On October 27, 1941, President Franklin Delano Roosevelt made his “Navy Day Address” to the American people, in which he informed us of the German attack on the Destroyer Kearney that had happened ten days prior to his address. It was the second time an American naval ship had been attacked during the war, the first of which occurred on September 4th, a few weeks before. This phaseangle meter was calibrated and “standardized” two days after the Japanese attack on Pearl Harbor.

In other instances, determining the age of a piece of equipment follows the quality control process of the manufacturer. Such is the case with the Weston Model One pictured on the following page. In the earliest days of the twentieth century, the Weston Electrical Instrument Corporation often provided date-of-manufacture information on the back of their meter scales. However, date stamps strategically

placed at various locations inside a product will also reveal its age. These dates correspond to the day that the instrument passed its quality control testing after final assembly. This particular instrument passed its quality control inspection on May 2, 1904.
The day before this instrument was date stamped, The Battle of Yalu River occurred during the RussoJapanese War. This was the first land battle of the war. It ended with a decisive Japanese victory.
Sometimes, it isn’t necessary to open an instrument to discover its age. Such is the case with the very stylish Weston Model One depicted below. This meter is housed in a protective wooden case. It was previously owned by the Boston Edison


Company and was probably bought when it was brand new. It was last calibrated on April 27, 1981. By simply removing the meter from its outer case we can see the familiar purple-ink date stamp that identifies its date of manufacture as February 28, 1912.
There was a lot going on in the world during 1912. A few weeks prior to the creation of this meter, Hsian T’ung, the last emperor of China, was forced to abdicate following Sun Yat-sen’s republican revolution. This ended two hundred-and-sixty-seven years of Manchu rule and two thousand years of imperial rule in China.
Less than a month and a half after this meter was made, the Titanic struck an iceberg and sank. This meter shares its birthday with Clara Petacci, who was also born on February 28, 1912. She became the mistress of Benito Mussolini and shared his fate on April 28, 1945.
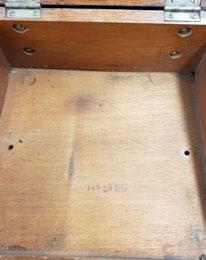
As we can see, examining antique test instruments to find their dates of manufacture can reveal other interesting aspects of the times in which they were made. For example, let’s look at an extremely old DC Volt-Ammeter. Pictured on the following page (to the right), is a Model 540, manufactured by the Weston Electrical Instrument Corporation in Newark, New Jersey. This small, portable instrument is literally packed with historical information. By opening a compartment in the back of the instrument, we can see that this is
where a fuse compartment is located. Fortunately, some of the fuses are still in place. These fuses are the kind of ephemera that are often separated from a product and lost over time. It is amazing to me that a modern and common device like these replaceable fuses has changed so little in nearly one hundred and thirty years. By removing this instrument from its case, we can see other aspects of its historical importance. It is based on Dr. Weston’s patented meter movement. This meter movement was patented only seven years before the creation of this specific instrument. By removing the meter scale, we can see that this unit is serial number 1663. It was manufactured in 1895.
1895 is the year that American abolitionist, orator, and statesman Fredrick Douglass died. In 1895, H.G. Wells published his book The Time Machine. It was also the year that Shemp Howard was born.
This is why I have always loved the work that I do. I’m not sure that I could have found a better career path. Just as we ground electrical circuits, this work grounds me personally. I often think of the challenges that faced the men and women that worked in our industry in years gone by.

In the last few months, I have purchased many new standards for our laboratory. I have also been fortunate to be able to add a few new metrologists to our team. Just as it was in days of old, it’s now my job to continuously push the frontiers of our abilities as we move into the future. To me, it is just as important to know where we have come from. Only then can we truly understand and define where we are today.
Dan Wiswell (dcwiswell@repaircalibration.net) CalTek Company, Inc., North Billerica, Massachusetts.
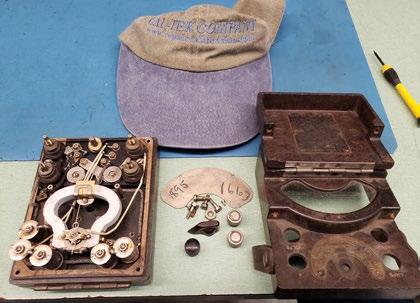


Intrinsically Safe and wireless datalogging options offer precise calibration in manufacturing and processing environments including hazardous areas
DENVER, Colo., April 6, 2023 — Advanced Energy Industries, Inc. (Nasdaq: AEIS) – a global leader in highly engineered, precision power conversion, measurement and control solutions – has added two new high-accuracy handheld temperature calibrators to its TEGAM ® family of measurement and calibration tools. These intuitive calibrators are suited for manufacturing and processing environments including operations in hazardous areas, with applications ranging from aerospace and automotive to chemical, pharmaceutical and food safety.
The Intrinsically Safe (IS) TEGAM 947A is designed for environments that are potentially hazardous due to the presence of flammable gases, vapors or liquids. While conventional IS calibrators are typically single Resistance Temperature Detector (RTD) probe stick thermometers, the 947A supports 14 thermocouple types for added flexibility. The TEGAM 948A offers integrated Bluetooth communication with any software running on a Windows, iOS or Android platform, eliminating the need for complex integration into existing control and monitoring systems.
“Quick and accurate temperature calibration is an essential aspect of many modern industrial manufacturing and processing environments,” said Russ House, director of product line management, critical sensing and control at Advanced Energy. “Offering intuitive operation, our intrinsically safe and Bluetooth-enabled TEGAM calibrators significantly simplify and speed the calibration process while delivering best-in-class accuracy, portability and battery life.”
The new laboratory-grade temperature calibrators feature simultaneous source/measure functionality and provide resolution to 0.01°C with an accuracy of +/-5 µV. Both units combine clear and informative backlit displays with a sealed keypad that rejects fluid and dirt without compromising tactile feedback. Each is powered by three AA batteries and battery life is rated at 500 hours. The 947A is UL-, CSA-, ATEX- and IECEx-certified for worldwide use.
For detailed product information and technical specifications, visit the TEGAM 947A and 948A pages at www.advancedenergy.com.
BN-LLSF-2P Matches CIE Reference Spectrum L41 Per CIE 251:2023
In photometry and colorimetry, standard CIE illuminant A tungsten-filament light sources have exclusively been used as calibration standard sources since 1932.
As LEDs increasingly replace traditional lighting new means and methods of calibration are needed due to differences in emission spectra.
Technical Report CIE 251:2023, just published in February 2023, presents a LED reference spectrum titled “CIE Reference Spectrum L41.”
The shape of this spectrum is based on available LED illuminants as well as minimum error considerations in terms of spectral mismatch errors of photometers. However, it was not designed to match an existing LED on the market. The intention is to use this source in addition to standard CIE Illuminant A for photometer calibration, especially for LED measurements. The report also contains information about typical magnitudes of spectral mismatch errors with V(λ)filtered photometers in measurements of LEDs as well as other types of light sources. This is based on the assumption that CIE reference spectrum L41 is used for photometer calibration instead of CIE standard illuminant A. Finally, the document introduces a quality metric for selection of white LEDs as physical LED standard sources.
On this basis, Gigahertz-Optik developed the LEDbased standard BN-LLSF-2P which is perfectly suited for photometric calibrations according to CIE 251:2023 (see spectra comparison with CIE reference spectrum L41 below). The source matches the reference spectrum very well with just minor deviations as indicated by the spectral distribution mismatch index of fsf, L41=0.016. The standard can be used both as an illuminance calibration standard for photometers as well as a luminous flux standard in combination with an integrating sphere in 2π geometry.
The BN-LLSF-2P standard is offered together with calibration by Gigahertz-Optik’s ISO 17025-accredited calibration laboratory to guarantee the highest quality and standards.
Contact us today to discuss your application and pricing: info-us@gigahertz-optik.com


The 5560A defines a new class of multi-product electrical calibrators with a host of new technologies to meet the demands of modern calibration labs
EVERETT, Wash., Jan. 17, 2023 — Calibration technicians are facing increasing workloads with devices that require even more accuracy. The new Fluke Calibration 5560A Multi-Product Calibrator meets the demands of modern workloads by enabling technicians to calibrate more devices with a single calibrator and at a greater accuracy—up to 6.5 digits—than ever before. The 5560A, along with the new 5550A and 5540A calibrators, defines an entirely new class of multi-product electrical calibrator that provides the broadest electrical workload coverage.
The 5560A features a new 17.8 centimeter (7-inch) graphical user interface with intuitive menus that are easy to navigate and read. The new interface provides access to common functions with the touch of a finger, eliminating menu scrolling. The screen displays all the information technicians need for each parameter being calibrated with color-coded fields that make it easy to see where to enter data.
Other technology innovations and performance improvements include:
• 30 A Class D transconductance amplifier — the 5560A, 5550A and 5540A include 30 A continuous current output with no duty cycle.
• Visual Connection Management™ connection terminals — output terminals light up to show which terminals are active, guiding the user to make the correct connections.
• New output block design — the output terminals have been re-mapped to match the terminals’ layout on standard digital multimeters, making it possible to calibrate this type of workload with minimal lead changes.
• 1000 V direct amplifier — the amplifier reduces the use of transformers to generate high AC voltages to reduce the size and weight of the calibrator, making on-site calibration easier.
• Improved thermocouple input/output mechanical/ thermal design — reduces settling time to improve productivity and reliability because it takes less time for friction heat to dissipate after making the connection.
For more information on the Fluke Calibration 5560A Multi-Product Calibrator, visit http://us.flukecal.com/5560A.
Prescott, Ontario, February 1, 2023 — Measurements International (MI) is proud to announce the release of its revolutionary Cryogenic Current Comparator Model 6200A, a precision measurement bridge designed for use in resistance measurement.
The 6200A Cryogenic Current Comparator features advanced technology that allows for accurate and reliable measurement of current in low temperatures. This makes it the ideal tool for researchers and engineers working in the field of resistance measurement, as well as superconductivity, cryogenic energy storage, and other cryogenic applications.
The 6200A utilizes a unique reliquefication system that maintains optimal measurement conditions at all times, which provides users with continuous operation without the need for a supply of liquid helium.
“We are excited to unveil this revolutionary device, which represents a major breakthrough in the field of precision measurement,” said Ryan Brown, President of Measurements International. “The 6200A Cryogenic Current Comparator will change the way resistance is measured in the laboratory.”
The MI 6200A Cryogenic Current Comparator is now available for purchase from Measurements International. For more information about this revolutionary device, please visit www.mintl.com.
About Measurements International
Measurements International is a leading provider of precision measurement equipment with a focus on developing cutting-edge technology for a wide range of industries. Contact Measurements International for more information.

Michael Schwartz Cal Lab Solutions, Inc.
For those of you who have heard about ChatGPT or even played with it, this question of whether it will replace me doesn’t seem to be a question of “If” but more of a question of “When.”
Personally, I don’t see AI replacing good programmers anytime in the near future. But AIs will take on more and more of a programmer’s daily tasks. Kind of like having an intern; you can assign all those monotonous tasks you hate doing. In the past few months of playing with ChatGPT, I have discovered some of its limitations and areas where it excels.
The first thing I did with ChatGPT was the very thing they tell you not to do with ChatGPT; I asked it legal advice. And as expected, it gave a very good answer based on the question. But it was an intern’s answer, something you would see on the test. Unlike a real lawyer, it didn’t ask me context or follow-up questions to ensure the answer aligned with my exact needs.
The next thing I tried was to see if the AI could write some code—some automation scripts, to be more exact. Here is where ChatGPT shows its weakness. First of all, the creators will tell you the AI was not trained on code examples; no, it was trained on knowledge sites like Wikipedia. Yes, there are small code examples on some Wiki pages, but the examples are limited. And none, of which I know, are focused on metrology-related automation.
That is not to say ChatGPT can’t learn to write code specific to metrology because it can! It just needs examples, thousands and thousands of examples. But where to start?
The user interface doesn’t have an upload function, mainly because it is built as a chat tool. So, using the help files from Fluke MET/CAL® 7.3, because they are text files, I started copying and pasting the text into the chat window. First, I copied the help for the ASK Flags into the chat window, then asked the AI, what does this code do?
1.001
The AI was able to give me a good explanation of what the ASK flags did, but it wasn’t able to create the ASK flags I needed based on my test requirements. This is one of the limits to interactions with AIs; how do you correctly ask the question or define the requirements? The devil is in the details.
I had better results with less technical questions like “Can you write a short story about a monkey who liked to measure things with his tail?”
ChatGPT wrote:
Miles the monkey had always been fascinated with measuring things. And what better tool to measure with than his own tail? He used it to measure the length of branches, the width of tree trunks, and even the depth of the river he sometimes crossed.
One day, while measuring the length of a particularly long branch, Miles heard a loud rustling sound. He turned to see a group of monkeys he had never seen before. They were watching him with great interest. One of them approached Miles and asked, “What are you doing with your tail?”
Miles explained how he used it to measure things, and to his surprise, the other monkeys were impressed. They had never seen such a clever use of a tail before. Miles spent the rest of the day teaching his new friends how to measure with their tails, and they all had a great time comparing the lengths and widths of various things in their jungle home. From that day on, Miles knew he had made some new friends and that he had helped them learn something new.
All and all, my experience with ChatGPT was that it is a great tool but still needs a lot more knowledge and examples before it can actually write code without examples. And, those examples will have to be well documented before an AI can understand any of the nuances unique to metrology.
Keep in mind, ChatGPT was trained on conversation examples, not programming examples or equipment specifications and metrology. The AI is a friendly tool, not looking to replace me at work.


