The economy in figures 2022

92.225 km² Portugal Lisbon 100 km² Lisbon (city) 55 mm Maximum daily precipitation 299 Days without rain 3.015 km² Lisbon (AML) Area People employed in non-financial companies Tourists Students in Tertiary Education Population Non-Financial companies 0,1% 3% 29% 9% 35% 16% 30% 22% 37% 31% 28% 5% AML Lisbon Portugal 0 400 800 1,200 1,600 2,000 2,400 Do you know that? Area Climate Indicators of Lisbon Annual average air temperature 228m Lisbon (City) 528m Lisbon (AML) 2.351m Portugal 2.351m Source: Statistics Portugal, Statistical Yearbook of Lisboa Region, Ed. 2021 Altitude 22,6° 18,2° 13,8° Maximum Mean Minimum 2 The economy in figures 2022
3 ° 0500 250 km Lisbon - AML LisbonCity Portugal Lisbon - AML Spain Algeria Libya Egypt Morocco Tunisia France Italia Austria Germany United Kingdom Ireland Poland Denmark Belgium Holland Norway Lithuania Sweden Finland Latvia Czech republic Greece Hungary Romania Ukraine Bulgaria Belarus Turkey LISBON Lisbon Sintra Cascais Almada Sesimbra Loures Mafra Setubal Palmela Montijo V. Franca de Xira Seixal Montijo Moita Barreiro Oeiras Amadora Odivelas Alcochete Serbia Switzerland 3
BY: Lishoa

A SUA EMPRESA TEM UMA IDEIA I isboaempreendemais.pt CONTE CONNO SC O PARA EMPREENDER MAIS! • • • • • • Programa premiado pe la Startup Europe Awards 2016 - Best • Public Administration for St artups e European Enterp rise Promotion Awards 201S - Grande Premio do Juri3- d ay s t o le a r n every t hing a b ou t h ow t o set up yo ur l ife and bu siness in Lis b on . Practical workshops and int roduction to key partners and the ecosystem .
WWW.STARTUPLISBOA.COM/LAUNCH- I N-LISBON EXPERTISE PARTNER S: PARTNERS: FIDELI :> ADE
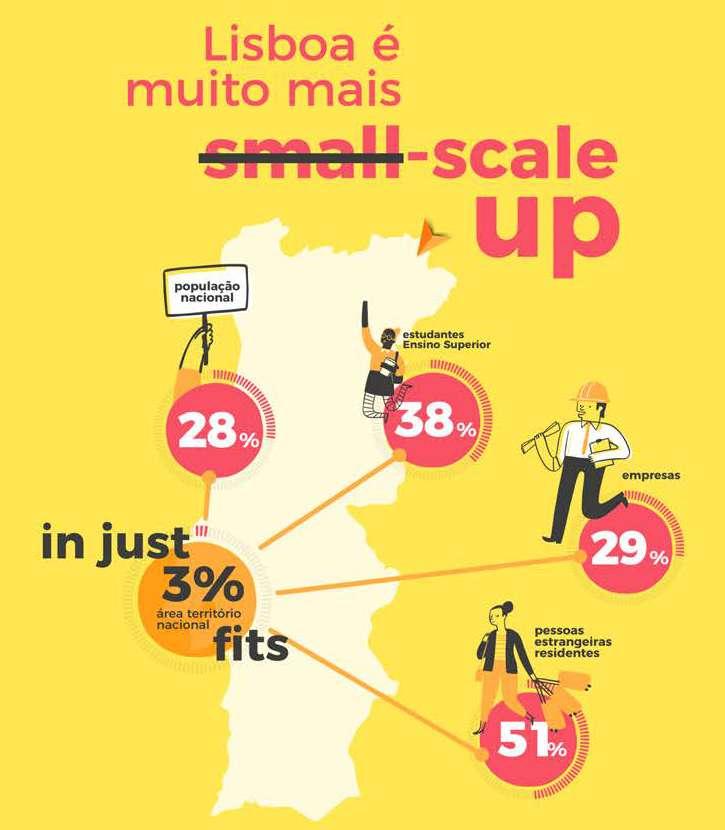
Lisbon is the capital of a country with 10.3 million inhabitants and the Hub of a metropolitan area with 2.9 million inhabitants.
Daily, the number of the city users increases more than 70%, due to the commuting movements (from house-to work and school).
After 5 decades of population decrease, that reached 257 thousand inhabitants (1/3 of the initial population), Lisbon’s population stabilized (slowing down the demographic decrease registered in the previous decades, with only a 3% population decay in the last one), due to the growing number of families and young residents rate.
At present the decrease of population is again an up-do-date issue that may lead to a reversion of these facts.
The majority of the national economic decision centers are located in Lisbon’s metropolitan area, representing 36% of the national GDP and employing 1.417 thousand persons (29% of national employment), reaching an apparent labor productivity 1,2 times higher than the national average.
10.298.252
5.093 Hab/km2
Source: Statistical Yearbook of Lisbon Region, Ed. 2021
Source: Statistics Portugal, Statistical Yearbook of Lisboa Region, Ed. 2021
General overview
Total population Demography
Lisbon (City)
Lisbon (AML)
952 Hab/km2
Density Birth Death Rate 509.614 Lisbon (City) 4,9% Country total 27,9% Country total 2.869.033 Lisbon (AML) Resident Population 11,2% Lisbon (City) 9,8% Lisbon (AML) 8,2% Portugal 14,4% Lisbon (City) 10,9% Lisbon (AML) 12,0% Portugal
5 The economy in figures 2022
Population density in the European Context Capitals (region)
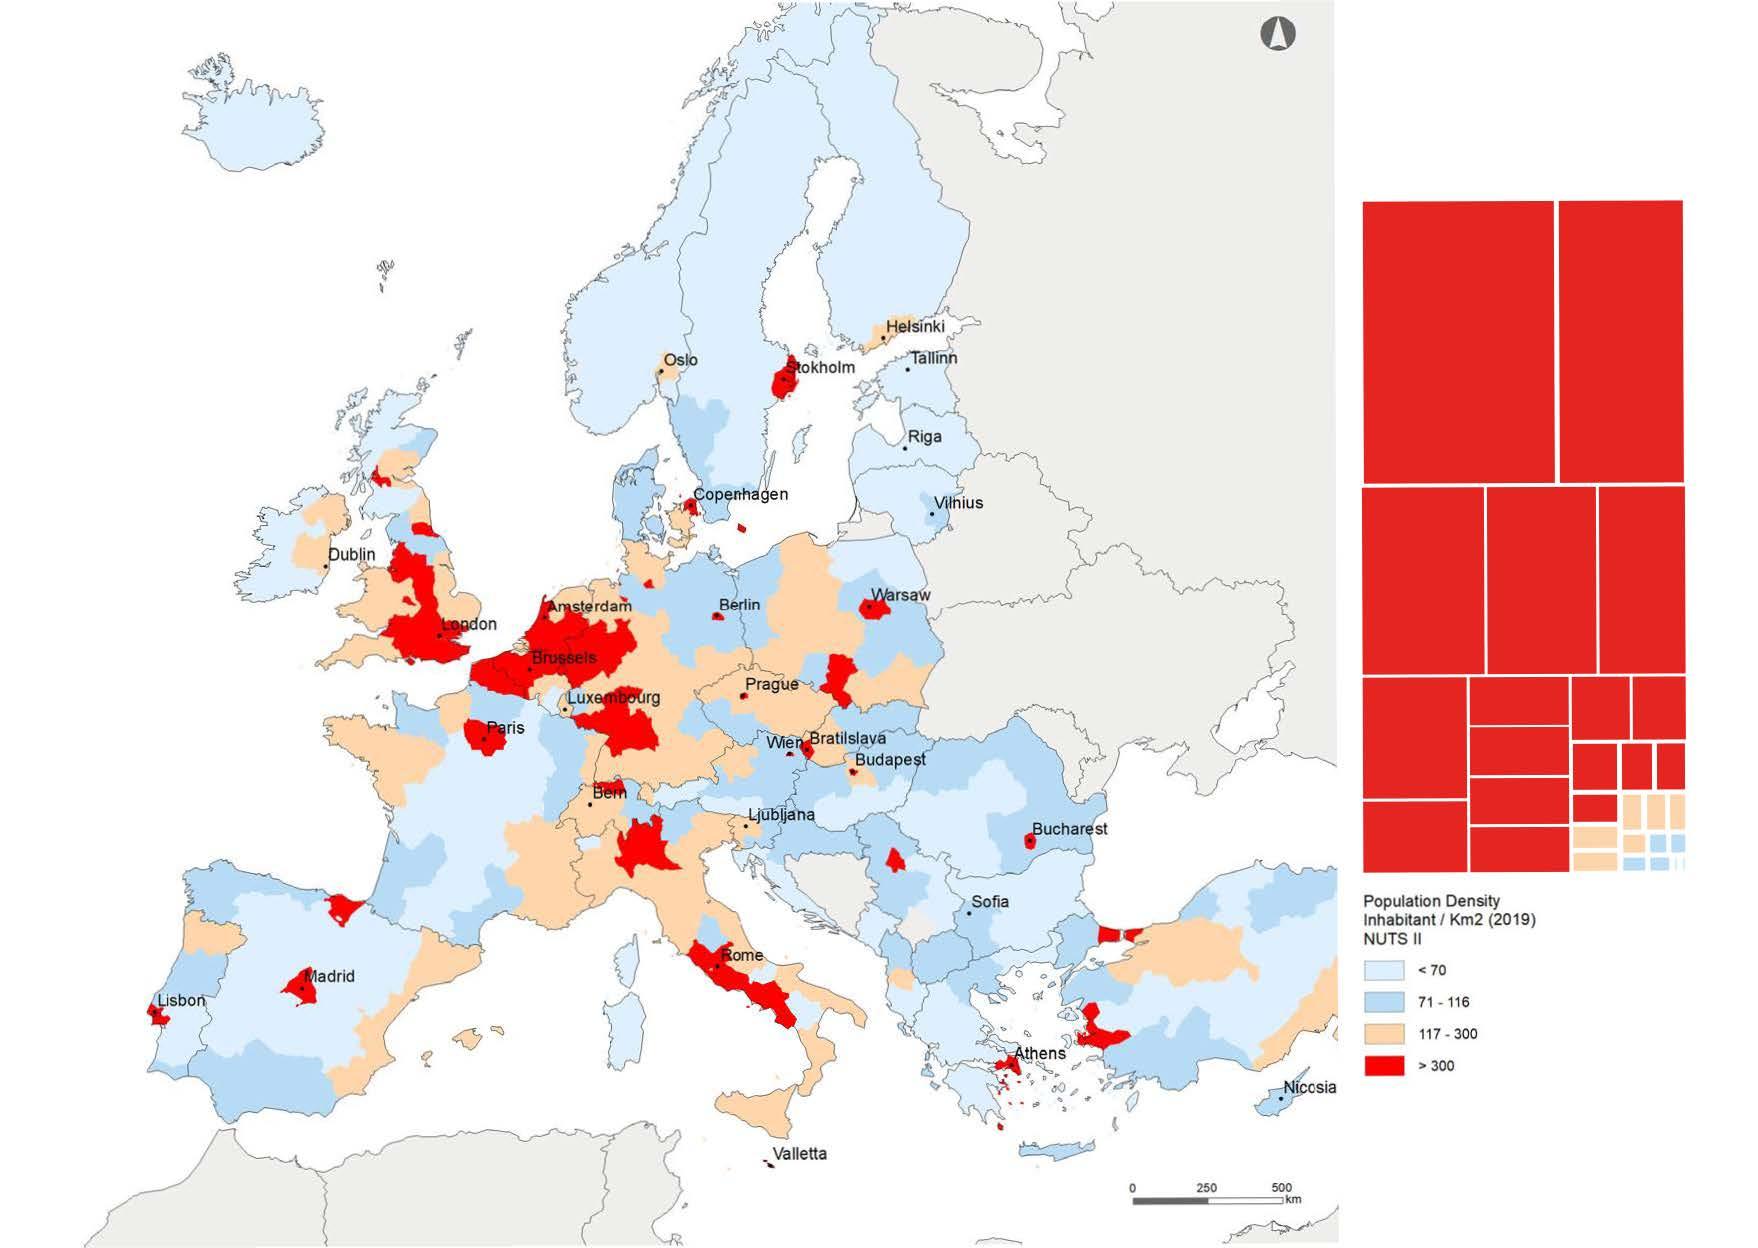
Source: Team of project DMEI/DEP from Eurostat data, Year: 2019; Region NUTS II
Legend:value of capital - Indicator data of the local region
Talin Brussels Berlin Budapest London Vienna Prague Valletta Amsterdam Paris Lisbon Athens Madrid Copenhagen Warsaw Estocolmo Roma Bratislava Oslo Luxembourg Bern Helsinki Dublin Ljubljana Sofia Nicosia Vilnius Bucharest Riga Tallinn EN 6 0 { -4 adrid < Valletta · , 0 250 500 Population Density Inhabit an t/ Km2 (201 9) NUTS II < 70 71 - 116 117 300 - >300 II II - II
Foreign Resident Population
661.607
National total
106.971
Foreign population resident (Lisbon)
330.413
Foreign population resident (AML)
The foreign population living in Lisbon
16,2% Country total
49,9% Country total
Source: Statistics Portugal, Statistical Yearbook of Lisboa Region Ed. 2021
18% Brazil
5% United Kingdom
2% Cape verde
2% Romania
8% China
2% Angola
1% Ukraine
Source: Statistical Yearbook 2021
1% S. Tomé Príncipe
1% Guinea Bissau
Atual. 2022 (EN)
7
----- -------- -------- -/ ----- -------- -------- -)
The economy in figures 2022
Gross Domestic Product (PPS per capita), the European Regions - Capitals (region)
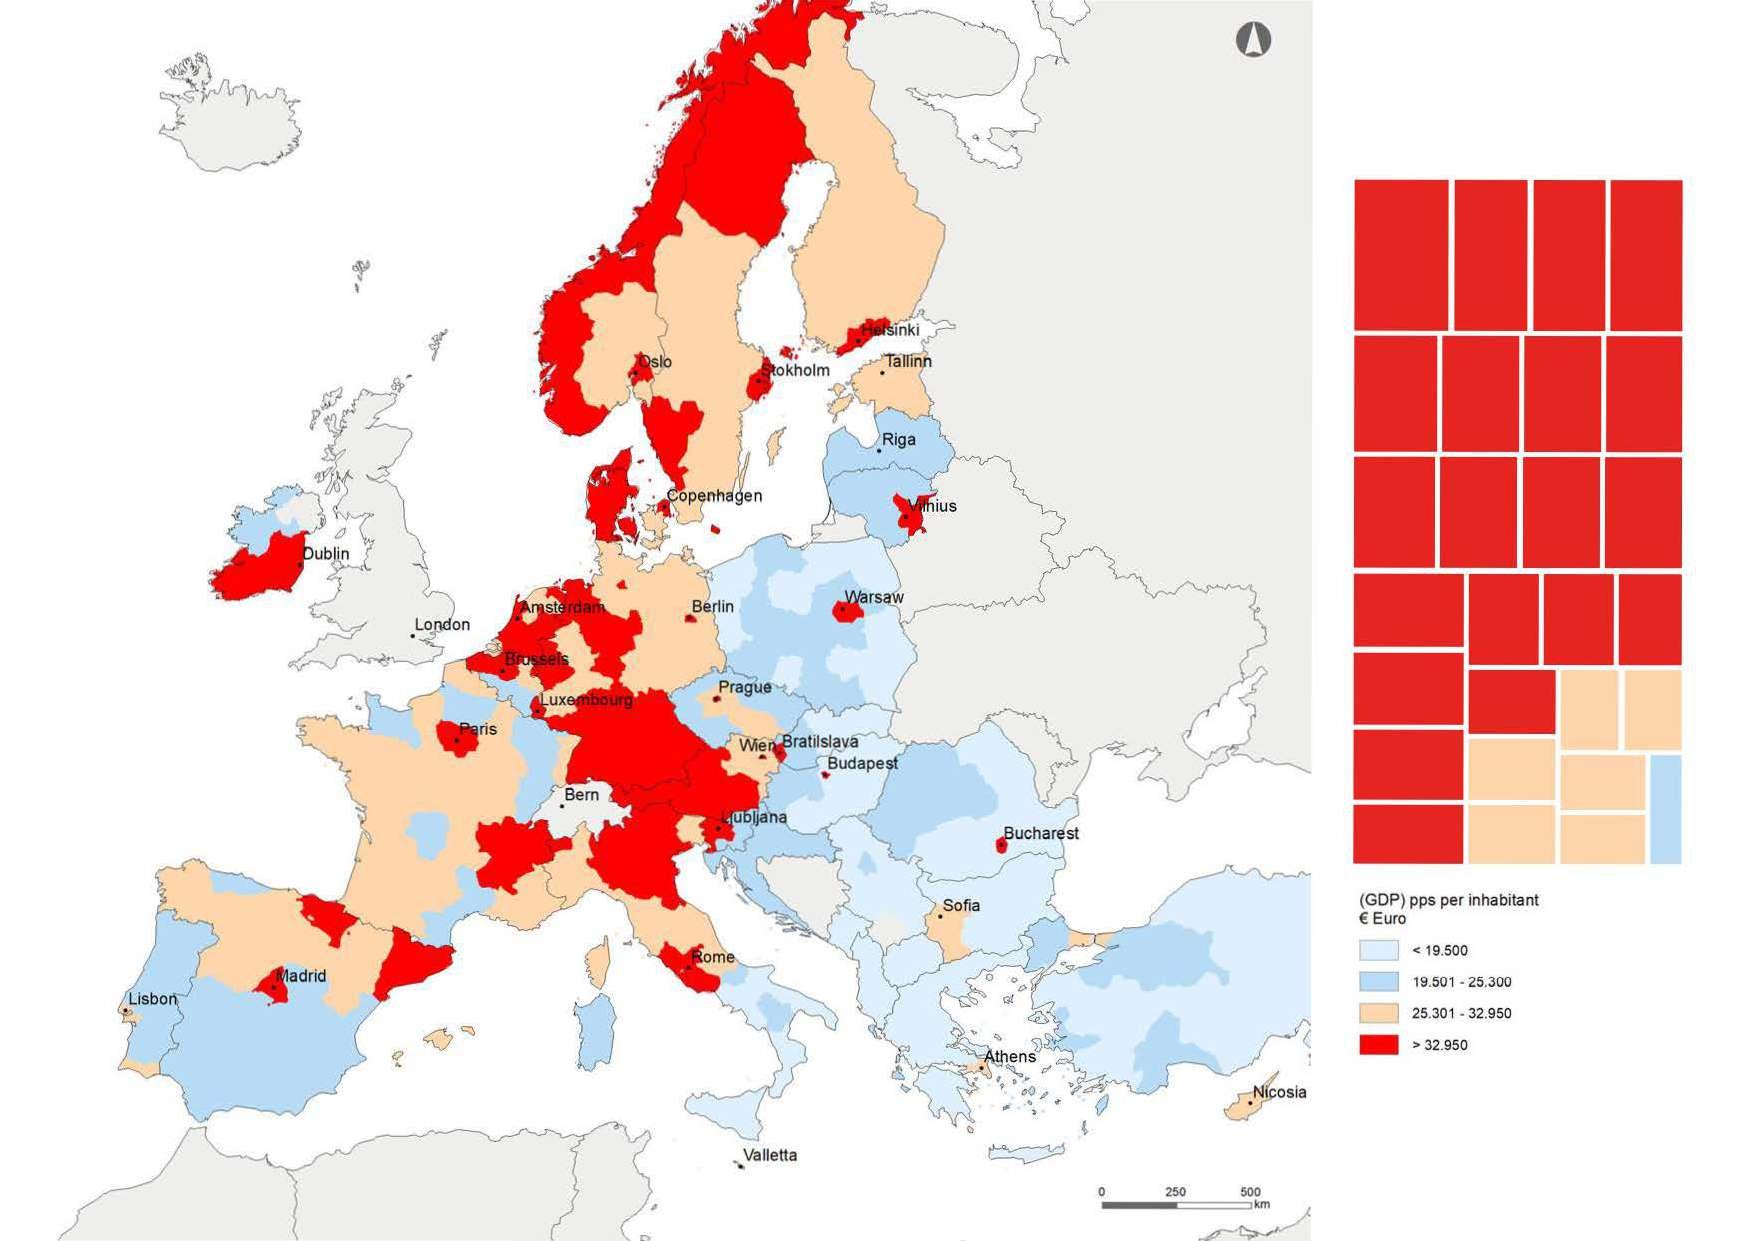
Source: Statistics Portugal, Statistical Yearbook of Lisboa Region - Year: 2019; Região NUTS II
Legend: value of capital - Indicator data of the local region
EN Luxembourg Prague Dublin Brussels Paris Amsterdam Copenhagen Stockholm Oslo Bratislava Warsaw Bucharest Budapest Vienna Helsinki Madrid Berlin Vilnius Rome Ljubljana Lisbon Valletta Athens Nicosia Sofia Talinn Riga 8 0 ( -4 adrid · habi tant
pps
In € Euro < 19 500 19 50 1 • 25 3 00 25 301 • 32 950 < - > 32 .950
(GOP)
per
Economic indicators
Activity and employment indicators (AML)
71.432
GDP* (million €)
62.219
GVA* (million €)
1.416 Employment* (thousands)
24,9 GDP per capita PIB (thousands €)
43,9 Apparent labour productivity (GVA/Employment) (thousands €)
Source: Statistics Portugal, Statistical Yearbook of Lisboa Region,Ed. 2021
GVA and Employment by economic activity in AML
35,7% Country total
35,7% Country total
29,1% Country total
1,3% Country total
1,2% Country total
GVA (million of euros)
(G) Wholesale and retail trade, repair of motor vehicles and motorcycles
(L) Real estate activities
(K) Financial and insurance activities
(O) Compulsory Social Security, Public Administration and Defence
(C) Manufacturing
Employment (thousands of people)
(G) Wholesale and retail trade, repair of motor vehicles and motorcycles
(N) Administrative activities and support services
(I) Accommodation and food service activities
(Q) Human health activities and social support
(O) Compulsory Social Security, Public Administration and Defence
Source: Statistics Portugal, Statistical Yearbook of Lisboa Region, Ed. 2021
9.115 8.337,9 5.514,4 5.113,3 4.731,4 0 5.000 10.000 C O K L G 223,5 193,7 130,1 119,3 100,3 0 150 300 O Q I N G
9 The economy in figures 2022
Business and Entrepreneurship
Lisbon metropolitan area concentrates a significant number of high degree of technology and R&D companies, 382.504 companies headquarters are located in this area.
It’s also the region with most employees in foreign enterprises and in high technology companies, comparing with the national average. Lisbon has a good performance in foreign investment attraction (with the set up and expansion of several multinational companies), and reveals potential for the location of shared and near shoring services , as well as for ICT, health and well-being companies.
Structure of the Business sector (AML)
382.504
Total of enterprises
1.482.870 Persons Employed
45.770 GVA (millions €)
187.660 Turnover (millions €)
29,0% Country total
35,1% Country total
43,8% Country total
45,5% Country total
Statistics Portugal, Statistical Yearbook of Lisboa Region, Ed. 2021
10 The economy in figures 2022
Structure of the Non-Financial Sector of the Lisbon (City)
120.698 Enterprises
59.113 Companies
675.345 Persons Employed
24.272 GVA (millions €)
Total companies in Lisbon City
9,2% Country total
13,5% Country total
16,0% Country total
23,2% Country total
Source: Statistics Portugal, Statistical Yearbook of Lisboa Region, Ed. 2021
Source: Team of DMEI project, the data from the INE, Year: 2016
N High Low
11 The economy in figures 2022
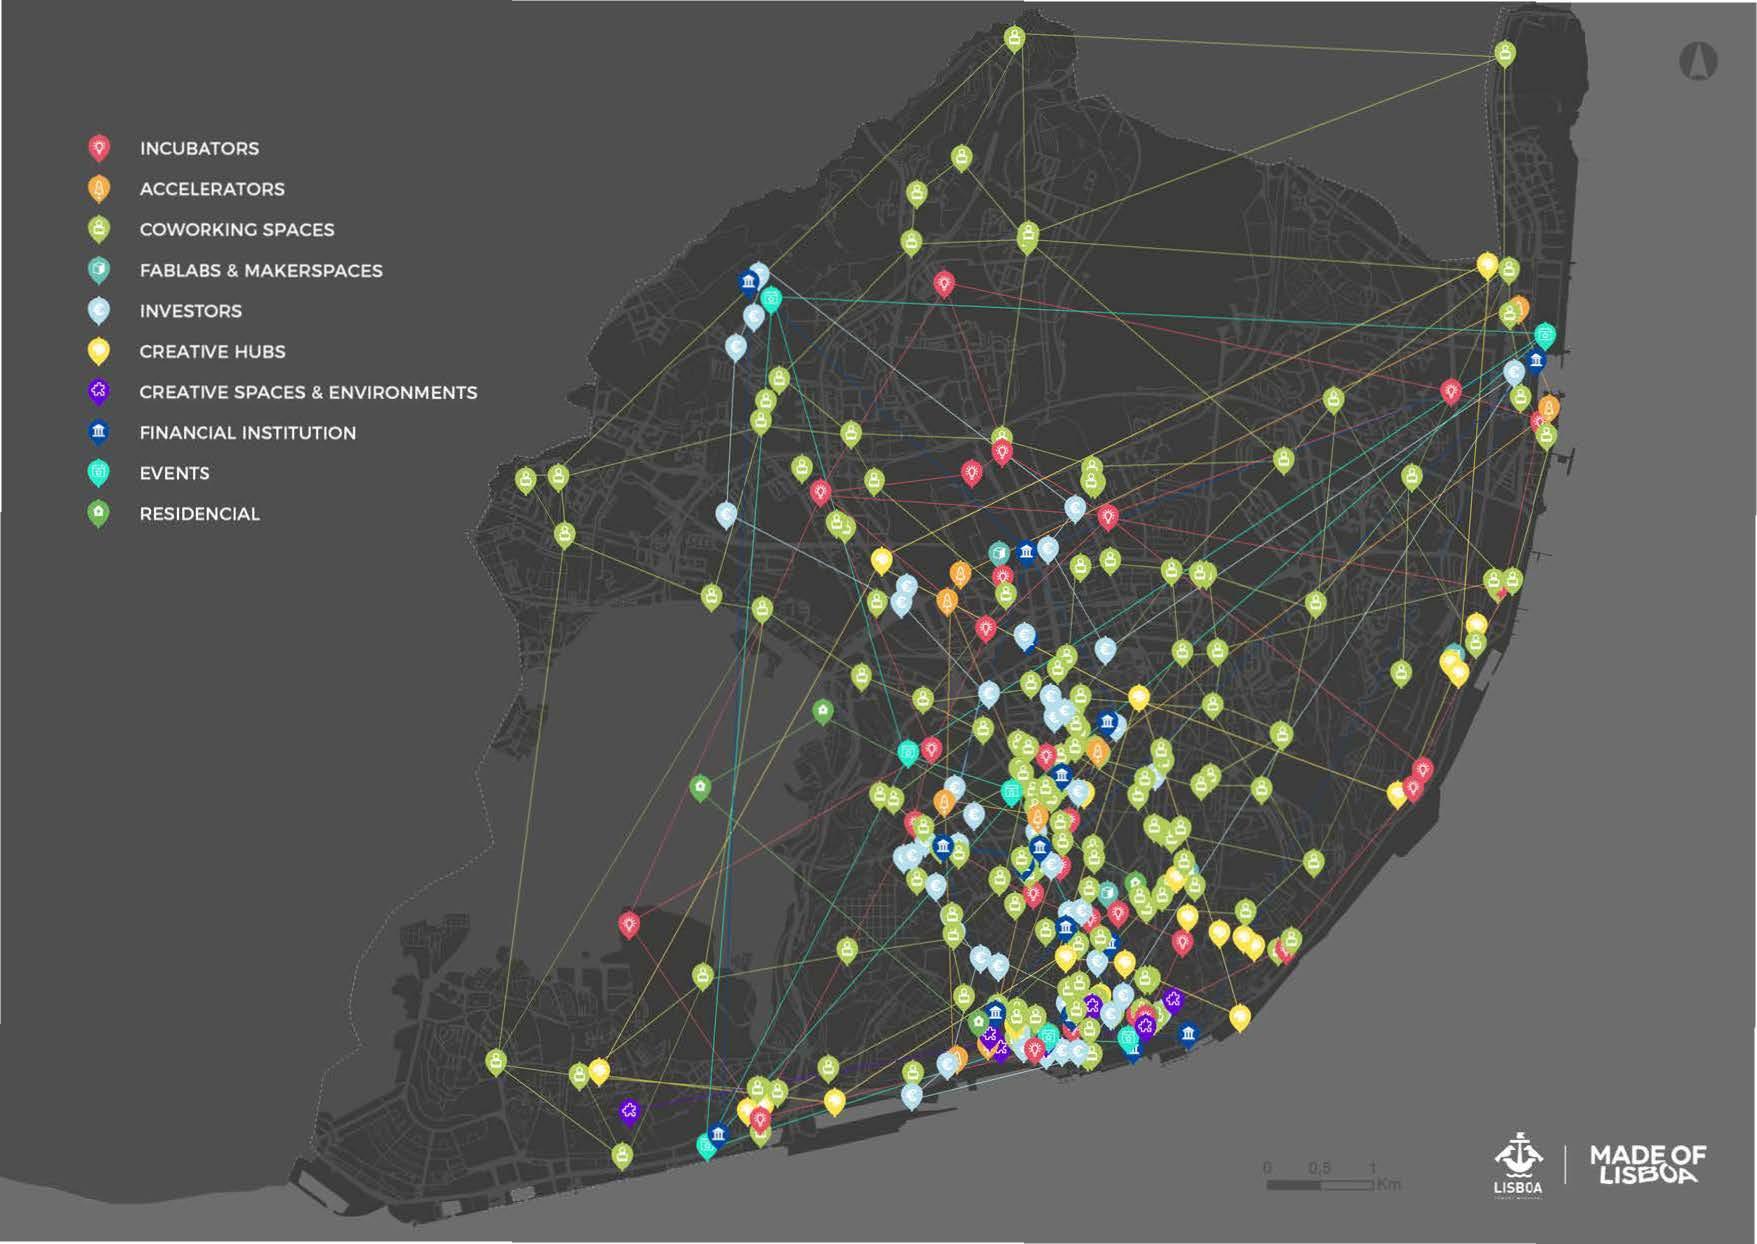
LISBON: A GROWING ENTREPRENEURIAL ECOSYSTEM
0
MADE"OF Community of Lisbon-based Innovators
you like numbers. We know about collaborative workspaces, innovative entrepreneurs and startup and track who belongs to our t heir businesses about. And there 's a lot more you can do Find us and find for yourself. Made of Lisboa is home for Lisbon based innovators You're welcome. madeoflisboa.com 4> I MAOEOF LISDCJ:>£:...:•'
So
Weight of sectors of the Region of Lisbon, according to the Persons Employed*
Source: CML/DMEI, from data INE, I.P. SCIE, Year: 2019
*Representation of strategic sectors based on the staff, according to the demarcation drawn by CML/DMEI
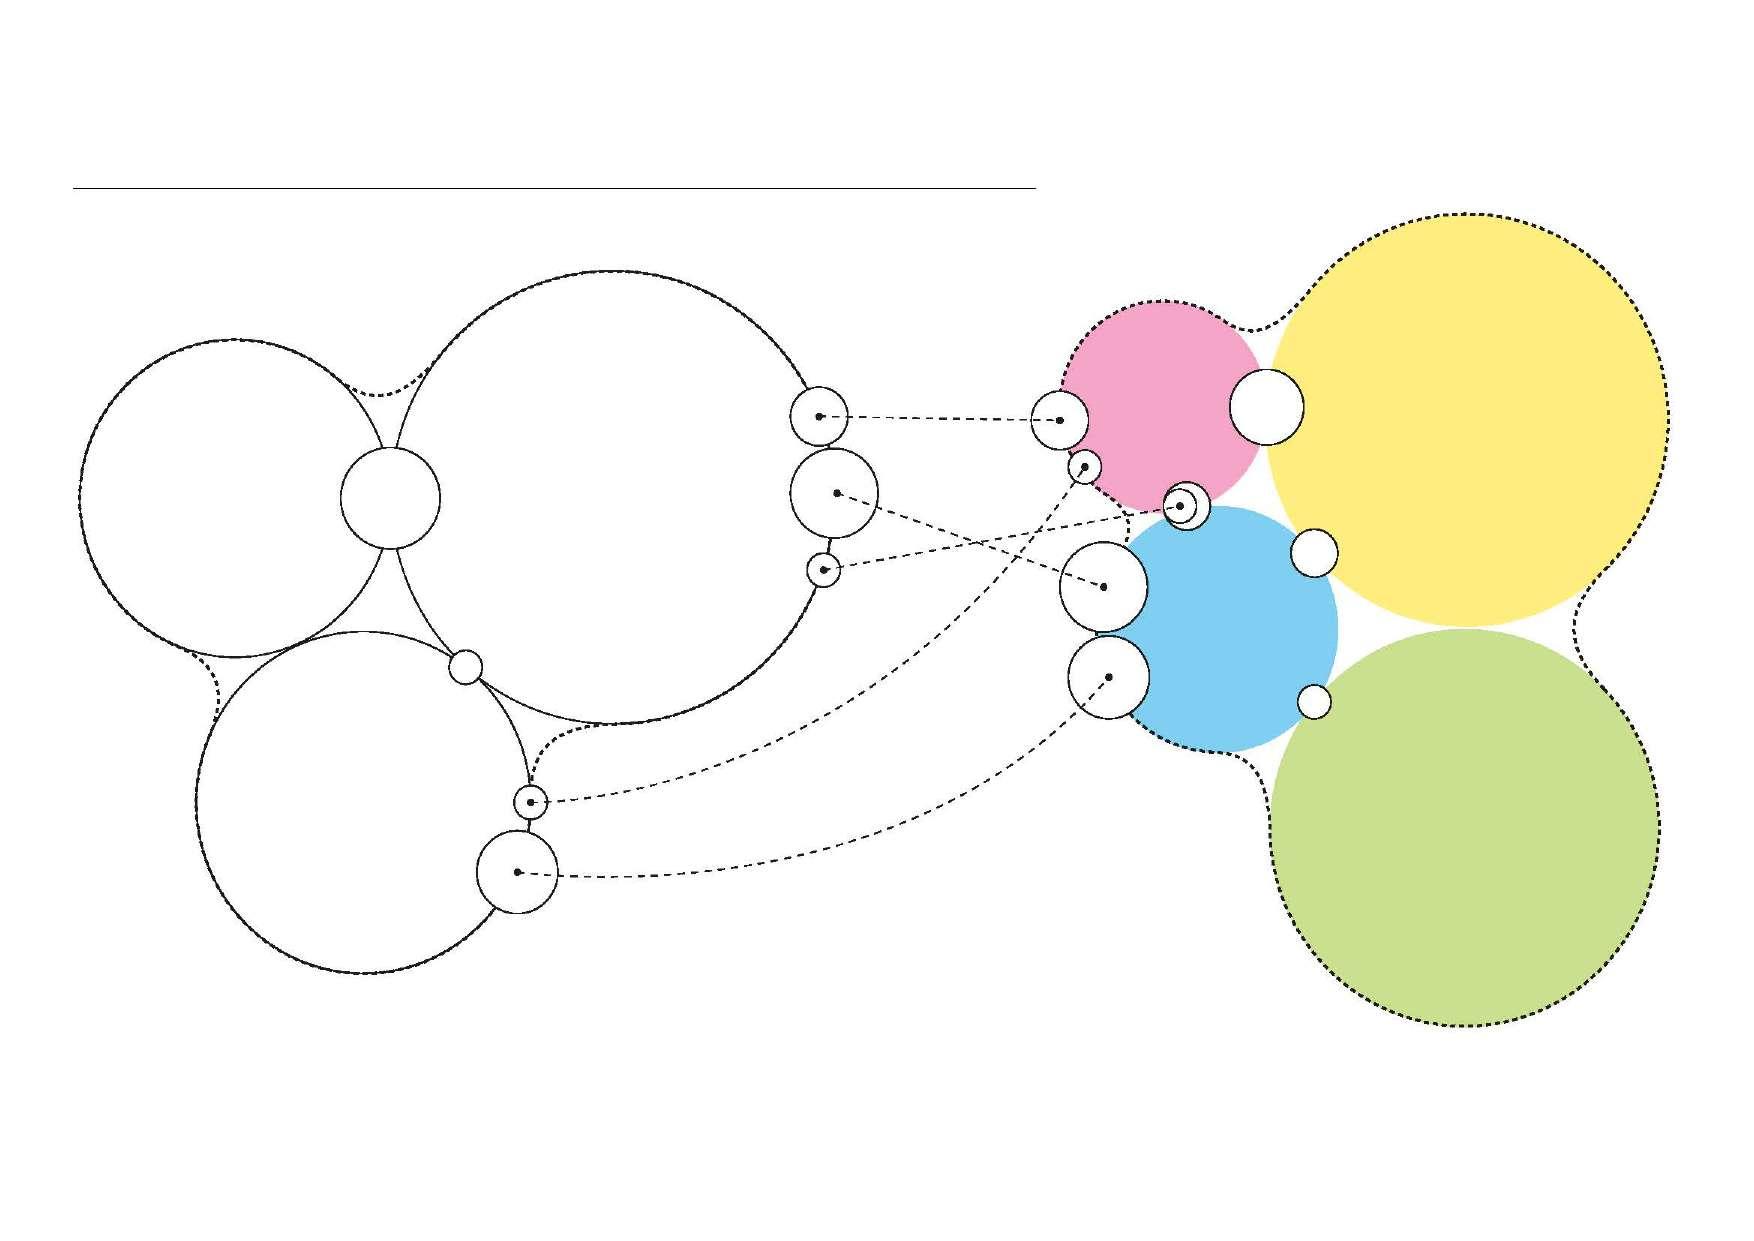
3,9% Creatives 5,3% Sea 13,8% Health Strategic
10,2% Commerce 8,8% Construction and Real estate 17,9% Tourism Sectors of Reference 14,8% ICT's
Sectors
14 The economy in figures 2022 ,,' -- _,, -----------------. .. ... .. _ ....... ·.. ••• I . •••••' ••••. •'• ''•. . . • I I 0 0 . ' . ' . '' : • • . . ·.. .·· .. ..·· ...... ...... •"' _______ ........
Employment in High-tech sectors, in European Regions Capitals (region)
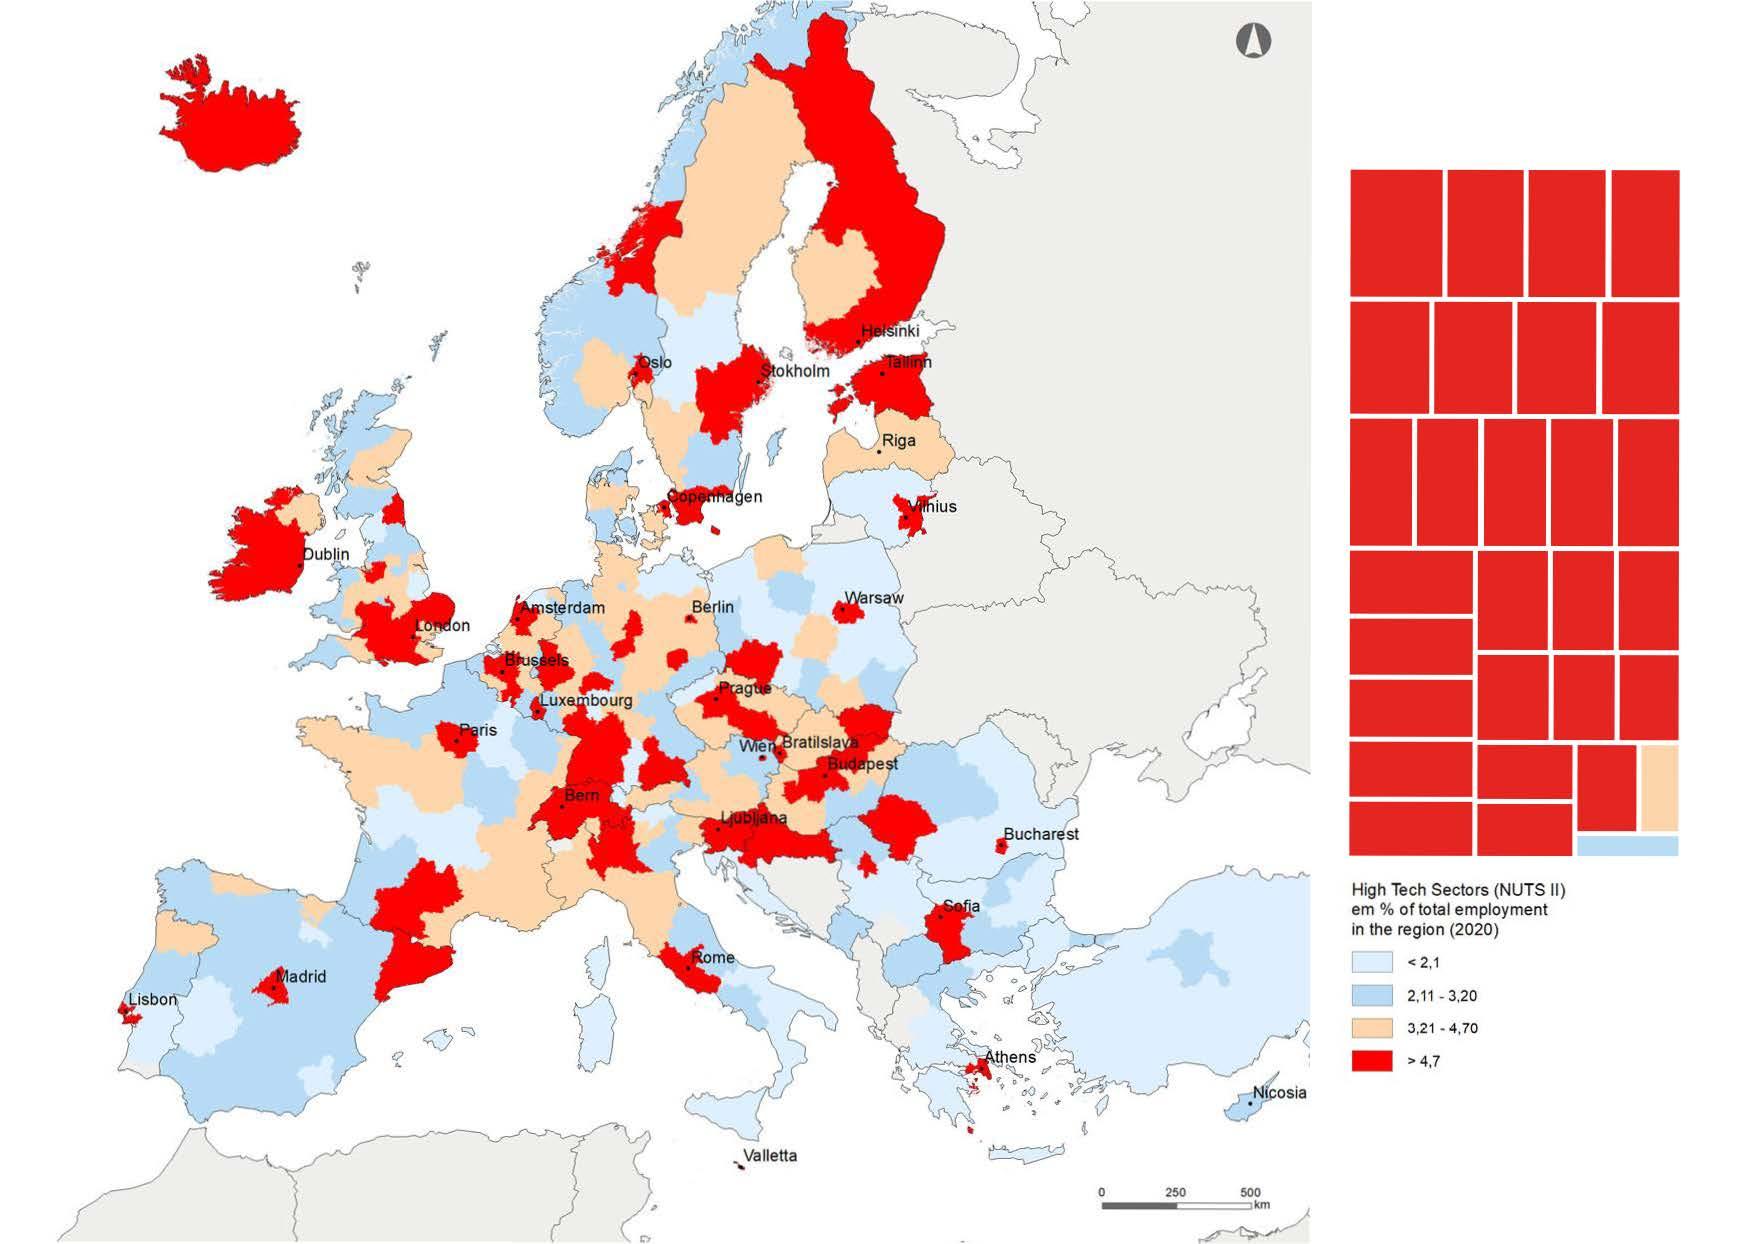
High Tech Sectors ( NUTS II ) em % of total employment in the region (2020 )
Source: Statistics Portugal, Statistical Yearbook of Lisboa Region, Year: 2020; NUTS II Region Legend: value of capital - Indicator data of the local region
EN EN Budapest Berlin Bratislava Stockholm Prague Helsinki Copenhagen Bucharest London Ljubljana Dublin Sofia Warsaw Paris Madrid Oslo Rome Bern Luxembourg Vienna Vilnius Brussels Athens Valletta Lisbon Talinn Amsterdam Riga Nicosia 15 0 f 0
<
2
-
3 ,21
- >4,7
2 ,1
,11
3.20 l
- 4 ,70
OPEIU-DAVS: Mercado do Forno do Tijolo, Lisboa 3as e 5asfeiras Faqa a sua reserva em: LISB<>A 18h-18h fablablisboa.pt
Human capital and knowledge
Lisbon labor market presents highly competitive, multilingual, creative, flexible and qualified human resources. More than ¼ of Lisbon city inhabitants has higher education, with a competitive wage level, comparing with other European cities.
The Lisbon metropolitan area concentrates 27% of national active and employed population, and unemployed reaches 107,4 thousand persons. In Lisbon metropolitan area the expenses on Research and Development (R&D) reach 1.7% of regional GDP, a very significant level in the European regional context.
With nearly 153.000 students enrolled in tertiary education, in 2018 more than 31.000 students graduated at tertiary education institutions, with particular relevance in the areas of business and administration, health, engineering and social sciences, which accounted for more than 58% of the graduates. Lisbon has been engaging a growing number of internacional students, that was greater then 18.000 students, in the year 2020/2021.
The Lisbon metropolitan area concentrates more then 43% of national R&D expenditures it is where the business sector is responsible for 49% in the financing and 51% in execution.
Qualified human capital (AML)
Indicators of Resident Population Towards Employment
1.399,9
1.292,5
%
Indicators of Activity and Employment
Active Population (thousands)
Employed Population (thousands)
Country total
26,8%
Country total 107,4 Unemployed Population (thousands)
27,1
Country total 30,6%
Source: Statistics Portugal, Statistical Yearbook of Lisboa Region, Ed. 2021
48,8% Activity rate (AML) 50,2% in Portugal 46,9% in Portugal 46,8% Female activity rate (AML) 30,2% in Portugal 29,5% 15-24 years activity rate (AML) 23,4% in Portugal 22,5% 15-24 years activity rate (AML) 18 The economy in figures 2022
Source: Statistics Portugal, Statistical Yearbook of Lisboa Region, Ed. 2021
Human capital and knowledge
Unemployment Rate
Source: Statistics Portugal, Statistical Yearbook of Lisboa Region, Ed.2021
Resident Population by Highest completed level of education
Average monthly earnings
1.669,4€ in Lisbon 1.477,4€ in AML
1.206,3€ in Portugal
Source: Statistics Portugal, Statistical Yearbook of Lisboa Region, Ed. 2021
Gross Salary Level (NY=100))
Source: Statistics Portugal, Statistical Yearbook of Lisboa Region, Ed.2021
Source: UBS, Price and Earnings 2018
23,7% 7,7% 7,7% 22,6% 7,1% 6,8% 0 5 10 15 20 25 30 35 40 Total Female years 15-24 Lisbon AML Portugal Lisbon AML Portugal Lisbon AML Portugal 0 20 40 60 80 100% Lisbon (AML) 39,7% 32,1% 27,8% Tertiary Education Secundary Education Basic Education None Portugal 29,8% 29,6% 39,5% 1,1% 0 70 140 Athens São Paulo Tallinn Doha Lisbon Riyadh Seoul Ljubljana Dubai Manama Nicosia Taipei Tel Aviv Madrid Barcelona Hong Kong Brussels Milan Lyon Auckland London Paris Rome Amsterdam Helsinki Dublin Berlin Tokyo Sydney Montreal Frankfurt Stockholm Munich Toronto Chicago Vienna Miami *New York Oslo Copenhagen Los Angeles Luxembourg Zurich Geneva
19 The economy in figures 2022
Unemployment as % of population aged 15+ in European Regions Capitals
Athens Madrid Brussels
Vienna Rome Paris Riga
Lisbon Stockholm Nicosia Helsinki
Valletta London Amsterdam
Unemployment % (NUTS II) of population aged 15+ (2020)
Oslo Bern Sofia Bratislava Budapest Warsaw Prague
Source: Statistics Portugal, Statistical Yearbook of Lisboa Region, Year: 2020; NUTS II Region Legend: value of capital - Indicator data of the local region
EN
Vilnius Luxembourg Tallinn Berlin Copenhagen Dublin Bucharest Ljubljana
20
Knowledge and innovation
411.995
No. enrolled in Tertiary Education
Indicators in Tertiary Education
122.554 Students enrolled (Lisbon)
153.149
country
%
Foreign students
58.960 National total
* includes Erasmus Program
8.249 of which in International Mobility Programs*
Foreign nationality students enrolled
18.056 Total (Lisbon)
2.906
From which in programs of international mobility* (Lisbon)
24.981 Graduates (Lisbon)
22.400 in AML
3.656 in AML
38,0% AML in the country
44,0% AML in the country
Source: DGEEC/MEC Direção-Geral de Estatísticas da Educação e Ciência 2020/2021
* Includes Erasmus Programme, Protocol/partnership with a foreign institution and other international programmes
%
Source: Statistics Portugal, Statistical Yearbook of Lisboa Region Ed. 2021, Year: 2020/2021
Students Graduated-Tertiary Education AML - Main areas of study
Evolution of foreign nationality students enrolled in higher education in the AML
Source: Statistics Portugal, Statistical Yearbook of Lisboa Region,, Ed. 2021, Year: 2019/2020
Source: DGEEC/MEC Direção-Geral de Estatísticas da Educação e Ciência
31,6% AML in the country 91 in AML 67 Educational institutions (Lisbon) Business Science Education Art Social Sciences and Behavior Law course Engineering and Related Technical personal services Health 6387 4254 3792 3510 1620 1779 1271 1061 9000 17000 25000 20/21 19/20 18/19 17/18 16/17 15/16 14/15 13/14 12/13 11/12 10/11 09/10 08/09 07/08 06/07 05/06 22.400
* * *
in AML
37,2% AML in the
13.091 in AML 36,8
AML
(Lisbon) 31.083 in AML 36,2
AML
in the country 10.626 Teaching staff
in the country
21 The economy in figures 2022
Research and Development (R&D) Indicators R&D expenditure by Sector of Performance
1,7%
GERD as percentage of GDP (AML)
16,9%
R&D personnel (FTE) in active population (AML)
1,4%
R&D Researchers (FTE) in active population (AML)
1,4% in Portugal
11,7% in Portugal
Lisboa (AML)
Portugal
1,0% in Portugal
Source: Statistics Portugal, Statistical Yearbook of Lisboa Region, Ed. 2019,
Total R&D Expenditure
1.293,6 AML (milhares €)
2.991,9 in Portugal 43,2% AML in the country
Source: Statistics Portugal, Statistical Yearbook of Lisboa Region, Ed. 2019,
Source: Statistics Portugal, Statistical Yearbook of Lisboa Region Ed 2021, Year: 2019
R&D expenditure by source of financing
Lisboa (AML)
Portugal
Source: Statistics Portugal, Statistical Yearbook of Lisboa Region Ed 2021, Year: 2019
49% Companies 40% State High education High education 4% 4% 1% 8% Foreign 7% Foreign 38% State 48% Companies Private not-for-profit institutions Private not-for-profit institutions 2% 51% Companies 53% Companies 39% High education 41% High education 6% State Private not-for-profit institutions 4% 2% 5% State Private not-for-profit institutions
22 The economy in figures 2022 - )
- - - - ) ) -)
)
LISBON: A GROWING EXPERIMENTATION ECOSYSTEM
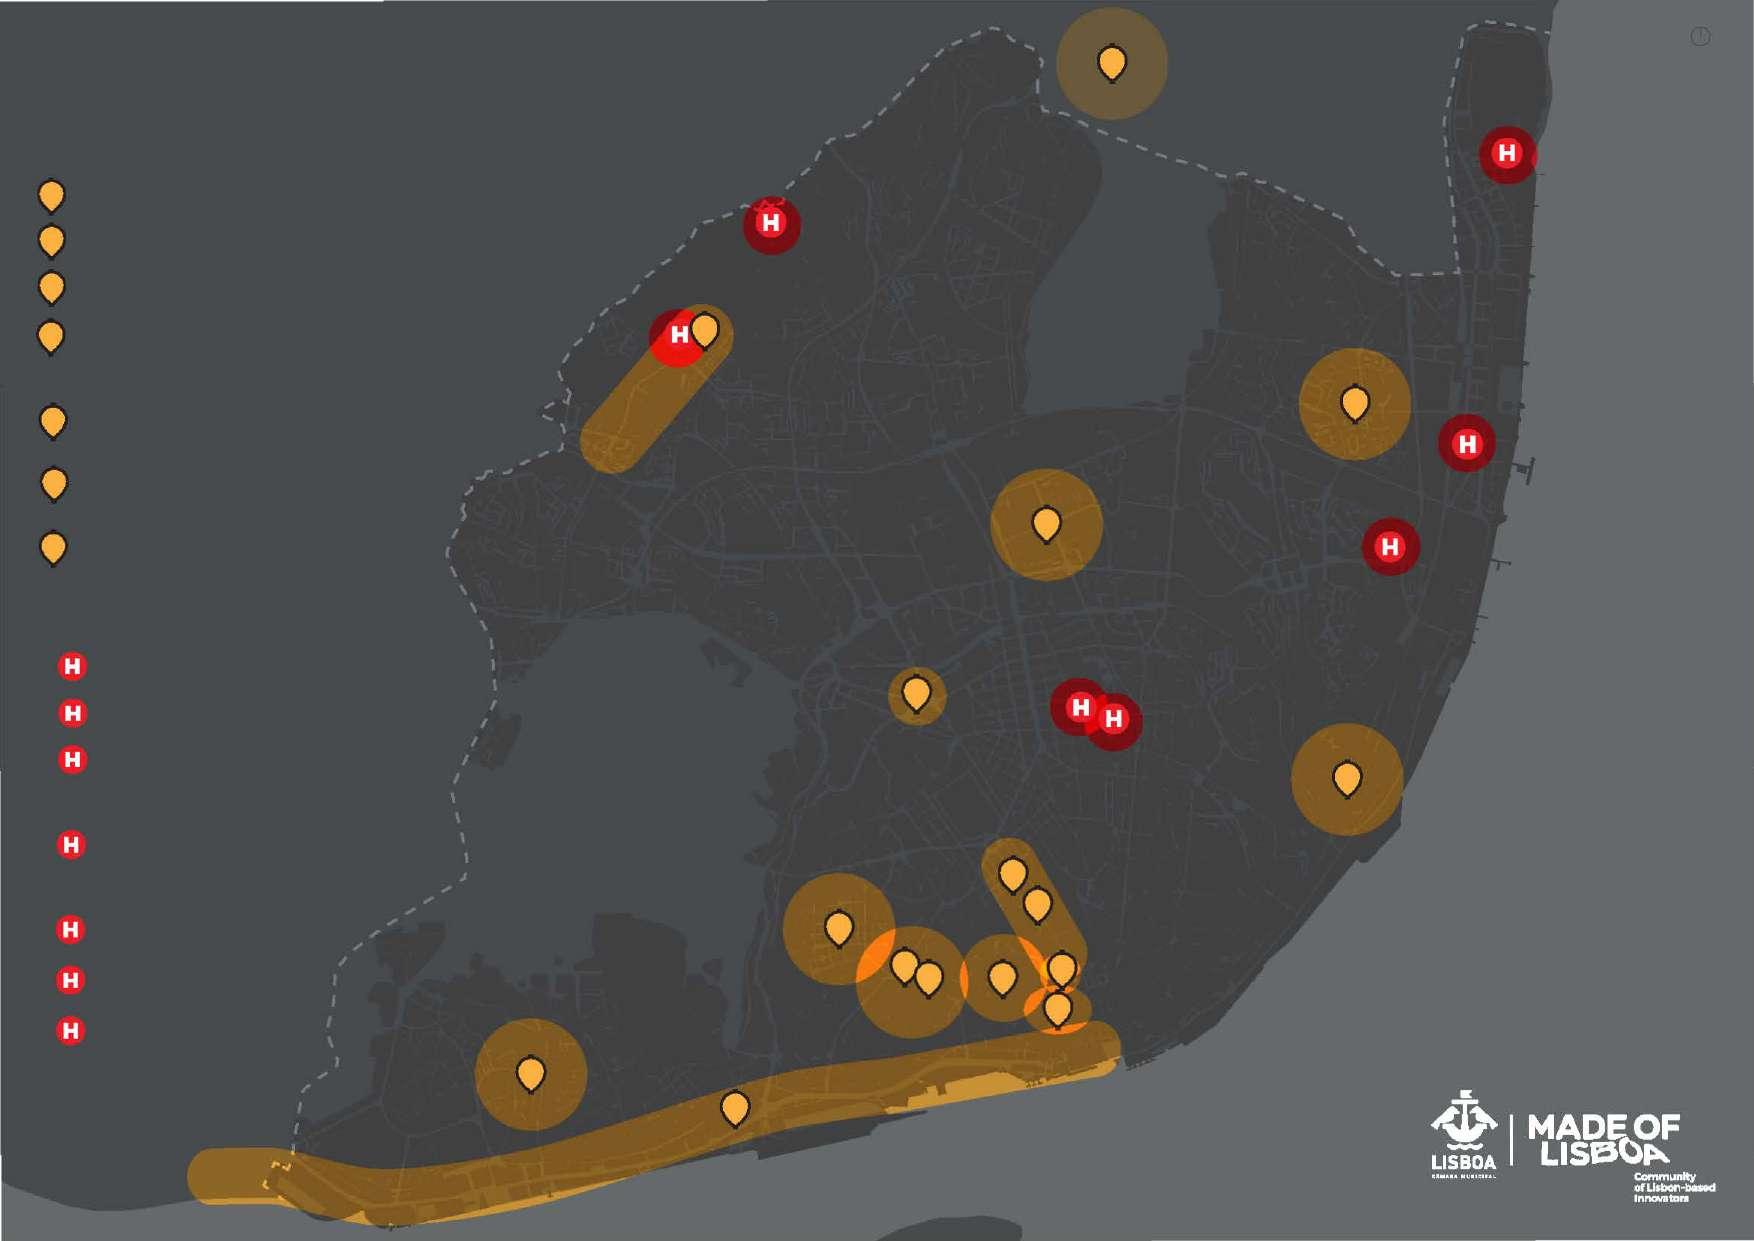
www.lisboarobotics.pt N 1 2 2 3 3 4 4 4 4 4 4 4 5 5 6 7 1 2 3 4 5 6 1 CONNECT ROBOTICS CTE CARNIDE - LISPOLIS 2 GREEN BY WEB AVENIDA DA LIBERDADE & PRAÇA DE ESPANHA 3 TRIGGER SYSTEMS JARDIM DE ESTRELA & ROSSIO 4 SOSPLUS FREGUESIAS: ESTRELA, AJUDA, CAMPO DE OURIQUE, MISERICÓRDIA, STO. ANTÓNIO,OLIVAIS, BEATO 5 KLC ALVALADE & LOURES (Card 4B o ces) 6 APPYFANS LARGO DE CAMÕES - RUA GARRET - RUA DO CARMO - ROSSIO 7 TICKEY TRAM LINE 15 (PRAÇA DA FIGUEIRA TO ALGÊS)
CARNIDES´S LANDFILL HOTSPOTS ATERRO DE BEIROLAS BEIROLAS´S LANDFILL RESERVATÓRIO
CABEÇOS
CABEÇOS
LISPOLIS
TECHNOLOGY
ISR/IST
AND
ISR/IST
TESTBED 1 2 3 4 5 6 7 7 Source: CML/DMEI 2018 1
ATERRO DE CARNIDE
DO JARDIM DO
DAS ROLAS
DAS ROLAS GARDEN'S WATER RESERVOIR COMPANHIA DE INTERVENÇÃO ESPECIAL - QUARTEL DO RSB SPECIAL INTERVENTIONS GROUP - RSB (FIRE DEPARTMENT)
- LISBON
CENTER
- ROBOTICS, BRAIN
COGNITION LAB
- ISROBONET@HOME
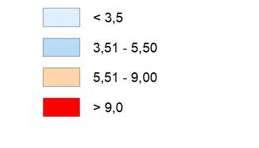
Expenditure on R&D as % of GDP in European Regions Capitals (region)
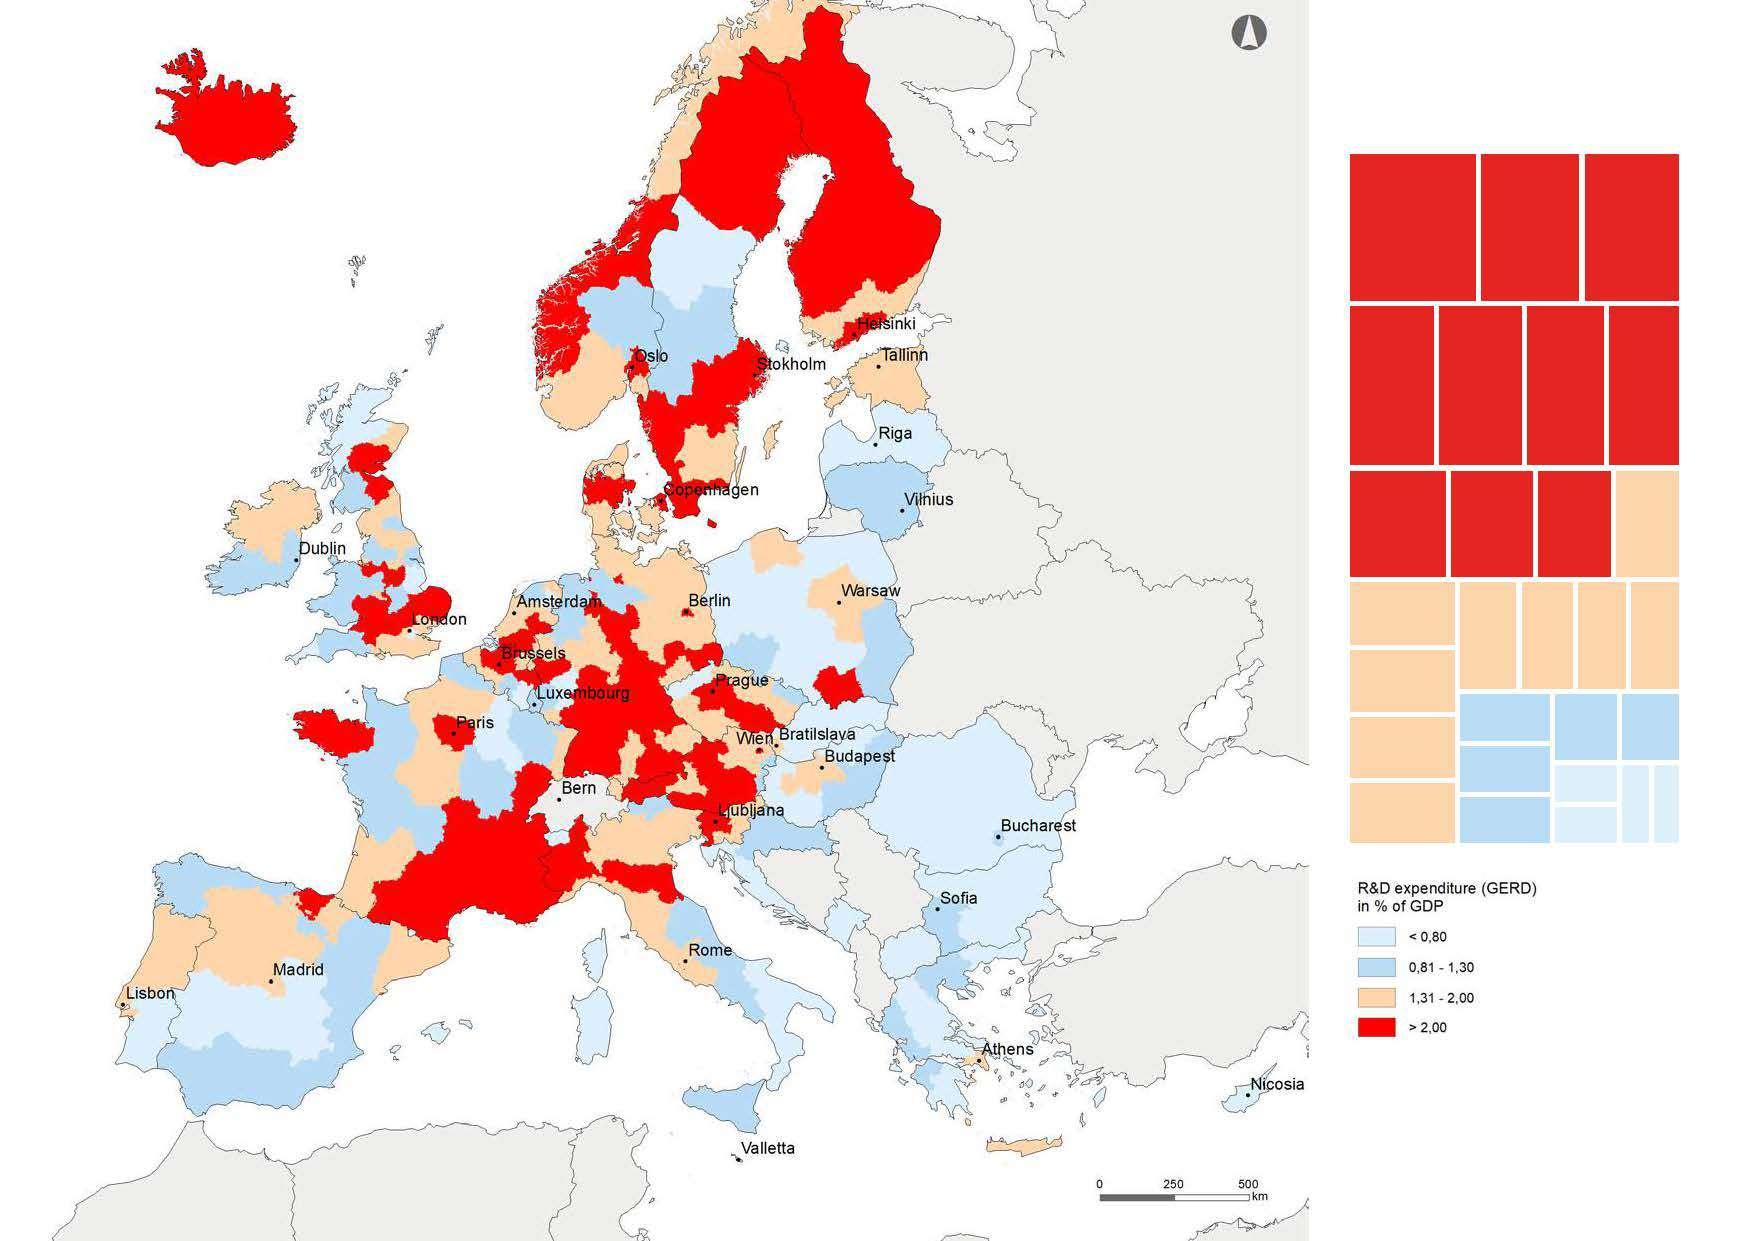
R&D expend iture (GERD) in % of GOP
Source: Statistics Portugal, Statistical Yearbook of Lisboa Region, Year: 2018; NUTS II Region Legend: value of capital - Indicator data of the local region
EN Copenhagen Stockholm Vienna Helsinki Berlin Oslo Paris Prague Ljubljana Brussels Amsterdam Budapest Rome Warsaw Madrid Lisbon Athens Bratislava Talinn Luxembourg Bucharest Sofia Dublin Vilnius London Riga Nicosia Valletta
24 {
0 (
_j
Valletta ....
< 0 ,80 D o,81 -1, 3o u 1,3 1- 2 , 00 - >2 ,00


STUDY IN A CITY THAT IS ALWAYS ON TOP! www.studyinlisbon.pt Know Lisbon by it's shops lojascomhistoria.pt 25
An economy open to the world
Capital city, with several ports in its hinterland, Lisbon is considered from long time a privileged commercial platform for different continents. With easy access to 500 million European consumers, it has a modern network of highways, railroads and other transport and logistic infrastructures.
Lisbon has an excellent geostrategic location, with strong business and economic connections with the seven Portuguese speaking countries, that makes this city the ideal place for companies who want to export or invest in those markets.
The importance of international trade has been growing in the region, originating 30% of national exports, and the destination of more than half of national imports. In the last 10 years Lisbon experienced a 90% growth of the exports.
Lisbon is the destination of more than 2,4 million tourists per year, and more than 55% of them originated from foreign markets, in particular from Spain, France, Brazil, Germany, United Kingdom and Ireland and United States. Lisbon is often the choice for international congresses, as demonstrated by the main international rankings, being a capital full of dynamism and creative events all year long.
Lisbon positioning in international rankings is becoming more relevant each year, proving that Lisbon is seen and felt as an Atlantic city with unique characteristics to study, live, work and invest.
4.975
1.129 National Way
2.230
Annual V. -3,2%
Source: INPI National Institute of Industrial Property (2021)
86.867 Flights
9.262 Passengers AL (thousands) 89 Cargo AL (thousands ton.)
Port of Lisbon
1.661 Ships
10.845 Passengers Portugal (thousands)
Source: ANA, Aeroporto Nacional, SA e Porto de Lisbon, Year 2020
Source: INPI National Institute of Industrial Property (2021)
National Way
National Way
919
24.022
Airport of Lisbon (AL)
European Way European patent validations in PT 286 European Way PT origin
European Way PT origin
242 International way PT origin 140 International way PT origin -18,2% Annual V. 11,7% Annual V. -36% Annual V. -7,9% Annual V.
Annual V.
9.023 Cargo Portugal (thousands ton.) Annual V.
798 European Way PT origin
14,9%
21,8%
Annual V.
Annual V.
Annual V.
11,3%
17,6%
-58,3%
Innovation Transports National Inventions National Brands National design 26 The economy in figures 2022
163 Patents of which
International Trade
Economic indicators
Export
5.750 Lisbon (millons €)
Import
14.666 Lisbon (millions €)
16.130 AML (millions €) 33.140 AML (millions €)
30% of AML in the country total 49% of AML in the country total
Source: Statistics Portugal, Statistical Yearbook of Lisboa Region, Ed. 2021, Year 2020
other categories
Source: Statistics Portugal, Statistical Yearbook of Lisboa Region, Ed. 2021, Year 2020
The economy in figures 2022
Export (AML) Import (AML) 16.130 (millions €) 33.141 (millions €) 9,4% 12,7% 19,2% 15,6% 15,5% 17,1% 19,8% 23,5% 13,4% 13,4% 29,2% 11%
Goods not specified in
Consumer Goods not specified in other categories
Transport equipment and accessories
Machinery and other capital goods (except transport equipment) and its accessories
Fuels and lubricants Industrial Supplies not specified in other categories Food Products and beverages
27
Principals zonas - hotelaria - Alfama e Caste lo (Ce ntro Hist6rico 1) - Baixa 1 Chiado (Centro Hist6rico 2) Eixo Centrale Avenidas Novas Eixo Liberdade 1 Castilho
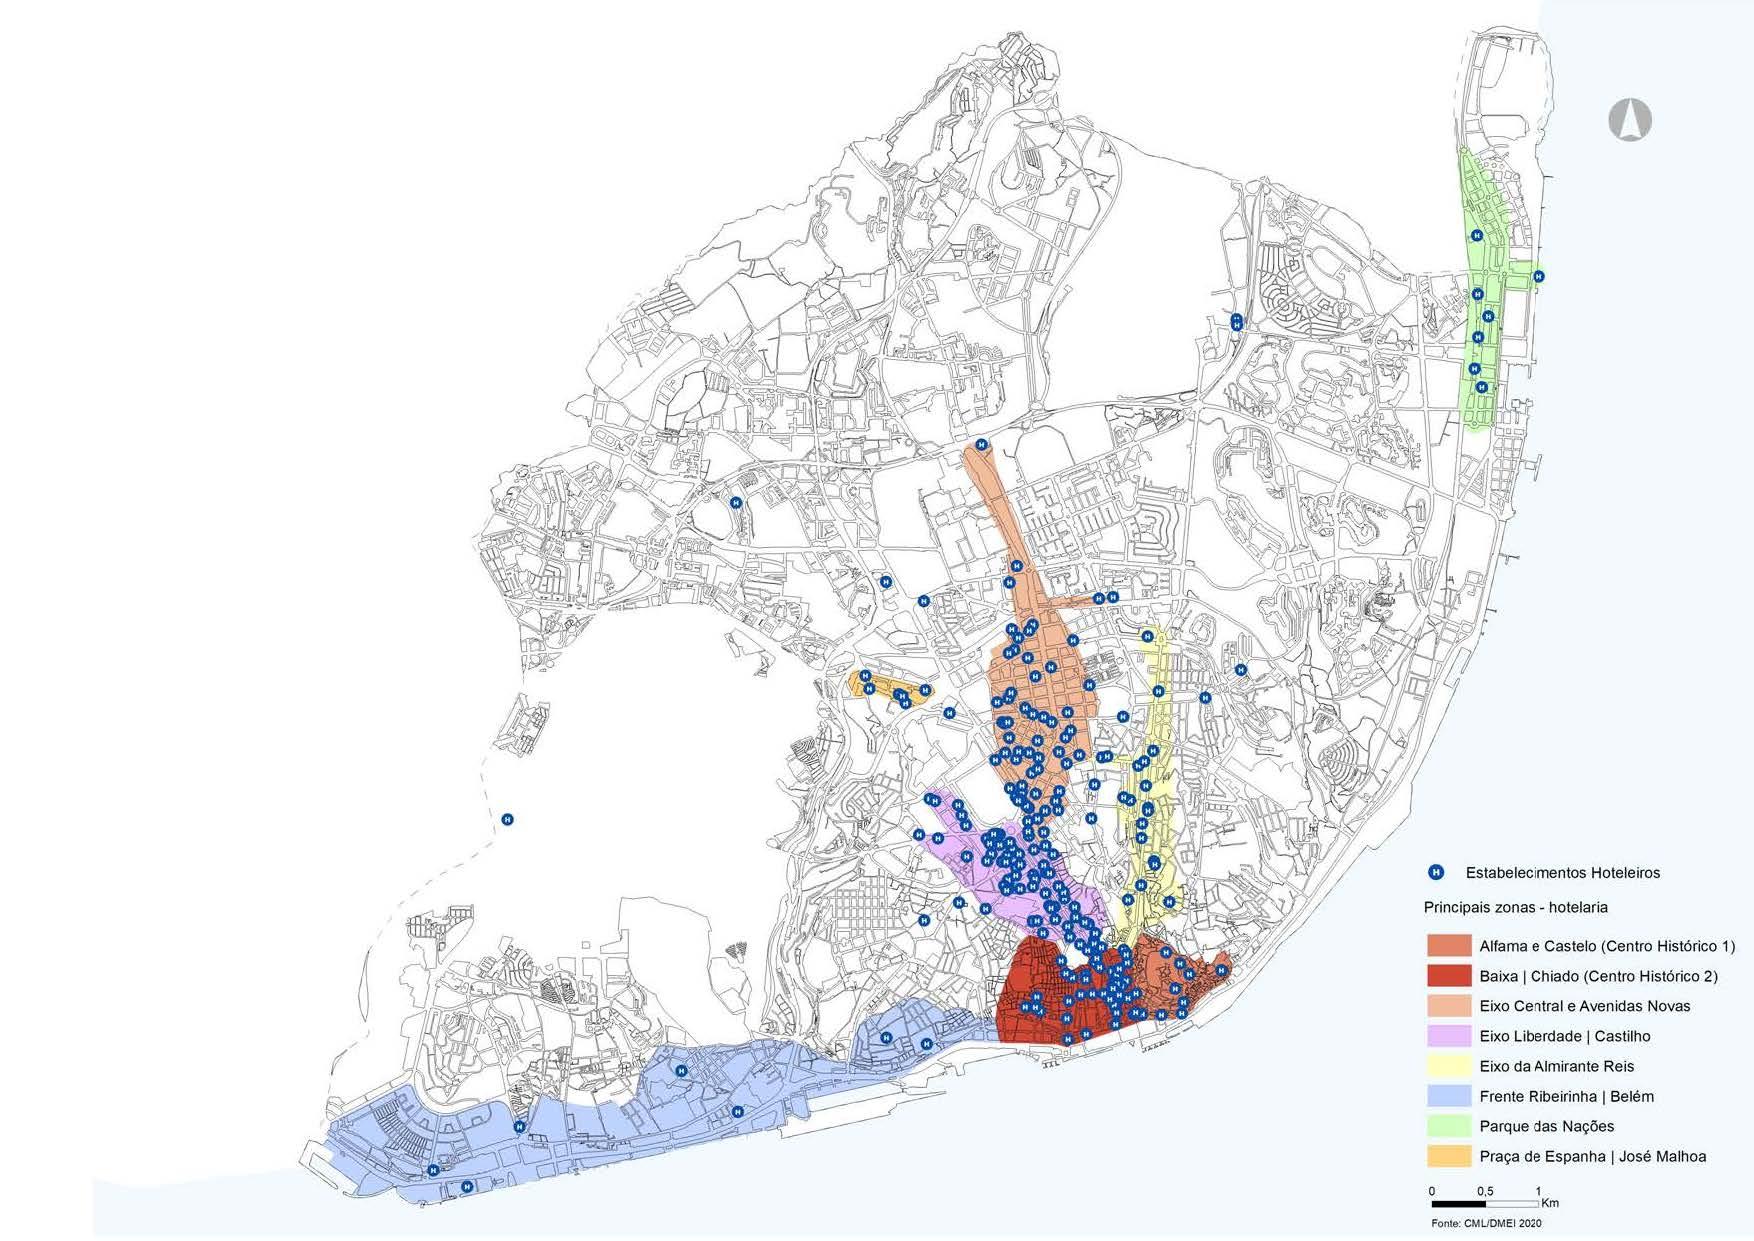
HOTEL
IN LISBON
2018 0
ESTABLISHMENTS
Fonte: CML/DMEI
0 Estabelec imentos Hoteleiros
Eixo da Alm irante Reis Frente Ribeirinha 1Belem
0 0,5 1 - = Km Fonte CMLIOMEI 2020
Parque das Nayoes Praya de Espanha 1 Jose Malhoa
Tourism
Overnight stays and guests in hotel establishments
Guests
1.519 Lisbon (thousands)
Overnight stays
3.481 Lisbon (thousands)
2.433 AML (thousands)
23,0% of AML in the country total
5.254 AML (thousands)
20,0% of AML in the country total
Source: Statistics Portugal, Statistical Yearbook of Lisboa Region, Ed. 2021, Ano: 2019
Evolution of the number of overnight stays in Region of Lisbon
Source: Statistics Portugal, Statistical Yearbook of Lisboa Region, Ed. 2021, Ano: 2020
5.254.354
5000000 10000000 15000000 20000000 2020 2019 2018 2017 2016 2015 2014
29 The economy in figures 2022


A economia em números 2020 anaana.pt www.investlisboa.com Cool for Living LISBOA Hot for Business Lisboa Made Easy
