
27 minute read
3 Main Menu Reference


3.1 Main Menu
The Main Menu has four sections. Select: Inspection to modify inspection settings Imager to run the Auto Exposure routine and to make adjustments to functions like exposure, gain, and strobe. System to select the Sensor Type and to manage the device. Logs to configure and view System and Inspection Logs.
Inspection Area
Sensor Type selection determines first menu item under inspection
Blemish
Match
Sort
Motion *
* Visible when Motion = Enabled and Sensor Type = Area or Blemish
Properties
** Visible when Sensor Type = Area or Blemish *** Visible when Sensor Type = Match or Sort
Stored Inspections
ROI Type Intensity Range Area Range Pass Count
ROI Type Intensity Range
Edge Length Range
Pass Count
ROI Type Percent Match Rotation Range Pass Count
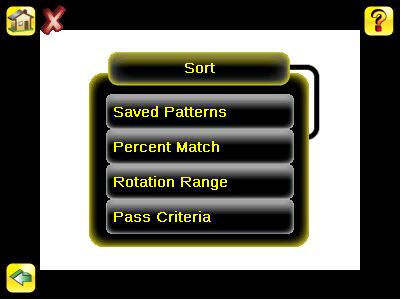
Stored Patterns Percent Match Rotation Range Pass Criteria
Number of Edges Sensitivity Rotation
Sensor Type Inspection Name Inspection ID Motion **
Timeout ***
Select Add New Startup Delete
Set Name / ID
Logs Inspection Logs System Logs
Communication Logs
Locked Sensor Menus
Industrial Ethernet
Command Channel
Data Export Image Export
Locked Inspection Logs System Logs
Communication Logs
Unlock Sensor System
Imager
View Logs Setup Sensor Mode
Sensor Configuration
Sensor Information Lock Sensor
Communications
Discrete I/O
Display Settings
Reboot Sensor
Firmware Update Language
Auto Exposure Exposure Gain
Trigger Focus Strobe
FOV Live Mode Demo Mode
Save to USB Load from USB Reset to Defaults
Ethernet I/O Serial I/O
Industrial Ethernet
Command Channel
Data Export
Image Export
Input Polarity Input Pullup Output Type Output 1 Output 2 Output 3
Fail Hold Time LCD Timeout Touch Calibration Advanced
External Internal
Maximize FOV Modify FOV Connection Status View Logs
Connection
Delimiters
Connection Data to Export Output Format Advanced
Connection Image Type Advanced
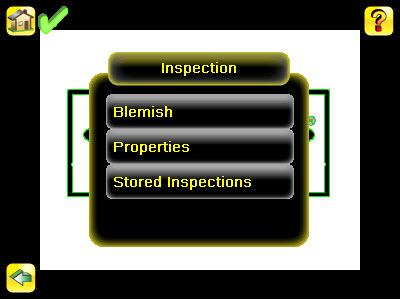
3.2 Inspection Menu
Inspection Menu Main Menu > Inspection
The Inspection menu is where you adjust settings for the inspection. The settings available are dependent on the Sensor Type. It is also where stored inspections can be managed.
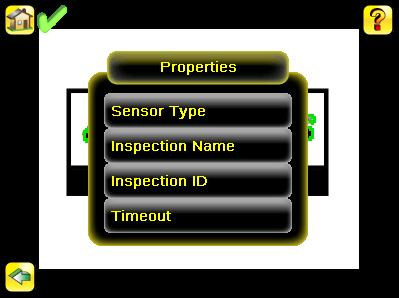
Properties Menu Main Menu > Inspection > Properties
The Properties menu is used to select a Sensor Type and specify an Inspection Name. Additionally, if the Sensor Type is Match or Sort, an option to define a timeout for the inspection.
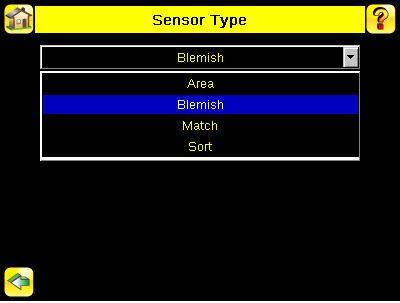
Sensor Type Screen Main Menu > Inspection > Properties > Sensor Type
The following Sensor Types are available: An Area Sensor Type that detects if a particular feature (or features) is present A Blemish Sensor Type that can be used find flaws on a part (for example, scratches on a disc). It can also be used to make sure that a feature exists on a part. A Match Sensor Type that determines whether a part or label matches some reference part or label A Sort Sensor Type that is used to identify and sort up to 10 different patterns per inspection.
Area Menu Main Menu > Inspection > Area
When configured as an Area sensor, the sensor is used to ensure that one or more features of interest are present on a part. To configure as an Area sensor, set four parameters: ROI Type (Rectangle, Elliptical, or Circle) and size Intensity Range (range of gray scale values) of a feature of interest Area Range, or size, of a feature of interest Pass Count To see a working example of the sensor configured as an Area sensor, see Demo Mode.

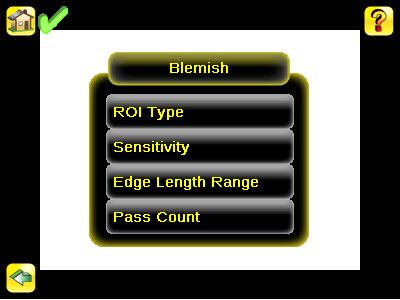
Blemish Menu Main Menu > Inspection > Blemish
When configured as a Blemish sensor, the sensor can be used find flaws on a part (for example, scratches on a disc). It can also be used to make sure that a feature exists on a part. Although this is more commonly an application for a sensor configured as an Area sensor, a Blemish sensor may be a better option to find a feature when dealling with variable materials or uneven lighting. To configure as a Blemish sensor, select the ROI type, and set the Sensitivity, Size Filter, and Pass Count.
Match Menu Main Menu > Inspection > Match
When the sensor is configured as a Match sensor, set the ROI Type and size, as well as the Percent Match, Rotation Range, and Pass Count for the inspection. To see a working example of the sensor configured as a Match sensor, see Demo Mode.

Sort Tool Menu Options Main Menu > Inspection > Sort
The Sort tool is used to identify and sort up to 10 stored patterns. The menu items in the Sort tool provide for managing stored patterns and configuring Sort tool inspection parameters.
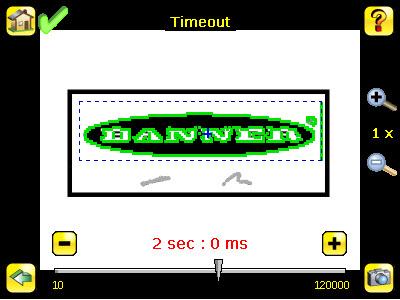
Timeout Main Menu > Inspection > Properties > Timeout
When the sensor type is set as Match or Sort, this screen provides for adjusting the maximum time the inspection is allowed to execute. A timeout error is reported in the case inspection runs out of time. If this value is set too high, the sensor can miss triggers while trying to detect a bad pattern.
Stored Inspections Menu Main Menu > Inspection > Stored Inspections
Stored Inspections is used to manage stored inspections. Management of stored inspections includes adding, deleting, and specifying which inspection should be defined as the Startup inspection.

Add New Inspection Screen Main Menu > Inspection > Stored Inspections > Add New
This screen is used to add a new inspection. The sensor can store up to 30 inspections. When you add a new one, it will begin running. When adding a new inspection, the Sensor Type and inspection name will be set.

Select Running Inspection Screen Main Menu > Inspection > Stored Inspections > Select
This screen is used to select a new running inspection. Select the name of the inspection to start, and click the Start Running button that displays.

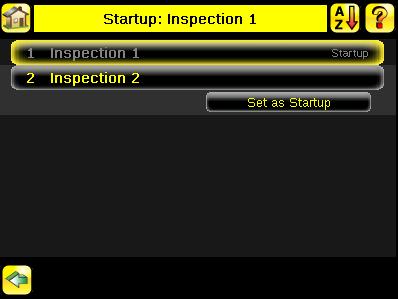
Select Startup Inspection Screen Main Menu > Inspection > Stored Inspections > Startup
This screen is used to select the inspection to use as the startup inspection; that is, the inspection the sensor will automatically start after power up. Click one the name of the inspection to select as the Startup inspection then click on the Set as Startup button that displays.
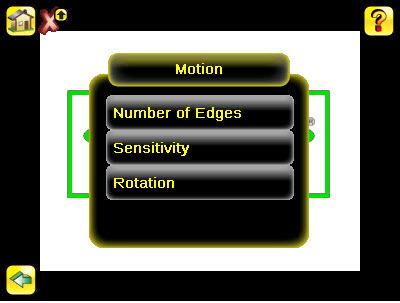
Motion Menu Main Menu > Inspection > Motion
Enable Motion when the part is expected to move or rotate. Motion settings also involve selecting the number of edges to locate, adjusting sensitivity, and selecting whether or not rotation is enabled. These settings appear on the Inspection Menu after Motion is set to 'Enabled'
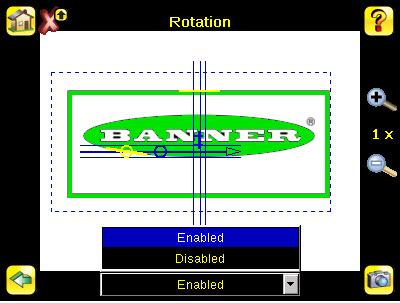
Motion Rotation Screen Main Menu > Inspection > Motion > Rotation
Rotation can be Enabled or Disabled. Select Enabled if the part can be expected to rotate during the inspection.
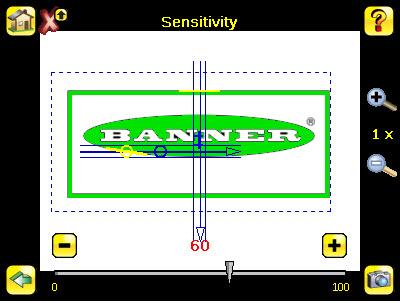
Motion Sensitivity Screen Main Menu > Inspection > Motion > Sensitivity
Sensitivity is used to fine-tune how sensitive the sensor is to finding a reference edge. The Sensitivity value helps account for light variations that might affect how well the sensor detects edges on inspected parts. The Sensitivity scale is from 0 to 100 where 0 means least sensitive and 100 means most sensitive. If set near 0, the sensor will only find very sharp edges with strong contrast. If set near 100, the sensor will find very dim or blurry edges, and may be unstable.
Number Of Edges Screen Main Menu > Inspection > Motion > Number of Edges
Use the radio buttons to select One Edge or Two Edges. If One Edge is selected, motion is tracked in one direction; if Two Edges is selected, motion can be tracked horizontally and vertically.

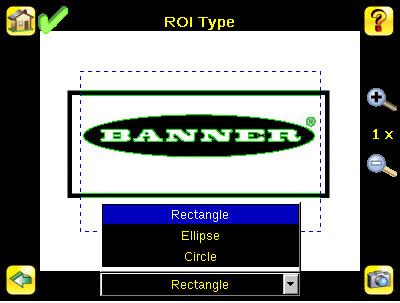
ROI Type Screen
A Region of Interest (ROI) is a user-defined area to be analyzed in the sensor's field of view. An ROI can be rectangular, elliptical, or circular, and resized as appropriate for the application.
3.3 Imager Menu
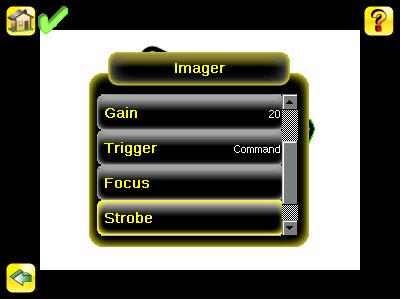
Imager Menu Main Menu > Imager
The Imager menu is used to access the Auto Exposure routine, manually adjust Exposure and Gain, set Trigger and Strobe options as well as the size of the field of view (FOV).
Auto Exposure Screen Main Menu > Imager > Auto Exposure
Auto Exposure optimizes the exposure time and gain for the current inspection.
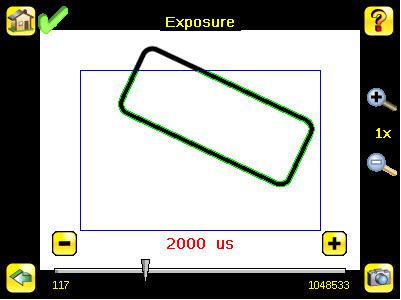
Exposure Screen
Main Menu > Imager > Exposure
Exposure is the amount of time the sensor allows light to energize the imager. Increasing the exposure time by moving the slider to the right allows more light to energize the imager, which brightens the image.
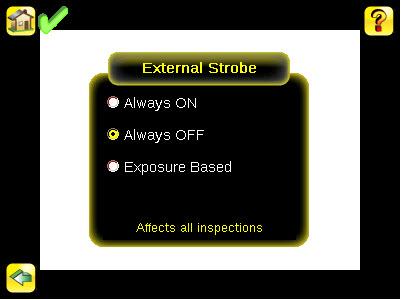
External Strobe Screen Main Menu > Imager > Strobe > External
The External Strobe is a 5V output that can be used for an external light. Setting options are Always ON, Always OFF, or Exposure Based. If Exposure Based is selected, then the external light is on during the time the sensor is capturing an image.
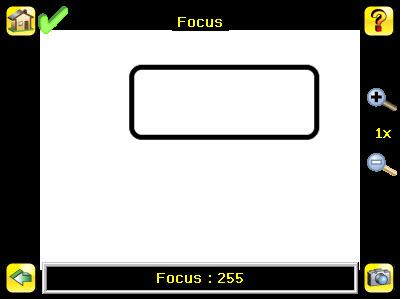
Focus Screen Main Menu > Imager > Focus
The Focus Number displayed at the bottom of this screen is used to fine-tune image focus. Loosen the lock on the lens cover, turn the focus ring on the sensor until the Focus Number peaks (or the image appears sharp), then lock the focus ring. Note that, for the Focus Number to work, the sensor must be triggering and the images must be similar over time.
FOV Menu Main Menu > Imager > FOV
The field of view (FOV) is the area that the sensor can see at the working distance. The working distance is the distance from the sensor's lens cover to the part being inspected. By default, the field of view (FOV) is the entire sensor display. The FOV can be reduced in order to speed up the processing time of an inspection, or to decrease background noise.

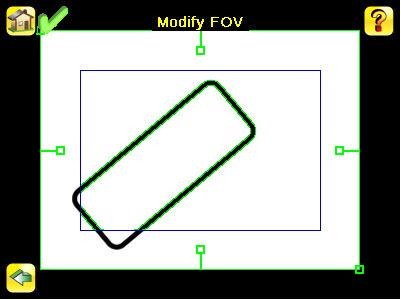
Modify FOV Screen Main Menu > Imager > FOV > Modify
The field of view (FOV) is the area that the sensor can see at the working distance. The working distance is the distance from the sensor's lens cover to the part being inspected. By default, the field of view (FOV) is the entire sensor display. The FOV can be reduced in order to speed up the processing time of an inspection, or to decrease background noise.
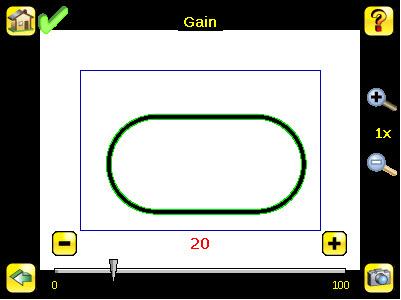
Gain Screen Main Menu > Imager > Gain
Gain is an electronic boost to the image signal. Increasing Gain by using the right arrow key or moving the slider to the right increases image brightness without increasing exposure time. Note that Gain brightens both the light pixels and dark pixels and may reduce the image quality.
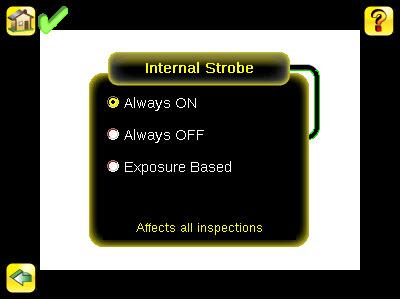
Internal Strobe Screen Main Menu > Imager > Strobe > Internal
The Internal Strobe setting configures the operation of the integrated ring light. Setting options are Always ON, Always OFF, or Exposure Based. If Exposure Based is selected, then the ring light is on during the time the sensor is capturing an image.
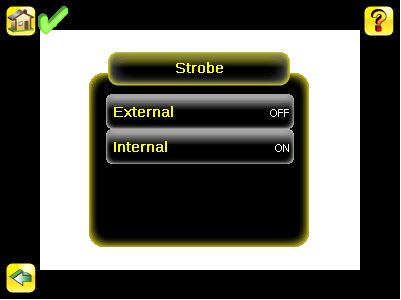
Strobe Menu Main Menu > Imager > Strobe
The Internal Strobe configures the operation of the integrated ring light. The External Strobe configures the operation of an external light.
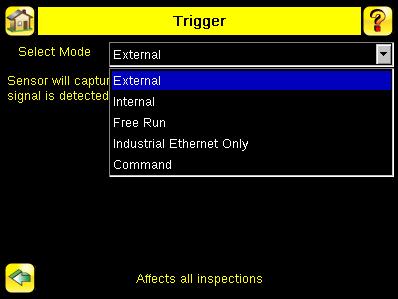
Trigger Screen Main Menu > Imager > Trigger
A Trigger is a signal that makes the sensor capture an image and inspect it. Use the radio buttons to select either External Trigger, Internal Trigger, Free Run, or Command. If Internal Trigger is selected, triggers are based on timed intervals, and you need to select a trigger interval between 10 and 10000 milliseconds. Note: If the interval is less than
the inspection time, then missed triggers will occur. If External Trigger is selected, inspections are triggered in response to an electrical signal on the Trigger input line. If Free Run is selected, the sensor automatically runs continuous inspections. If Command is selected, the command channel is used to trigger the sensor from a remote device. When Industrial Ethernet Only is selected, trigger commands from the Industrial Ethernet communications channel only will be accepted.
3.4 System Menu
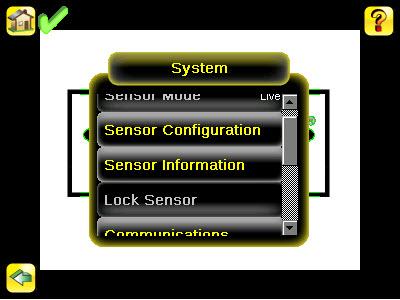
System Menu Main Menu > System
The System menu provides for selecting Sensor Mode, updating sensor firmware, backing up and restoring sensor Configuration, and other general system-level operations.
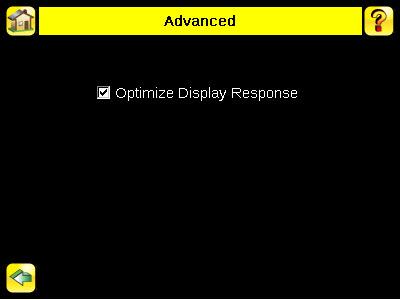
Advanced Display Setting Screen Main Menu > System > Display Settings > Advanced
Enabling Optimize Display Response helps to make the display more responsive when the sensor is busy (either inspection times are long and/or no idle time exists between inspections). Disable this feature if Missed Triggers occur due to touchscreen presses. With this setting disabled, the display may become sluggish when the sensor is busy.
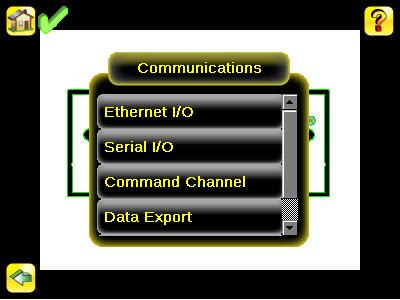
Communications Menu Main Menu > System > Communications
The Communications menu is used to configure iVu communications. This includes: • configuring Ethernet and/or Serial I/O ports • configuring up to three communications channels (one for data export, another for image export, and another as a command channel, which is for bi-drectional communications)
NOTE: The iVu Plus supports up to three communications channels on a sensor, but only one of the channels can be configured for Serial I/O. Additionally, Serial I/O can only be configured for either Data Export or Command Channel. Image Export is only available for Ethernet.
Data Export Channel Menu Main Menu > System > Communications > Data Export
When the Data Export Channel is enabled, the sensor will transmit selected inspection data when triggered.
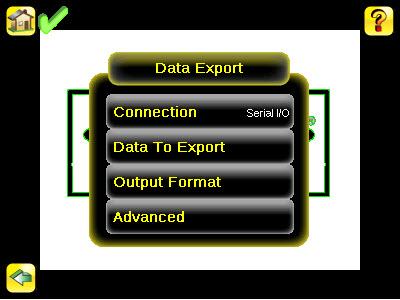
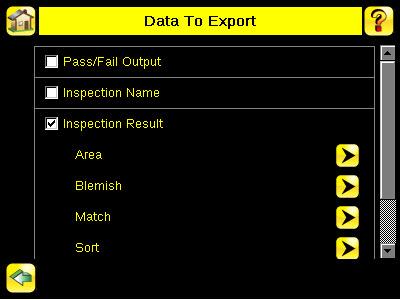
Data Export To Export Screen Main Menu > System > Communications > Data Export > Data To Export
The Data To Export screen is used to determine the information included in a data export. Data will output in the order displayed on the screen.
Demo Mode Screen Main Menu > System > Sensor Mode > Sensor Mode
The iVu Series sensor is operating in Demo Mode. In this mode, inspections are run on stored images and inspection parameters. This mode demonstrates how the sensor is set up without having to worry about focus, lighting, or triggers. In this mode, you can learn how to make adjustments working with the four sensor types while observing how the adjustments affect the inspections. This mode is just for demonstration, and none of the changes you make will be saved. To exit Demo Mode, select Exit Demo Mode. You may exit this mode later, by selecting Main Menu - System - Sensor Mode and select Live. When you exit Demo Mode, the sensor reboots into its normal operating mode. Note: You may return to Demo Mode any time by going to Main Menu - System - Sensor Mode and selecting Demo.
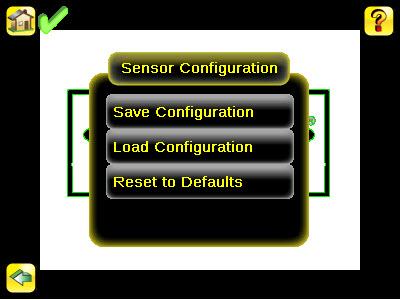
Sensor Configuration Menu Main Menu > System > Sensor Configuration
The Sensor Configuration menu provides for: Saving sensor Configuration to the USB drive Restoring sensor Configuration from the USB drive Resetting the sensor to defaults
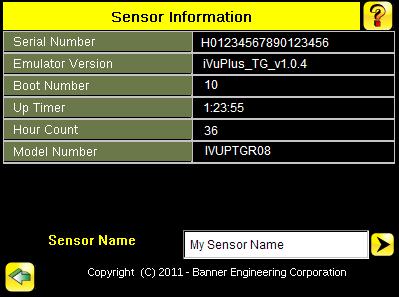
Sensor Information Screen Main Menu > System > Stored Information
The Sensor Information screen displays information like the sensor Serial Number, Firmware Version and Model Number. Note that there is a field for the Sensor Name of the sensor. You may set the sensor name in English on the device. To set the sensor in any other language, please use the Emulator software. The 'Up Timer' represents the time elapsed since last boot of the sensor. The 'Hour Counter' represents the total hours of operation in the sensor's lifetime.
Lock Sensor Menu Main Menu > System > Lock Sensor
The Lock Device menu option allows you to lock the sensor to prevent accidental changes to the setup and configuration of the sensor.
Save to USB Main Menu > System > Sensor Configuration > Save to USB
The Save to USB screen provides for saving sensor Configuration to a USB flash drive. The saved configuration information can be used as a backup or as a way to clone configuration information for other sensors.
Load from USB Main Menu > System > Sensor Configuration > Load from USB
The Load from USB screen provides for restoring sensor Configuration from a USB drive.
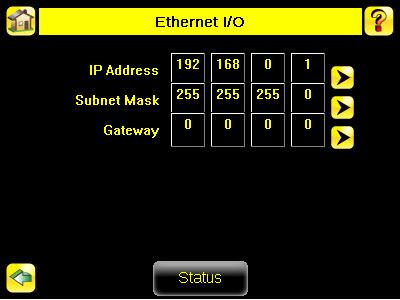
Ethernet I/O Screen Main Menu > System > Communications > Ethernet I/O
The sensor's Ethernet communications can be used to send data out the Ethernet port as part of an inspection, and remote devices can communicate with the sensor. The Ethernet I/O screen is where IP Address, Subnet Mask, and Gateway settings are configured. Use the expand arrow next to each field to display a software keypad to enter values for each field. Click the Stataus button at the bottom of the screen to verify communications as you connect to remote devices.
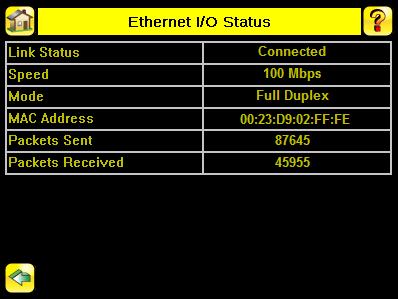
Ethernet I/O Status Main Menu > System > Communications > Ethernet I/O > Status
The Ethernet I/O Status screen can be used to verify that the Ethernet wiring has been correctly set up. In addition to determining if link has been established, incoming and outgoing traffic can be monitored.
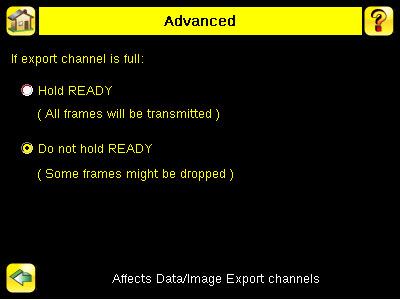
Data Export Advanced Screen Main Menu > System > Communications > Data Export > Advanced
During the Data and Image export operation, the sensor's output channels might become full. This can occur if the sensor is producing export data (frames) faster than the data can be exported from the device (due to bandwidth limitations) or faster than the client is reading the channel export data. This setting affects how the sensor will behave in this situation. Select 'Hold READY' to ensure that all frames are transmitted. In this case, the READY signal will remain inactive (sensor is busy) until the new frame has been added to the channel for transmission. Triggers might be missed during this time. Select 'Do not hold READY' to cause the sensor to discard the new frame if the channel is full and thus
activate the READY signal immediately after the current inspection is complete. In this case, the discarded frames will not be transmitted. NOTE: This setting affects both the Data Export Channel and Image Export Channel.
Fail Hold Time Screen Main Menu > System > Display Settings > Fail Hold Time
The Fail Hold Time determines how long a failed image is displayed on the LCD so that you can see what failed. The sensor will continue to process any triggers and the inspection will continue normally. This time delay is just for the screen. You can set this parameter using the slider at the bottom of the screen.
Firmware Update Screen Main Menu > System > Firmware Update
The Firmware Update screen is used to load the latest sensor firmware. The Firmware Update screen lists the firmware versions it finds in the BANNER\FIRMWARE folder on the USB drive. When you receive a firmware update from Banner Engineering, be sure to put it in the BANNER\FIRMWARE folder on the USB drive.

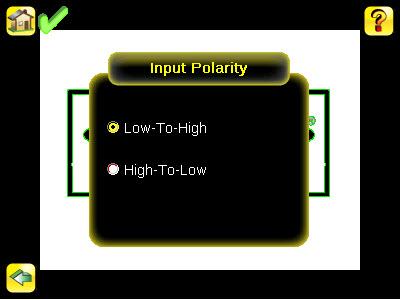
Input Polarity Main Menu > System > Discrete I/O > Input Polarity
The iVu has two input signals - —Trigger and Remote Teach. Both these signals are edge sensitive. The operation of these signals is dependent on the Input Polarity setting. • Low To High — The Trigger and Remote Teach are detected on a low to high transition of the signal. High • To Low — The Trigger and Remote Teach are detected on a high to low transition of the signal.
Input Pullup Screen Main Menu > System > Discrete I/O > Input Pullup
By default, the Input Pullup is disabled. If the device used to trigger and remote teach the iVu sensor is a Sinking device (NPN) then you will only need to enable Input Pullup here if that device does not have its own pullup resistor. Otherwise, this should be disabled.

I/O Type Screen
Main Menu > System > Discrete I/O > Output Type
Select NPN to configure the sensor's outputs to sink current. Select PNP to configure the sensor's output for source current.
LCD Timeout Screen Main Menu > System > Display Settings > LCD Timeout
The LCD screen dims after a user-selectable period when it is not being used. Use the arrow keys or slide the bar at the bottom of the screen to set the LCD screen time out.
Lock Sensor Main Menu > System > Lock Sensor
This option provides for locking the sensor to prevent accidental modification of settings. When locked, the sensor only provides access to pass/fail statistics, as well as the ability to view logs and to save them to a USB device. A lock icon in the upper left corner of the sensor display indicates that the sensor is locked. Note that the sensor can be locked with or without a password. If a password is not used, unlock the sensor by clicking on the Unlock Device menu. When a password is used, it must be 4 digits entered using the software keypad. If the password is lost, use the Password Reset Utility software provided in the CD to obtain a Reset Key.
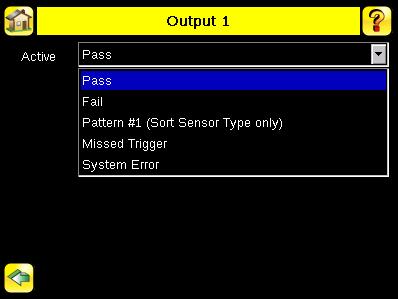
Output1 Screen Main Menu > System > Discrete I/O > Output1
Output-1 can be configured for Pass, Fail, Sort Pattern #1, Missed Trigger, or System Error. The default setting is Pass and Latched for this output. For Latched, the signal is active until the results of an inspection cause a change in the signal output. If Pulse is selected, the default Pulse width is 50 ms. • A Missed Trigger condition occurs when a trigger is received while sensor is busy inspecting the pervious image. This output signal will be set to active state. This signal will be reset up on resetting the 'History' on the statistics page. • A System Error condition occurs when a fatal error is detected on the sensor. This output signal will be set to active state. This signal can be reset upon resetting the 'History' on the statistics page, or executing a 'ClearSystemError' command through command channel.
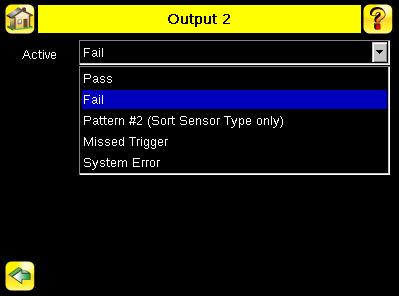
Output2 Screen Main Menu > System > Discrete I/O > Output2
Output-2 can be configured for Pass, Fail, or Sort Pattern #2 The default setting is Pass and Latched for this output. For Latched, the signal is active until the results of an inspection cause a change in the signal output. If Pulse is selected, the default Pulse width is 50 ms.
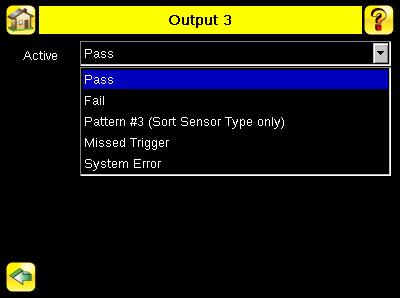
Output3 Screen Main Menu > System > Discrete I/O > Output3
Output-3 can be configured for Pass, Fail, or Sort Pattern #3. The default setting is Pass and Latched for this output. For Latched, the signal is active until the results of an inspection cause a change in the signal output. If Pulse is selected, the default Pulse width is 50 ms.
Port Errors Main Menu > System > Port Status
The Port Errors screen can help to debug communications channel issues. Parity, Break, and Framing indicate mismatched port settings or, in the case of Break, incorrect cabling.
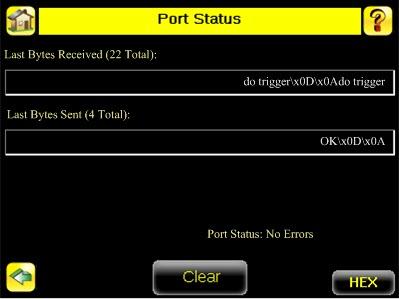
Port Status Main Menu > System > Communications > Serial I/O > Status
The Port Status screen can be used to ensure data is entering and exiting the sensor. This can be useful for debugging issues such as improper wiring, mismatched baud rates, or other serial I/O issues.
Sensor Mode Screen Main Menu > System > Sensor Mode
This menu option provides for toggling between Live and Demo modes. • Live Mode is the normal operating mode where the sensor reads and verifies barcodes • Demo Mode, runs demo inspections on stored images. This mode demonstrates how the sensor is set up without having to worry about focus, lighting, or triggers. In this mode, you can learn how to make adjustments while observing how the adjustments affect the inspections. Note that this mode is just for demonstration, and none of the changes you make will be saved. To exit Demo Mode, select Live.
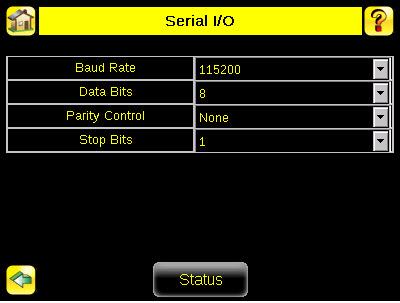
Serial I/O Settings Main Menu > System > Communications > Serial I/O
The Serial I/O menus are used to enable serial output and adjust the serial Port Settings if necessary, and to define the type of data to export as well as its format.
Touchscreen Calibration Screen Main Menu > System > Display Settings > Touch Calibration
Touchscreen Calibration may be necessary if the software does not correctly respond when an icon on the screen is pressed. The calibration routine aligns the touch screen's coordinates to the display behind it. Be sure to follow the prompts on the screen when executing the Touchscreen Calibration function.
Unlock Device Main Menu > System > Unlock Device
Once you set up the sensor, you can lock it to prevent someone modifying parameters. Locking the sensor turns it into a read-only device. Users can still monitor pass/fail statistics, as well as access logs and save logs to a USB device. When the sensor is locked, a lock appears in the upper left corner of the LCD. You can lock the sensor with or without a password. Passwords are 4 digits in any combination, and you can reset the password at any time. If you forget the password, the system will display a device ID, which you need to use with the Password Reset Utility software provided in the CD to obtain a Reset Key. If you don't use a password, you can unlock by clicking on the Unlock Password menu.
3.5 Logs Menu
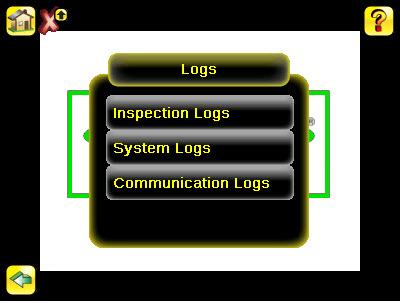
Logs Menu Main Menu > Logs
The Logs menu is used to set up or view Inspection, System, and Communications Logs.
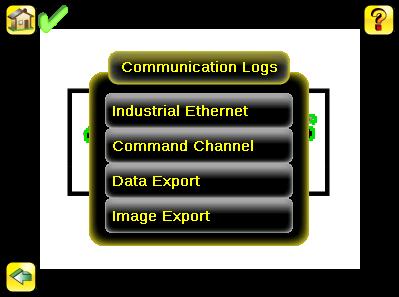
Communication Logs Menu Main Menu > Logs > Communication Logs
There are logs for each of the communications channels: -Industrial Ethernet -Command Channel -Data Export -Image Export
Industrial Ethernet Log Main Menu > Logs > Communication Logs > Industrial Ethernet Log
The iVuPlus device can be controlled or monitored over Industrial Ethernet using Ethernet/IP, Modbus/TCP or PCCC protocols. This document will help you to set up the iVu Plus in the desired configuration and provide you with information you will need to connect to the master device (PLC, HMI, etc.).
Command Channel Log Main Menu > Logs > Communication Logs > Command Channel
The Communication Log will log the most recent Command communication activity. Each entry in the log includes a status indicator for the operation. A green indicator displays when the channel is enabled or disabled -- light-green when the channel is enabled, dark-green when the port is disabled. An up-arrow displays for incoming requests from a remote device. A down-arrow displays for outgoing responses from the iVu sensor. The up- and down- arrows are green when everything is OK, red if there is an error. The up-arrow will be yellow if the command is incomplete (for example, waiting for an end-of-frame delimiter). Note: an hourglass will display if an operation takes a particularly long time to complete; for example, during a long trigger. Each log entry includes a log detail button (arrow icon on right side of log entry) to display a detail view of the log entry. Buttons at the bottom of the screen provide for refreshing the display and clearing the log. Additionally, the communication log can be saved to the USB drive so that the communication log can be imported to the emulator.
Image Export Channel Log Main Menu > Logs > Communication Logs > Image Export
The Image Export log is purely an an output log so there is no receive (input) activity. Image Export is only available over Ethernet. When a user enables Image Export, the log will show an Enabled entry that indicates the port is being listened to. When a client application connects or disconnects, a log entry indicates that which IP address has connected or disconnected. If data is dropped, the logs will indicate the number of frames that have been dropped.
Inspection Logs Screen Main Menu > Logs > Inspection Logs > View Logs
Inspection Logs appear as a strip of film. You can select a frame to view a specific image. Use the icon in the lower right of the screen to save the logs to the USB drive. Logs saved to the USB drive can be imported into the emulator. Click the Clear button to clear Inspection Logs.


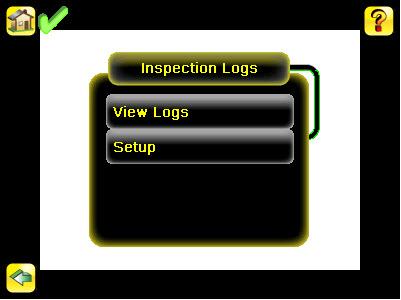
Inspection Logs Menu Main Menu > Logs > Inspection Logs
This menu provides for configuring and viewing Inspection Logs. Inspection Logs are stored inspection records that include a captured image, the parameters used to inspect it, and the results of that inspection. Up to ten Inspection Logs can be held in memory on the sensor. The next ten overwrite the previous. Inspection Logs can be saved to the USB drive so that the logs can be imported to the emulator.
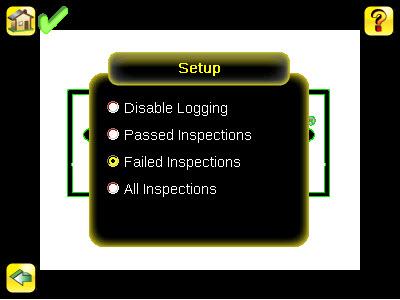
Inspection Logs Setup Screen Main Menu > Logs > Inspection Logs > Setup
Use the radio buttons to Disable Logging, or to log Passed Inspections, Failed Inspections, or All Inspections.
Frame Inspection Log Main Menu > Logs > Inspection Logs > View Logs (click on a frame to view)
The View Inspection Log screen is used to debug an inspection, and shows one inspection in read-only mode. Click the upper-left icon to cycle through views. When in Statistics view, the table title has arrows to switch between Inputs and Results of the Inspection. Use the left and right arrow keys at the bottom of the screen to navigate through the all stored Inspection Logs.
System Log Main Menu > Logs > System Logs > System Log
The System Log contains configuration change information, other notifications, and any errors or warnings that may be encountered. The list is sorted in descending order with respect to time. The 'Time' associated with each event consists of the Hour Count (lifetime hours of operation) and the Up Timer (time elapsed since last boot). Click the icon in the upper left corner of the screen to show/hide the time column. Click Clear Log button at the bottom of the screen to clear the System Log. Click the icon at the lower-right of the screen to save the System Log to the USB drive.


