HAV G roup ASA
A SUSTAINABLE FUTURE AT SEA

2022 / ANNUAL REPORT


SETTING
A
AT SEA Page CONTENT 4 CEO letter 6 HAV Group 18 Sustainability in HAV Group 20 Board of directors report 26 Responsibility statement from board and CEO 27 Consolidated statement of profit or loss 28 Consolidated statement of financial position 31 Statement of cash flow 32 Notes group 56 Parent company 57 Consolidated statement of profit or loss parent company 58 Consolidated statement of financial position parent company 60 Statement of cash flow parent company 61 Notes parent company 71 Independent Auditor’s report
COURSE TOWARDS
SUSTAINABLE FUTURE
HAV Group’s vision is “A sustainable future at sea”. This is backed up by the provision of numerous technologies, products, systems and services that support the marine and maritime industries towards the ultimate goal of zero emission operations.
Navigating safely through choppy waters
Dear co-shareholder,
Although this is first and foremost a report about HAV Group’s operational and financial performance in 2022, we and other companies are obviously affected by what goes on around us. As such, 2022 was also impacted by unexpected world events. Just when we had put most of the physical limitations caused by Covid-19 behind us, Russia embarked on its invasion of Ukraine, causing the tragic loss of thousands of innocent lives.
Although trivial compared to the sufferings of the Ukrainian people, the effects of the war have also caused major disturbances to European energy supply and the
world economy in general. This has impacted HAV Group and most other companies. Supply chain disturbances, high electricity prices and rising inflation are some of the unexpected effects that we and others have had to tackle. Following Covid-19-limitations in 2021, I’m pleased to see that my colleagues have been able to tackle the many unforeseen challenges that 2022 presented to them.
From a financial perspective, 2022 was a typical transitional year. However, we do not let short term disturbances affect our strategic direction. We will continue to create value through collaboration and by developing people who share

HAV Group ASA – Annual report 2022
4
our vision. We create profitability by exploiting the synergies that exist within the group and develop our businesses with complementary resources, activities and solutions that give customers the greatest value. We create growth through organic development, strategic partnerships and corporate acquisitions that provide added value to customers and through cooperation within the group.
There were also multiple positive events for HAV Group in 2022. For example, we won a substantial number of new contracts. As a result we ended 2022 with an order backlog that was 26 percent higher than one year prior. Overall, we are seeing an improved market which has also resulted in several new contracts at the beginning of 2023 too.
The winds of change in the maritime industries provide tailwind for HAV Group. Global megatrends, including regulatory changes, provide incentives and requirements for the maritime industry to reduce the environmental footprint short and long term. The journey towards zero emission shipping has thoroughly begun. It is a matter of when, not if, we will see a large global fleet of low and zero emission vessels sailing the world’s oceans and inland rivers and seas. The million-dollar question is how quickly this will happen, but we are already seeing a lot of positive developments in this regard.
In the meantime we continue to focus unwaveringly on our role as the enabler of low and zero emission shipping. We have spent the last few decades as well as 2022 on delivering a wide range of CO2-reducing products and technologies to our customers. We are constantly improving the cost-efficiency benefits of product portfolio, and we have launched new products that will make it easier for shipowners, ship designers and shipyards to choose the most environmentally friendly solution for their vessels.
HAV Group possesses the technologies and products that enable the green transition at sea. The global maritime market outlook is more positive going into 2023, and HAV Group has chosen to maintain its capacity to be able to fully capitalize on forthcoming growth opportunities. That is also why we have chosen to reiterate our 2025 revenue target of NOK 1.3 billion, with periodic fluctuations that reflect the project-driven business we are.
Finally, I would like to thank my colleagues for their drive and dedication to HAV Group, our customers and shareholders. HAV Group is a team effort. So is the transition to zero emission shipping. I look forward to achieving this together with you.
Gunnar Larsen CEO HAV Group
HAV Group ASA – Annual report 2022
HAV Group; an enabler of the green transition at sea
HAV Group is an international provider of technology and services for maritime and marine industries.
Although the group was formally established as late as 2021, it currently comprises four subsidiaries – HAV Design, Norwegian Electric Systems, HAV Hydrogen and Norwegian Greentech–that have several decades of combined industry experience.
The company is headquartered in Fosnavåg, Norway, with offices in Bergen, Ålesund and Egersund (Norway), Sopot (Poland), Matulji (Croatia) and Istanbul (Turkey).
Our experience and expertise, as well as the focus on efficiency, safety, and sustainability, is the foundation for developing and delivering high-quality innovative solutions to our customers in the seafood, energy, and transport sectors.
The group and its subsidiaries possess special expertise in guiding the marine and maritime industries towards zero emissions.
Ship design: Supplier of innovative ship design, pioneering the design and construction of zero and low-emission vessels.
Energy design and smart control systems: Supplier of sustainable energy systems, electric propulsion, automation and NavCom systems for a wide range of vessels.
Hydrogen-based energy systems: Supplier of zero-emission hydrogen-based energy systems for vessels.
Water treatment systems: Supplier of ballast water treatment system and other water treatment systems for aquaculture and maritime use.
HAV Group is listed on Euronext Growth Oslo (ticker: HAV).
For more information, see www.havgroup.no
HAV Group ASA – Annual report 2022
services
HAV Group’s solutions and
include:
6

HAV Group ASA
HAV is the Norwegian word for ocean.
The HAV Group is an international provider of technology and services for maritime and marine industries.
The Group’s vision is ”A sustainable future at sea”.
HAV Group was established in 2021 and comprises four subsidiaries with a leading position in supporting the marine and maritime industries towards the ultimate goal of zero emissions, all based on our Norwegian heritage, experience, quality focus and innovative solutions.
Our experience and expertise, as well as the focus on efficiency, safety, and sustainability, lays the foundation for developing and delivering highquality innovative solutions to our customers in the seafood, energy, and transport sectors.

This insight provides our customers with a head start, increases their competitiveness, and enables them to realize the green shift towards a sustainable future at sea.
The Group shall create shareholder value by contributing to its subsidiaries and projects through:
Actively taking part in subsidary companies’ strategic development to implement group strategy
HAV Group ASA – Annual report 2022 HAV Group ASA – Annual report 2022
8
Stimulating intercompany business development and R&D processes

Extracting synergies through economies of scale and standardization of processes and systems
Pursuing value accretive growth – organic and through M&A
Ship design
HAV Group advises customers regarding selection of vessel parameters and technologies that allow shipowners to increase their competitiveness and enable the green transition at sea.
It provides pioneering innovations in the design and construction of low and zero-emission vessels and energyoptimized ship designs.
This entails developing the most efficient vessels possible, covering every aspect of the vessel’s functionality and performance, including environmental performance, through concept development, detail design, equipment selection, procurement, system engineering and integration.
Further, innovative simulation-based ship design enables analysis and documentation of real-life performance of a vessel – before it has been built.
In total, HAV Group possesses the competence and tools available to help shipowners design, develop and construct low and zero emission vessels, thereby supporting the global maritime industry in reaching its emission targets.
HAV Group’s subsidiary HAV Design has a track record of more than 100 ship designs.
For more information, see www.havdesign.no
HAV Group ASA – Annual report 2022
10

HAV Group ASA – Annual report 2022
Energy design and smart control systems
HAV Group supplies low and zero emission energy, propulsion and control systems for the global marine market.
Detailed knowledge about vessel operations – from bridge to propeller – and specialist competence in integrating energy sources, including electric propulsion and charging systems, allow design of optimal power and propulsion systems that keep emissions to a minimum.
Smart control systems and software platforms for navigation, automation and control ensure even more fuel-efficient operations.
These products and systems are key enablers to achieve low and zero emissions, and can be applied to newbuilds or retrofitted on board existing vessels, making it easier for shipowners to reduce emissions from their fleets.
HAV Group’s subsidiary Norwegian Electric Systems is a leading supplier of advanced diesel electric, hybrid electric, and 100 percent electric propulsion systems, for the global marine market.
See www.norwegianelectric.com for more information.
HAV Group ASA – Annual report 2022
12

HAV Group ASA – Annual report 2022
Hydrogen-based energy systems
HAV Group is a supplier of complete and scalable zero-emission hydrogen-based energy systems for vessels. The systems are suitable for both vessel newbuilds and retrofits.
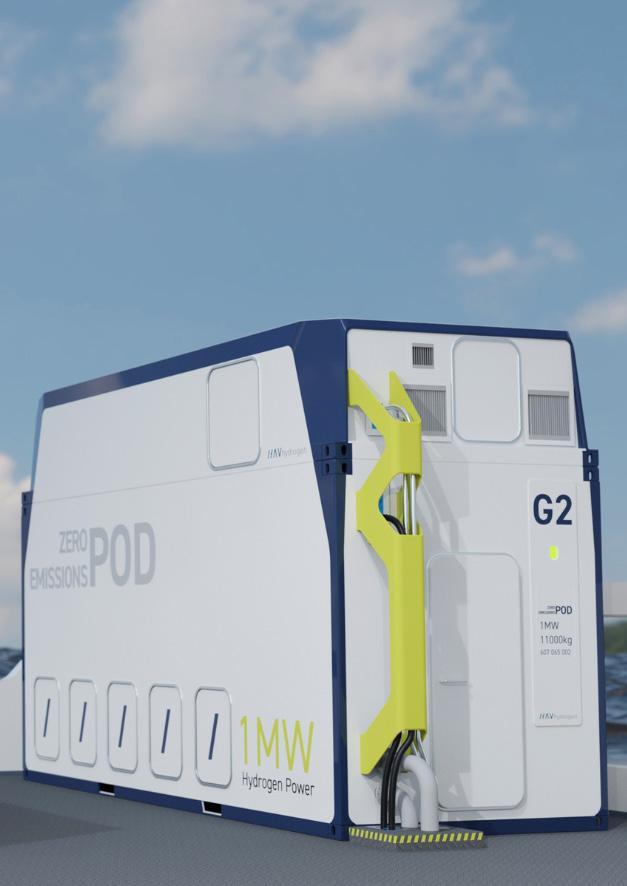
The group has developed maritime-based energy systems with liquid hydrogen tank below deck and a container-based hydrogen system to be installed on deck – the Zero Emission Pod.
Adoption of hydrogen as ship fuel is considered a vital part of the transition to more sustainable shipping. HAV Group is one of the global frontrunners in offering approved hydrogenbased energy systems for ships.
Installed effect can be used for the main propulsion systems, or for additional power supply on board the vessel to comply with green operation standards. Quayside, hydrogen systems can ensure sufficient green power supply to the vessel, which does not need to rely on onshore charging infrastructure to achieve zero emission status.
HAV Group’s subsidiary HAV Hydrogen develops hydrogenbased energy systems for vessels.
See www.havhydrogen.no for more information.
HAV Group ASA – Annual report 2022
14

HAV Group ASA – Annual report 2022
Water treatment systems
HAV Group is a supplier of ballast water treatment systems for ships and other water treatment systems for the aquaculture industry.
The spread of invasive species is recognized as one of the greatest threats to the ecological and the economic wellbeing of the planet.
Efficient treatment of ballast water prevents the unwanted spread of invasive species. The ballast water treatment system is available for both retrofit and vessel newbuilds.
Process water treatment for aquaculture production is key to maintain fish health and avoid detrimental effect on local environment.
HAV Group provides water treatment technologies for both land-based aquaculture and live fish carriers. Moreover, HAV Group’s water treatment products are based has a chemical-free system that does not pollute the marine environment.
HAV Group’s subsidiary Norwegian Greentech develops and manufactures water treatment systems.
See www.norwegiangt.no for more information.
HAV Group ASA – Annual report 2022
16

HAV Group ASA – Annual report 2022
Sustainability in HAV Group
At HAV Group, sustainability and corporate development and performance go hand-in-hand. Our entire business is founded on providing shipowners with technologies, products, systems and services that allow them to realise both the financial and environmental benefits associated with low and zero emission shipping.
In short, HAV Group is an enabler of the green transition at sea.
For the first time ever, HAV Group this year publishes a sustainability report, where we aim to inform stakeholders about our approach and performance on key environmental, social and governance (ESG) topics.
In connection with this work, we have identified three main sustainability topics that we believe are central to managing the most important social, societal and environmental challenges that HAV Group face:

- Environmental protection
- People
- Ethics and transparency
You can read more about HAV Group sustainability strategy, efforts and targets in the 2022 sustainability report, which can be found at www.havgroup.no
18


BOARD OF DIRECTORS REPORT
OPERATIONS AND LOCATION
HAV Group ASA (“HAV”) was established in February 2021, and is an international provider of technology and services for the maritime and marine industry. The company is listed at Euronext Growth Oslo.
HAV is the parent company and majority owner of the shares in various subsidiaries operating within engineering, ship design and equipment. The group has several decades of combined experience in the industry, in addition to special expertise in leading the marine and maritime industry through the green shift and towards the goal of zero emissions. The purpose of HAV is to assist its subsidiaries with strategic management, finance, logistics, marketing, and other support functions.
HAV and the group management are based in the main office at HAV House in Fosnavåg, Herøy.
Below follows a description of development in the various business areas. 2021 figures in ( )
HAV DESIGN
HAV Design AS (“HDE”) carries out development, sale and deliveries of ship design, project engineering and system packages to shipyards and shipping companies worldwide.
The scope of delivery can consist of packages with basic design, detailed design and engineering support, equipment packages, and system integration based on the customer’s requirements and needs.
The business area is headquartered in Fosnavåg. Foreign subsidiaries have been established in Poland and Croatia.
HAV, with HDE in front, works actively with developing new designs and solutions and takes part in various projects. This segment also participates in research and development towards using hydrogen as an energy source for larger vessels. This project is going to contribute towards strengthening the group’s leading position within the green shift in the maritime industry.
HAV design is delivered or being under development for customers in Norway, Denmark, Iceland, the Faroe Islands, Spain, Russia, Turkey, India, China, Singapore and Nigeria.
In 2023, HDE has made a breakthrough in the American offshore wind market with the development of a new offshore wind service vessel (SOV), thus becoming the first European ship designer to develop an SOV for the American market.
US has set a goal of installing 30 GW of offshore wind by 2030. According to the classification society American Bureau of Shipping (ABS) and other industry experts, this large-scale development will require more than 100 American vessels in the future.
HDE is 100 % owned by HAV as of 31.12.22.
Segment turnover was NOK 155.4 million (627.1) and a pre-tax result of NOK 10.5 million (84.7). EBITDA amounted to NOK 15.7 million (91.6). The segment has an equity of NOK 17.6 million (97.4) which equals 7% (38%) of total assets.
HAV HYDROGEN
HAV Hydrogen AS (“HHY”) is a start-up company with the aim of being a total supplier of hydrogen-based energy systems for vessels. Through the FreeCO2ast project, HHY develops a high-capacity hydrogen energy system, to be approved for zero emission sailing with high speed over long sailing distances.
The scope of delivery can consist of complete and scalable hydrogen systems for use on both big and small vessels, newbuildings and retrofits, that are designed for operation in heavy seas. HHY is a total supplier with expertise in prestudies, hydrogen systems, ship integration and cooperation with the policy instrument system and private investors.
In 2022, HHY received preliminary approval for its hydrogenbased energy system. The company also launched a hydrogen energy system that will be installed in a container and placed on deck on board ships. In 2023, the company received approval in principle (AiP) from DNV. The approval is an important milestone for HHY’s work to commercialize the new “Zero Emission Pod” system, a container-based solution that aims to accelerate the commercial use of hydrogen as ship fuel.
The business area is headquartered in Fosnavåg. HHY is 100 % owned by HAV as of 31.12.22.
Segment turnover was NOK 2.8 million (1.9) and a pre-tax result of NOK -5.6 million (-1). EBITDA amounted to NOK -5.4 million (-1). The segment has an equity of NOK 6.7 million (0.03) which equals 71% (2%) of total assets.
NORWEGIAN ELECTRIC SYSTEMS
Norwegian Electric Systems AS (“NES”) manufactures and supplies electric, hybrid-electric propulsion systems, integrated automation systems, bridge systems, as well
HAV Group ASA – Annual report 2022
BOARD OF DIRECTORS REPORT
20
as navigation- and communication packages for vessels. This includes switch-boards, electromechanical products, automation and safety systems. NES has a unique composition of products that complement each other in a good way and the company can deliver complete equipment supplies from bridge to thruster.
In addition to the locations in Bergen and Ålesund, the business area has also established a branch in Egersund, which is primarily responsible for product development. The Egersund area has long traditions in the development of advanced technology within marine systems.
In 2022, the company established a new subsidiary and opened an office in Istanbul, Turkey. This is a strategic decision to be able to provide even better services to Turkish and other shipyards in southern Europe, as well as provide local sales, services and commissioning support. Being located close to the large Turkish shipyards, it will be possible to provide an even more costeffective service offer, which will hopefully make the company an even more attractive supplier to the local shipyards.
NES is 100% owned by HAV as per 31.12.22.
Segment turnover was NOK 268.6 million (226.8) and a negative pre-tax result of NOK 10.7 million (0.9). EBITDA amounted to NOK -11.5 million (7.5). The segment has an equity of NOK 35.8 million (60.7) which equals 20% (26%) of total assets.
NORWEGIAN GREENTECH
Norwegian Greentech AS (“NGT”) is specialized in design, engineering and delivery of systems for cleansing of ballast water. The International Maritime Organization (IMO) now demands cleansing of ballast water for ships within certain categories or areas, and this also results in vessels in operation having to install such systems, as well as newbuilds.
In 2022, HAV purchased the remaining 22,72% of the shares, where NGT is 100% owned by HAV as per 31.12.22.
Segment turnover was NOK 226.7 million (167.5) and pre-tax profits was at NOK 23.3 million (11.9). EBITDA was at NOK 30.8 million (15.9). The segment has an equity of NOK 12.4 million (20.5), which amounts to 12 % (16%) of total assets.
GOING CONCERN
The financial statements have been prepared under the going concern assumption, cf. the Accounting Act § 3-3a. It is confirmed that the going concern assumption is present.
FUTURE DEVELOPMENT
Global megatrends with ambitious goals and increasingly stringent environmental requirements provide incentives and requirements for the maritime industry to reduce its environmental footprint considerably.
HAV is well established with references, customer base, order back log, renowned knowledge, technology and products within digitalization and sustainability for contributing to the green shift in the maritime and marine industries.
The companies within the group have had a diversification strategy over the last years, and this has resulted in a diversified customer base in several segments:
• Established with new designs in the growing ferries and windmill service vessel market.
• Established position in the aquaculture market with new technology, by delivery of design and equipment packages.
• Entering new segments, such as large passenger ferries and cargo vessels.
• Entering into new geographical markets, such as the American offshore wind market.
The group has established a strategy which is expected to provide a basis for continued growth and income development. The group will make considerable efforts in the export marketing area, with a view to increase the share of sales outside Norway.
RISK ASSESSMENT
Risk in business areas is generally handled as an integral part of the work processes. All managers are responsible for risk management and internal control within their area of responsibility.
The board receives, generally, quarterly reports where the companies’ finances, information about projects, and market conditions are described.
In sales contracts, the respective group company carries the legal and commercial risk towards customers. However, in some cases, there have also been issued parent company guarantees from HAV.
Internally in the group, each business area carries the risk of its own performance. Beyond the commercial risk factors described in the paragraphs above, the group is also exposed to the following risk factors:
HAV Group ASA – Annual report 2022
BOARD OF DIRECTORS REPORT
Financial risk:
The group’s primary sources of liquidity in addition to the operational cash flows have been equity capital and debt financing raised through several minor loans related to projects. The group is exposed to various risks such as market risk (including currency risk, fair value interest rate risk and price risk), credit risk, liquidity risk and cash flow interest rate risk, and no assurances can be given that the group’s monitoring of such risks will be adequate or sufficient. The group’s credit and borrowing facilities are structured in short term debt instruments. Although such debt instruments contain few or no covenants and are customarily secured in accordance with the market practice for these types of financing, there can be no assurance that the group will be able to meet such covenants relating to current or future indebtedness contained in its funding agreements or that its lenders will extend waivers or amend terms to avoid any actual or anticipated breaches of such covenants. Failure to comply with its financial and other covenants may have an adverse effect on the group’s financial condition, and also potential increased financial costs, requirements for additional security or cancellation of loans.
The group is dependent upon having access to short term funding. There can be no assurance that the group may not experience net cash flow shortfalls exceeding the group’s available funding sources nor can there be any assurance that the group will be able to raise new equity, or arrange new borrowing facilities, on favourable terms and in amounts necessary to conduct its ongoing and future operations, should this be required.
NOK is the functional currency of HAV and all its subsidiaries. The group is exposed to foreign currency risks related to its operations. The group’s expenses are primarily in NOK and EUR. As such, the group’s earnings are exposed to fluctuations in the foreign currency market for NOK in relation to EUR. To mitigate this risk, the company has implemented hedging arrangements, and uses the foreign currency spot and forward market to buy foreign currencies. Contracts are entered into when treasury finds it in line with the overall currency risk strategy.
MARKET AND BUSINESS RISK
TThe demand for maritime technologies depends on underlying industries that are vulnerable to external factors outside of the group’s control. In particular, the demand for newbuilding of vessels and associated maritime technologies is dependent on the activity within the different industries and segments, which are in turn dependent on factors including, but not limited to, worldwide economic and political
conditions, levels of supply and demand, the policies of the Organization of Petroleum Exporting Countries (“OPEC”), advances in exploration and development technology, and the availability and exploitation of alternate fuel sources. The demand for vessels within fisheries and aquaculture is dependent on regulatory frameworks and other factors. A decline in the demand for maritime technologies will have a negative impact on the demand for the group’s products, technologies and services.
The group is dependent on successfully competing for, and winning, contracts offering a satisfactory profit margin in order to maintain revenues and profitability. The contracts are entered into in a competitive market where the group competes on product quality, overall service offering, financing, and price. A deterioration of the group’s ability to deliver competitive products, technologies and services could have a significant adverse effect on the group’s business and results of operations in the future.
The products and services offered by the group are characterized by complex projects with a high technological content and highly customized orders. When entering into contracts, the group has risks on its margin between the agreed fixed price of the finished product or service, and the costs involved in completing such product or service. In particular, when constructing new or customized products, there is an element of uncertainty involved in the cost or time involved in such construction which may have a significant adverse effect on the group’s results of operations.
When supplying maritime technologies, the group provides a functionality guarantee for the product for a specified period of time after delivery. The group makes allocation for such guarantees in its accounts. There can be no assurance that the allocations made will be sufficient to meet any potential guarantee claims, and a rightful claim could have a material adverse effect on the group’s financial position.
The group has procured adequate insurance coverage for its operation risks in line with market practice, including but not limited to insurance for personnel, property and liability. The group’s insurance policies and contractual rights to indemnity may not adequately cover the group’s losses, or may have exclusions of coverage for some losses. In line with industry practice, the group does not have insurance coverage or rights to indemnity for all kinds of risks. If a significant accident or other event occurs which is not fully covered by insurance or contractual indemnity, it could adversely affect the financial position, results of operations and cash flows of the group.
HAV Group ASA – Annual report 2022
BOARD OF DIRECTORS REPORT 22
DIRECTORS’ AND OFFICERS INSURANCE
HAV Group ASA has established a liability insurance for the board of directors, which includes the parent company and its subsidiaries. The insurance policy covers the board members, CEO and members of the management team, and comprises personal liability, including defence and legal costs.
SHAREHOLDER INFORMATION
HAV was listed on Euronext Growth Oslo in March 2021 and has 3987 shareholders as of 31.12.2022. The company only has one share class, and all shares are freely tradable.
ACCOUNTING PRINCIPLES
The consolidated financial statements of HAV Group ASA and its subsidiaries (the “Group”) are prepared in accordance with the Accounting Act and generally accepted accounting principles. See note 2 -Significant Accounting Policies.
FINANCIAL REVIEW
The Group’s revenue was NOK 621,8 million in 2022 compared to NOK 916.7 million in 2021.
The operating profit (EBIT) for the Group was NOK 2.0 million in 2022 compared to NOK 90.6 million in 2021.
The Group’s net profit in 2022 amounted to NOK 2,8 million, compared to NOK 75.7 million in 2021. The main reason for the lower level of turnover was extensive trading deliveries in 2021. The profit is lower due to lower activity and some loss projects. We also observe increasing activity in Norwegian Greentech after years with focus on product development.
Equity amounted to NOK 112,5 million at 31.12.2022, compared to NOK 152.4 million at 31.12.2021. This represents an equity ratio of 23.0% respectively in 2022 and 26.0% in 2021. The reason for the decrease is mainly due to the Group’s purchasing of own shares in 2022.
Net cash flow for the group during the period is NOK -152.0 million compared to NOK 341.9 million in 2021. Cash flow from operating activities is NOK -70.4 million compared to NOK 274.8 million in 2021. This negative figures is mainly due to reduction in net liabilities based on lower activity level.
Net cash flow from investing activities is NOK -25.1 million in 2022 compared to NOK -13.0 million in 2021. The negative cash flow is mainly due to investment in research and development and purchase of shares in Norwegian Greentech.
Net cash flow from financing activities is NOK -56.6 million
in 2022 compared to NOK 80.2 million in 2021. Main reason is purchase of own shares and repayment of non-current debt.
The cash flow statement shows the cash flow changes throughout the year. Total assets and capital employed is variable based on the payment terms and delivery times of contracts.
As of 31st December 2022, the Group’s liquid assets were NOK 223.8 million compared to NOK 375.9 million at the end of 2021.
The Group’s short-term debt amounted to NOK 311.3 million at 31st December compared to NOK 362.0 million 2021, and the reduction is due to lower level of Advance payment from customers and less debt to suppliers.
The balance sheet shows total assets for the Group of NOK 479.8 million in 2022, compared to NOK 588.5 million in 2021.
The Board believes that the annual report provides an accurate view of the Group’s assets and liabilities, financial position, and results
WORK ENVIRONMENT
The total sick leave for the Group in 2022 was 3,99%, which is higher than in 2021, where the total sick leave was 1,6%.
The group works actively to reduce the extent of injuries, secure workplaces, and improve protective equipment. It also works actively to return employees from long-term sick leave.
No serious workplace accidents which resulted in major property damage or personal injury have occurred or been reported during the year.
The Board of directors receives quarterly statistics for the development within the areas of health, environment, safety, and quality.
Furter information on environmental impacts can be found in the separate ESG report.
EQUALITY AND DISCRIMINATION
The group shall comply with the purpose of the Equality and Discrimination Act, including by promoting equality and preventing discrimination on the grounds of sex, pregnancy, maternity leave or adoption, care tasks, ethnicity, religion, outlook on life, disability, sexual orientation, gender identity, gender expression, age and other significant factors of a person.
HAV Group ASA – Annual report 2022
BOARD OF DIRECTORS REPORT
The group shall be a workplace where there is full equality between women and men.
When hiring, professional competence is emphasized. Candidates with different ethnicity, national origin, descent, skin colour, language, religion or outlook on life shall all have the same opportunities and rights. Working time arrangements in the group follow from the various positions and are independent of gender.
Further reporting in accordance with the Equality and Discrimination Act can be found on the websites for the group companies that are covered by the extended reporting obligations within this area.
ENVIRONMENTAL AND CLIMATE RISK
Climate risk for companies can include the risk of loss of value and assets as a result of physical climate change, as well as loss of market share and value creation as a result of climate policy and technological development. Overall, the climate risk and its impact on future earnings is considered to be relatively low.
The UN Sustainable Development Goals, political ambitions and new regulations pushes the group and its customers to develop the solutions of the future already today. The group is passionate about using knowledge to solve environmental challenges by creating energy-efficient products and cutting emissions, while at the same time increasing customers’ profitability, competitiveness, and value creation by giving them a tool for the future.
By widely experience in energy-efficient vessels, environmentally friendly systems and technology, the group has the cross-cutting expertise required to do its part in meeting the UN Sustainable Development Goals.
In 2022, there have been no climate or environmental issues requiring special measures. The group has not had any emissions to air or water in excess of the requirements set by the authorities.
Furter information on climate and environmental impacts can be found in the separate ESG report.
As of 31 December 2022, the group owns more than 40 ship designs that are sold worldwide. From 2013, great emphasis has been placed on development, and several new designs have been developed. It is believed that there are significant excess values here beyond those stated in the financial statements. Support from several different programs has been received and the development of a system for rebuilding to hydrogen is a large project that extends over several years.
ANNUAL PROFIT AND ALLOCATION
The Board proposes the following allocation of the parent company’s profit for 2022:
Transferred to other equity in total MNOK 2.8 Group: The Board proposes a dividend of NOK 0.
SOCIAL RESPONSIBILITY
HAV shall maintain a solid reputation for its credibility around the world, by consistently conducting its operations with integrity and in compliance with the applicable laws and regulations. Board members and employees shall act fairly and honestly, and display integrity in all dealings with other employees, business partners, clients, the public, the industry, shareholders, suppliers, competitors, and government authorities. The group’s values and commitment to sustainable development should be reflected, promoted and implemented through policies, decisions, and actions.
The group has established a code of ethics and social responsibility: “Code of Conduct for Business Ethics and Corporate Social Responsibility”. Among other things, these guidelines include rules for relations with business partners, hereunder policy regarding gifts and confidential information. The code of ethics and social responsibility also give guidelines on how to deal with a potential conflict of interest.
An anti-corruption program has been developed and this program deals with among other things how to define risk areas for corruption and how to take preventive measures.
Both the anti-corruption program and the Code of Conduct for Business Ethics and Corporate Social Responsibility are available at the group´s web page www.havgroup.no
RESEARCH AND DEVELOPMENT
The group conducts extensive development activities, including the development of ship designs and zero emission propulsion systems.
The group is strongly involved in ensuring the development of expertise and education in the maritime industry. Our apprentice program and HAV Academy are examples of the social responsibility that the group has taken to ensure future competence in our industry.
HAV Group ASA – Annual report 2022 BOARD OF DIRECTORS REPORT
24
The Transparency Act (Åpenhetsloven) is a new law that will promote companies’ respect for basic human rights and decent working conditions, and ensure the public’s access to information. The Act imposes, among other things, a duty to provide information and a duty to carry out due diligence assessments in the supply chain, which must be explained in a yearly report.
The Company will publish a report of the due diligence assessment on its website www.havgroup.no within June 2023.
HAV Group ASA – Annual report 2022 BOARD OF DIRECTORS REPORT
RESPONSBILITY STATEMENT FROM THE BOARD AND CEO


We hereby in accordance with the Norwegian Securities Trading Act §5-5 confirm, to the best of our knowledge, that the financial statements for the period 1 January to 31 December 2022 have been prepared in accordance with applicable accounting standards, and that the information in the accounts gives a true and fair view of the company’s and group’s assets, liabilities, financial position and profit or loss as a whole. We also confirm that the annual report gives a fair view of the company’s and group’s development, financial position and profit or loss as a whole, as well as a description of the principal risks and uncertainties the company and the group face.


HAV Group ASA – Annual report 2022
Fosnavåg, 28 April 2023
The Board of Directors and CEO HAV Group ASA
Chairman of the Board
Tore Hopen Board member
Anita Fjørtoft Board member Gunnar Larsen CEO
Helge Simonnes Board member Kjetil Ripe Board member
Vibeke Fængsrud Board member 26
Board member
CONSOLIDATED STATEMENT OF PROFIT OR LOSS HAV Group ASA
HAV Group ASA – Annual report 2022
(NOK 1,000) Note 2022 2021 Revenues 3 620 342 915 055 Other operating revenues 3 1 473 1 662 Operating income 621 815 916 717 Materials and consumables 392 155 614 534 Payroll expenses 4 141 036 121 049 Other operating expenses 5 68 848 73 047 Operating expences 602 040 808 630 Operating profit before depreciation and amortisation (EBITDA) 19 776 108 087 Depreciation 6,7 17 807 17 453 Operating profit/loss (EBIT) 3 1 969 90 635 Financial income 8 20 119 12 888 Financial expenses 8 17 783 15 794 Profit / loss before tax 3 4 305 87 728 Income tax expense 3,9 1 496 12 031 Profit for the year 3 2 809 75 697 Translation differences -1 763 Total comprehensive income 2 809 73 934 Attributable to : Equity holders of parent -476 70 540 Non-controlling interest 3 285 3 393 Total 2 809 73 934 CONSOLIDATED STATEMENT OF PROFIT OR LOSS
CONSOLIDATED STATEMENT OF FINANCIAL POSITION
HAV Group ASA
(NOK 1,000)
HAV Group ASA – Annual report 2022 CONSOLIDATED STATEMENT OF FINANCIAL POSITION
Note 2022 2021 Non-current assets Licenses, patents and R&D 6 77 292 82 684 Property, plant and equipments 7 6 178 3 436 Investment in financial assets 2 136 132 Total non-current assets 85 606 86 252 Current Assets Inventory 2,11 26 463 20 580 Accounts receivables 12,13 82 632 85 532 Other receivables 13 50 785 14 655 Contract assets customer contracts 10 493 5 598 Cash and cash equivalents 14 223 847 375 888 Total current assets 394 220 502 252 TOTAL ASSETS 3 479 826 588 504
ASSETS
28
CONSOLIDATED STATEMENT OF FINANCIAL POSITION
HAV Group ASA – Annual report 2022 EQUITY AND LIABILITIES (NOK 1,000) Note 2022 2021 Equity Share capital 15 35 000 35 000 Share premium reserve 87 202 87 202 Treasury shares -1 638 -1 817 Retained earnings -10 586 24 662 Non-controlling interests 2 562 7 429 Total equity 112 541 152 476 Non-current liabilities Deferred tax liability 9 8 252 7 334 Liabilities to Financial institutions 16 46 192 66 531 Other long-term liabilities 1 535 114 Total non-current liabilities 55 978 73 980 Current liabilities Accounts payables 12 40 182 52 772 Tax payables 9 0 3 218 Public duties payables 11 929 16 963 Advance payment from customers 192 860 224 069 Other current liabilities 17 66 336 65 026 Total current liabilities 311 307 362 048 Total liabilities 367 286 436 028 TOTAL EQUITY AND LIABILITIES 3 479 826 588 504 Fosnavåg,
28 April 2023
The Board of Directors and CEO HAV Group ASA
Chairman of the Board
Tore Hopen Board member
Anita Fjørtoft Board member
Gunnar Larsen CEO
Helge Simonnes Board member
Kjetil Ripe Board member
Vibeke Fængsrud Board member
Board member
CONSOLIDATED STATEMENT OF FINANCIAL POSITION
HAV Group ASA
CONSOLIDATED STATEMENT OF CHANGES IN EQUITY HAV Group ASA
HAV Group ASA – Annual report 2022
(NOK 1,000) Note Share capital Share premium reserve Treasury shares Retained earnings Total Noncontrolling interest Total equity January 1, 2022 35 000 87 202 -122 22 967 145 047 7 429 152 476 Profit for the Year -476 -476 3 285 2 809 Currency translation differences 241 241 75 316 Purchase /sale of own shares -2 321 -30 573 -32 894 -32 894 Exit minority with partial settlement in cash 806 -2 744 -1 939 -7 729 -9 668 Dividend -496 -496 Desember 31, 2022 35 000 87 202 -1 639 -10 586 109 978 2 562 112 541 (NOK 1,000) Note Share capital Share premium reserve Treasury shares Retained earnings Total Noncontrolling interest Total equity January 1, 2021 30 0 0 41 681 41 711 4 034 45 745 Profit for the Year 72 360 72 360 3 337 75 697 Currency translation differences -1 821 -1 821 58 -1 763 Contribution in kind, formation on the group 29 970 5 536 -87 983 -52 477 -52 477 Share issue settled in cash 5 000 81 667 86 667 86 667 Purchase of own shares -1 817 -1 817 -1 817 Other changes 423 423 423 December 31, 2021 35 000 87 203 -1 817 24 662 145 045 7 429 152 476 CONSOLIDATED STATEMENT OF CHANGES IN EQUITY 30
CONSOLIDATED STATEMENT OF CASHFLOW
HAV Group ASA – Annual report 2022
(NOK 1,000) Note 2022 2021 CASH FLOW FROM OPERATIONS Profit/(loss) before tax 3 4 305 87 728 Taxes paid 9 -3 218 0 Depreciation 6,7 17 807 17 453 Net financial items 8 -2 336 -2 906 Changes in inventory 11 -5 883 -12 958 Changes in accounts receivables 12 2 900 -40 047 Changes in accounts payable 12 -12 590 -216 315 Changes in other current receivables/liabilities 13 -71 383 441 796 Net cash flow from/(to) operating activities -70 400 274 750 CASH FLOW FROM INVESTMENTS Investments in property, plant and equipment 7 -4 729 -2 368 Investment in intangible assets 6 -10 345 -11 062 Interest income 8 1 690 391 Purchase of shares in subsidiary -9 668 0 Purchase of shares in associated company -2 000 0 Net cash flow used in investing activities -25 052 -13 039 CASH FLOW FROM FINANCING ACTIVITIES New long term debt 16 0 7 500 Interest payment 8 -3 357 -3 223 Repayment non-current debt 8,16 -20 340 -8 968 Purchase of own shares -32 894 -1 817 Capital increase - share issue (net) 0 86 667 Net cash flow from/ (used in) financing activities -56 591 80 159 Net change in cash and cash equivalents -152 042 341 871 Cash and cash equivalents at start of the year 375 888 34 015 Cash and cash equivalents at end of the year 14 223 847 375 888 Restricted cash at end of year 6 047 5 411 Cash and cash equivalent recognised in the balance sheet 223 847 375 888 CONSOLIDATED STATEMENT OF CASHFLOW
HAV Group ASA
HAV Group ASA – Annual report 2022 NOTES HAV Group ASA Note Name 1 General information 2 Significant accounting policies 3 Segment information 4 Salary, fees, number of employees etc. 5 Other operating expenses 6 Intangible assets 7 Property, plant and equipment 8 Financial income and financial expenses 9 Income tax 10 Subsidiaries, associates and other financial investments 11 Inventory 12 Financial risk management 13 Other current and non-current receivables 14 Cash and cash equivalents 15 Share capital 16 Interest bearing debt 17 Other current liabilities 18 Losses to completion and other provisions for losses 19 Government grants 20 Contingencies and provisions 21 Related party transactions 22 Environmental and climate risk 32
NOTE 1. GENERAL INFORMATION
HAV Group ASA is a limited company based in Norway, and its head office is in Fosnavåg, Herøy.
HAV is the parent company and majority owner of the shares in various subsidiaries operating within engineering, ship design and equipment. The group has several decades of combined experience in the industry, in addition to special expertise in leading the marine and maritime industry through the green shift and towards the goal of zero emissions. The purpose of HAV is to assist its subsidiaries with strategic management, finance, logistics, marketing, and other support functions.
NOTE 2. SIGNIFICANT ACCOUNTING POLICIES
2.1 Basis of preparation
The consolidated financial statements of HAV Group ASA and its subsidiaries (the “Group”) are prepared in accordance with the Accounting Act and generally accepted accounting principles.
Preparation of accounts in accordance with the Accounting Act requires the use of estimates. Furthermore, the application of the company’s accounting principles requires management to exercise discretion. Areas that to a large extent contain such discretionary assessments, a high degree of complexity, or areas where assumptions and estimates are significant for the annual accounts, are described in the notes.
The consolidated financial statements have been prepared according to the assessment rules in the Accounting Act, chapter 5.
The consolidated financial statements are presented in NOK 1,000. Figures in all notes to the financial statements are also presented in NOK 1,000 unless otherwise specified.
The consolidated accounts were approved by the Board of Directors on 28 April 2023.
2.2 Basis of consolidation
The consolidated financial statements include Hav Group ASA and companies in which Hav Group ASA has a controlling influence. Controlling influence is normally achieved when the parent company has ownership interests that directly, or indirectly, provide more than half of the voting rights in a company, unless it and only in exceptional cases, it can be clearly demonstrated that ownership does not provide control. Note 10 shows an overview of subsidiaries.
Internal transactions and intercompany balances, including internal profits and unrealized gains and losses, are eliminated. Similarly, unrealized losses are eliminated, but only to the extent that there are no indications of impairment of the asset sold internally.
A change in ownership interest in a subsidiary, without loss of control, is accounted for as an equity transaction. If the group loses control of a subsidiary, the following is executed:
• Derecognizes the assets and liabilities of the subsidiary.
• Derecognizes the carrying amount of any non-controlling Interests.
• Derecognizes the cumulative translation differences recorded in equity.
• Recognizes the fair value of the consideration received.
• Recognizes the fair value of any investment retained.
• Recognizes any surplus or deficit in profit or loss.
2.3 Classification of balance sheet items
Assets intended for permanent ownership or use are classified as fixed assets. Assets that are associated with the product cycle are classified as current assets. Receivables are otherwise classified as current assets if they are to be repaid within one year. For debt, analogous criteria are used as a basis. First-year installments on long-term receivables and long-term debt are nevertheless not classified as current assets and short-term debt.
2.4 Acquisition cost
Acquisition cost for assets includes the purchase price, less bonuses, discounts and the like, and with the addition of purchase expenses (shipping, customs duties, nonrefundable government fees and other direct purchase expenses). When purchasing in foreign currency, the asset is capitalized at the exchange rate at the time of the transaction.
For property, plant and equipment and intangible assets, the acquisition cost also includes direct expenses to prepare the asset for use, such as expenses for testing the asset.
2.5 Foreign currency
Receivables and liabilities in foreign currency, which are not hedged using forward contracts, are capitalized at the exchange rate at the end of the financial year. Exchange rate gains and losses related to sales of goods and purchases of goods in foreign currency are recognized as operating income and cost of goods.
HAV Group ASA – Annual report 2022
NOTES
2.6 Related parties
Parties are related if one party has the ability, directly or indirectly, to control the other party or exercise significant influence over the party in making financial and operating decisions. Parties are also related if they are subject to common control or common significant influence.
Transactions with related parties are disclosed in note 21.
2.7 Revenue recognition
The Group recognizes revenue as the Group fulfills a delivery obligation upon transfer of goods or services to the customer. The Group’s operating revenues are related to the following income streams:
• Sale of ship electrical systems and accompanying aftermarket activity
• Sale of ship design that is also combined with equipment deliveries
• Design, engineering and delivery of systems for cleaning of ballast water
Sale of ship electrical systems
Income from contracts must be recognized in the income statement in line with progress (degree of completion).
Earned contract income on the balance sheet date is the total estimated contract income multiplied by the degree of completion. Earned contract income in the period is earned contract income on the balance sheet date less earned contract income recognized in the income statement in previous periods.
The degree of completion is calculated on the basis of production performed for completion, contract costs are incurred on the balance sheet date, and the degree of completion is calculated as the ratio between these and estimated total contract costs.
Sale of ship design, possibly combined with equipment packages.
Earned contract income on the balance sheet date is the total estimated contract income multiplied by the degree of completion. Earned contract income in the period is earned contract income on the balance sheet date less earned contract income recognized in the income statement in previous periods.
The degree of completion is calculated on the basis of production performed for completion, contract costs are
incurred on the balance sheet date, and the degree of completion is calculated as the ratio between these and estimated total contract costs.
Design, engineering and delivery of systems for cleaning of ballast water
Revenues from the sale of goods are recognized in the income statement once delivery has taken place and the risk and return has been transferred.
2.8 Borrowing costs
Borrowing costs directly attributable to the acquisition, construction or production of an asset that necessarily takes a substantial period of time to get ready for its intended use or sale are capitalized as part of the cost of the respective assets. All other borrowing costs are expensed in the period in which they occur. Borrowing costs consist of interest and other costs that an entity incurs in connection with the borrowing of funds.
2.9 Investment in subsidiaries
The cost method is used as a principle for investments in subsidiaries. The cost price is increased when funds are provided through a capital increase, or when group contributions are made to subsidiaries. Dividends received are initially recognized in the income statement as income. Dividends that exceed the share of earned equity after the purchase are entered as a reduction of the acquisition cost. Dividends / group contributions from subsidiaries are recognized in the same year as the subsidiary allocates the amount. Dividends from other companies are recognized as financial income when approved.
2.10 Property, plant and equipment
Property, plant and equipment is stated in the balance sheet at cost, net of accumulated depreciation and accumulated impairment losses, if any. Cost includes expenditures that are directly attributable to the acquisition of the item of property, plant and equipment.
Depreciation is calculated on a straight-line basis over the estimated useful lives of the assets as follows:
• Land and buildings 10-40 years
• Machinery 3-10 years
• Operating equipment 3-10 years
When significant parts of property and equipment are
HAV Group ASA – Annual report 2022
34 NOTES
required to be replaced at intervals, the Group recognizes such parts as individual assets with specific useful lives and depreciates them accordingly. All other repair and maintenance costs are recognized in profit and loss as incurred.
Leased (leased) fixed assets are capitalized as fixed assets if the lease is considered financial.
An item of property and equipment and any significant part initially recognized is derecognized upon disposal or when no future economic benefits are expected from its use or disposal. Any gain or loss arising on derecognition of the asset (calculated as the difference between the net disposal proceeds and the carrying amount of the asset) is included in the income statement when the asset is derecognized. The residual values, useful lives and methods of depreciation of property and equipment are reviewed at each financial year end and adjusted prospectively, if appropriate.
2.11 Intangible assets
Development expenses are capitalized to the extent that a future economic benefit related to the development of an identifiable intangible asset can be identified and the expenses can be measured reliably. Otherwise, such expenses are expensed on an ongoing basis. Capitalized development is depreciated on a straight-line basis over its economic life.
2.12 Impairment of fixed assets
If there is an indication that the book value of a fixed asset is higher than the fair value, a test for impairment is performed. The test is performed for the lowest level of fixed assets that have independent cash flows. If the book value is higher than both sales value and value in use (present value for continued use / ownership), a write-down is made to the higher of sales value and value in use.
Previous write-downs, with the exception of write-downs of goodwill, are reversed if the conditions for the write-down are no longer present.
2.13 Inventories
Goods are valued at the lower of acquisition cost (according to the FIFO principle) and fair value. For raw materials, replacement cost is used as an approximation of fair value. For finished goods and goods under construction, the acquisition cost consists of expenses for product design, material consumption, direct wages, and other direct and
indirect production costs (based on normal capacity). Fair value is the estimated selling price less expenses for completion and sale. Only variable expenses are considered necessary to sell finished goods, while fixed manufacturing costs are also included as necessary for goods that have not been finished.
2.14 Construction contracts
Work in progress related to fixed-price contracts with a long production time is assessed according to the current settlement method. The degree of completion is calculated as accrued costs as a percentage of the expected total cost. The total cost is reassessed on an ongoing basis. For projects that are assumed to incur losses, the entire estimated loss is expensed immediately.
2.15 Receivables
Accounts receivable are entered in the balance sheet after deductions for provisions for expected losses. Provisions for losses are made on the basis of an individual assessment of the receivables and an additional provision to cover other foreseeable losses. Significant financial problems with the customer, the probability that the customer will go bankrupt or undergo financial restructuring and deferrals and deficiencies in payments are considered as indicators that trade receivables must be written down.
Other receivables, both current receivables and capital receivables, are entered at the lower of nominal and fair value. Fair value is the present value of expected future payments. However, no discounting is made when the effect of discounting is insignificant for the accounts. Provisions for losses are assessed in the same way as for trade receivables.
2.16 Treasury Shares
Own equity instruments that are reacquired (treasury shares) are recognized at cost and deducted from equity. No gain or loss is recognized in profit or loss on the purchase, sale, issue or cancellation of the Group’s own equity instruments. Any difference between the carrying amount and the consideration, if reissued, is recognized in retained earnings. Voting rights related to treasury shares are nullified for the Group and no dividends are allocated to them.
2.17 Debt
Debt, with the exception of certain provisions for liabilities, is recognized in the balance sheet at the nominal debt amount.
HAV Group ASA – Annual report 2022
NOTES
2.18 Accounts payable
Trade payables are recognized at fair value on initial recognition. Accounts payable are classified as short-term if they fall due within one year or less. If this is not the case, it is classified as long-term. Due to the short maturity, the face value of the debt is considered to reflect fair value. Normally, fair value will equal transaction price.
In agreements that reduce the value of outstanding debt, the value of the debt is reduced and recorded as income. Upon subsequent calculation of the value of the agreement, changes are entered as an adjustment of the debt with a counter-item in the income statement.
2.19 Pension
The company has various pension schemes. The pension schemes are financed through payments to insurance companies, with the exception of the AFP scheme. The company has both defined contribution plans and defined benefit plans.
Deposit plans
In the case of deposit plans, the company pays deposits to an insurance company. The company has no further payment obligation after the deposits have been paid. The deposits are accounted for as wage costs. Any prepaid deposits are capitalized as an asset (pension funds) to the extent that the deposit can be refunded or reduce future payments.
AFP
The AFP scheme is an unsecured performance-based multicompany scheme. Such a scheme is in fact a defined benefit plan, but is treated in the accounts as a defined contribution plan as a result of the scheme’s administrator not providing sufficient information to calculate the obligation in a reliable manner.
2.20 Warranties
Warranties related to completed sales are assessed at the estimated cost of such work. The estimate is calculated on the basis of historical figures for warranty work, but corrected for expected deviations due to, for example, changes in quality assurance routines and changes in product range. The provision is entered under “Other current liabilities”, and the change in the provision is expensed.
2.21 Government grants
Government grants are recognized when it is reasonably certain that the company will meet the conditions stipulated for the grants and that the grants will be received. Operating grants are recognized systematically during the grant period. Grants are deducted from the cost which the grant is meant to cover. Investment grants are capitalized and recognized systematically over the asset’s useful life. Investment grants are recognized as a deduction of the asset’s carrying amount.
2.22 Taxes
The tax expense in the income statement includes both the tax payable for the period and the change in deferred tax. Deferred tax is calculated at the current tax rate on the basis of the temporary differences that exist between accounting and tax values, as well as any tax losses carried forward at the end of the financial year. Tax-increasing and tax-reducing temporary differences that reverse or can reverse in the same period have been offset. The entry of deferred tax assets on net tax-reducing differences that have not been settled and losses carried forward are justified by assumed future earnings. Deferred tax and tax assets that can be recognized in the balance sheet are entered net in the balance sheet.
Tax reduction on group contributions made, and tax on received group contributions which is led to a reduction in cost or directly against equity, is entered directly against tax in the balance sheet (against tax payable if the group contribution has an effect on tax payable and against deferred tax if the group contribution has effect on deferred tax) .
Deferred tax is recognized at the nominal amount.
2.23 Cash flow statement
The cash flow statement is prepared according to the indirect method. Cash and cash equivalents include cash, bank deposits and other short-term, liquid investments that can be immediately and with insignificant exchange rate risk converted into known cash amounts and with a remaining term of less than three months from the date of acquisition.
HAV Group ASA – Annual report 2022
36 NOTES
NOTE 3. SEGMENT INFORMATION
The Group's main activities are:
1. HAV Design, i.e. provide ship design and system packages for offshore, transport and fishing vessels;
2. Norwegian Electric Systems , i.e. specializing in design, engineering and installation of electric systems and delivery of control and automation systems for ships;
3. Norwegian Greentech, i.e. specializes in the design, engineering and delivery of ballast water treatment systems.
4. HAV Hydrogen, i.e. delivers complete and scalable hydrogensystems, that are designed for operation in heavy seas.
See note 10 for information about which segment each subsidiary are located in.
The group divides the customers into geographical areas on the basis of the customers' nationalities. The areas are Norway, Europe without Norway and Other.
The Group's customer base consists of a wide range of companies.
Transfer prices between operating segments are basis in a manner similar to transactions with third parties.
The accounting principles for segment reporting correspond to those used by the group, with the exception of discontinued operations which are treated in the same way as continuing operations in segment reporting.
"Other" contains parent company items and elimination of intra-group transactions.
HAV Group ASA – Annual report 2022 NOTES
2022 (NOK million) HAV Design Norwegian Electric Systems Norwegian Greentech HAV Hydrogen Other/ Elimination Group Operating revenues, External 151,1 238,4 226,2 2,7 1,8 620,3 Operating revenues, Internal 2,9 30,2 0,4 0,1 -33,6 0,0 Operating income 155,4 268,6 226,7 2,8 -31,7 621,8 EBITDA 15,7 -11,5 30,8 -5,4 -9,9 19,8 Depreciation 5,0 5,9 6,3 0,0 0,7 17,8 Operating profit/(loss) (EBIT) 10,7 -17,3 24,5 -5,4 -10,5 2,0 Net financial items -0,3 6,6 -1,2 -0,1 -2,7 2,3 Profit/(Loss) before tax 10,5 -10,7 23,3 -5,6 -13,2 4,3 Income tax expense 2,1 -2,4 5,0 -1,2 -2,0 1,5 Profit/(Loss) 8,4 -8,3 18,2 -4,3 -11,1 2,8 Total assets 266,6 182,7 106,4 9,4 -85,4 479,8 Equity 17,6 35,8 12,4 6,7 40,1 112,5 Liabilities 249,0 147,0 94,1 2,7 -125,5 367,3 Geographical areas Norway Europe Other Total Operating revenues 383,8 234,0 4,0 621,8
"Other" contains parent company items and elimination of intra-group transactions.
NOTE 4. SALARY, FEES, NUMBER OF EMPLOYEES ETC.
The Group has a defined contribution plan covering all employees. The Group's pension scheme satisfies the requirements of the Act on Compulsory Occupational Pensions. Pension costs for the Group's defined contribution plans are expensed on a continuous basis with earnings for the employees. The Group's duty is limited to the payment of agreed contribution and where the actuarial risk and investment risk fall on the individual employee.
HAV Group ASA – Annual report 2022 38 NOTES 2021 (NOK million) HAV Design Norwegian Electric Systems Norwegian Greentech HAV Hydrogen Other/ Elimination Group Operating revenues, External 624,2 121,5 167,5 1,9 0,0 915,1 Operating revenues, Internal 1,5 105,0 0,0 0,0 -106,6 0,0 Operating income 627,1 226,8 167,5 1,9 -106,6 916,7 EBITDA 91,6 7,5 15,9 -1,0 -6,0 108,1 Depreciation 10,7 5,2 1,6 0,0 0,0 17,5 Operating profit/(loss) (EBIT) 80,8 2,4 14,4 -1,0 -6,0 90,6 Net financial items 3,8 -1,5 -2,5 0,0 -2,7 -2,9 Profit/(Loss) before tax 84,7 0,9 11,9 -1,0 -8,7 87,7 Income tax expense 26,8 -15,0 3,1 -0,2 -2,6 12,0 Profit/(Loss) 57,8 15,9 8,8 -0,8 -6,1 75,7 Total assets 259,0 229,0 125,7 2,0 -27,2 588,5 Equity 70,6 60,7 20,5 0,0 0,7 152,5 Liabilities 188,4 168,3 105,2 1,9 -27,9 436,0 Geographical areas Norway Europe Other Total Operating revenues 279,7 631,0 6,0 916,7
Payroll expenses 2022 2021 Wages 120 924 105 738 Employer's part of social security costs 18 053 14 613 Pension, contribution plans 8 394 5 630 Capitalization R&D -10 366 -6 915 Other benefits 4 031 1 982 Total salaries and social expenses 141 036 121 048 Man-labour year 147 135
(NOK 1,000)
At the time for establishment of HAV Group in Q1 2021, Gunnar Larsen was employed as CEO for HAV Group. At the same time Pål Aurvåg (CFO) and Frank-Levi Kvalsund (SVP HR/ QHSE) were hired in from Havyard Group ASA (EQVA ASA) in respective positions, but transferred to HAV Group from March 2022. Figures for 2022 is only related to remuneration from HAV Group.
Key management does not have bonus agreements or any share-based payment.
No loans or guarantees to the Group CEO or any member of the bord per 31/12/2022 or 31/12/2021.
HAV Group ASA – Annual report 2022
(NOK 1,000) 2022 2021 2022 2021 2022 2021 Salary 2 164 2 249 1 069 1 477 825 1 350 Pension 98 96 78 85 74 92 Other remuneration 183 132 114 137 112 159 Total remuneration 2 445 2 477 1 260 1 699 1 011 1 601
Gunnar
Larsen, CEO Pål Aurvåg, CFO Frank-Levi Kvalsund, SVP HR/QHSE
NOTES
NOTE 5. OTHER OPERATING EXPENSES
NOTE 6. INTANGIBLE ASSETS
HAV Group ASA – Annual report 2022 40
Auditor's fees are stated excluding VAT. (NOK 1,000) Other operating expenses 2022 2021 Rent and leasing expenses 13 924 13 342 Office and administration expenses 4 717 2 946 Plant, tools and equipment (including IT) 7 883 3 852 Travel and employee exoenses 10 457 6 377 Hired consultants* 15 365 29 752 Marketing and communication 4 606 2 358 Other operating expenses 11 897 14 420 Total 68 848 73 047 *Fees to auditor are included here Fees to the auditor consists of the following services: 2022 2021 Statutory audit 2 848 1 278 Tax advice 291 302 Other assistance 22 1 973 Total 3 160 3 553 NOTES
2022 2021 (NOK 1,000) Research and development Research and developmentl Acquisition cost as of 1/1 198 869 187 807 Additions during the year 10 345 11 062 Acquisition cost as of 31/12 209 214 198 869 Accumulated depreciation as of 1/1 116 185 100 178 Depreciation for the year 15 737 16 007 Accumulated depreciation as of 31/12 131 922 116 185 Book value as of 31/12 77 292 82 684 Depreciation rate 5-10 years 5-10 years
NOTE 7. PROPERTY, PLANT AND EQUIPMENT
Other operating equipment mainly relates to office equipment.
Depreciation
Operating equipment and are depreciated by the linear method over expected useful life.
NOTE 8. FINANCIAL INCOME AND FINANCIAL EXPENSES
HAV Group ASA – Annual report 2022 2022 2021 (NOK 1,000) Operating equipment Operating equipment Acquisition cost as of 1/1 23 723 21 355 Additions during the year 4 729 2 368 Disposals during the year 0 0 Acquisition cost as of 31/12 28 452 23 723 Accumulated depreciation as of 1/1 20 287 18 839 Depreciation for the year 1 987 1 448 Impairment 0 0 Accumulated depreciation as of 31/12 22 274 20 287 Book value as of 31/12 6 178 3 436 Useful life 3-10 years 3-10 years
(NOK 1,000) 2022 2021 Interest income 1 690 389 Agio 18 294 12 497 Other financial income 136 2 Total financial income 20 119 12 888 Interest expenses 3 357 3 223 Agio loss 11 845 5 746 Other financial expenses 2 582 6 825 Total financial expenses 17 783 15 794 Net financial items 2 336 -2 906 NOTES
NOTE 9. INCOME TAX
The parent company HAV Group ASA is resident in Norway, where the corporate tax rate is 22 %, while some parts of the group are taxed in other jurisdictions and other tax regimes.
The major componenents of income tax expense/ (income) for the year are:
Reconciliation of actual tax cost against expected tax cost in accordance with the ordinary Norwegian income tax rate of 22%.
Deferred tax relates to the following temporary differences:
Deferred income tax and liabilities are offset when there is a legally enforceable right to offset current tax assets against current tax liabilities and when the deferred income taxes relate to the same fiscal authority.
After an assessment, Deferred tax is reset on the basis that we have unrecognized deferred tax assets and we can use tax loss carried forward in 2022, and possibly later years.
HAV Group ASA – Annual report 2022 42
Consolidated income statement 2022 2021 Current income tax: Taxes payable 0 3 218 Changes in deferred tax 917 8 813 Prior year adjustments 579 0 Income tax expense/(income) reported in the income statement 1 496 12 031 (NOK 1,000) 2022 2021 Profit before tax 4 305 87 728 Tax expense 22% 947 19 300 Recognized tax expense 1 496 12 031 Difference between expected and recognised tax expense 549 -7 269 Difference is related to: Other permanent differences 549 -7 269 Total 549 -7 269
(NOK 1,000)
2022 2021
Non-current assets -13 368 -29 579 Earned, not billed production 75 624 94 157 Leasing -13 28 Current assets -3 053 1 796 Accruals and provisions -14 255 -7 812 Tax loss carried forward -7 427 -25 252 Total temporary differences 37 508 33 338 Net deffered tax liability/ assets (-) 8 252 7 334 Deferred tax liability in the balance sheet 8 252 7 334 NOTES
(NOK 1,000)
NOTE 10. SUBSIDIARIES, ASSOCIATES AND OTHER FINANCIAL INVESTMENTS
HAV Group ASA – Annual report 2022
Financial information for subsidiaries with non-controllling interest (NOK 1,000) 2022 HAV Group ASA has the following ownership in subsidiaries as of 31/12/2022 Ownership share/ voting share Business office Segment Currency Share capital (1,000) Norwegian Electric Systems AS 100 % Bergen NOK 1 121 HAV Design AS 100 % Fosnavåg Design & Solutions NOK 108 Norwegian Greentech AS 100 % Fosnavåg Norwegian Greentech NOK 5 000 HAV Design & Engineering Poland sp.z.o.o 70 % Sopot Design & Solutions PLN 101 HAV Design & Engineering Rijeka d.o.o. 70 % Rijeka Design & Solutions HRK 28 HAV Hydrogen AS 100 % Fosnavåg Hydrogen NOK 30 Norwegian Electric Systems AS Tyrkia 85 % Istanbul Norwegian Electric Systems TRL 10 Subsidiary with non-controlling interests as of 31/12/2022 Ownership share/ Voting share Business office Currency Share of result (1,000) HAV Design & Engineering Poland sp.z.o.o 70 % Sopot PLN 1 145 HAV Design & Engineering Rijeka d.o.o. 70 % Rijeka HRK -375 Norwegian Electric Systems AS Tyrkia 85 % Istanbul TRL -712 Norwegian Electric Systems AS Tyrkia HAV Design & Engineering Poland sp.z.o.o HAV Design & Engineering Rijeka d.o.o. SUM Operating revenue 402 9 804 3 624 13 830 Profit/(loss) -837 1 815 -536 442 Total assets 2 831 9 525 783 13 139 Equity -1 665 8 749 206 7 290 Liabilities 4 496 777 576 5 849 NOTES
has the following ownership
*Investments in Havyard China Ltd and Havyard Far East Pte Ltd has not been consolidated in 2020 due to immaterial values.
as of
information for subsidiaries with non-controllling interest
NOTE 11. INVENTORY
(NOK 1,000)
HAV Group ASA – Annual report 2022 44 2021 HAV Group ASA
in subsidiaries
of 31/12/2021 Ownership share/ voting share Business office Segment Currency Share capital (1,000) Norwegian Electric Systems AS 100 % Bergen Norwegian Electric Systems NOK 1 121 HAV Design AS 100 % Fosnavåg HAV Design NOK 108 Havyard Far East Pte Ltd* 100 % Singapore HAV Design SGD 570 Norwegian Greentech AS 77 % Fosnavåg Norwegian Greentech NOK 5 000 HAV Design Poland sp. z o.o.) 70 % Sopot HAV Design PLN 98 HAV Design Croatia d.o.o 70 % Rijeka HAV Design HRK 27 HAV Hydrogen AS 100 % Fosnavåg HAV Hydrogen NOK 30
as
Subsidiary with
31/12/2021 Ownership share/ Voting share Business office Currency Share of result (1,000) Norwegian Greentech AS 77% Fosnavåg NOK 7 899 HAV Design & Engineering Poland sp.z.o.o 70% Sopot PLN 1 902 HAV Design & Engineering Rijeka d.o.o. 70% Rijeka HRK -184 Norwegian Greentech AS HAV Design & Engineering Poland sp.z.o.o HAV Design & Engineering Rijeka d.o.o. SUM Operating revenue 167 503 10 848 3 978 182 329 Profit/(loss) 8 800 2 522 -618 10 704 Total assets 125 680 9 525 1 110 136 315 Equity 20 463 8 485 779 29 727 Liabilities 105 218 1 040 331 106 589 Financial
non-controlling interests
(NOK 1,000)
2022 2021 Raw materials (at cost) 0 8 749 Components 26 463 11 830 Total Inventories 26 463 20 580 Impairment for obsoletness 0 0 NOTES
Financial Risk
The Group’s activities expose it to financial risks such as, market risks, credit/counterpart risk and liquidity risk.
The Board of Directors is responsible for setting the objectives and underlying principles of financial risk management for the Group. The Board of Directors also establishes detailed policies such as authority levels, oversight responsibilities, risk identification and measurement, exposure limits and hedging strategies.
Market Risk
Market risk is the risk that fluctuations in market prices, e.g. exchange rates, the price of such raw materials as steel, and interest rates, will affect future cash flows or the value of financial instruments. Market risk management aims to ensure that risk exposure stays within the defined limits, while optimising the risk-adjusted return. Attempts should be made to secure major purchases in connection with projects as soon as possible after the final clarification of the project.
Capital Management
The Group’s objectives when managing capital are to safeguard the Group’s ability to continue as a going concern and to maintain an optimal capital structure so as to maximise shareholder value. In order to maintain or achieve an optimal capital structure, the Group may return capital to shareholders or obtain borrowings.
The Group monitors capital based on the equity to total asset ratio. In additon, the Group monitors the working capital closely.
Interest Rate Risk
The Group are exposed to changes in interest rates, as the liabilities have floating rates. The Group have not entered into interest rate hedging instrument. Reference is made to Note 16 for more information regarding interest bearing debt.
Currency Risk
The Group’s revenue and costs are denominated primarily in Norwegian Krone(“NOK”) which is the functional currency of most entities within the Group. Currency risk arises through ordinary business, future commercial transactions, recognised assets and liabilities and when such have been made against payment in a currency other than the functional currency of the Group. The Group is mainly exposed to Euro (EUR). The Group has a currency hedging strategy where forward contracts are used to keep the currency risk at a low level.
The Group's currency exposure is based on cash and bank balances, trade and other receivables, and trade and other payables. Financial assets and financial liabilities denominated in the functional currency are not included.
If the EUR or USD rates against the NOK had been stronger or weaker by 5 % at the balance sheet date with all other variables, the effects on profit and loss before tax arising from the net financial assets position would have been as follows:
If the EUR or USD rates against the NOK had been stronger or weaker by 5 % (2021: 5 %) at the balance sheet date with all other variables, the effects on profit and loss before tax arising from the net financial assets position would have been as follows:
HAV Group ASA – Annual report 2022
12. FINANCIAL RISK
NOTE
MANAGEMENT
NOK (1,000) 2022 2021 EUR Change if NOK 5 % weaker 574 392 Change if NOK 5 % stronger -574 -392 USD Change if NOK 5 % weaker 572 -31 Change if NOK 5 % stronger -572 31 NOTES
Credit/Counterparty Risk
Credit risk refers to the ability and willingness of counterparts to pay for services rendered and to stand by their future contractual commitments with the Group. The Group has implemented thorough procedures to limit the exposure to unreliable counterparts and the Group avoids undue concentration of credit and counterpart exposure. Prior to fixing any business with new customers or medium to longer term business with existing customers, commercial departments have to get approval from the Group’s credit risk team. Significant exposures must be approved by the Groups Credit Committee.
The age analysis of trade receivables is as follows:
The credit assessments are based on information from external credit rating agencies, public information, the Group's previous experience with the counterpart and internal analysis. Country and political risk also forms a part of the assessment. The Group actively seeks to diversify its exposure to particular industries and/or jurisdictions.
Liquidity Risk
Liquidity risk is the risk that the group will be unable to fulfil its financial obligations as they fall due. The Group monitors its liquidity risk by maintaining a level of cash and bank balances deemed adequate by management to finance the Group’s operations and mitigate the effects of fluctuations in cash flows.
Management monitors rolling forecasts of the Group’s liquidity reserve and cash and bank balances on the basis of expected cash flow. Close follow of the cash flow development
is also the basis for the continued operation considerations. Reference can be made to note 14 for details on cash, note 16 for interest bearing debt.
Liquidity risk can also be caused by customers not able to establish long-term financing for projects or that the Group is unable to secure construction financing.
HAV Group ASA – Annual report 2022 46 NOTES NOK (1,000) 2022 2021 Not past due 41 451 72 117 Past due < 3 months 31 805 8 253 Past due 3 to 6 months 1 404 587 Past due over 6 months 7 972 4 575 Impairment 0 0 Trade receivables 82 632 85 532 Contract assets customer contracts 10 493 5 598 Total credit/counterparty risk to customers 93 125 90 950
Liabilities in balance sheet
NOTE 13. OTHER CURRENT AND NON-CURRENT RECEIVABLES
HAV Group ASA – Annual report 2022
2022 Current Long Term NOK (1,000) 0-3 months 3-6 months 6-12 months 1-2 years 2-5 years > 5 years Non Derivatives Accounts payables 37 570 2 612 Liabilities to financial institutions 40 140 6 052 Total 37 570 2 612 - 40 140 6 052Derivatives Forward contract foreign exchange Total 37 570 2 612 - 40 140 6 0522021 Current Long Term NOK (1,000) 0-3 months 3-6 months 6-12 months 1-2 years 2-5 years > 5 years Non Derivatives Accounts payables 50 083 2 513 176 Liabilities to financial institutions 40 681 20 450 5 400 Total 50 083 2 513 176 40 681 20 450 5 400 Derivatives Forward contract foreign exchange Total 50 083 2 513 176 40 681 20 450 5 400
Other current receivables 2022 2021 Prepayments suppliers 19 266 10 072 Employee-related items 75 0 Receivables VAT and government grants 4 632 2 867 Other short-term receivables 26 812 1 717 Sum other current receivables 50 786 14 655 (NOK 1,000) NOTES
NOTE 14. CASH AND CASH EQUIVALENTS
Cash and cash equivalents consist of:
NOTE 15 SHARE CAPITAL
Ordinary shares issued and fully paid
All shares have equal rights.
2022
The share capital was NOK 35 000 000 divided by 35 000 000 shares, at NOK 1.
Treasuryshares
HAV Group ASA owns 1.638.437 treasury shares ( 4.7% of share capital) as of 31/12/2022. (Ref.ongoing repurchase program.)
Dividendsandgroupcontributions
The Group has not paid dividend in 2022.
The board proposes NOK 0 in dividend for the general meeting Emini Invest AS, HSR Invest AS, Innidimann AS and Pision AS jointly own 100% of Havila Holding AS. The largest shareholder of the Group is Havila Holding AS. Chairman of the Board Vegard Sævik and boardmember Hege Sævik Rabben have indirect ownership in the group through their ownership in Havila Holding AS.
Havila Holding AS is a limited company based in Norway, and its head office is located in Fosnavåg, Herøy.
HAV Group ASA – Annual report 2022 48 NOTES
NOK
2022 2021 Cash at banks - unrestricted 217 800 370 476 Cash at banks - restricted 6 047 5 411 Total 223 847 375 887 Restricted
consists of: Tax withholding accounts 6 047 5 411
(1,000)
cash
2022 2021 Number of ordinary shares 35 000 000 35 000 000 Par value (NOK) 1 1 Share capital (NOK) 35 000 000 35 000 000
Shareholders as of 31.12.2022 Controlled by Number of shares Ownership HAVILA HOLDING AS Vegard Sævik (Ch.of Board) 8 737 827 25,0 % FARVATN CAPITAL AS 2 408 909 6,9 % HAV GROUP ASA 1 638 437 4,7 % MP PENSJON PK 1 524 220 4,4 % EQVA ASA 1 513 542 4,3 % NORDNET LIVSFORSIKRING AS 1 379 834 3,9 % EMINI INVEST AS 1 127 179 3,2 % HSR INVEST AS Hege Sævik Rabben (Board) 1 127 179 3,2 % INNIDIMMAN AS Vegard Sævik (Ch.of Board) 1 127 179 3,2 % AVANZA BANK AB 1 012 324 2,9 % NORDNET BANK AS 917 848 2,6 % JAHATT AS 770 500 2,2 % MORGAN STANLEY & CO. INTERNATIONAL 735 608 2,1 % PISON AS 375 726 1,1 % OTHER SHAREHOLDERS (<1 %) 10 603 688 30,3 % Number of shares 35 000 000 100 %
2021
The share capital was NOK 35 000 000 divided by 35 000 000 shares, at NOK 1.
Treasuryshares
HAV Group ASA has 118 080 treasury shares ( 0.35% of share capital) as of 31/12/2021. (Ref.ongoing repurchase program.)
Dividendsandgroupcontributions
The Group has not paid dividend in 2021.
The board proposes NOK 0 in dividend for the general meeting
Emini Invest AS, HSR Invest AS, Innidimann AS and Pision AS jointly own 100% of Havila Holding AS. The largest shareholder of the Group is Havila Holding AS. Chairman of the Board Vegard Sævik and boardmember Hege Sævik Rabben have indirect ownership in the group through their ownership in Havila Holding AS.
Havila Holding AS is a limited company based in Norway, and its head office is located in Fosnavåg, Herøy. Havyard Group ASA is consilidated in the financial accounts of Havila Holding AS. Havila Holding and companies owned by family owns in total 57.72% of Havyard Group ASA.
Shareholders as of 31.12.2021
HAV Group ASA – Annual report 2022
by Number of shares Ownership HAVYARD GROUP ASA Vegard Sævik (Ch.of Board) 11 659 047 33,3 % HAVILA HOLDING AS 4 693 500 13,4 % FARVATN CAPITAL AS 2 408 909 6,9 % MP PENSJON PK 1 072 192 3,1 % NORDNET LIVSFORSIKRING AS 882 485 2,5 % AVANZA BANK AB 800 643 2,3 % JAHATT AS 770 500 2,2 % NORDNET BANK AS 686 829 2,0 % EMINI INVEST AS 605 461 1,7 % HSR INVEST AS Hege Sævik Rabben (Board) 605 461 1,7 % INNIDIMMAN AS Vegard Sævik (Ch.of Board) 605 461 1,7 % MORGAN STANLEY & Co. INTERNATIONAL 471 986 1,3 % Other shareholders (<1 %) 9 737 526 27,8 % Number of shares 35 000 000 100,0 %
Controlled
NOTES
NOTE 16. INTEREST BEARING DEBT
Bank and leasing
(NOK 1,000)
The Liabilities to financial institutions of MNOK 66,5 include the DNB loan of NOK 32,5 million (HAV Group) and NOK 13,7 million from Sparebanken Møre and Innovation Norway (Norwegian Greentech).
The loan from DnB (NOK 32,5 million, maturity 30.09.2024)
The interest rate is 3 months NIBOR + 3.5% margin.
The loans from Sparebanken Møre (SBM) has a maturity of 3-6 years with nominal interest rates of NIBOR 3 months + margin 4.75 %.
The loans from Innovasjon Norge has a maturity of 3-10 years with nominal interest rates of 2.35 % to 3.9 %.
As of 31 December 2022, the Group was in compliance with all its existing debt covenants.
Several of the subsidiary in the Group have debt covenants, mainly towards equity and working capital.
Coventants HAV Group - DNB;
Working Capital > 0
NIBD/ EBITDA > 2,5
Free Cash > NOK 35 million
HAV Group ASA – Annual report 2022 50
Interest bearing long-term debt 2022 2021 Long term Loan DnB 32 500 47 500 Long term Loan Sparebanken Møre 8 500 11 500 Long term Loan Innovasjon Norge 4 993 7 286 Other long-term liabilities 199 246 Sum 46 192 66 531 Debt secured by mortgage 2022 2021 Long-term debt to financial institutions 46 192 66 531 Sum 46 192 66 531
NOTES
Book value of pledged asset
Changes in loans related to NOK 55 million is a result of the spin-off from Havyard Group ASA. (EQVA ASA)
HAV Group ASA – Annual report 2022
2022 2021 Machinery, operating equipment 6 178 3 436 Earned, not billed production 10 493 5 598 Inventory 26 463 20 580 Accounts receivables 82 632 85 532 Bank deposits 223 847 375 888 Sum book value of pledged assets 349 613 491 033 2021 Loans Cashflow IB Proceeds from new loans Installment Not cash changes UB Liabilities to financial institutions 13 000 7 500 -8 968 55 000 66 531 Other long-term liabilities 0 0 0 0 0 Lease liabilities 0 0 0 0 0 Total interest-bearing debt 13 000 7 500 -8 968 55 000 66 531 (NOK 1,000) 2022 Loans Cashflow IB Proceeds from new loans New long term debt Installment Not cash changes UB Liabilities to financial institutions 66 531 -20 340 46 192 Other long-term liabilities 0 0 0 Lease liabilities 0 0 0 0 Total interest-bearing debt 66 531 0 0 -20 340 0 46 192
NOTES
NOTE 17. OTHER CURRENT LIABILITIES
NOTE 18. PROVISIONS FOR LOSS CONTRACTS
The provison at year end is related to loss contracts. The amount is related to projects at Norwegian Electric Systems related to delivery of engineering and installation of electric systems and delivery of control and automation systems for ships. The reduction in provision is due to finalizing of projects in NES.
NOTE 19. GOVERNMENT GRANTS
The provision is presented as part of other current liabilities in the balance sheet. The profit and loss statement the expense is allocated between the line items materials and consumables, payroll expenses and other operating expenses.
Government grants have been received for several development projects. The grants are entered as a cost reduction over other operating costs and as a reduction of R&D in the balance sheet.There are no unsatisfied conditions or conditions attached to these grants. The grants are taken as a cost reduction.
Government grants have been received for several projects. There are no unfulfilled conditions or contingencies attached to these grants.
HAV Group ASA – Annual report 2022 52
2022 2021 Employee-related liabilities Note 20 430 14 391 Accrued cost WIP 18 723 14 126 Provision for losses on completion of contracts 10 729 2 689 Warranty provisions 3 364 5 812 Derivatives 0 824 Other current liabilities 13 091 27 185 Total other current liabilities 66 336 65 026 (NOK 1,000) NOTES 2022 2021 (NOK 1,000) Provisions Provisions from previous period 2 688 5 666 Provisions utilised -1 584 -2 978 New provisions 1 725 Total 2 829 2 688
NOK (1,000) 2022 2021 1.1 - Grants receivable 0 2 400 Received during the year 0 6 910 Released to the income statement 0 4 510 Of this - booked as reduction of other operating expenses 0 4 510 Of this - booked as reduction of capitalized R&D 0 0 31.12 - Grants receivable 0 0
NOTE 20. CONTINGENCIES AND PROVISIONS
Legal disputes
HAV Design AS (“HDE” - formerly Havyard Design & Solutions AS) entered into an agreement in 2018 for supply design and equipment to the Spanish shipyard Hijos de J. Barreras (“Barreras”). The contracts where related to two “coastal passenger vessels” ordered by Havila Kystruten AS (“HKY”) at Barreras (the “Shipbuilding Contracts”).
In connection with cancellation of the Shipbuilding Contracts, legal proceedings were initiated between HK and “insurers” (Abarca) who issued the insurance bond as security for repayment of advance payments under the Shipbuilding Contracts. The dispute has not been finally settled as of today.
The Group occasionally faces warranty claims as part of its ordinary business. No material warranty claim has as of the date of these financial statements been directed at any of the companies in the Group, nor have any of the companies in the Group been notified of any such claims.
(NOK 1,000)
HAV Group ASA – Annual report 2022 NOTES
2022 2021 Provisions IB 5 812 3 095 Used provision -3 752 0 New provisions 1 304 2 717 Provisions UB 3 364 5 812
Guarantees/warranties
NOTE 21. RELATED PARTY TRANSACTIONS
The Group has various transactions with related parties. All the transactions have been carried out as part of the ordinary operations.
The most significant transactions are as follows: (NOK 1,000)
Related to lease of office space. Havblikk Eiendom AS is a subsidiary of Havila Holding AS, which owns directly 25% of the shares in HAV Group ASA.
The group sold equipement for re-build of ferries to transform from diesel to electrical power to Fjord1.
Havila Holding AS owns 25% of the shares in HAV Group ASA. Havila Holding, through its three subsidiaries, Havilafjord AS, Havilafjord Holding AS and Havilafjord Holding 2 AS, owns 50.1% of Fjord1 ASA.
The group bougth services from EQVA ASA related to shared services. (Accounting, IT, HR, Law, Finance.)
Havila Holding AS owns 25% of the shares in HAV Group ASA and 13.9% in EQVA ASA at the end of 2022.
owns 4,3% in HAV Group ASA at the end of 2022.
Havila Holding AS owns 25 % of the shares in HAV Group ASA. See note 20 - Contingencies and provisions for info related to Havila Kystruten.
Havila Holding AS owns 25% of the shares in HAV Group ASA.
Holding AS owns 60.4% of the shares in Havila Kystruten AS.
HAV Group ASA – Annual report 2022 54
EQVA ASA
Havblikk Eiendom AS Sales to related parties / Purchases from related parties / Amounts owed to related parties / 2022 0 3 940 7 2021 0 3 759 0 Havila Kystruten AS Sales to related parties / Purchases from related parties / Amounts owed to related parties / 2022 2651 46 000 2021 526 0 46 000 Fjord1 ASA Sales to related parties / Purchases from related parties / Outstanding claims from to parties / 2022 43 294 0 985 2021 33 627 0 1 006 EQVA ASA Sales to related parties / Purchases from related parties / Amounts owed to related parties / 2022 0 0 0 2021 0 23 785 636 2022 2021 Account receivables 1 418 11 648 Account payables 46 007 46 509 NOTES
Havila
NOTE 22. ENVIRONMENTAL AND CLIMATE RISK
ENVIRONMENTAL AND CLIMATE RISK
Climate risk for companies can include the risk of loss of value and assets as a result of physical climate change, as well as loss of market share and value creation as a result of climate policy and technological development. Overall, the climate risk and its impact on future earnings is considered to be relatively low.
The UN Sustainable Development Goals, political ambitions and new regulations pushes the group and its customers to develop the solutions of the future already today. The group is passionate about using knowledge to solve environmental challenges by creating energy-efficient products and cutting emissions, while at the same time increasing customers’ profitability, competitiveness, and value creation by giving them a tool for the future.
By widely experience in energy-efficient vessels, environmentally friendly systems and technology, the group has the cross-cutting expertise required to do its part in meeting the UN Sustainable Development Goals.
In 2022, there have been no climate or environmental issues requiring special measures. The group has not had any emissions to air or water in excess of the requirements set by the authorities.
Furter information on climate and environmental impacts can be found in the separate ESG report.
HAV Group ASA – Annual report 2022
NOTES
PARENT COMPANY

PROFIT OR LOSS STATEMENT PARENT COMPANY
HAV Group ASA – Annual report 2022 PROFIT OR LOSS STATEMENT PARENT COMPANY
HAV Group ASA Note 2022 2021 Operating revenues and operating expenses (NOK 1000) Revenues 28 824 27 145 Total revenue 28 824 27 145 Wages and salaries 2 19 040 3 945 Depreciation 3 662 0 Other operating expenses 2,4 19 645 29 192 Total operating expenses 39 346 33 137 Operating profit -10 523 -5 992 Financial income and expenses Income from subsidiaries 5 146 732 12 035 Other interest income 5 1 436 1 259 Other interest expenses 5 4 087 2 227 Other financial expenses 5 4 1 769 Net financial income and expenses 144 077 9 298 Profit before taxes 133 554 3 306 Taxes 6 9 839 0 Profit for the year 123 715 3 306 Allocations Transferred to other equity 123 715 3 306 Total allocations 123 715 3 306 57
BALANCE SHEET PARENT COMPANY
HAV Group ASA – Annual report 2022 STATEMENT OF FINANCIAL POSITION PARENT COMPANY
HAV Group ASA Note 2022 2021 ASSETS (NOK 1,000) Non current assets Research and development 7 1 523 1 523 Deferred tax assets 6 57 0 Total intangible assets 1 581 1 523 Fixed assets Operating equipment, fixtures, fittings, tools, etc 3 875 0 Total tangible fixed assets 875 0 Financial fixed assets Investments in subsidiaries 8 182 243 122 983 Loan to Group companies 9 25 554 24 315 Investments in shares 2 000 0 Other long-term receivables 3 0 Total financial fixed assets 209 801 147 298 Total fixed assets 212 256 148 821 Current assets Accounts receivable 3 053 0 Receivables from group companies 9 153 417 17 471 Other current receivables 10 2 520 620 Total receivables 158 990 18 091 Cash and bank deposits 11 6 405 52 440 Total current assets 165 395 70 531 Total assets 377 652 219 353 58
The Board of Directors and CEO
HAV Group ASA
HAV Group ASA – Annual report 2022
Chairman of the Board
Tore Hopen Board member
Anita Fjørtoft
Board member
Gunnar Larsen CEO
Helge Simonnes Board member
Kjetil Ripe Board member
Vibeke Fængsrud Board member STATEMENT OF FINANCIAL POSITION PARENT COMPANY EQUITY AND LIABILITIES Note 2022 2021 (NOK 1,000) Equity Share capital 12,13 35 000 35 000 Own shares 12 1 638 1 817 Share premium 12 87 202 87 202 Total paid-in equity 120 564 120 386 Retained equity Retained earnings 108 445 3 306 Total retained earnings 108 445 3 306 Total equity 12 229 009 123 692 Liabilities Liabilities to Financial institutions 14,15 32 500 47 500 Liabilities to Group companies 9,14 61 628 44 675 Total other long-term liabilities 94 128 92 175 Total long-term liabilities 94 128 92 175 Current liabilities Accounts payable 10 2 410 1 116 Public duties payable 2 037 131 Debt to group companies 9 44 988 0 Other current liabilities 10 5 080 2 238 Total short-term liabilities 54 515 3 486 Total liabilities 148 642 95 661 Total equity and liabilities 377 652 219 353
Board member
Fosnavåg, 28 April 2023
STATEMENT OF CASHFLOW PARENT COMPANY
HAV Group ASA – Annual report 2022 STATEMENT OF CASHFLOW PARENT COMPANY
HAV Group ASA (NOK 1,000) Note 2022 2021 Cash flow from operations Profit/(loss) before tax 133 554 3 306 Depreciation 3 662 0 Net financial items 5 -144 077 -9 298 Changes in accounts receivables and accrued income 1 548 0 Changes in accounts payables 1 293 1 116 Changes in other current receivables/liabilities 2 323 25 796 Net cash flow from operating activities -4 697 20 920 Cash flow from investments Investments in property, plant and equipment 3 -1 537 0 Investments in shares -2 000 0 Investments in shares in subsidiary -9 667 -35 000 Interest payments 5 -2 135 -1 490 Received interest payments 0 1 259 Net cash flow from investing activities -15 339 -35 230 Cash flow from financing activities Repayment long term debt 14 -15 000 -7 500 Capital increase - share issue (net) 0 86 670 Purchase of own shares -32 894 -1 817 Change intercompany balances 21 895 -10 632 Net cash flow from financing activities -25 999 66 721 Net change in cash and cash equivalents -46 035 52 410 Cash and cash equivalents at start of the period 52 440 30 Cash and cash equivalents at end of the period 6 405 52 440 Of this restricted cash 11 952 131 60
HAV Group ASA – Annual report 2022
HAV Group ASA Note Name 1 ACCOUNTING PRINCIPLES 2 PAYROLL EXPENSES, NUMBER OF EMPLOYEES, REMUNERATIONS, ETC. 3 EQUIPMENT 4 OTHER OPERATING EXPENCES 5 FINANCIAL INCOME AND FINANCIAL EXPENSES 6 TAXES 7 INTANGIBLE ASSETS 8 SUBSIDIARIES 9 INTERCOMPANY BALANCES AND TRANSACTIONS 10 OTHER SHORT TERM RECEIVABLES AND LIABILITIES 11 RESTRICTED CASH 12 EQUITY 13 SHARE CAPITAL AND SHAREHOLDER INFORMATION 14 NON-CURRENT LIABILITIES 15 MORTGAGES 16 FINANCIAL MARKET RISK
NOTES PARENT COMPANY
NOTES TO THE FINANCIAL STATEMENTS 2022 PARENT COMPANY
NOTE 1 ACCOUNTING PRINCIPLES Accounting Principles
The financial statements are set up in accordance with the Norwegian Accounting Act. They are prepared using Norwegian accounting standards and generally accepted accounting principles.
Management has used estimates and assumptions that affect the income statement and the valuation of assets and liabilities, as well as contingent assets and liabilities, at the balance sheet date during the preparation of financial statements in accordance with generally accepted accounting principles.
Fixed assets are comprised of assets intended for long-term hold and use. Fixed assets are stated at cost. Fixed assets are capitalized and depreciated over the asset's useful life.
Expenditure on research and development is capitalized to the extent that a future economic benefit related to the development of an identifiable intangible asset can be identified and where the acquisition cost can be measured reliably. Otherwise, such expenses are expensed on an ongoing basis. Capitalized research and development is depreciated on a straight-line basis over its economic life.
Tangible fixed assets are written down to the recoverable amount when impairment is not expected to be temporary. The recoverable amount is the higher of an asset’s net selling price and its value in use. An asset’s value in use is the present value of the estimated future cash flows from the asset. If the reasons for impairment no longer exist, the impairment loss is reversed.
Current assets and liabilities consist of items that fall due for payment within one year of acquisition, as well as items related to the business cycle. Current assets are valued at the lower of cost and net realizable value. Current liabilities are stated at nominal value at the time of acquisition.
Monetary items in foreign currency are translated using the exchange rates at the balance sheet date. Transactions in foreign currency are translated at the rate applicable on the transaction date.
Trade receivables and other receivables are recorded at nominal value less a provision for doubtful accounts. The provision is made based on an individual assessment of each receivable.
Subsidiaries and associated companies are assessed according to the cost method in the company accounts. The investment is valued at the acquisition cost of the shares unless impairment has been necessary. Write-downs have been made at fair value when a fall in value is due to reasons that cannot be assumed temporary and it must be considered necessary according to good accounting practice. Impairment losses are reversed when the basis for impairment is no longer present.
Dividends, group contributions and other distributions from subsidiaries are recognized in the same year as they are recognized in the financial statement of the provider. If dividends/group contribution exceed withheld profits after the acquisition date, the excess amount represents repayment of invested capital, and the distribution will be deducted from the recorded value of the acquisition in the balance sheet for the parent company.
The tax expense in the income statement is comprised of both the period’s payable tax and changes in deferred tax. Deferred tax is calculated at a rate of 22 % based on the temporary differences that exist between accounting and tax values, and tax losses carried forward at the year-end. Tax increasing and tax-reducing temporary differences that are reversed or can be reversed in the same period are offset. Net deferred tax assets are recognized to the extent that it is probable that the amount can be utilized against future taxable income.
Accounting principles are further discussed in the accompanying notes to individual financial statement items.
HAV Group ASA – Annual report 2022 NOTES PARENT COMPANY
62
NOTE 2 PAYROLL EXPENSES, NUMBER OF EMPLOYEES, REMUNERATIONS, ETC.
At the time for establishment of HAV Group in Q1 2021, Gunnar Larsen was employed as CEO for HAV Group. At the same time Pål Aurvåg (CFO) and Frank-Levi Kvalsund (SVP HR/ QHSE) were hired in from Havyard Group ASA (EQVA ASA) in respective positions, but transferred to HAV Group from March 2022. Figures for 2022 is only related to remuneration from HAV Group.
No loans or guarantees have been issued to the CEO, the Chairman of the Board or other related parties. As of 31.12.2022 there has not been established bonus programs or share based incenive programs for management.
Pension scheme
The company has a defined contribution plan in accordance with the Norwegian Law on Required Occupational Pension. The pension depends on paid-in contributions and the return on these contributions. For the company, the year’s pension cost is equal to the year’s premium.
The company’s pension scheme meets the requirements of the Norwegian Law on Required Occupational Pension.
HAV Group ASA – Annual report 2022
(NOK 1,000) Payroll expenses 2022 2021 Wages 12 369 1 602 Social security tax 2 086 251 Pension costs 986 76 Other payroll-related costs 3 598 2 017 Total 19 040 3 945 Average number of employees 17 1 Auditor remuneration is distributed as follows: 2022 2021 Statutory audit 1 279 250 Tax consulting 22 0 Other services 0 1 949 Total (net of VAT) 1 301 2 199 Gunnar Larsen, CEO Pål Aurvåg, CFO (NOK 1,000) 2022 2021 2022 2021 Salary 2 164 2 249 1 069 1 477 Pension 98 96 78 85 Other remuneration 183 132 114 137 Total remuneration 2 445 2 477 1 260 1 699 Frank-Levi Kvalsund, SVP HR/QHSE Board (NOK 1,000) 2022 2021 2022 2021 Salary 825 1 350 1 300 1 550 Pension 74 92 0 0 Other remuneration 112 159 0 0 Total remuneration 1 011 1 601 1 300 1 550 NOTES PARENT COMPANY
HAV Group ASA – Annual report 2022
3 EQUIPMENT (NOK 1,000) NOTE 4 OTHER OPERATING COST (NOK 1,000) NOTE 5 FINANCIAL INCOME AND FINANCIAL EXPENSES (NOK 1,000) 2022 2021 Operating equipment Operating equipment Acquisition cost as at 01.01 0 0 Additions during the year 1 537 0 Acquisition cost as of 31.12 1 537 0 Accumulated depreciation as of 01.01 0 0 Depreciation for the year 662 0 Accumulated depreciation as of 31.12 662 0 Book value as of 31/12 875 0 2022 2021 Rent and leasing expenses 952 21 Office and administration expenses 977 120 Plant, tools and equipment (including IT) 3 581 125 Travel and employee expenses 3 017 983 Hired consultants* 11 117 27 944 Total 19 645 29 192 Fees to the auditor consists of the following services: 2022 2021 Statutory audit 1 279 250 Tax advice 22 0 Other assistance 0 1 949 Total 1 301 2 199 The item “Other financial income” consists of: 2022 2021 Interest from Group companies 1 427 1 259 Agio 10 0 Income from subsidiaries 146 732 0 Total 148 168 1 259 The item "Other financial costs" consists of: 2022 2021 Interest to Group companies 1 953 1 490 Interest payment 2 135 0 Disagio 1 0 Other financial costs 2 279 Total 4 091 1 769 NOTES PARENT COMPANY 64
NOTE
NOTE 6 TAXES
Taxes are expensed as they incur, i.e. the tax charge is related to the pre-tax accounting profit. Taxes are comprised of payable tax (tax on the year’s taxable income) and changes in deferred tax. The tax expense is allocated between the ordinary profit and extraordinary items in accordance with the tax base.
Below is a breakdown of the difference between profit before taxes in the P&L statement and the year’s tax base.
The income tax expense in the profit and loss statement consists of the following:
The income tax expense in the profit and loss statement consists of the following:
HAV Group ASA – Annual report 2022 NOTES PARENT COMPANY
(NOK 1,000) 2022 2021 Profit before taxes 133 554 3 306 Permanent differences -88 830 -3 306 Change in temporary differences 261 The year's tax base before tax losses carried forward 44 985 0 Net group contribution -44 985 0 The year's tax base 0 0 (NOK 1,000) 2022 2021 Non-current assets -261 0 Total temporary differences and tax losses carried forward. -261 0 Not accounted deffered tax asset 0 0 Deferred tax / deferred tax asset (-) -57 0 Applied tax rate 22 % 0 % Payables tax in balance sheet 2022 2021 Payables tax on years profit and loss -1 986 0 Payables tax from group contribution 11 883 0 Payables tax to group contribution -9 897 0 Total payables tax in balance sheet. 0 0 Payables tax in balance sheet 2022 2021 Tax payable 9 897 -2 648 Change in deffered tax -57 0 This year's tax expense 9 839 -2 648
NOTE 7 INTANGIBLE ASSETS (NOK 1,000)
The company’s capitalized research and development concerns the development of a hydrogen system solution. The project name is FreeCO2ast and was trasferred to HAV Group ASA as part of the drop-down in Q1 2021. It is ongoing and depreciation has not started.
NOTE 8 SUBSIDIARIES
Subsidiaries are accounted for using the cost method. (NOK 1.000)
HAV Group ASA bought (22.72%) rest of the shares in Norwegian Greentech AS Mai 2022. Havyard Far East Pte Ltd closed down end of 2021.
Havyard Newco was established in 2020 and changed name to HAV Group in the spin-off in March 2021. The companies was transferred from Havyard Group (EQVA) to HAV Group during this process.
HAV Group ASA – Annual report 2022 2022 2021 Research and development Research and development Acquisition cost as at 01.01 0 0 Additions during the year 1523 1523 Acquisition cost as at 31.12 1 523 1 523 Transferred 0 0 Acc. depreciation as at 31.12 0 0 Book value as at 31.12 1 523 1 523 Depreciation for the year 0 0 Economic life 5-10 5-10 Depreciation method Linear Linear
2022 Company Business office Owner's share Book value Company's equity 100% Company's result 100% Norwegian Electric Systems AS Bergen 100,0 % 89 392 36 438 -8 104 HAV Design AS Fosnavåg 100,0 % 37 360 10 000 12 085 Norwegian Greentech AS Fosnavåg 100,0 % 51 119 12 356 18 237 HAV Hydrogen AS Fosnavåg 100,0 % 4 372 6 716 -4 342 Book value as at 31.12.2022 182 243 65 509 17 875
2021 Company Business office Owner's share Book value Company's equity 100% Company's result 100% Norwegian Electric Systems AS Bergen 100,0 % 58 643 1 121 26 614 HAV Design AS Fosnavåg 100,0 % 37 360 108 63 802 Havyard Far East Pte Ltd* Singapore 100,0 % 0 570 0 Norwegian Greentech AS Fosnavåg 77,0 % 26 950 5 000 9 247 HAV Hydrogen AS Fosnavåg 100,0 % 30 30 -797 Book value as at 31.12.2021 122 983 6 829 98 867
NOTES PARENT COMPANY 66
NOTE 9 INTERCOMPANY BALANCES AND TRANSACTIONS
NOTE 10 OTHER SHORT TERM RECEIVABLES AND LIABILITIES
(NOK 1,000)
NOTE 11 RESTRICTED CASH
(NOK 1,000)
952 (131) of cash and cash equivalents relates to tax withholdings.
HAV Group ASA – Annual report 2022
(NOK 1,000) 2022 2021 Non-current receivables to Norwegian Greentech 25 554 24 315 Current receivables (incl group contribution ) 153 417 12 870 Accounts receivable (subsidiaries) 2 286 4 601 Non-current debt from HAV Design -61 628 -44 675 Accounts payable -310 -21 Current liabilities (incl group contribution) -45 298 0 Total 74 022 -2 910 Transactions 2022 2021 Management fee cost (Havyard Group) 0 -21 358 Management fee income (subsidiaries) 26 936 27 060 Total 26 936 5 702 The item “Other Short-term receivables” consists of: 2022 2021 Prepaid expenses 1 563 103 Other short term receivables 957 517 Total 2 520 620 The item “Other short term liabilities” consists of: 2022 2021 Unpaid wages and vacation pay 4 470 2 097 Accrued interests 103 96 Other short-term liabilities 506 45 Total 5 080 2 238
Balance sheet
NOTES PARENT COMPANY
NOTE 12 EQUITY
The board proposes NOK 0 in dividend for the general meeting
The board proposes NOK 0 in dividend for the general meeting
NOTE 13 SHARE CAPITAL AND SHAREHOLDER INFORMATION
2022
The company got one stock group and all shares have same rights.
The share capital was NOK 35 000 000 divided by 35 000 000 shares, at NOK 1.
HAV Group ASA has 1 638 437 treasury shares ( 4.7% of share capital) as of 31/12/2022)
Emini Invest AS, HSR Invest AS, Innidimann AS and Pision AS jointly own 100% of Havila Holding AS. The largest shareholder of the Group is Havila Holding AS. Chairman of the Board Vegard Sævik and boardmember Hege Sævik Rabben have indirect ownership in the group through their ownership in Havila Holding AS.
Havila Holding AS is a limited company based in Norway, and its head office is located in Fosnavåg, Herøy.
HAV Group ASA – Annual report 2022
(NOK 1,000) 2022 2021 Share capital Own shares Share premium Other equity Retained earnings Total Equity as at 01.01.2022 35 000 -122 87 202 -1 695 3 306 123 692 Profit for the year 123 715 123 715 Purchase of own shares -2 321 -30 578 -32 894 Exit minority 806 13 696 14 502 Equity as at 31.12.2022 35 000 -1 638 87 202 -1 695 110 139 229 009
Share capital Own shares Share premium Other equity Retained earnings Total Equity as at 01.01.2021 30 0 0 0 0 30 Profit for the year 0 3 306 3 306 Contribution in kind 1 000 1 000 Equity Issue 33 970 0 33 970 Capital increase - share issue (net) 87 202 87 202 Purchase of own shares -122 -1 695 -1 817 Equity as at 31.12.2021 35 000 -122 87 202 -1 695 3 306 123 692
NOTES PARENT COMPANY 68
2021
The share capital was NOK 35 000 000 divided by 35 000 000 shares, at NOK 1.
Treasury shares
HAV Group ASA has 118 080 treasury shares ( 0.35% of share capital) as of 31/12/2021. (Ref.ongoing repurchase program.)
Dividends and group contributions
The Group has not paid dividend in 2021. The board proposes NOK 0 in dividend for the general meeting.
Emini Invest AS, HSR Invest AS, Innidimann AS and Pision AS jointly own 100% of Havila Holding AS. The largest shareholder of the Group is Havila Holding AS. Chairman of the Board Vegard Sævik and boardmember Hege Sævik Rabben have indirect ownership in the group through their ownership in Havila Holding AS.
Havila Holding AS is a limited company based in Norway, and its head office is located in Fosnavåg, Herøy. Havyard Group ASA is consilidated in the financial accounts of Havila Holding AS. Havila Holding and companies owned by family owns in total 57.72% of Havyard Group ASA.
HAV Group ASA – Annual report 2022 Shareholders as of 31/12/2022 Controlled by Number of shares Ownership HAVILA HOLDING AS Vegard Sævik (Ch.of Board) 8 737 827 25,0 % FARVATN CAPITAL AS 2 408 909 6,9 % HAV GROUP ASA 1 638 437 4,7 % MP PENSJON PK 1 524 220 4,4 % EQVA ASA 1 513 542 4,3 % NORDNET LIVSFORSIKRING AS 1 379 834 3,9 % EMINI INVEST AS 1 127 179 3,2 % HSR INVEST AS Hege Sævik Rabben (Board) 1 127 179 3,2 % INNIDIMMAN AS Vegard Sævik (Ch.of Board) 1 127 179 3,2 % AVANZA BANK AB 1 012 324 2,9 % NORDNET BANK AS 917 848 2,6 % JAHATT AS 770 500 2,2 % MORGAN STANLEY & CO. INTERNATIONAL 735 608 2,1 % PISON AS 375 726 1,1 % OTHER SHAREHOLDERS (<1 %) 10 603 688 30,3 % Number of shares 35 000 000 100 % Shareholders as of 31/12/2021 Controlled by Number of shares Ownership HAVYARD GROUP ASA Vegard Sævik (Ch.of Board) 11 659 047 33,3 % HAVILA HOLDING AS 4 693 500 13,4 % FARVATN CAPITAL AS 2 408 909 6,9 % MP PENSJON PK 1 072 192 3,1 % NORDNET LIVSFORSIKRING AS 882 485 2,5 % AVANZA BANK AB 800 643 2,3 % JAHATT AS 770 500 2,2 % NORDNET BANK AS 686 829 2,0 % EMINI INVEST AS 605 461 1,7 % HSR INVEST AS Hege Sævik Rabben (Board) 605 461 1,7 % INNIDIMMAN AS Vegard Sævik (Ch.of Board) 605 461 1,7 % MORGAN STANLEY & Co. INTERNATIONAL 471 986 1,3 % OTHER SHAREHOLDERS (<1 %) 9 737 526 27,8 % Number of shares 35 000 000 100,0 %
NOTES PARENT COMPANY
NOTE 14 NON-CURRENT LIABILITIES
(NOK 1,000)
Non-current liabilites is a result of the spin-off from Havyard Group ASA (EQVA), where external loans and shares in subsidiiaries was transferred to HAV Group ASA. The Liabilities to financial institutions of MNOK 32,5 (MNOK 47,5 in 2021) include the DNB loan. Maturity 30.09.2024 and the interest rate is 3 months NIBOR + 3.5% margin.
NOTE 15 MORTGAGES
NOTE 16 FINANCIAL MARKET RISK
Interest rate risk arises in the short and medium run as the Company’s liabilities are subject to floating interest rates.
Foreign currency Risk
Fluctuations in exchange rates entail both direct and indirect financial risks for the company. The Group uses currency hedging instruments to keep the currency risk at a low level.
Liquidity Risk
Liquidity risk is the risk that the group is unable to fulfill its financial obligations as they fall due. The Group has routines for continued monitoring of the cash flow.
HAV Group ASA – Annual report 2022
NOTES PARENT COMPANY
(NOK
1,000)
Interest rate Risk
Book value of liabilities secured by mortgages 2022 2021 Liabilities to Financial institutions 32 500 47 500 Total 32 500 47 500 Security for DnB Loan Book value of pledged assets 2022 2021 Research and development 1 523 1 523 Operating equipment, fixtures, fittings, tools, etc 875 0 Accounts receivable 767 18 Shares in Norwegian Electric Systems AS 89 392 58 643 Shares in HAV Design AS 37 360 37 360 Shares in Norwegian Greentech AS 51 119 26 950 Shared in HAV Hydrogen AS 4 372 30 Total 185 409 124 524 Non-current liabilites 2022 2021 Liabilities to Financial institutions 32 500 47 500 Liabilities to Group companies 61 628 44 675 Total 94 128 92 175 70
To the General Meeting of HAV Group ASA
Independent Auditor’s Report Opinion

We have audited the financial statements of HAV Group ASA, which comprise: the financial statements of the parent company HAV Group ASA (the Company), which comprise the balance sheet parent company as at 31 December 2022, the profit or loss statement parent company and statement of cash flow parent company for the year then ended, and notes to the financial statements, including a summary of significant accounting policies, and the consolidated financial statements of HAV Group ASA and its subsidiaries (the Group), which comprise the consolidated statement of financial position as at 31 December 2022, the consolidated statement of profit or loss, consolidated statement of changes in equity and consolidated statement of cash flow for the year then ended, and notes to the financial statements, including a summary of significant accounting policies.
In our opinion
the financial statements comply with applicable statutory requirements, the financial statements give a true and fair view of the financial position of the Company as at 31 December 2022, and its financial performance and its cash flows for the year then ended in accordance with Norwegian Accounting Act and accounting standards and practices generally accepted in Norway, and the consolidated financial statements give a true and fair view of the financial position of the Group as at 31 December 2022, and its financial performance and its cash flows for the year then ended in accordance with Norwegian Accounting Act and accounting standards and practices generally accepted in Norway.
Basis for Opinion
We conducted our audit in accordance with International Standards on Auditing (ISAs). Our responsibilities under those standards are further described in the Auditor’s Responsibilities for the Audit of the Financial Statements section of our report. We are independent of the Company and the Group as required by relevant laws and regulations in Norway and the International Ethics Standards Board for Accountants’ International Code of Ethics for Professional Accountants (including International Independence Standards) (IESBA Code), and we have fulfilled our other ethical responsibilities in accordance with these requirements. We believe that the audit evidence we have obtained is sufficient and appropriate to provide a basis for our opinion.
Other Information
The Board of Directors and the Managing Director (management) are responsible for the information in the Board of Directors’ report. The other information comprises information in the annual report, but does not include the financial statements and our audito r’s report thereon. Our opinion on the financial statements does not cover the information in the Board of Directors’ report.
INDEPENDENT AUDITOR’S REPORT PricewaterhouseCoopers AS, Sandviksbodene 2A, Postboks 3984 - Sandviken, NO-5835 Bergen T: 02316, org. no.: 987 009 713 MVA, www.pwc.no Statsautoriserte revisorer, medlemmer av Den norske Revisorforening og autorisert regnskapsførerselskap
In connection with our audit of the financial statements, our responsibility is to read the Board of Directors’ report. The purpos e is to consider if there is material inconsistency between the Board of Directors’ report and the financial statements or our knowledge obtained in the audit, or whether the Board of Directors’ report otherwise appear s to be materially misstated. We are required to report if there is a material misstatement in the Board of Directors’ report. We have nothing to report in this regard.
Based on our knowledge obtained in the audit, it is our opinion that the Board of Directors’ report is consistent with the financial statements and contains the information required by applicable statutory requirements.
Responsibilities of Management for the Financial Statements
Management is responsible for the preparation of financial statements that give a true and fair view in accordance with the Norwegian Accounting Act and accounting standards and practices generally accepted in Norway, and for such internal control as management determines is necessary to enable the preparation of financial statements that are free from material misstatement, whether due to fraud or error.
In preparing the financial statements, management is responsible for assessing the Company’s and the Group’s ability to continue as a going concern, disclosing, as applicable, matters related to going concern. The financial statements use the going concern basis of accounting insofar as it is not likely that the enterprise will cease operations.
Auditor’s Responsibilities for the Audit of the Financial Statements
Our objectives are to obtain reasonable assurance about whether the financial statements as a whole are free from material misstatement, whether due to fraud or error, and to issue an auditor’s report that includes our opinion. Reasonable assurance is a high level of assurance, but is not a guarantee that an audit conducted in accordance with ISAs will always detect a material misstatement when it exists. Misstatements can arise from fraud or error and are considered material if, individually or in aggregate, they could reasonably be expected to influence the economic decisions of users taken on the basis of these financial statements.
For further description of Auditor’s Responsibilities for the Audit of the Financial Statements reference is made to: https://revisorforeningen.no/revisjonsberetninger
Bergen, 28 April 2023
PricewaterhouseCoopers AS
Fredrik Gabrielsen State Authorised Public Accountant
(This document is signed electronically)
HAV Group ASA – Annual report 2022 72 2 / 2
INDEPENDENT AUDITOR’S REPORT
HAV Group ASA – Annual report 2022
A SUSTAINABLE FUTURE AT SEA

